Headlines
|
|
Weekly Wrap for Sep 17 - Diverging VIX, Streaks End, Natural Gas Jumps:
This week saw some unusual moves between realized and implied volatility and an end to some long streaks of positive breadth. There are few 200-day stretches that can compare to the last 10 months. Stocks are entering a weak seasonal window as few of them are able to outperform the S&P 500.
Bottom Line:
STOCKS: Hold
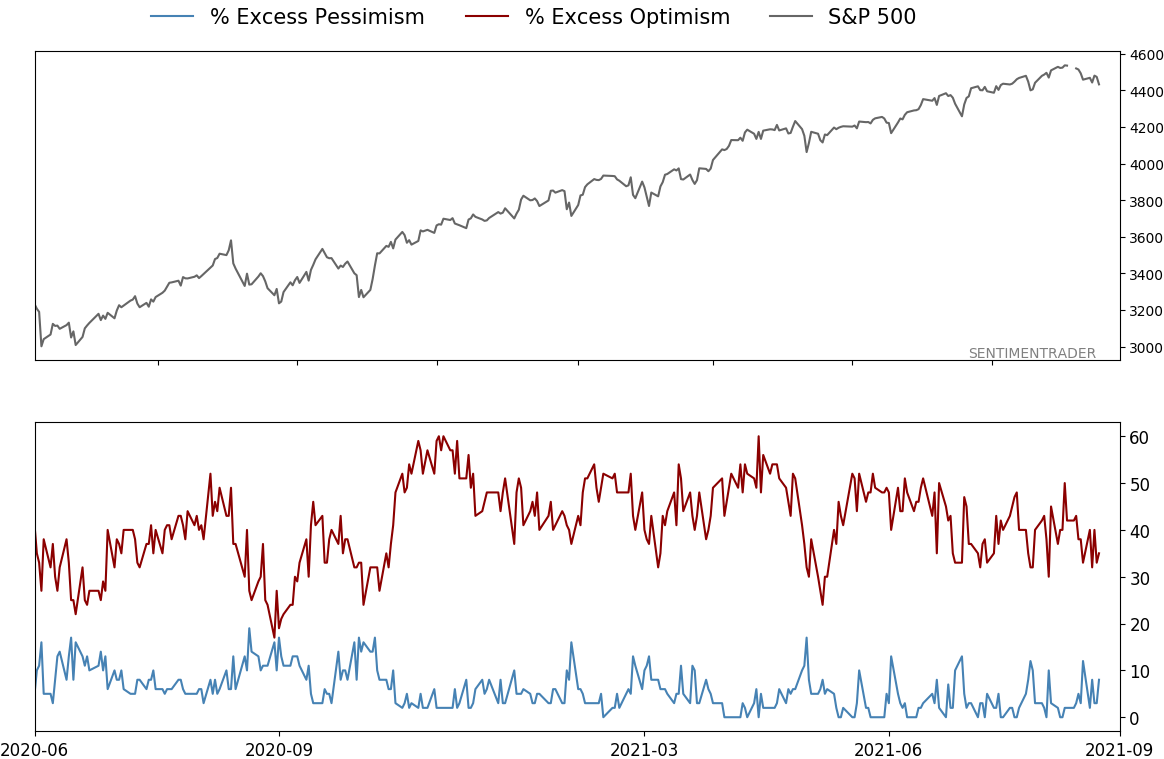
Sentiment continues to decline from the speculative February peak. With deteriorating breadth, this raises the risk of poor short- to medium-term returns until optimism and better breadth returns. See the Outlook & Allocations page for more. BONDS: Hold
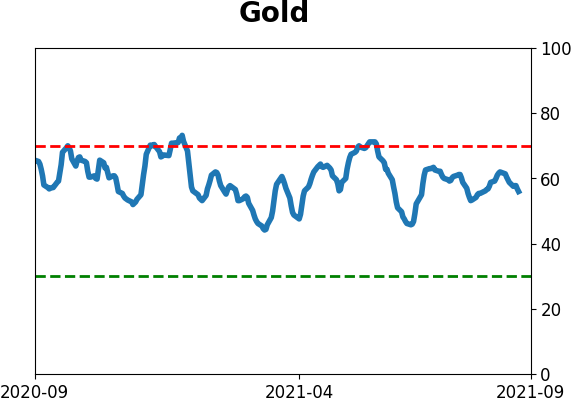
Various parts of the market got hit in March, with the lowest Bond Optimism Index we usually see during healthy environments. Bond prices have modest recovered and there is no edge among the data we follow. GOLD: Hold
Gold and miners were rejected after trying to recover above their 200-day averages in May. Lately, some medium-term (not long-term) oversold extremes in breadth measures among miners have triggered.
|
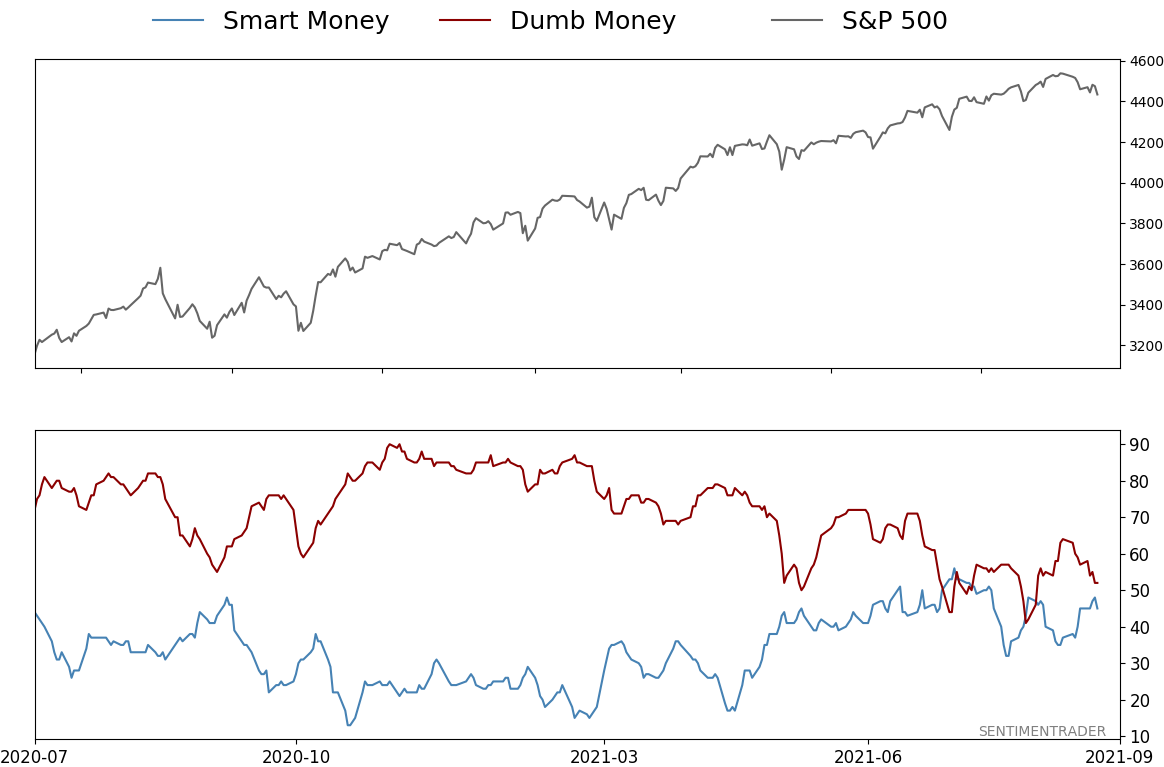
Smart / Dumb Money Confidence
|
Smart Money Confidence: 45%
Dumb Money Confidence: 52%
|
|
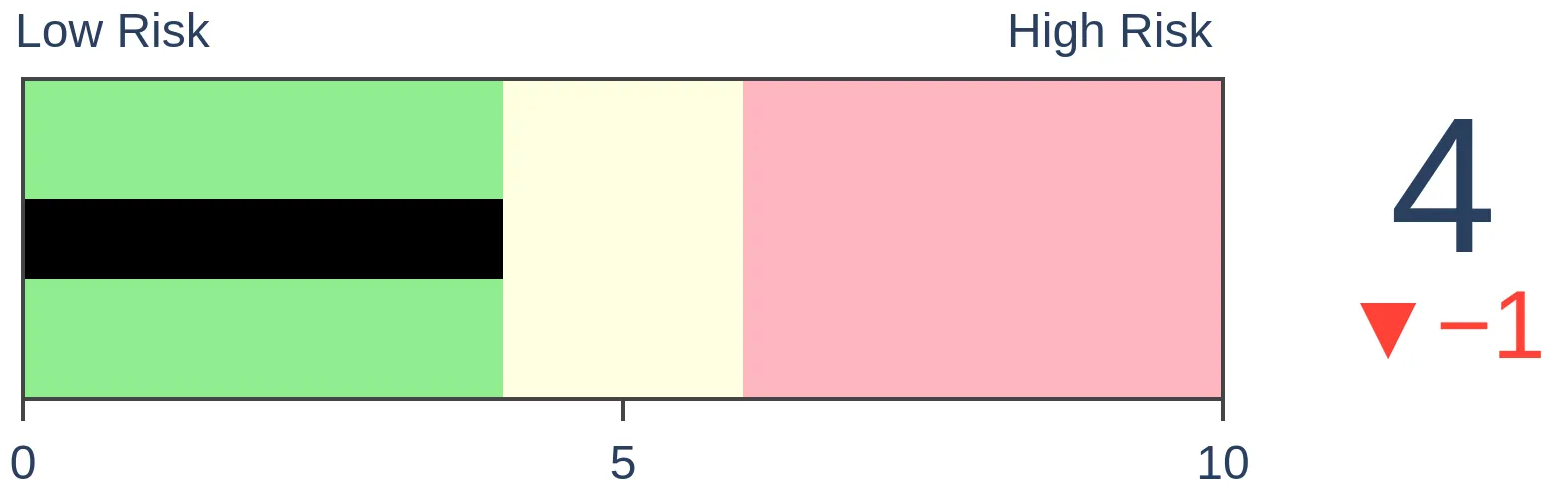
Risk Levels
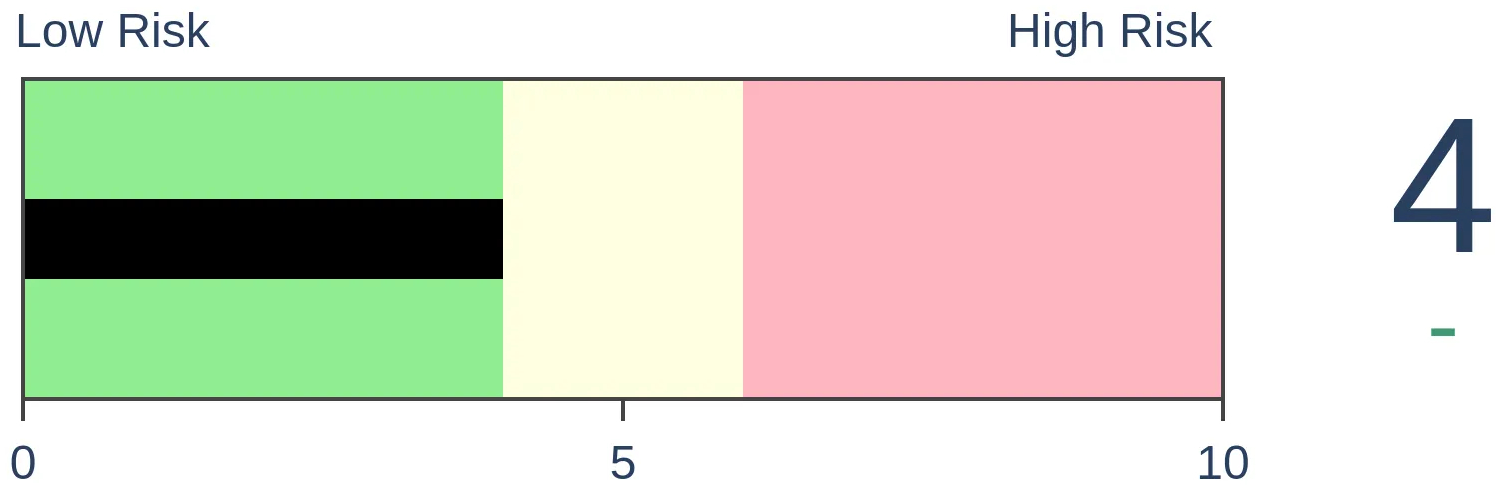
Stocks Short-Term
|
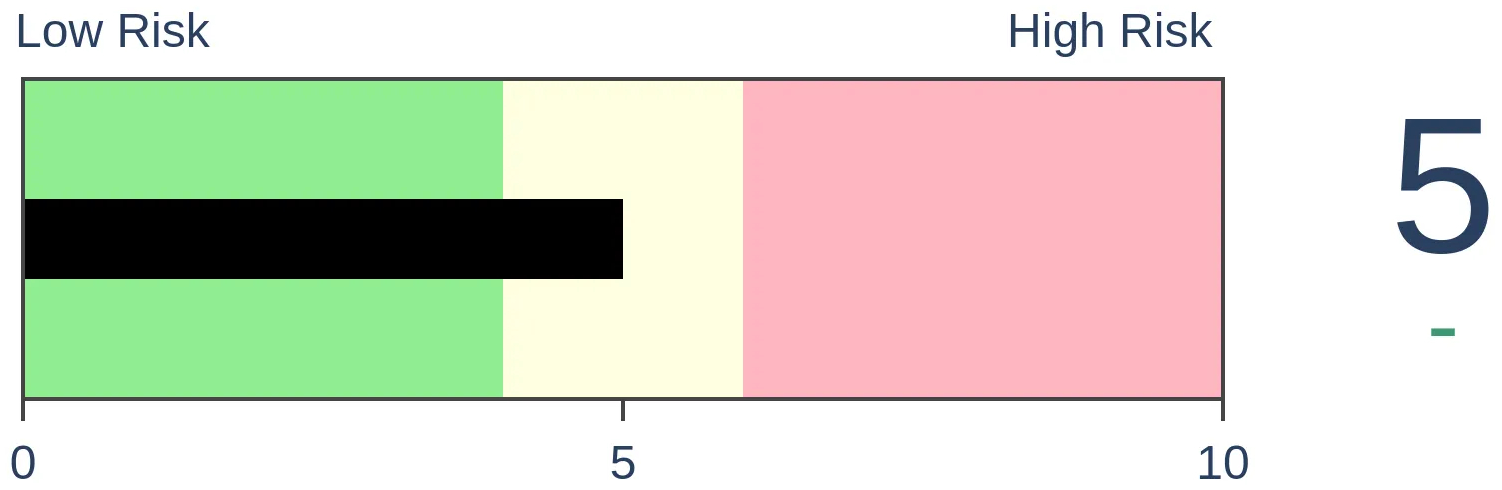
Stocks Medium-Term

|
|
Bonds

|
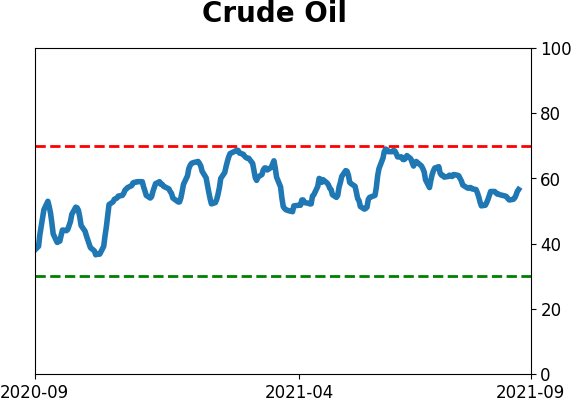
Crude Oil
|
|
Gold
|
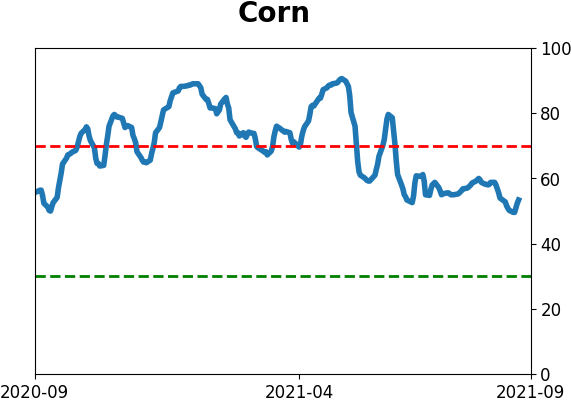
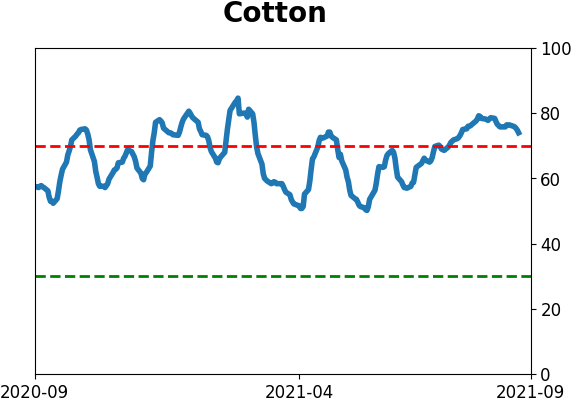
Agriculture

|
|
Research
By Jason Goepfert
BOTTOM LINE
This week saw some unusual moves between realized and implied volatility and an end to some long streaks of positive breadth. There are few 200-day stretches that can compare to the last 10 months. Stocks are entering a weak seasonal window as few of them are able to outperform the S&P 500.
FORECAST / TIMEFRAME
None
|
The goal of the Weekly Wrap is to summarize our recent research. Some of it includes premium content (underlined links), but we're highlighting the key focus of the research for all. Sometimes there is a lot to digest, with this summary meant to highlight the highest conviction ideas we discussed. Tags will show any symbols and time frames related to the research.
| STOCKS |
 |  |
|
Options traders don't trust the calm conditions.
The S&P 500 declined for 5 consecutive sessions, but the overall loss was tiny. Historically, that combination has preceded a rebound - calm conditions tend to persist until that one moment when they don't, and the trend changes.
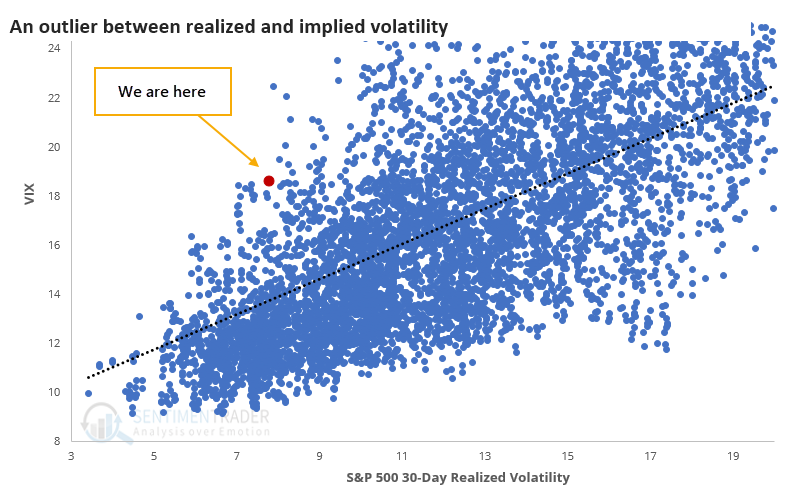
Conditions have been pretty much perfect for stock investors all year. A slow, steady drumbeat of gains is nirvana. But the VIX "fear gauge" of implied future volatility has been holding up for weeks, which is unusual since it's occurring at the same time that actual, realized volatility in the S&P 500 index has dripped close to all-time lows. The action late last week didn't change things much.
There is a clear positive correlation between realized and expected volatility. Traders rely on the recent past (realized volatility) to predict the near future (implied volatility).
If we zoom in on smaller readings, we can see just how much last week stands out versus all historical readings.
So who knows more, equity investors or volatility traders? The table below suggests that in the short-term, options traders are "smarter," while in the medium-term, investors have been.
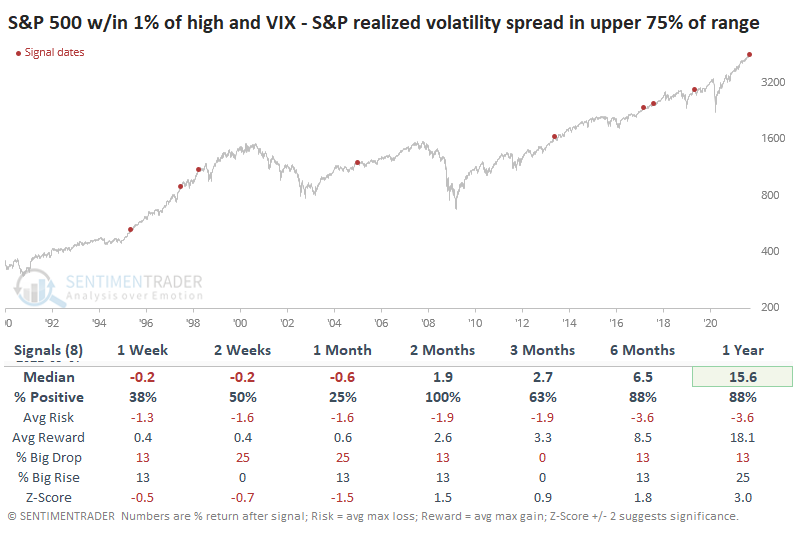
We're always looking for times when markets don't do what they should, and we got indications of that on the upside as early as January. Now we should be watching for signs that stocks aren't doing what they should on the downside, and if we see any material follow-through weakness after last week's small but persistent declines, it would suggest that the momentum run of 2021 is entering a shakier stretch.
THE END OF 3/4 OF STOCKS ABOVE LONG-TERM AVERAGES
It was quite a run, but the dip in stocks last week did a bit of damage.
At no time since November did fewer than 75% of S&P stocks close below their long-term averages until the end of last week. For the first time in 10 months, fewer than 3 out of every 4 stocks in the S&P 500 closed above their 200-day moving averages. That ends the 4th-longest streak since at least 1928.
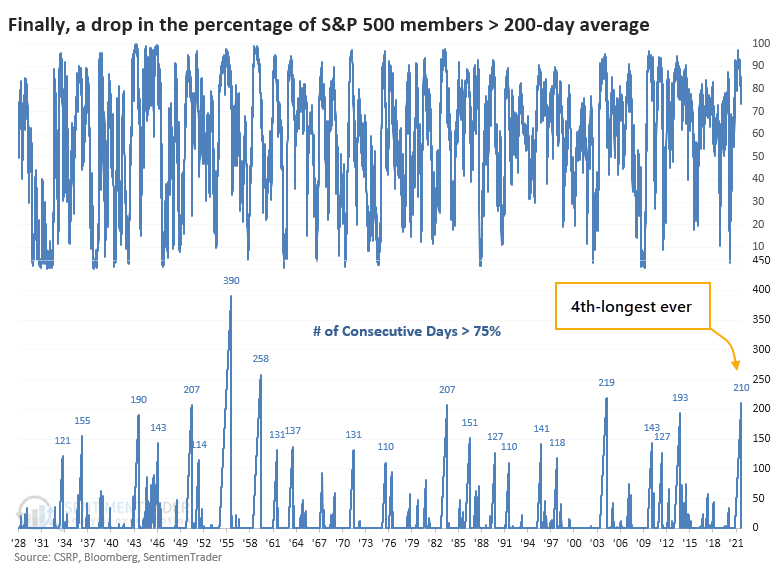
In over 90 years of history, there have only been 5 other streaks of at least 200 consecutive days. Like we see with many momentum types of data, forward returns were good, even after the streaks ended. While it did precede a big dip in 1950, the others saw minimal losses or gains over the following months.
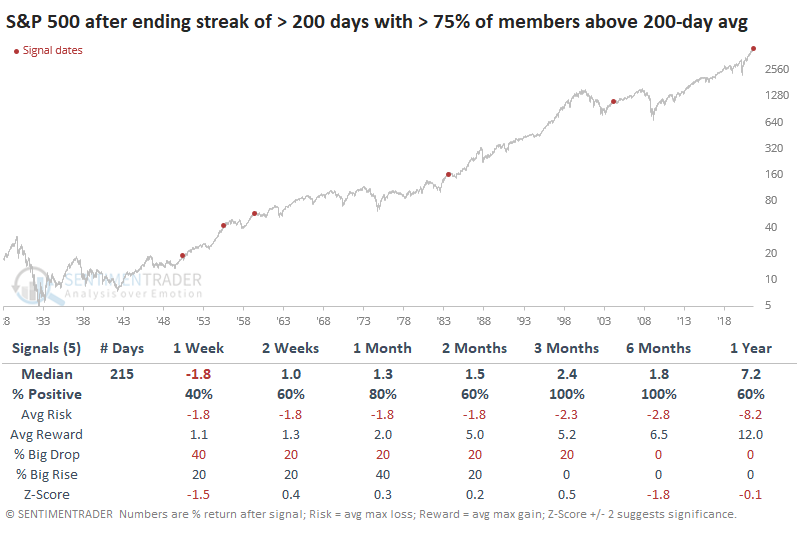
A bigger sample size is usually better, so if we relax the parameters to look for the ends of streaks of at least 100 days, shorter-term returns were mediocre, but medium- to long-term ones were very good.
Impressive momentum has been a feature of this market since the initial thrusts off of the 2020 low. It's hard (impossible) to reconcile it against other worries like deteriorating macro conditions combined with a rising bear market probability. No worries have mattered for nearly a year, so counting on them to matter now is like tilting at windmills.
HIGHEST-CORRELATED 200 DAYS
The past 200 sessions have been remarkable for their calm. Most other kick-offs from bear market bottoms have suffered at least some volatility along the way.
If we use the objective calculations we always do for analogs, then we can look at other 200-day periods in the S&P 500's history to see which ones have the highest correlation to the recent past. The chart below shows the last 200 days in the index (blue) along with an average of the 18 stretches with the highest correlation (black).
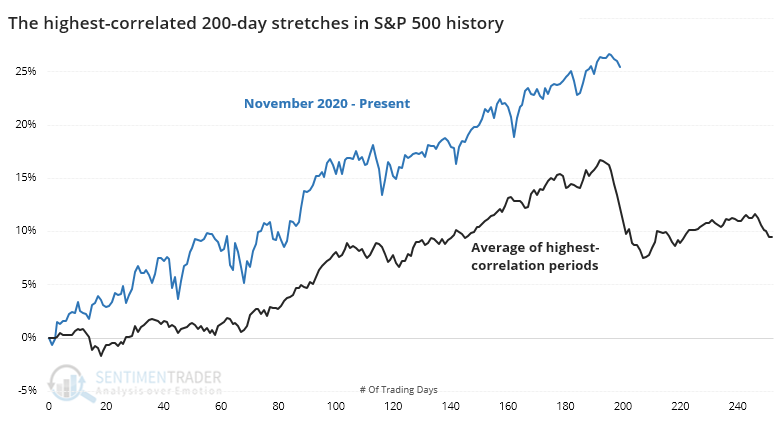
The chart shows that the average analog suffered a pullback right about now. A look at thumbnails of the 10 most recent occurrences shows how consistent that was. What we should be most interested in is future returns. If we look at the ends of the 200-day periods shown above, then we can see how the S&P fared going forward.
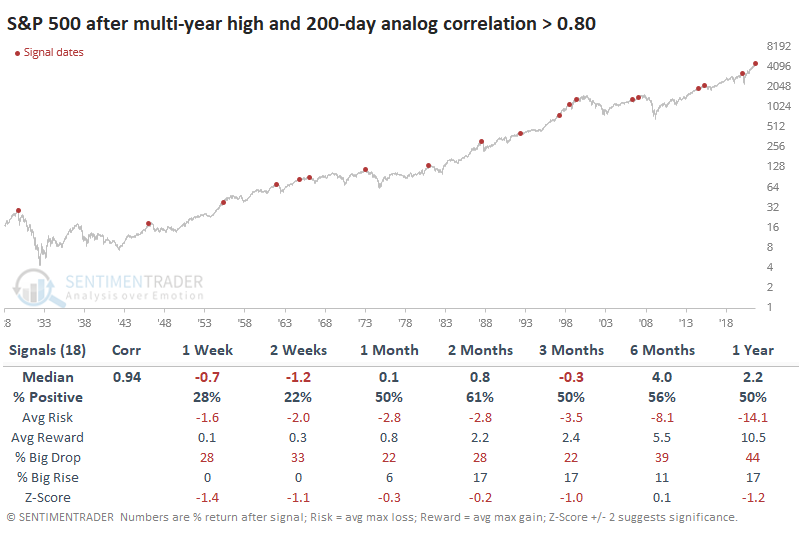
Across most time frames, the S&P's returns were below random, and the overall risk/reward was very poor. One difference with our current market is just how strong the momentum and (mostly) breadth have been. The current trend has been so calm, for so long, that an interruption would be par for the course but it would be rare for it to turn into a rout just yet.
FEWER STOCKS OUTPERORMING THE INDEX
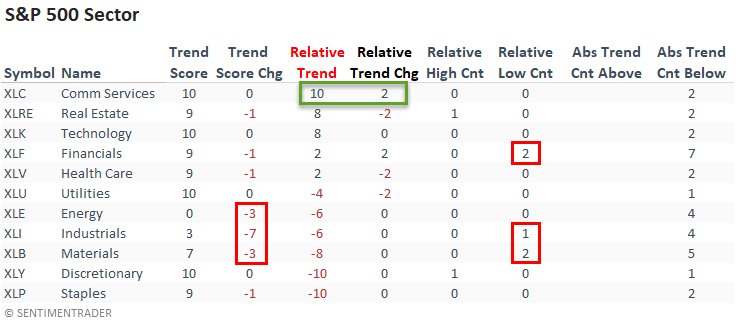
Dean updated his absolute and relative trend following indicators for domestic and international ETFs.
Several cyclical-oriented sectors registered a decline in their respective absolute trend scores, especially the industrials group, which fell seven points. Most of the same sectors also recorded new relative lows.
Communication services reestablished a perfect trend score combination after a two-point increase in its relative score.
Over the last 40 days, more than 60% of S&P 500 members have underperformed the index, which indicates a lack of participation from the average stock. The chart below shows that it has matched the highest count in history, which previously occurred in 1973.
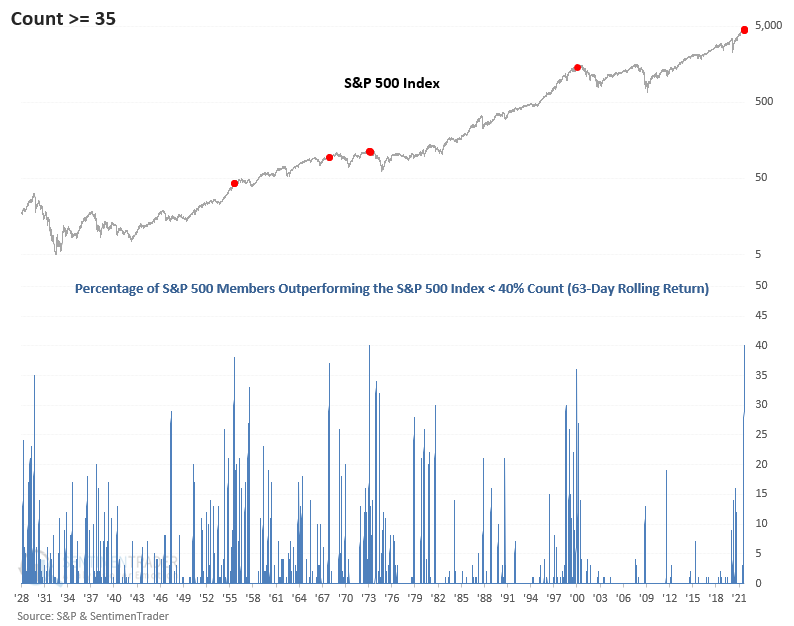
The current market environment is highly unusual and only matched by a few other periods in history. Typically, historical instances of this nature have only occurred near market peaks when breadth was extremely narrow.
The pandemic-driven On vs. Off rotation between growth and value sectors has made the investing environment challenging in year two of the recovery as rolling internal corrections are the norm.
A SEASONAL (REALLY) WEAK SPOT
Jay pointed out that a 6-day window into late September has had a strong tendency to see weakness. This roughly equates with the week following options expiration.
The figure below shows the cumulative % price gain for the S&P 500 Index held only during this 6-trading day period each month over the full 90-year test period (i.e., the cumulative price return if one had bought the S&P 500 Index at the close of TDM -11 and sold it six trading days later at the close on the 5th to last trading day of the month, and repeated this process every single month).
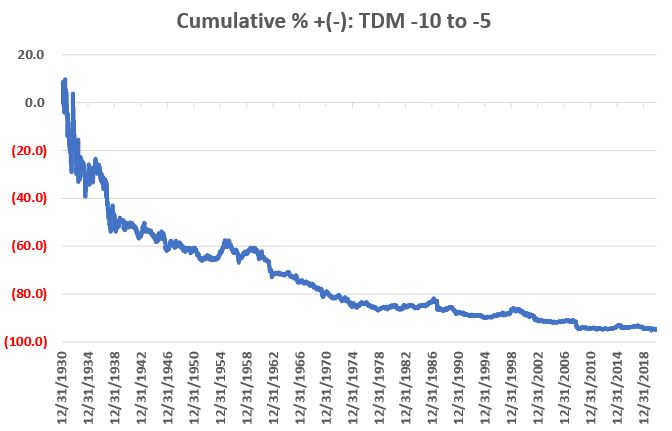
Clearly, it is NOT a pretty picture.
For the record, had an investor been stubborn (foolish?) enough to buy-and-hold the S&P 500 Index ONLY during this 6-day period every month starting in January 1931, the cumulative loss through 12/31/2020 would be -94.9%. This was during a 90-year period, which saw the S&P 500 Index grow +24,386% (using price data only) on a buy-and-hold basis.
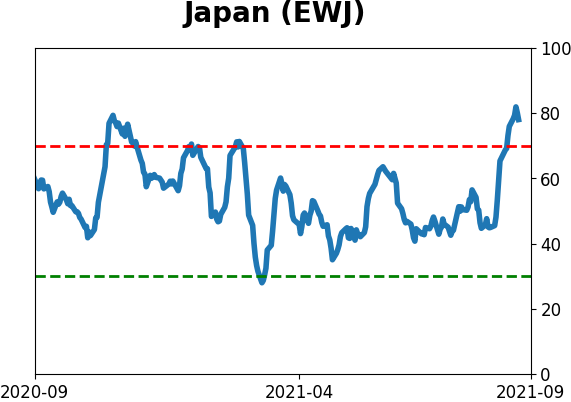
STOCKS AND SECTORS - JAPAN
Dean noticed several of the short-term Nikkei 225 breadth measures had improved by a material amount of late. One of the measures, the percentage of Nikkei 225 members registering a 4-week high, surged to 61%.
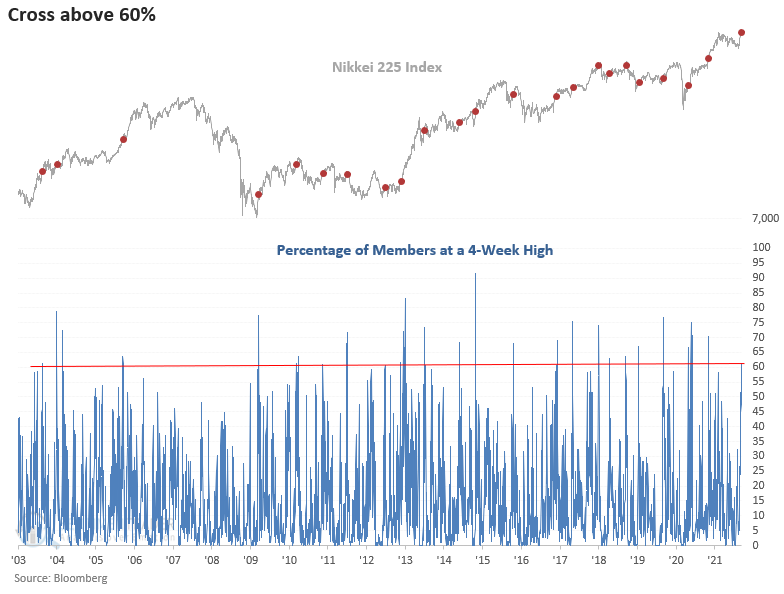
Let's assess if the surge in 4-week highs keeps the bullish momentum going for the Nikkei 225 Index. The study will identify when the number of Nikkei 225 members trading at a 4-week high surge above 60%. This time we will assess the outlook for a currency-hedged Japan ETF. This type of ETF offers you a way to more fully access the return potential of Japanese equities in a weakening yen environment.
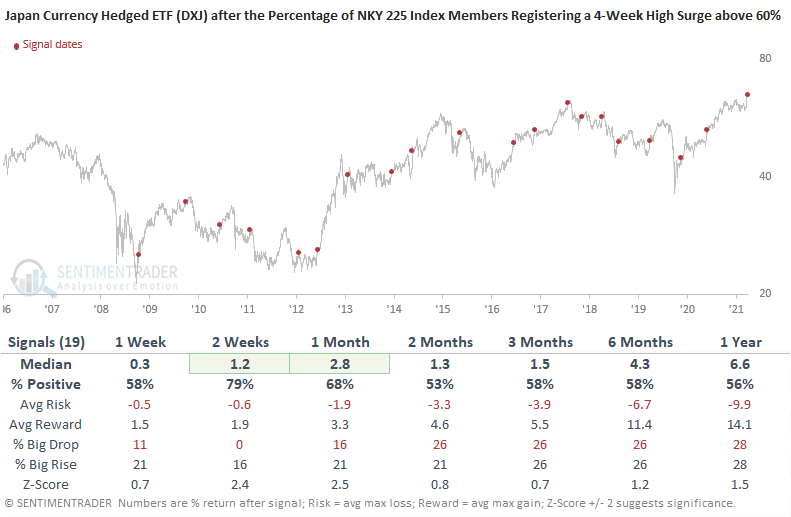
Choosing the appropriate vehicle to play the surge in momentum depends on one's outlook for the dollar versus yen cross.
STOCKS AND SECTORS - HEALTH CARE
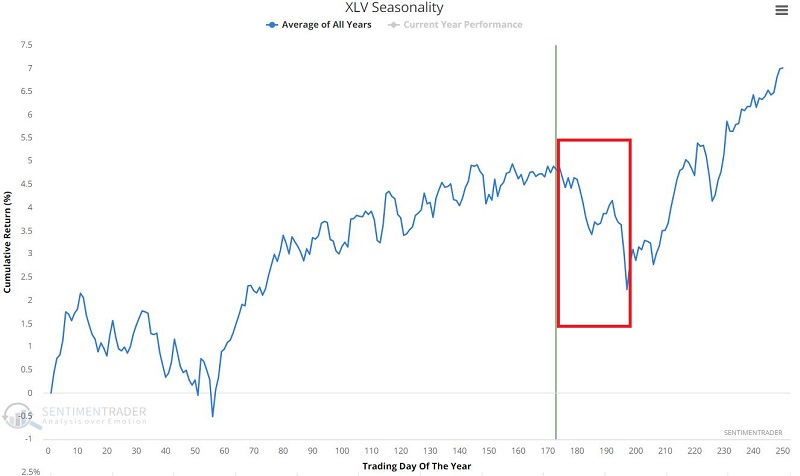
Jay noted that since the March 2020 Covid-panic low, the Health Care sector has marched relentlessly higher. Technically, the price trend is inarguably still up and price is well above its own 39-week moving average.
The chart below displays the Annual Seasonal Trend for ticker XLV, which shows a dip right about now.
The chart below displays the cumulative % return for the S&P 500 Health Care sector ONLY from Trading Day of the Year (TDY) #174 through TDY #187 every year since 1953.
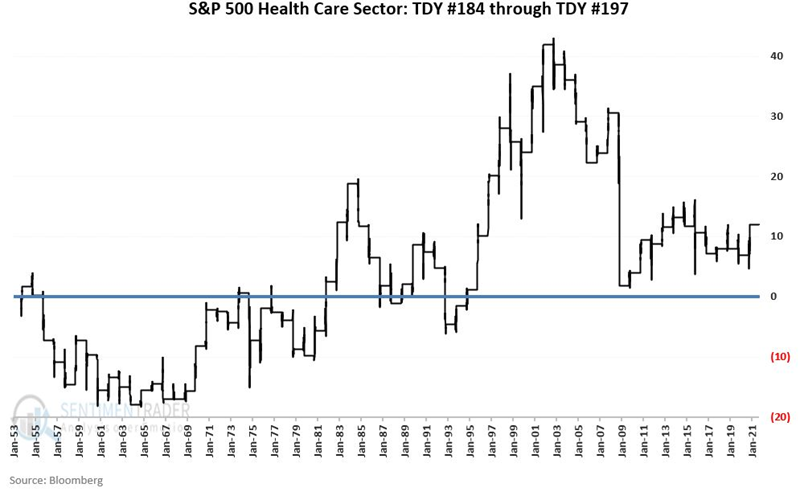
The total cumulative % return since 1953 has been +11.9%. The total cumulative % return since 1983 has been (-0.4%).
| COMMODITIES |
|  |
|
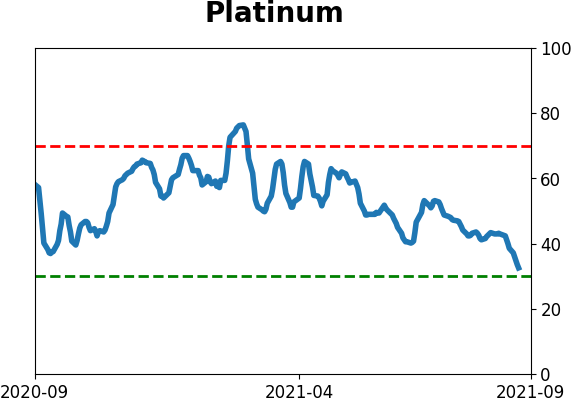
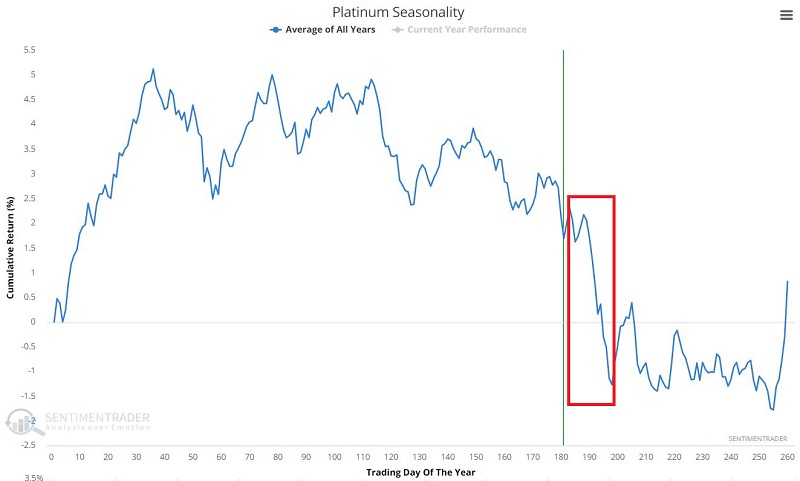
Both platinum and the U.S. dollar have had a tendency to show weakness in the coming weeks, according to Jay.
The chart below displays the Annual Seasonal Trend for platinum. The bottom line is that there is not too much to get excited about on a seasonal basis.
The dollar is also entering a weak seasonal period. The chart below displays the cumulative dollar +/- for a long position in U.S. Dollar futures held ONLY from the close on TDY #180 through TDY #191.
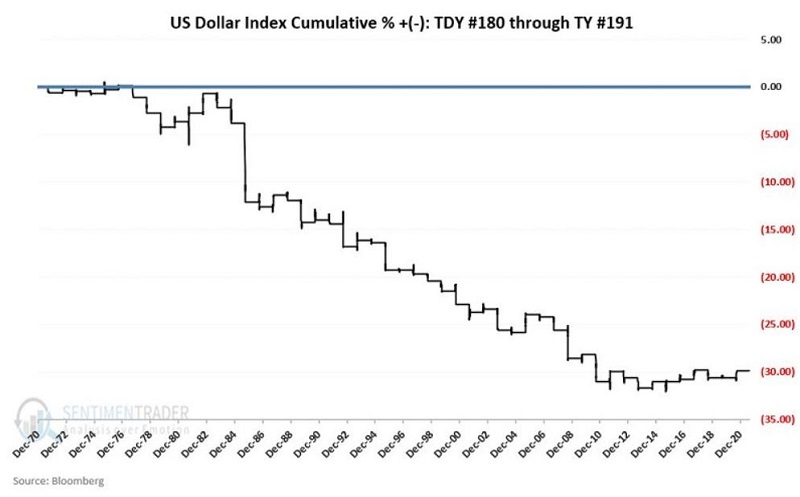
And once again, the relevant question is NOT, "what do you think is going to happen?" The relevant question is, "what are you going to do with your trading capital?"
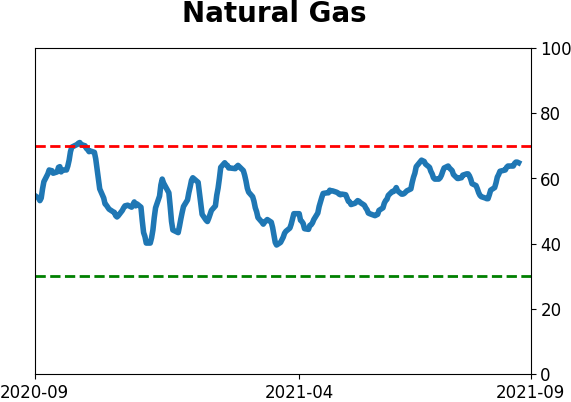
NATURAL GAS TAKES OFF
Dean noted that since the low last June, the continuous front-month natural gas futures contract has risen by 268%. And, in the latest trailing 21-day period, the commodity has increased by over 38%. So, what should we expect from here if we use history to guide our future outlook for gas prices?
The first couple of months look like a coin toss. The 1-month period registered ten consecutive increases between 2000 and 2009. Once you get past the 2-month window, the returns look weak, especially the 3-month timeframe.
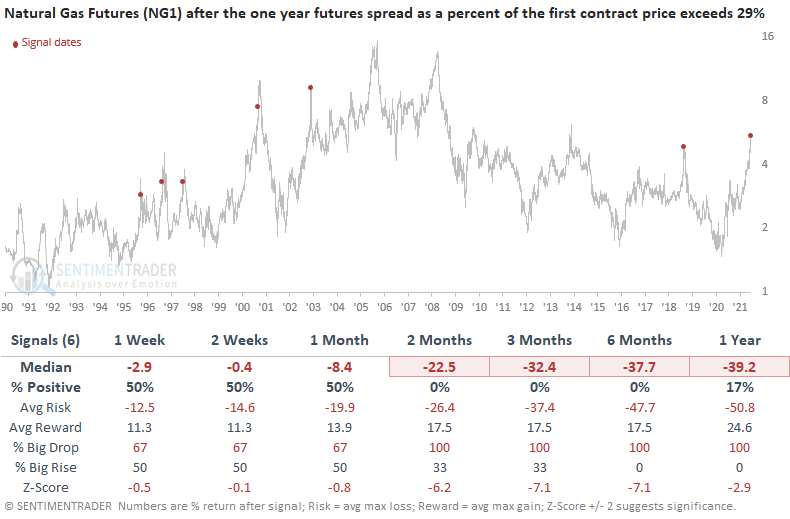
The natural gas one-year futures spread as a percent of the first contract price is an excellent indicator to assess a dislocation in the futures curve. Historically, a high spread identifies significant peaks in the commodity. With the spread increasing above 29% on 9/15/21, let's assess the forward return outlook for natural gas when it has crossed above that level in the past.
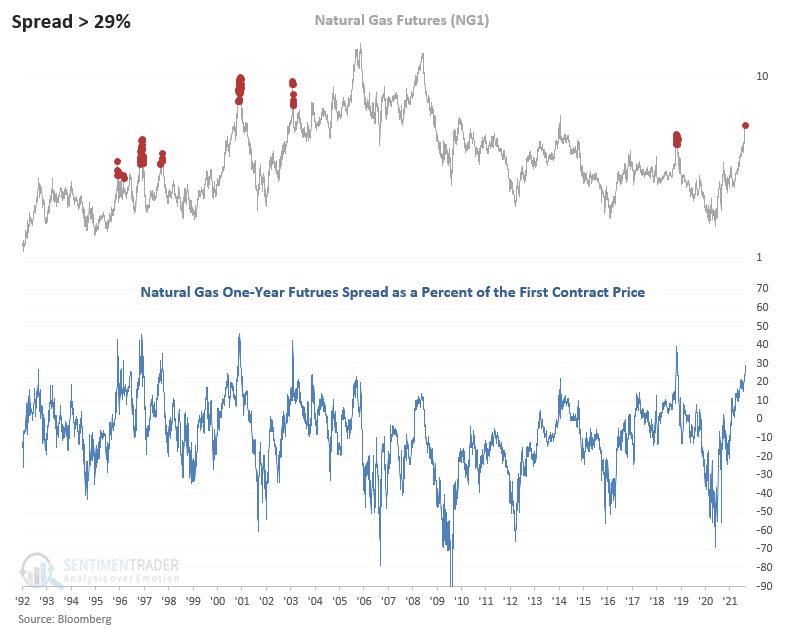
Results are a coin toss in the short term with some substantial gains. Once you get past that timeframe, watch out below.
Active Studies
| Time Frame | Bullish | Bearish | | Short-Term | 0 | 6 | | Medium-Term | 5 | 3 | | Long-Term | 11 | 5 |
|
Indicators at Extremes
Portfolio
| Position | Description | Weight % | Added / Reduced | Date | | Stocks | RSP | 4.1 | Added 4.1% | 2021-05-19 | | Bonds | 23.9% BND, 6.9% SCHP | 30.7 | Reduced 7.1% | 2021-05-19 | | Commodities | GCC | 2.6 | Reduced 2.1%
| 2020-09-04 | | Precious Metals | GDX | 5.6 | Reduced 4.2% | 2021-05-19 | | Special Situations | 4.3% XLE, 2.2% PSCE | 7.6 | Reduced 5.6% | 2021-04-22 | | Cash | | 49.4 | | |
|
Updates (Changes made today are underlined)
Much of our momentum and trend work has remained positive for several months, with some scattered exceptions. Almost all sentiment-related work has shown a poor risk/reward ratio for stocks, especially as speculation drove to record highs in exuberance in February. Much of that has worn off, and most of our models are back toward neutral levels. There isn't much to be excited about here. The same goes for bonds and even gold. Gold has been performing well lately and is back above long-term trend lines. The issue is that it has a poor record of holding onto gains when attempting a long-term trend change like this, so we'll take a wait-and-see approach. RETURN YTD: 8.7% 2020: 8.1%, 2019: 12.6%, 2018: 0.6%, 2017: 3.8%, 2016: 17.1%, 2015: 9.2%, 2014: 14.5%, 2013: 2.2%, 2012: 10.8%, 2011: 16.5%, 2010: 15.3%, 2009: 23.9%, 2008: 16.2%, 2007: 7.8%
|
|
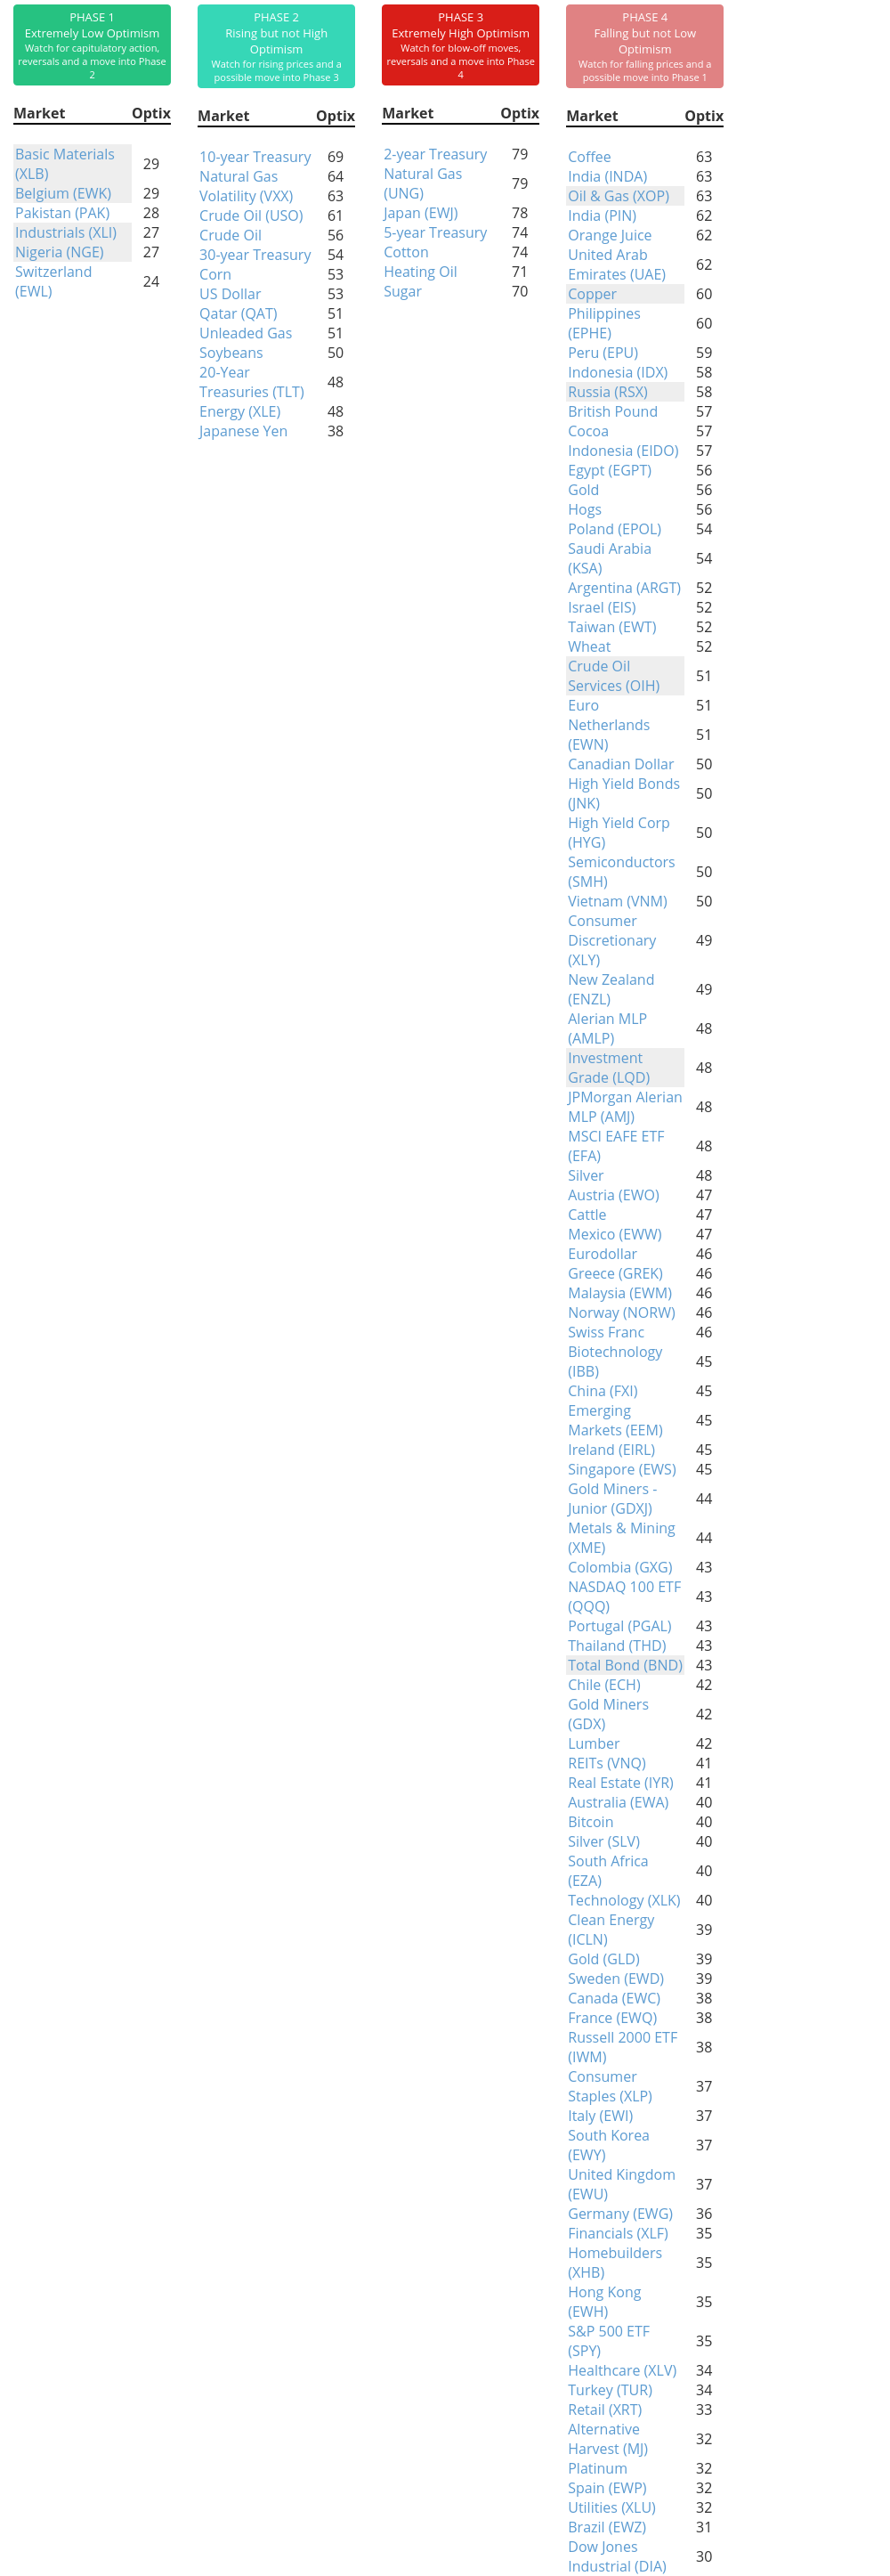
Phase Table
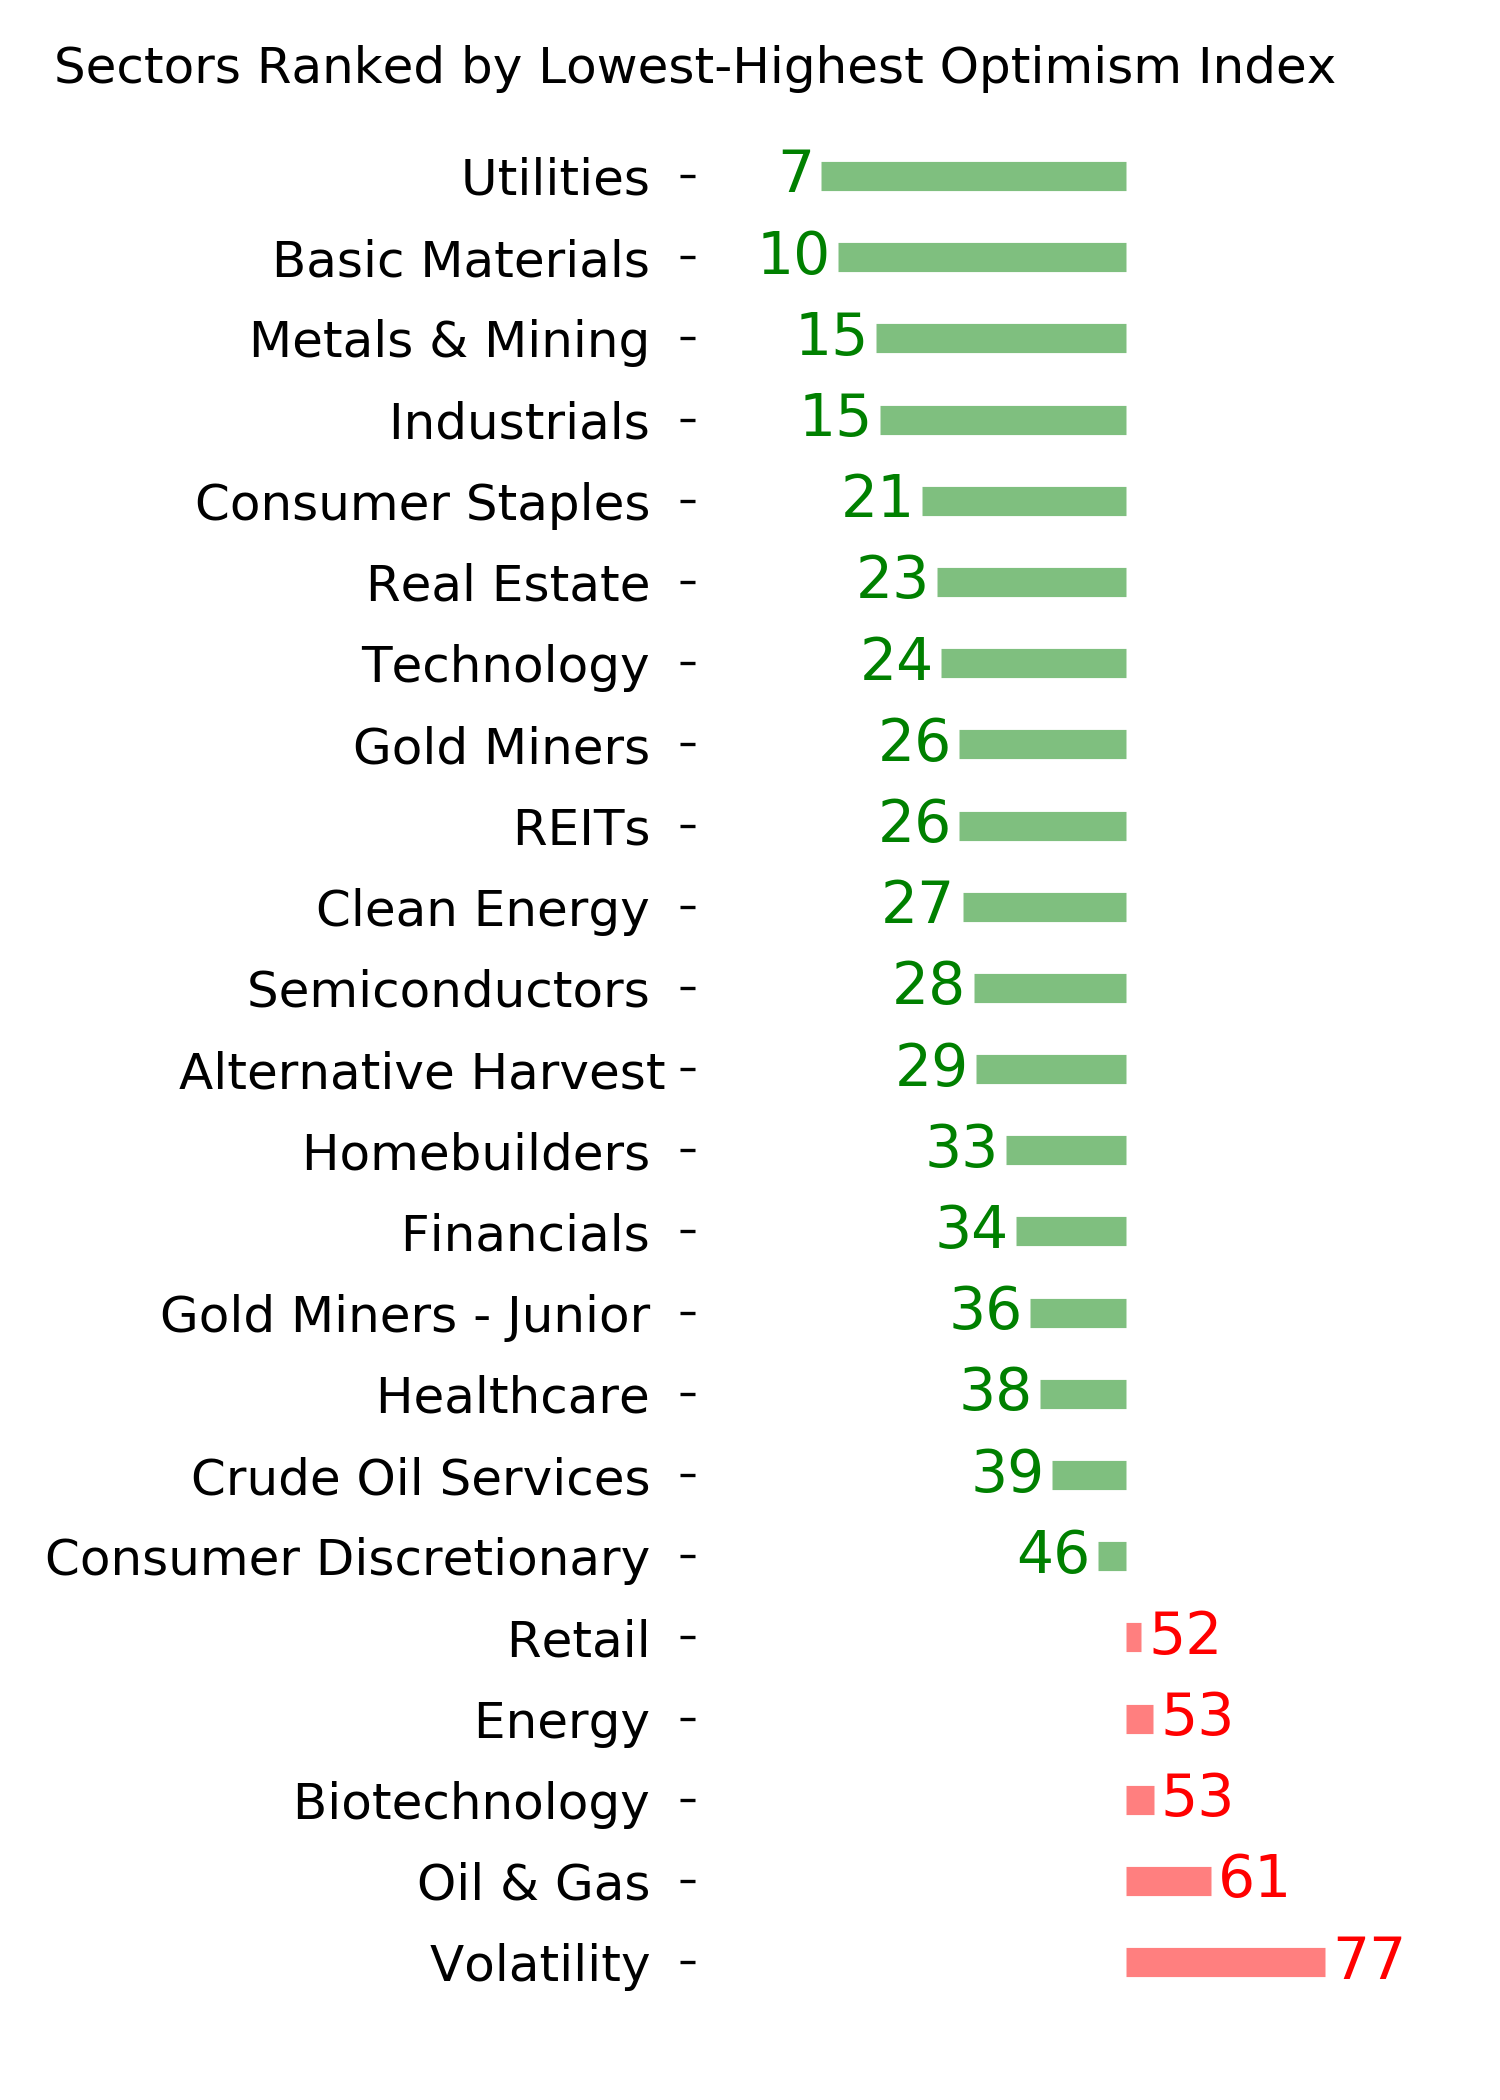
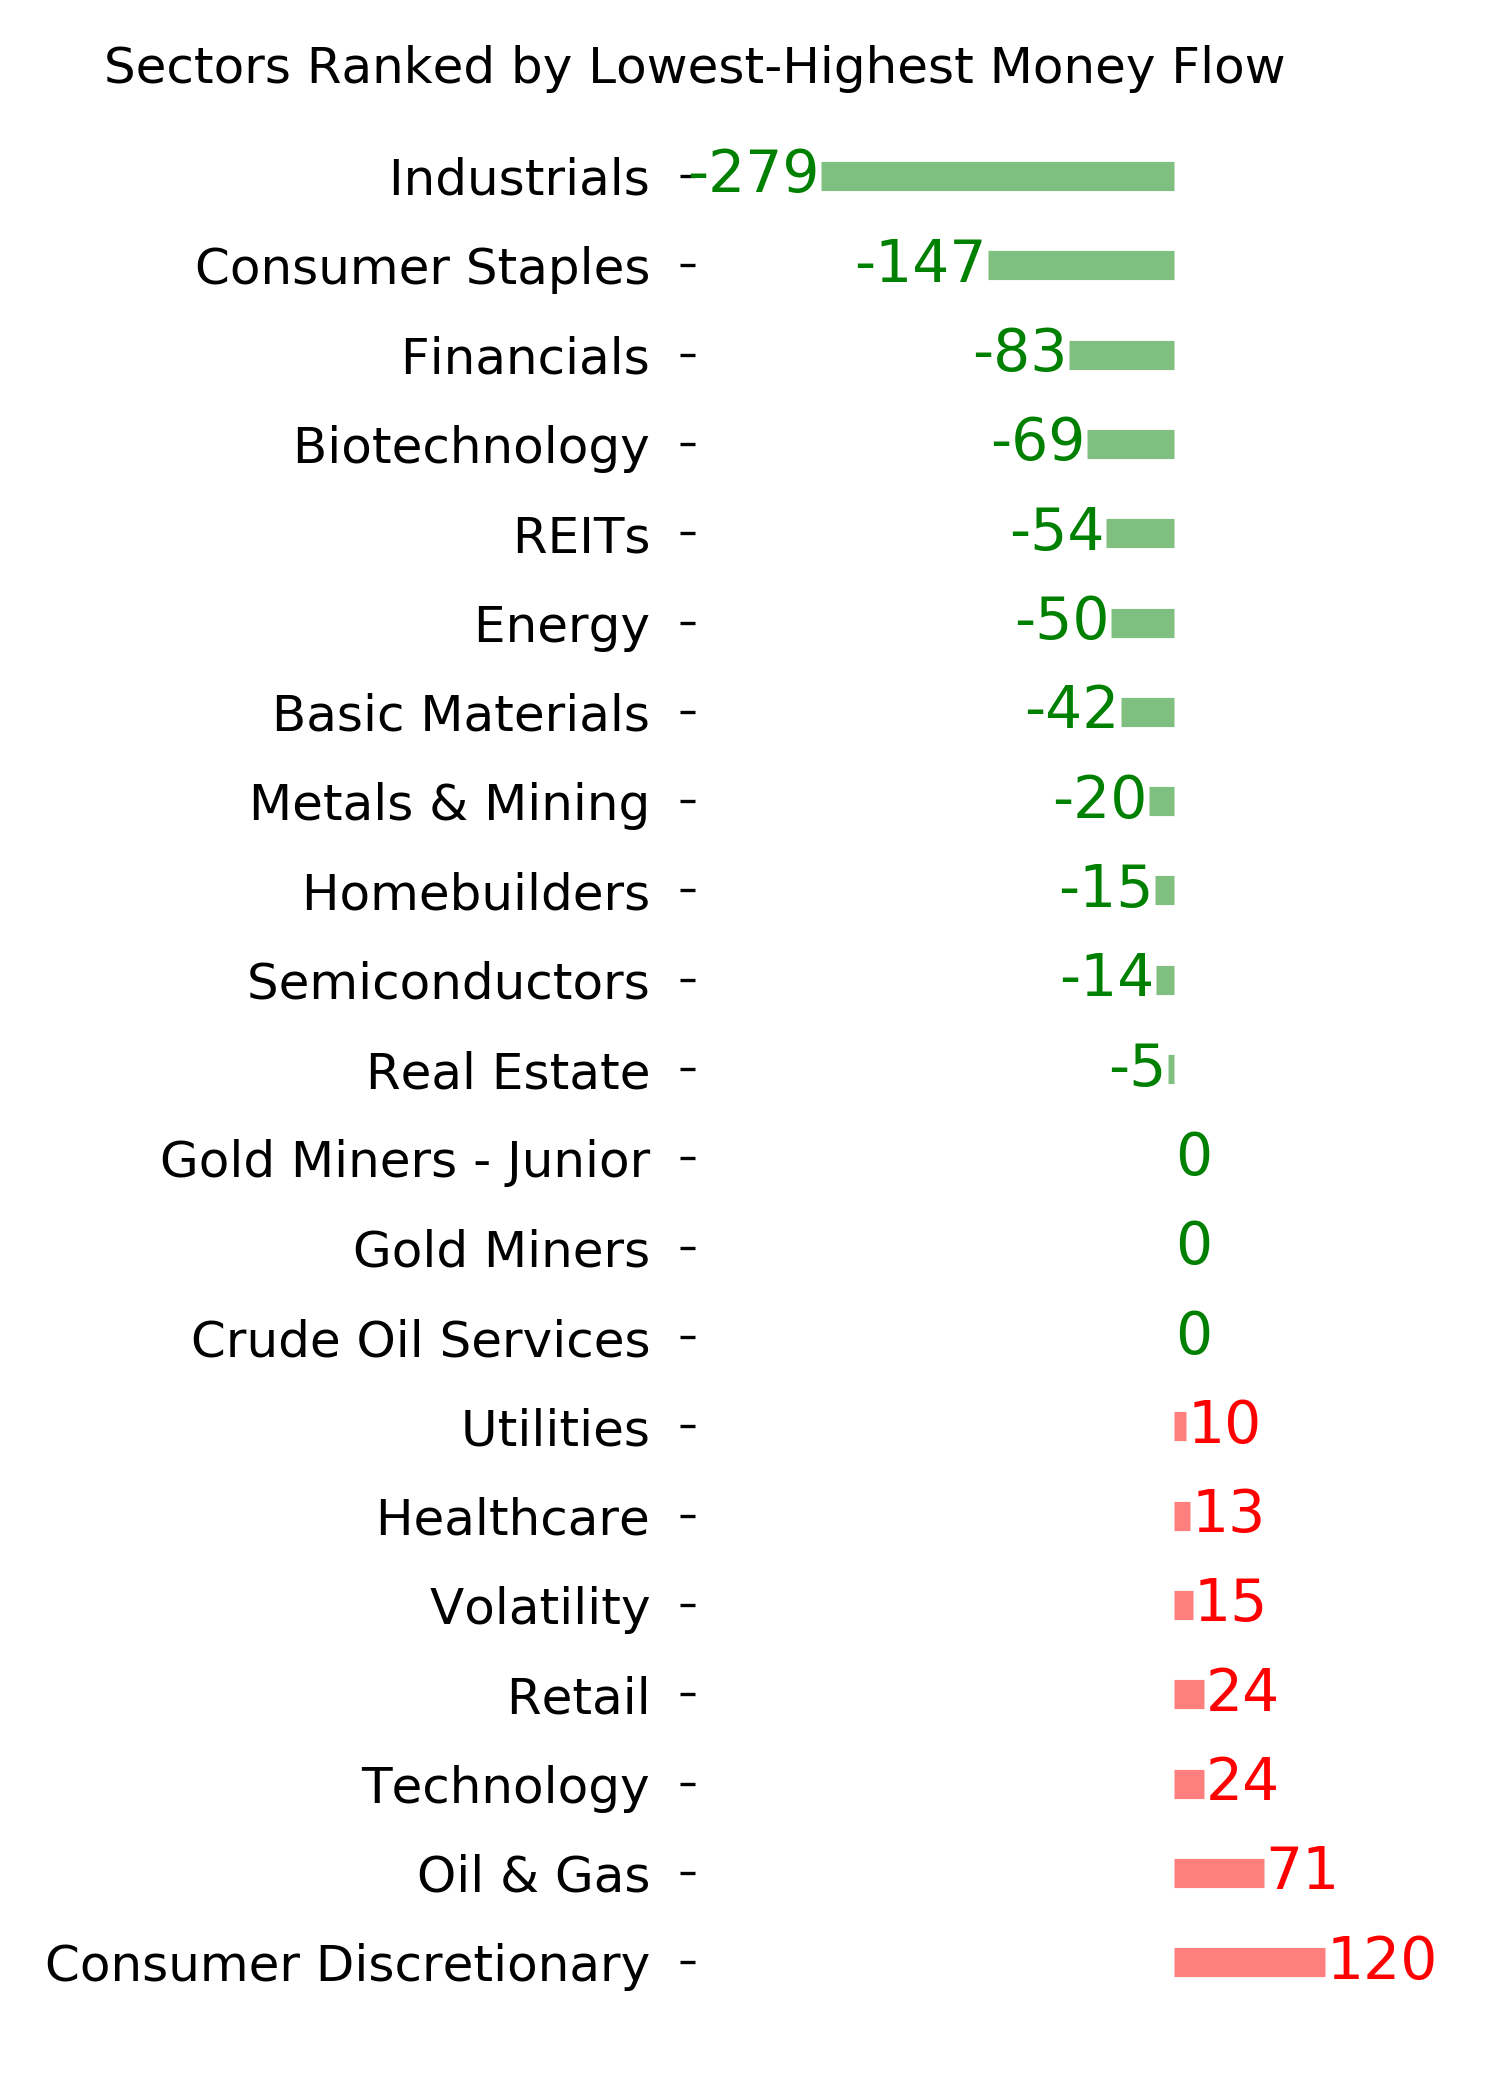
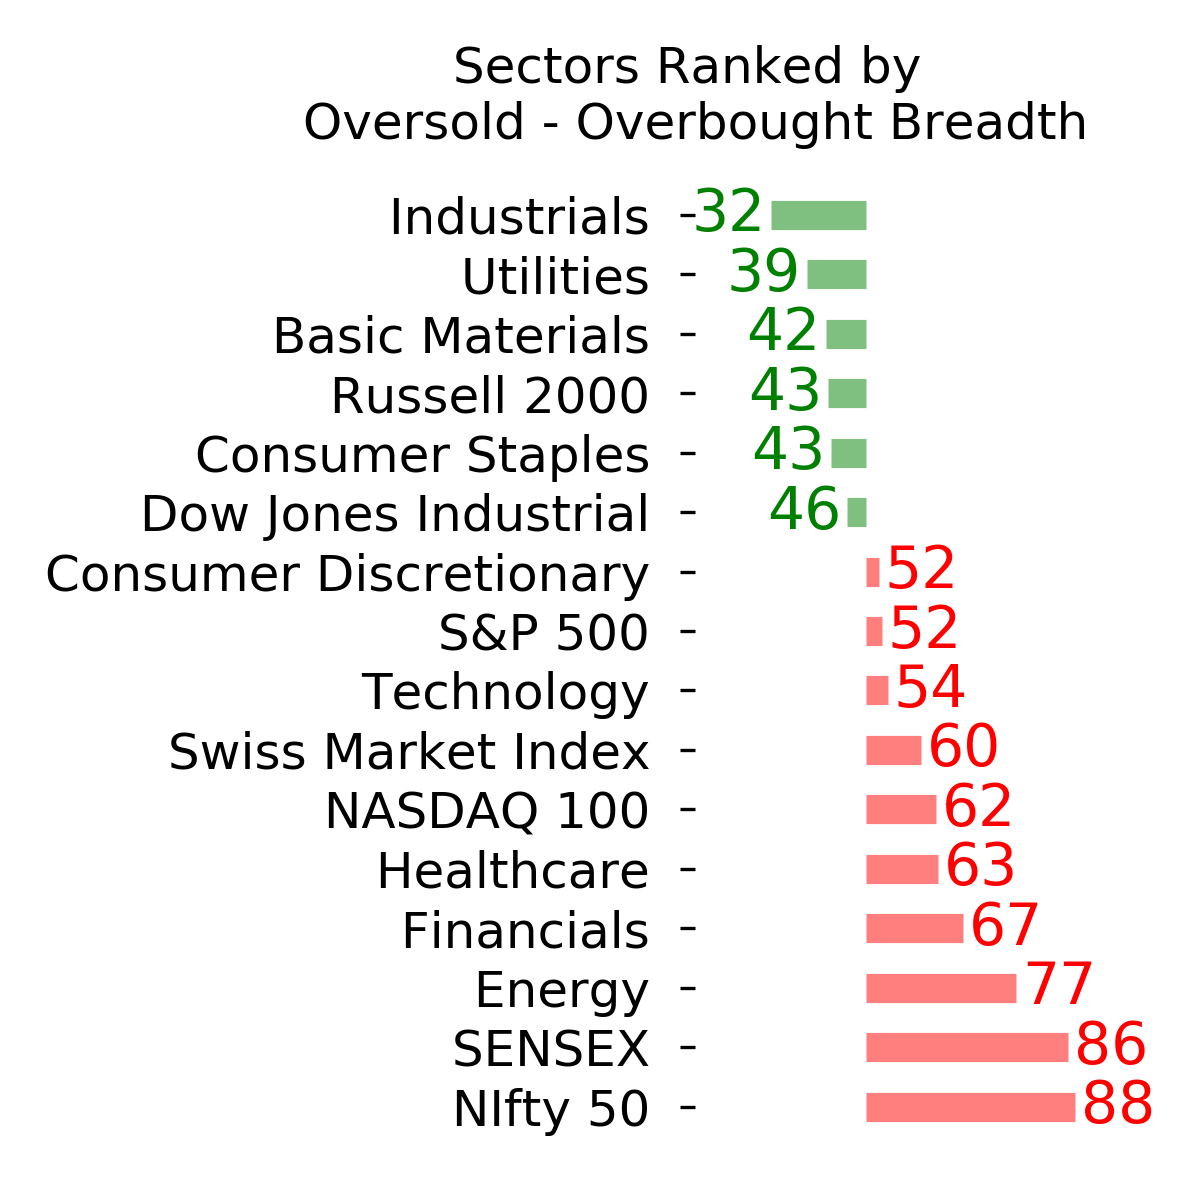
Ranks
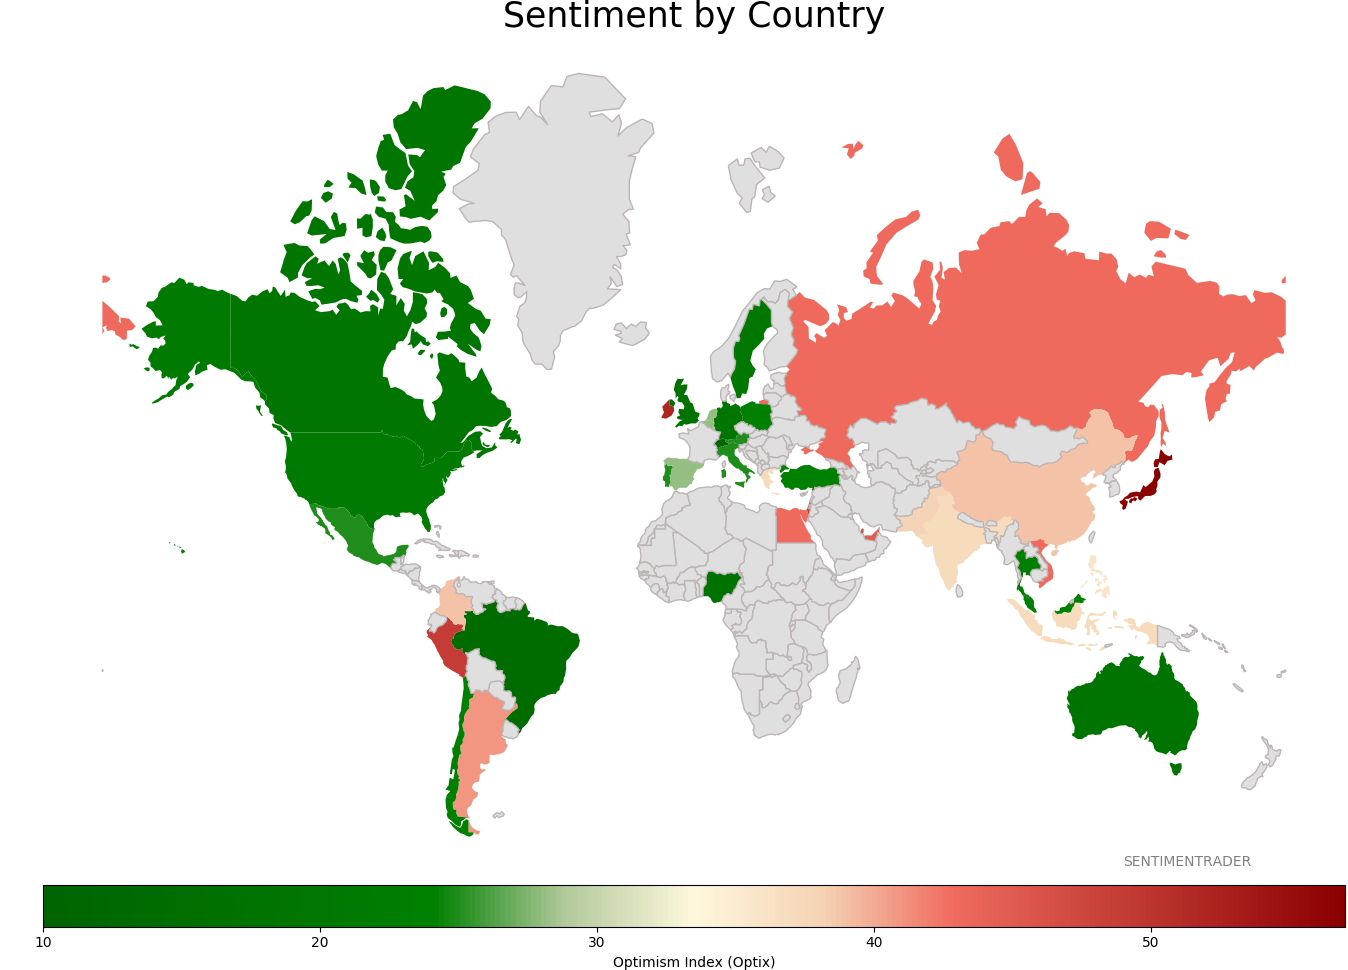
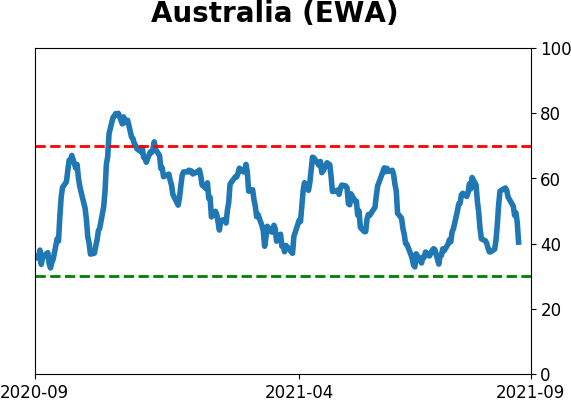
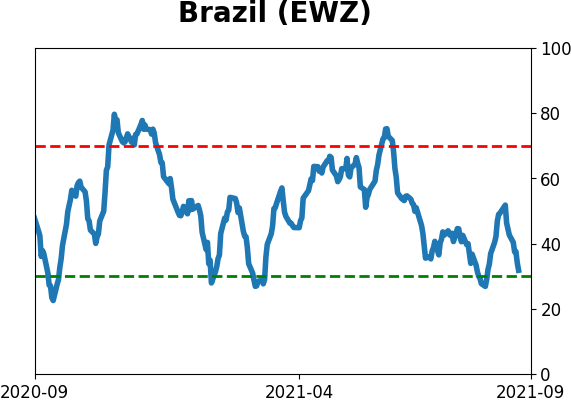
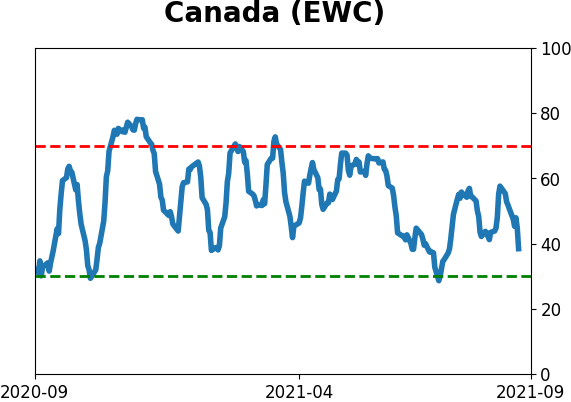
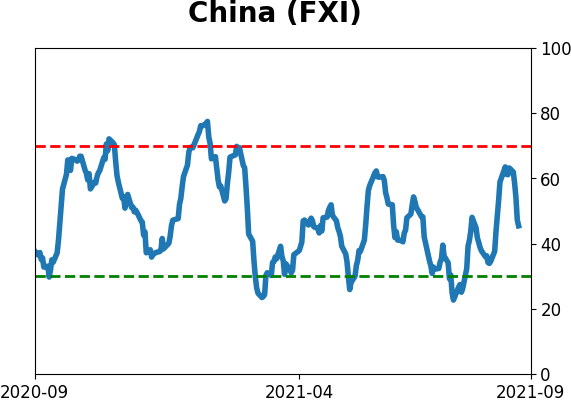
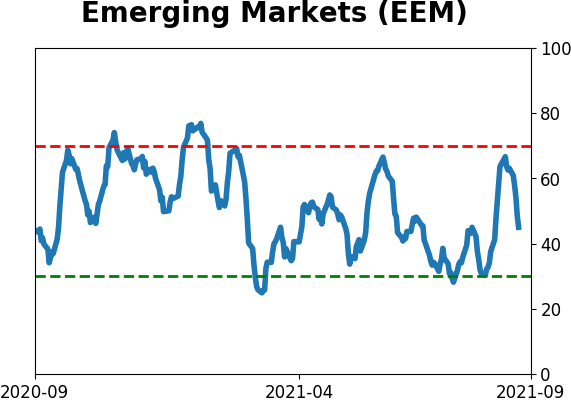
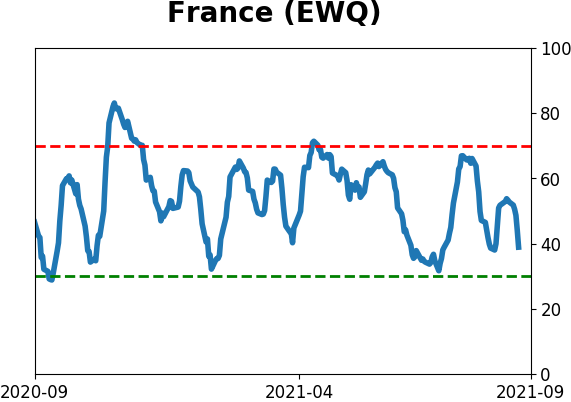
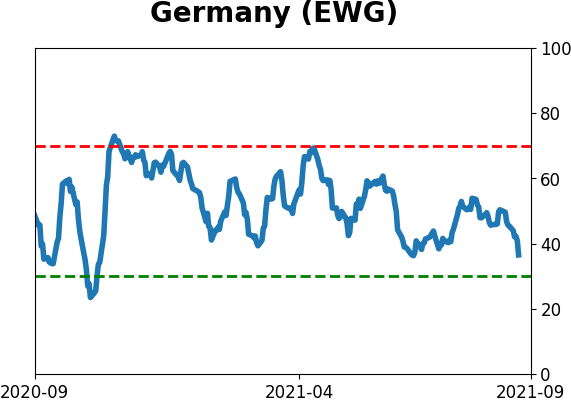
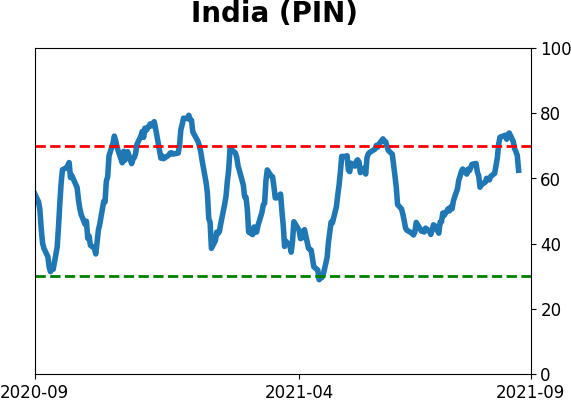
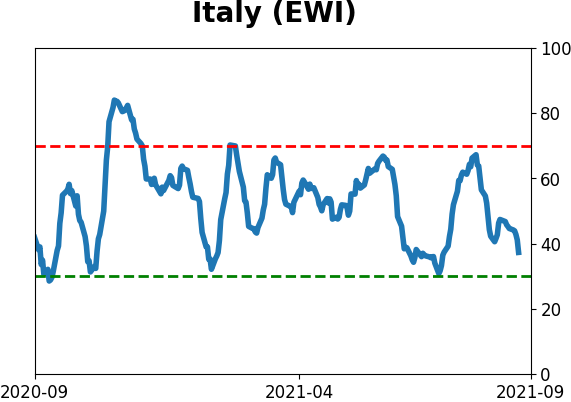
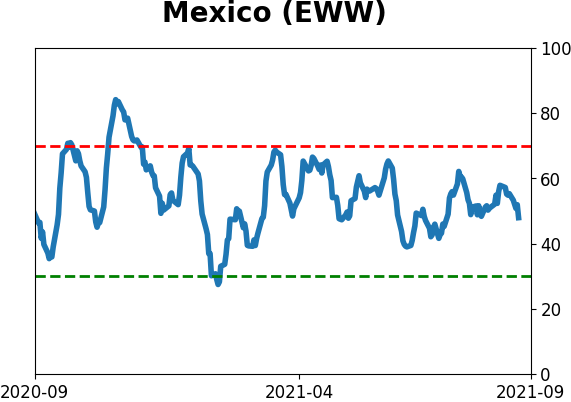
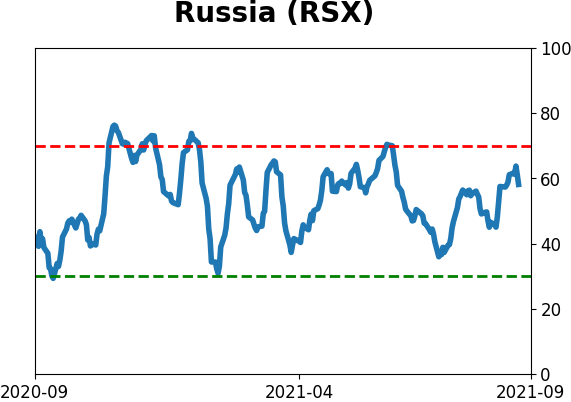
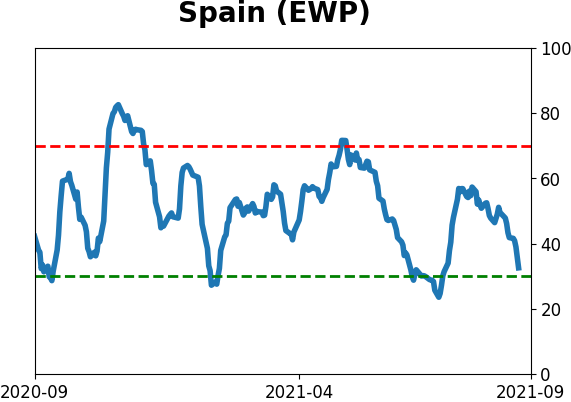
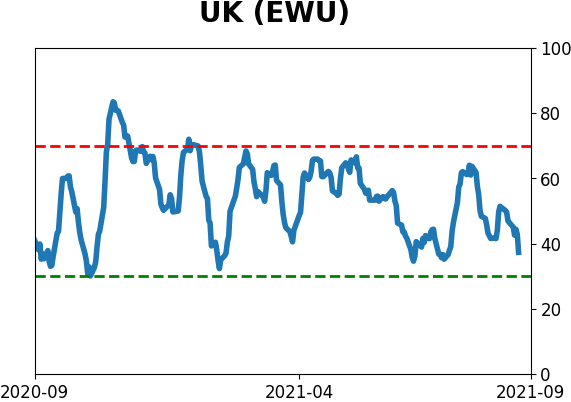
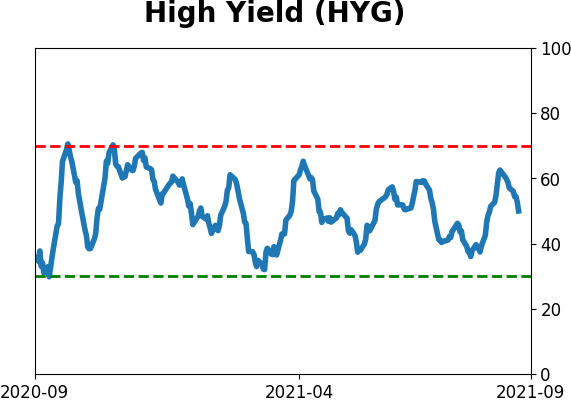
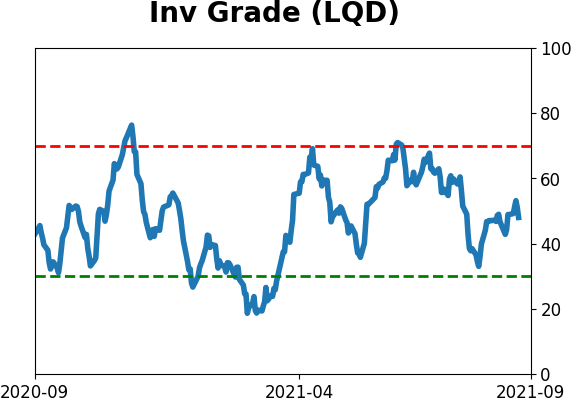
Sentiment Around The World
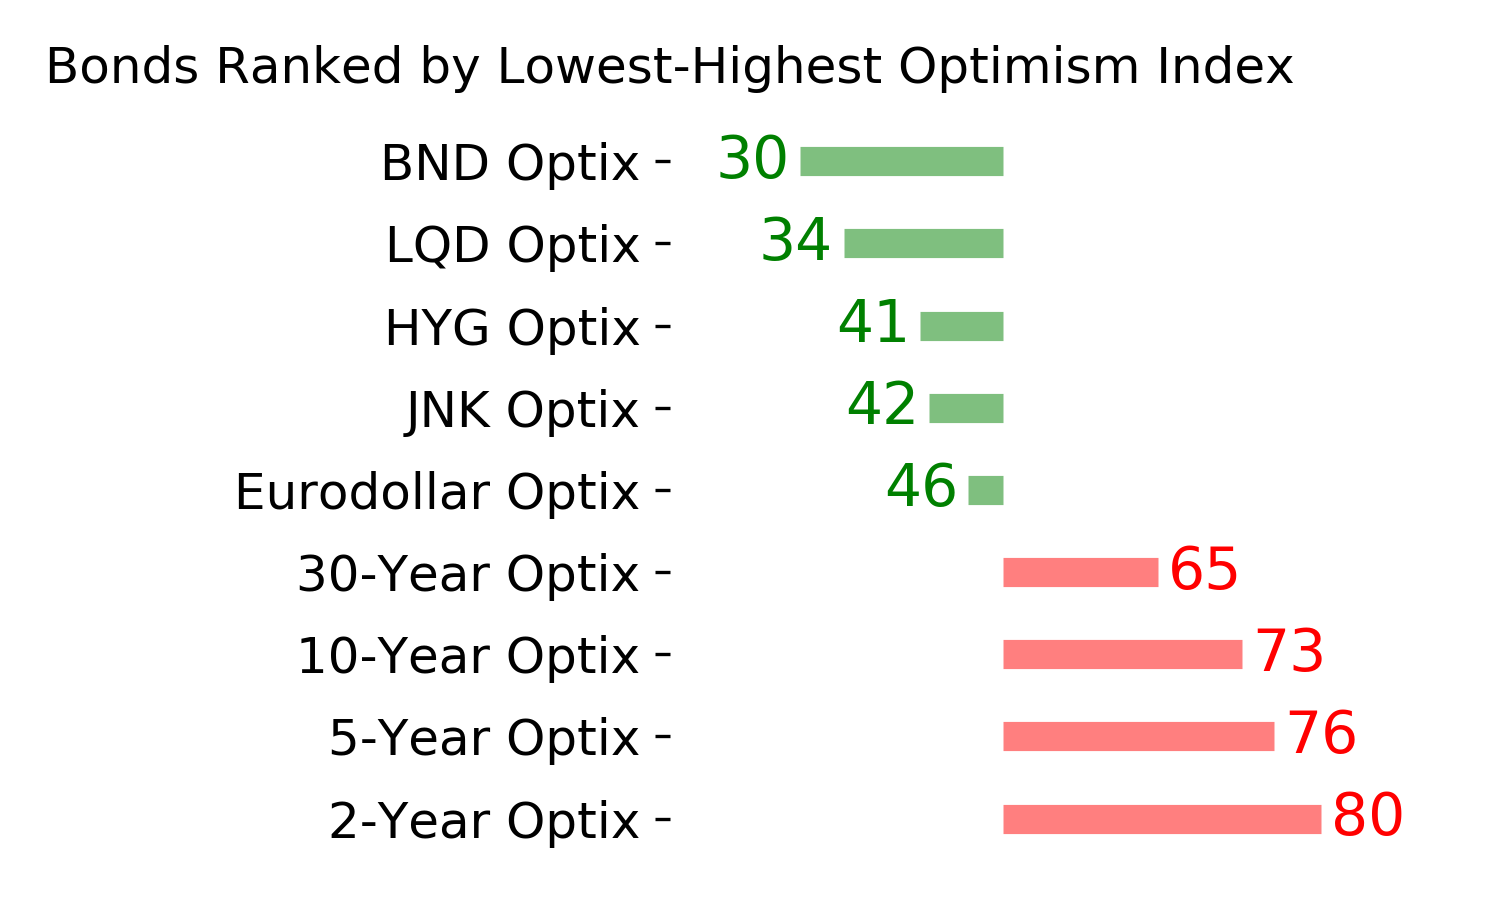
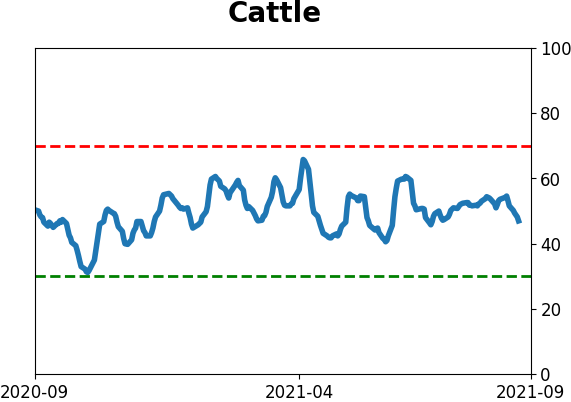
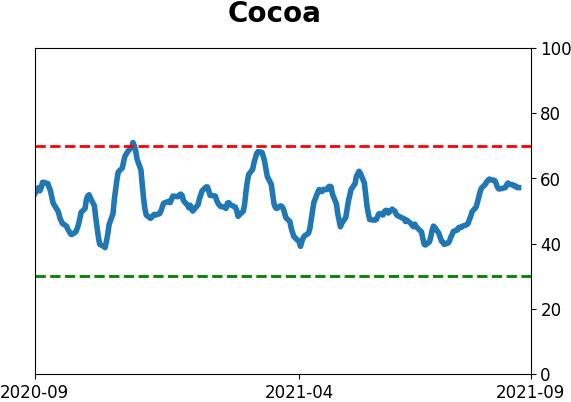
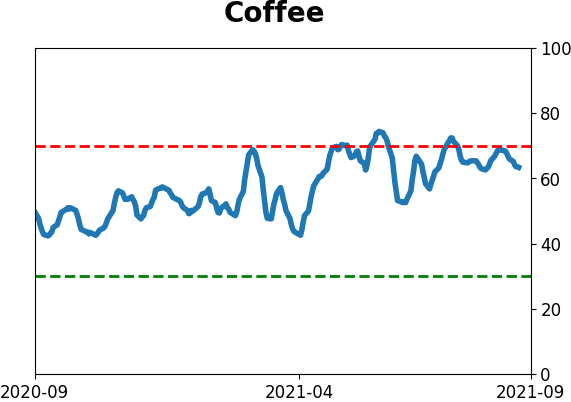
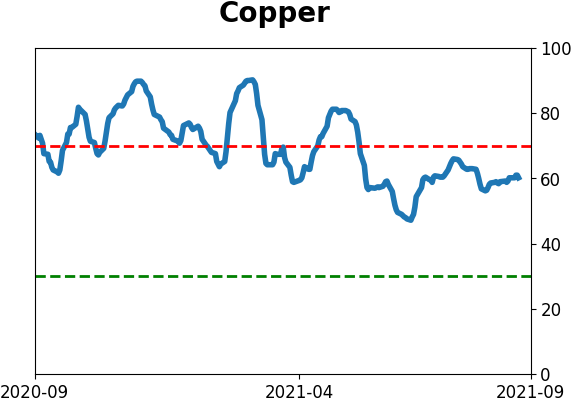
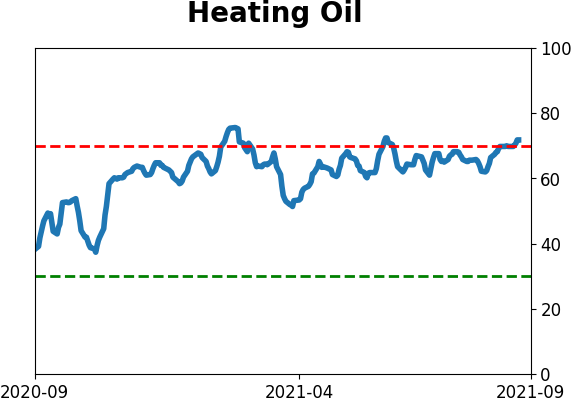
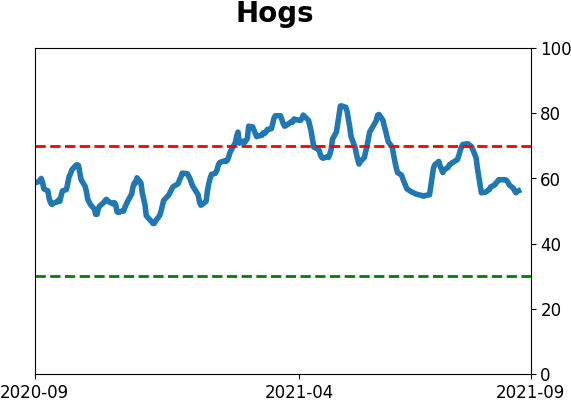
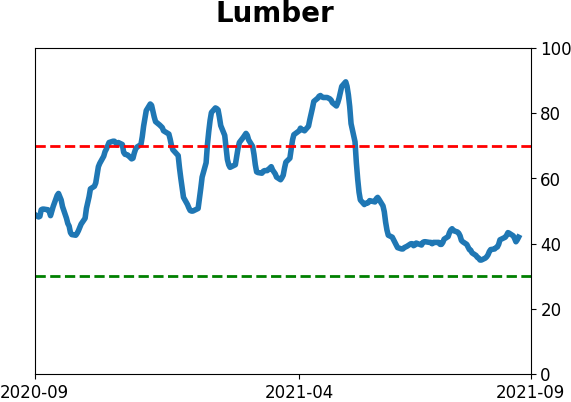
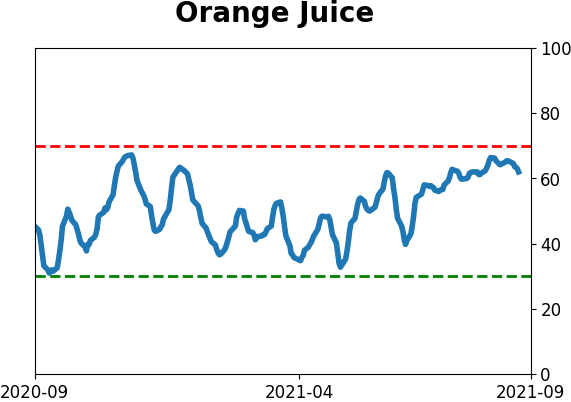
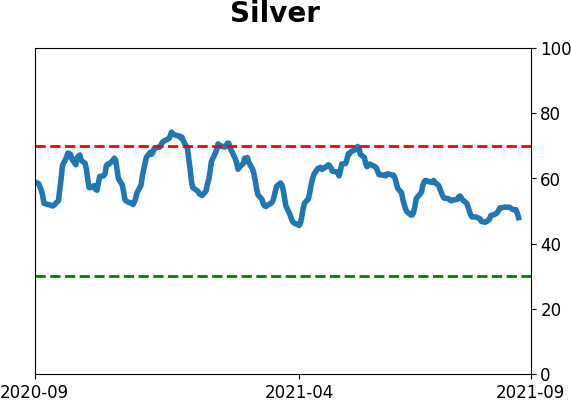
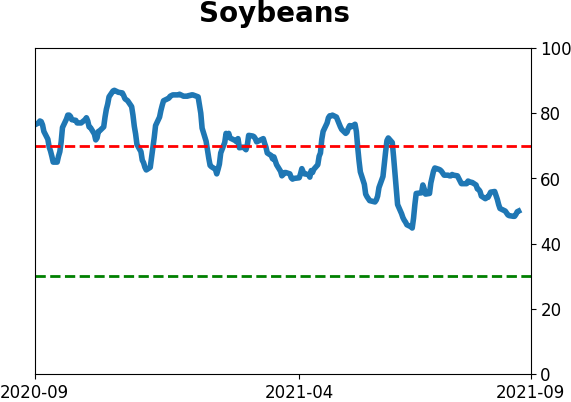
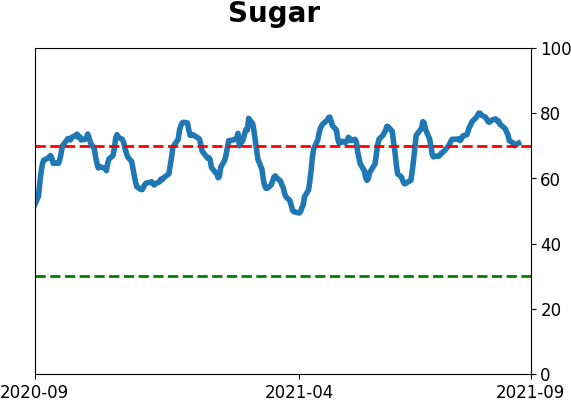
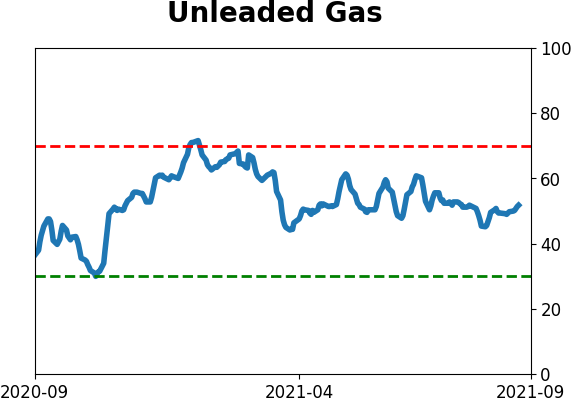
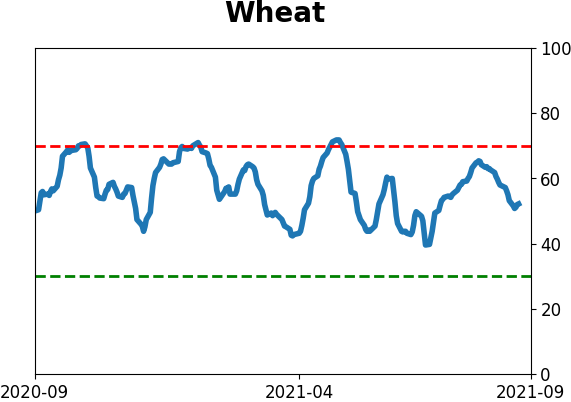
Optimism Index Thumbnails
|
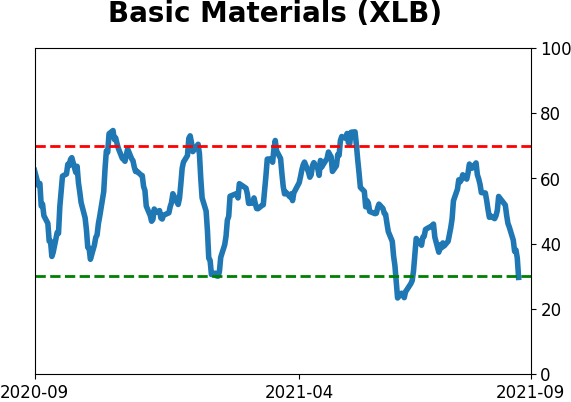
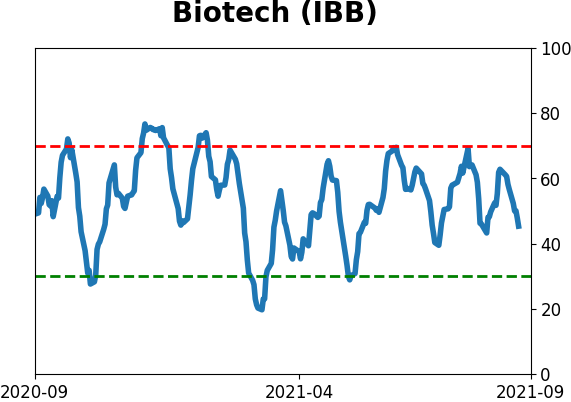
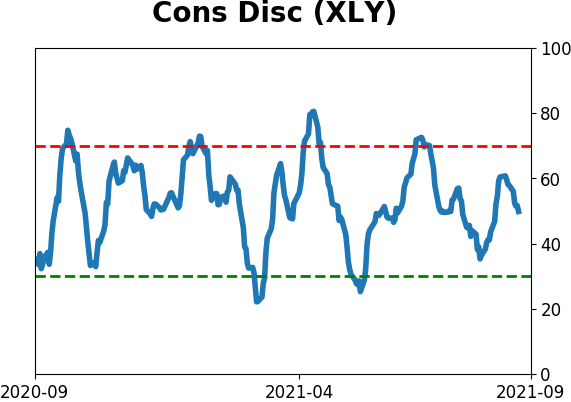
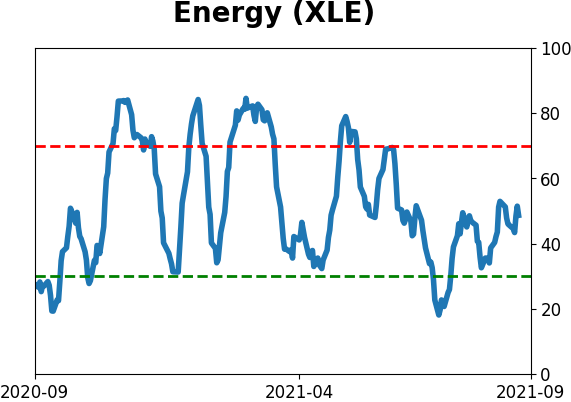
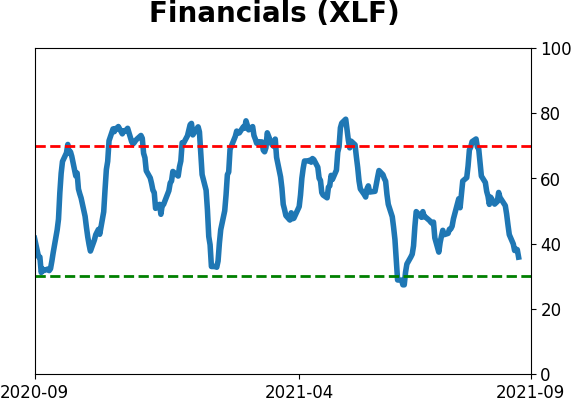
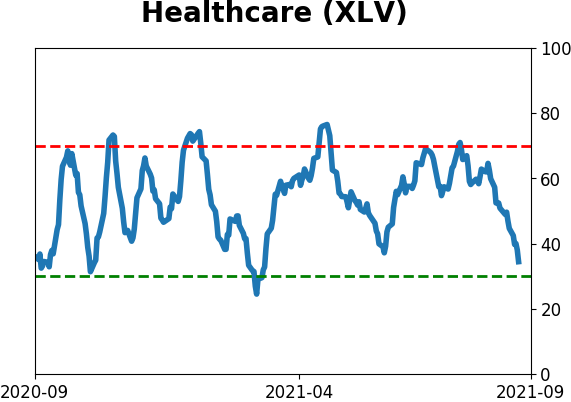
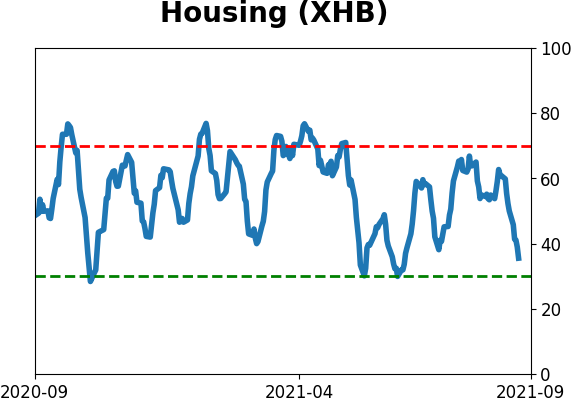
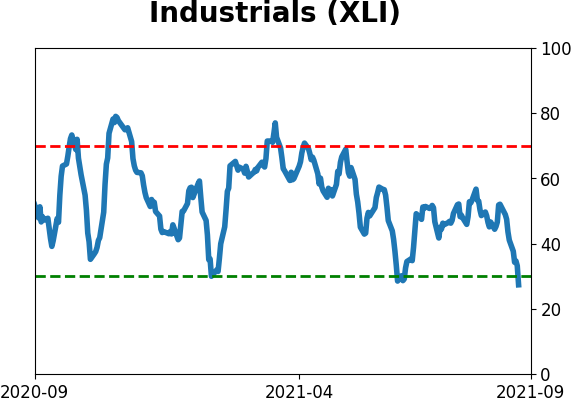
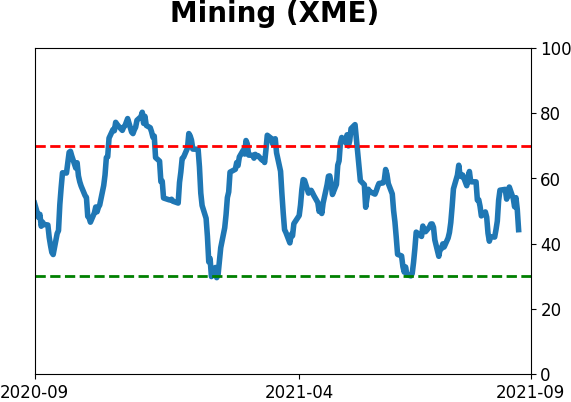
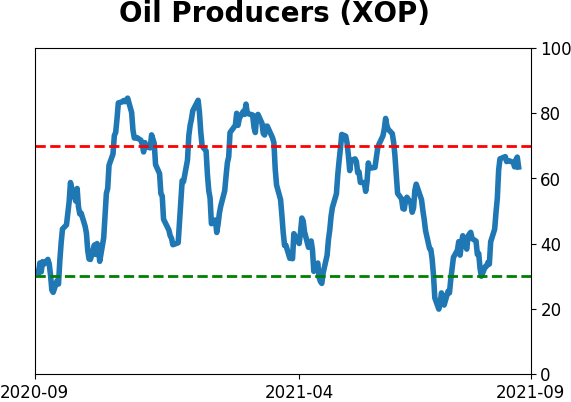
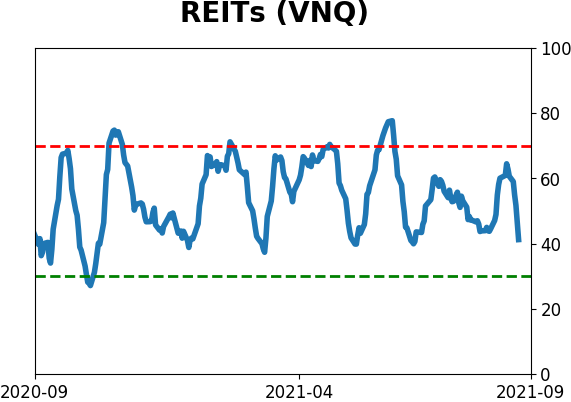
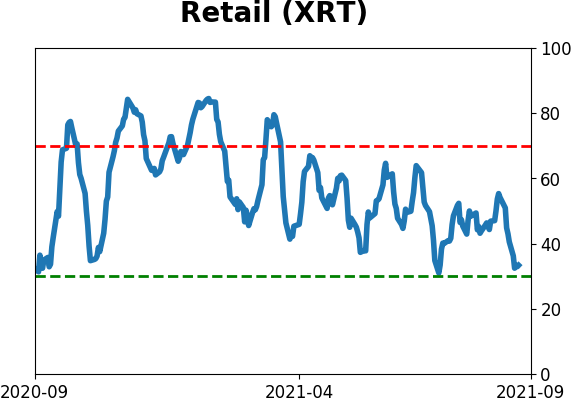
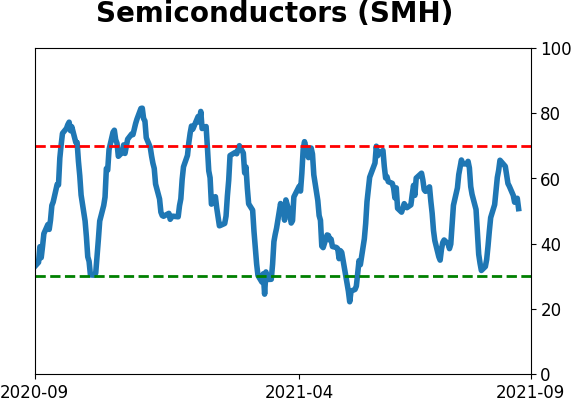
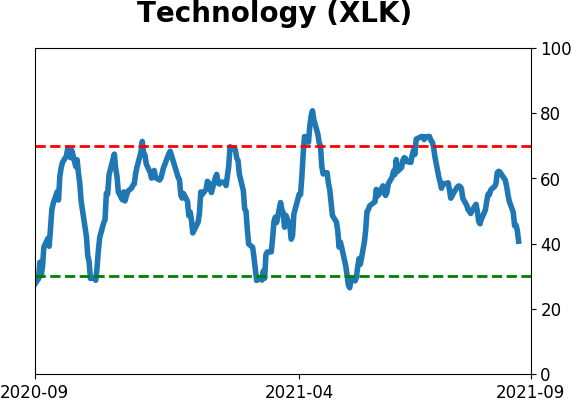
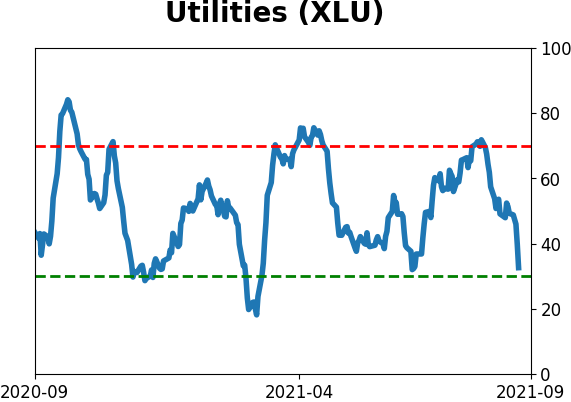
Sector ETF's - 10-Day Moving Average
|
|
|
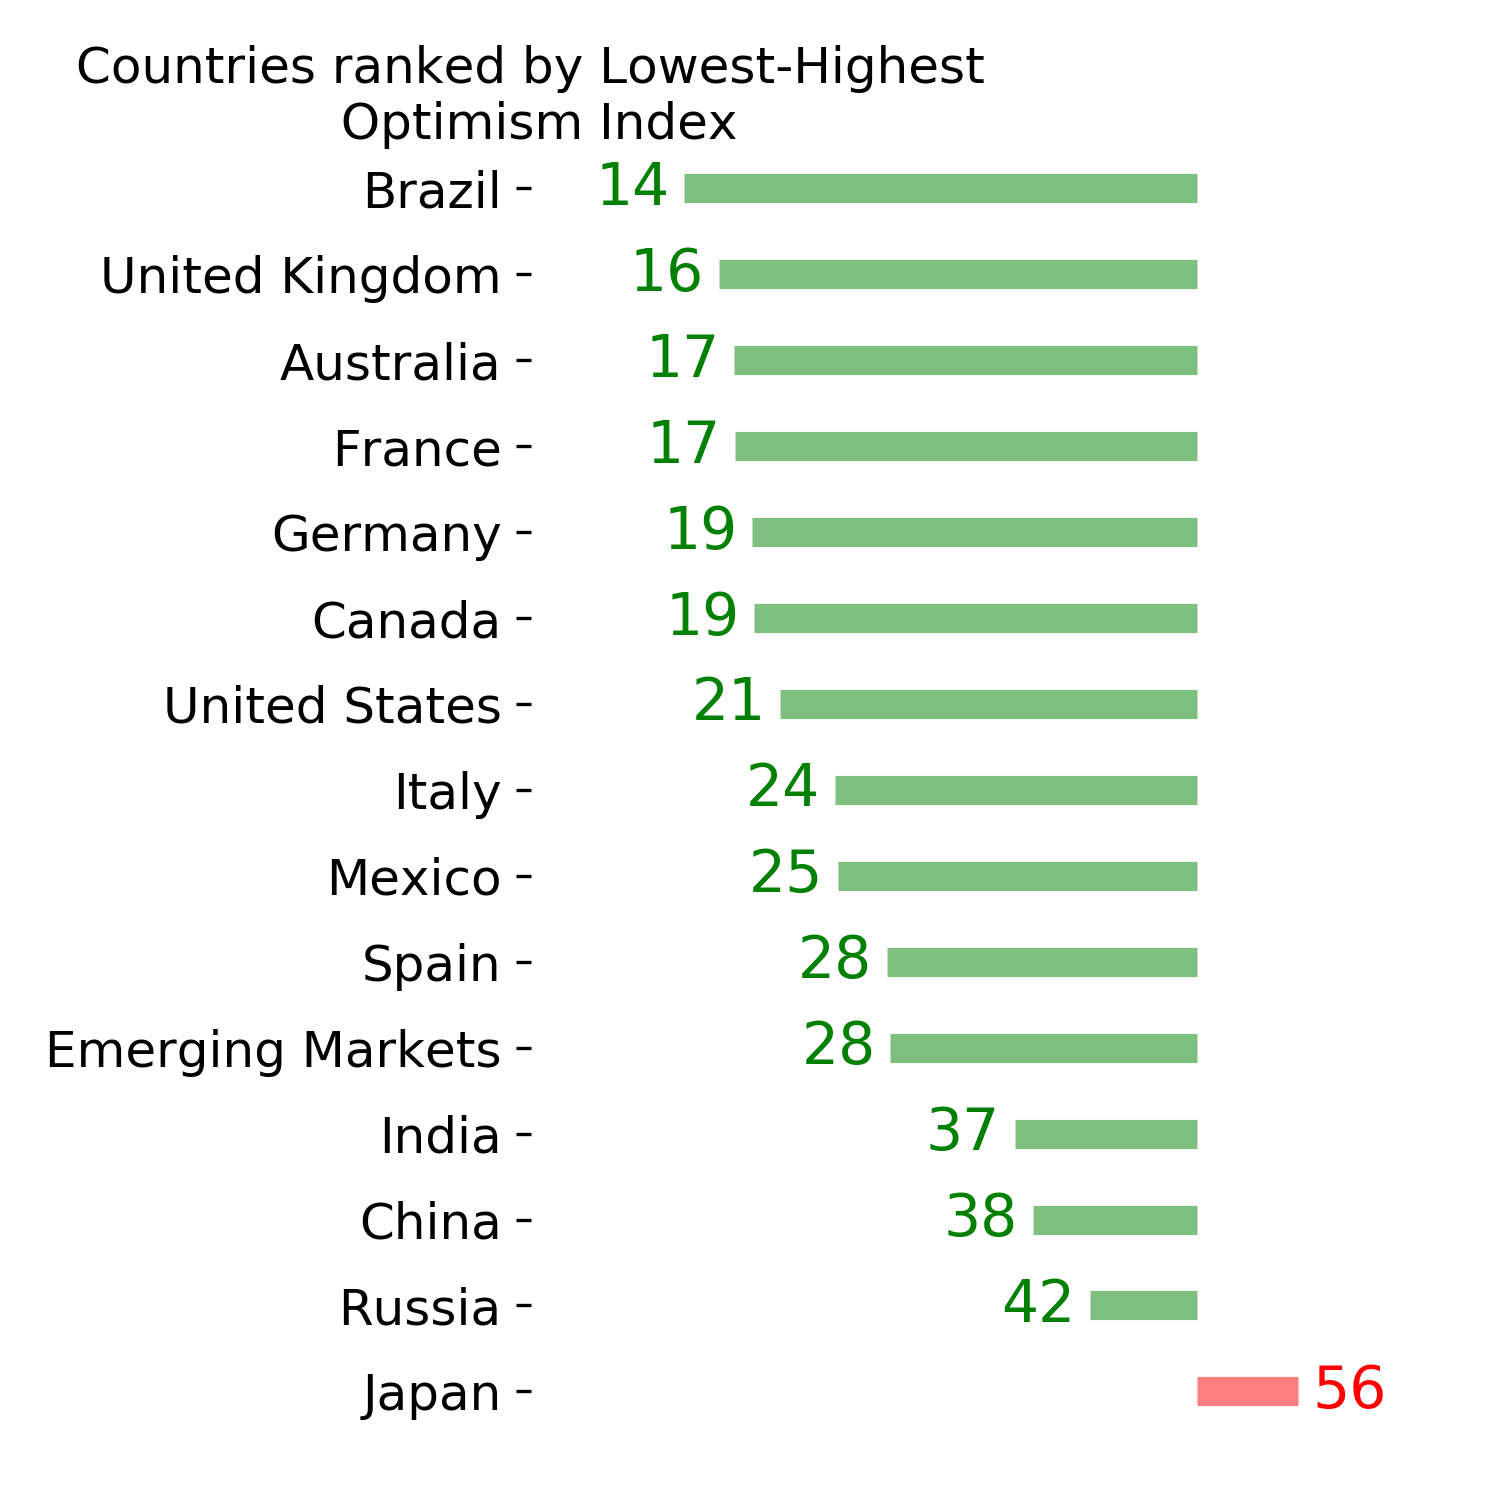
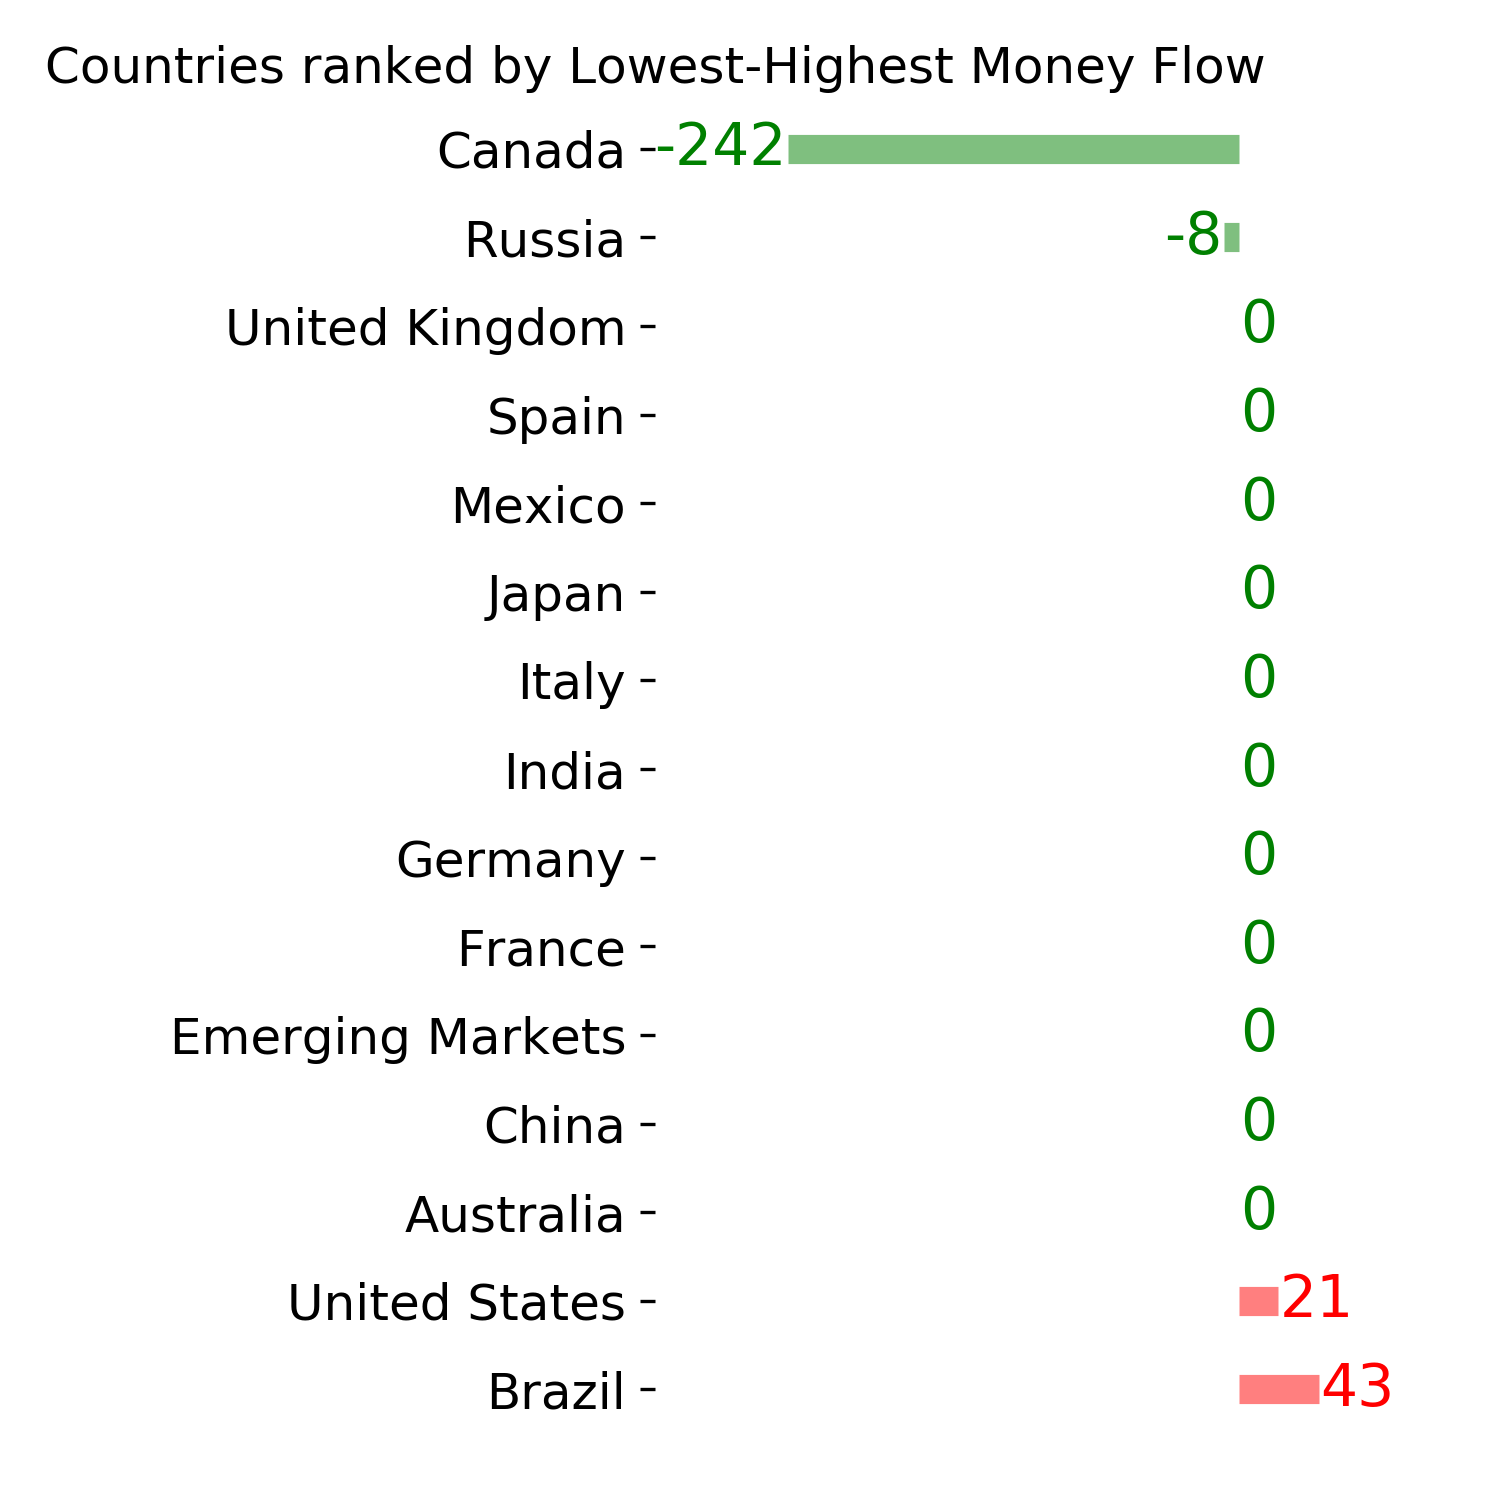
Country ETF's - 10-Day Moving Average
|
|
|
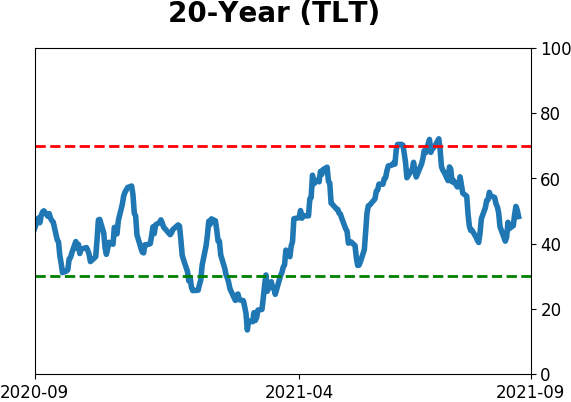
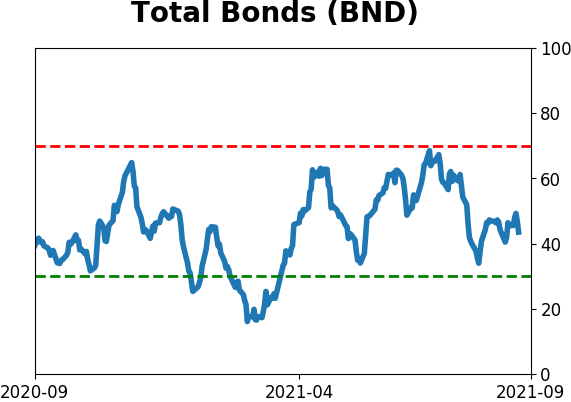
Bond ETF's - 10-Day Moving Average
|
|
|
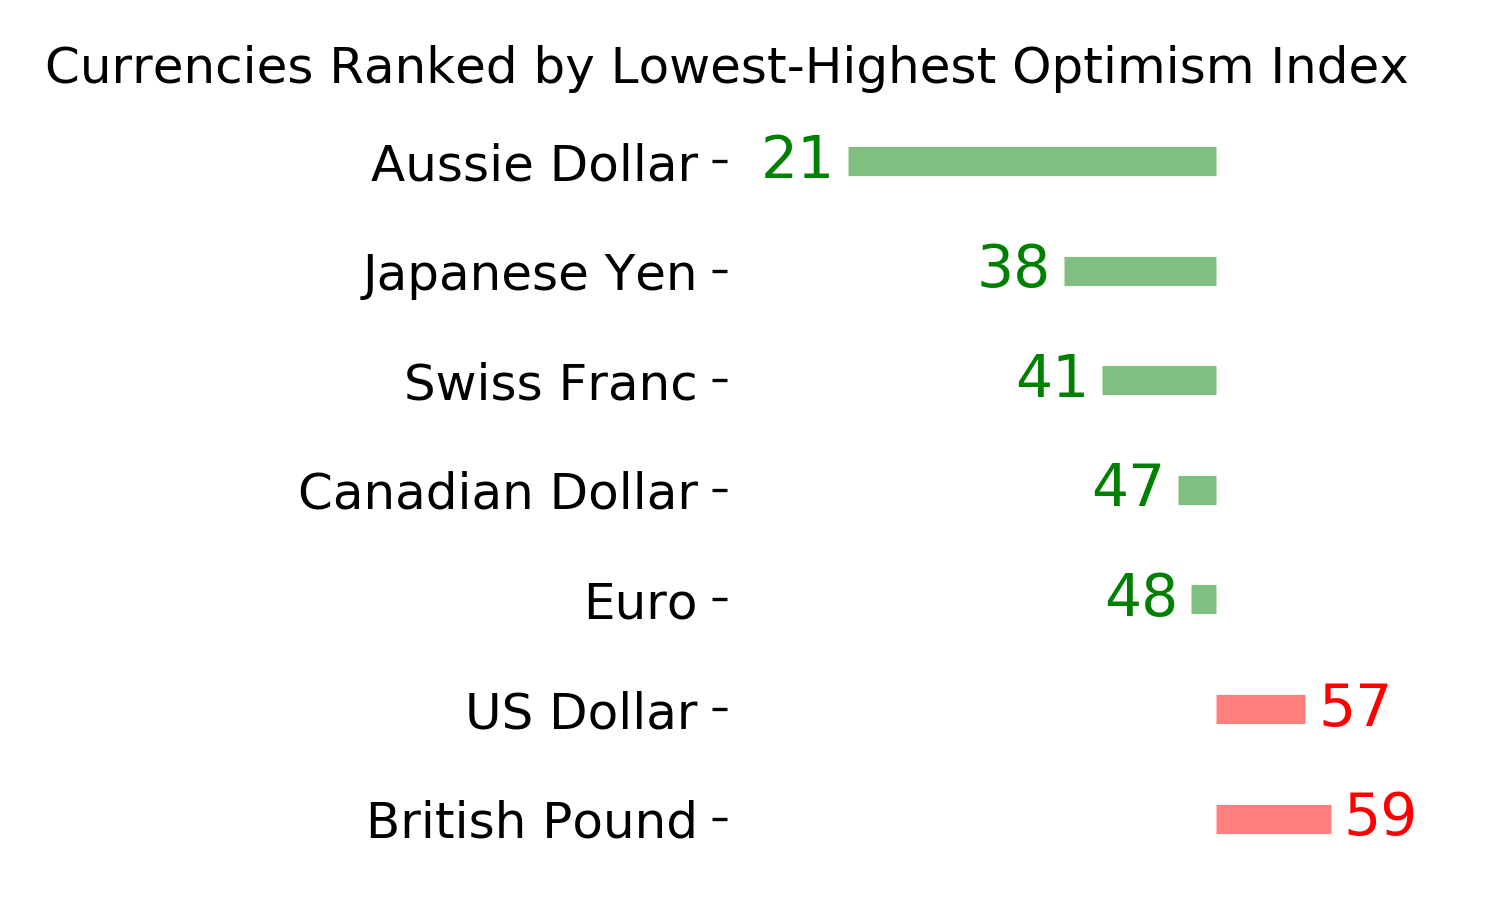
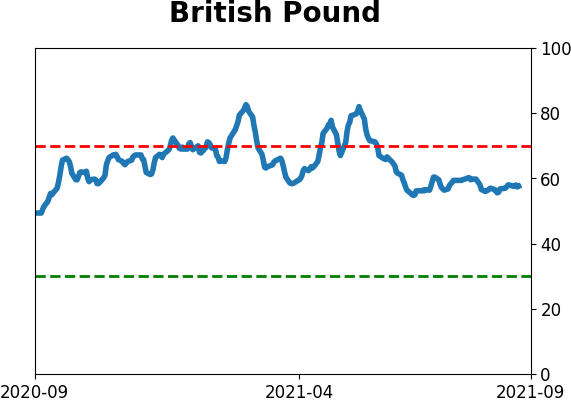
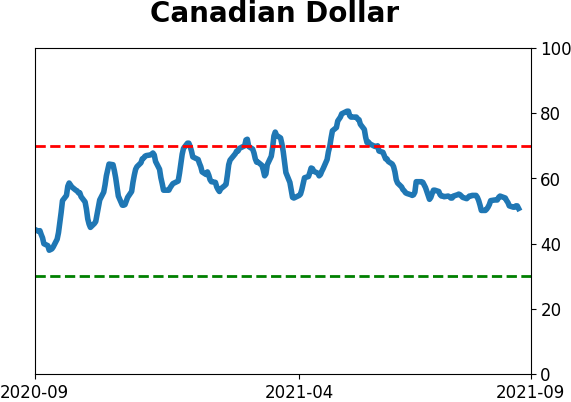
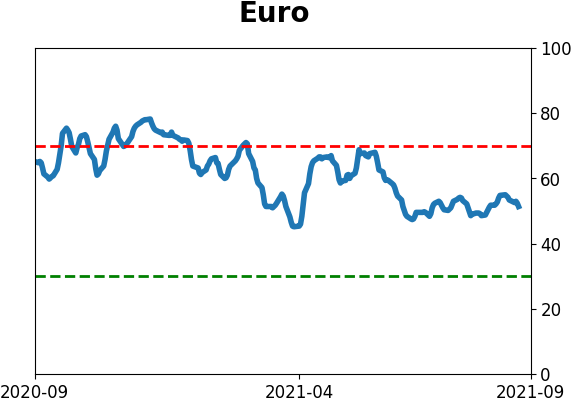
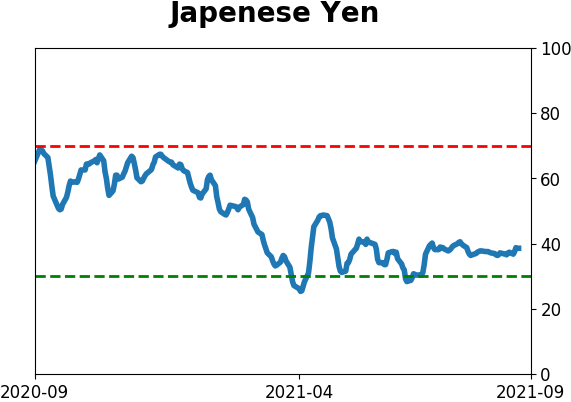
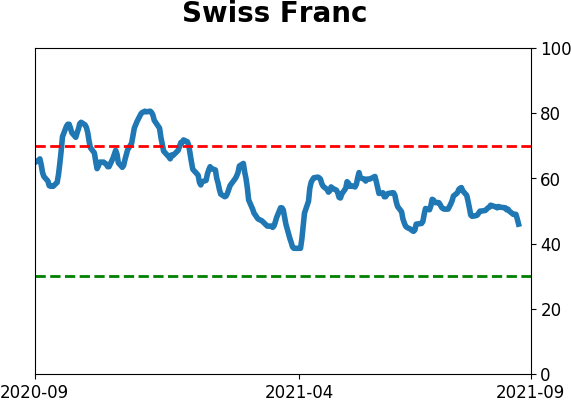
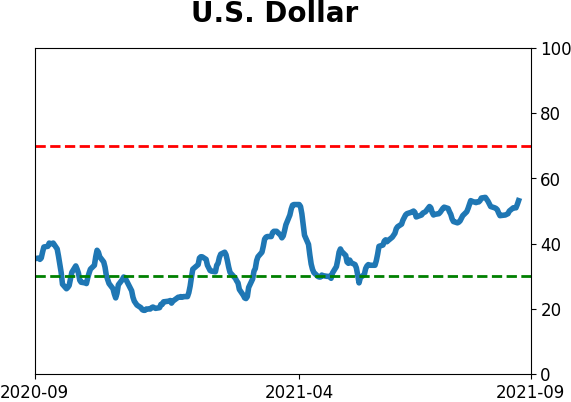
Currency ETF's - 5-Day Moving Average
|
|
|
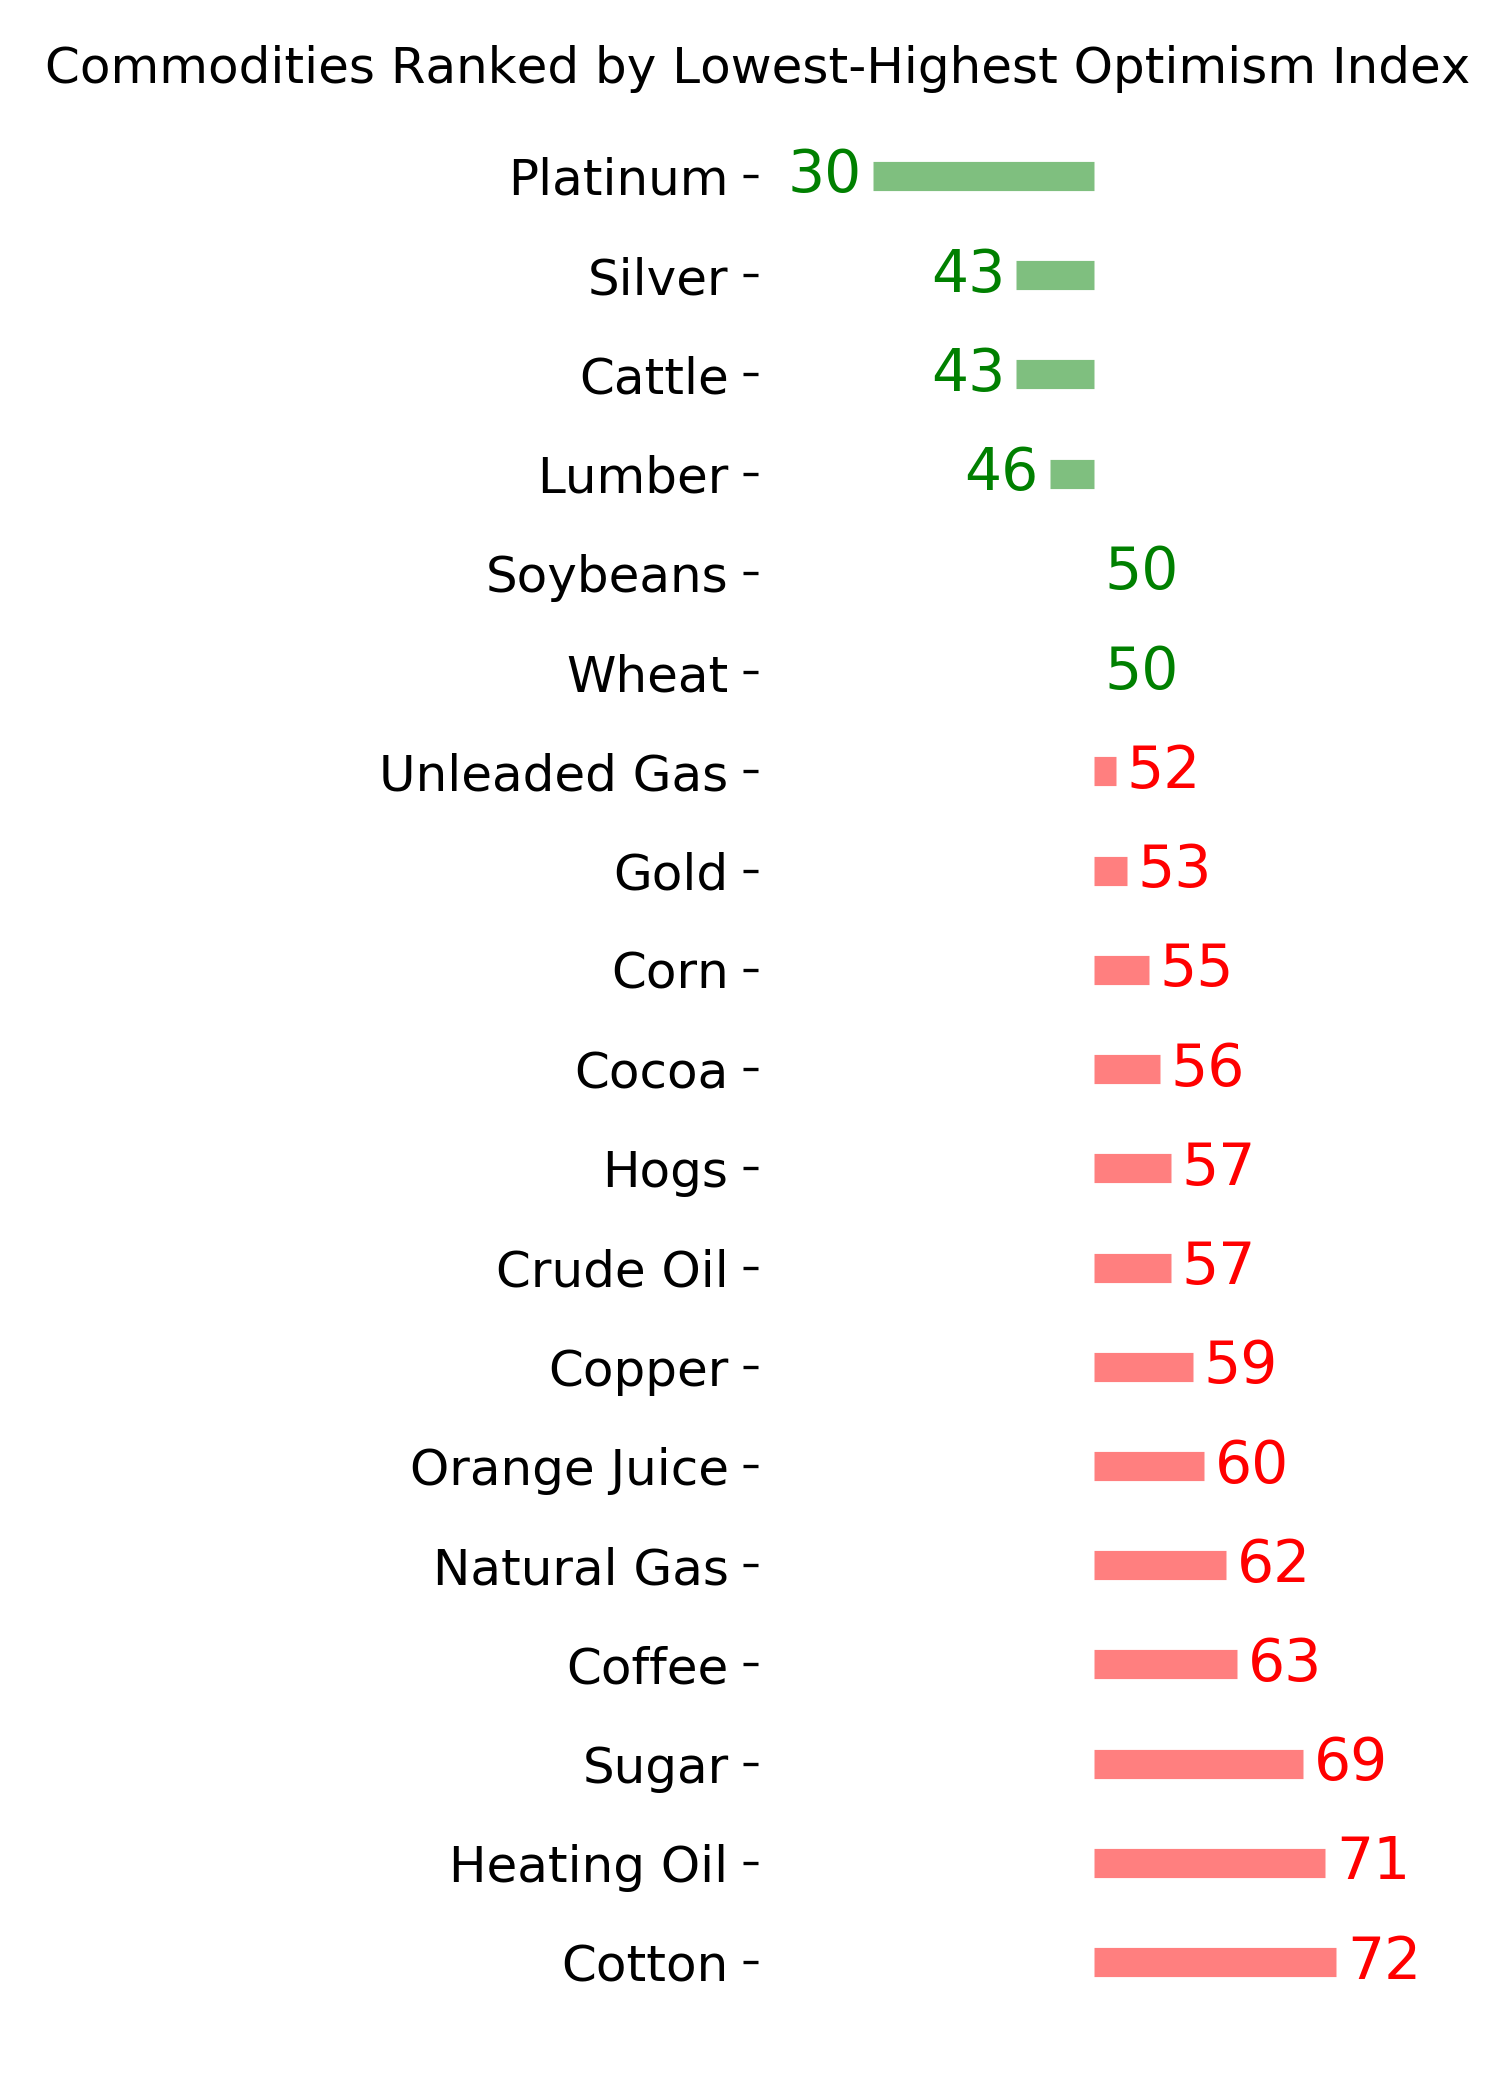
Commodity ETF's - 5-Day Moving Average
|
|