Headlines
|
|
Stocks End Historic Trend of Long Term Positive Trends:
For the first time in more than 200 days, fewer than 75% of stocks in the S&P 500 managed to hold above their 200-day moving averages. That ends the 4th-longest streak of such positive breadth since 1928.
Bottom Line:
STOCKS: Hold
Sentiment continues to decline from the speculative February peak. With deteriorating breadth, this raises the risk of poor short- to medium-term returns until optimism and better breadth returns. See the Outlook & Allocations page for more. BONDS: Hold
Various parts of the market got hit in March, with the lowest Bond Optimism Index we usually see during healthy environments. Bond prices have modest recovered and there is no edge among the data we follow. GOLD: Hold
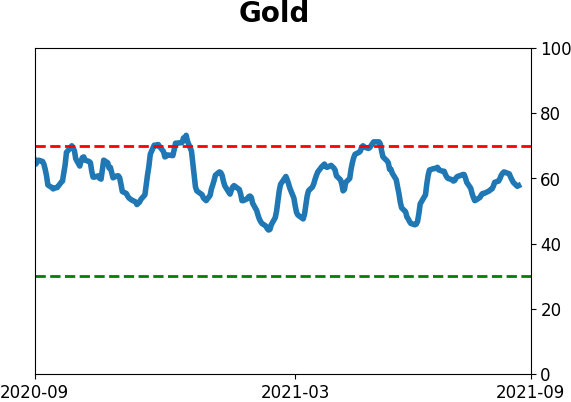
Gold and miners were rejected after trying to recover above their 200-day averages in May. Lately, some medium-term (not long-term) oversold extremes in breadth measures among miners have triggered.
|
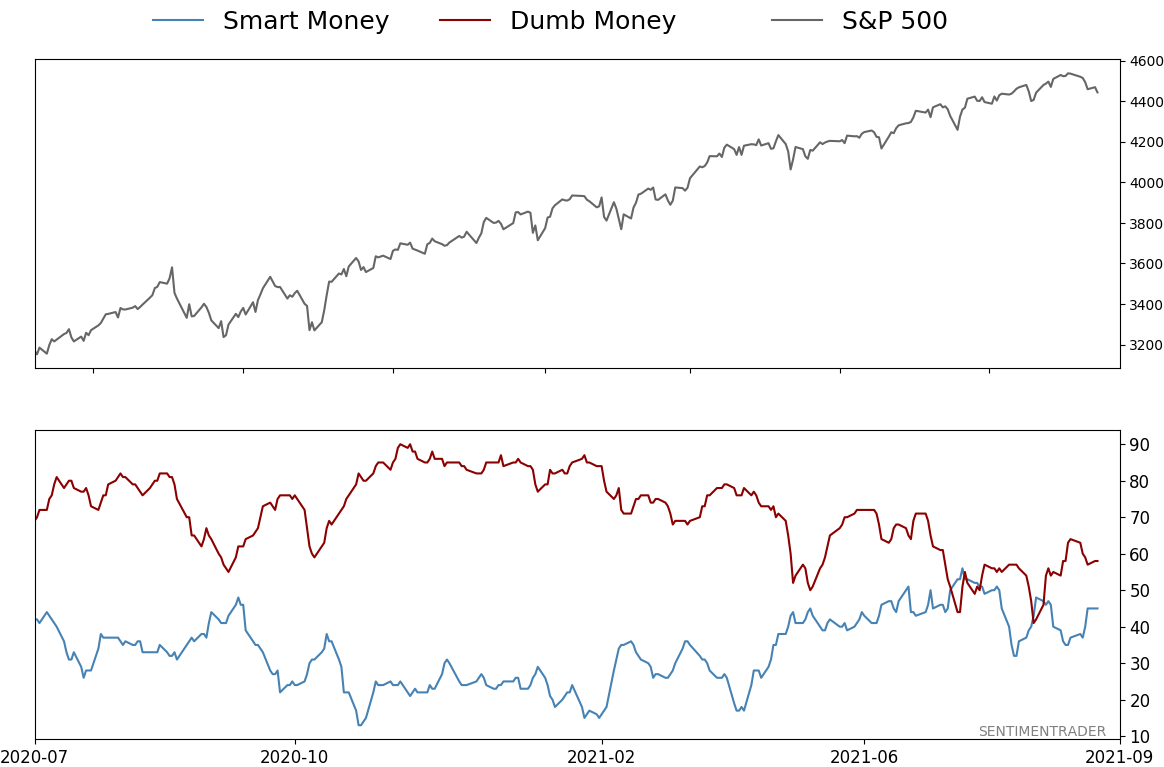
Smart / Dumb Money Confidence
|
Smart Money Confidence: 45%
Dumb Money Confidence: 58%
|
|
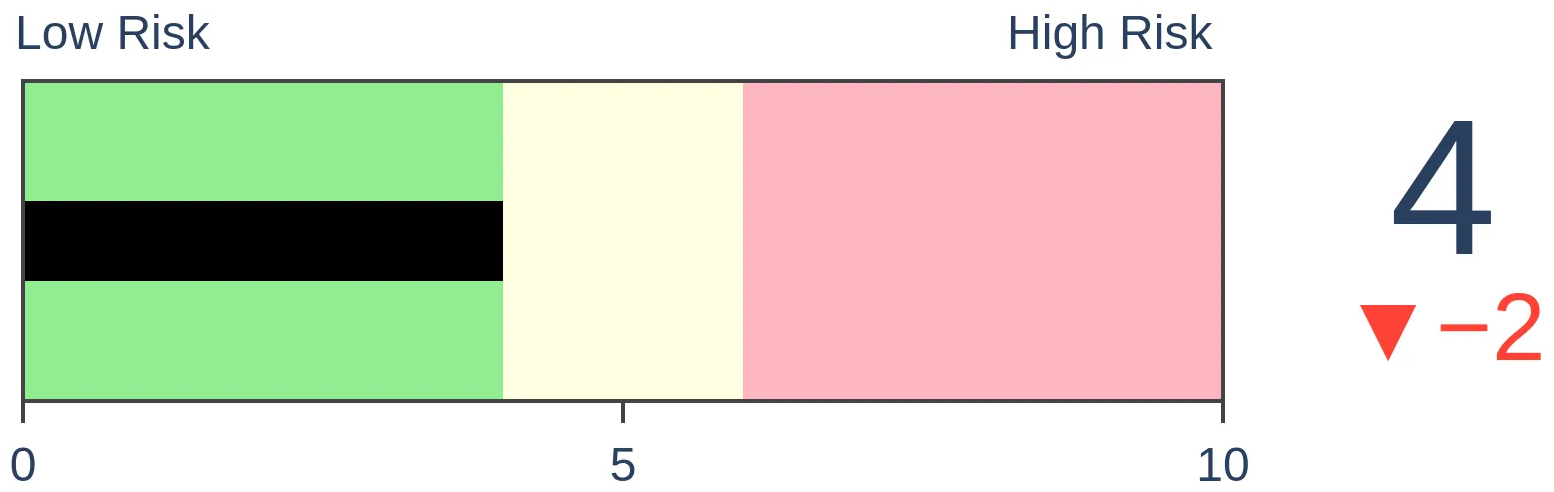
Risk Levels
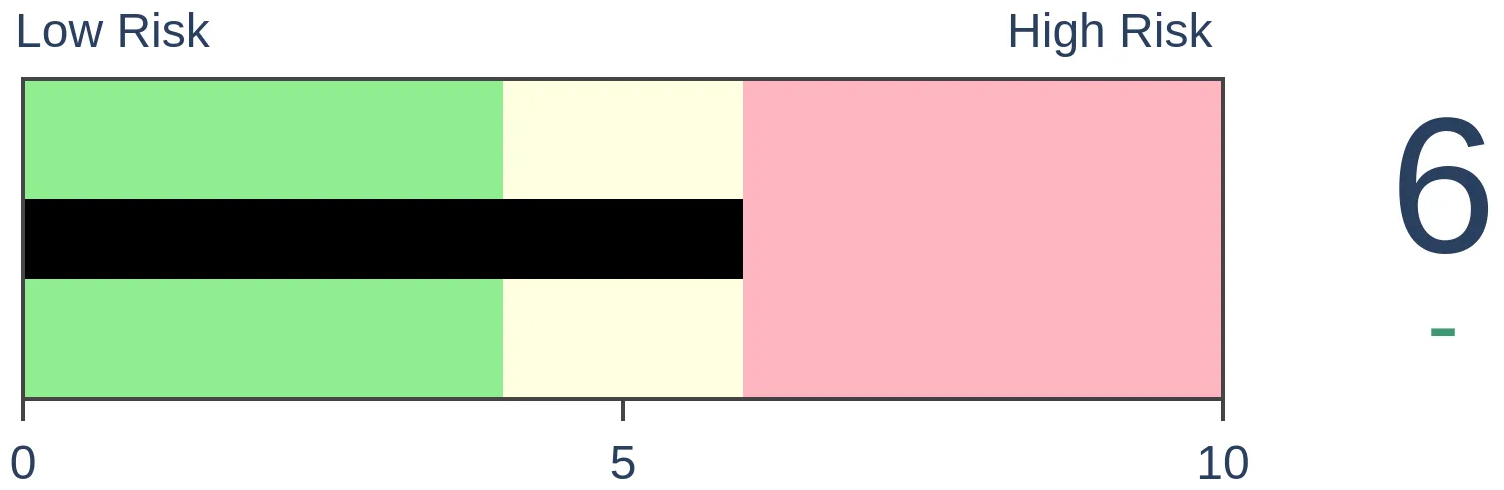
Stocks Short-Term
|
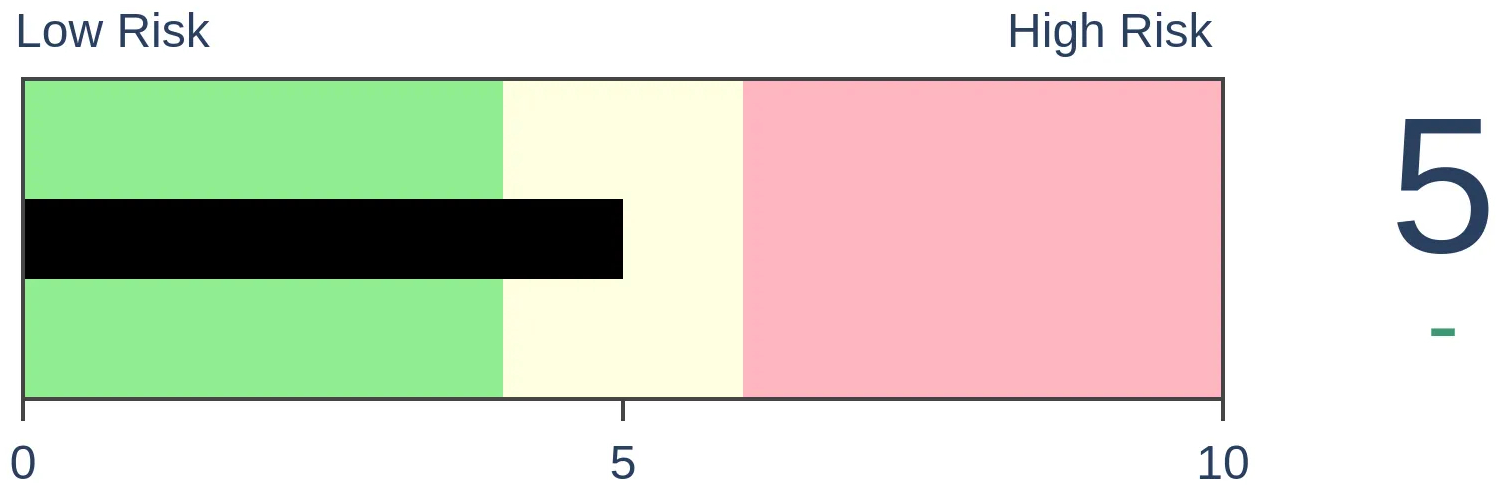
Stocks Medium-Term
|
|
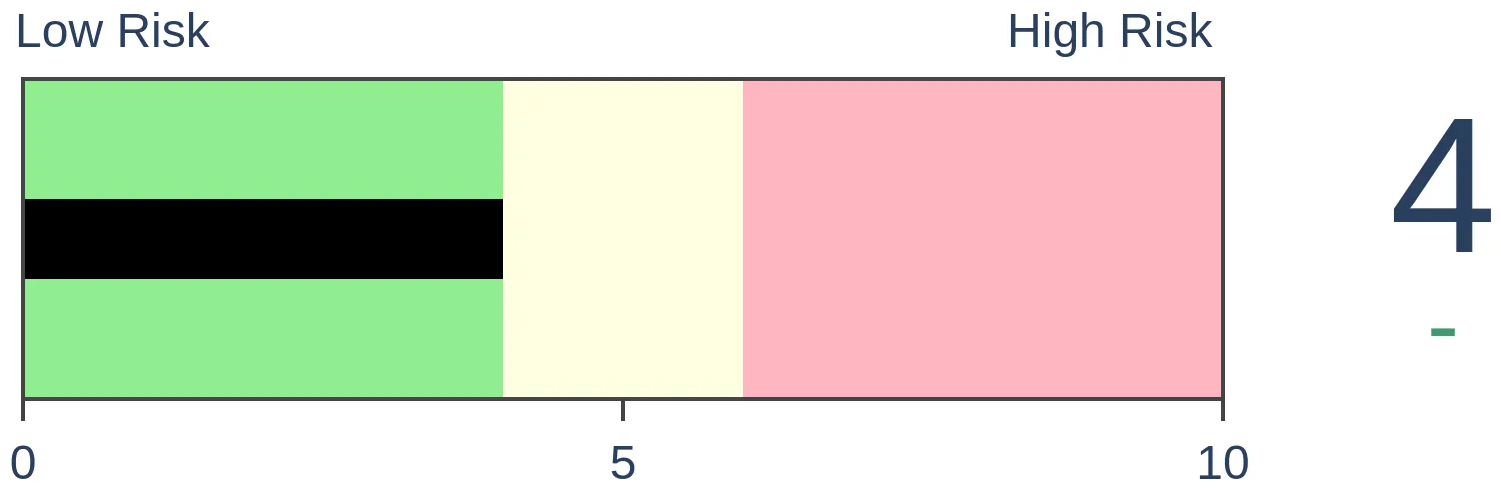
Bonds

|
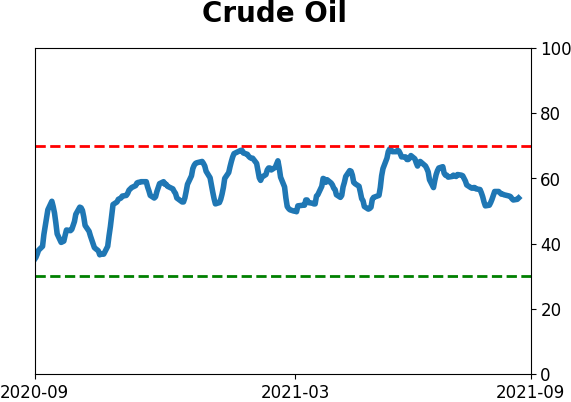
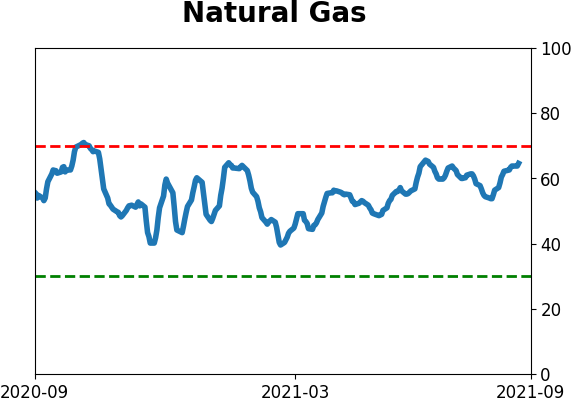
Crude Oil

|
|
Gold
|
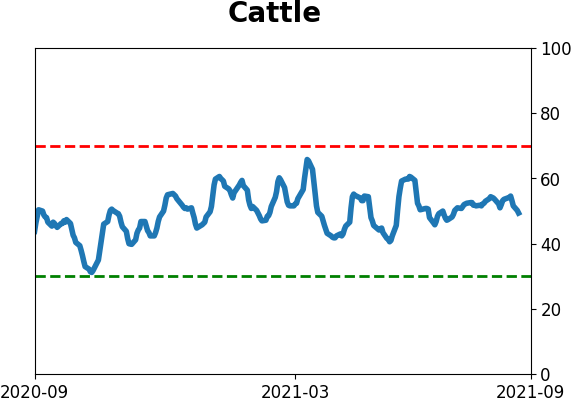
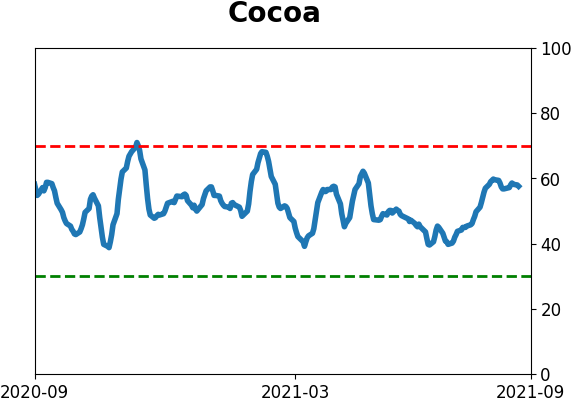
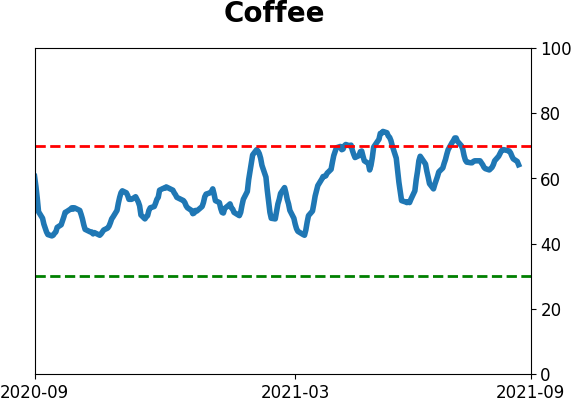
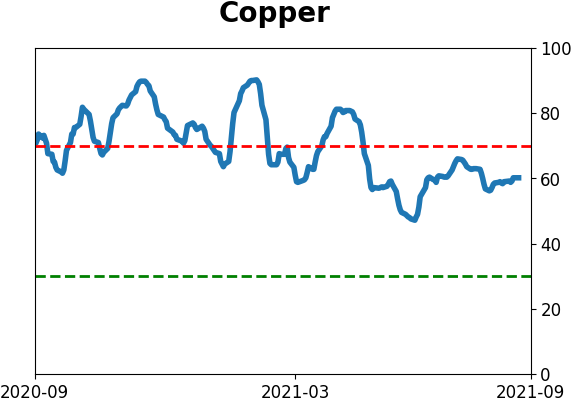
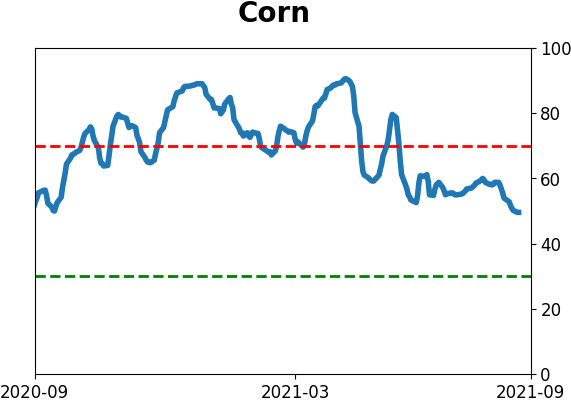
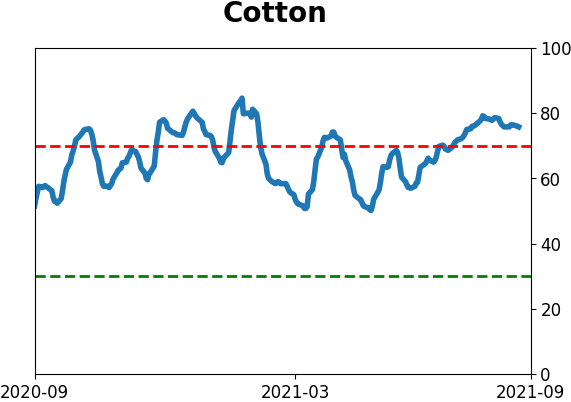
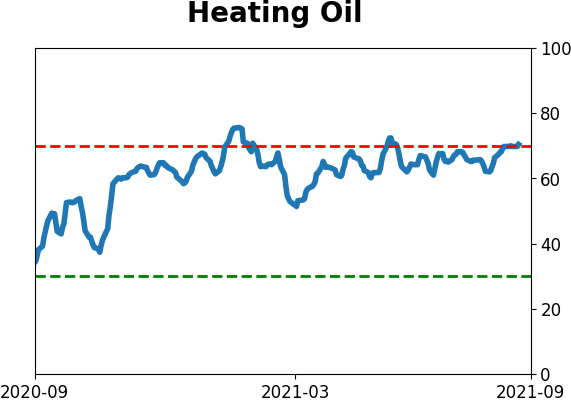
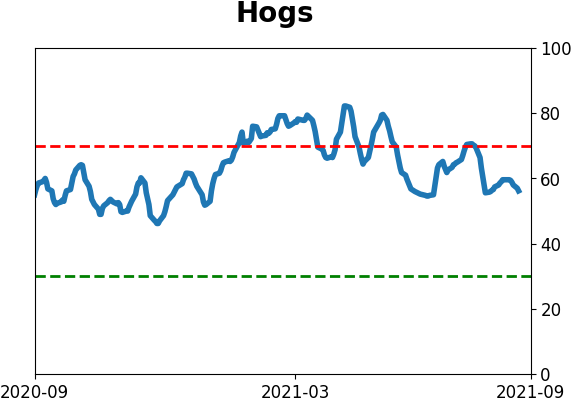
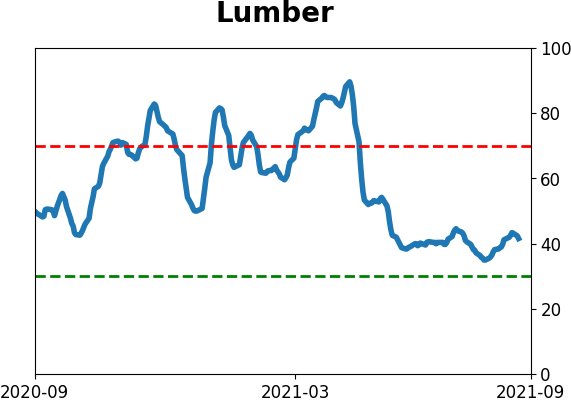
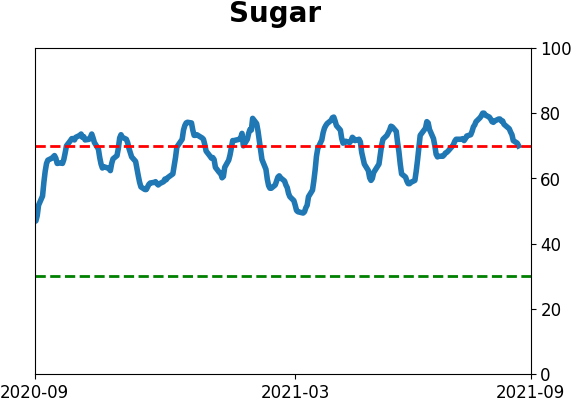
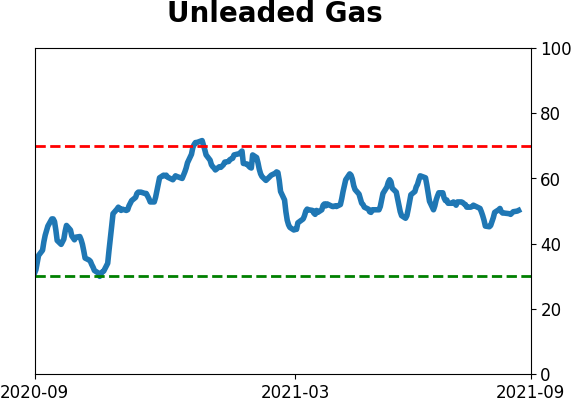
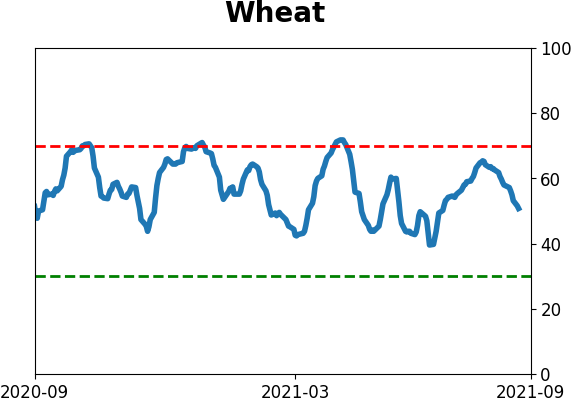
Agriculture
|
|
Research
By Jason Goepfert
BOTTOM LINE
For the first time in more than 200 days, fewer than 75% of stocks in the S&P 500 managed to hold above their 200-day moving averages. That ends the 4th-longest streak of such positive breadth since 1928.
FORECAST / TIMEFRAME
None
|
It was quite a run, but the dip in stocks last week did a bit of damage.
We've seen from multiple perspectives just how much of an outlier 2021 has been in terms of sentiment, breadth, and momentum. At various points since January, momentum ebbed, or negative breadth divergences triggered, then buyers came in immediately.
Yet, at no time did fewer than 75% of S&P stocks close below their long-term averages until the end of last week. For the first time in 10 months, fewer than 3 out of every 4 stocks in the S&P 500 closed above their 200-day moving averages.
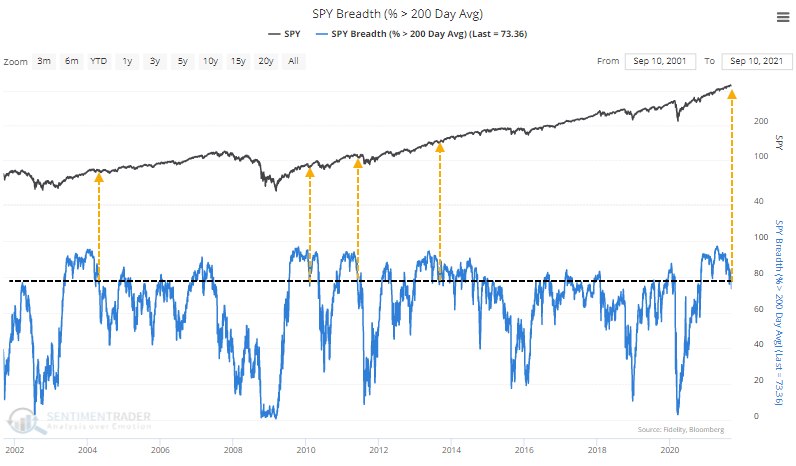
That ends the 4th-longest streak since at least 1928.
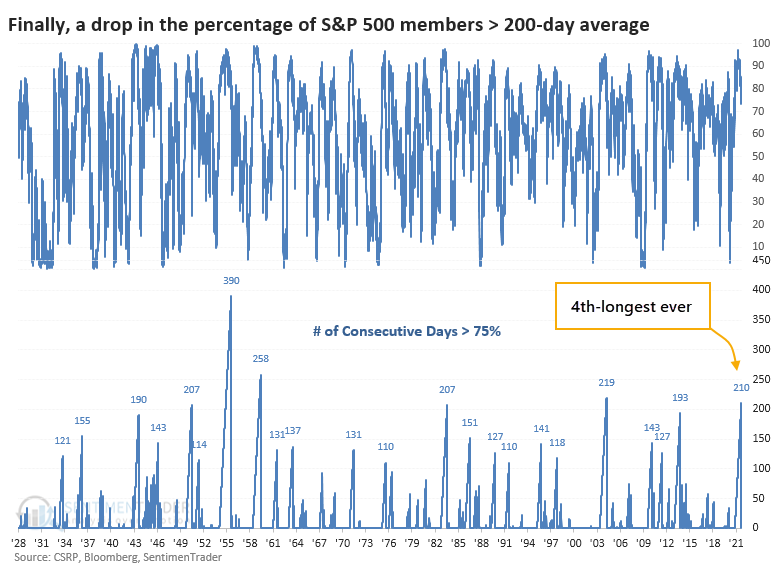
In over 90 years of history, there have only been 5 other streaks of at least 200 consecutive days. Like we see with many momentum types of data, forward returns were good, even after the streaks ended. While it did precede a big dip in 1950, the others saw minimal losses or gains over the following months.
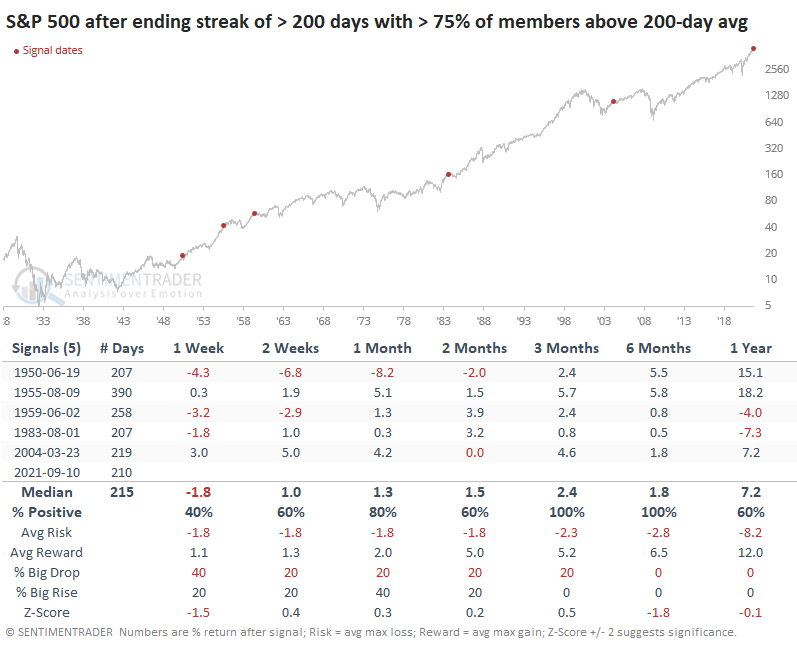
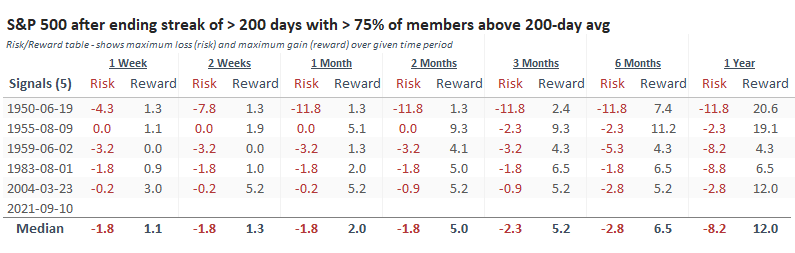
The Risk/Reward Table highlights the positive skew, with 1950 being the clear outlier. About the only negative is that risk exceeded reward over the next 2-4 weeks after three of the five precedents.
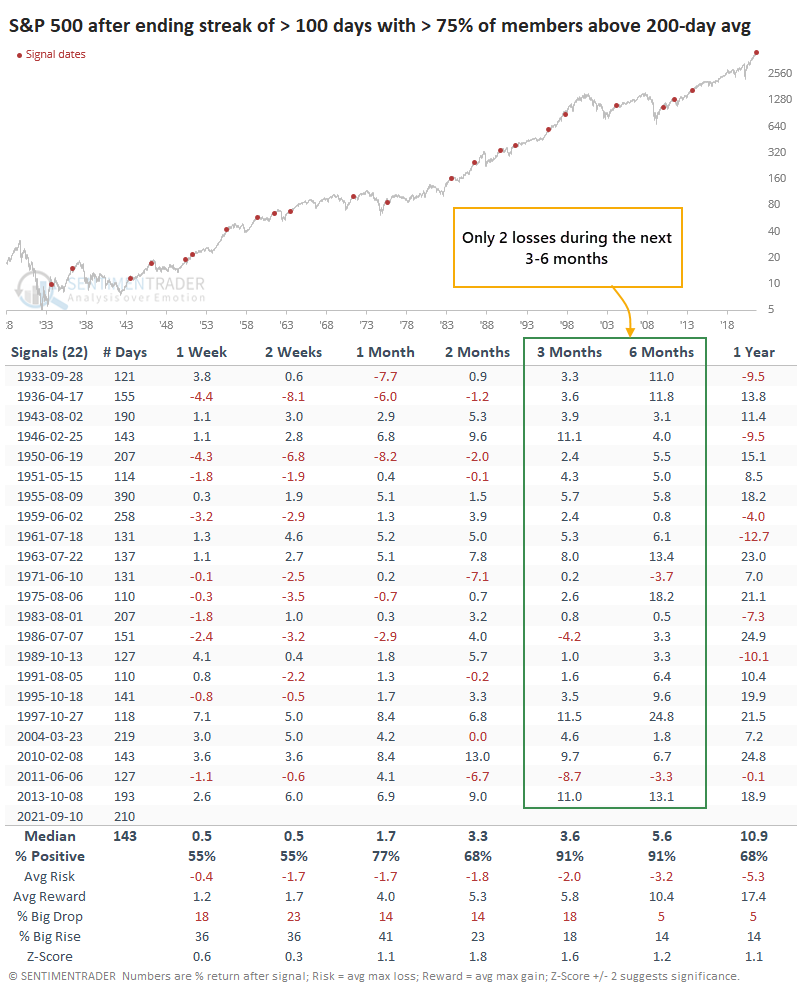
A bigger sample size is usually better, so if we relax the parameters to look for the ends of streaks of at least 100 days, shorter-term returns were mediocre, but medium- to long-term ones were very good. The consistency was impressive, with only 2 losses out of 22 signals over the next 3-6 months.
Impressive momentum has been a feature of this market since the initial thrusts off of the 2020 low. It's hard (impossible) to reconcile it against other worries like deteriorating macro conditions combined with a rising bear market probability. No worries have mattered for nearly a year, so counting on them to matter now is like tilting at windmills.
There are compelling worries out there, and there are some signs of deteriorating momentum. However, the simple fact that it has lasted so long suggests that any declines should be relatively mild and relatively brief. The longer-term worries will have more imminent respect when (or if) we see more, and longer-lasting, deterioration in the stock and corporate bond market.
Active Studies
| Time Frame | Bullish | Bearish | | Short-Term | 0 | 6 | | Medium-Term | 5 | 3 | | Long-Term | 11 | 5 |
|
Indicators at Extremes
Portfolio
| Position | Description | Weight % | Added / Reduced | Date | | Stocks | RSP | 4.1 | Added 4.1% | 2021-05-19 | | Bonds | 23.9% BND, 6.9% SCHP | 30.7 | Reduced 7.1% | 2021-05-19 | | Commodities | GCC | 2.6 | Reduced 2.1%
| 2020-09-04 | | Precious Metals | GDX | 5.6 | Reduced 4.2% | 2021-05-19 | | Special Situations | 4.3% XLE, 2.2% PSCE | 7.6 | Reduced 5.6% | 2021-04-22 | | Cash | | 49.4 | | |
|
Updates (Changes made today are underlined)
Much of our momentum and trend work has remained positive for several months, with some scattered exceptions. Almost all sentiment-related work has shown a poor risk/reward ratio for stocks, especially as speculation drove to record highs in exuberance in February. Much of that has worn off, and most of our models are back toward neutral levels. There isn't much to be excited about here. The same goes for bonds and even gold. Gold has been performing well lately and is back above long-term trend lines. The issue is that it has a poor record of holding onto gains when attempting a long-term trend change like this, so we'll take a wait-and-see approach. RETURN YTD: 8.7% 2020: 8.1%, 2019: 12.6%, 2018: 0.6%, 2017: 3.8%, 2016: 17.1%, 2015: 9.2%, 2014: 14.5%, 2013: 2.2%, 2012: 10.8%, 2011: 16.5%, 2010: 15.3%, 2009: 23.9%, 2008: 16.2%, 2007: 7.8%
|
|
Phase Table
Ranks
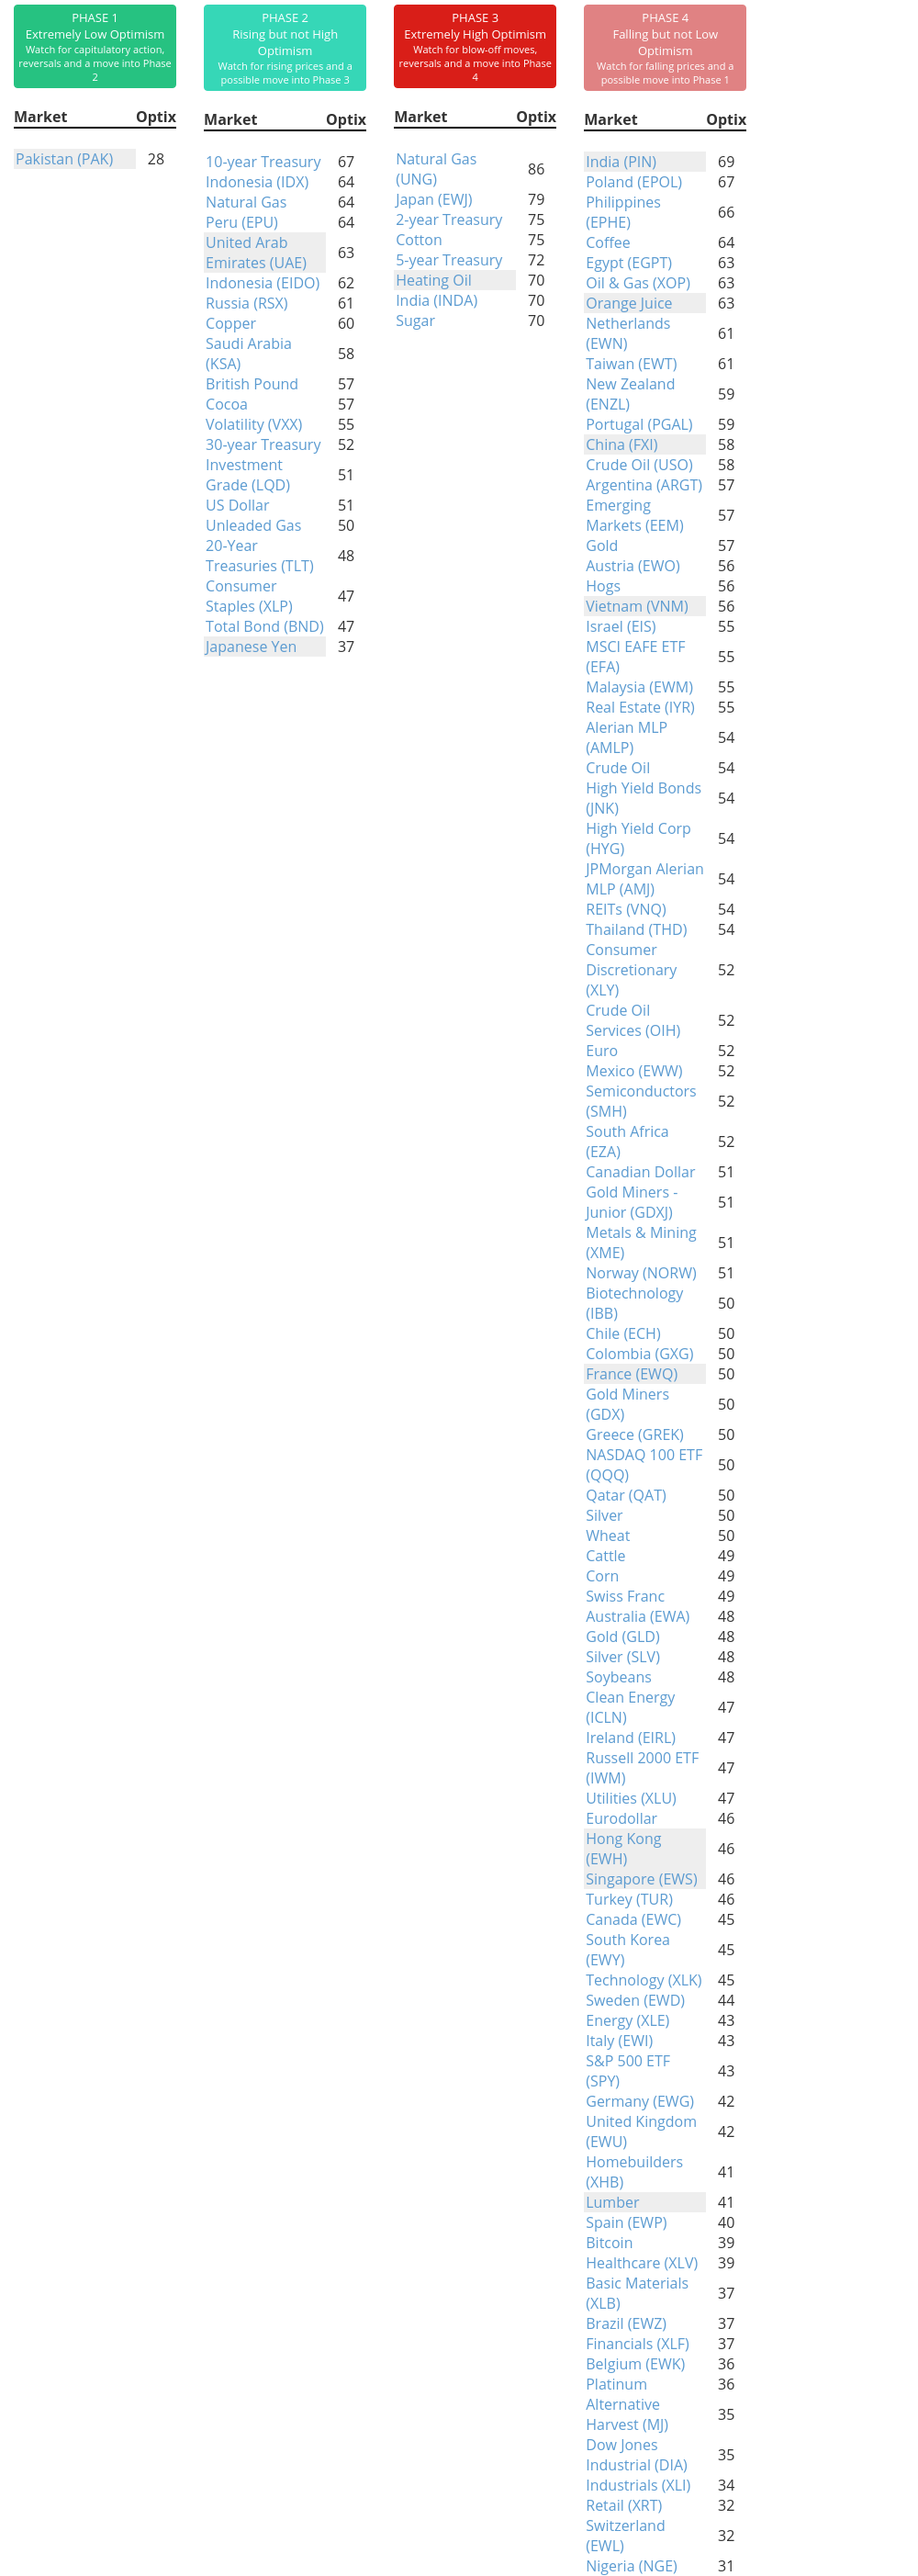
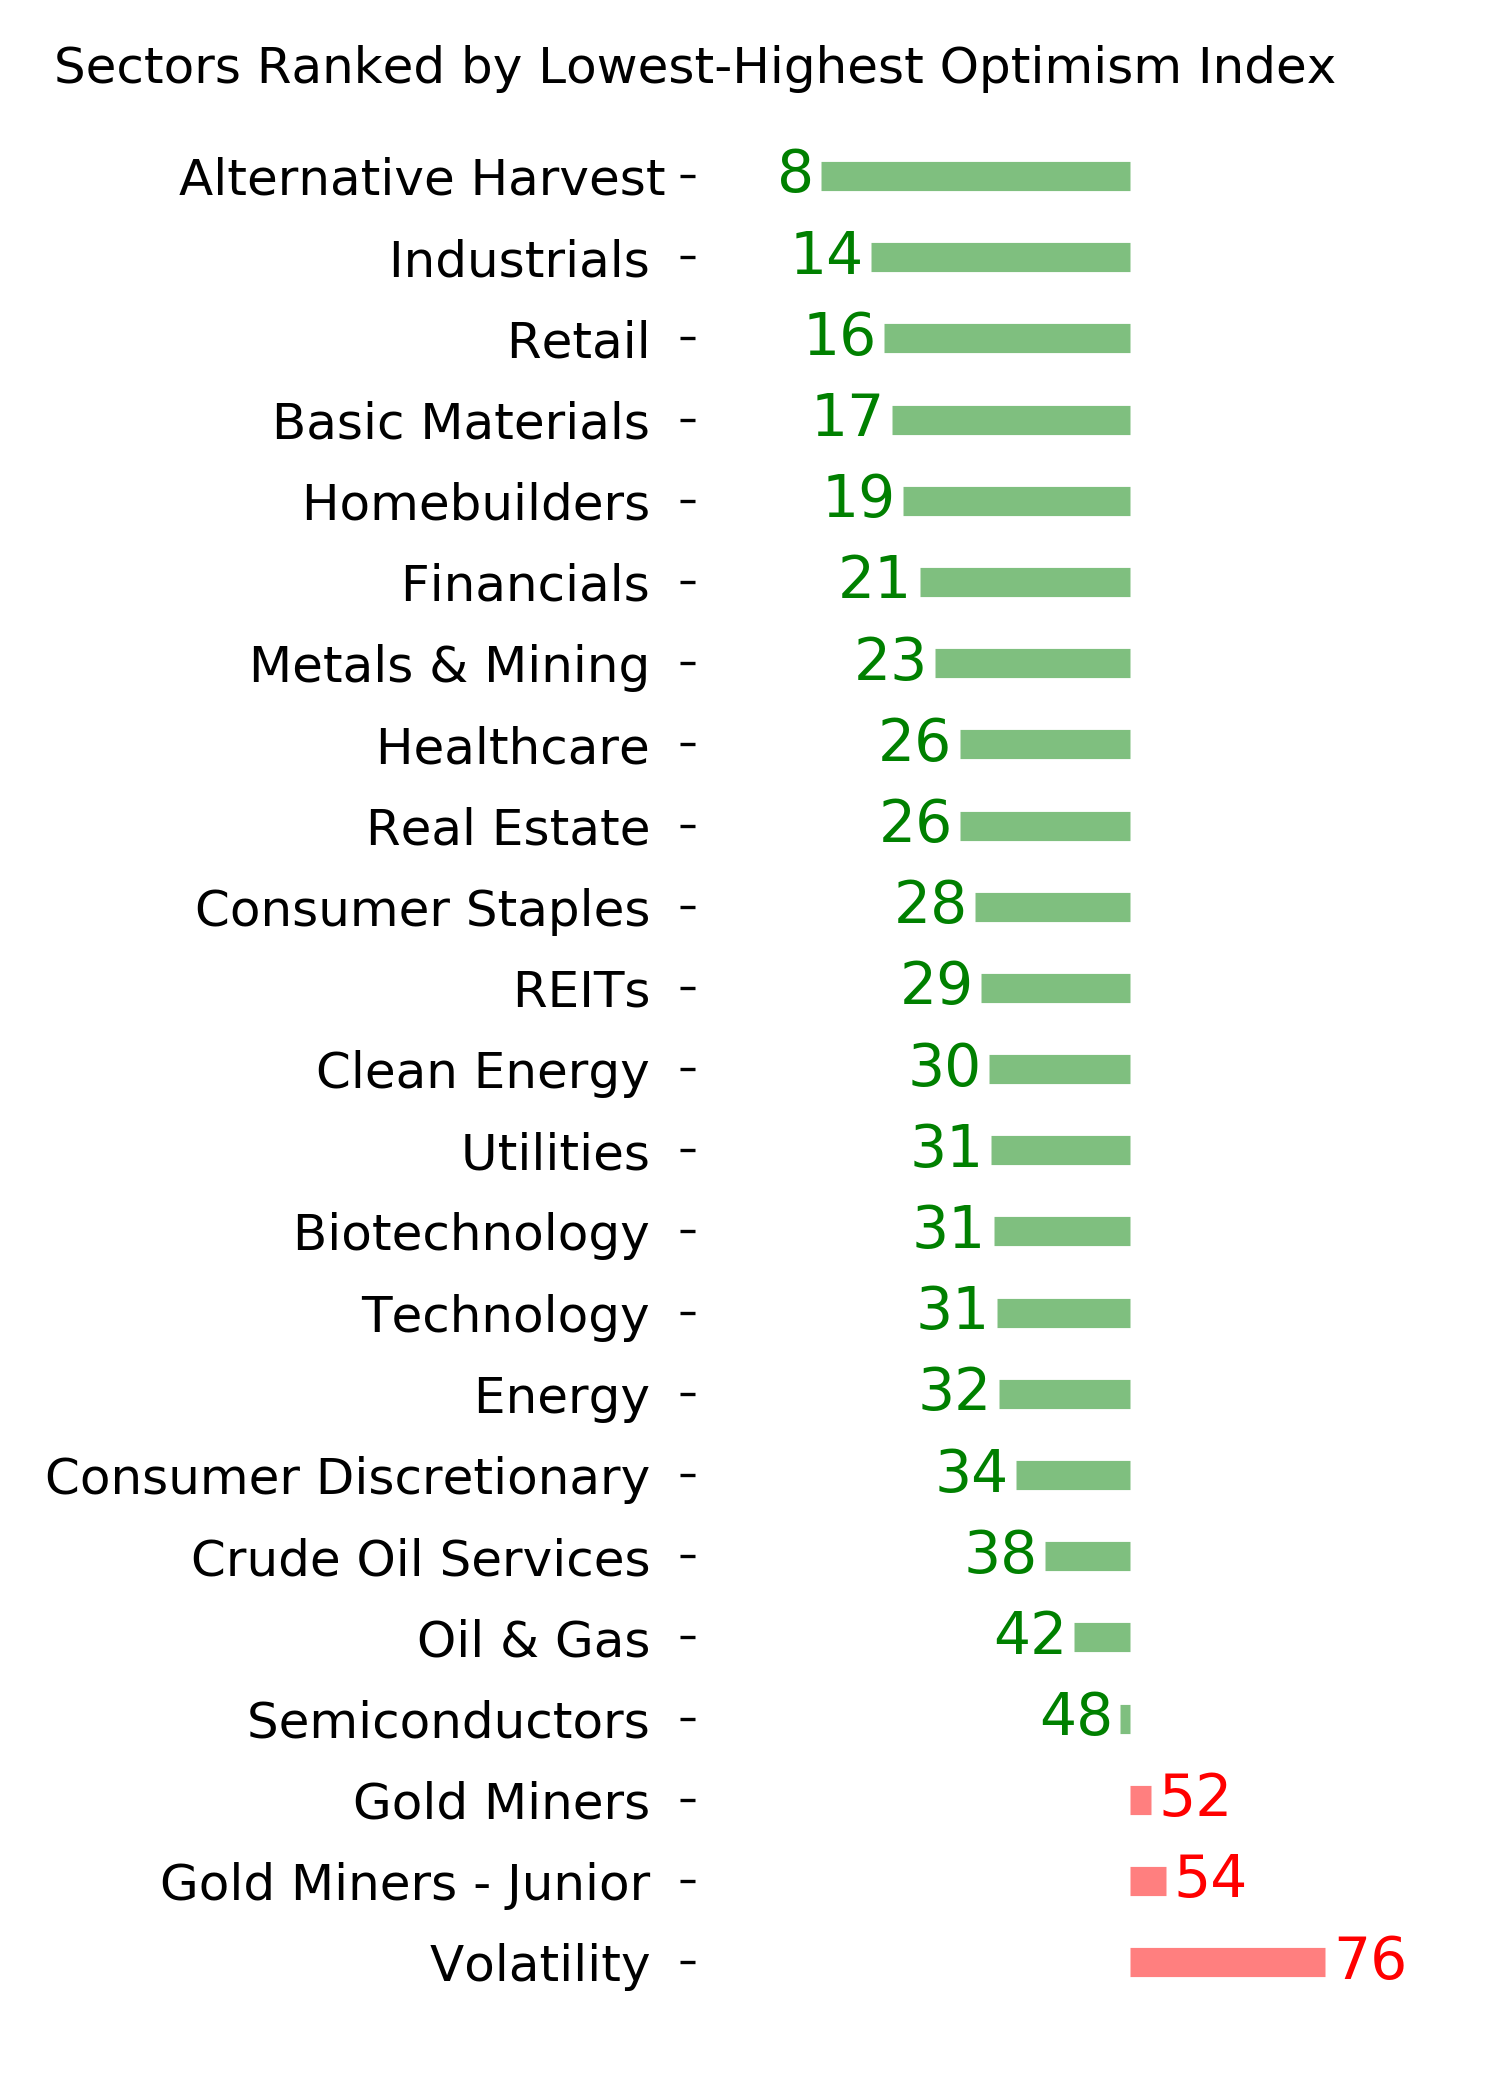
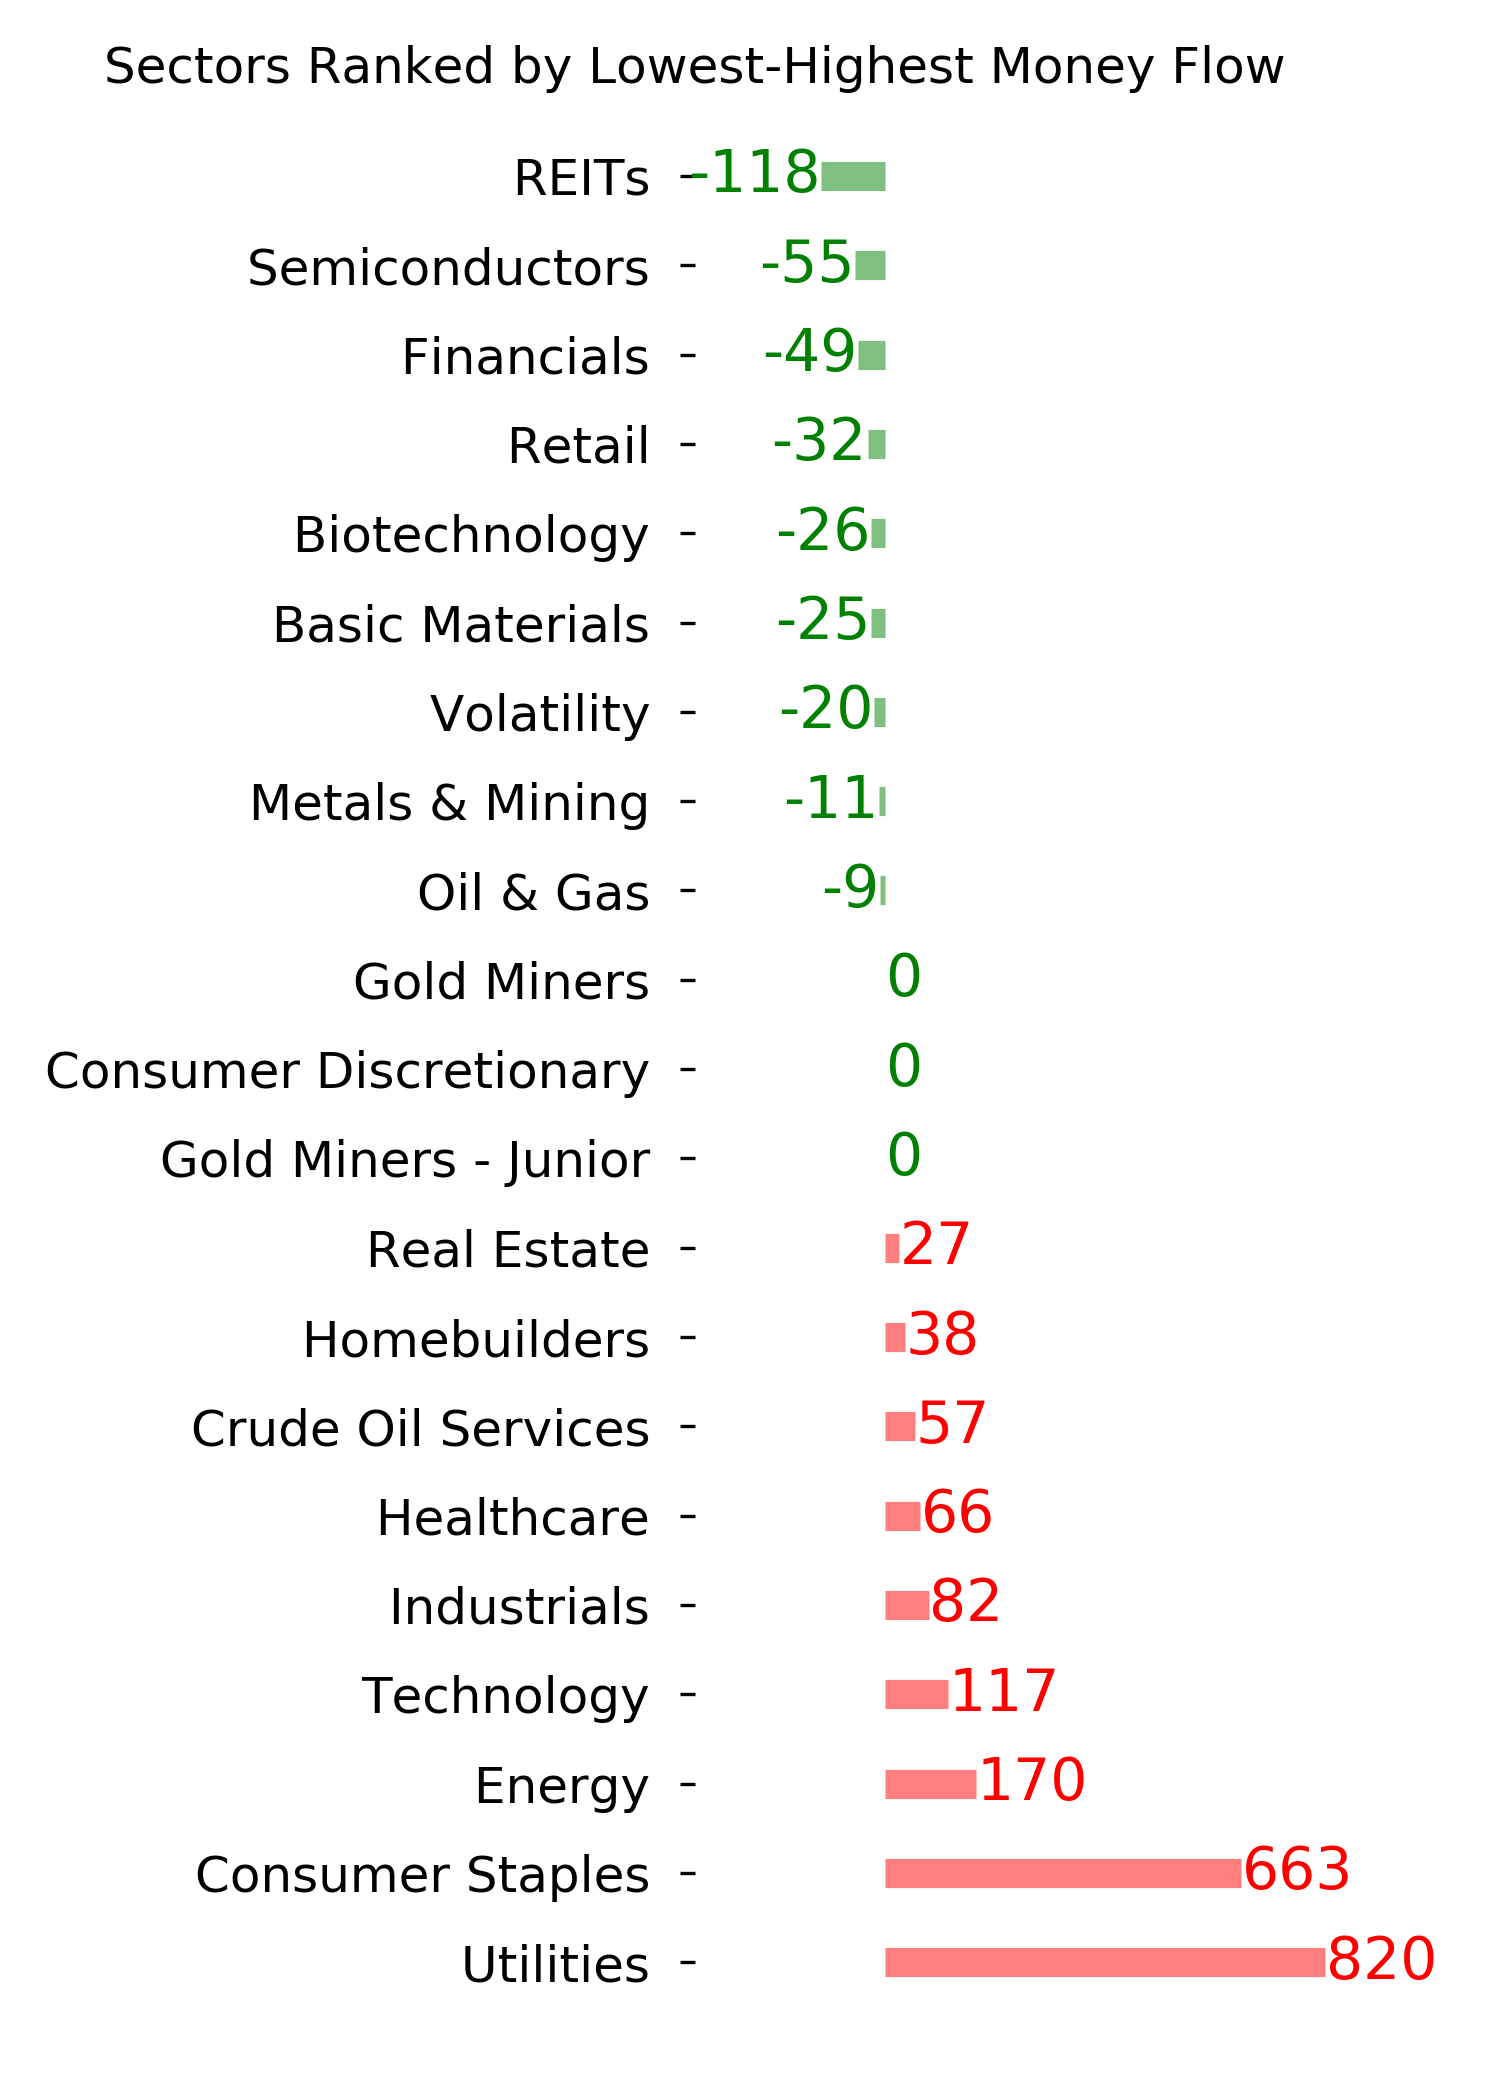
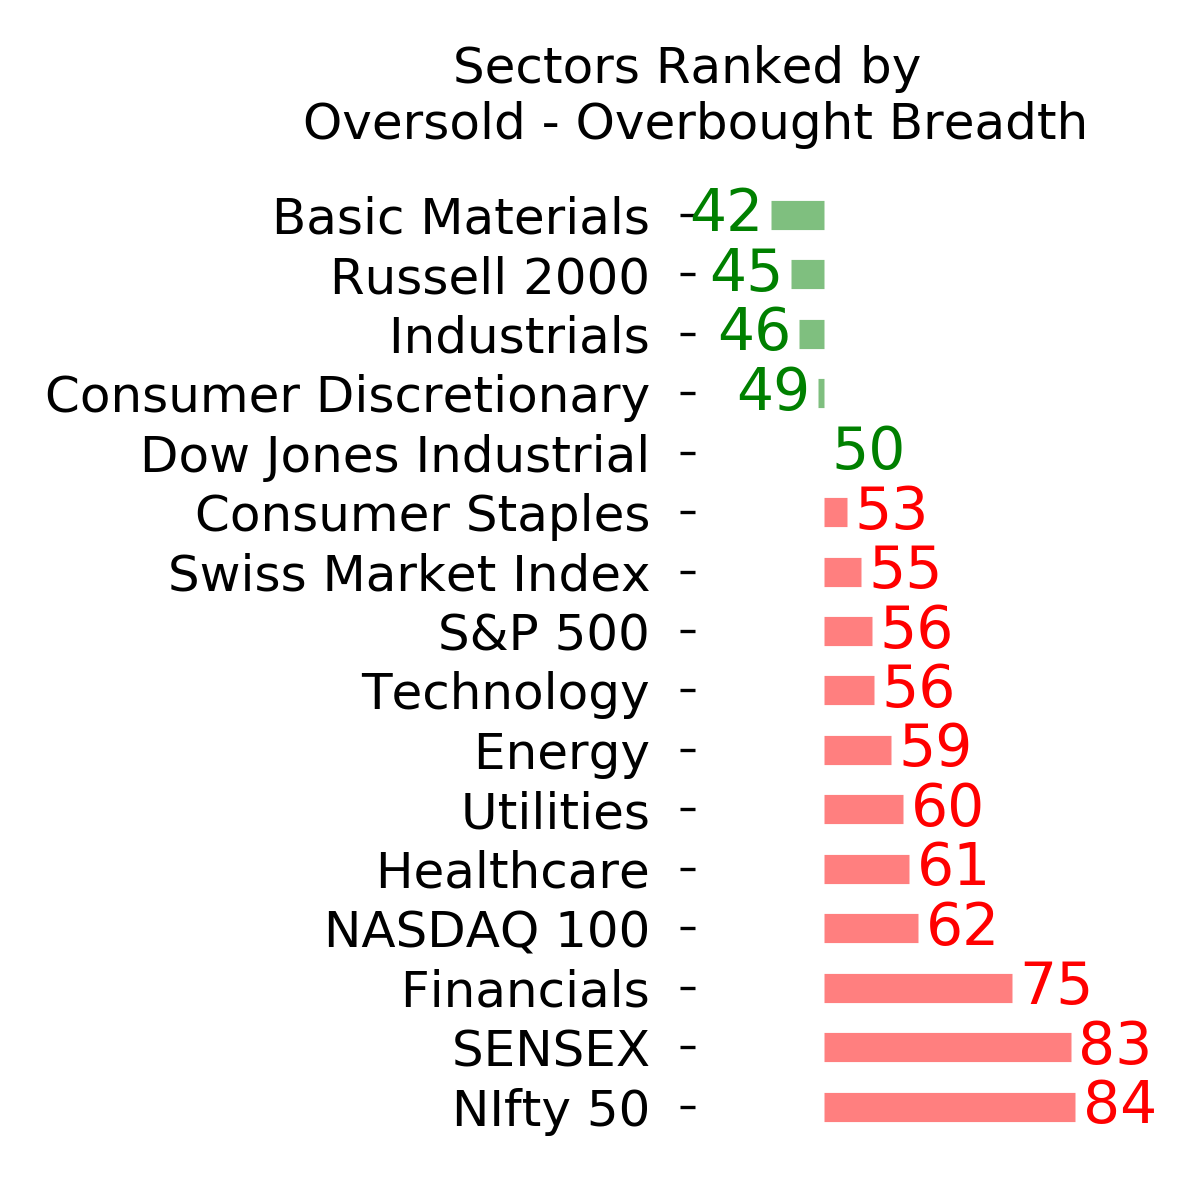
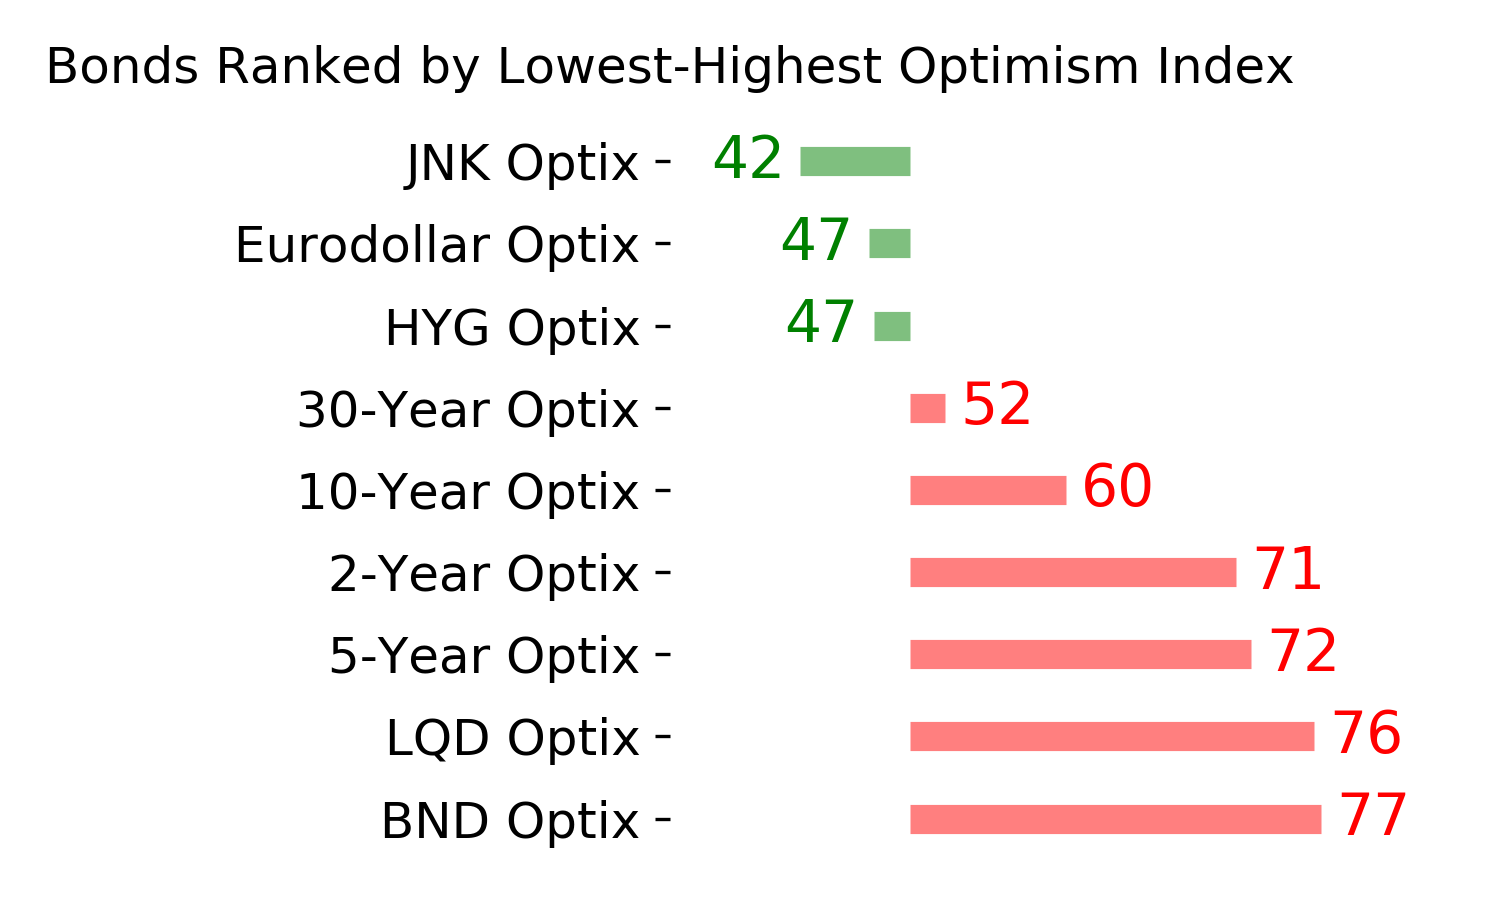
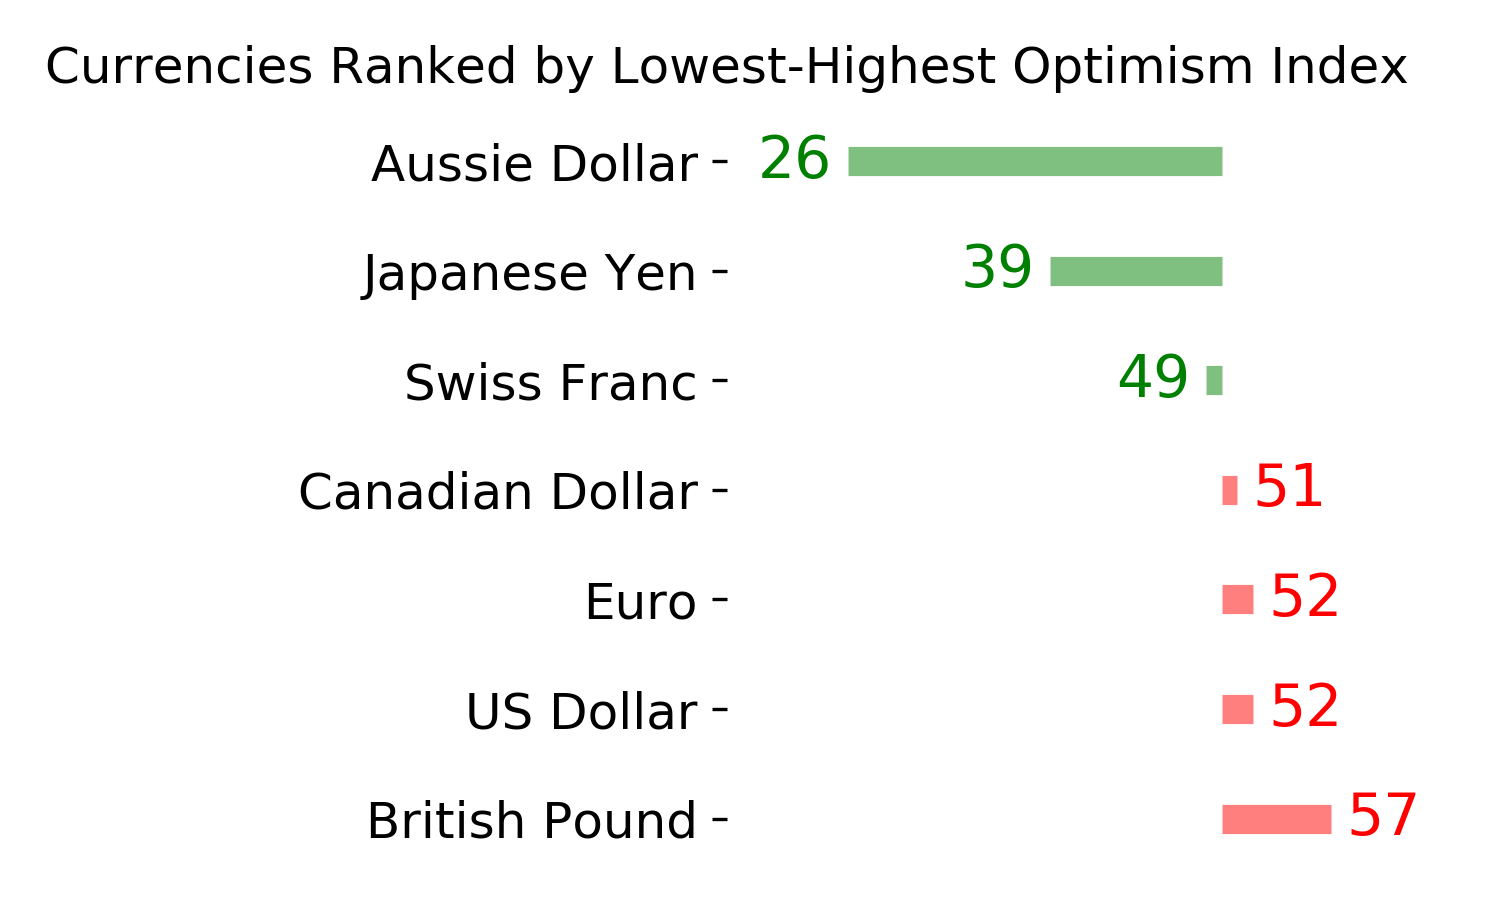
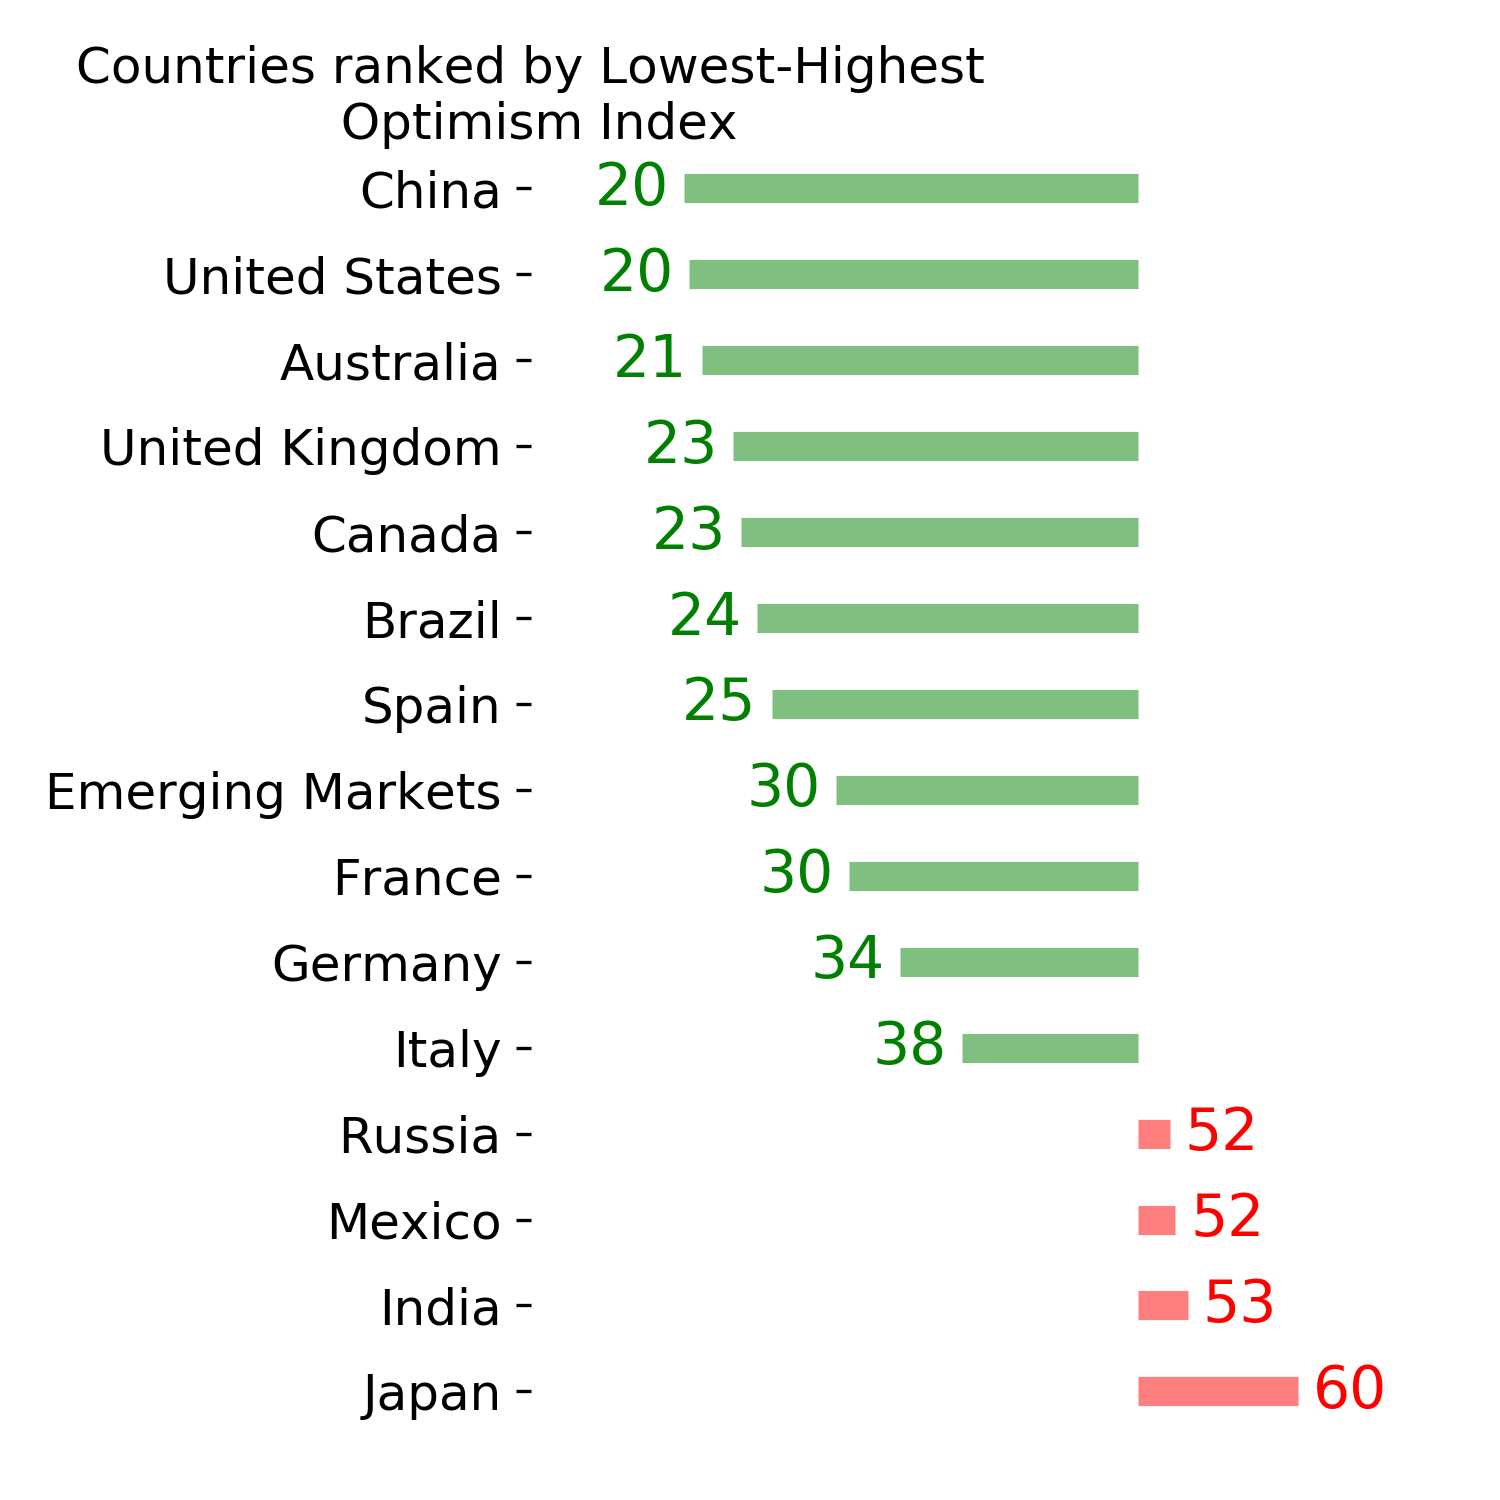
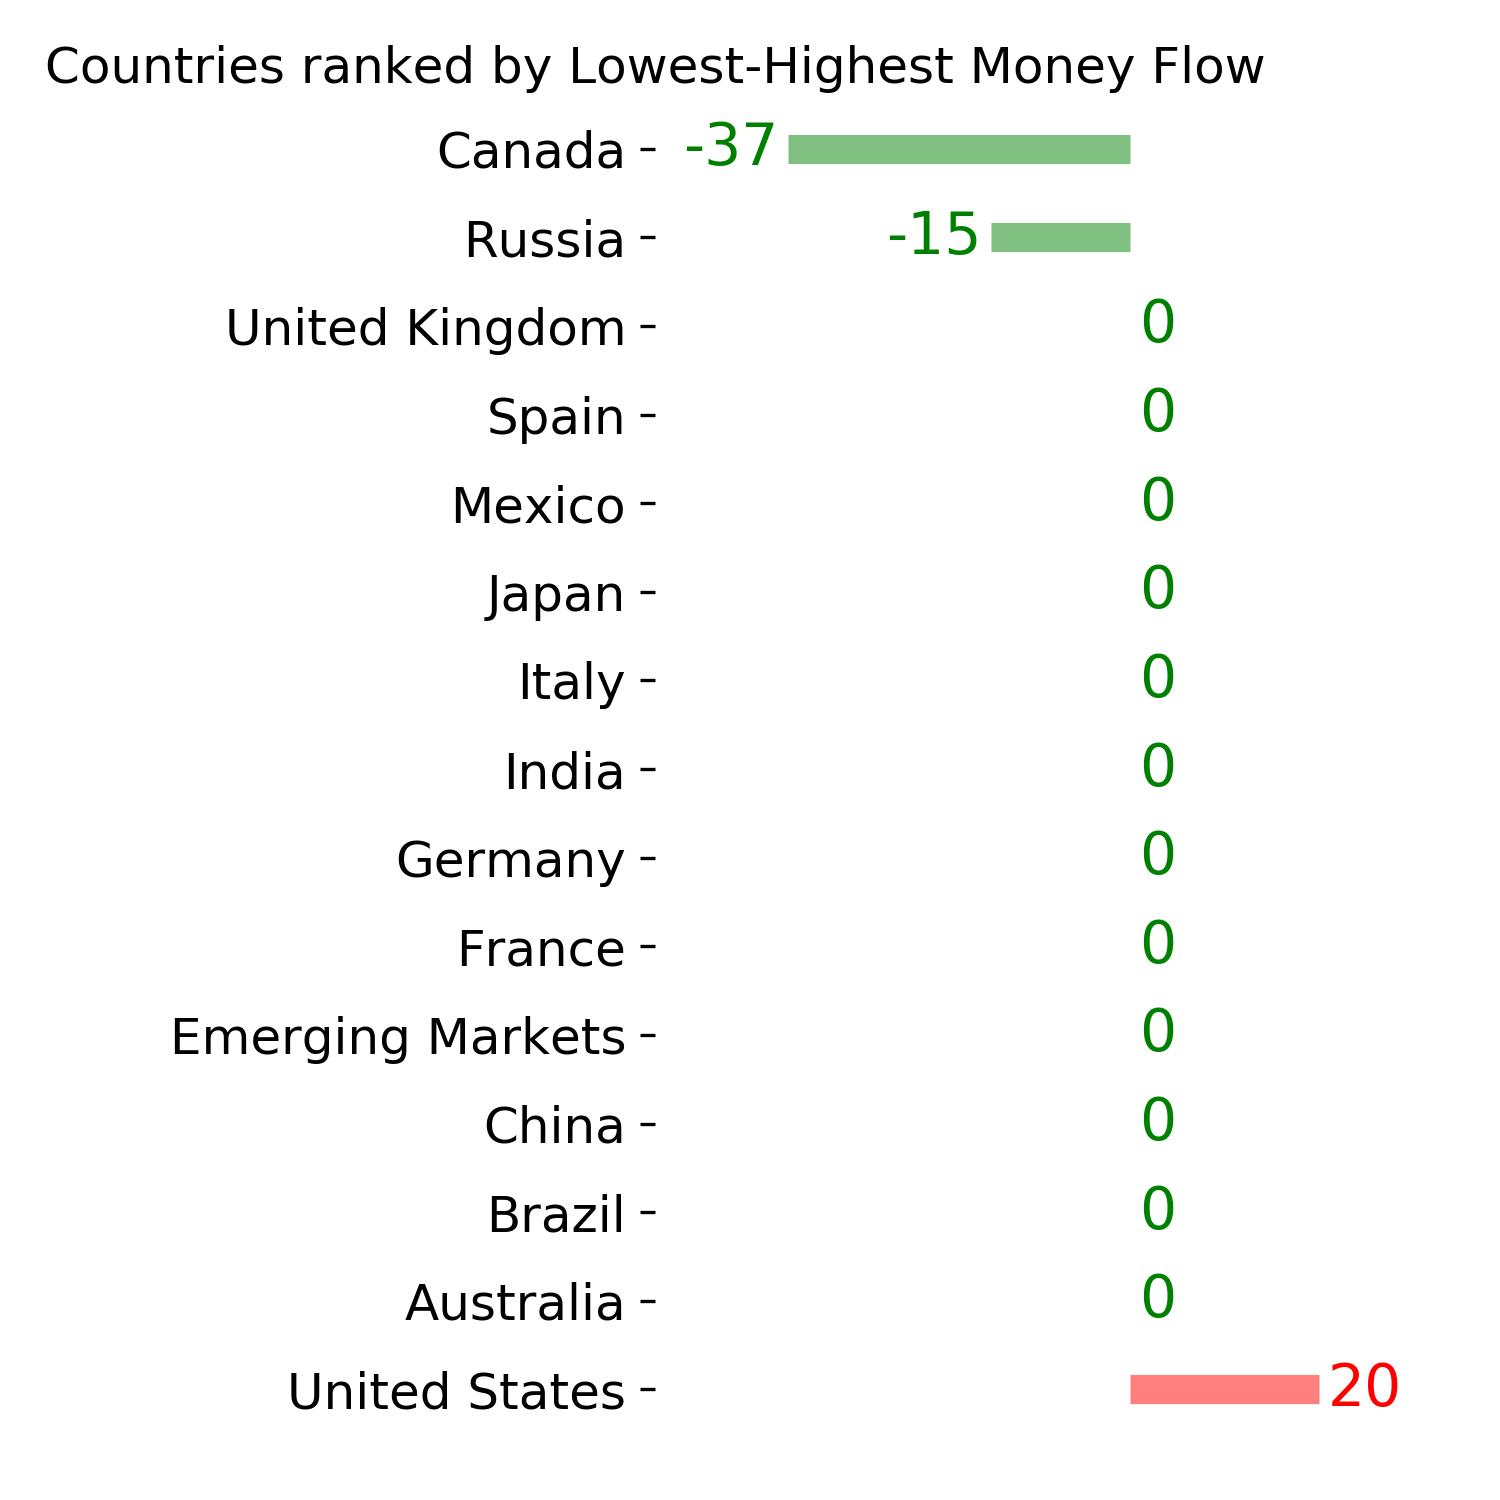
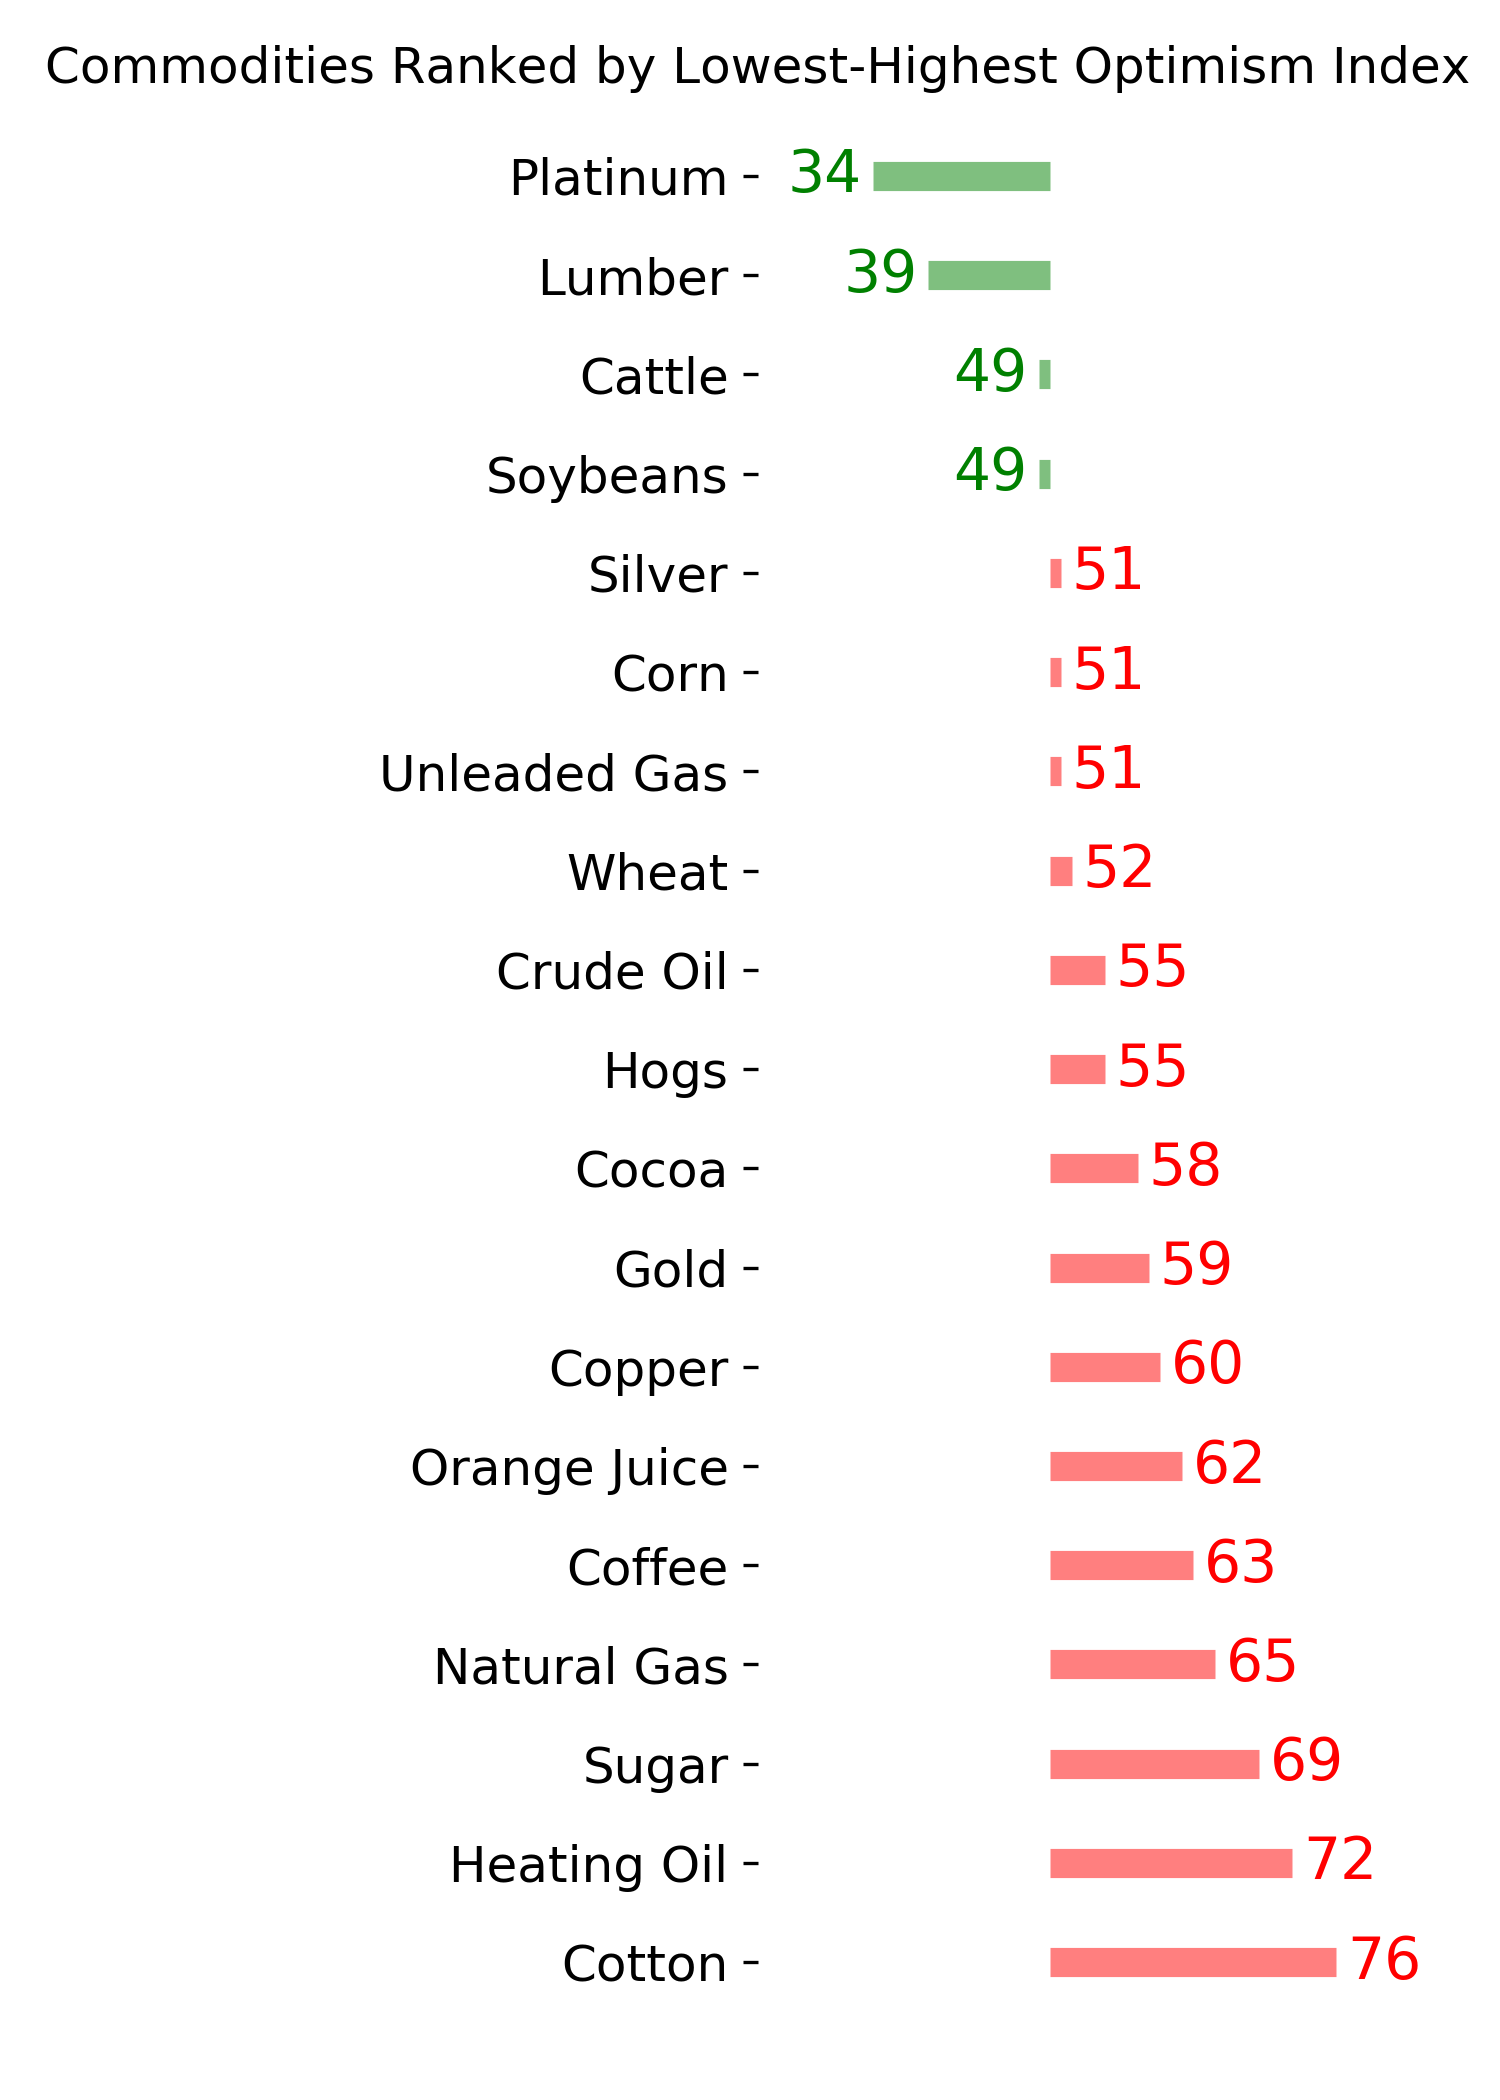
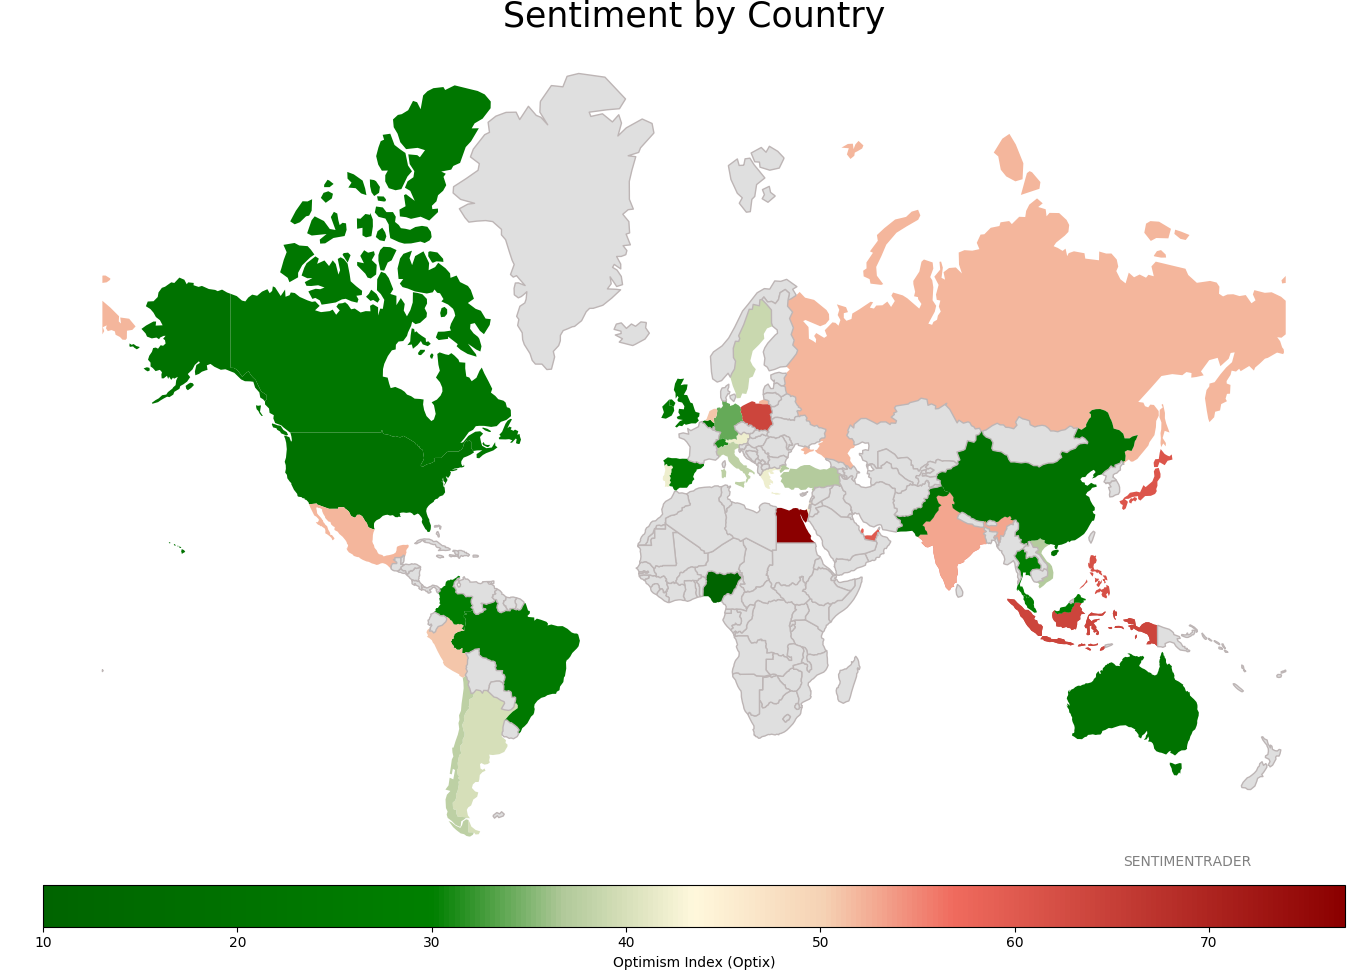
Sentiment Around The World
Optimism Index Thumbnails
|
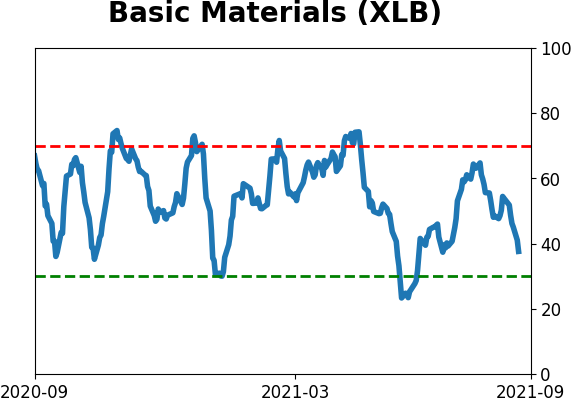
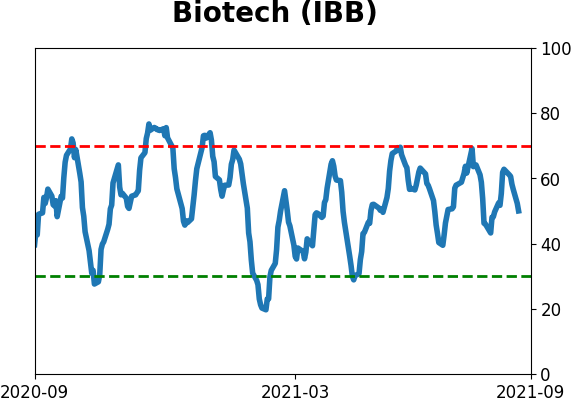
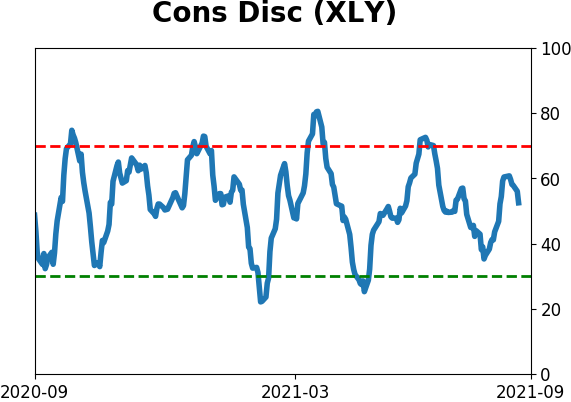
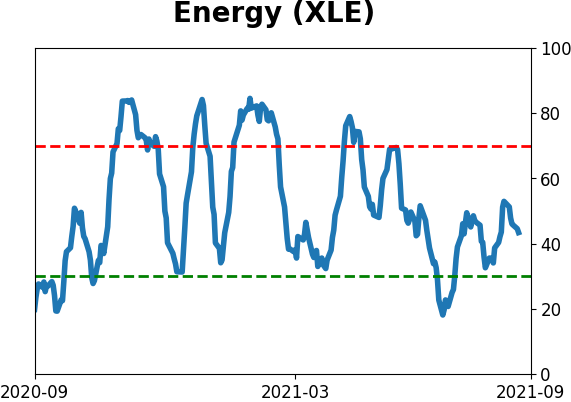
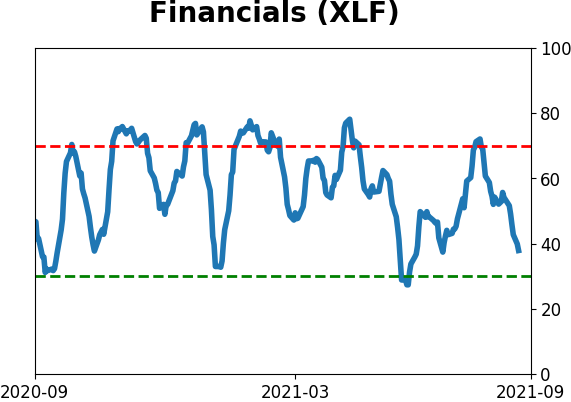
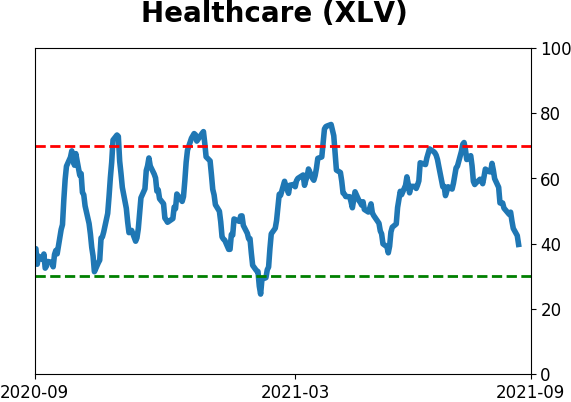
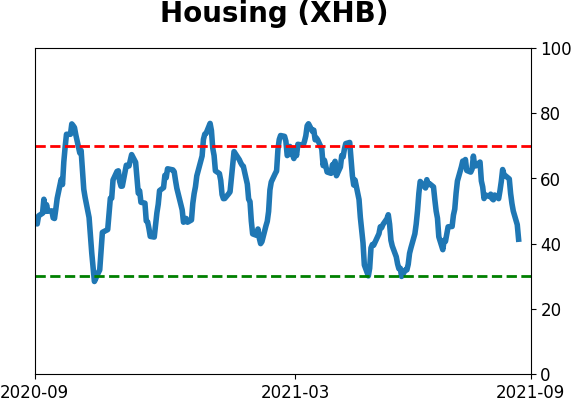
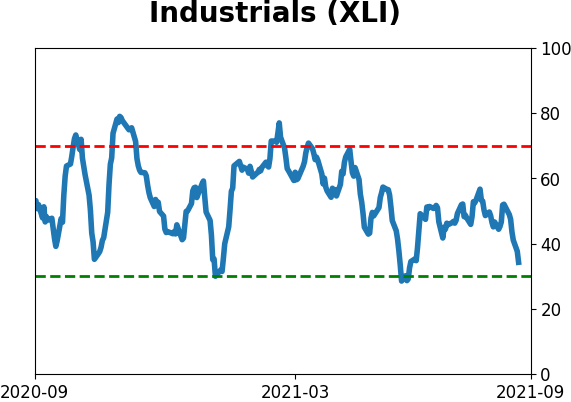
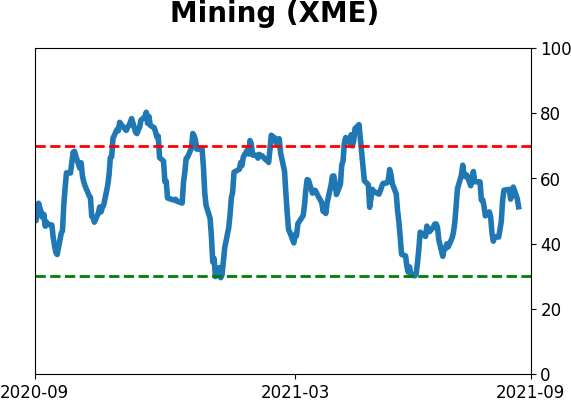
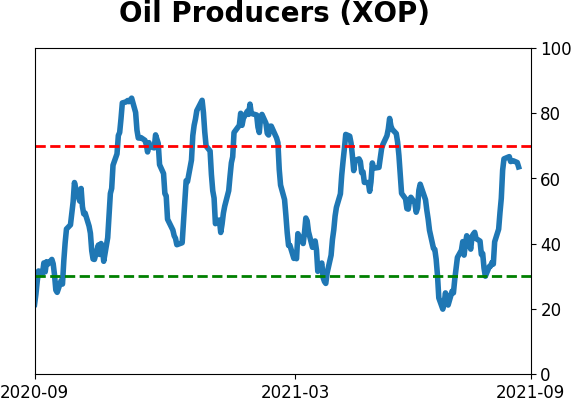
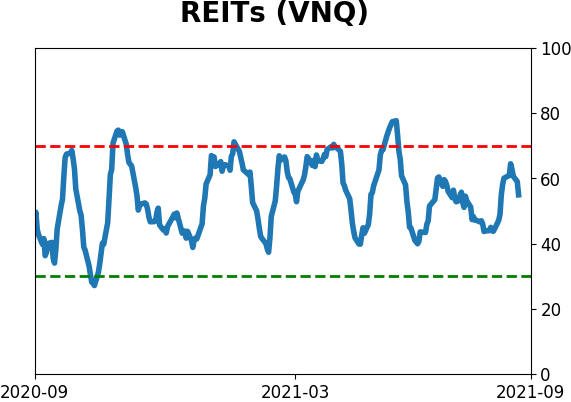
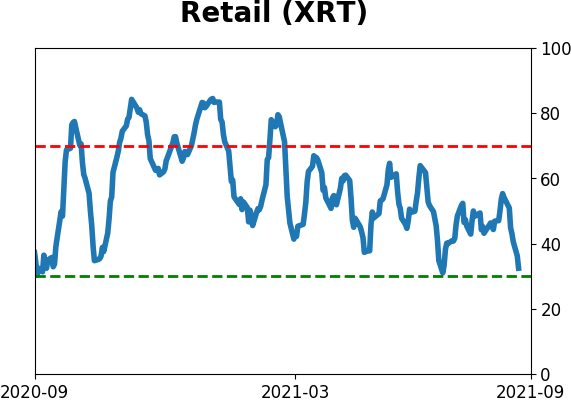
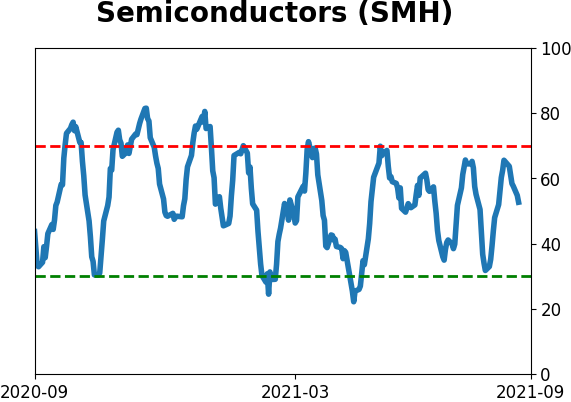
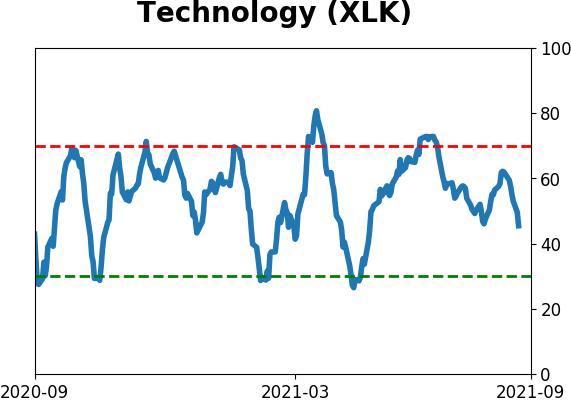
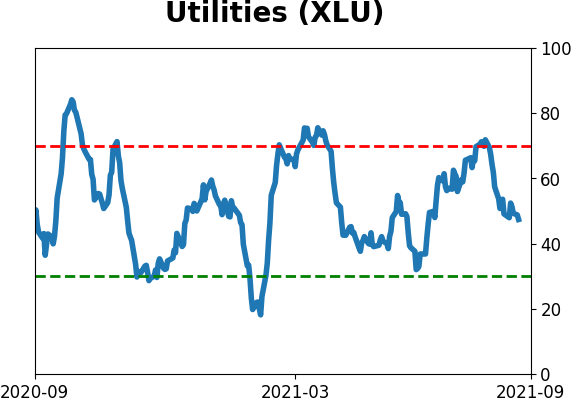
Sector ETF's - 10-Day Moving Average
|
|
|
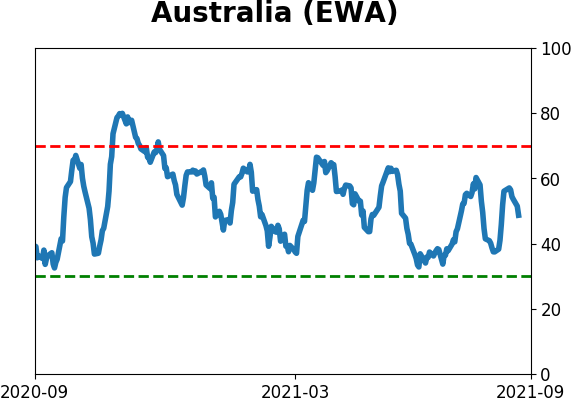
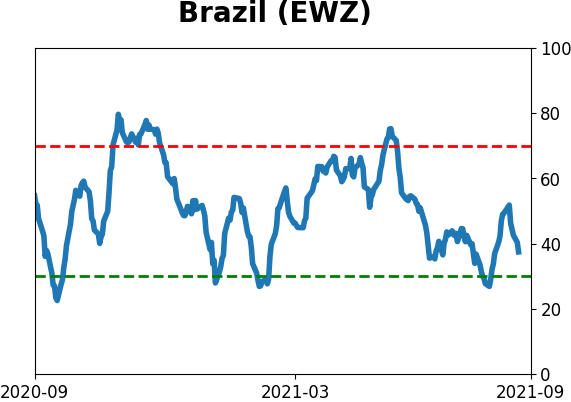
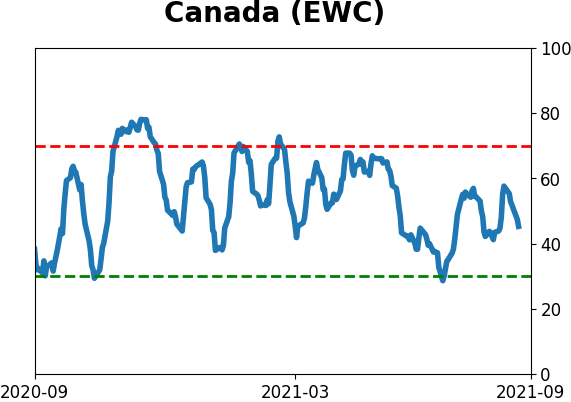
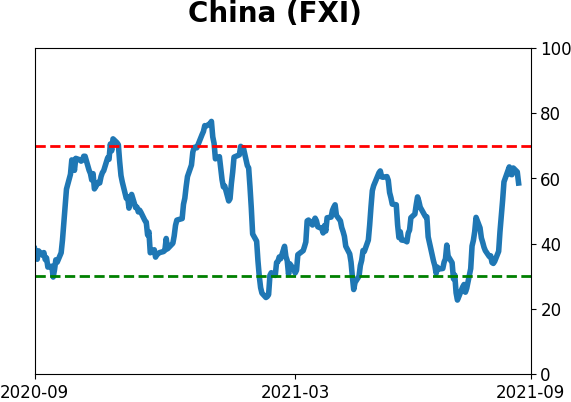
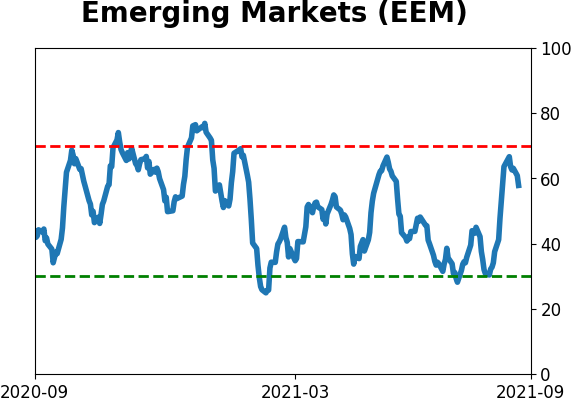
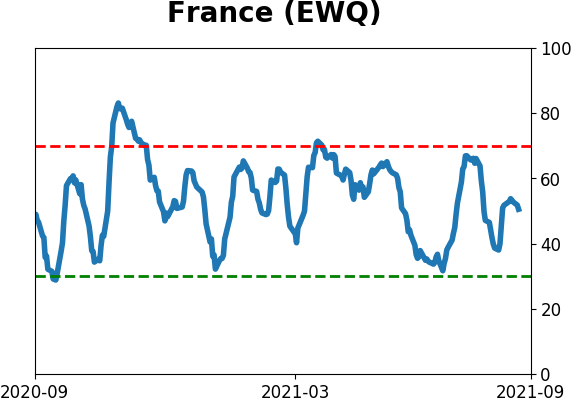
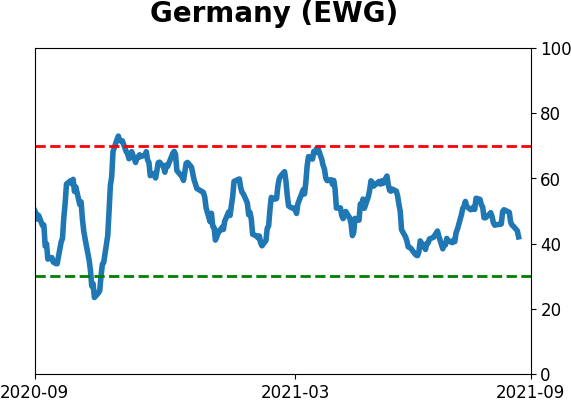
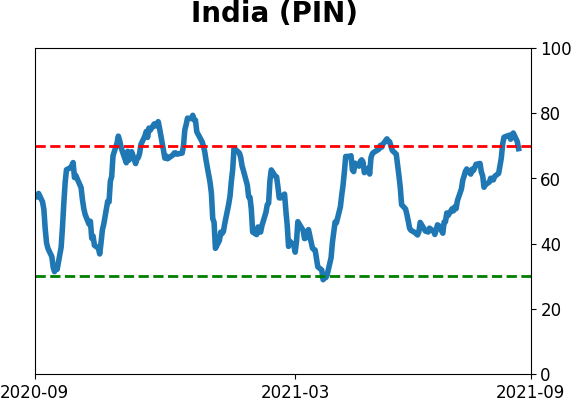
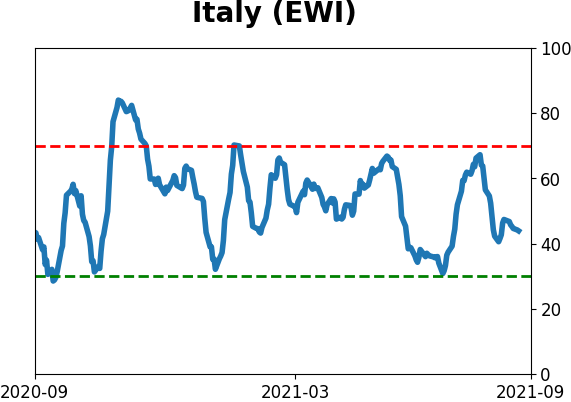
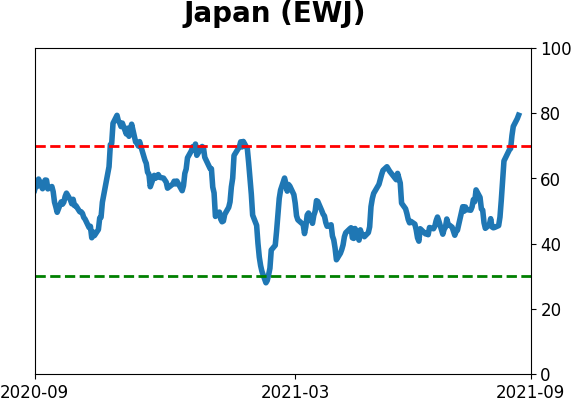
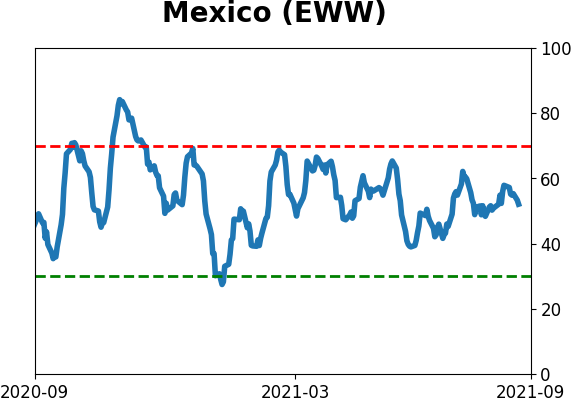
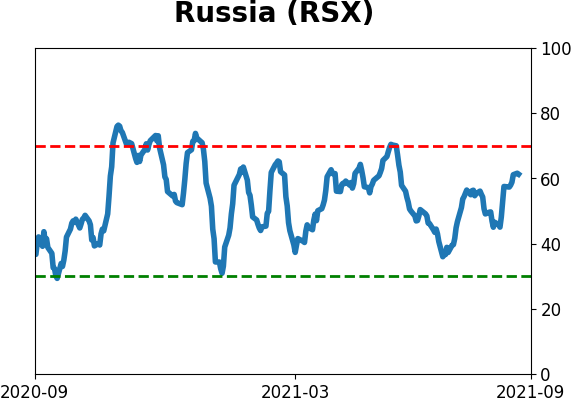
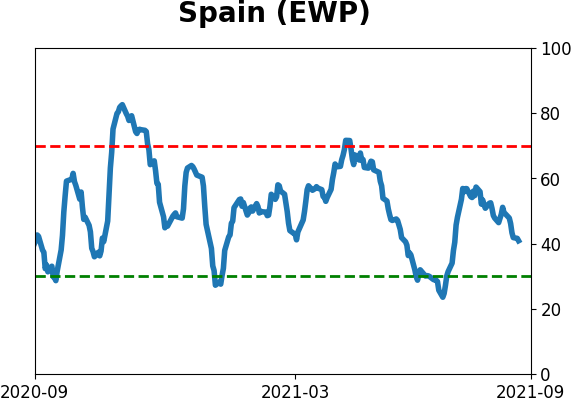
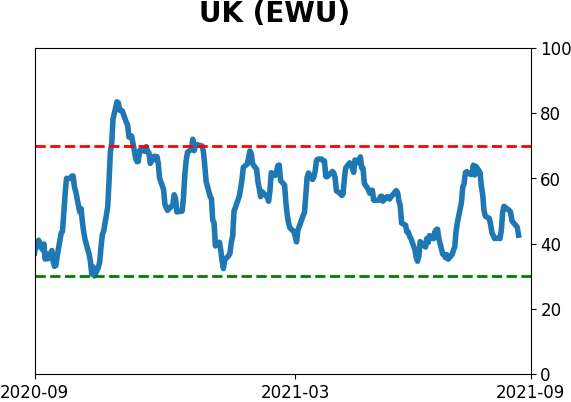
Country ETF's - 10-Day Moving Average
|
|
|
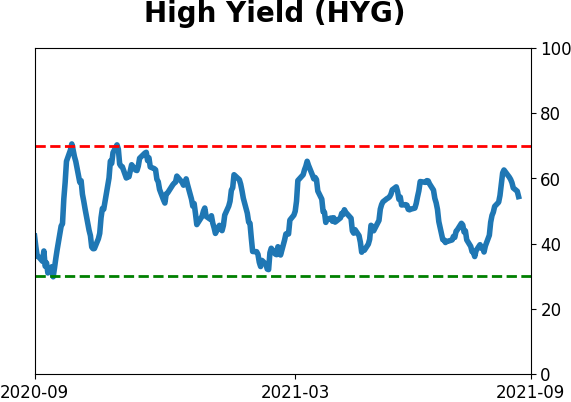
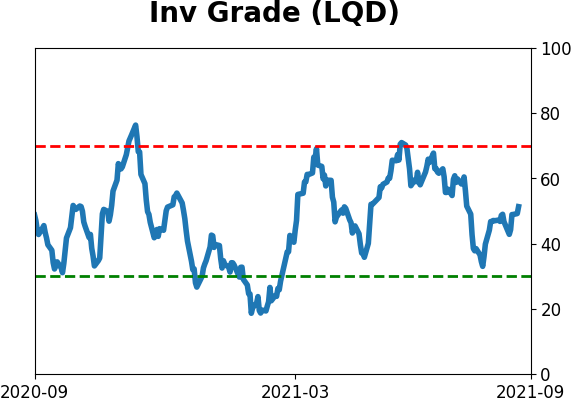
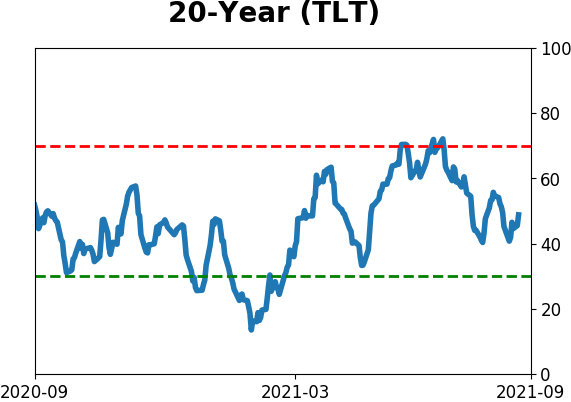
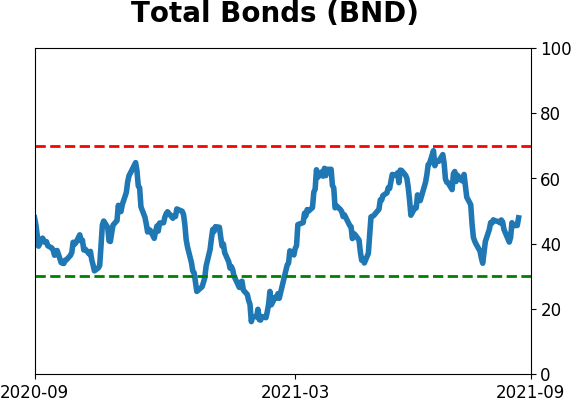
Bond ETF's - 10-Day Moving Average
|
|
|
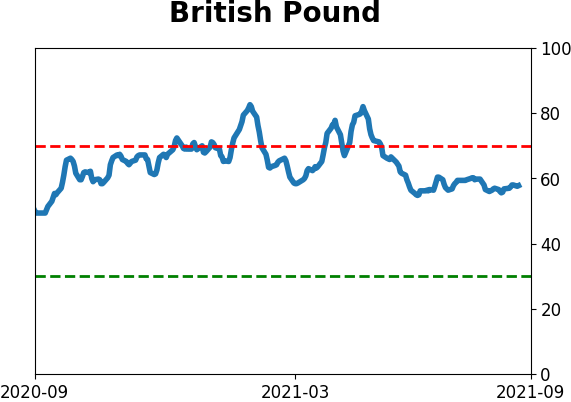
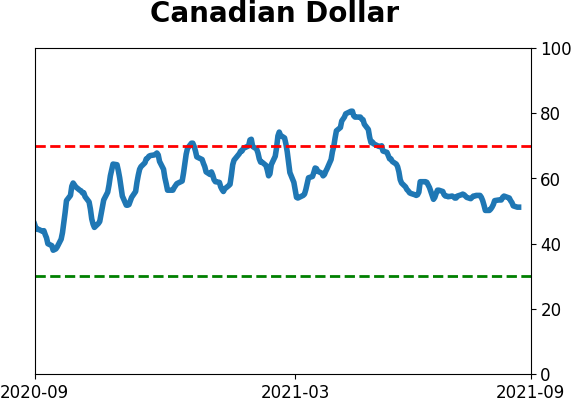
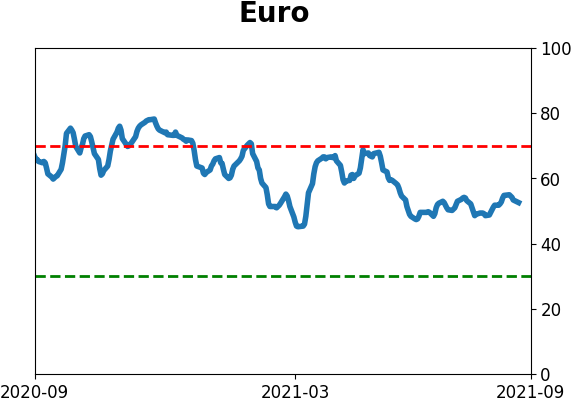
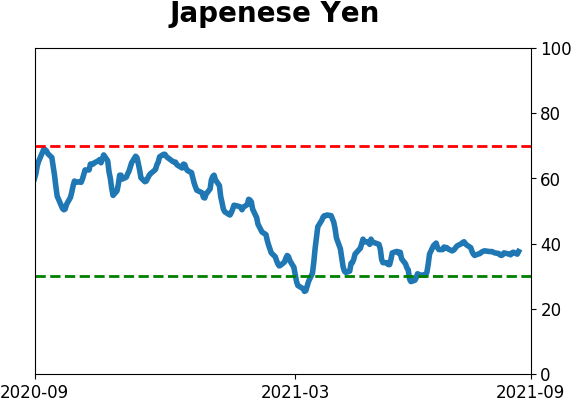
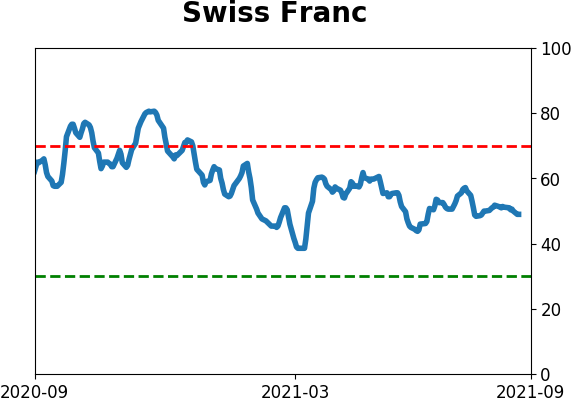
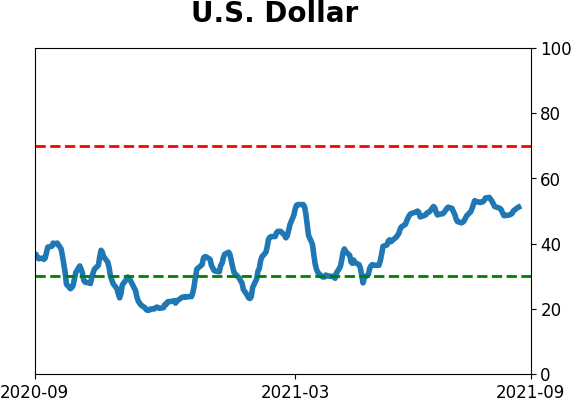
Currency ETF's - 5-Day Moving Average
|
|
|
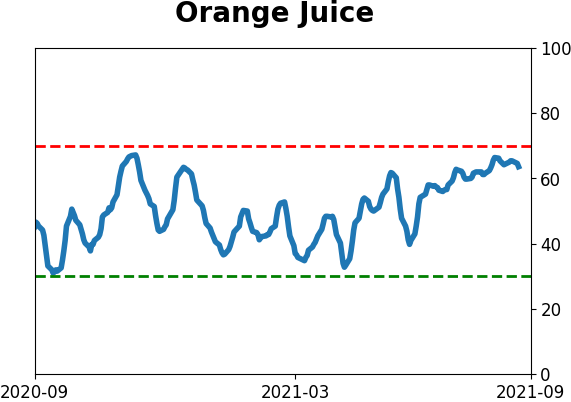
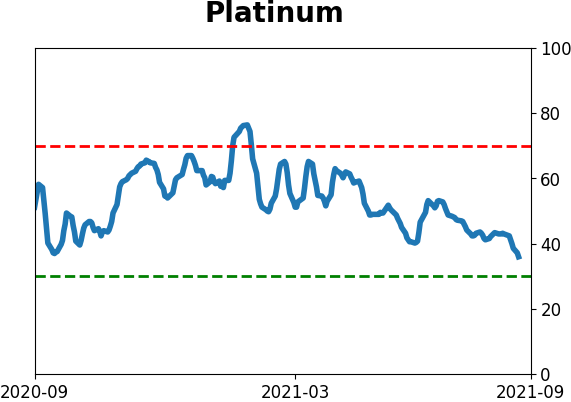
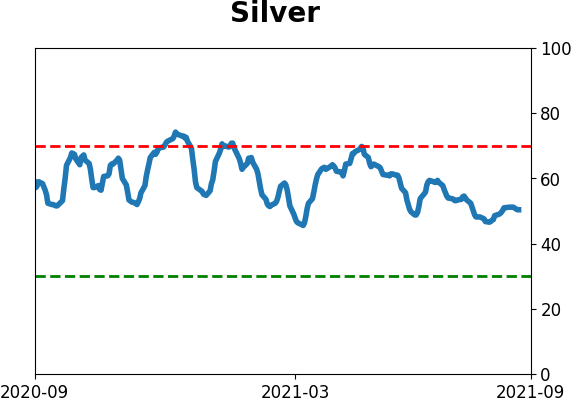
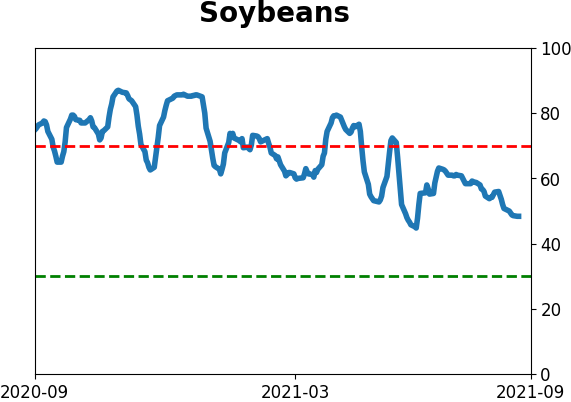
Commodity ETF's - 5-Day Moving Average
|
|