Headlines
|
|
Options Traders Don't Trust the Calm Conditions:
Even as the VIX remains elevated, actual historical volatility has been subdued. That suggests that options traders are worried about the calm conditions and expect it to become more volatile.
Bottom Line:
STOCKS: Hold
Sentiment continues to decline from the speculative February peak. With deteriorating breadth, this raises the risk of poor short- to medium-term returns until optimism and better breadth returns. See the Outlook & Allocations page for more. BONDS: Hold
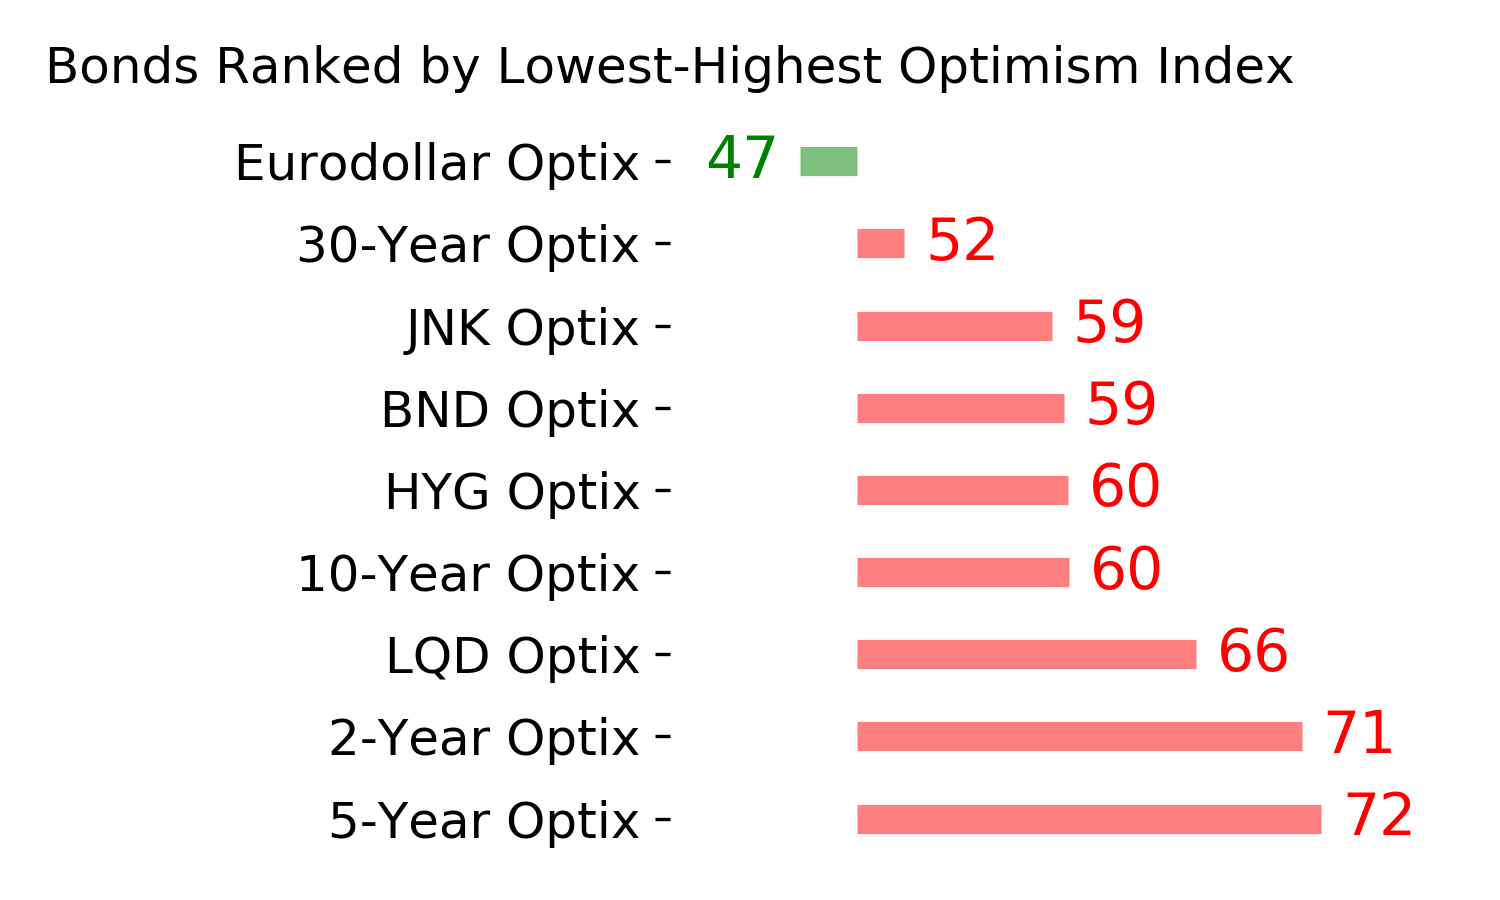
Various parts of the market got hit in March, with the lowest Bond Optimism Index we usually see during healthy environments. Bond prices have modest recovered and there is no edge among the data we follow. GOLD: Hold
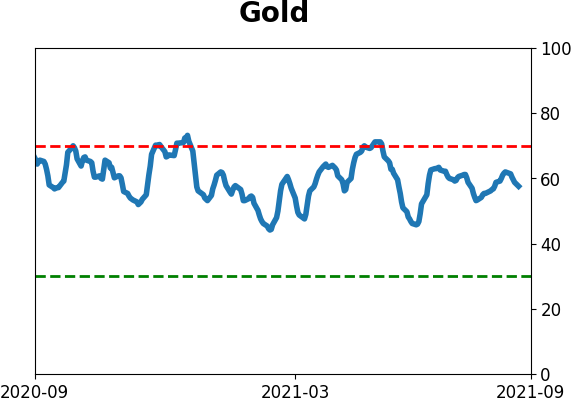
Gold and miners were rejected after trying to recover above their 200-day averages in May. Lately, some medium-term (not long-term) oversold extremes in breadth measures among miners have triggered.
|
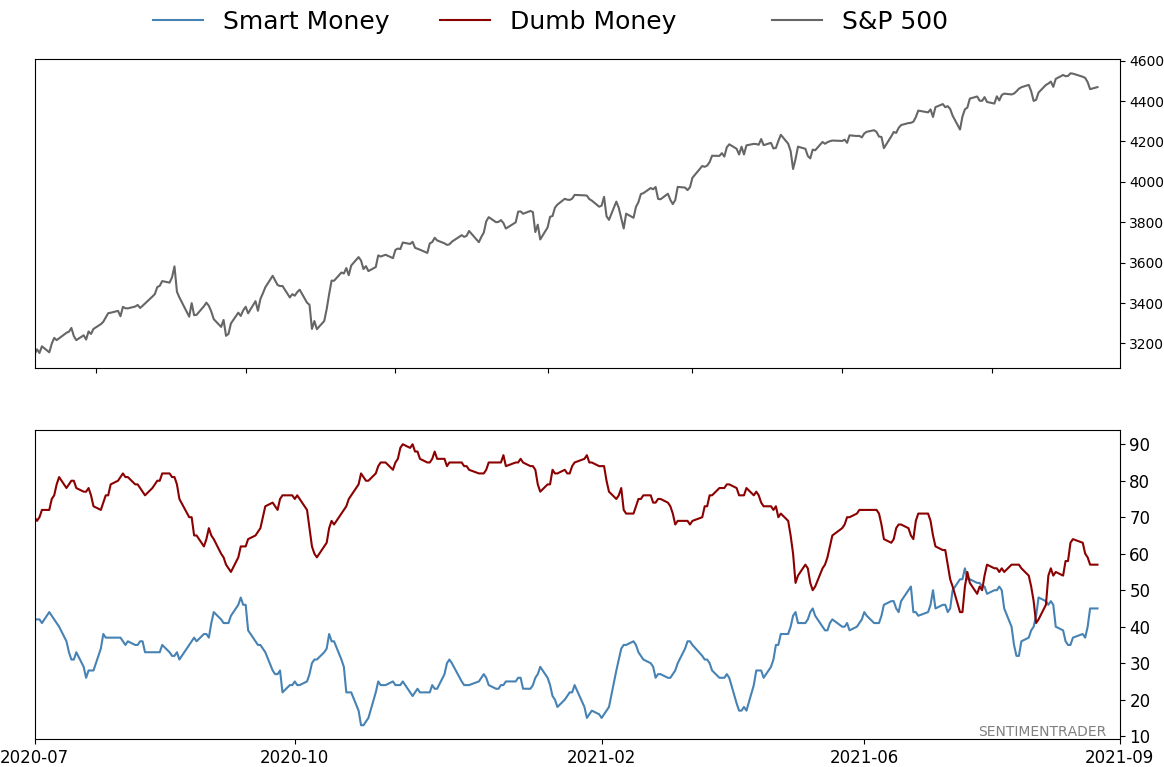
Smart / Dumb Money Confidence
|
Smart Money Confidence: 45%
Dumb Money Confidence: 57%
|
|
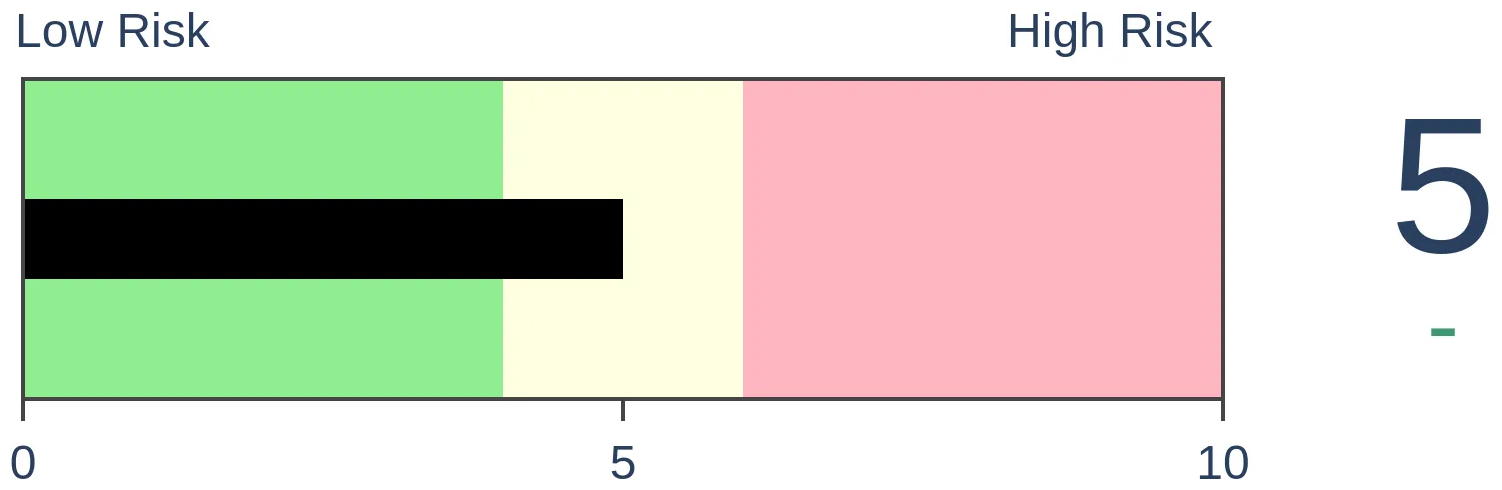
Risk Levels
Stocks Short-Term
|
Stocks Medium-Term

|
|
Bonds

|
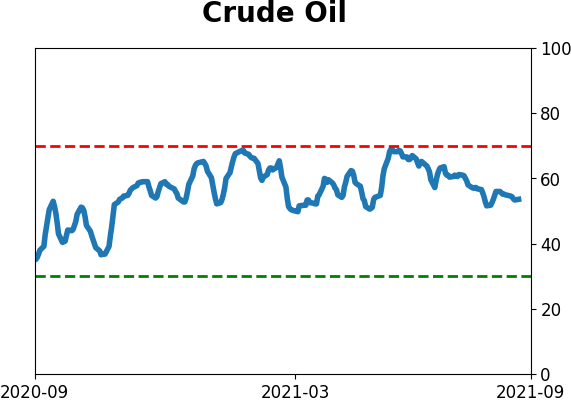
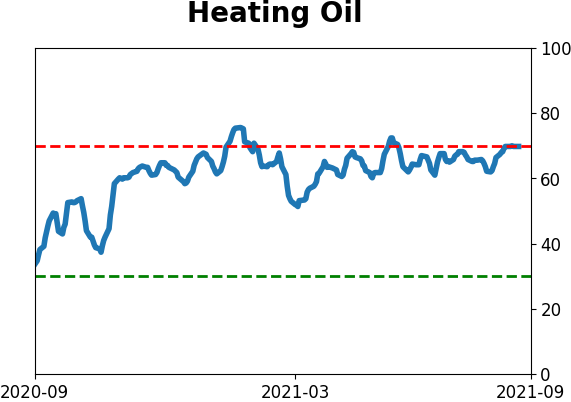
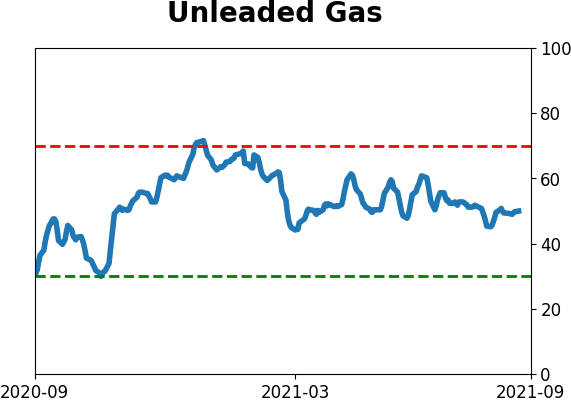
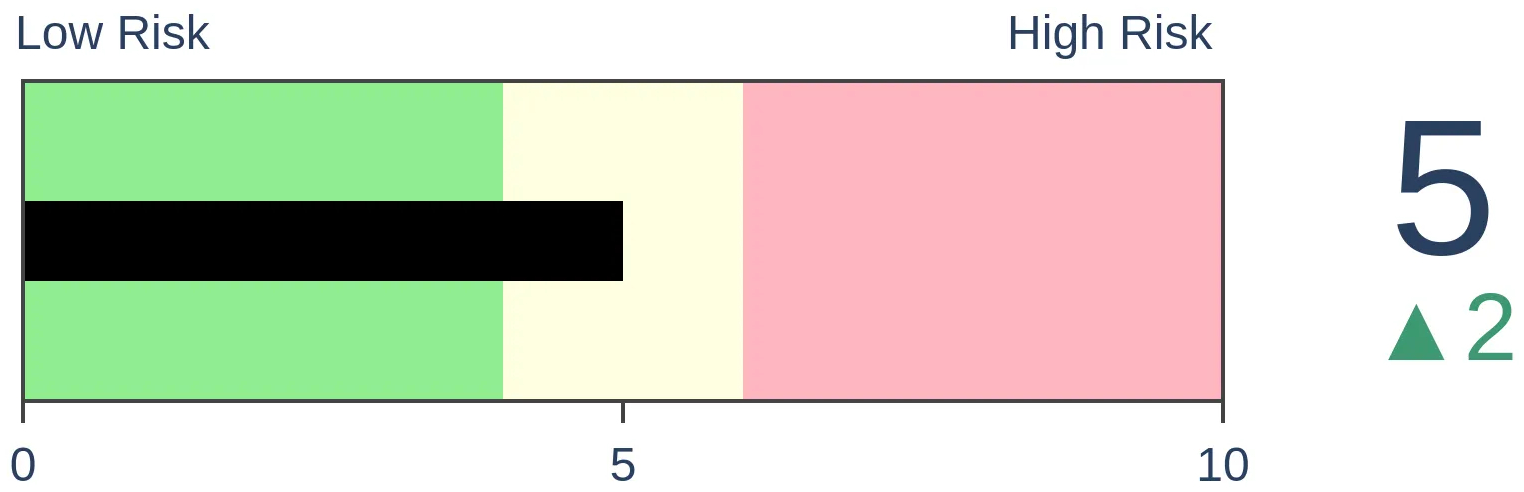
Crude Oil
|
|
Gold
|
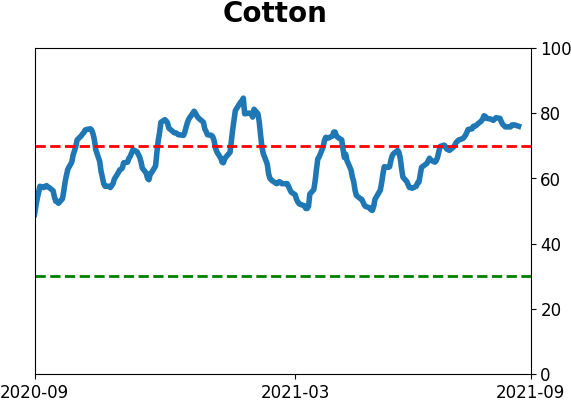
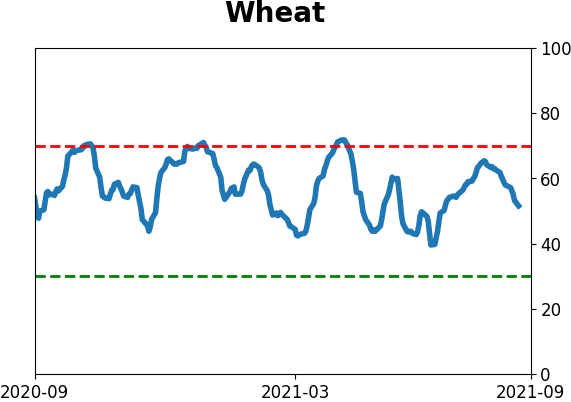
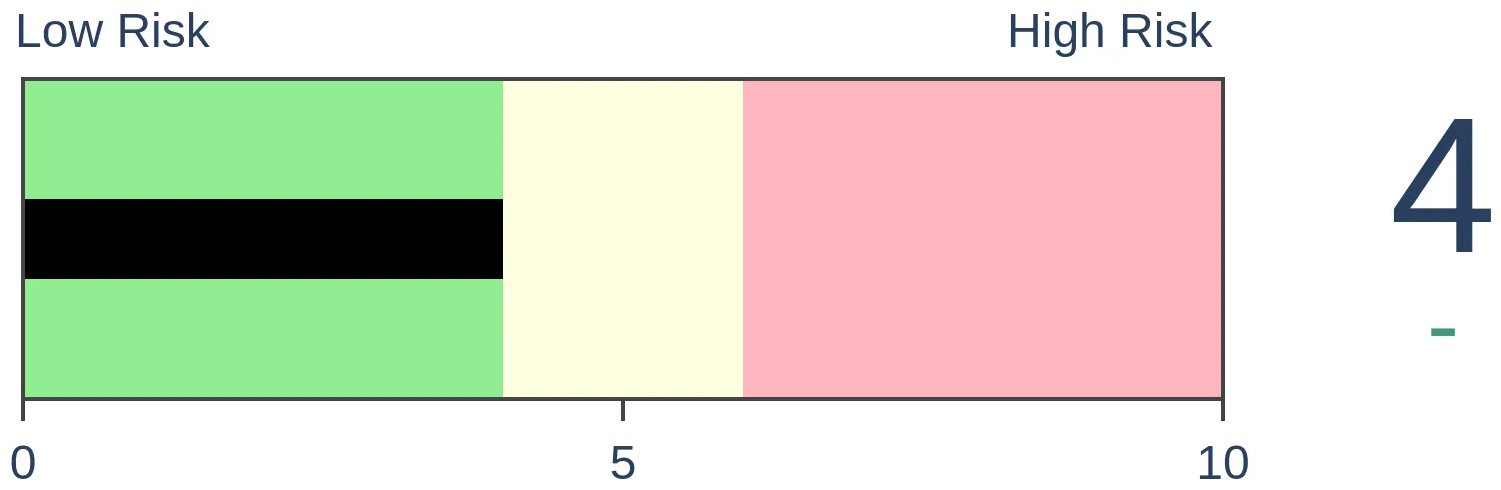
Agriculture

|
|
Research
By Jason Goepfert
BOTTOM LINE
Even as the VIX remains elevated, actual historical volatility has been subdued. That suggests that options traders are worried about the calm conditions and expect it to become more volatile.
FORECAST / TIMEFRAME
None
|
Options traders don't trust the calm conditions.
The S&P 500 declined for 5 consecutive sessions, but the overall loss was tiny. Historically, that combination has preceded a rebound - calm conditions tend to persist until that one moment when they don't, and the trend changes.
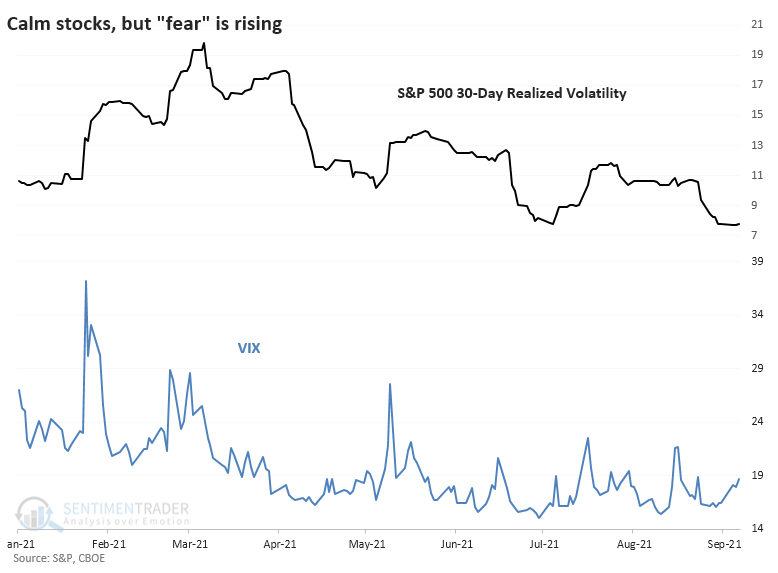
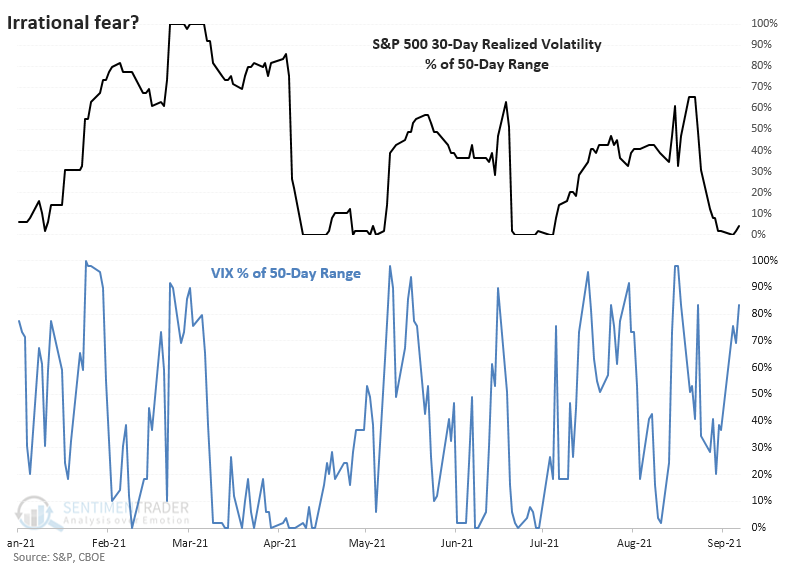
Conditions have been pretty much perfect for stock investors all year. A slow, steady drumbeat of gains is nirvana. But the VIX "fear gauge" of implied future volatility has been holding up for weeks, which is unusual since it's occurring at the same time that actual, realized volatility in the S&P 500 index has dripped close to all-time lows. The action late last week didn't change things much.
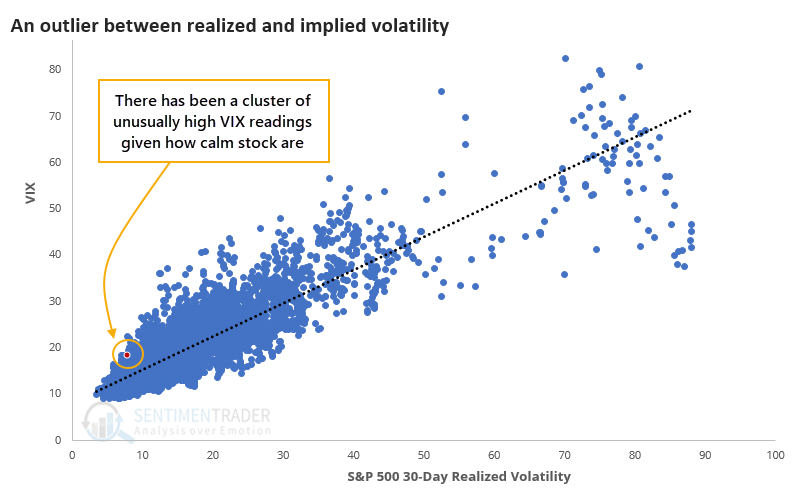
There is a clear positive correlation between realized and expected volatility. Traders rely on the recent past (realized volatility) to predict the near future (implied volatility).
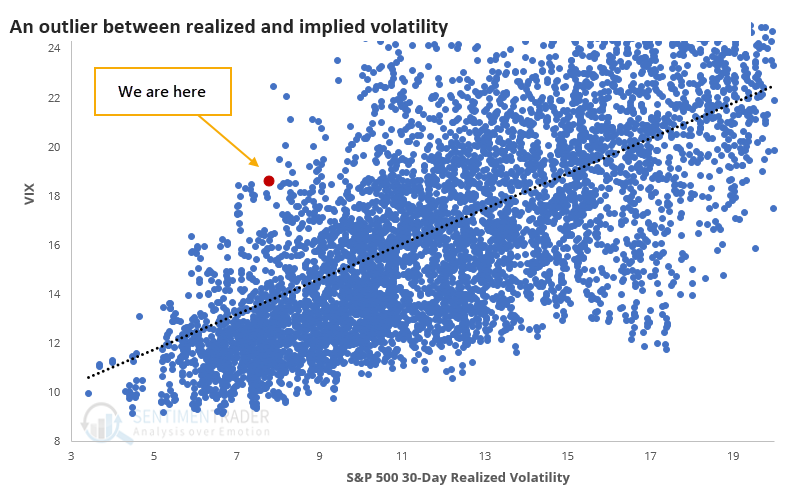
If we zoom in on smaller readings, we can see just how much last week stands out versus all historical readings.
This becomes clearer when we look at realized volatility versus its 50-day trading range. It's scraping the bottom of it. But the VIX has been priced at the upper end of its own range.
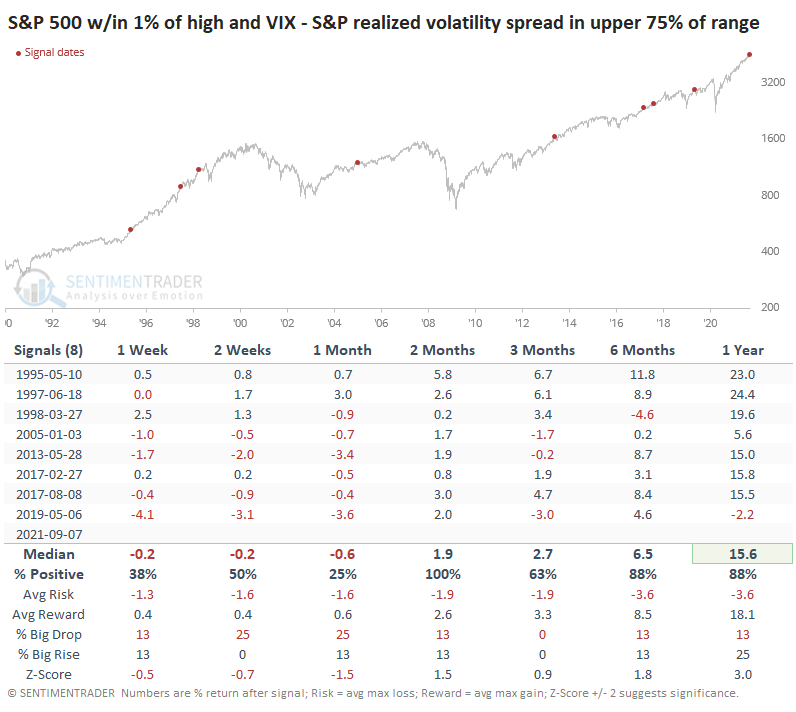
So who knows more, equity investors or volatility traders? The table below suggests that in the short-term, options traders are "smarter," while in the medium-term, investors have been.
Over the next 1-4 weeks, the S&P had great difficulty holding any meaningful gains when this signal triggered while the index was hovering within 1% of its prior highs, as it was last week. Even so, over the next two months, it rallied every time. And longer-term, there were no major losses.
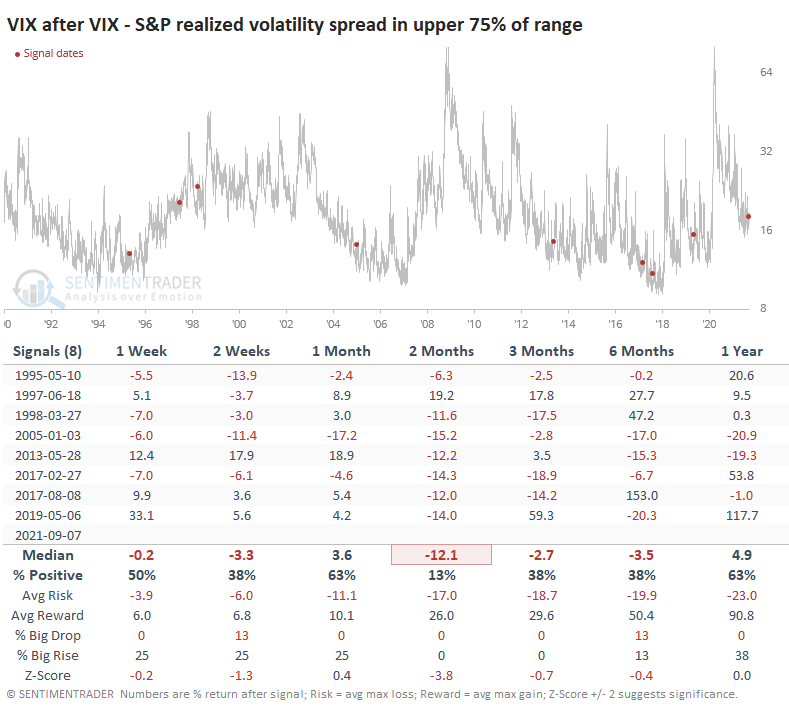
Even though stocks were rocky in the immediate aftermath of these signals, the VIX didn't pop higher very often. And only one of the signals showed any gain at all over the next couple of months.
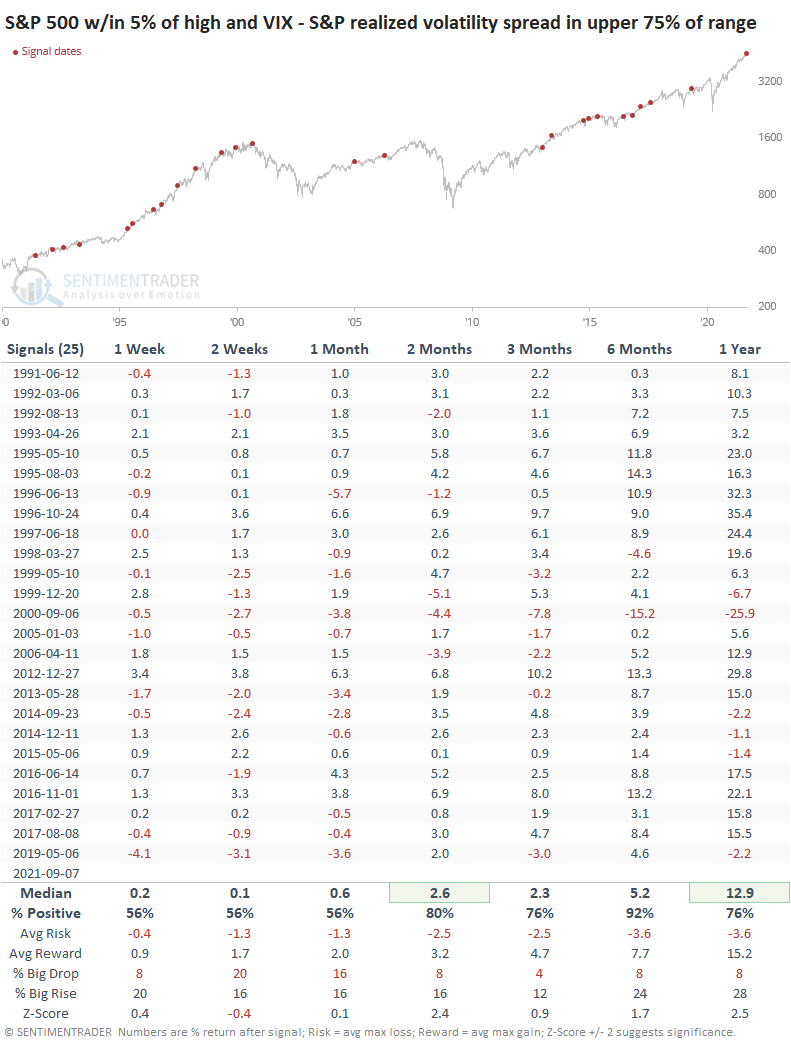
If we allow the S&P to be within 5% of its peak (instead of 1%), then the sample size increases dramatically. But the overall suggestion was the same - questionable shorter-term returns but decent medium- to long-term ones.
Stocks in 2021 have shrugged off every imaginable concern, and it has resulted in one of the most remarkable market environments in history. Maybe that means history is no guide whatsoever here, and a decent argument could be made that that's the case.
We're always looking for times when markets don't do what they should, and we got indications of that on the upside as early as January. Now we should be watching for signs that stocks aren't doing what they should on the downside, and if we see any material follow-through weakness after last week's small but persistent declines, it would suggest that the momentum run of 2021 is entering a shakier stretch.
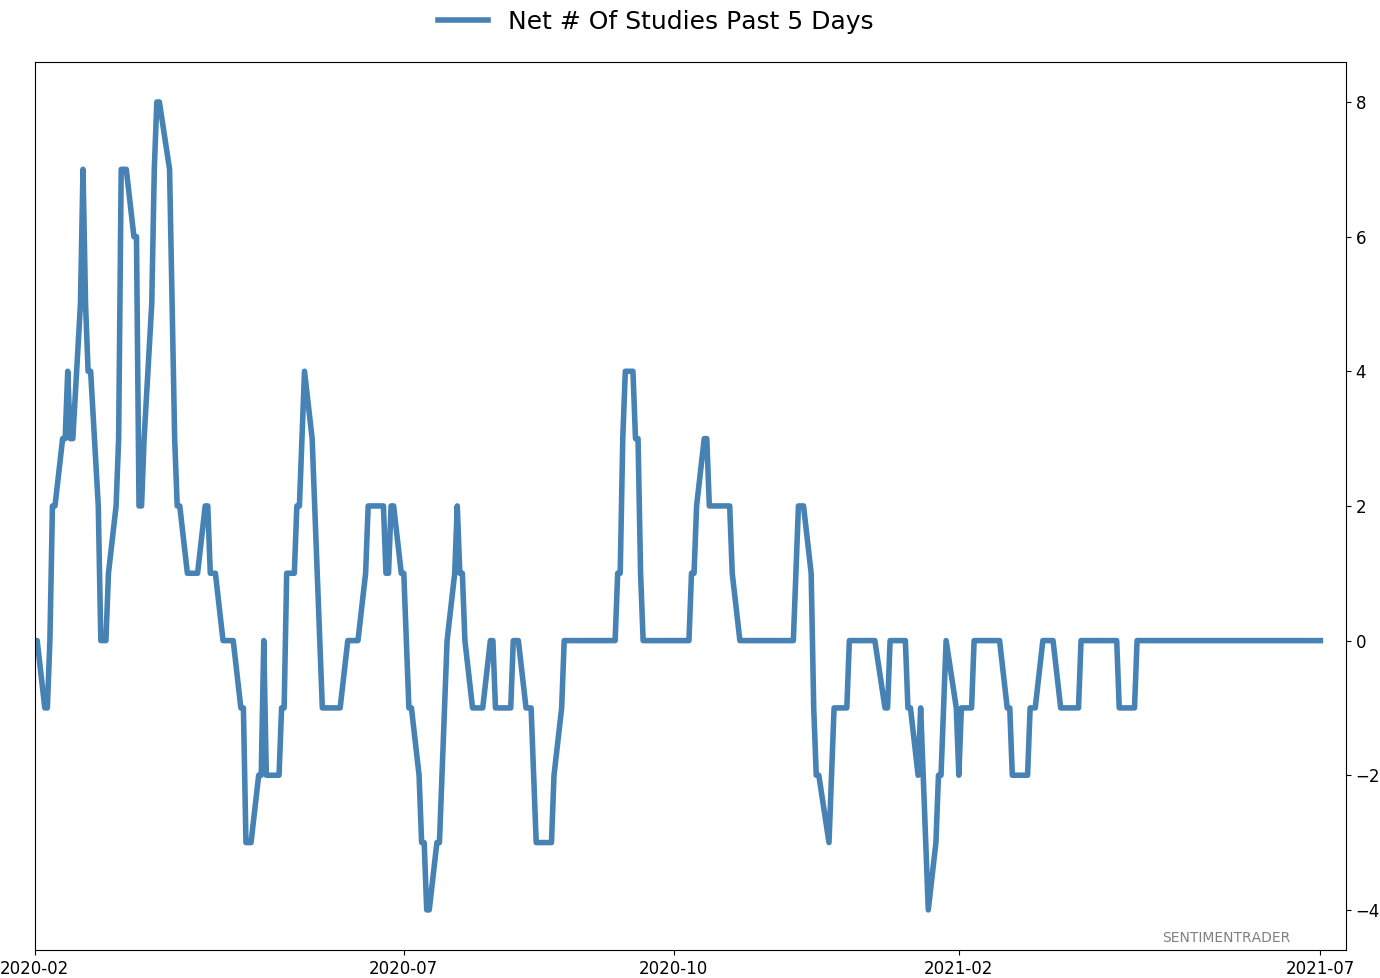
Active Studies
| Time Frame | Bullish | Bearish | | Short-Term | 0 | 6 | | Medium-Term | 5 | 3 | | Long-Term | 11 | 5 |
|
Indicators at Extremes
Portfolio
| Position | Description | Weight % | Added / Reduced | Date | | Stocks | RSP | 4.1 | Added 4.1% | 2021-05-19 | | Bonds | 23.9% BND, 6.9% SCHP | 30.7 | Reduced 7.1% | 2021-05-19 | | Commodities | GCC | 2.6 | Reduced 2.1%
| 2020-09-04 | | Precious Metals | GDX | 5.6 | Reduced 4.2% | 2021-05-19 | | Special Situations | 4.3% XLE, 2.2% PSCE | 7.6 | Reduced 5.6% | 2021-04-22 | | Cash | | 49.4 | | |
|
Updates (Changes made today are underlined)
Much of our momentum and trend work has remained positive for several months, with some scattered exceptions. Almost all sentiment-related work has shown a poor risk/reward ratio for stocks, especially as speculation drove to record highs in exuberance in February. Much of that has worn off, and most of our models are back toward neutral levels. There isn't much to be excited about here. The same goes for bonds and even gold. Gold has been performing well lately and is back above long-term trend lines. The issue is that it has a poor record of holding onto gains when attempting a long-term trend change like this, so we'll take a wait-and-see approach. RETURN YTD: 8.8% 2020: 8.1%, 2019: 12.6%, 2018: 0.6%, 2017: 3.8%, 2016: 17.1%, 2015: 9.2%, 2014: 14.5%, 2013: 2.2%, 2012: 10.8%, 2011: 16.5%, 2010: 15.3%, 2009: 23.9%, 2008: 16.2%, 2007: 7.8%
|
|
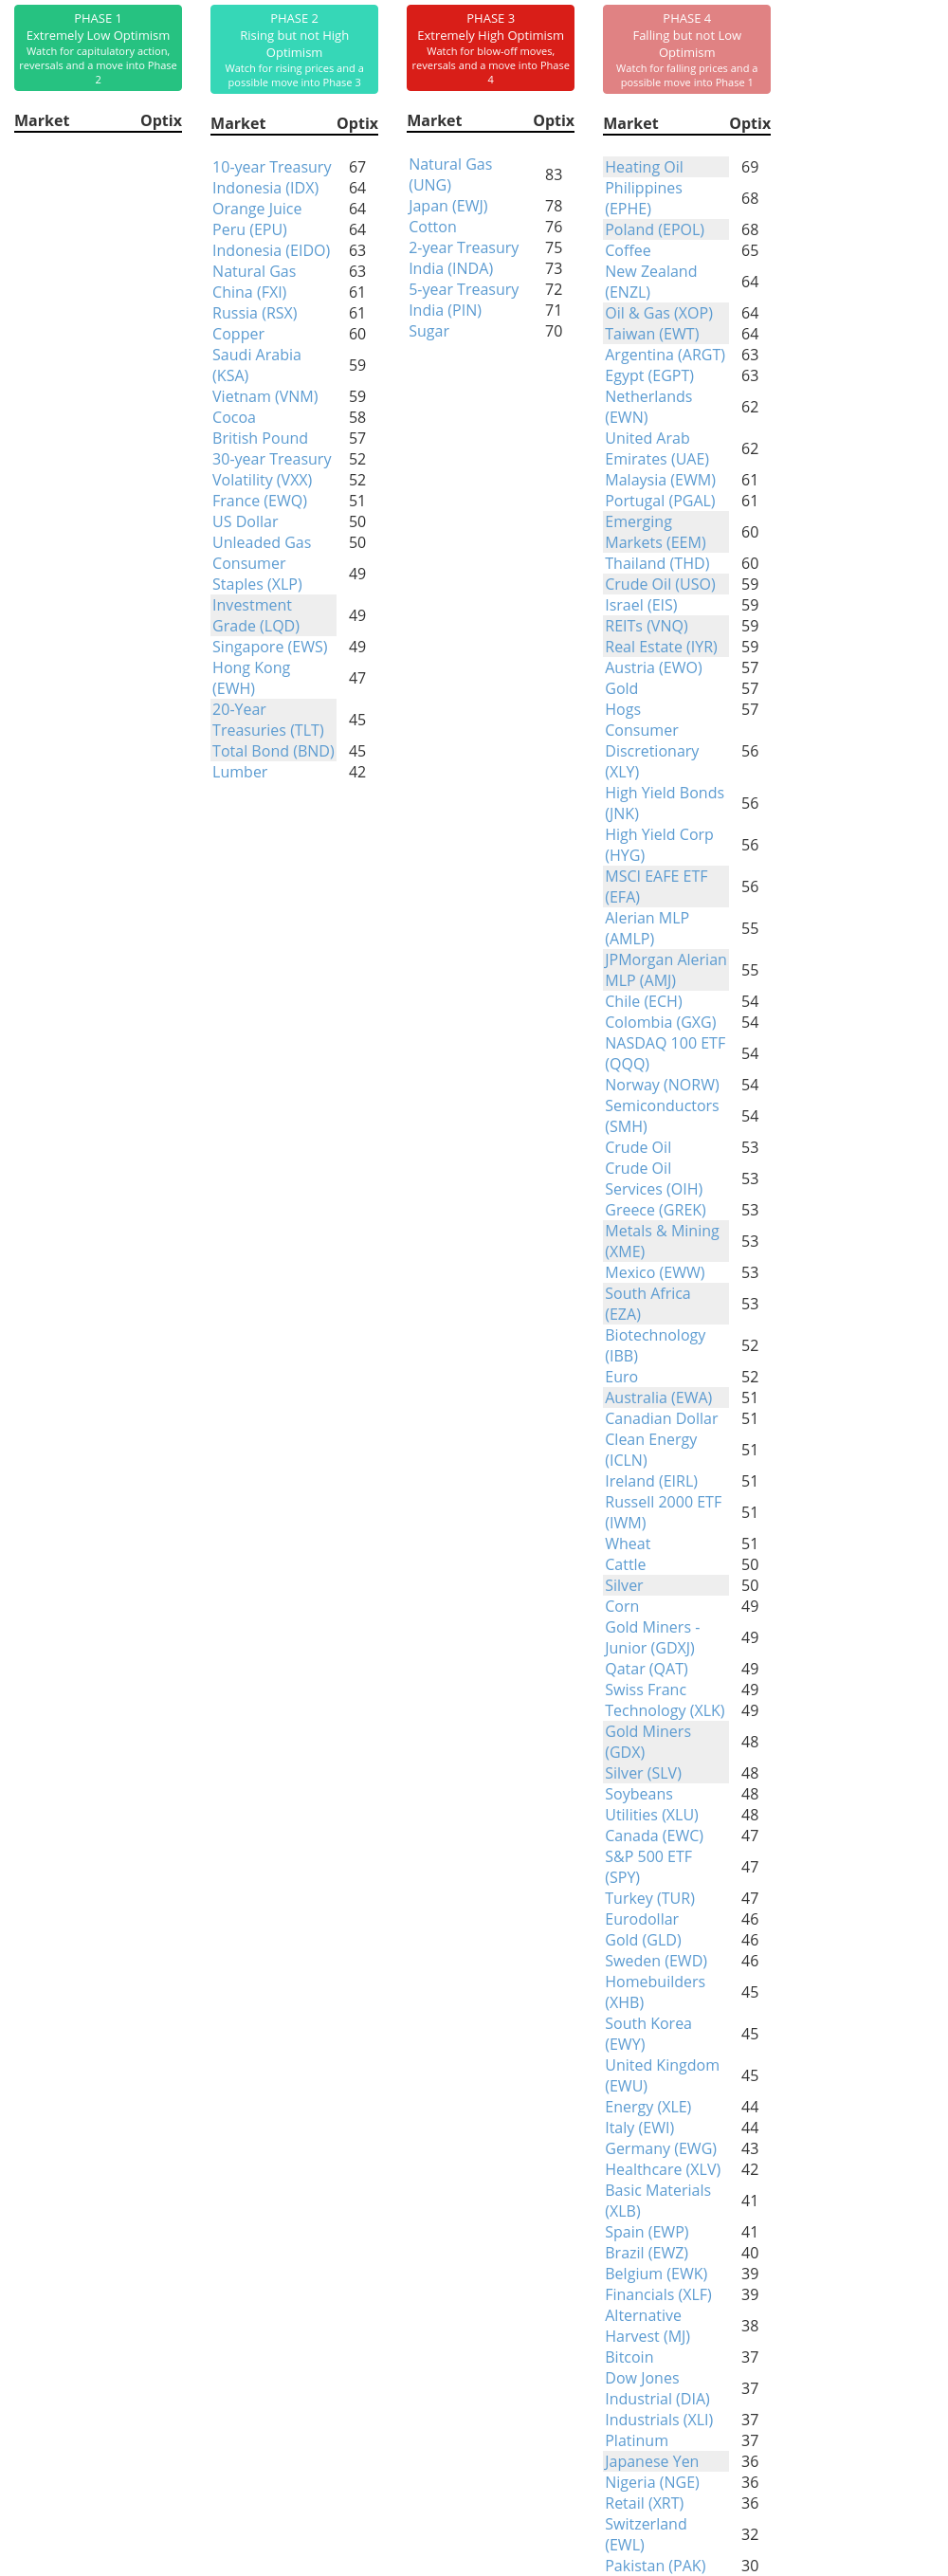
Phase Table
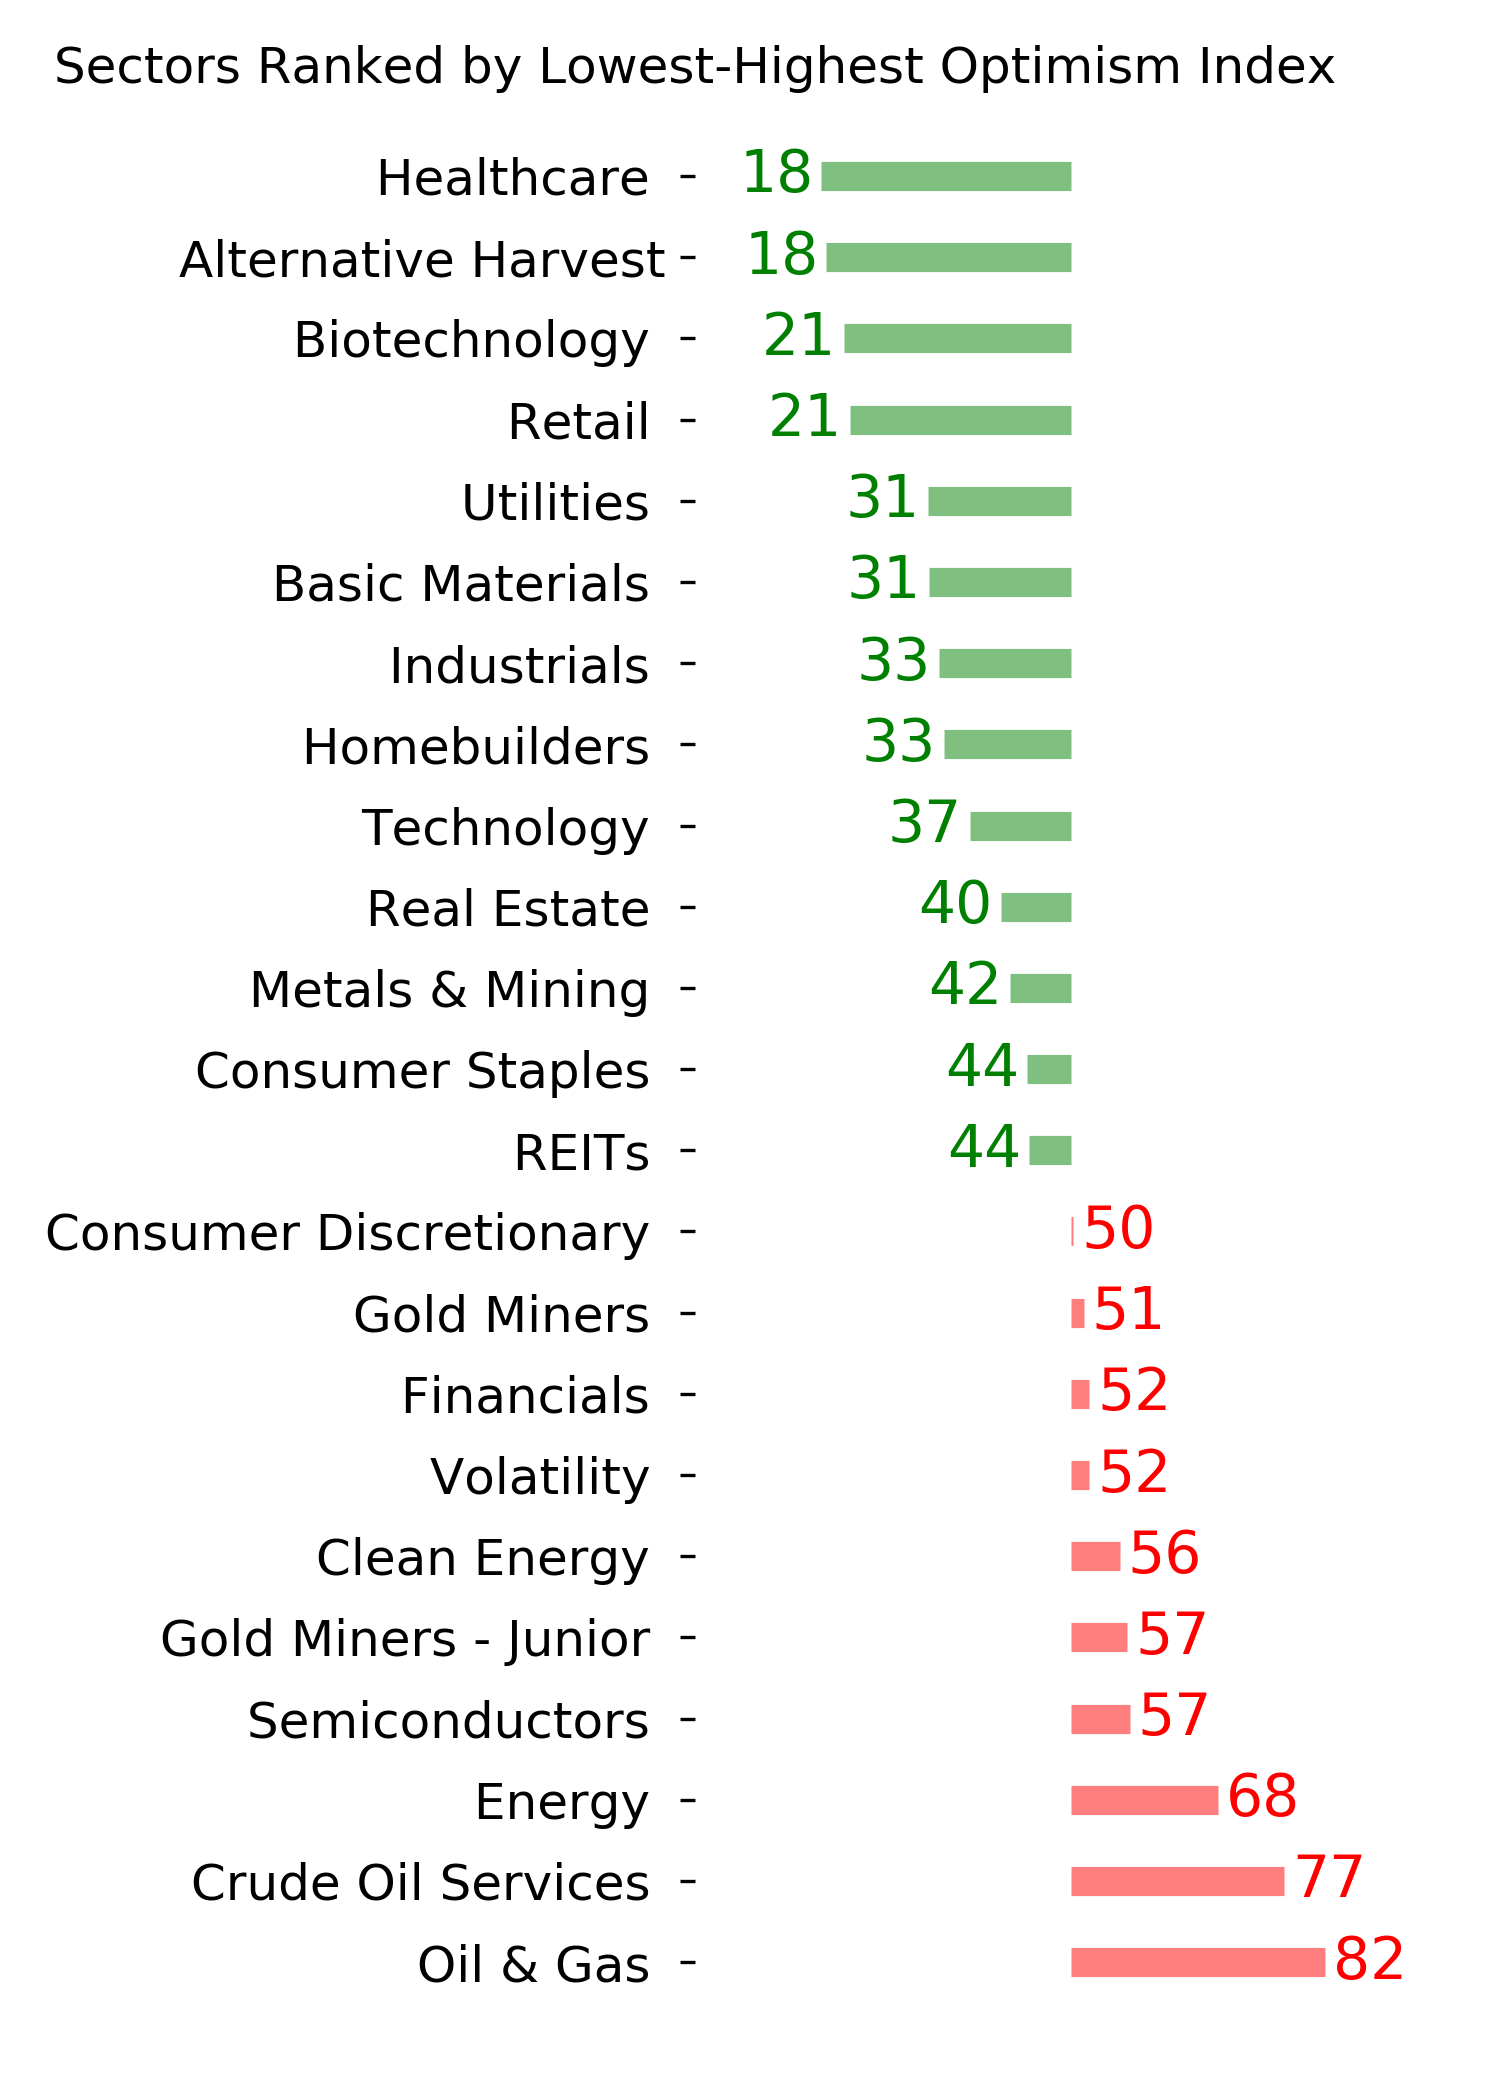
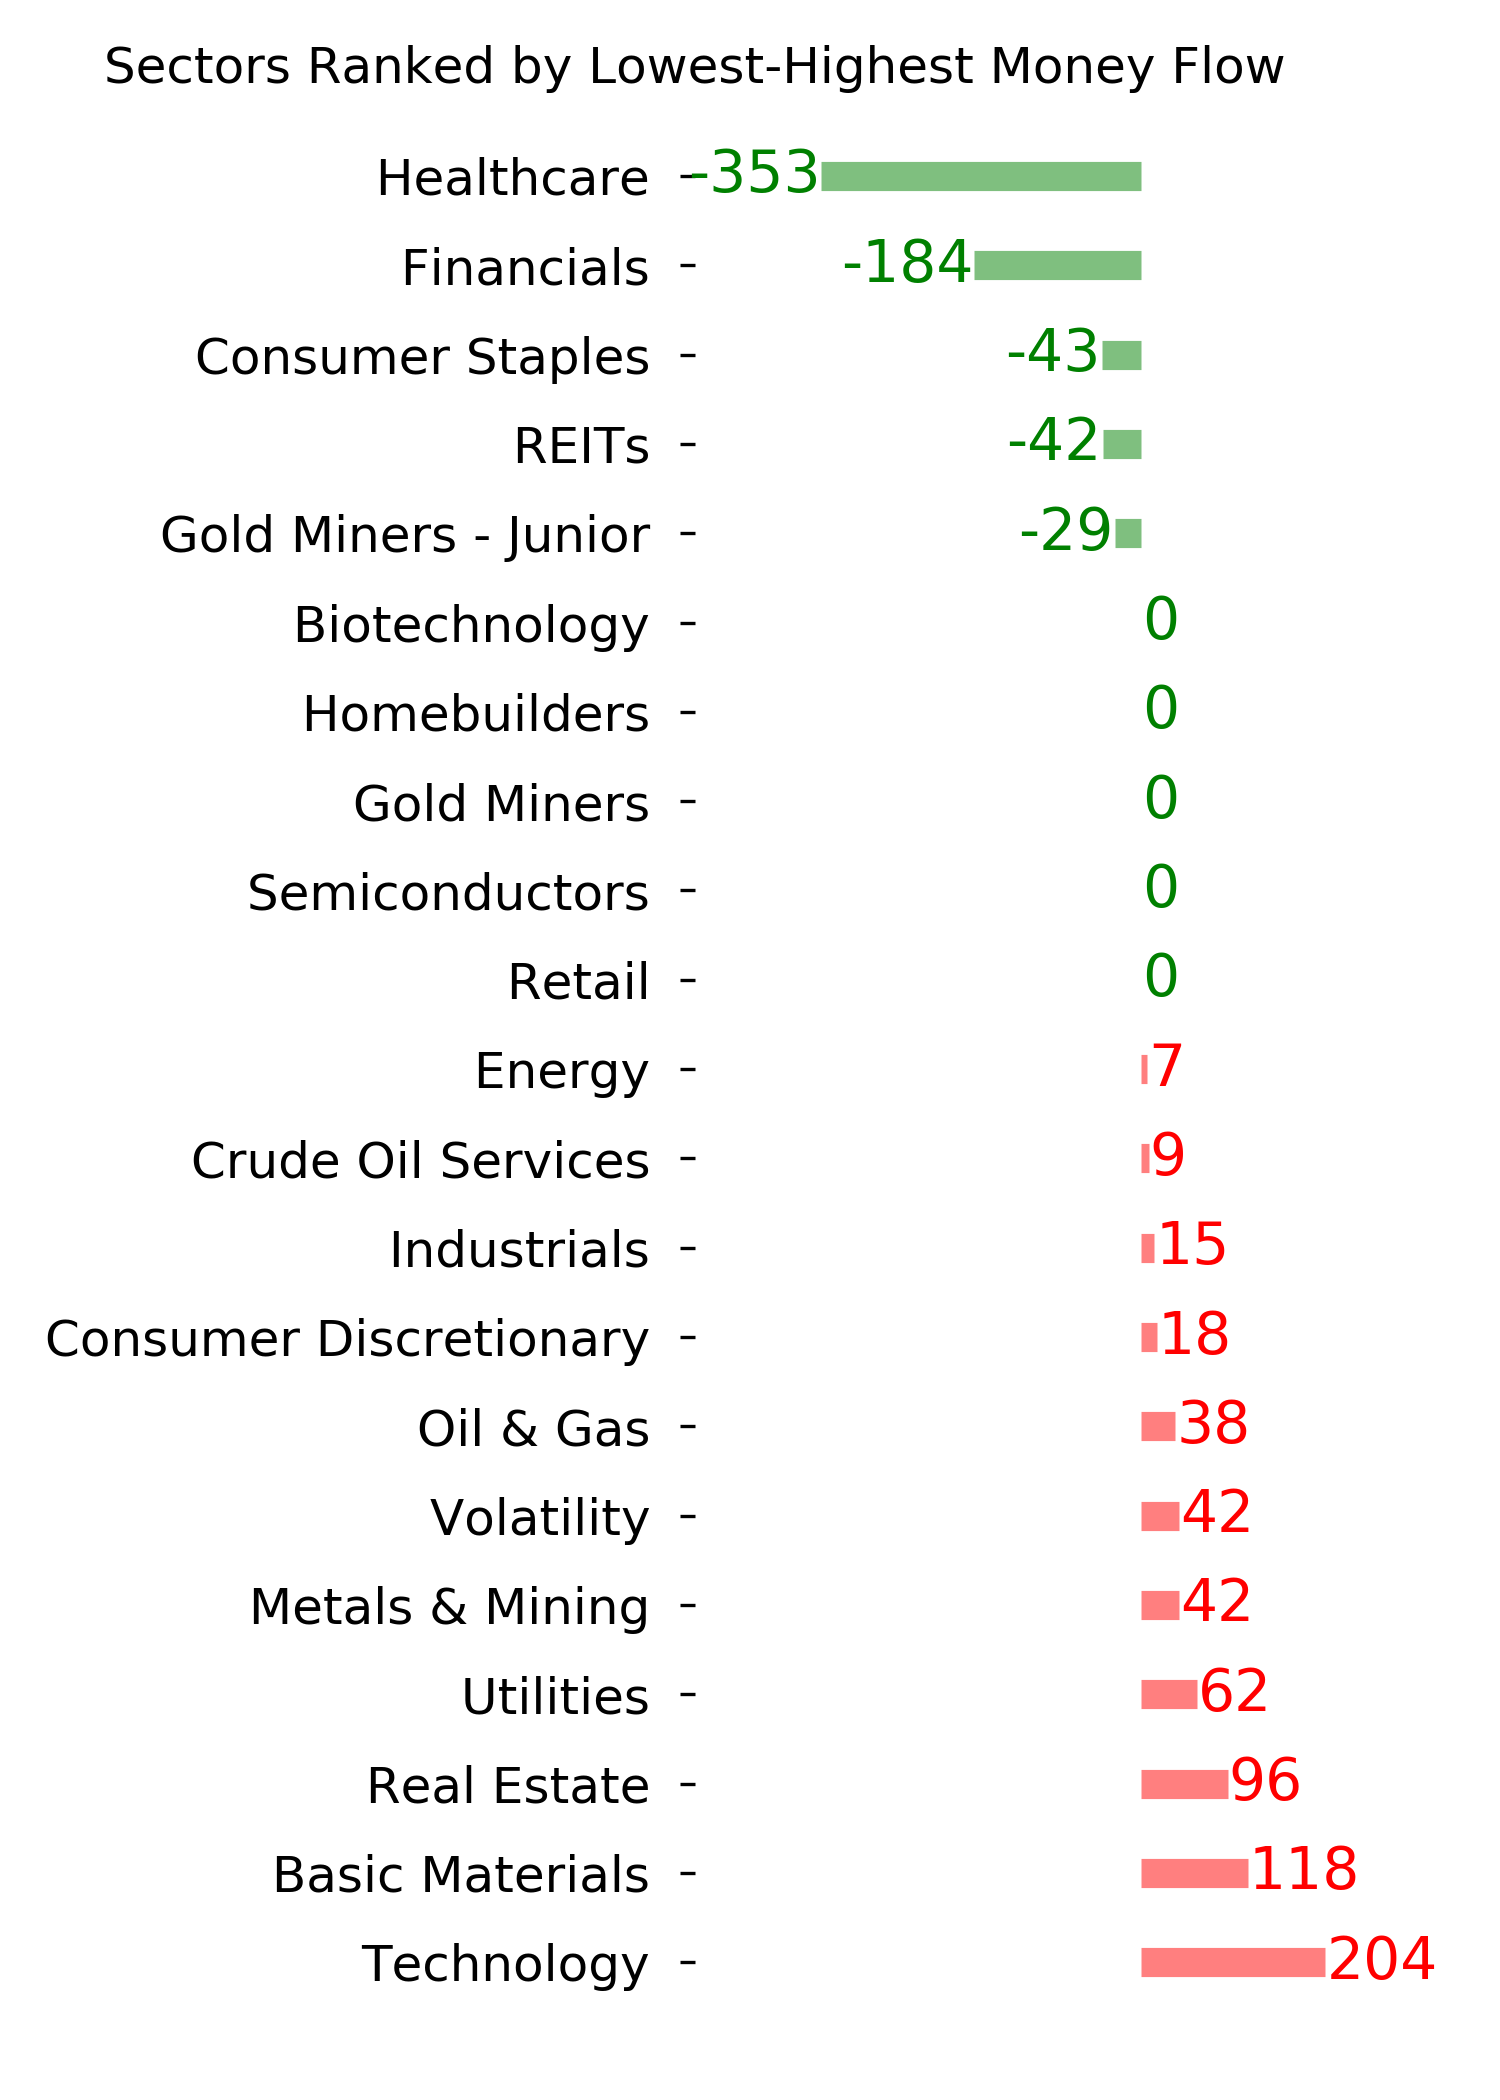
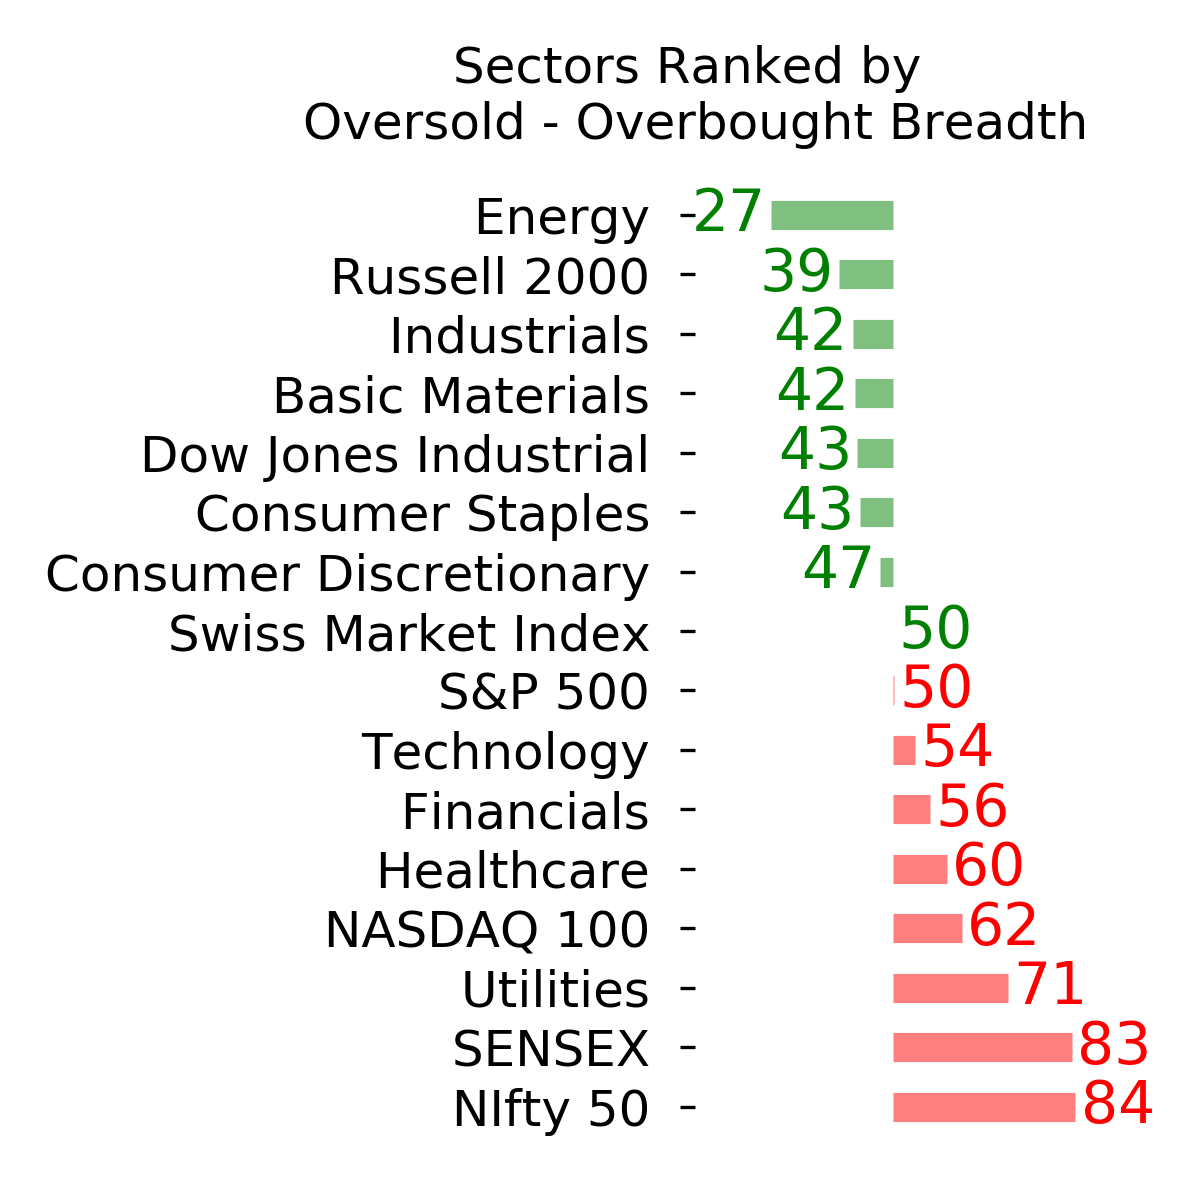
Ranks
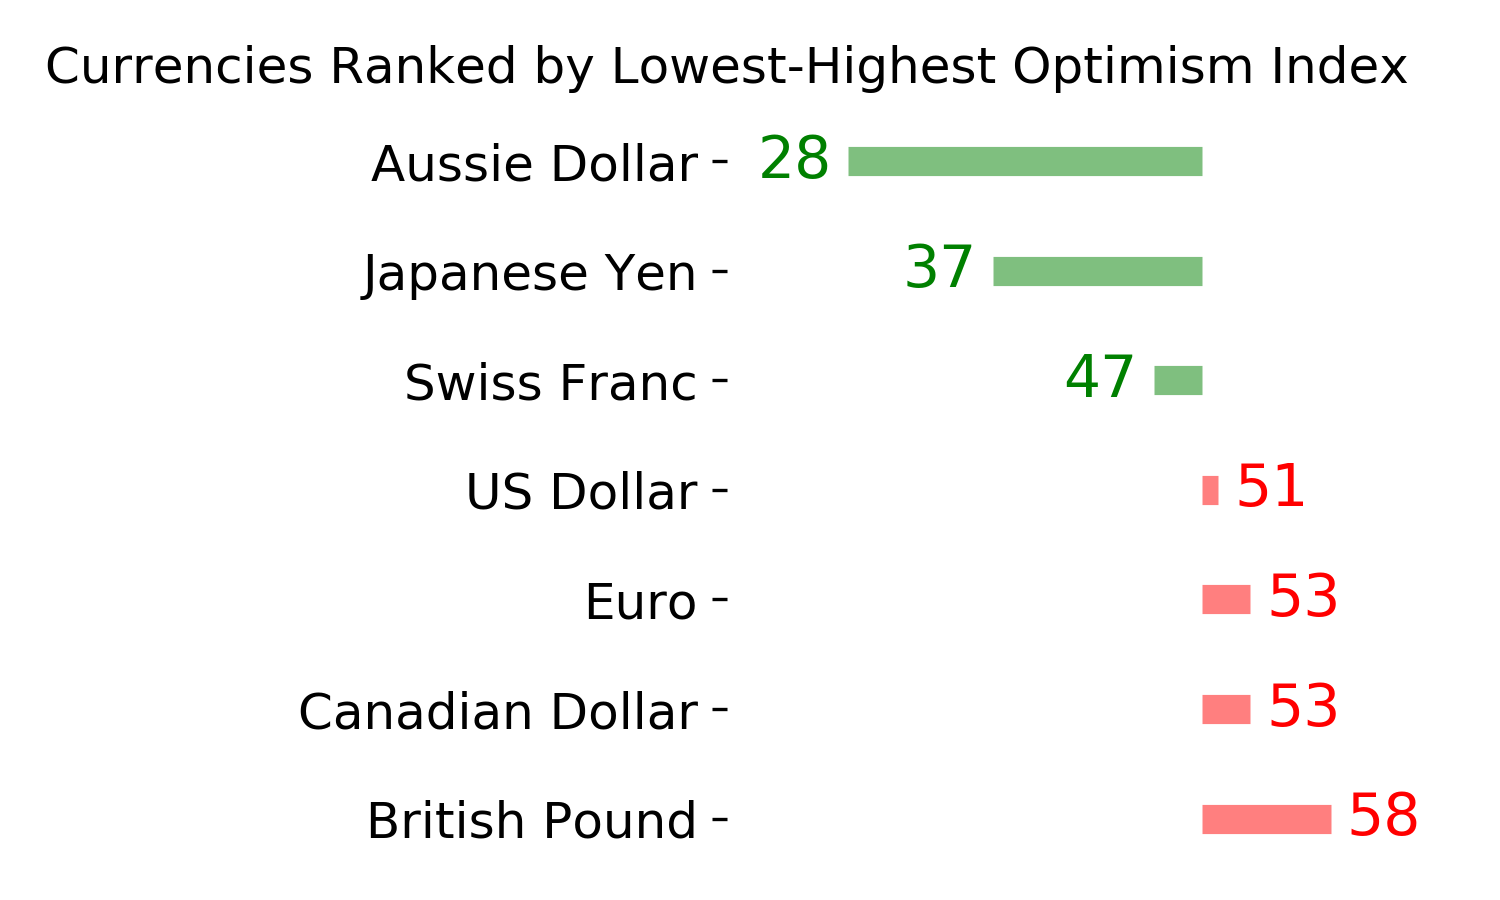
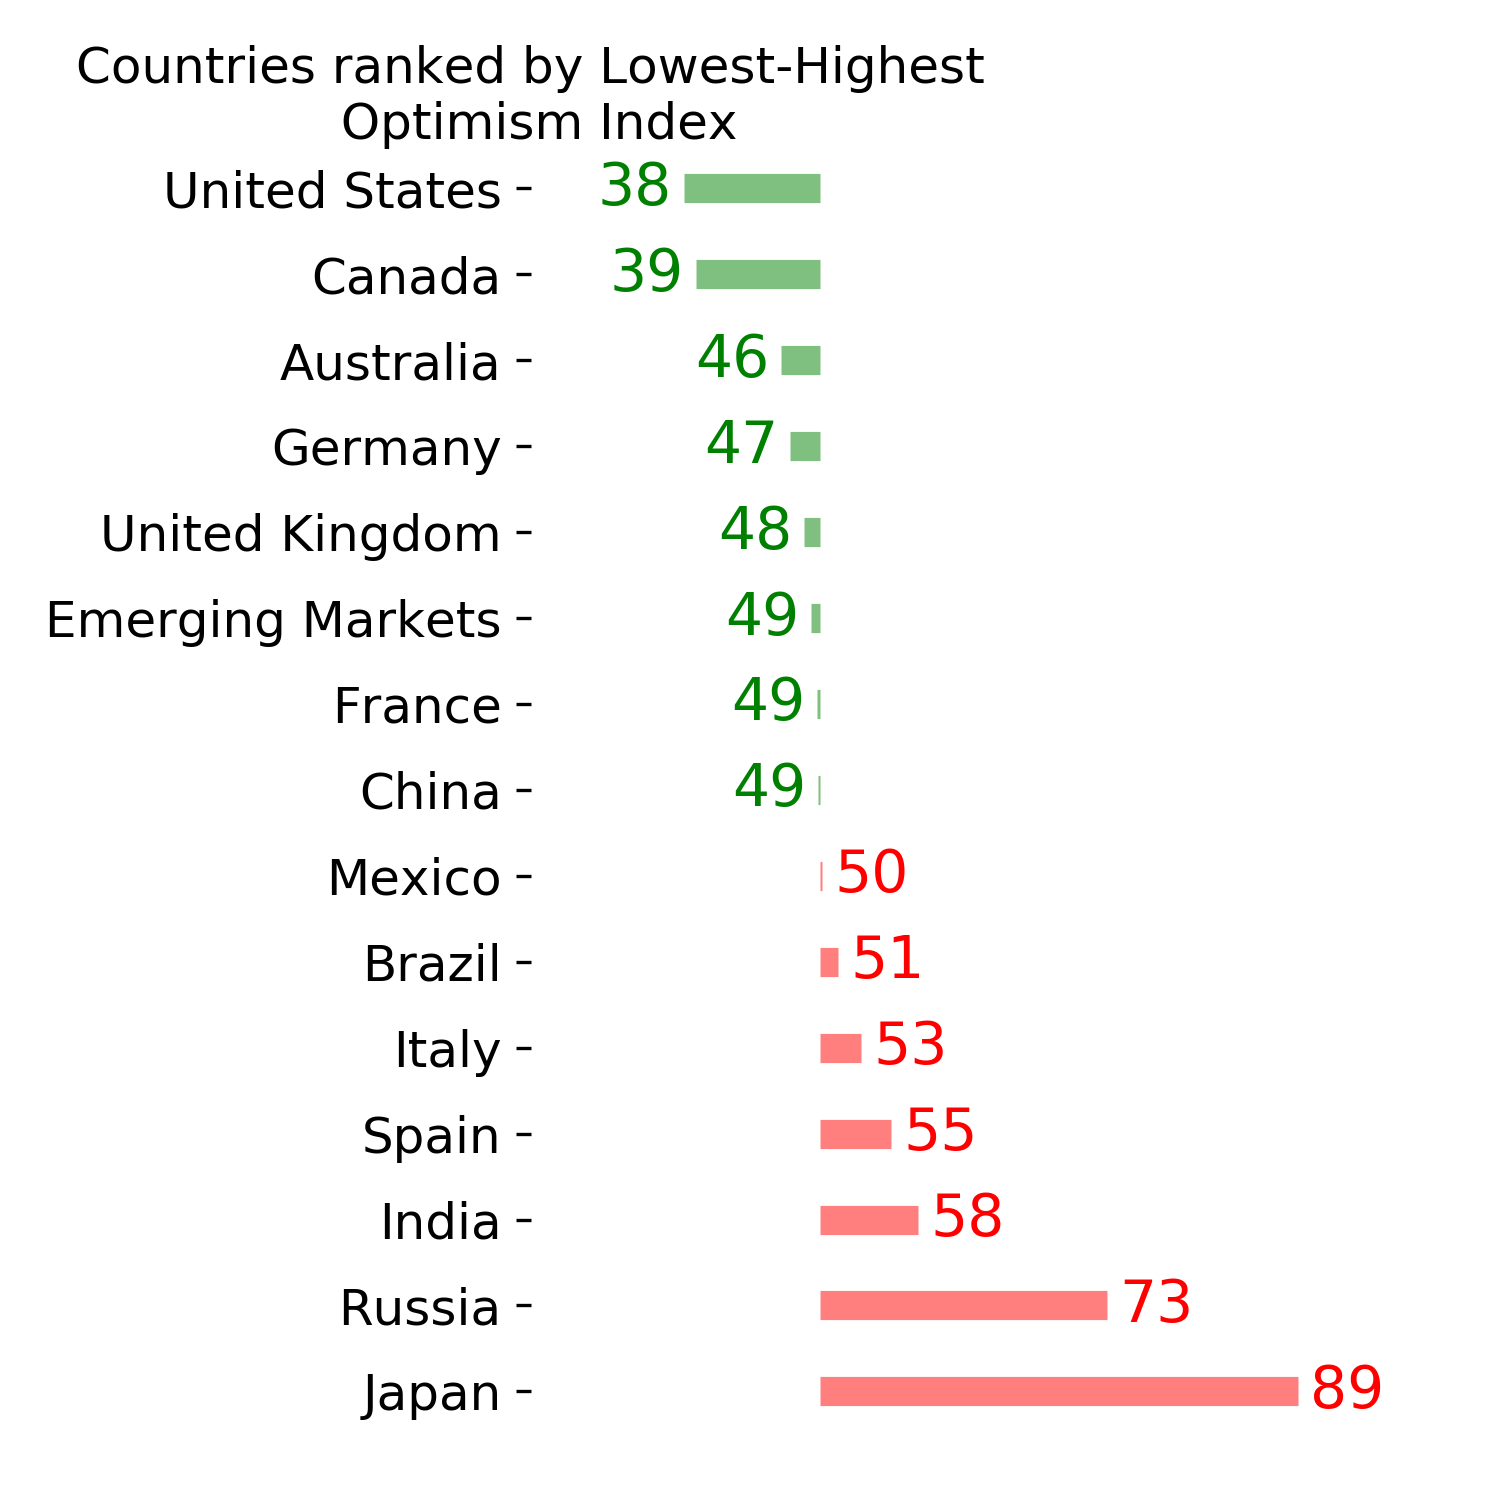
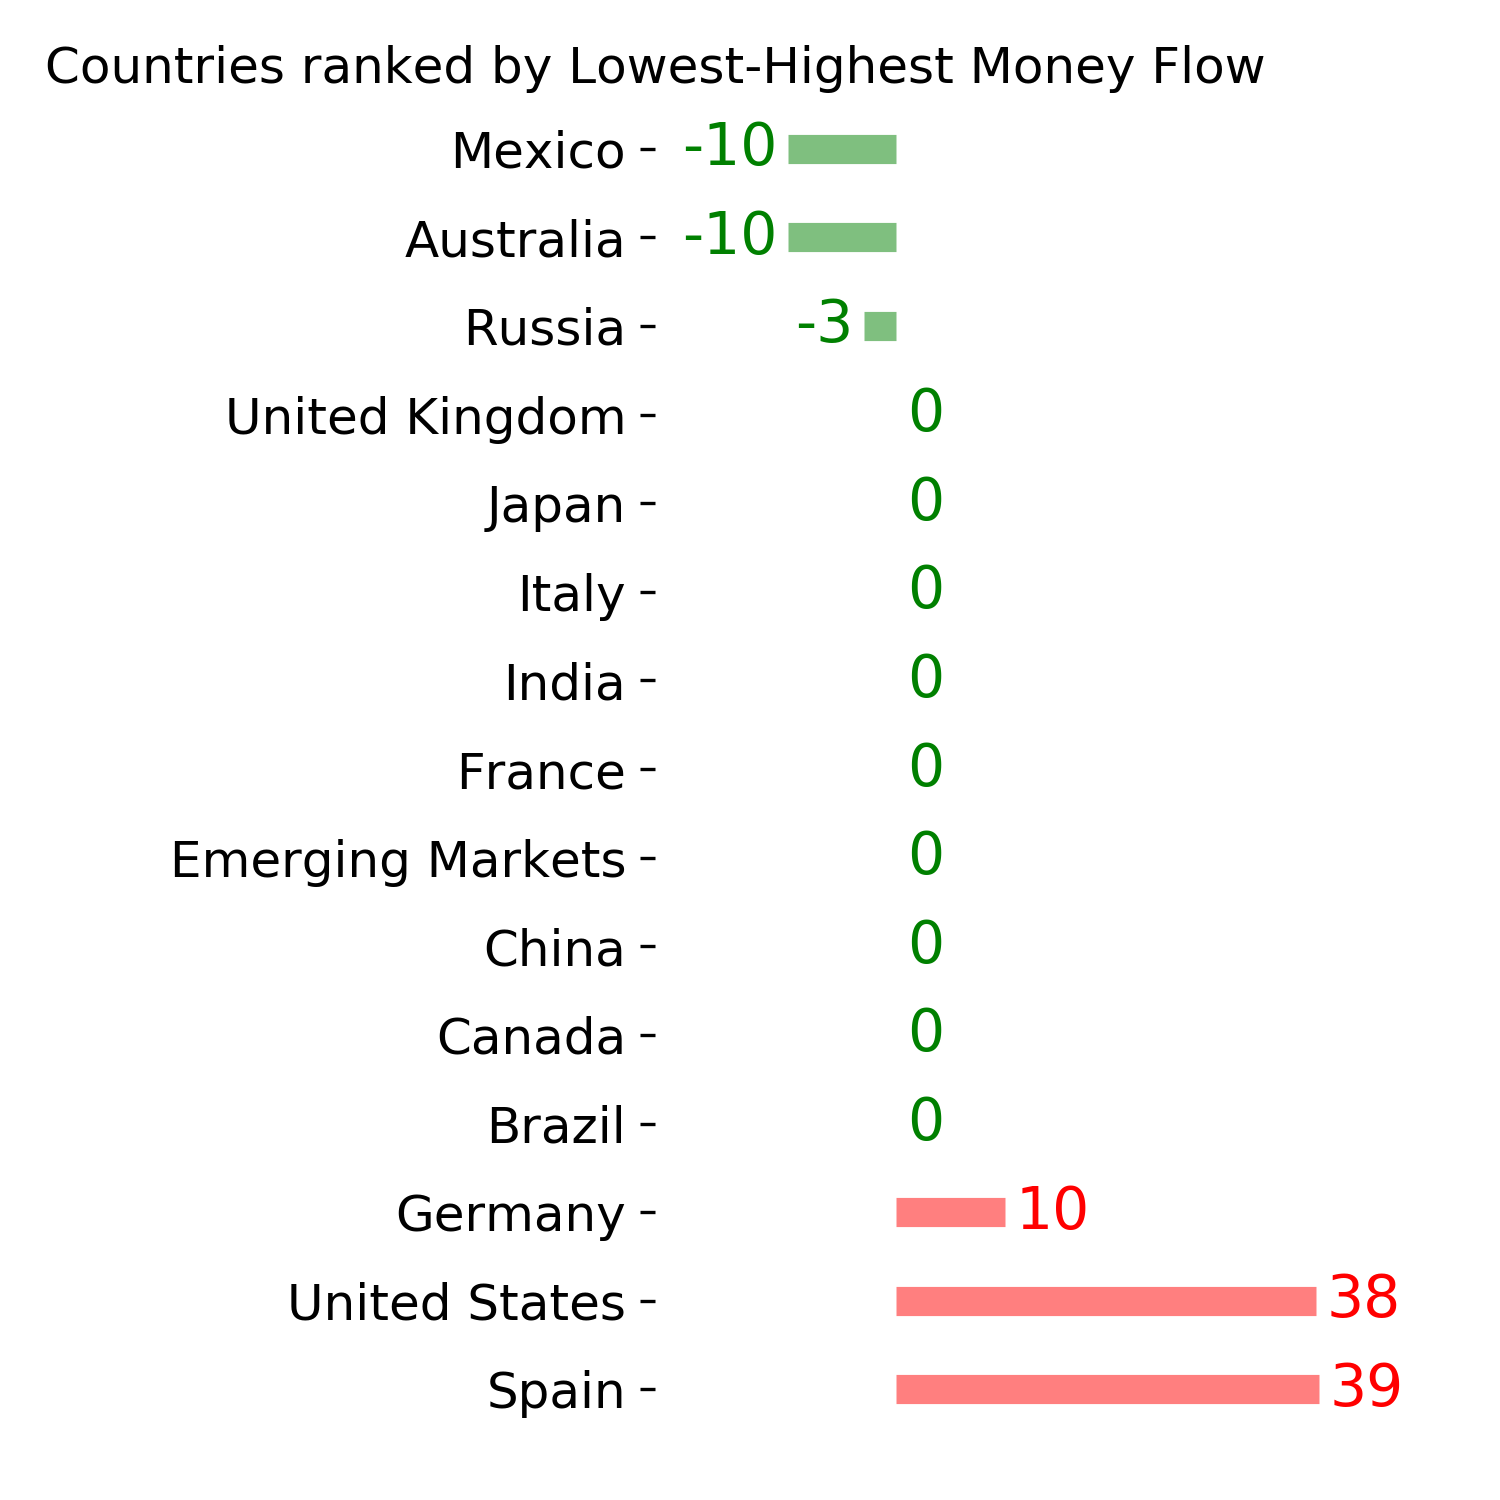
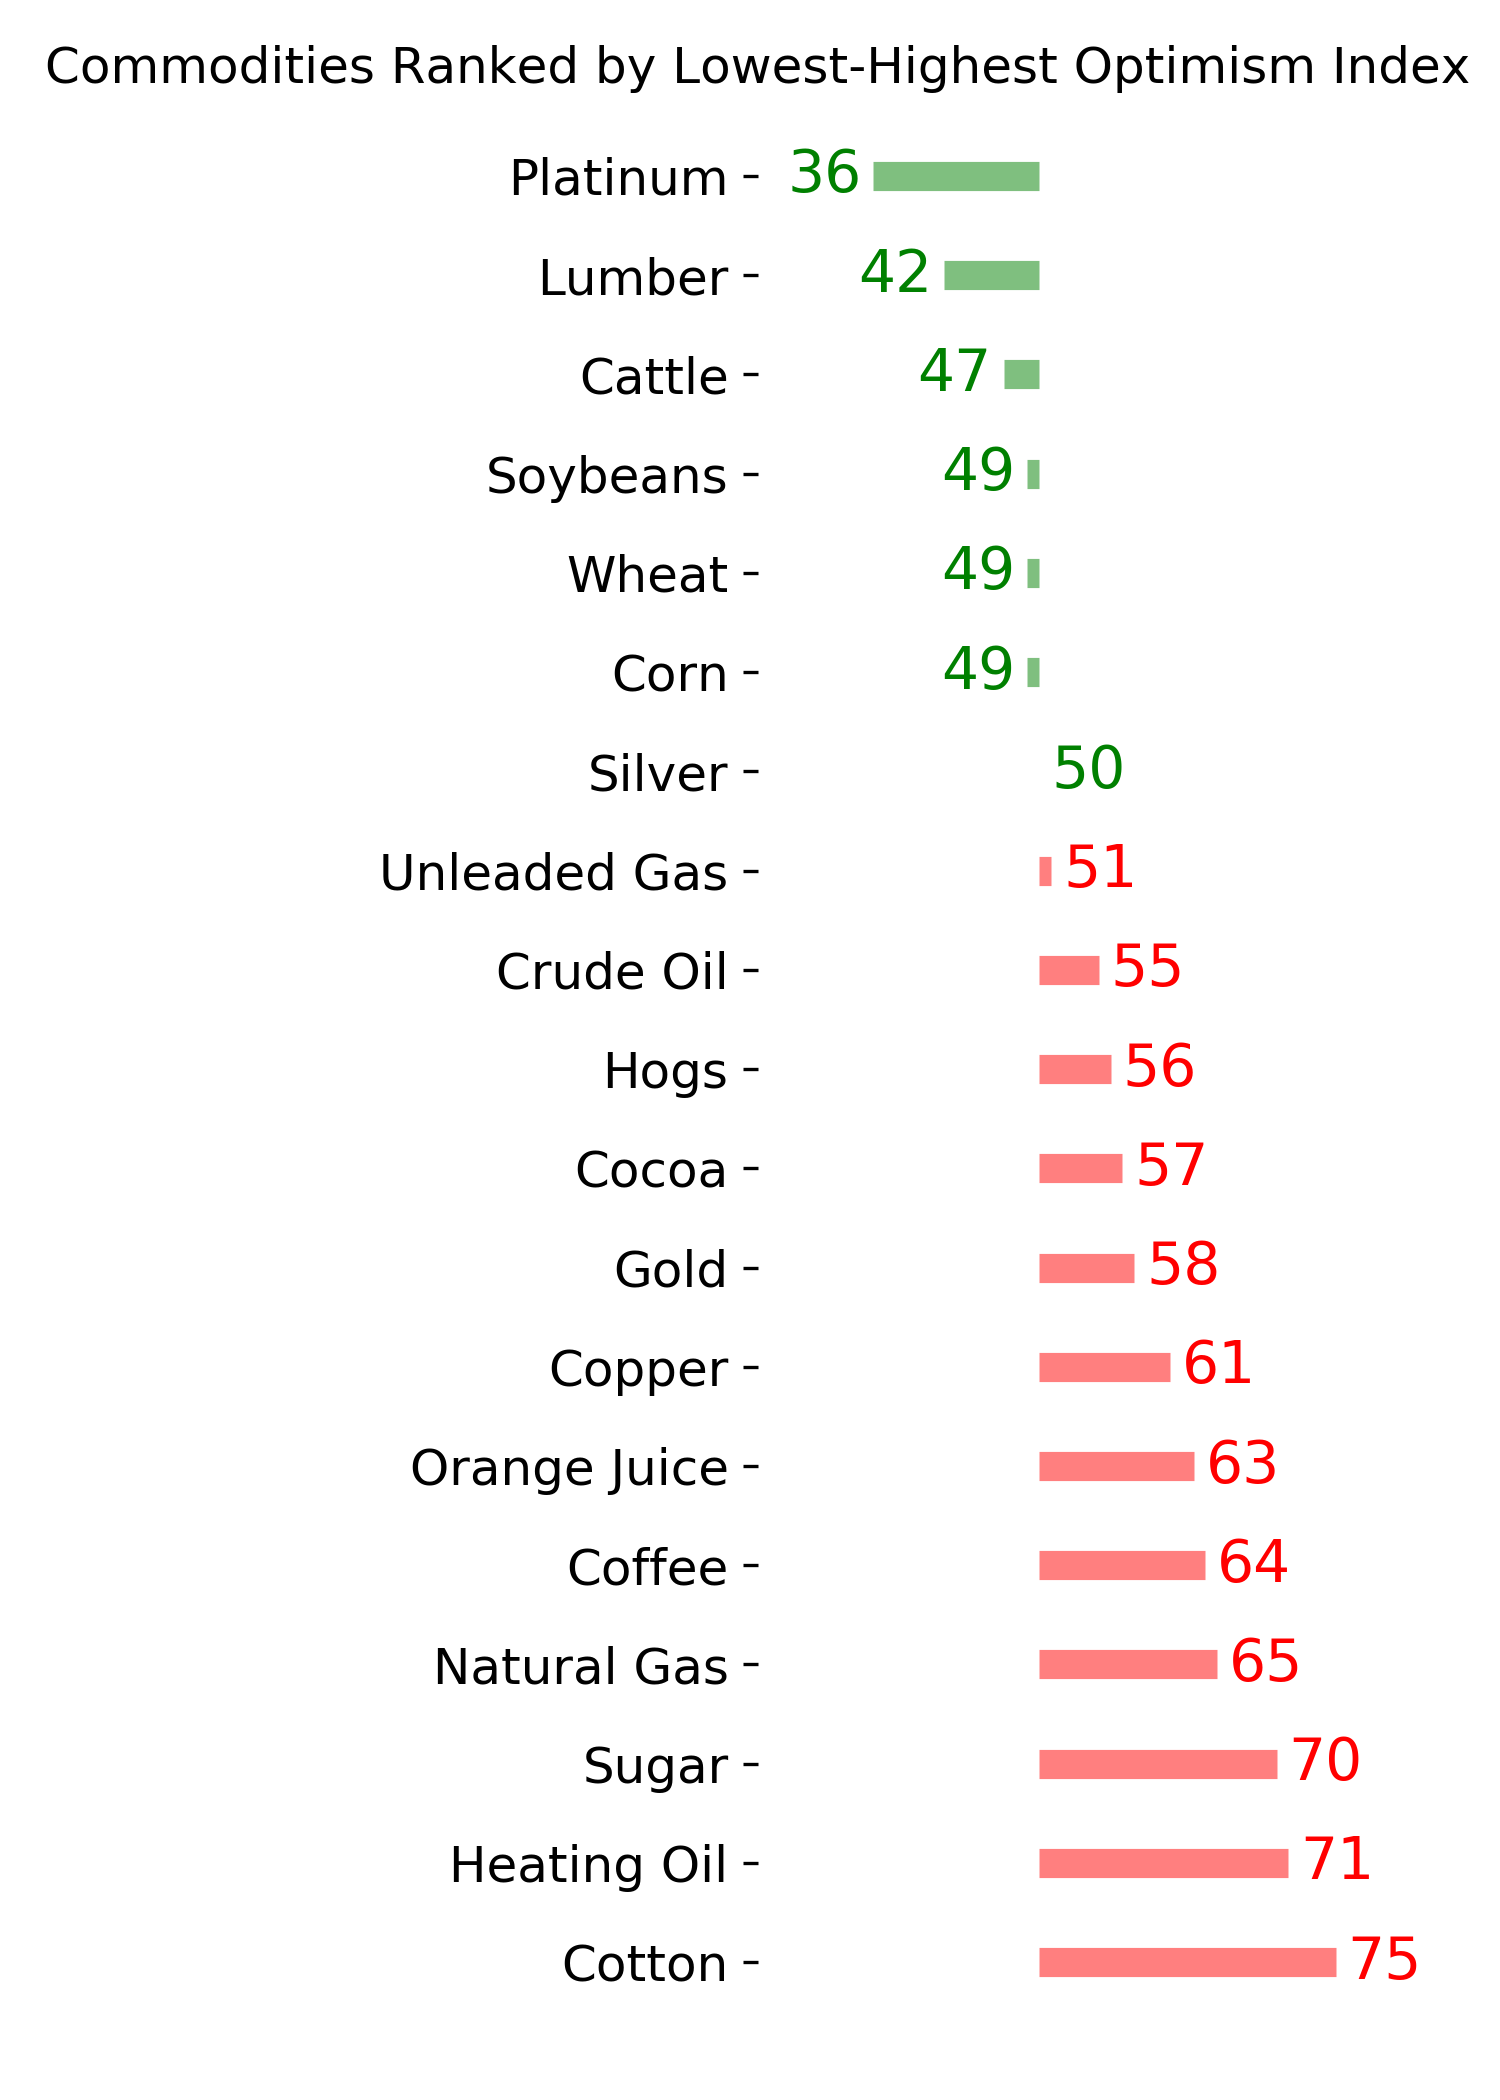
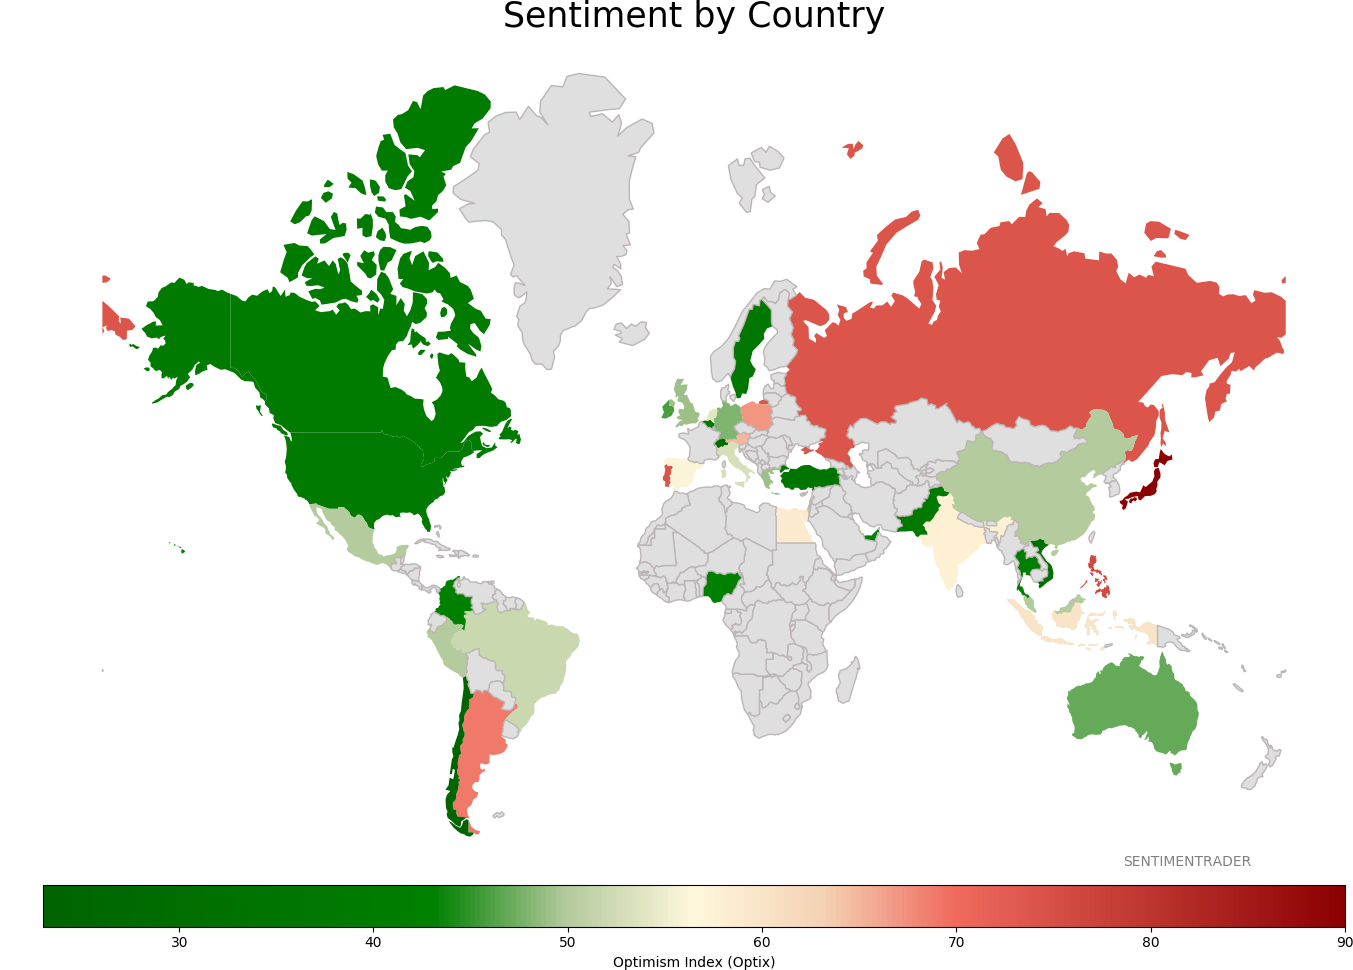
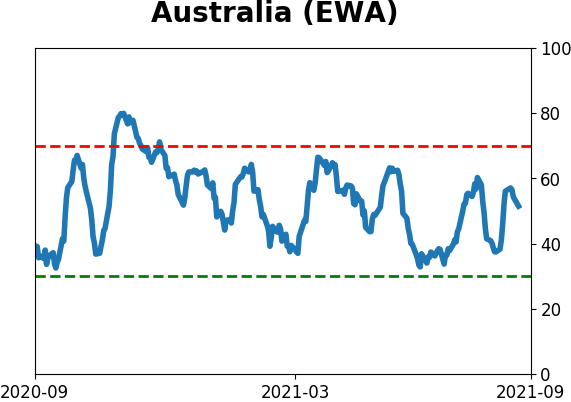
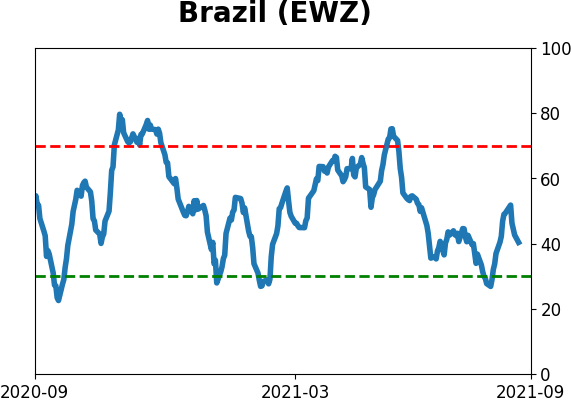
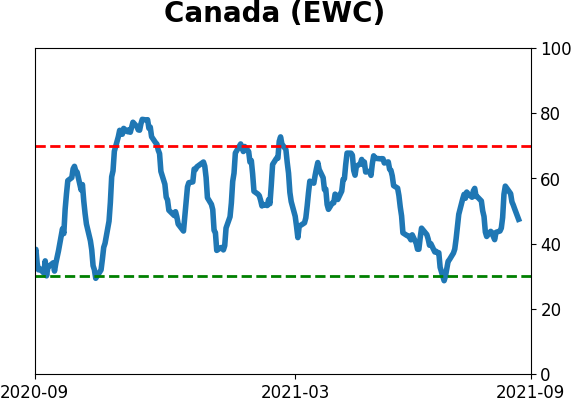
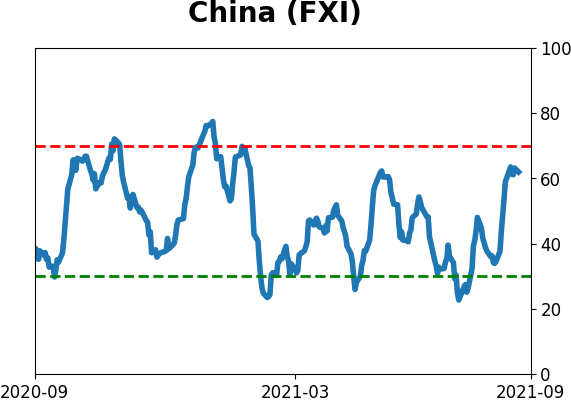
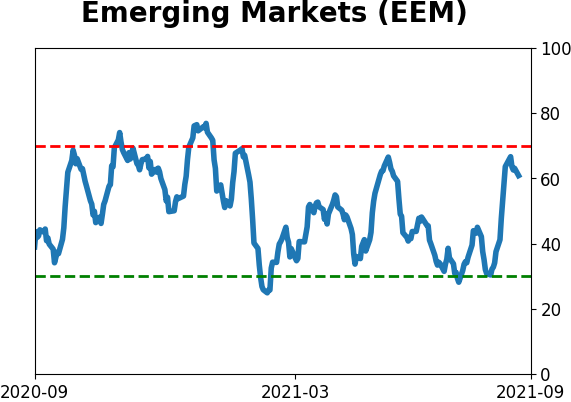
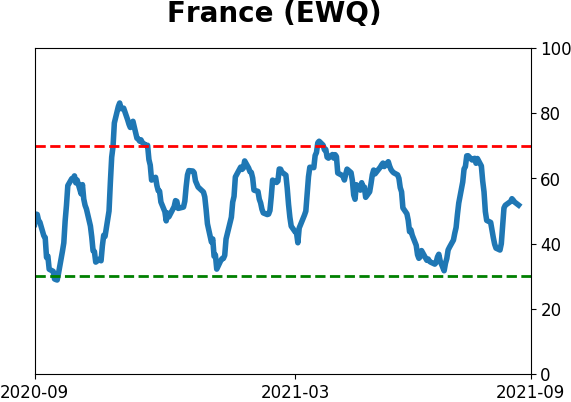
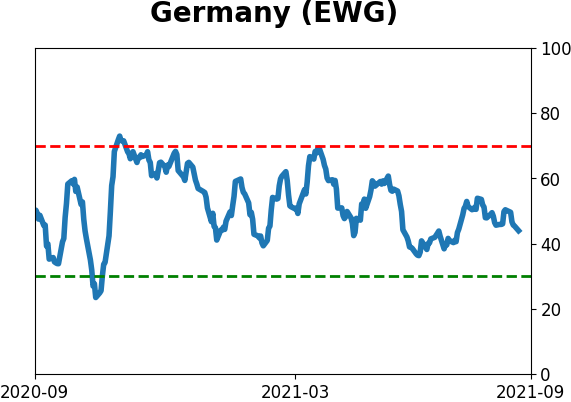
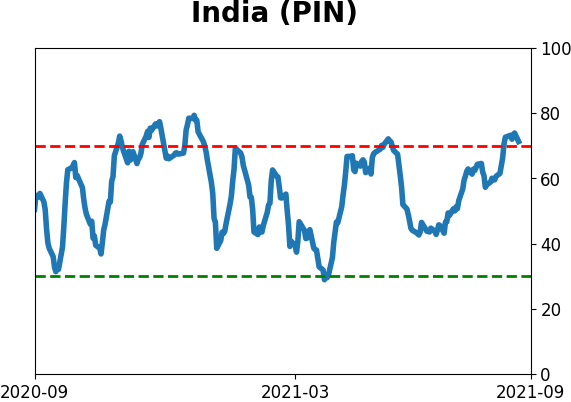
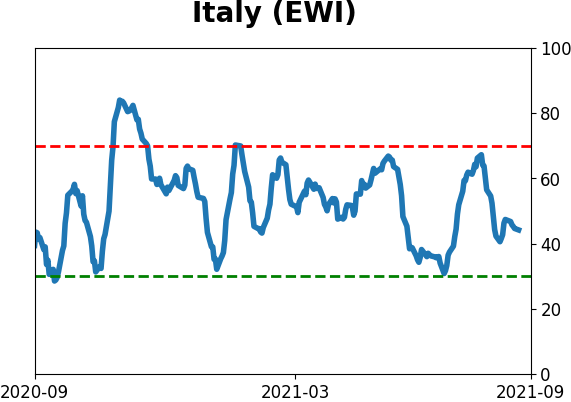
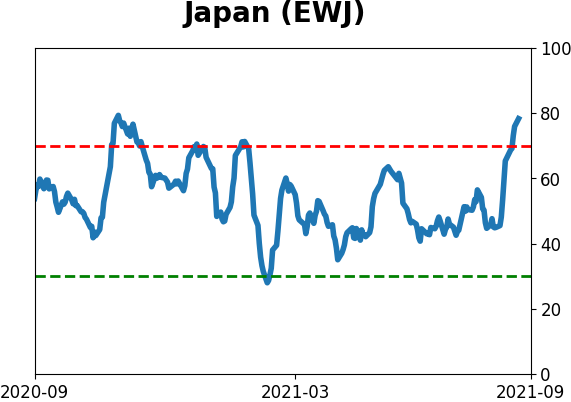
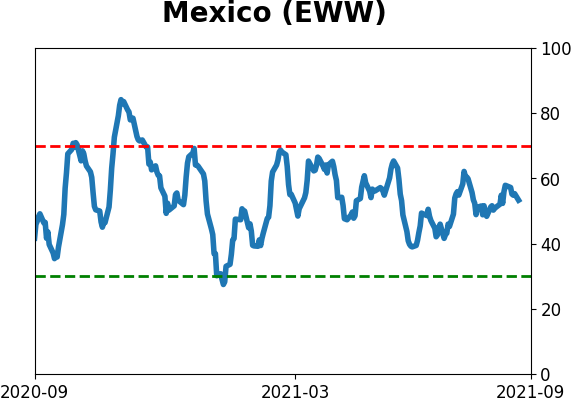
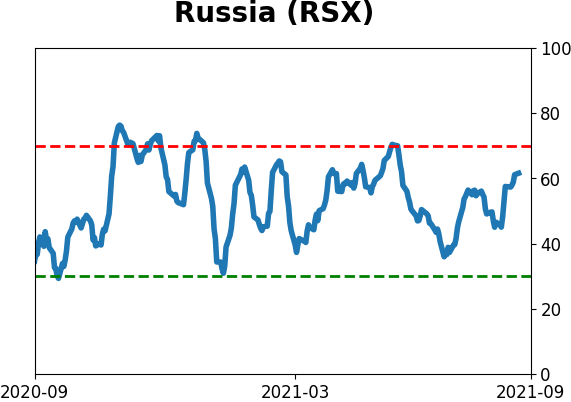
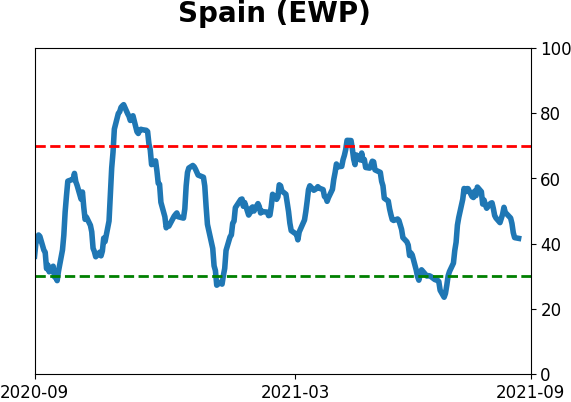
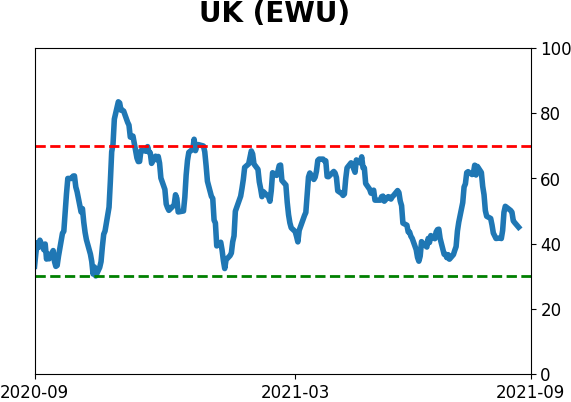
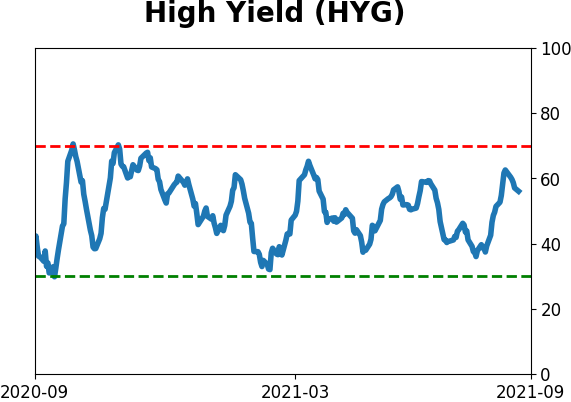
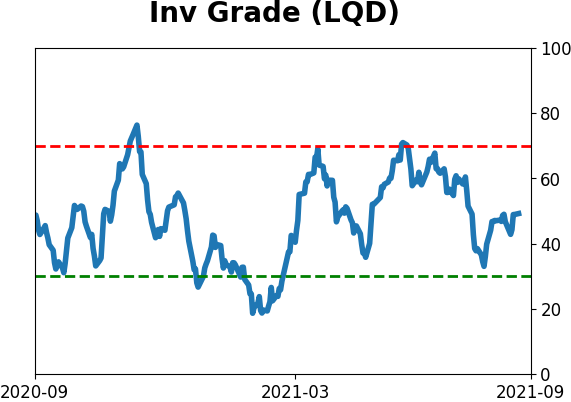
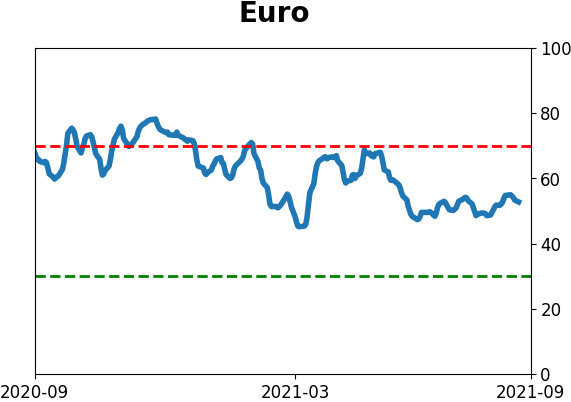
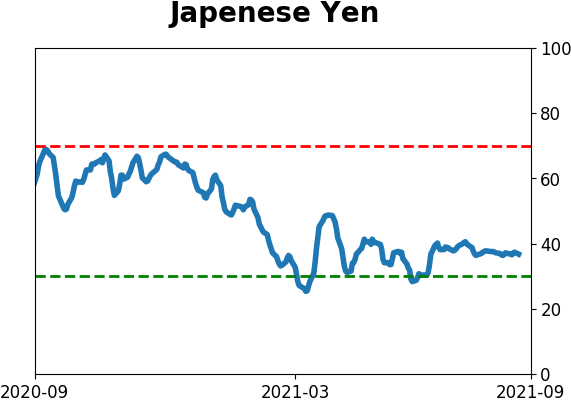
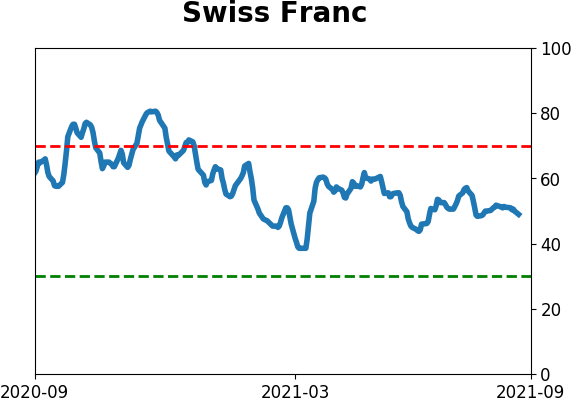
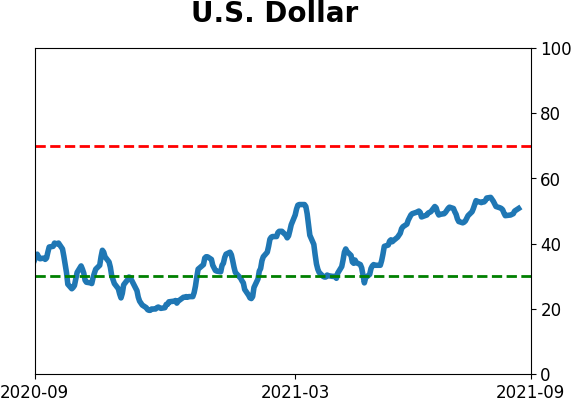
Sentiment Around The World
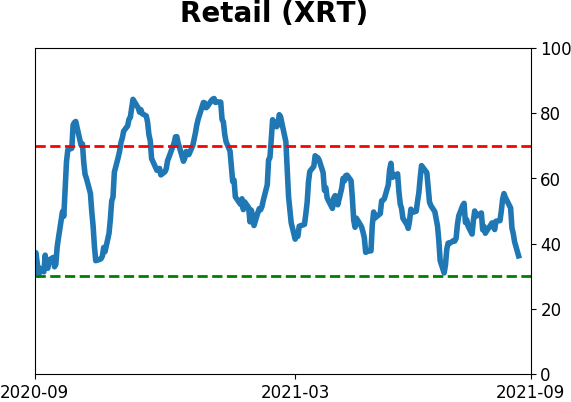
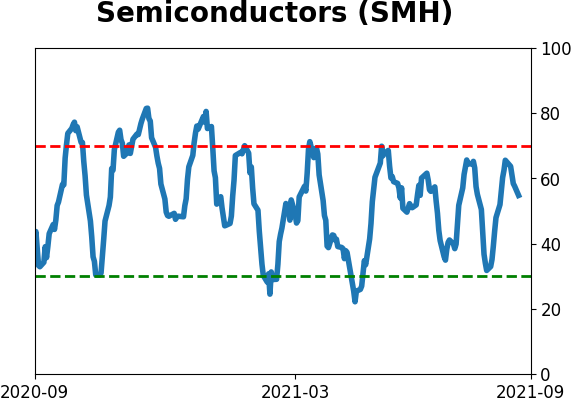
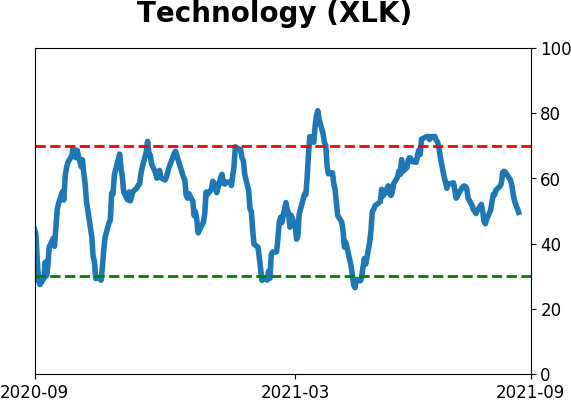
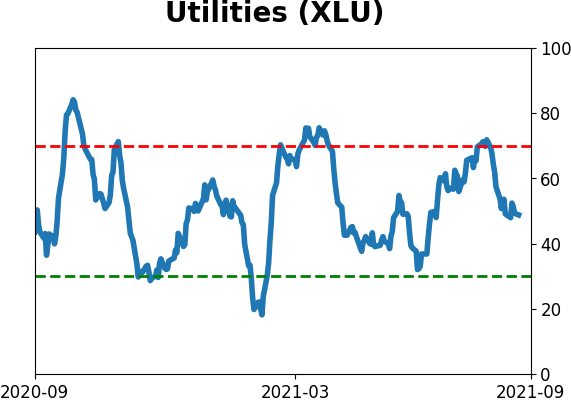
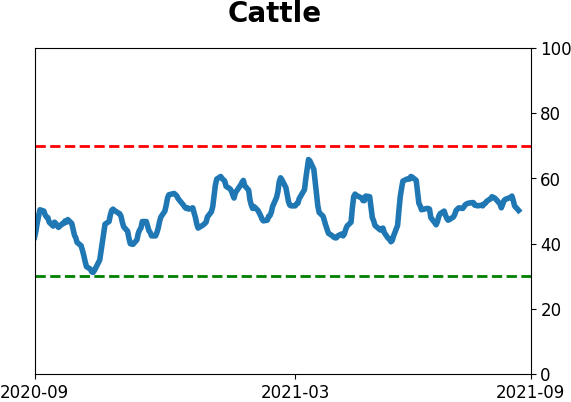
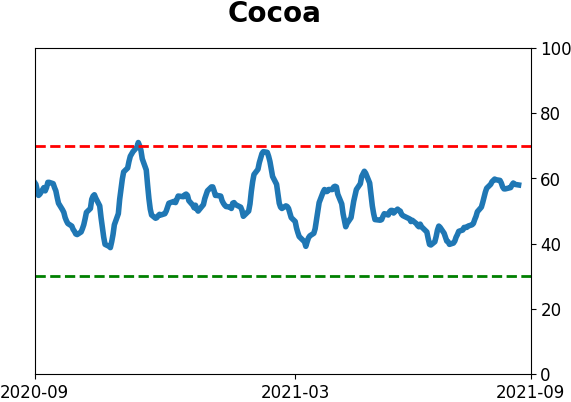
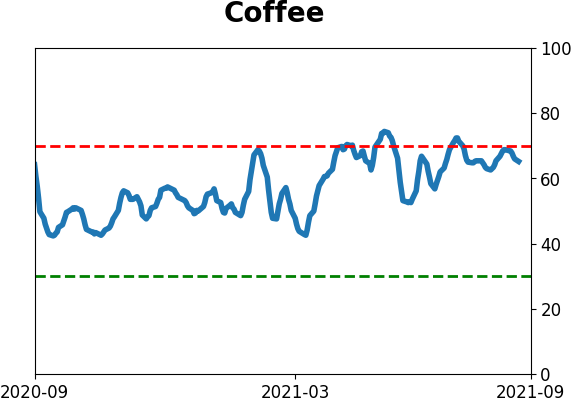
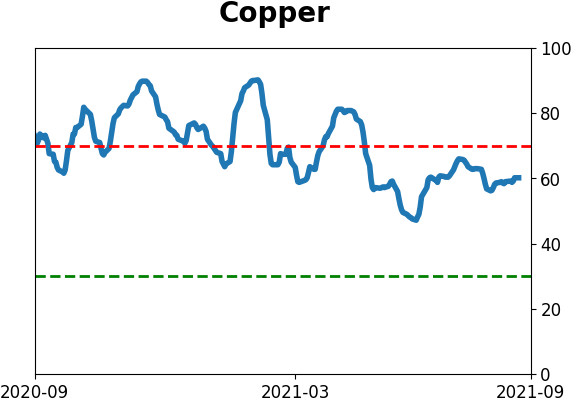
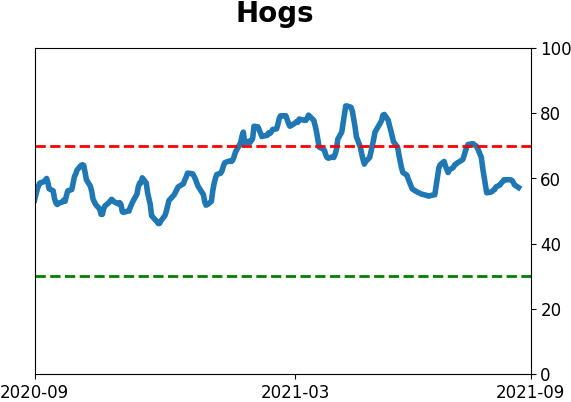
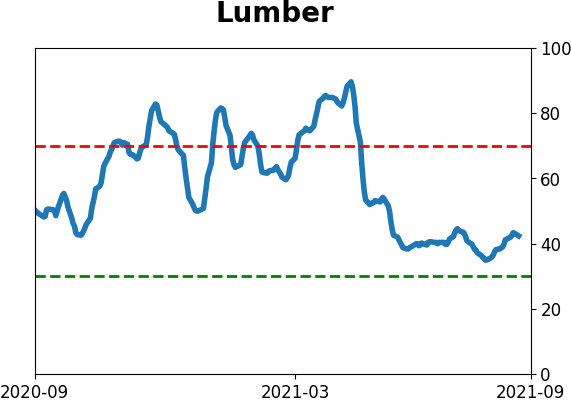
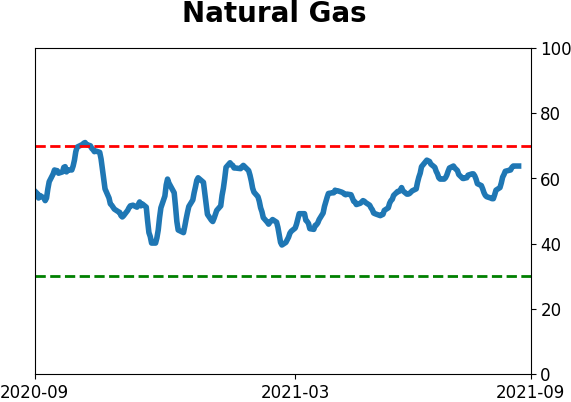
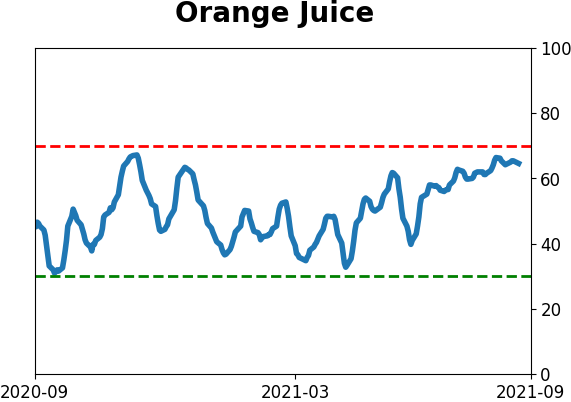
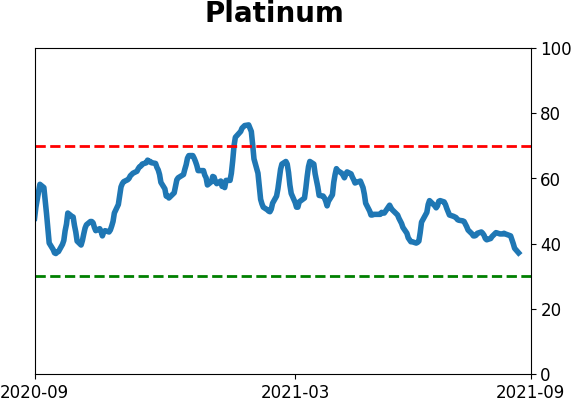
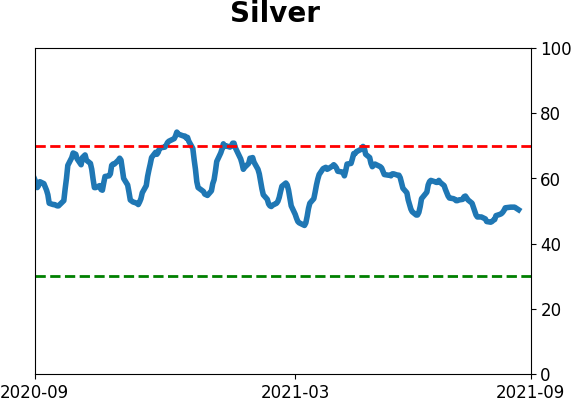
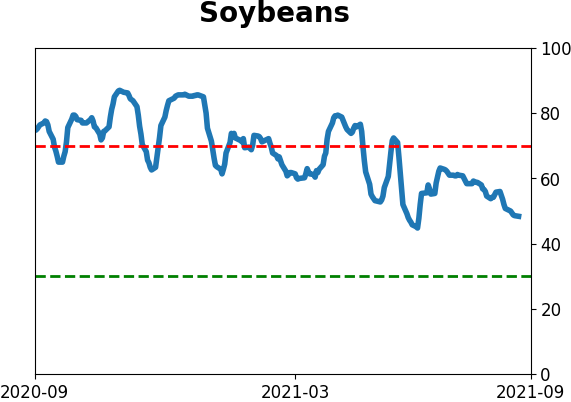
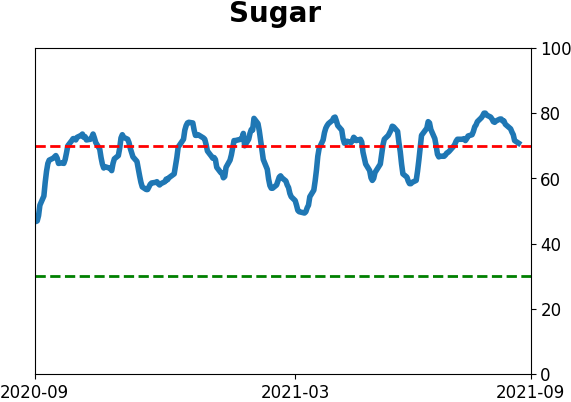
Optimism Index Thumbnails
|
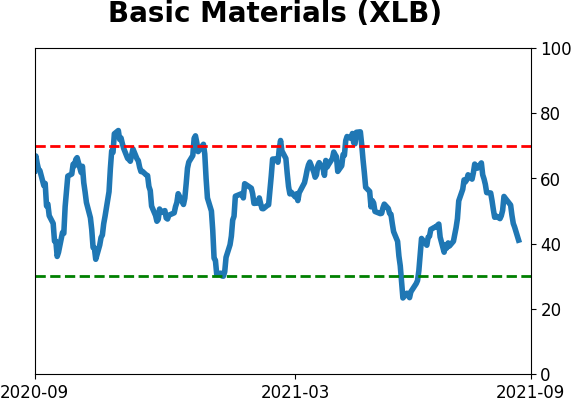
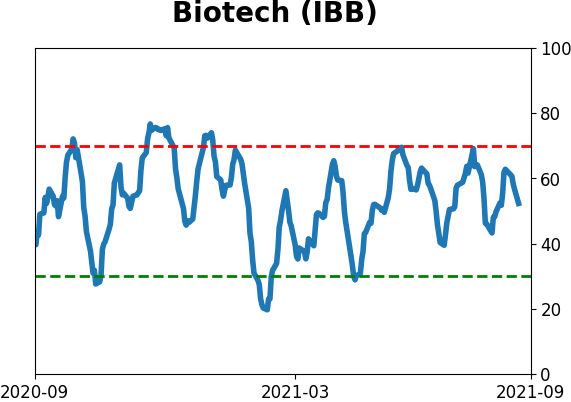
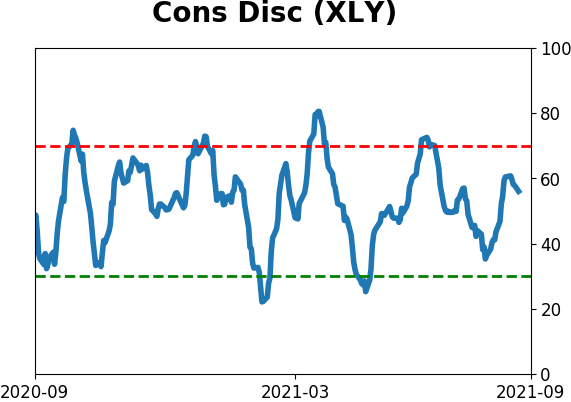
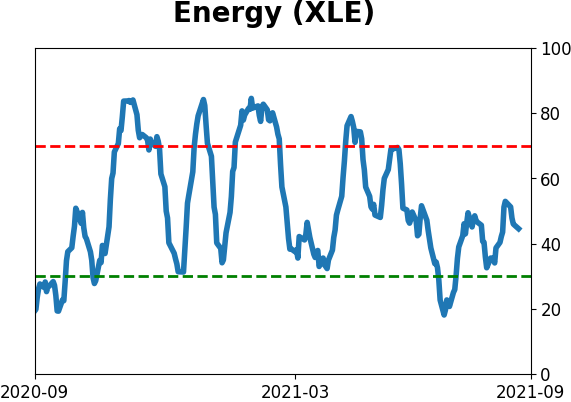
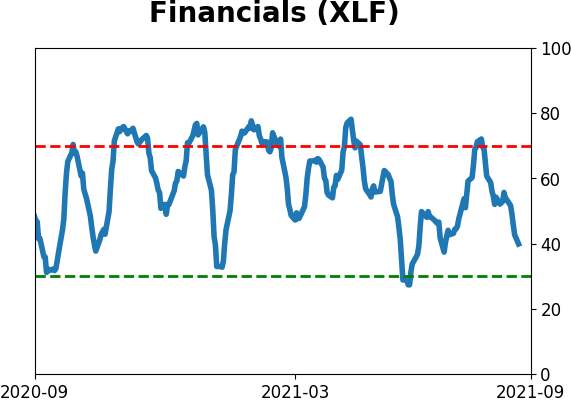
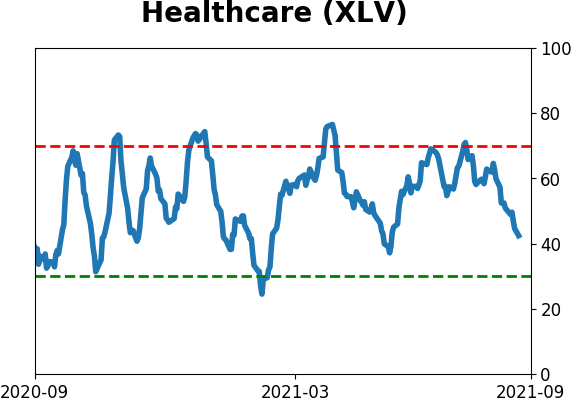
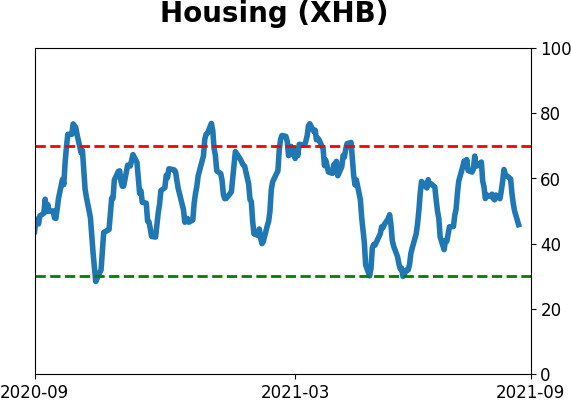
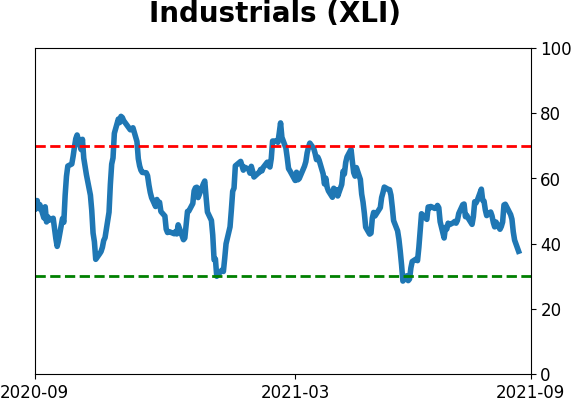
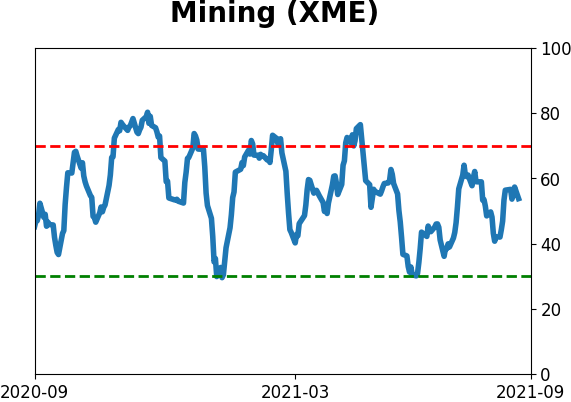
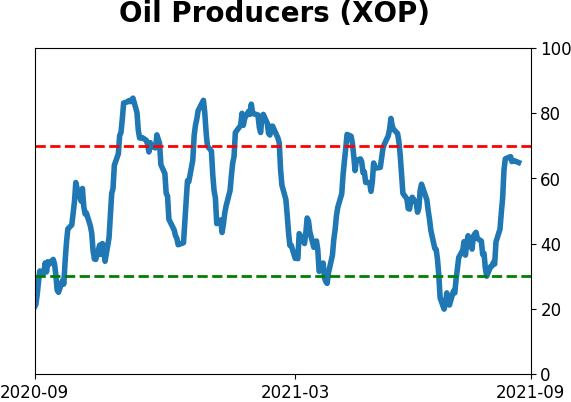
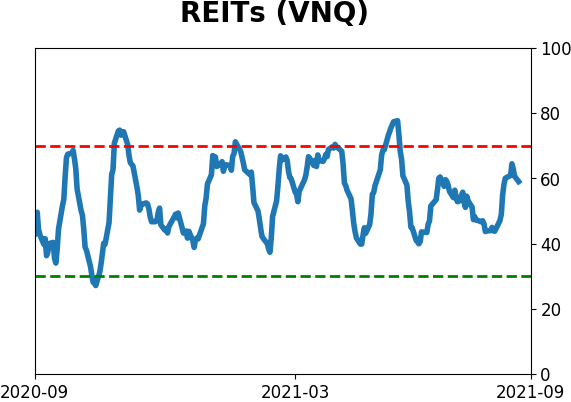
Sector ETF's - 10-Day Moving Average
|
|
|
Country ETF's - 10-Day Moving Average
|
|
|
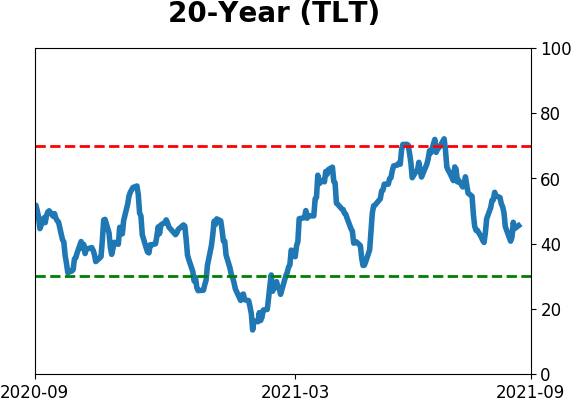
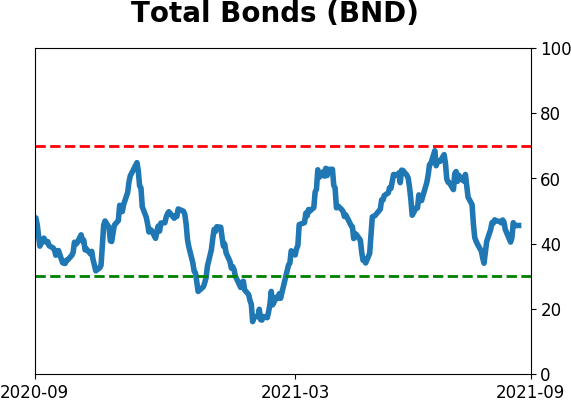
Bond ETF's - 10-Day Moving Average
|
|
|
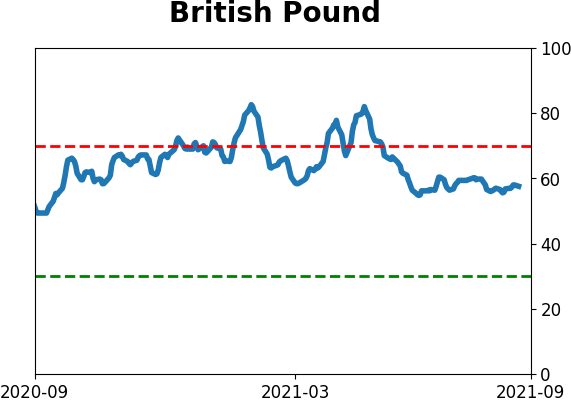
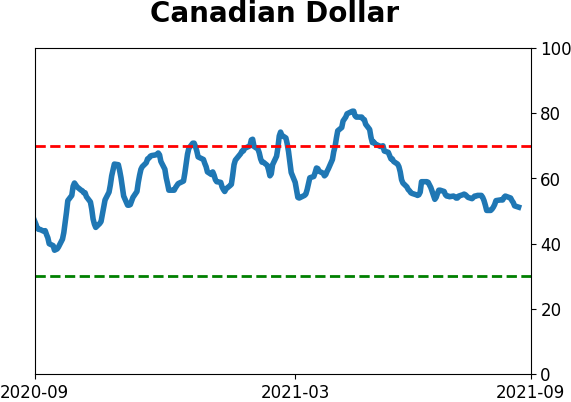
Currency ETF's - 5-Day Moving Average
|
|
|
Commodity ETF's - 5-Day Moving Average
|
|