Headlines
|
|
Once more unto the breach:
At the end of last week, buyers showed a sense of eagerness that had only been witnessed one other time in 5 years, at the end of the March 2020 bear market. Historically, 3-day runs like we saw last week have preceded long-term gains every time, or close to it. The same goes for when there is a quick cycle in stocks trading above their 10-day moving average.
|
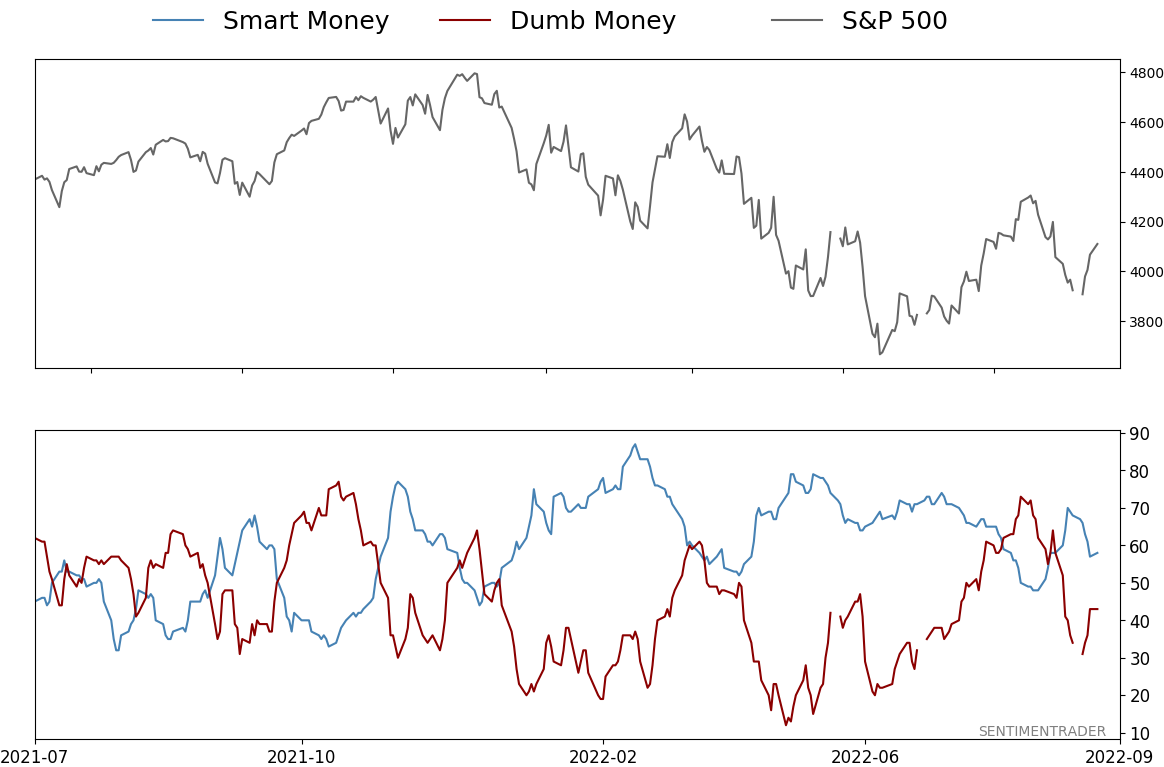
Smart / Dumb Money Confidence
|
Smart Money Confidence: 58%
Dumb Money Confidence: 43%
|
|
Risk Levels
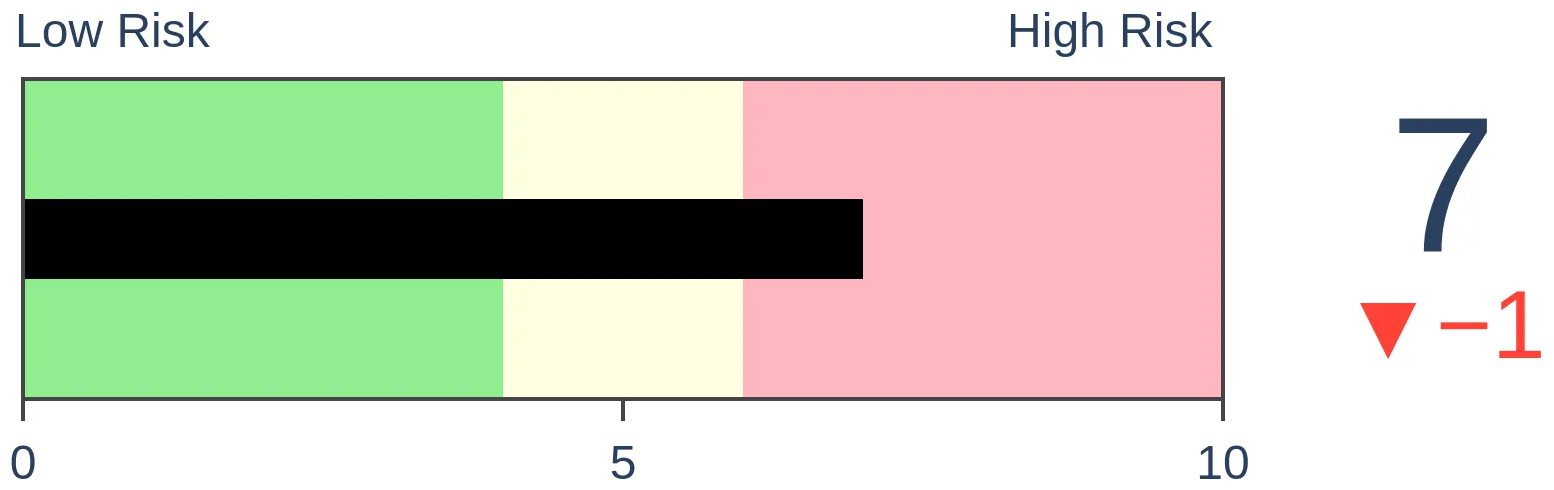
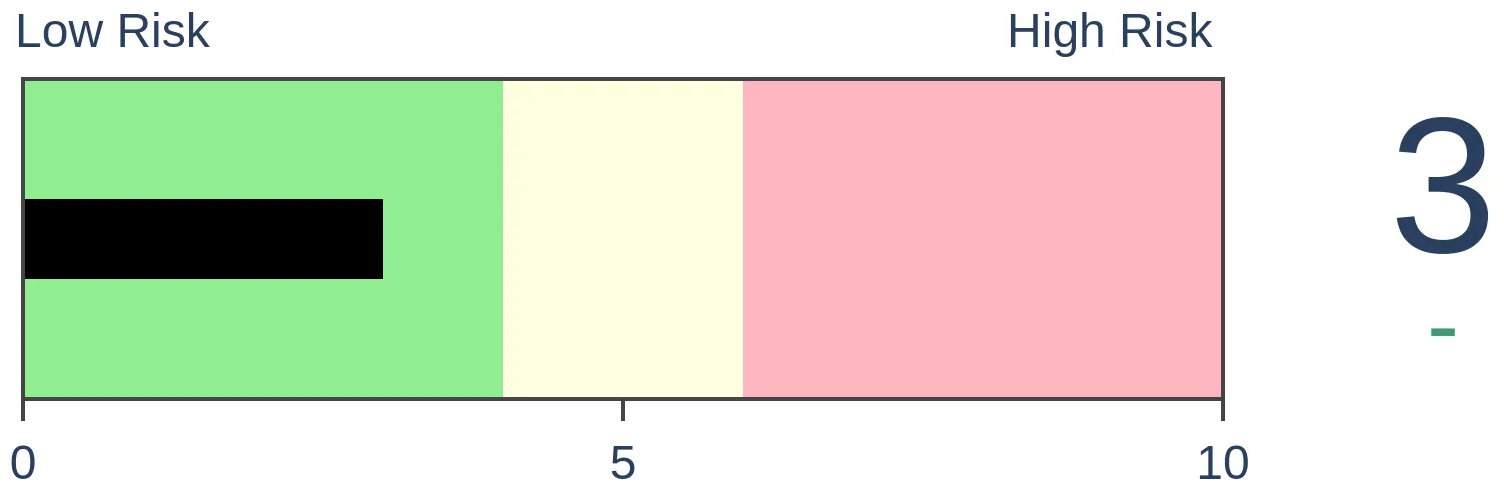
Stocks Short-Term
|
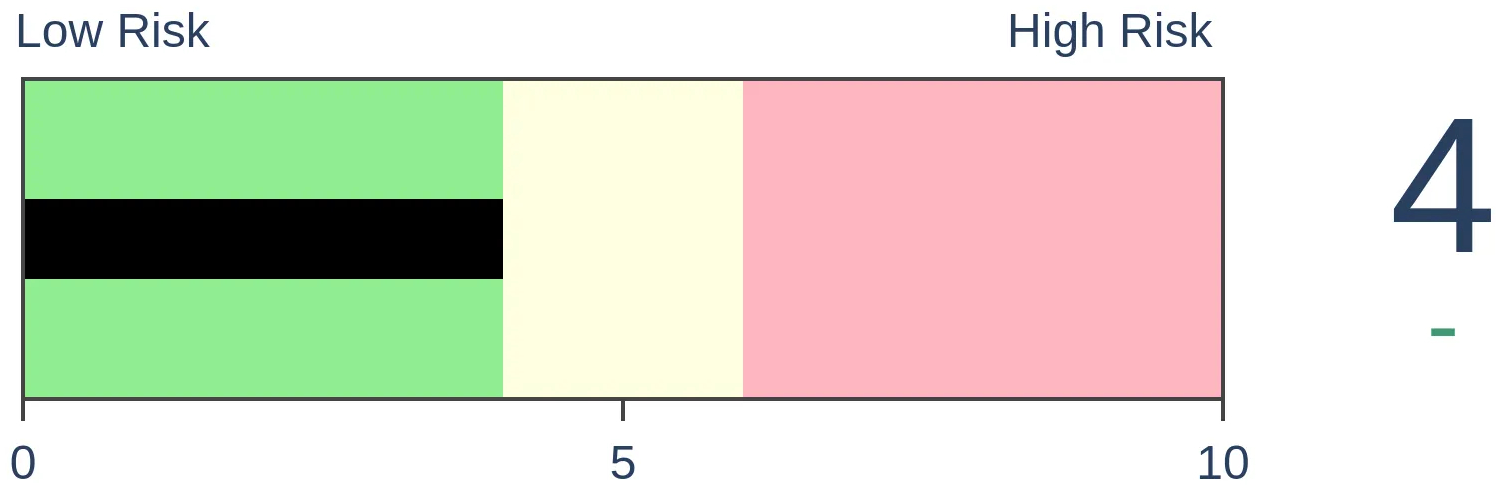
Stocks Medium-Term
|
|
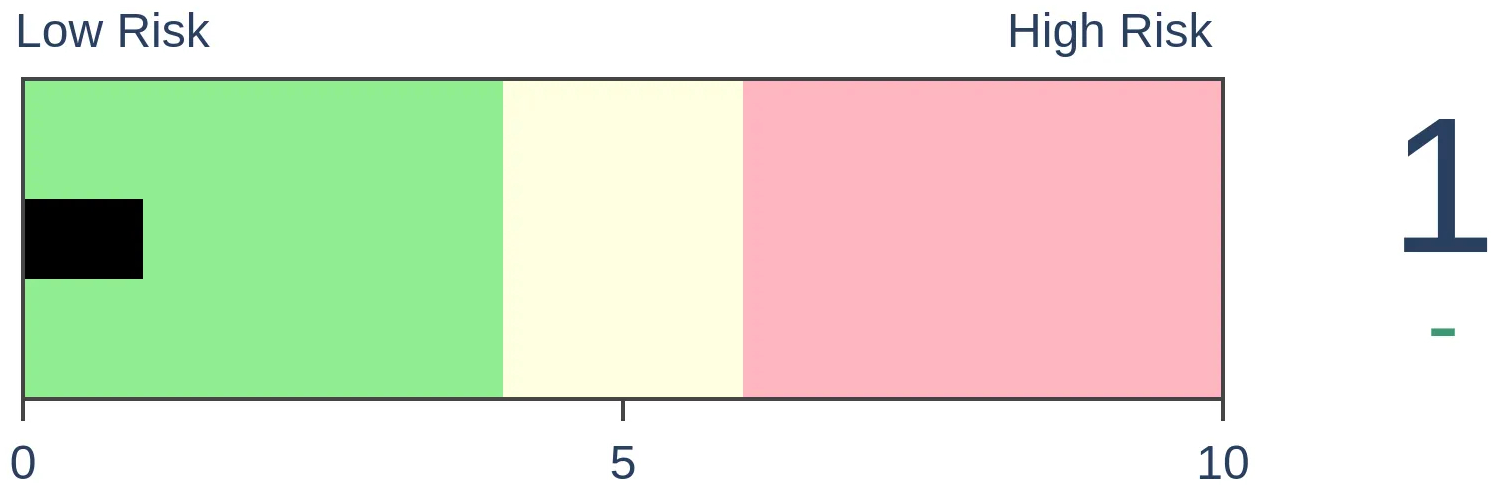
Bonds
|
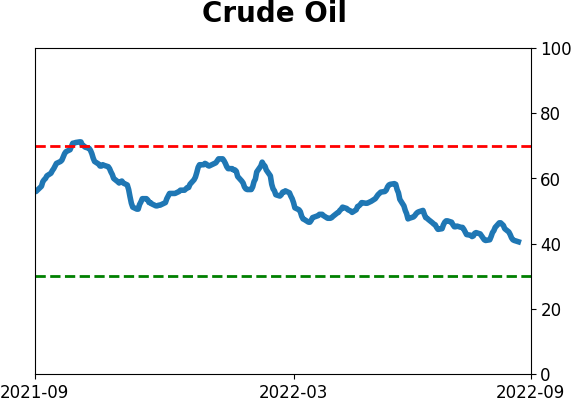
Crude Oil

|
|
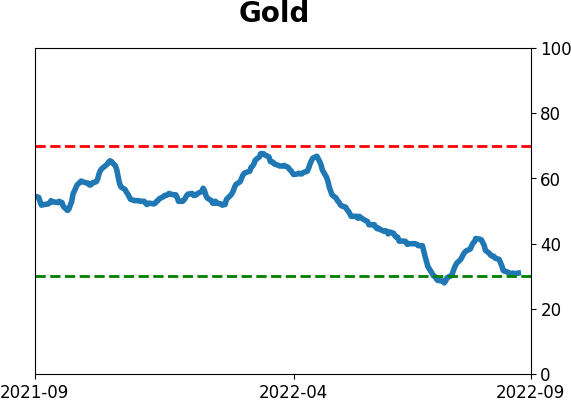
Gold
|
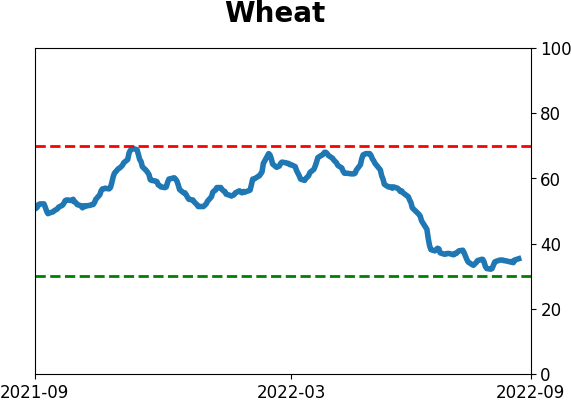
Agriculture

|
|
Research
By Jason Goepfert
BOTTOM LINE
At the end of last week, buyers showed a sense of eagerness that had only been witnessed one other time in 5 years, at the end of the March 2020 bear market. Historically, 3-day runs like we saw last week have preceded long-term gains every time, or close to it. The same goes for when there is a quick cycle in stocks trading above their 10-day moving average.
FORECAST / TIMEFRAME
SPY -- Up, Long-Term
|
Key points:
- Over the past 3 sessions, a historic number of S&P 500 stocks advanced
- Similar bouts of eager buying preceded long-term gains every time (or close to it)
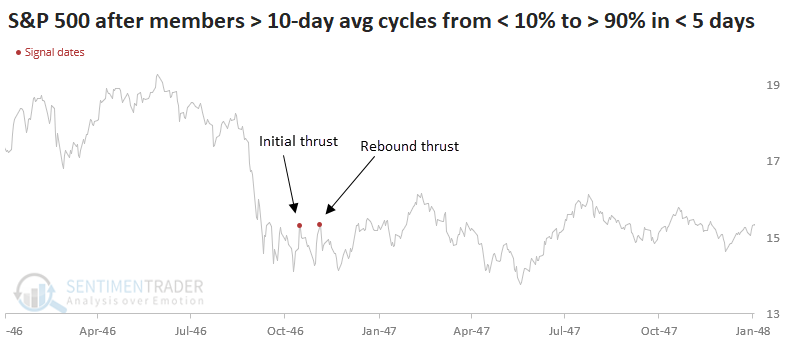
- This follows what had been a prior thrust and reset
A historic level of buying interest
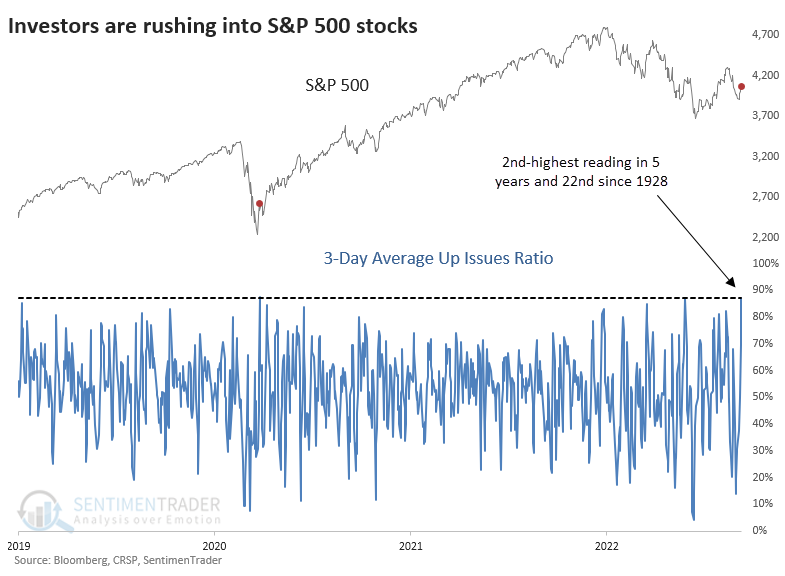
Once again, investors just can't get enough of stocks.
Over the past three sessions, an average of more than 87% of S&P 500 stocks have advanced. That's the 2nd-highest rate in six years, barely eked out by March 26, 2020.
Even going back to 1928, the current reading ranks 22nd, or in the top 0.1% of all days.
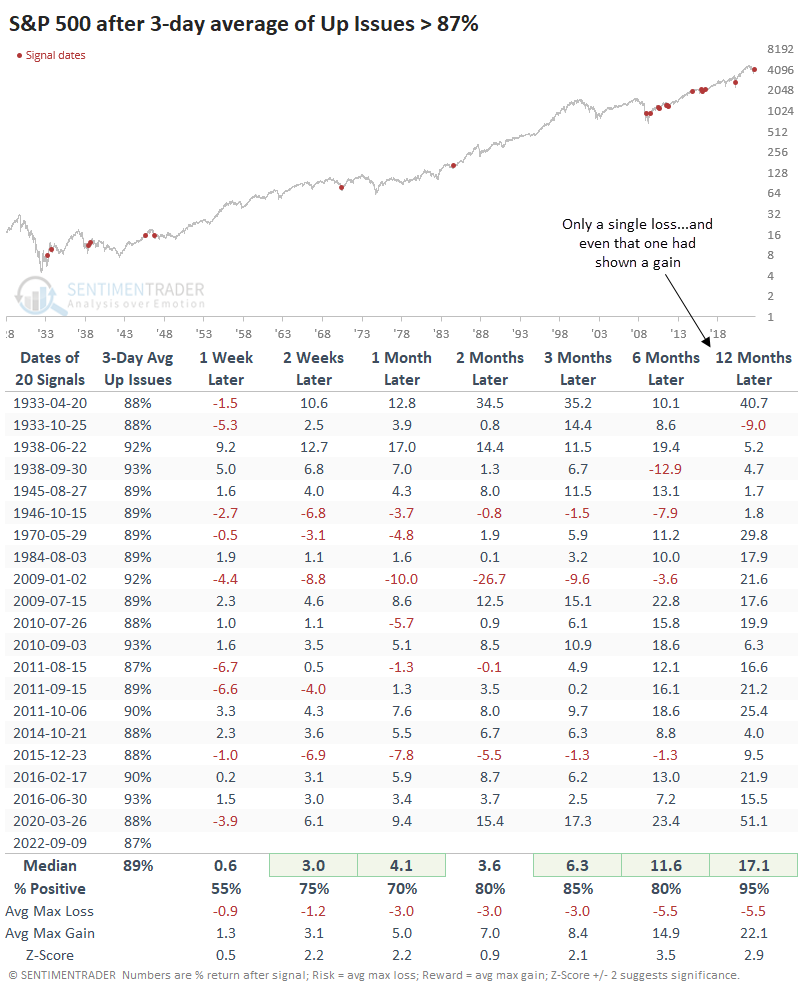
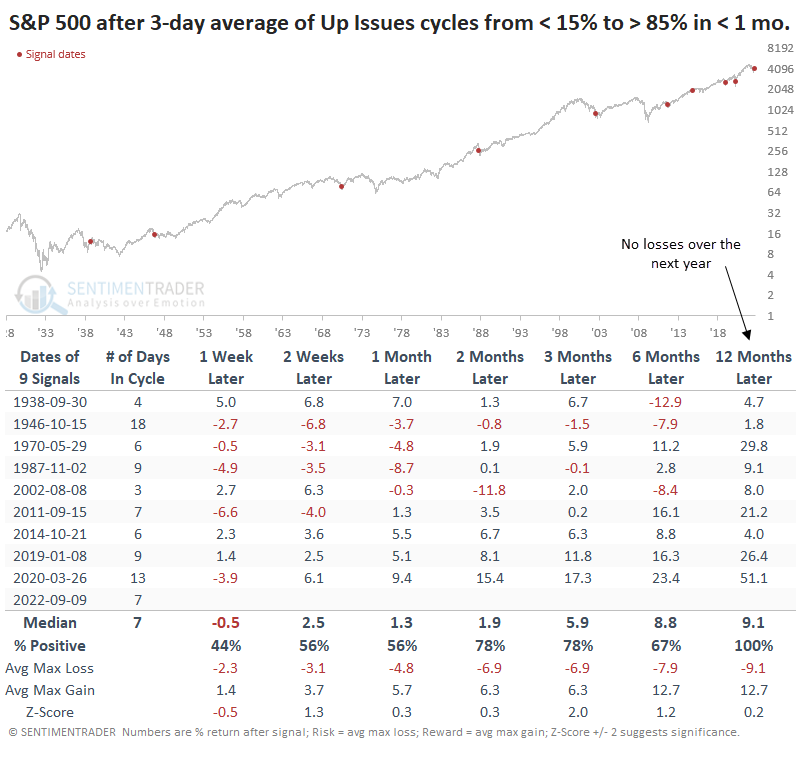
Since inception, there have been twenty unique times when the 3-day ratio of Up Issues in the S&P exceeded 87%. All but one of those dates witnessed the S&P rising over the next year. Even that one, in 1933, had shown a double-digit gain in the months prior.
Thrusts with no selling in between
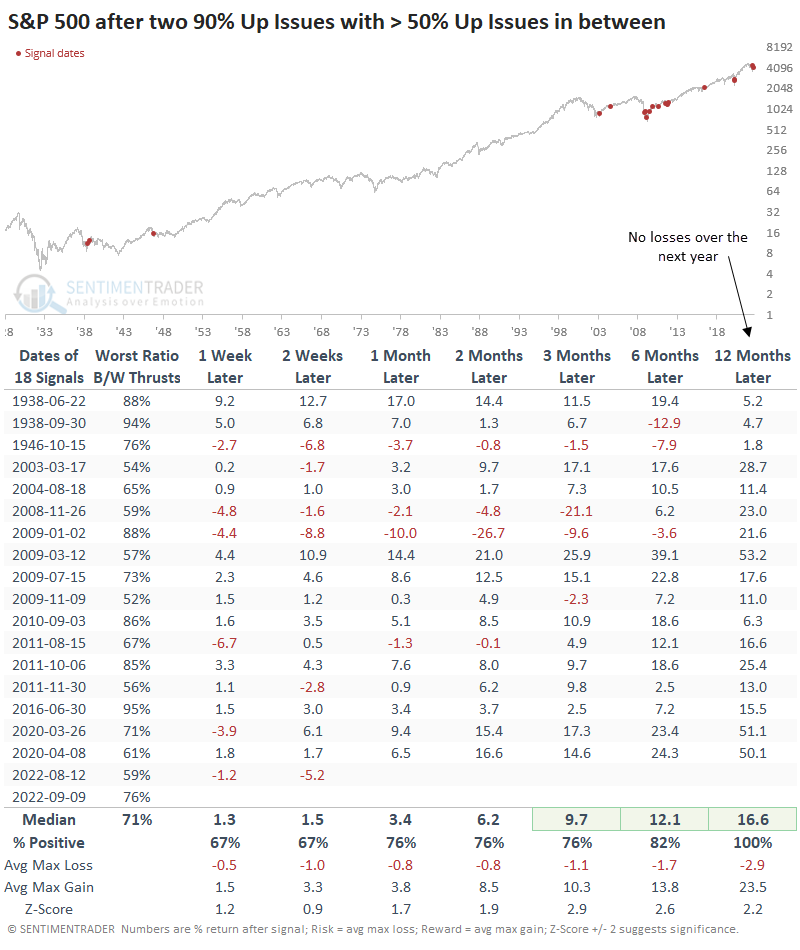
Perhaps even more remarkable is that more than 90% of stocks rose during two out of the past three sessions, and the intervening session on Thursday didn't see net selling pressure. Meaning that even when investors took a break, more stocks advanced than declined.
After similar behavior, the S&P never declined during the following year. As we've discussed many times, breadth statistics have become more volatile over the past twenty years, so most of the instances have occurred recently.
Also notable is the quick cycle between extreme selling and buying pressure. In less than a month, the 3-day Up Issues Ratio for the S&P cycled from below 15% to above 85%. Again, that preceded gains over the next year.
Short-term uptrends have surged again
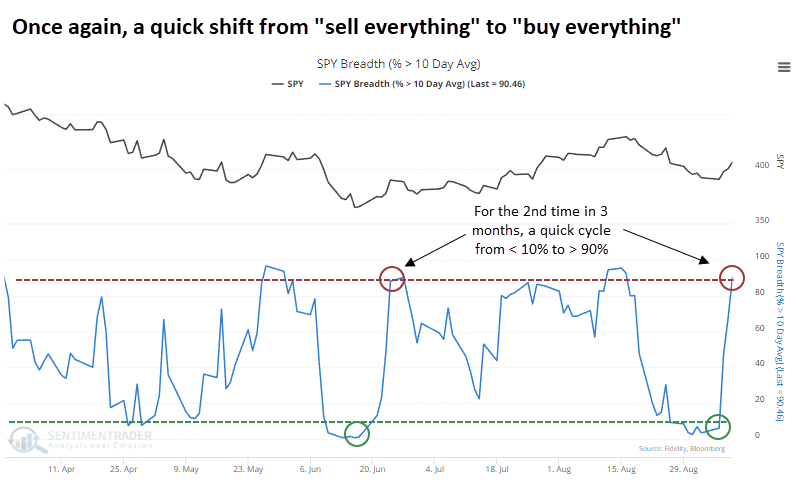
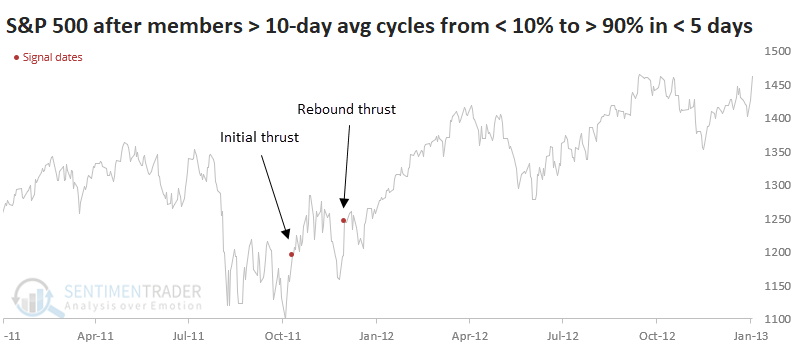
Thanks to the frenetic buying pressure, the percentage of S&P 500 stocks trading above their 10-day moving average has cycled from fewer than 10% to more than 90%. It took less than a week to do so, just like in June.
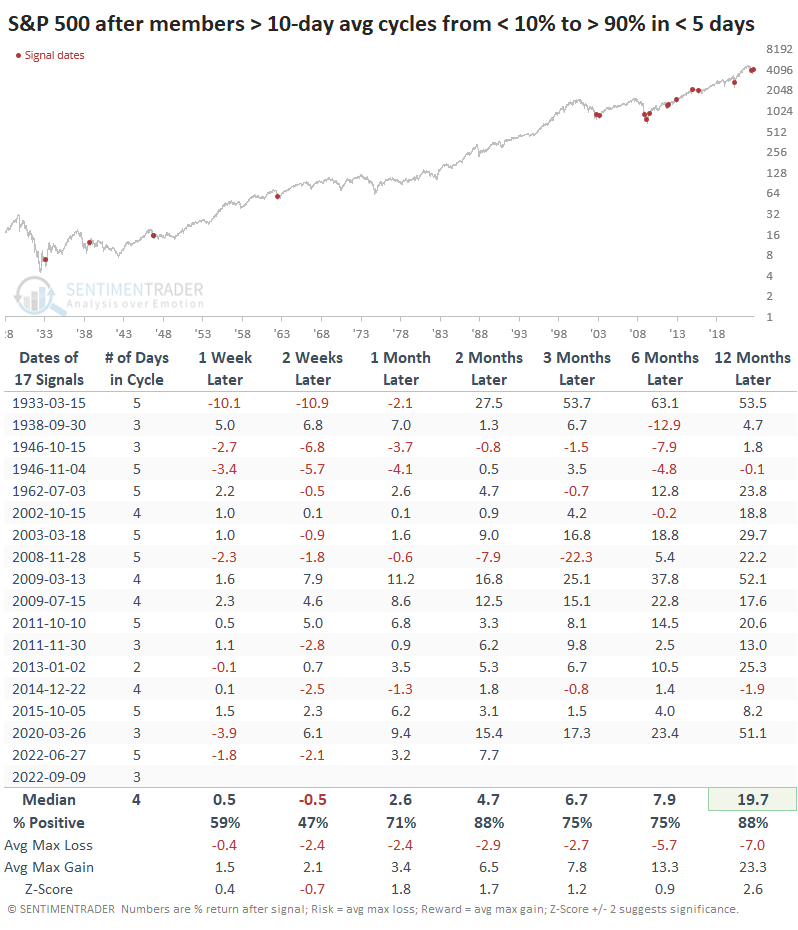
It's relatively rare to see such a quick shift in mentality. Again, it has become much more common since the global financial crisis, but since 1928, there have been only 17 times when the shift happened within a week.
All but two of the signals preceded gains in the S&P over the next year. The two losses were tiny, and one of them occurred when the index was trading near an all-time high, not coming off a significant and protracted loss like now.
Out of all that history, and all those signals, only two time periods witnessed two thrusts within three months. It just happened again, for the third time.
The first one, in 1946, witnessed a short-term decline in the S&P 500 and choppy behavior for months (years, actually) following that.
The other one, in 2011, also preceded a short-term drop, but much more persistent and impressive upside afterward.
What the research tells us...
When buyers emerged after the extreme pessimism in June, it triggered breadth thrusts from several different angles. Those were just some reasons we likely weren't experiencing a bear market rally. It seems worrying that those failed, but that kind of reaction isn't necessarily a death knell for a longer-term recovery. Now that we saw another dip in sentiment and a subsequent thrust from buyers, we're seeing behavior that has always, or at least almost always, preceded medium- to long-term gains for stocks.
Indicators at Extremes
Phase Table
Ranks
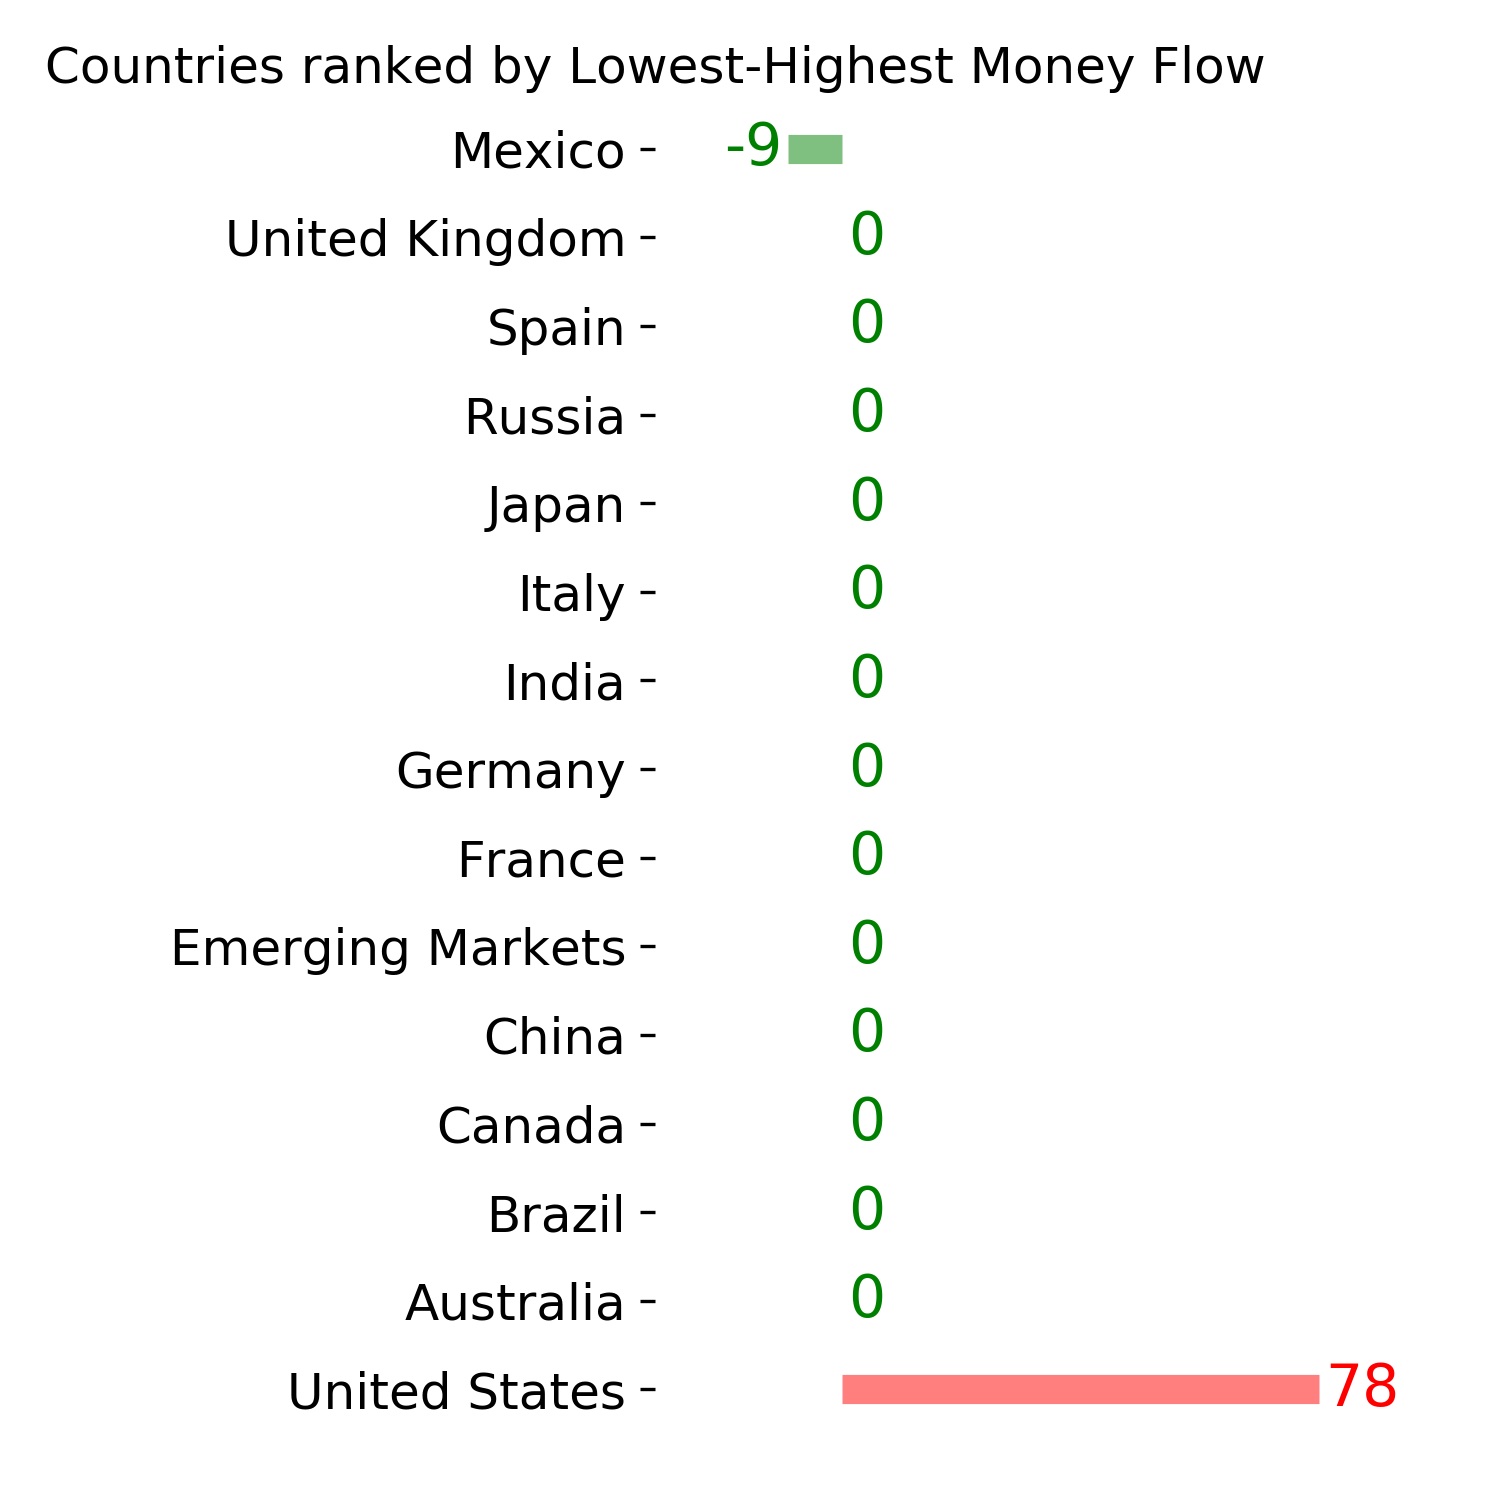
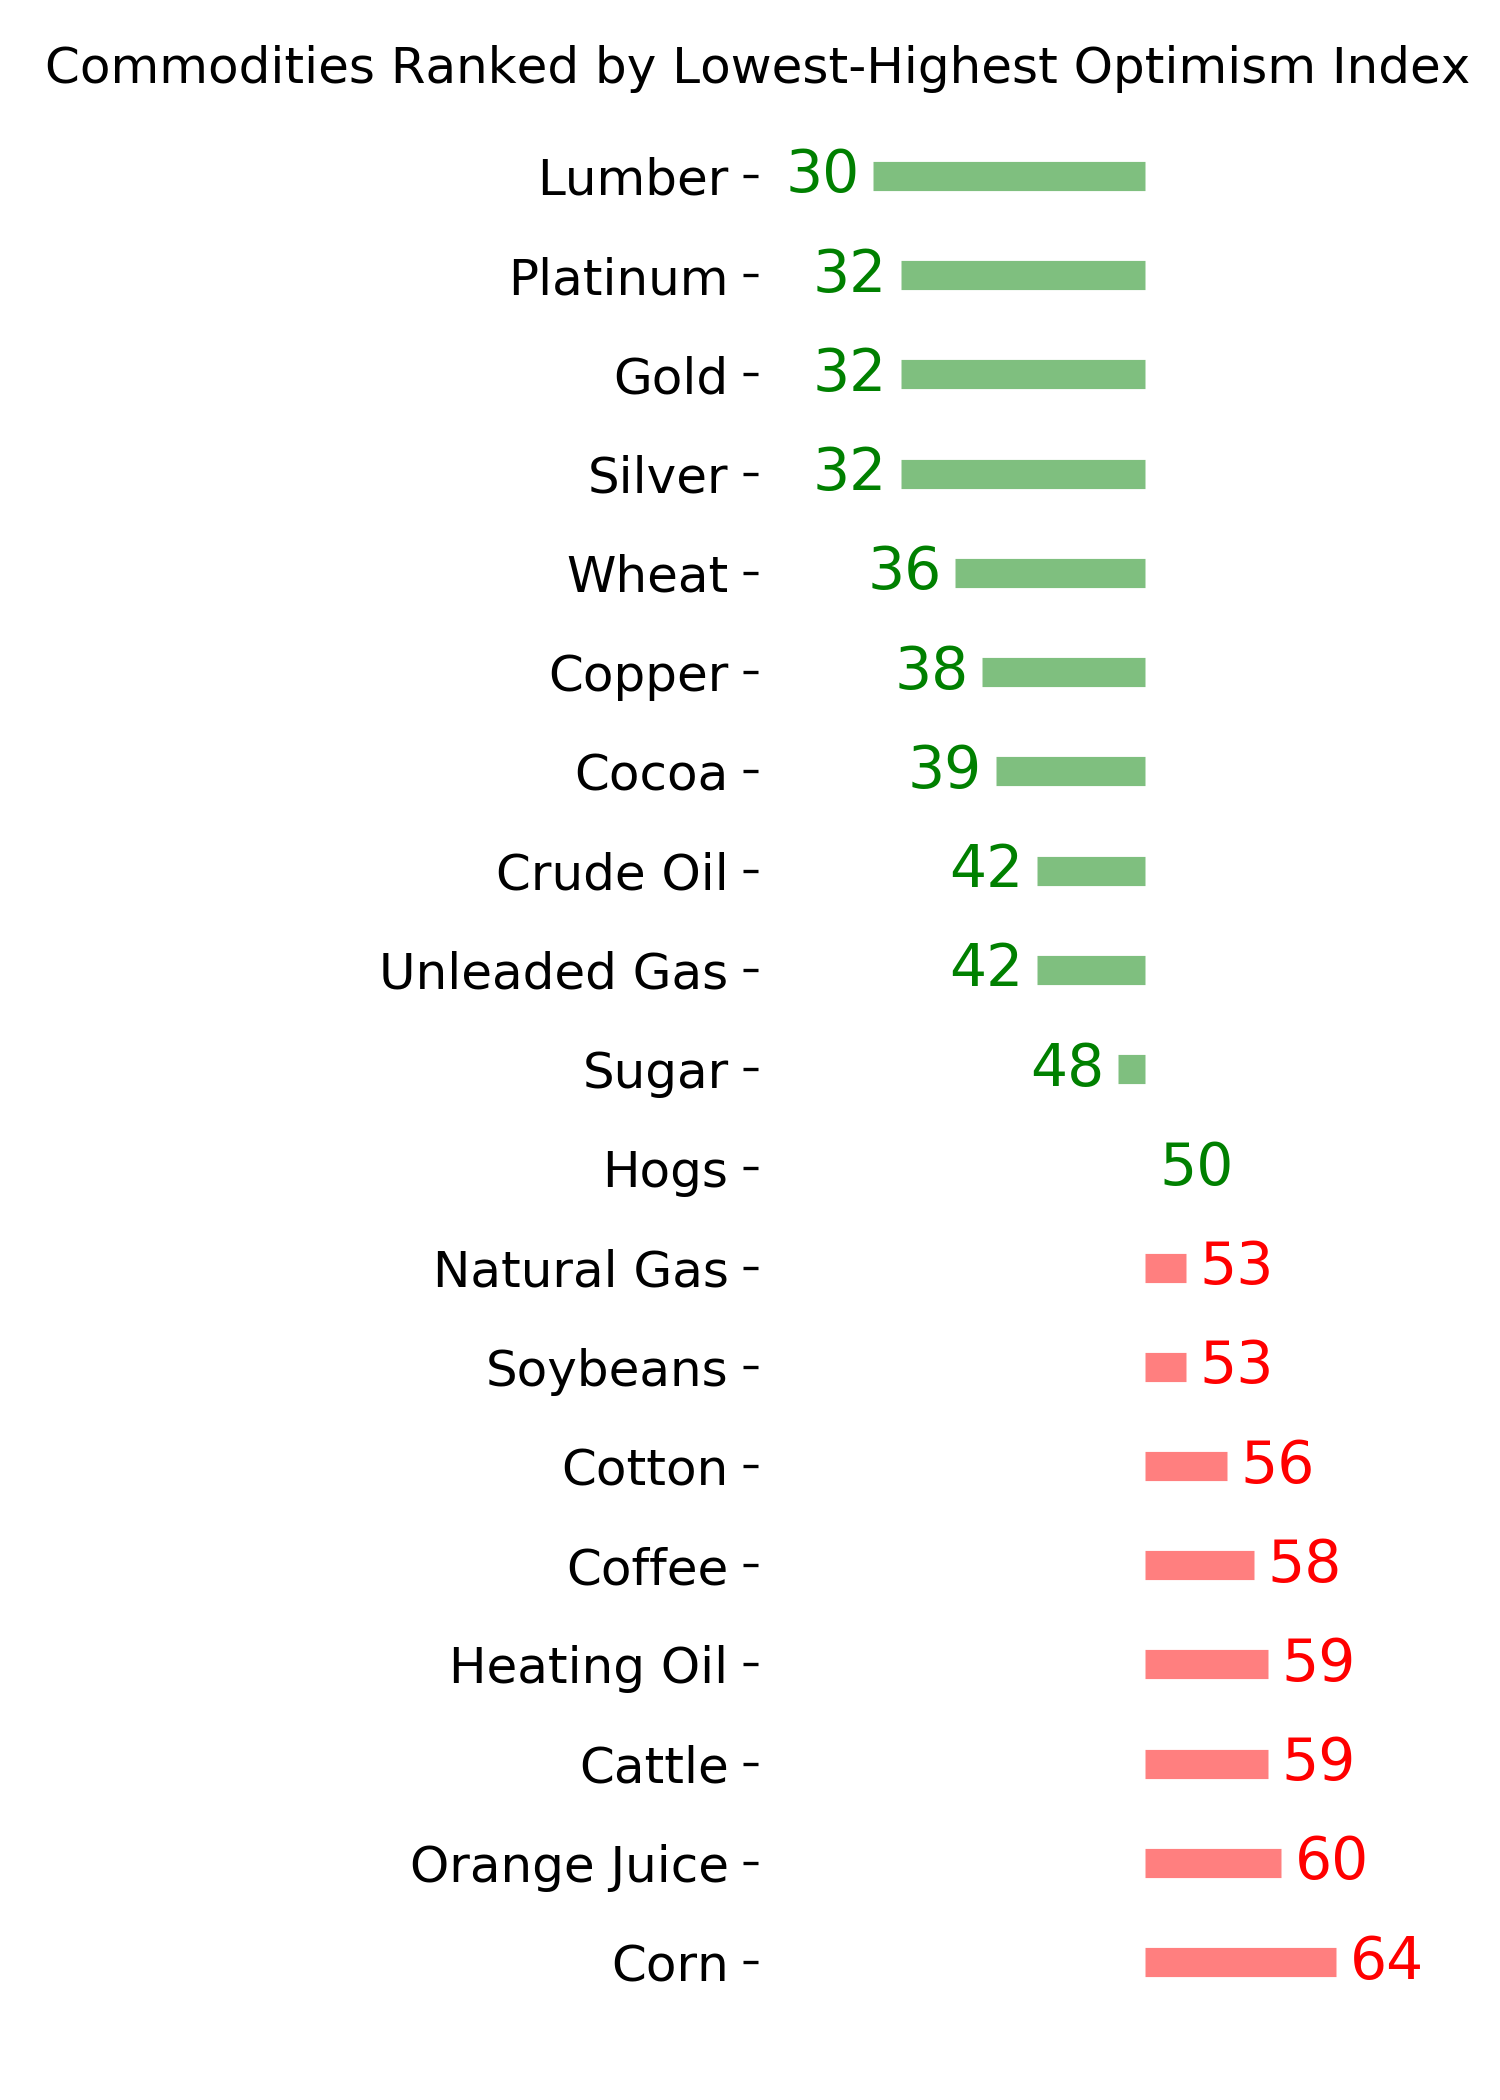
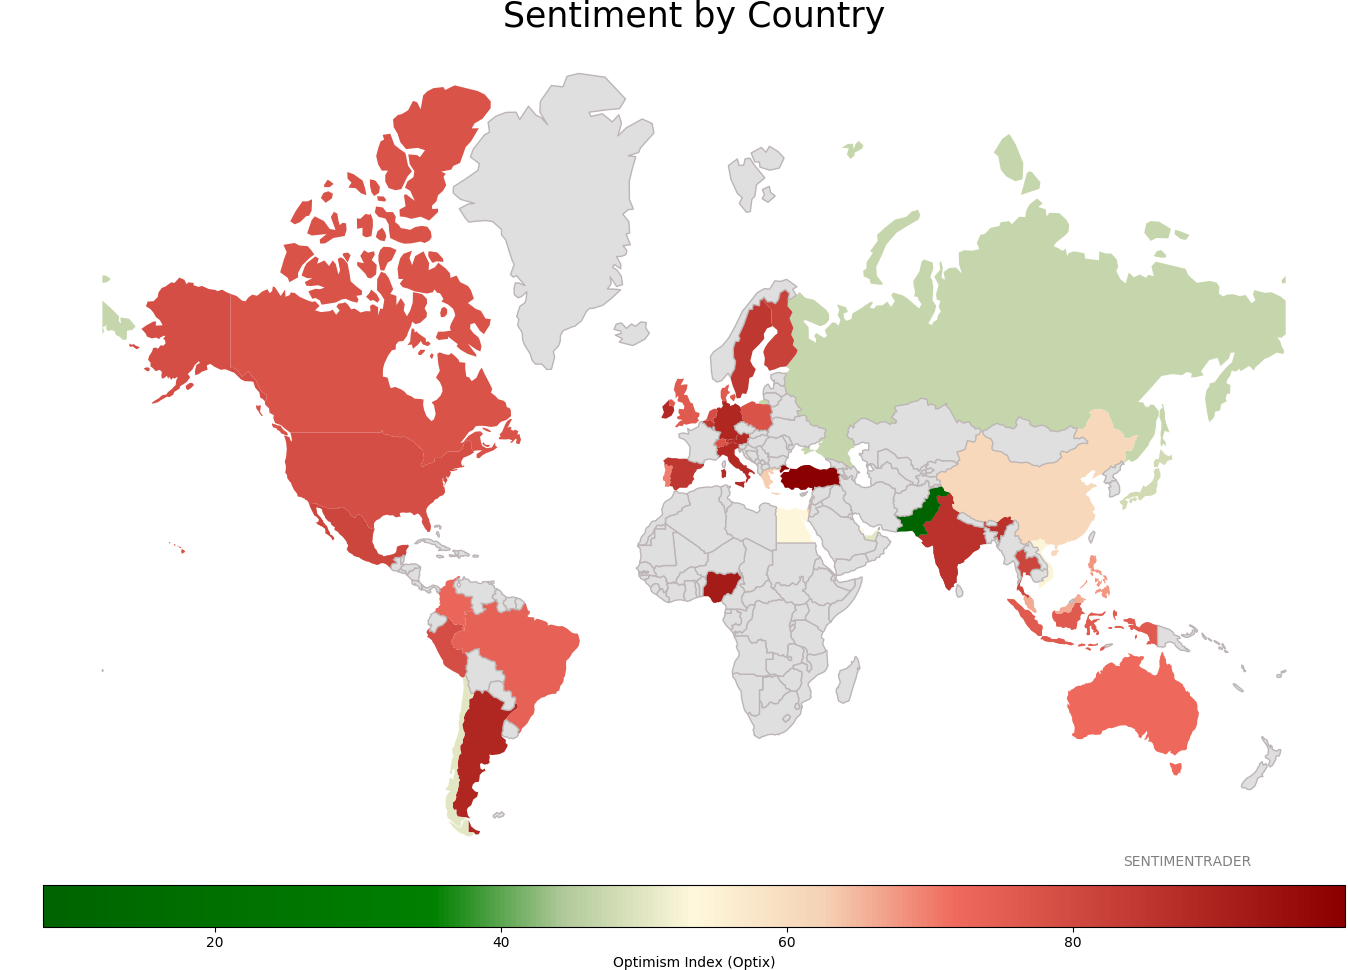
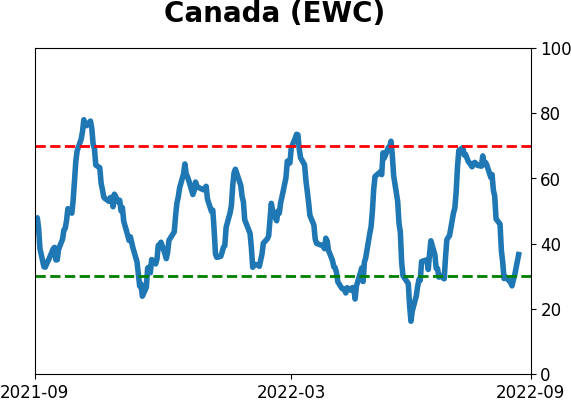
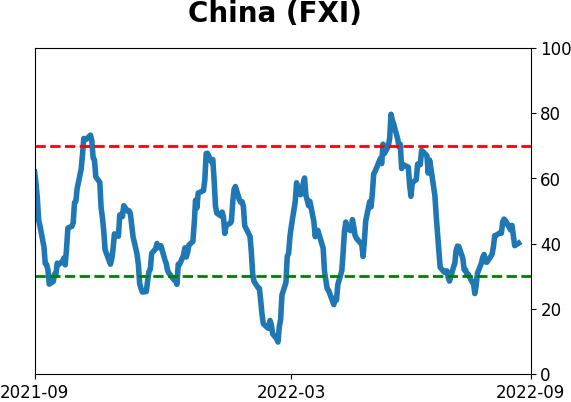
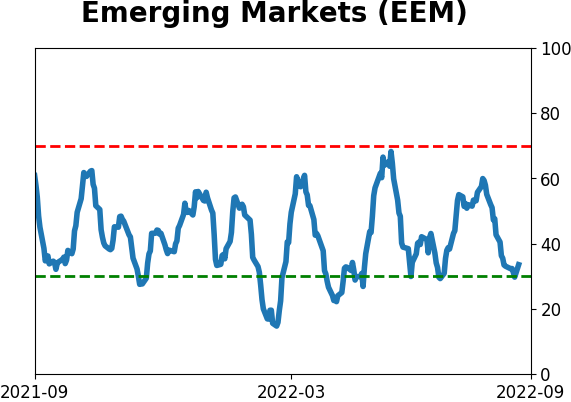
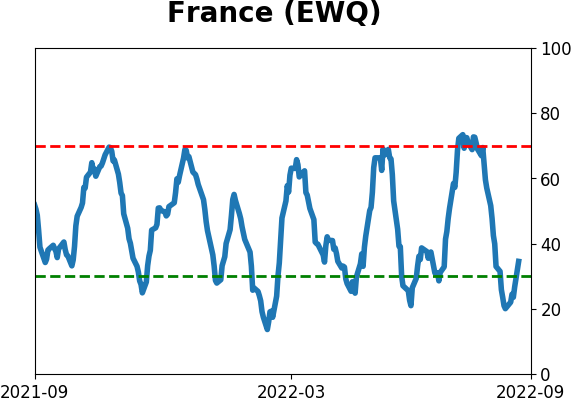
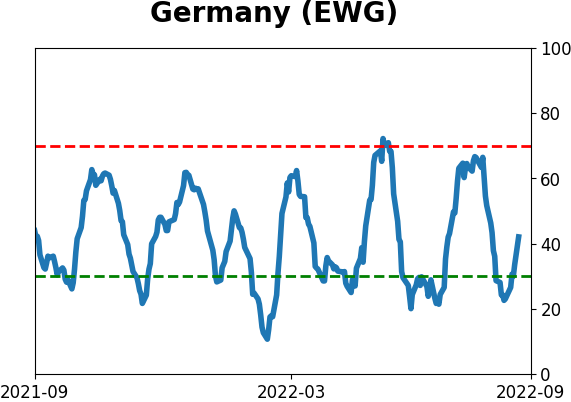
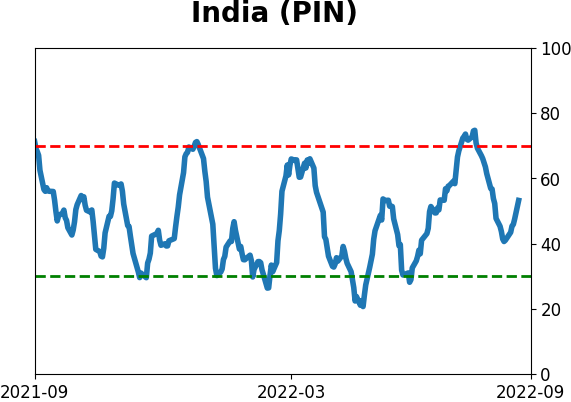
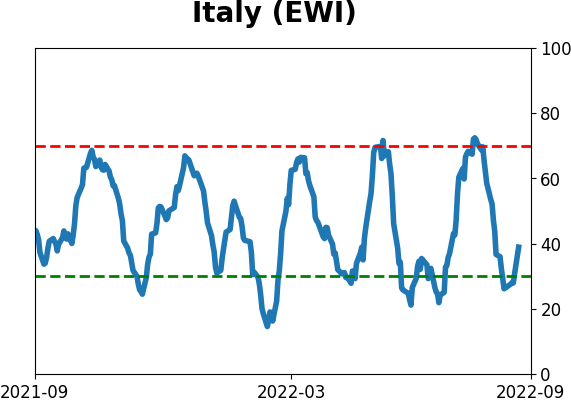
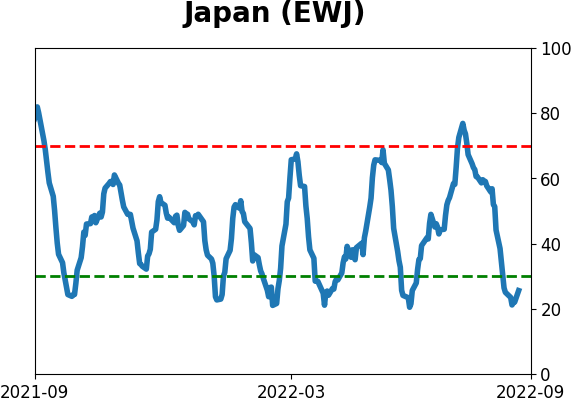
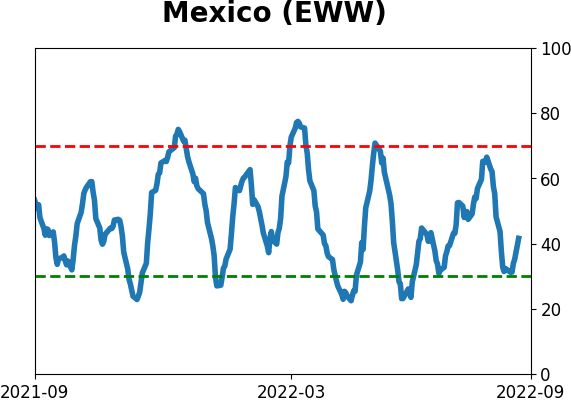
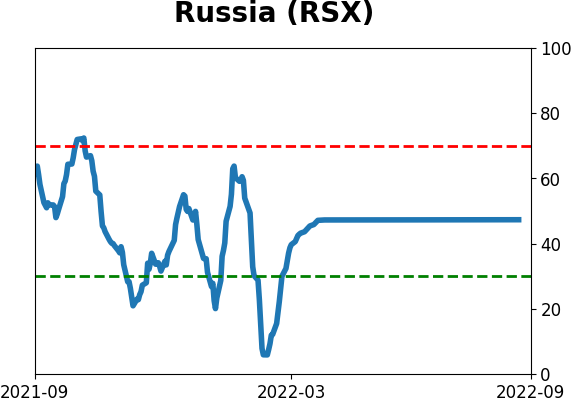
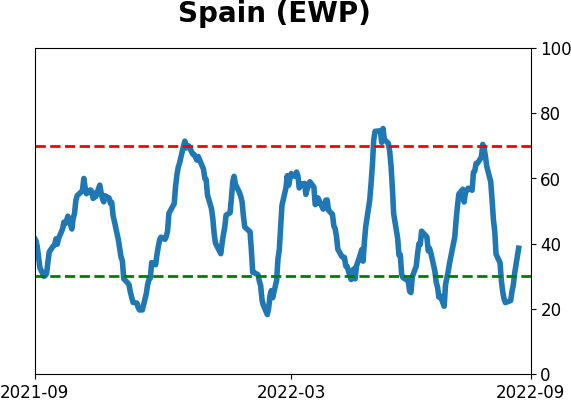
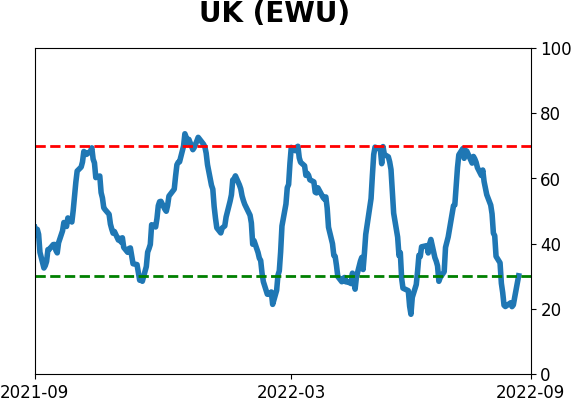
Sentiment Around The World
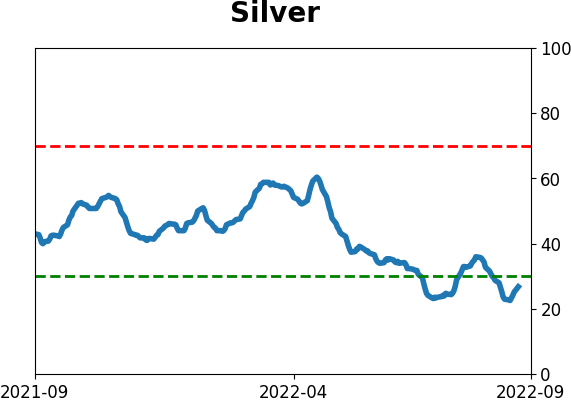
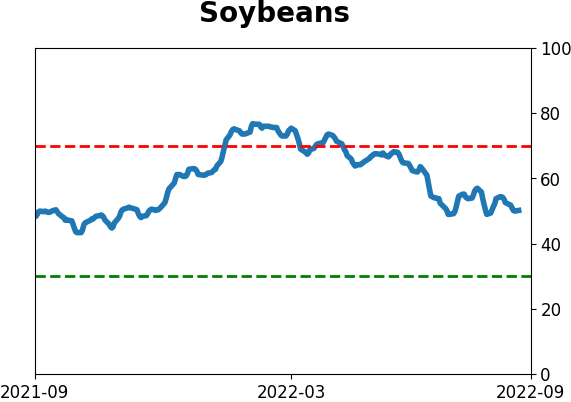
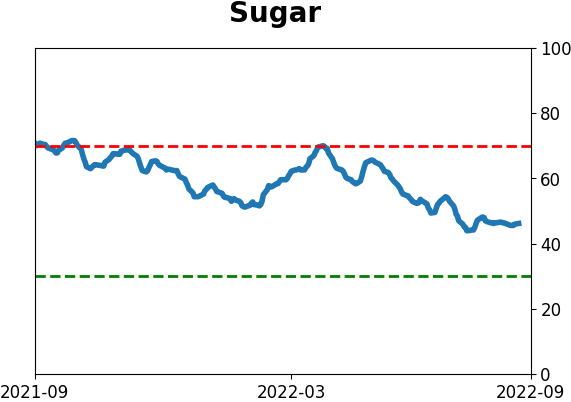
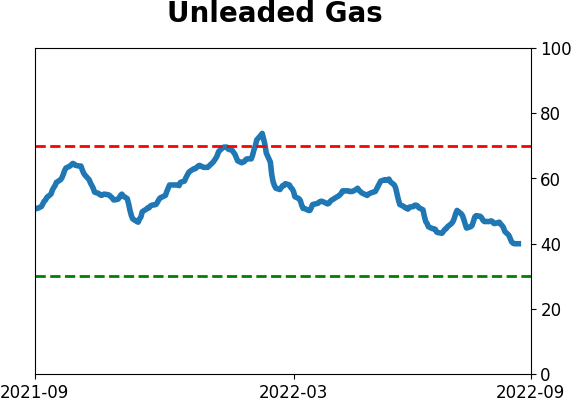
Optimism Index Thumbnails
|
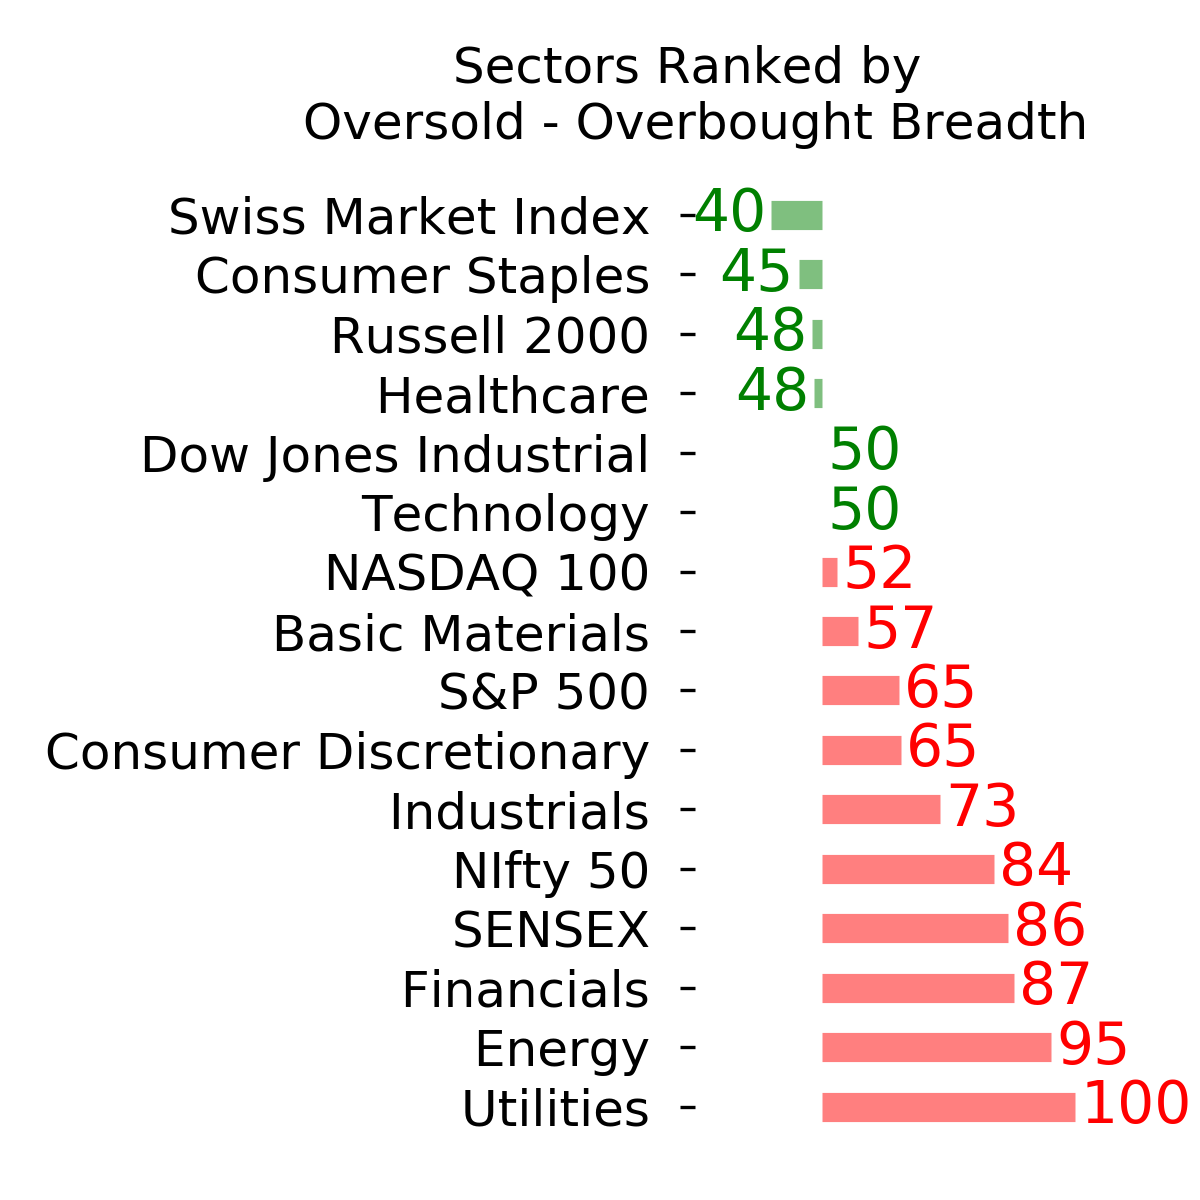
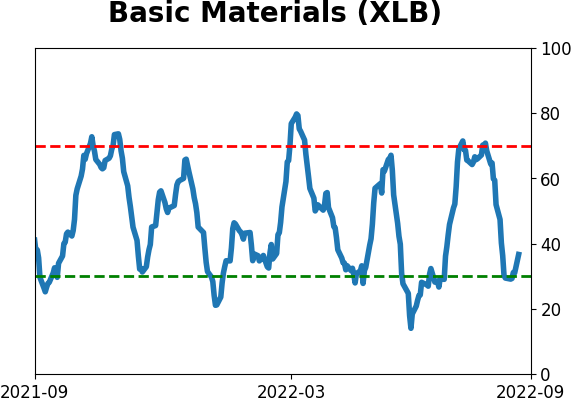
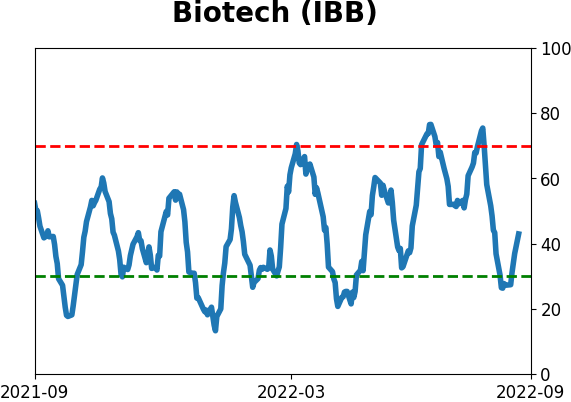
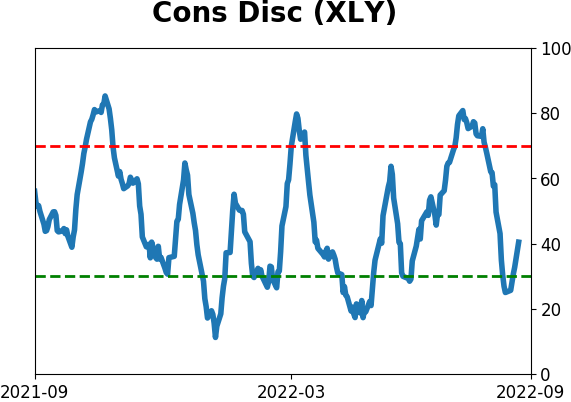
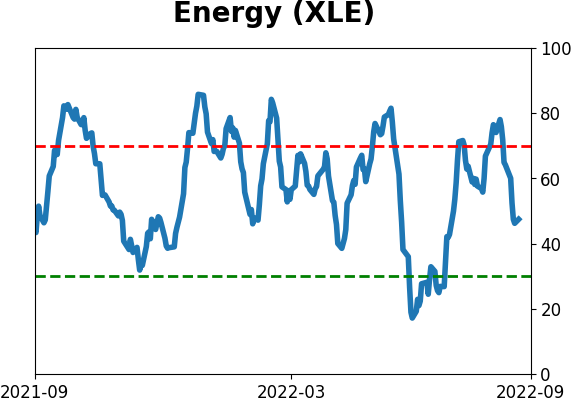
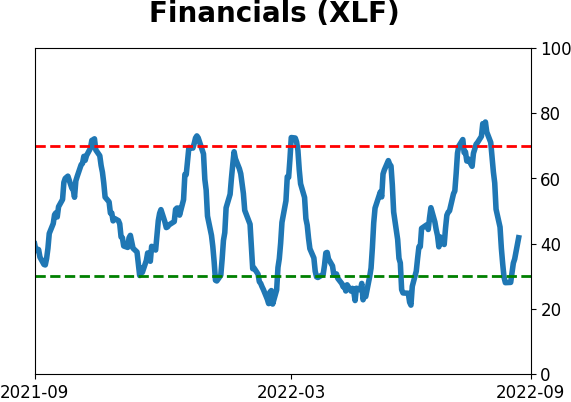
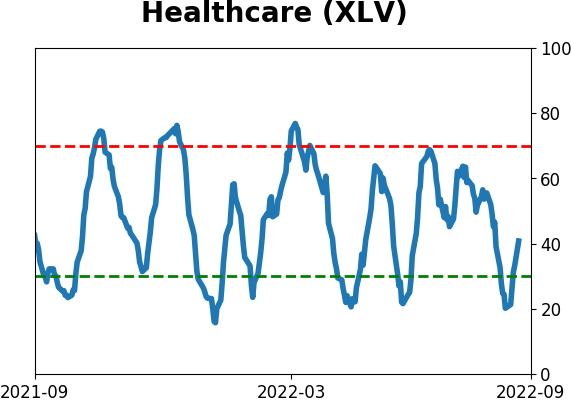
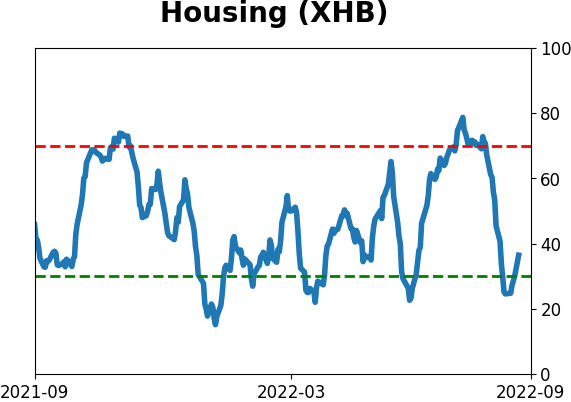
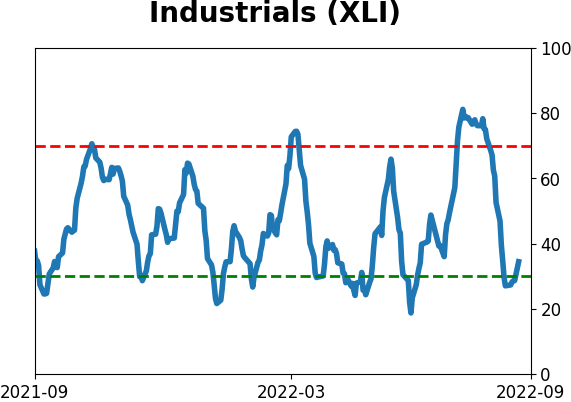
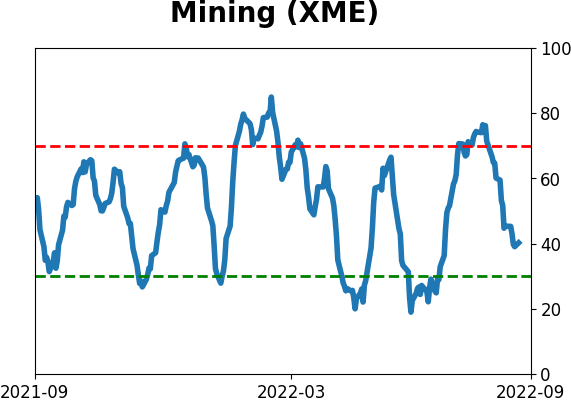
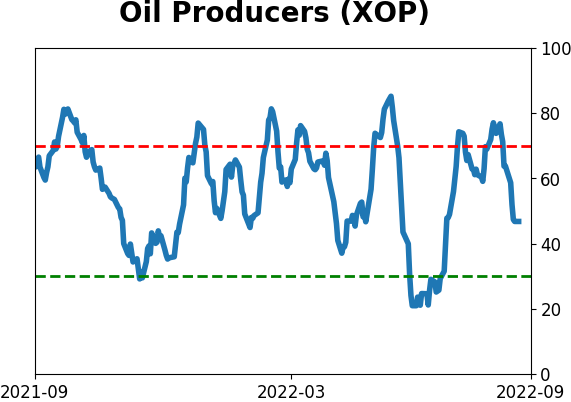
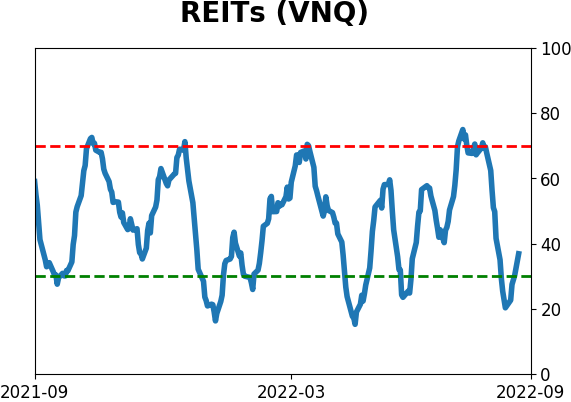
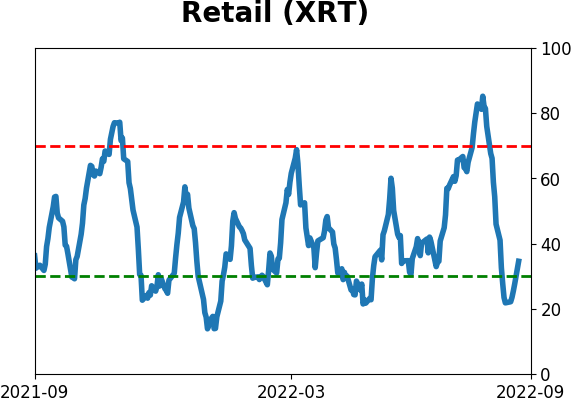
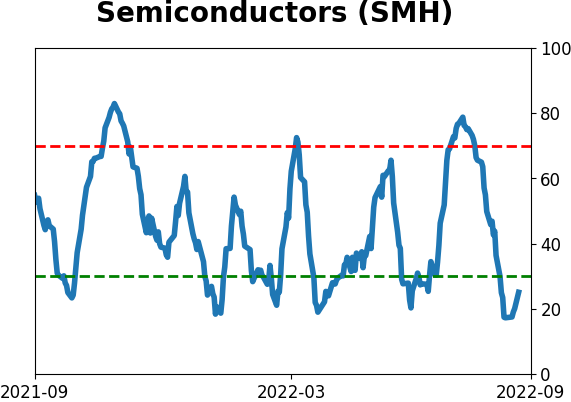
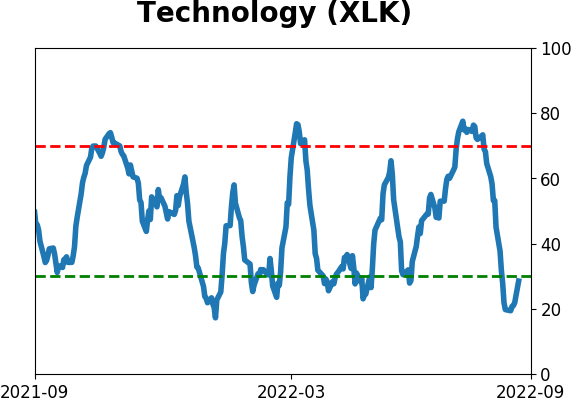
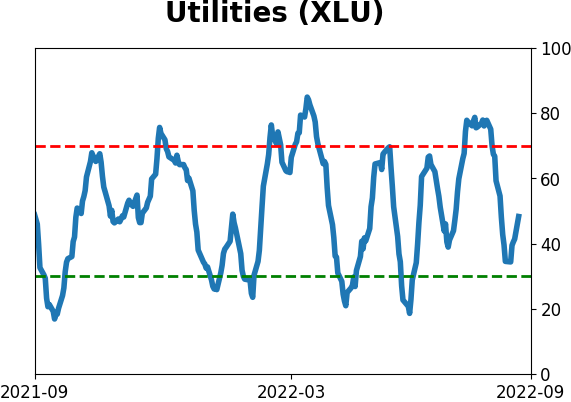
Sector ETF's - 10-Day Moving Average
|
|
|
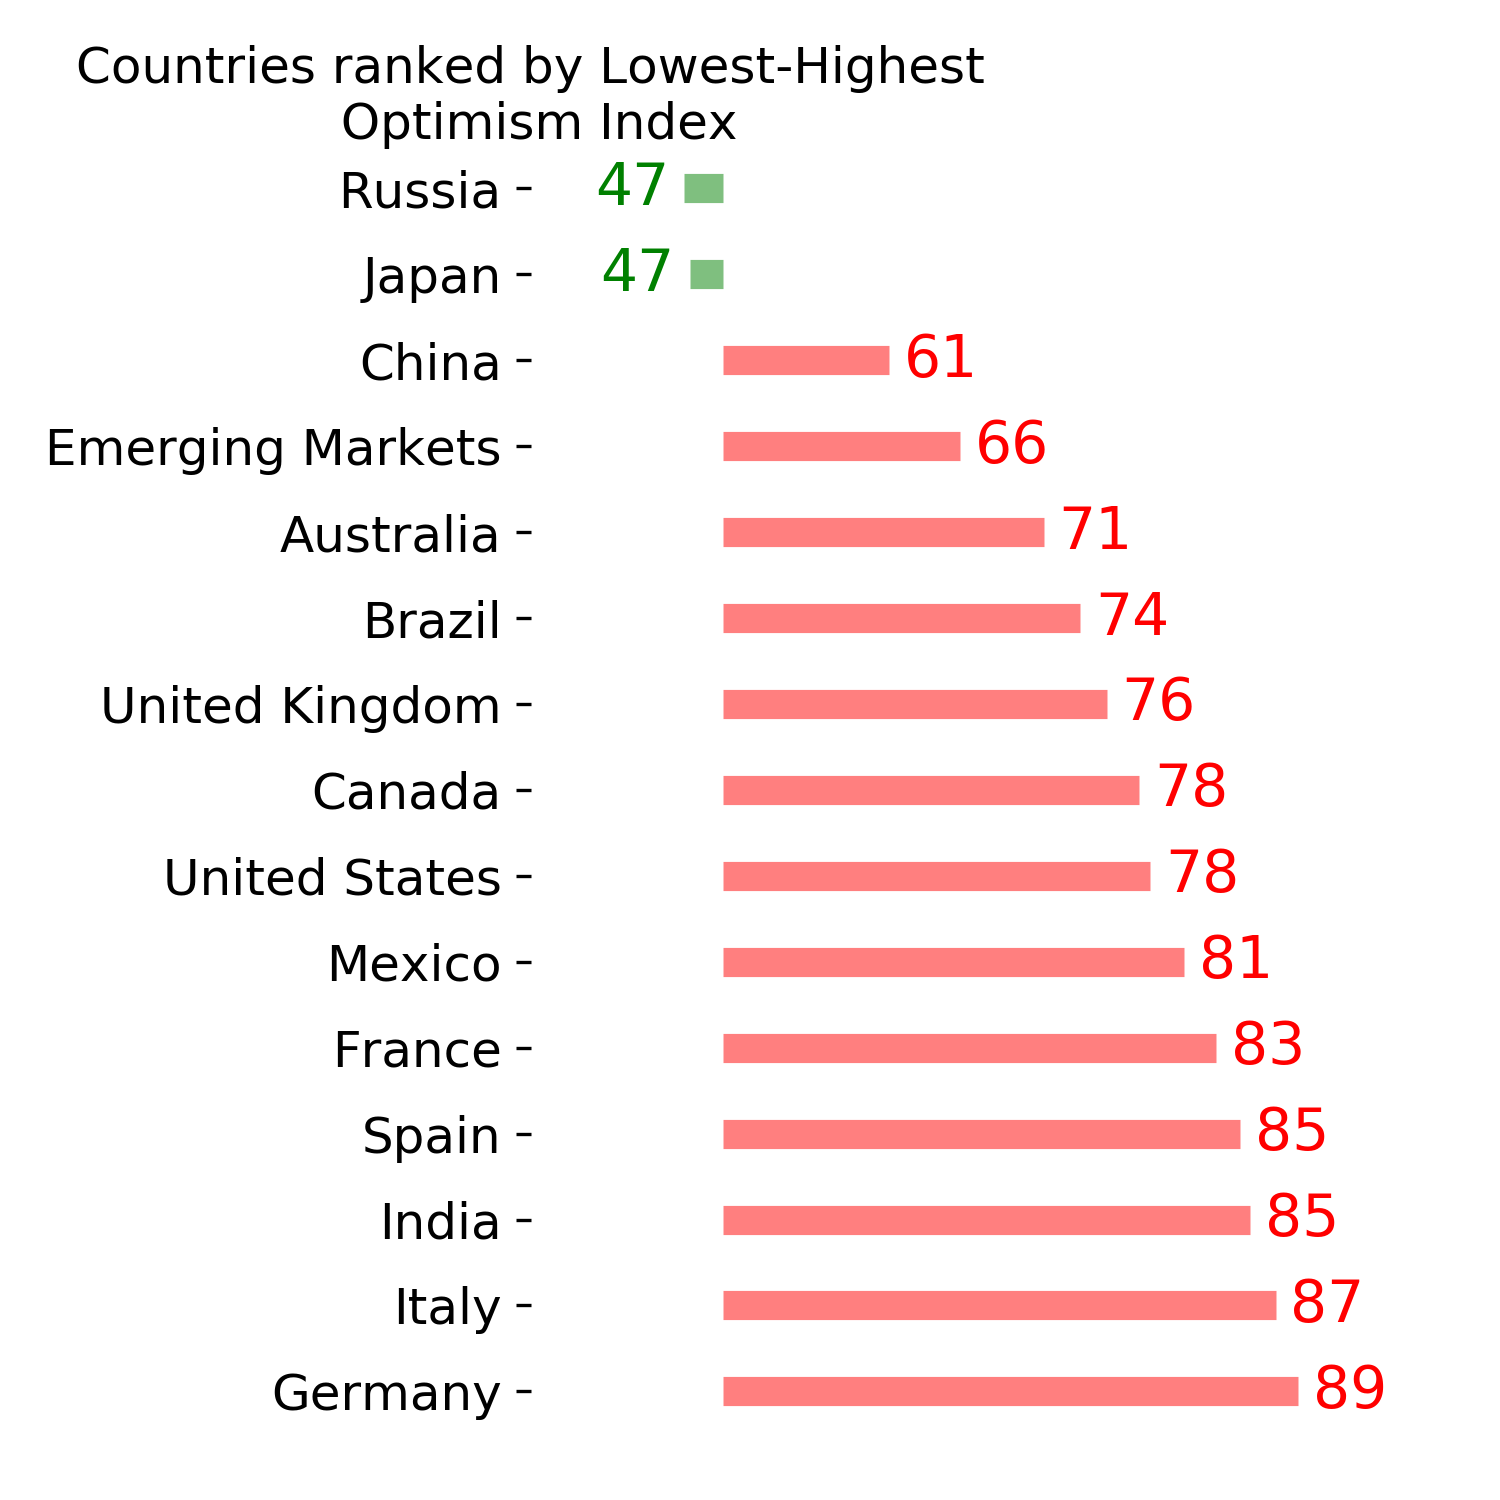
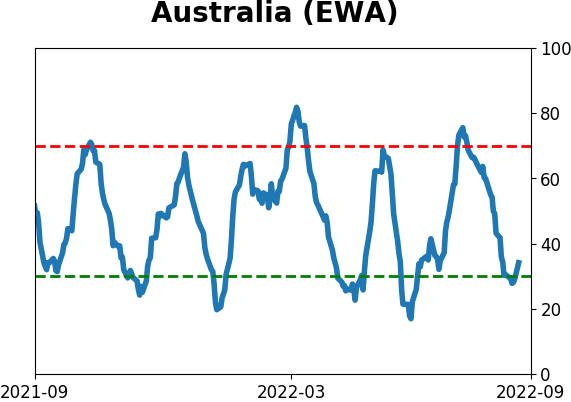
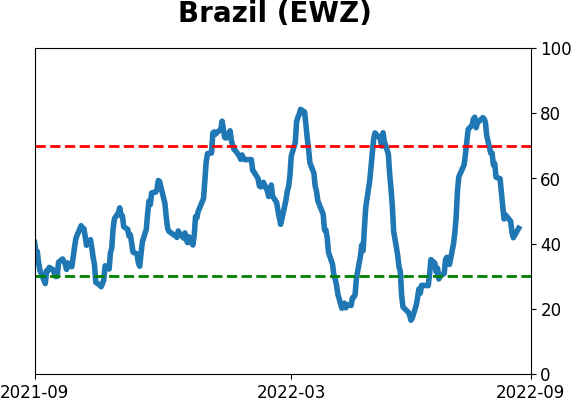
Country ETF's - 10-Day Moving Average
|
|
|
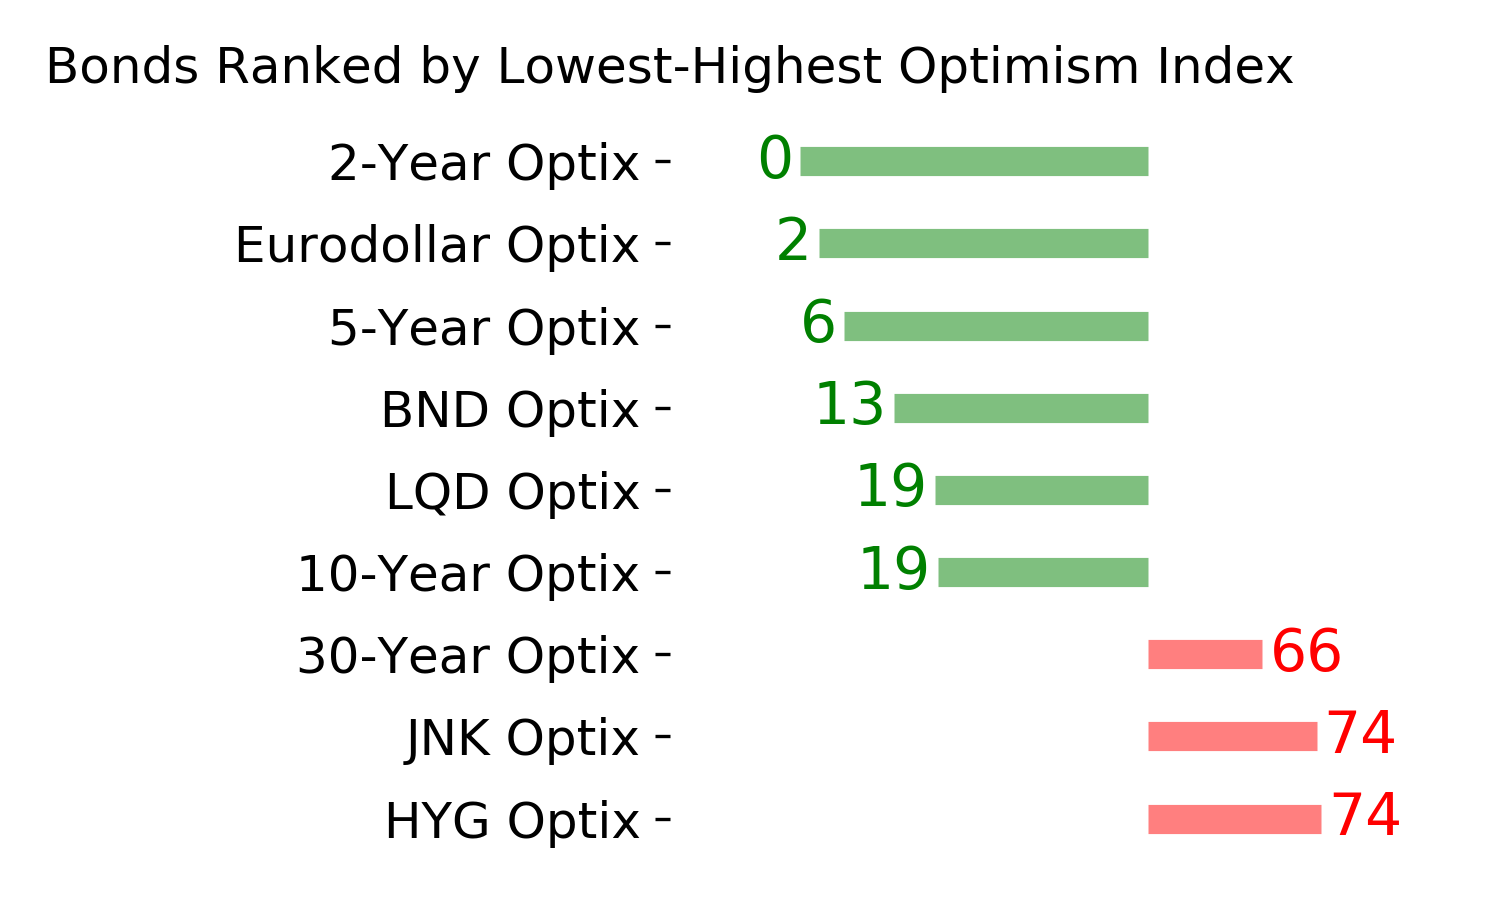
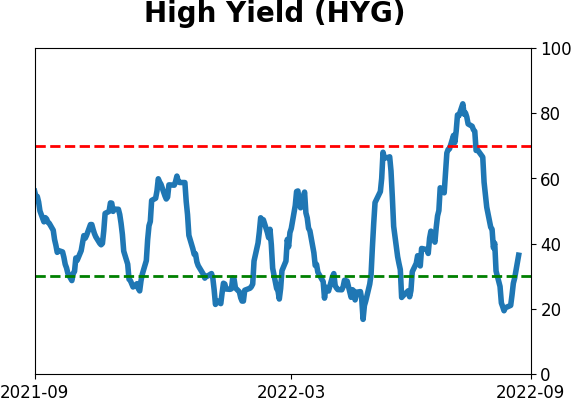
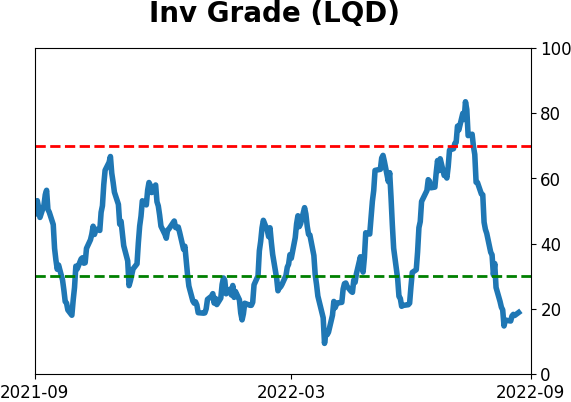
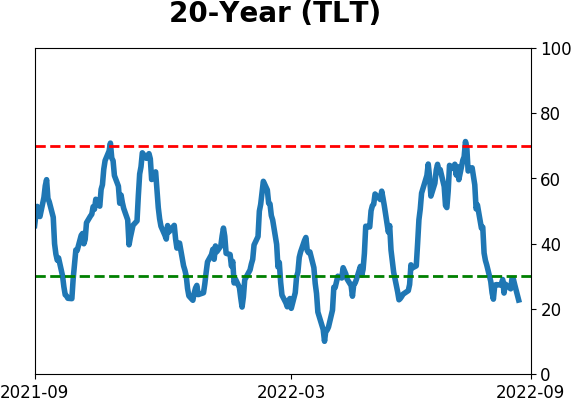
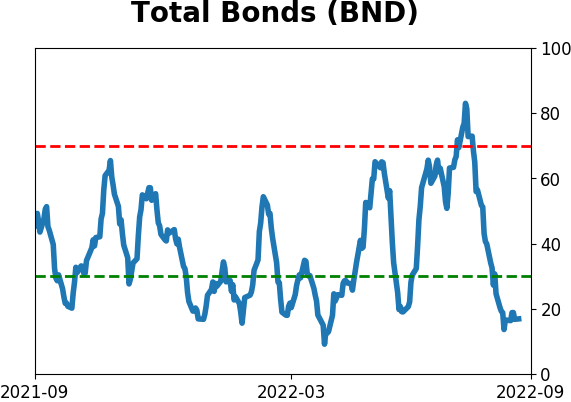
Bond ETF's - 10-Day Moving Average
|
|
|
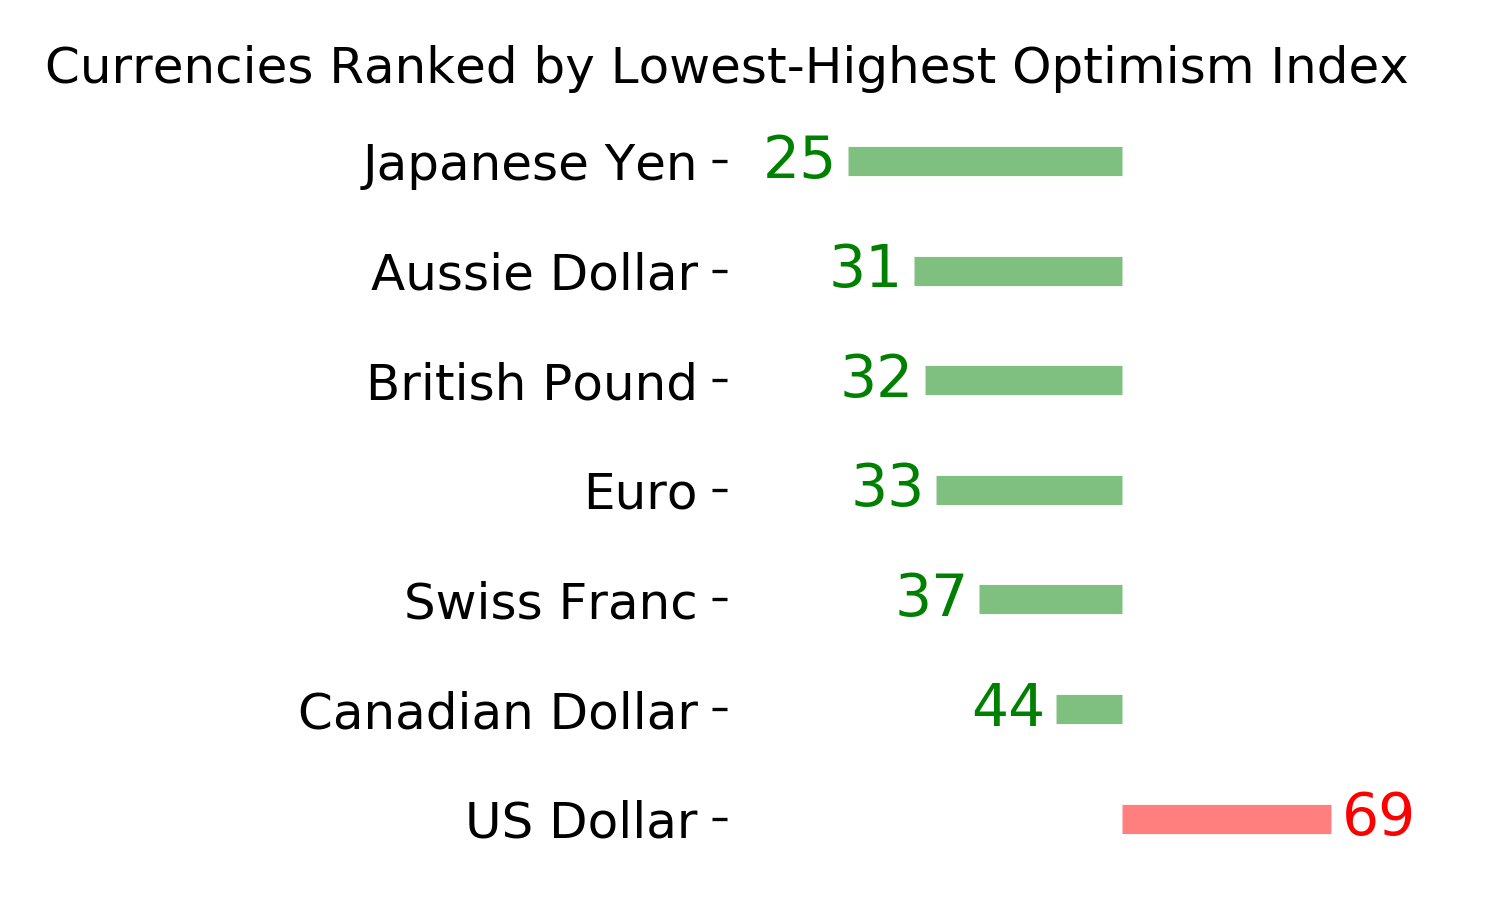
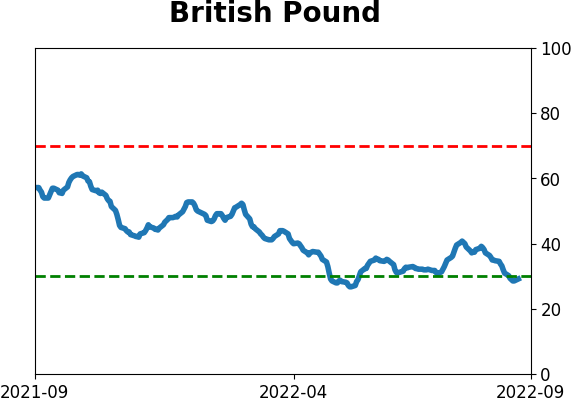
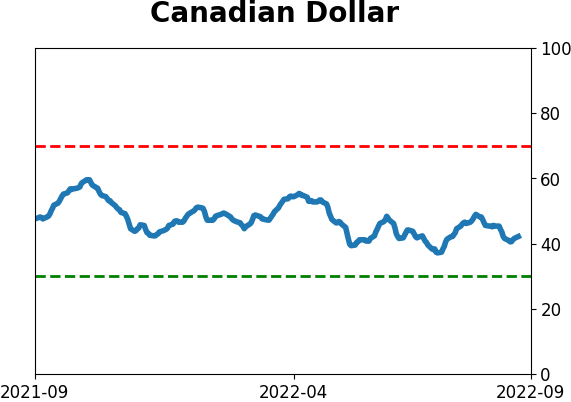
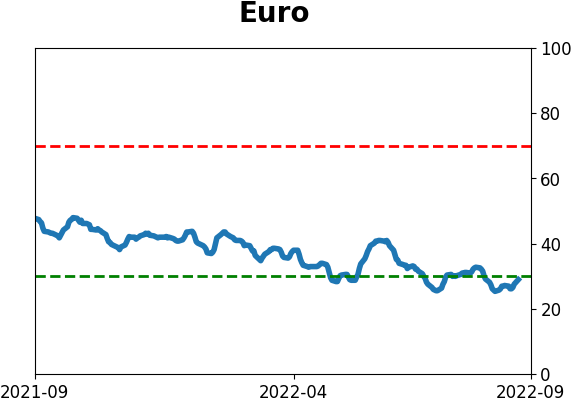
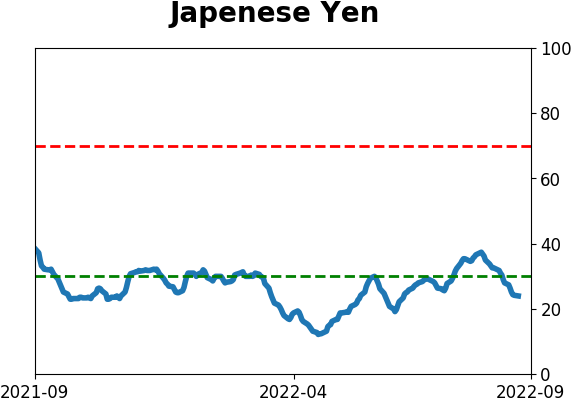
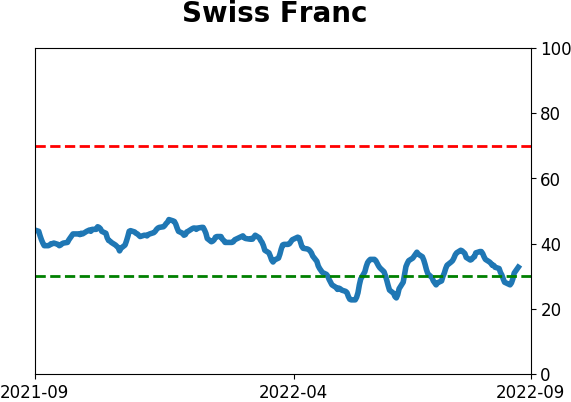
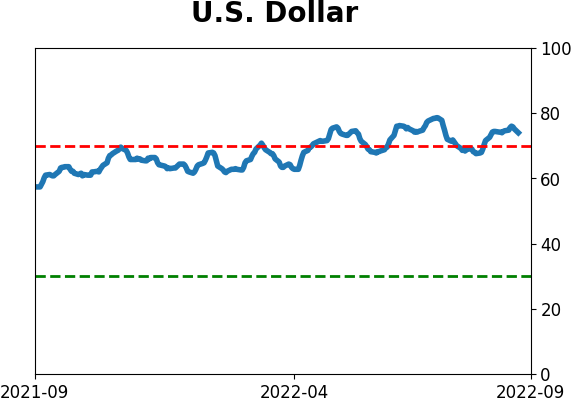
Currency ETF's - 5-Day Moving Average
|
|
|
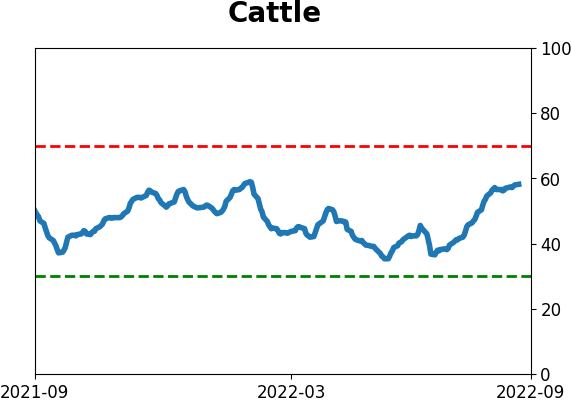
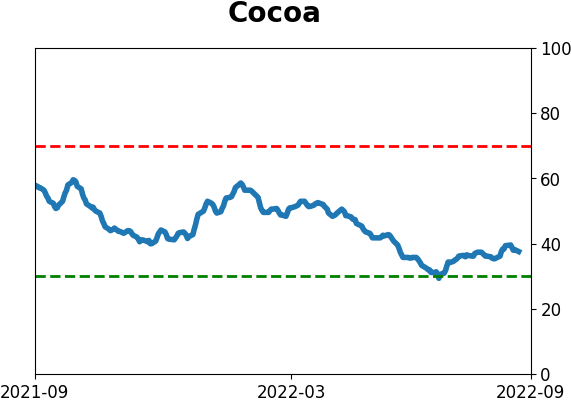
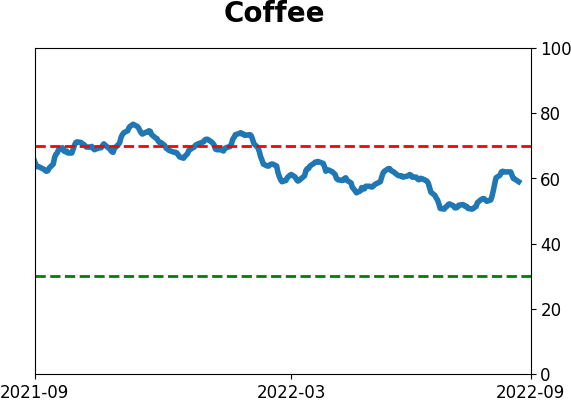
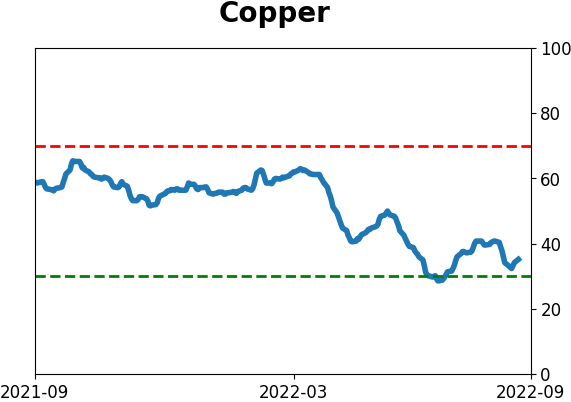
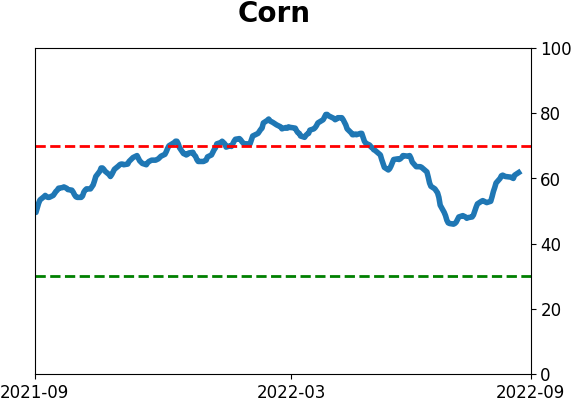
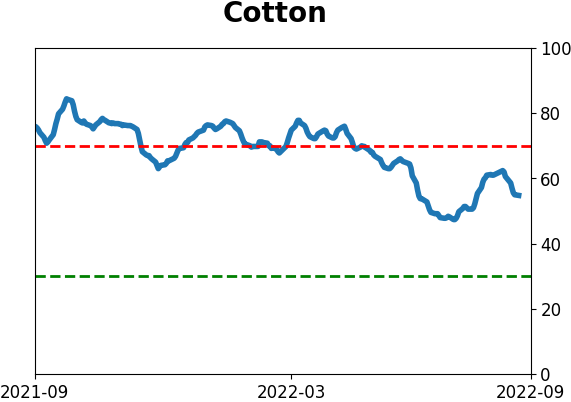
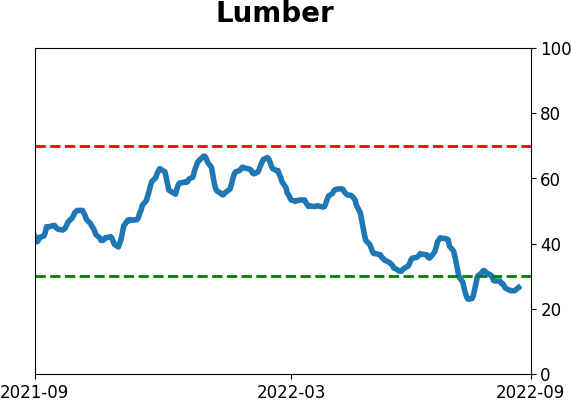
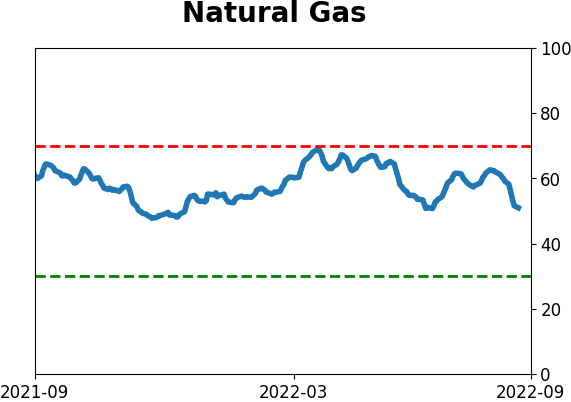
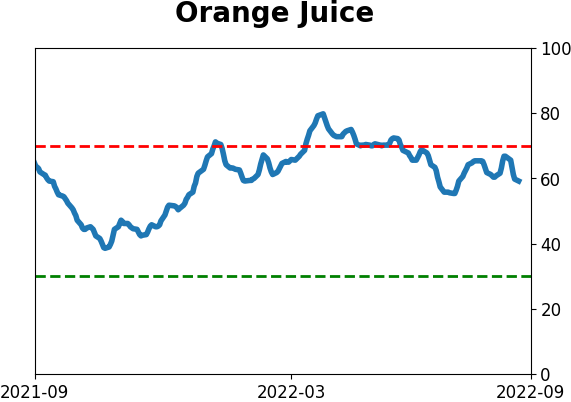
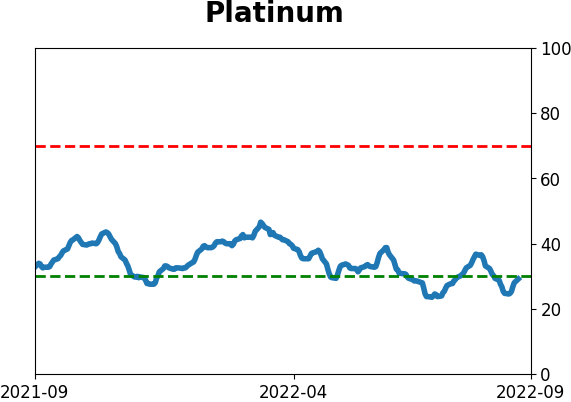
Commodity ETF's - 5-Day Moving Average
|
|