Headlines
|
|
Metals and bonds give different picture as excess liquidity spikes:
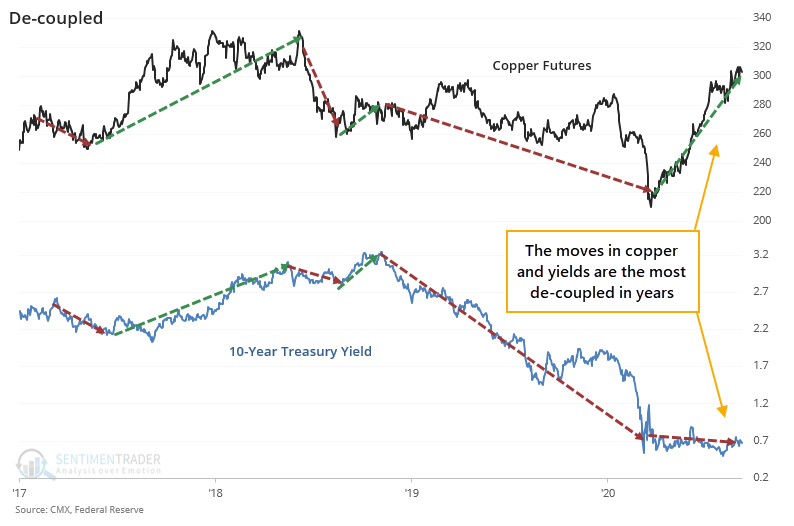
Over the past few months, there has been a breakdown in many long-term relationships, like between the price of copper and the level of 10-year Treasury yields. That's driven in part by a surge in excess liquidity in the system.
Active managers pull back: A couple of weeks ago, active investment managers were about the most exposed in at least 13 years. That's not a great contrary indicator, though it has often suggested that higher-beta stocks are more at risk. This week, their exposure dropped more than 30% yet still remains above 50%. That was a good buy-the-dip sign in March 2007 and August 2019, otherwise not so much.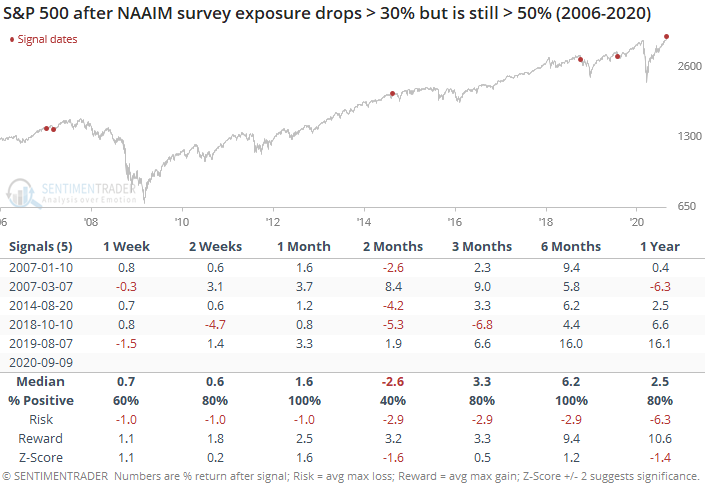
Bottom Line:
|
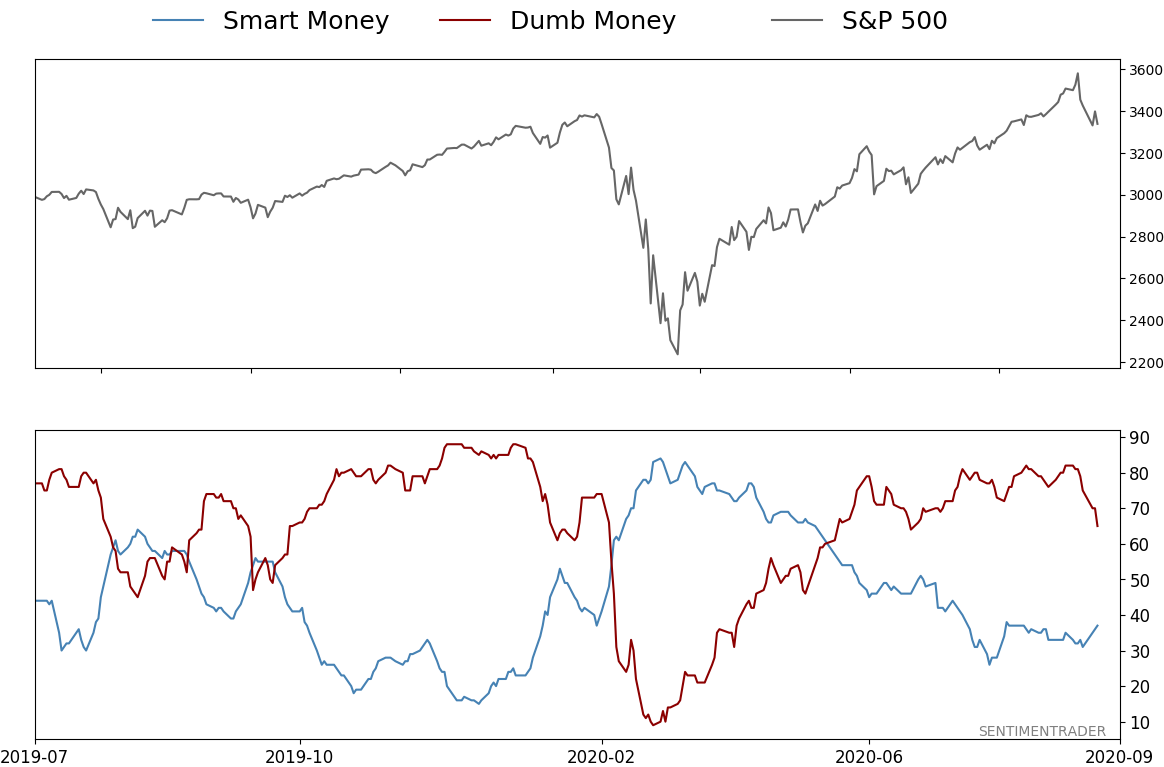
Smart / Dumb Money Confidence
|
Smart Money Confidence: 37%
Dumb Money Confidence: 65%
|
|
Risk Levels
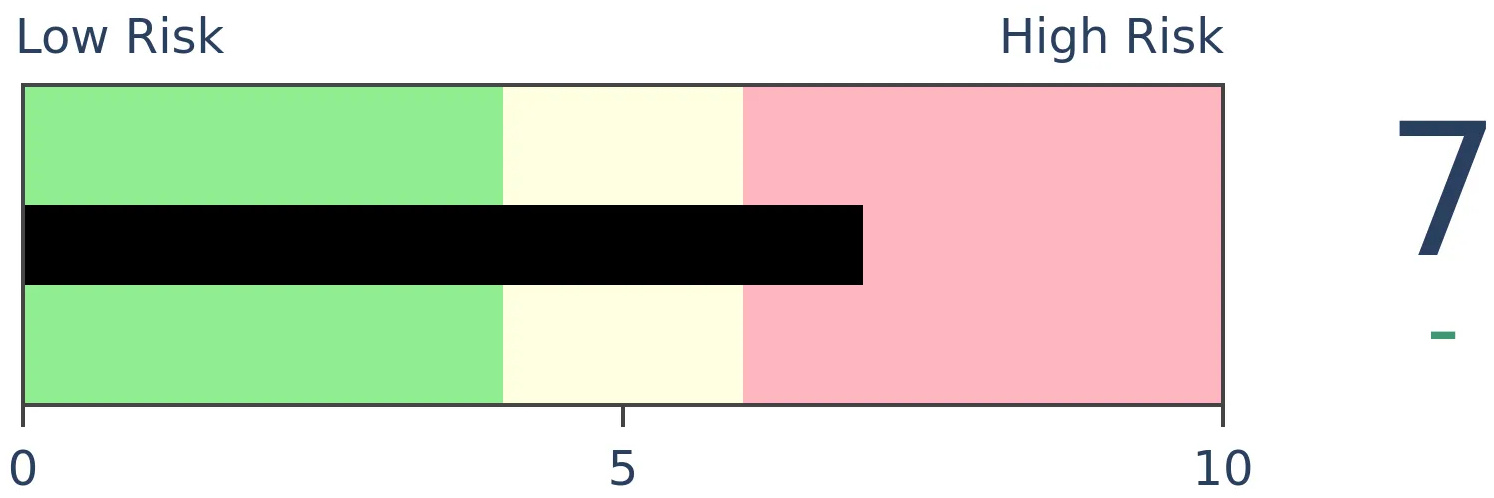
Stocks Short-Term
|
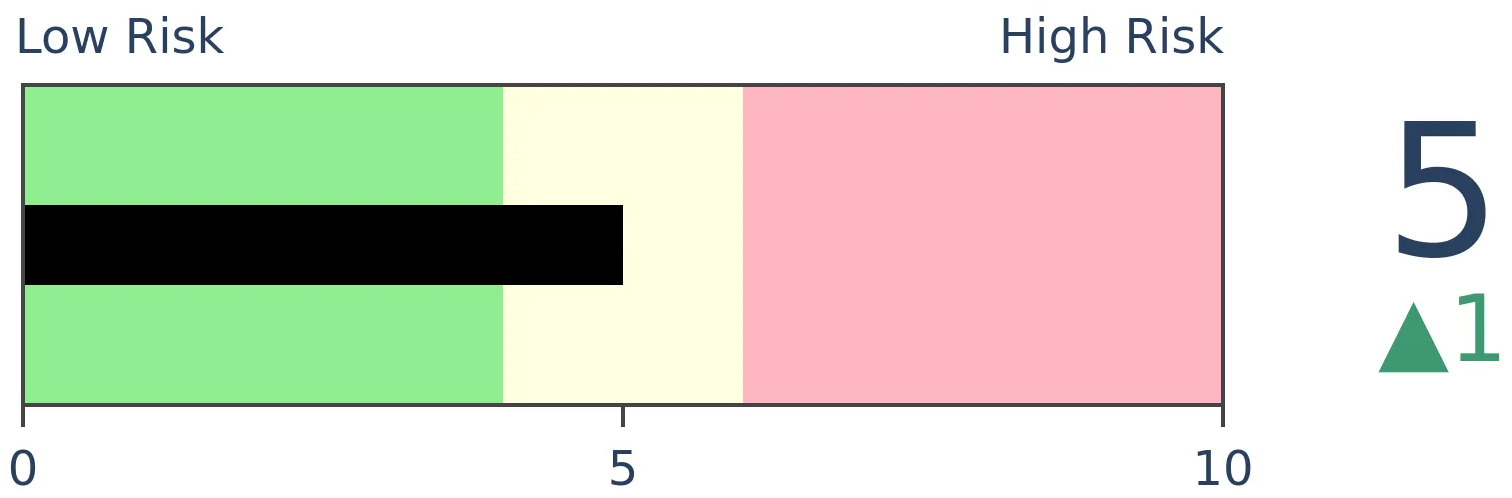
Stocks Medium-Term
|
|
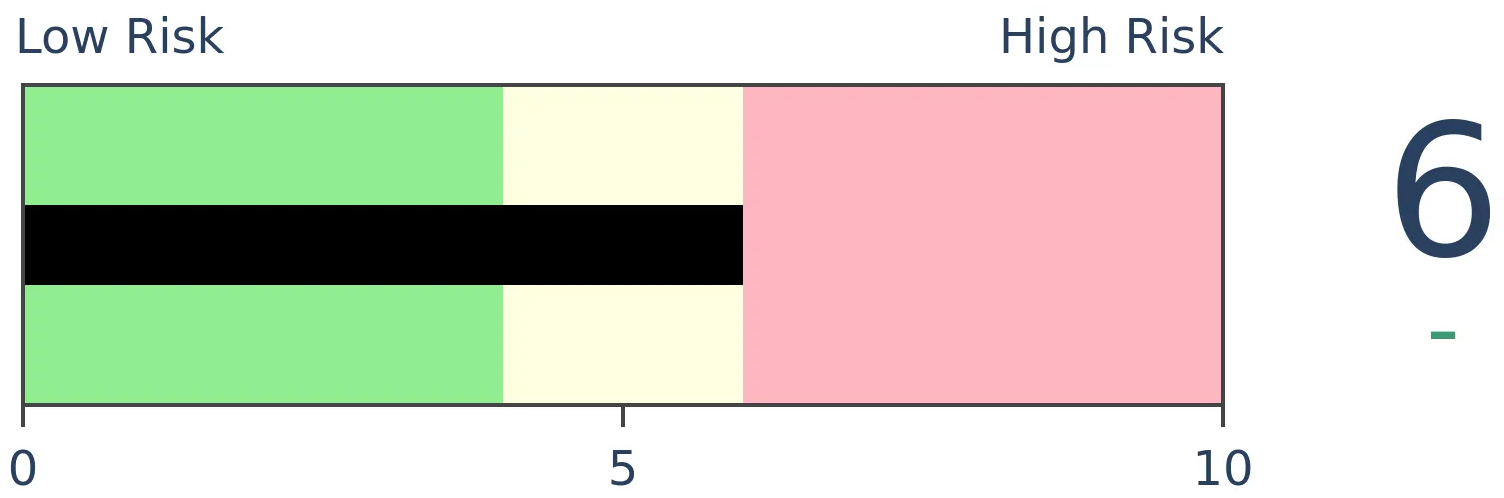
Bonds
|
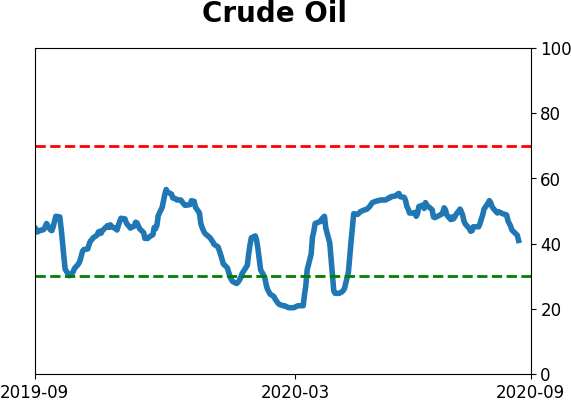
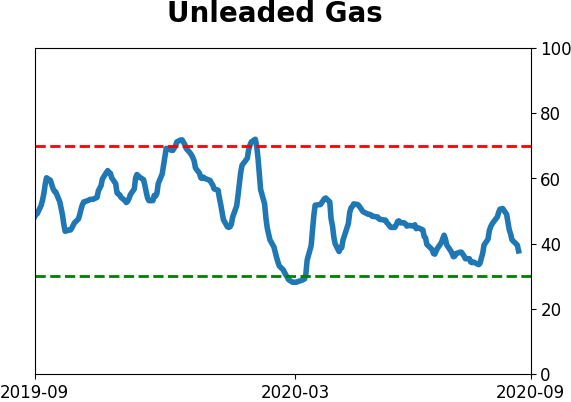
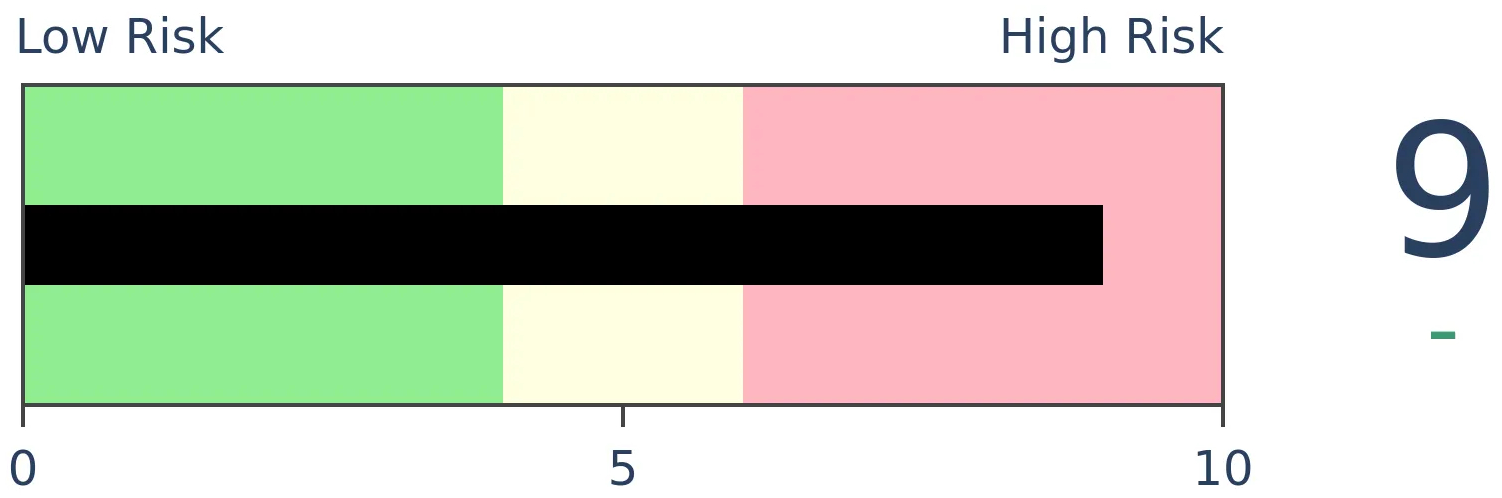
Crude Oil
|
|
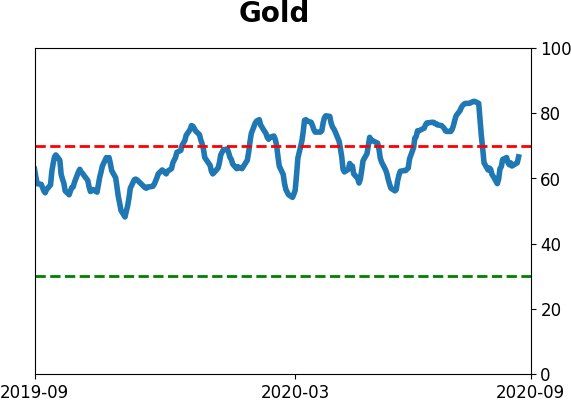
Gold

|
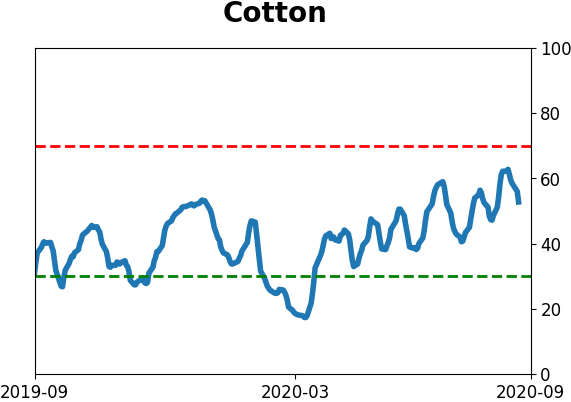
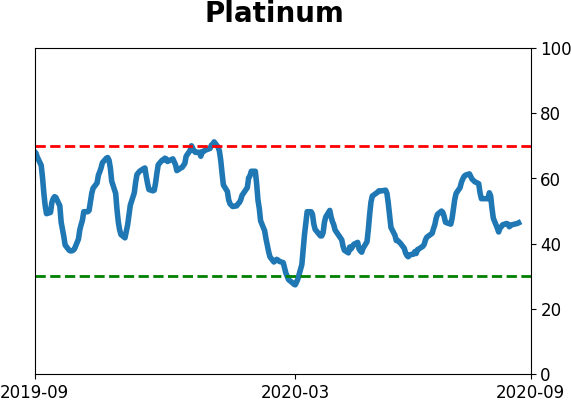
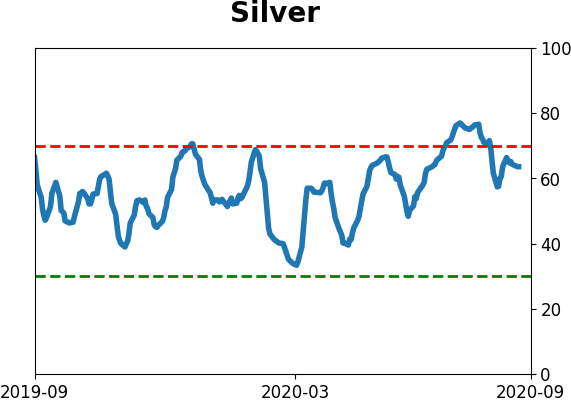
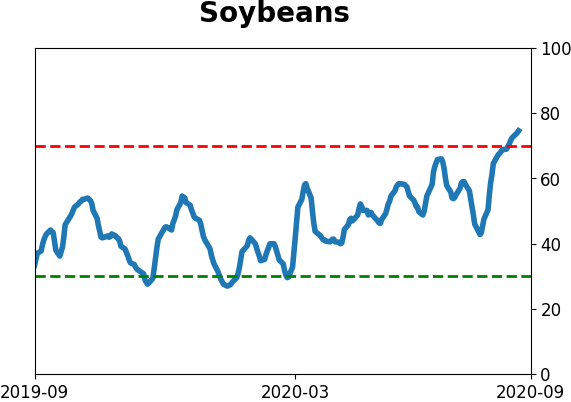
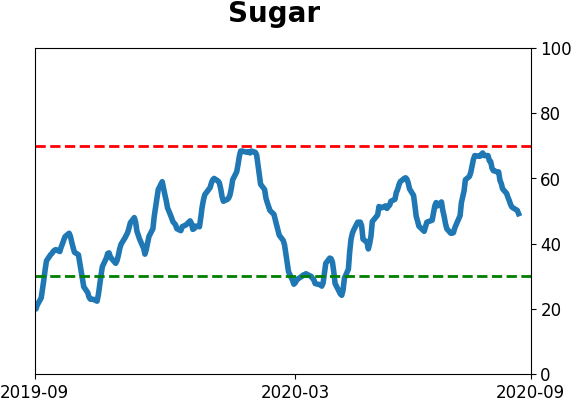
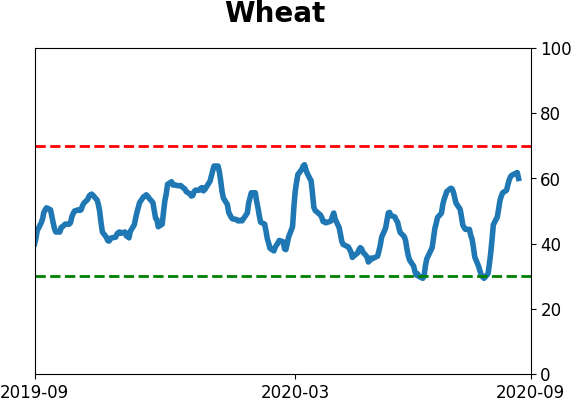
Agriculture
|
|
Research
BOTTOM LINE
Over the past few months, there has been a breakdown in many long-term relationships, like between the price of copper and the level of 10-year Treasury yields. That's driven in part by a surge in excess liquidity in the system.
FORECAST / TIMEFRAME
None
|
There are a lot of tables in this piece, so to summarize what may be an eye-watering amount of small numbers:
There is a historic divergence between copper and interest rates, driven in part by excess liquidity and suppressed rates. Prior divergences preceded some rocky times in stocks, and peaks in liquidity led to long-term declines in stock valuations. Both developments tended to lead to a drop in bond prices, and rise in yields. Other assets showed mixed returns.
The table below gives a quick overview of the longer-term returns in each asset.
| Asset | Copper / 10-Year Yield Divergence | Peak in Excess Liquidity |
| Stocks | Down | Flat |
| Yields | Up | Up |
| Dollar | Up | Down |
| Gold | Flat | Down |
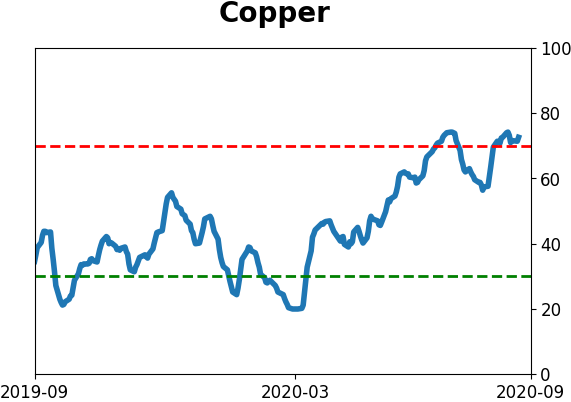
Copper vs. 10-Year Yields
There have been a lot of head-scratching moves in 2020, most of them in the past several months. The cross-currents battling it out in all markets are astounding, and many have never been seen before. One of the most consistent relationships, which has broken down in recent months, is between the price of copper futures and the yield on 10-year Treasury notes.
The two don't move hand-in-hand, but historically they have had a tight positive correlation. The same influences which would push copper higher (industrial demand and economic growth) are the same that would push yields higher. Until lately.
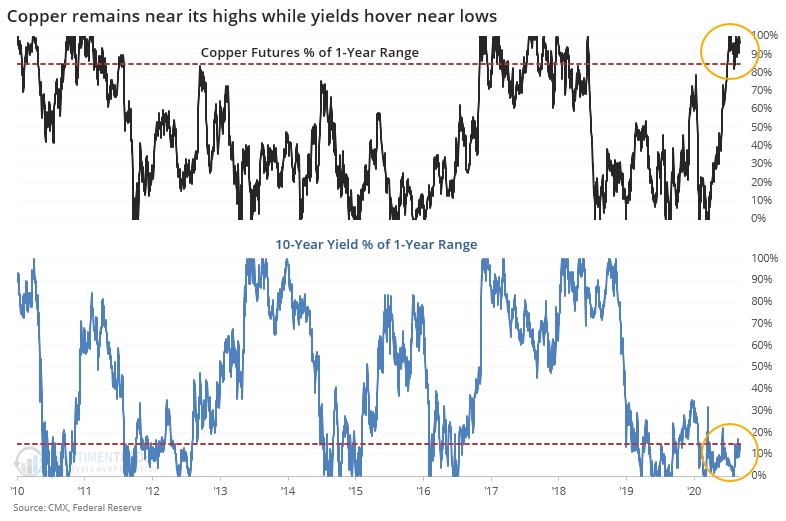
In recent months, copper has consistently held in the top 85% of its one-year range, while the 10-year yield has been stuck near the bottom 15% of its range.
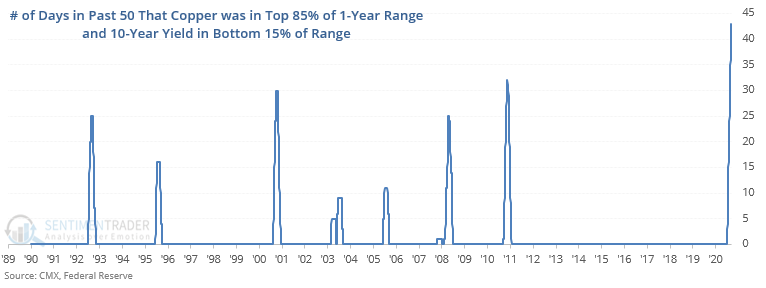
This has been going on for much of the past 50 days, which is by far a new record.
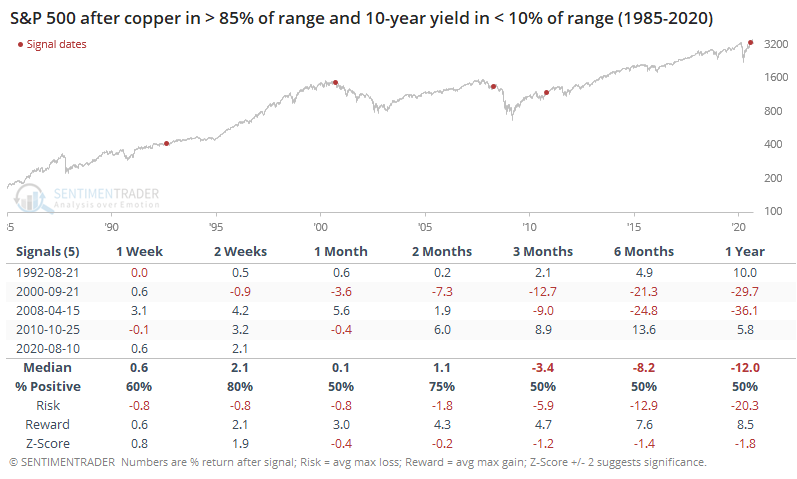
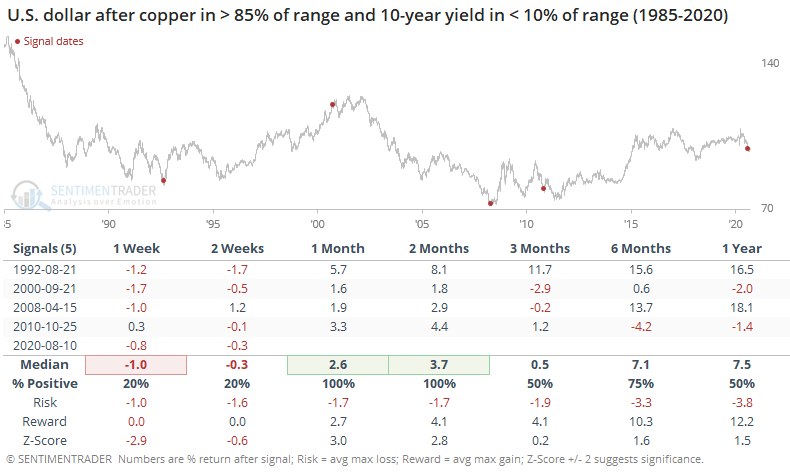
For stocks, this kind of divergence was a mixed blessing, with varied returns over the medium- to long-term.
The dollar rebounded over the medium-term.
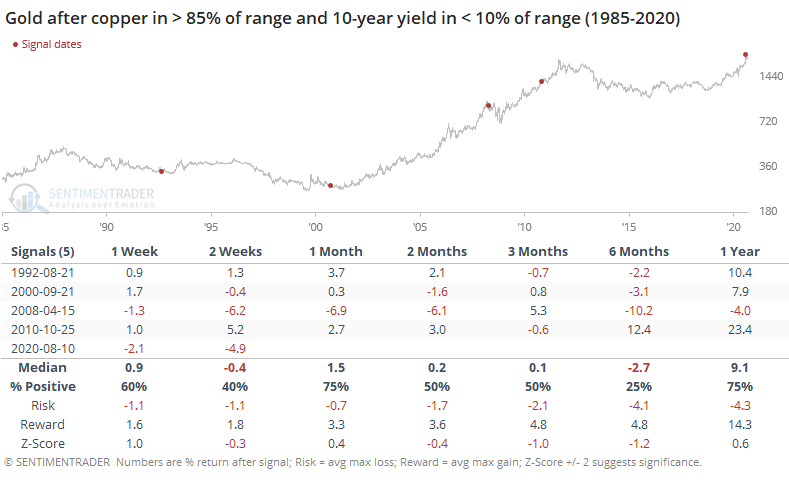
That was a headwind for gold but with only one large decline from 2008. The others saw rising prices longer-term.
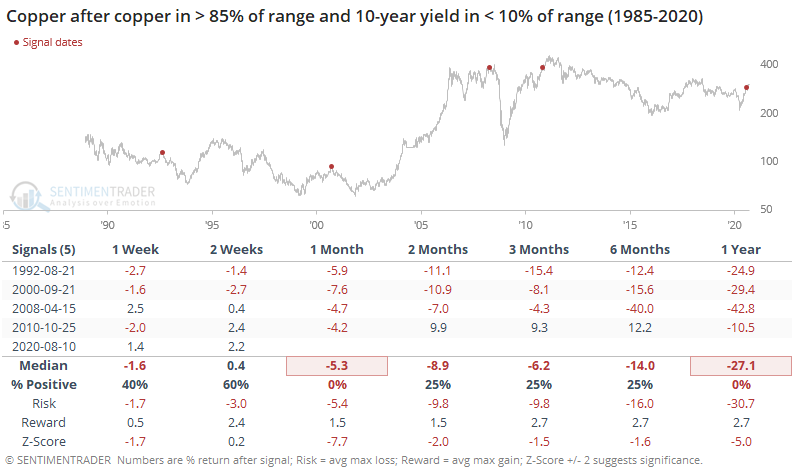
Copper itself took the brunt of the selling.
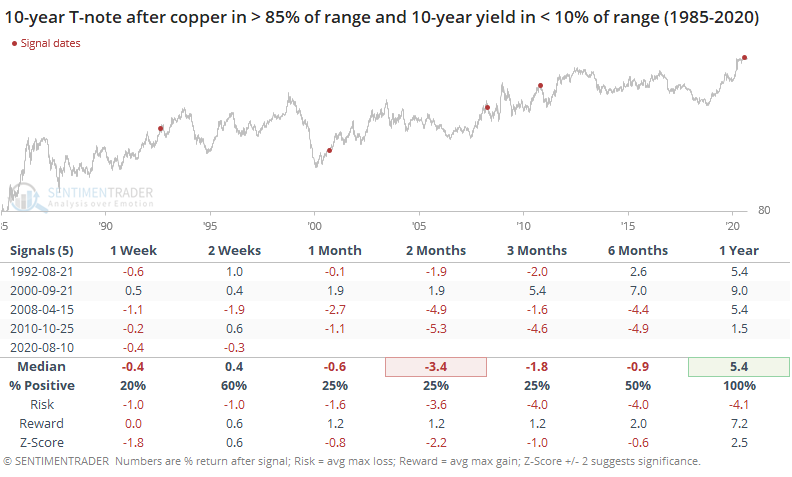
10-year Treasury futures also tended to decline (meaning yields rose) over the medium-term, but a year later bond prices were higher.
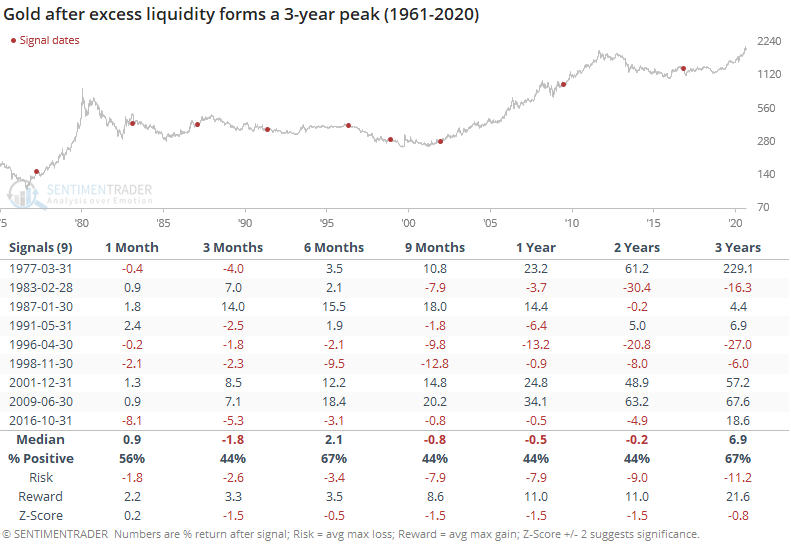
Excess Liquidity
The primary reason for the disconnect between yields and economically-sensitive instruments like copper are the fundamental factors of generous fiscal and monetary stimuli coupled with actively-suppressed interest rates.
As the Daily Shot highlighted, there is a record amount of excess liquidity in the system, defined by the year-over-year growth in M2 money supply minus the year-over-year growth in U.S. GDP.
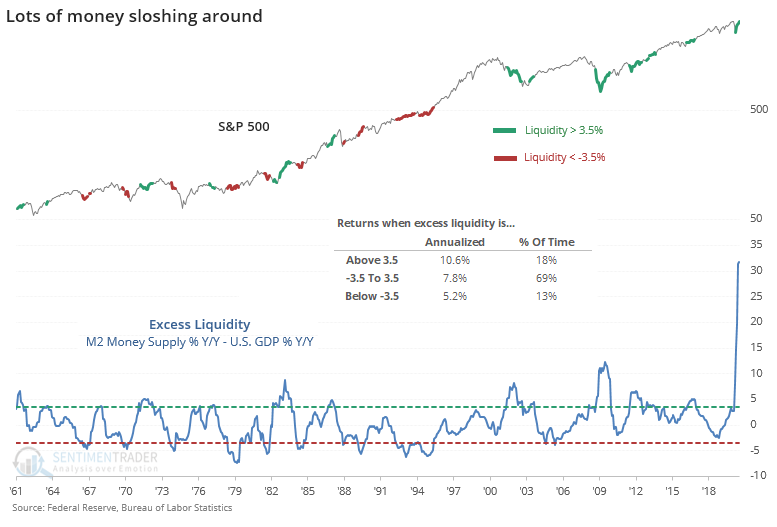
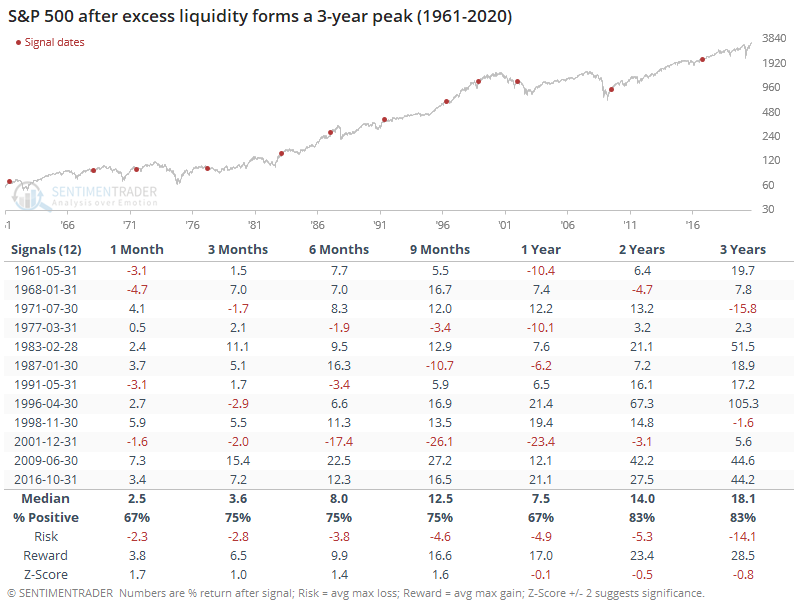
Stocks, and many other financial assets, tend to do well when excess liquidity is high. The issue is that it has already slowed down and has likely peaked.
That meant okay, but below average, long-term returns for stocks.
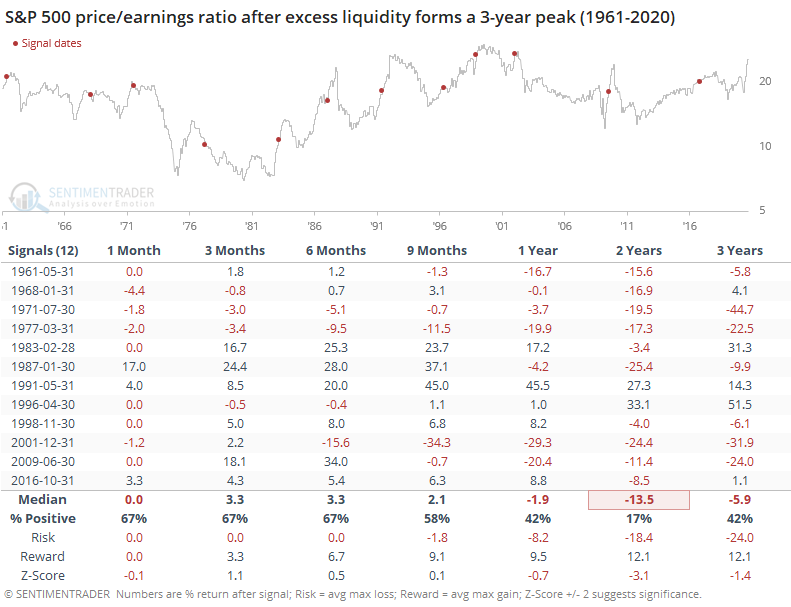
Perhaps most importantly, it led to a lower price/earnings multiple for the index. That's a particularly sensitive issue now since the P/E is at the upper end of its historical range. Only twice, in 1991 and 1996, did the S&P's multiple rise over a 2-year time frame, and both of those times the starting value was below 20.
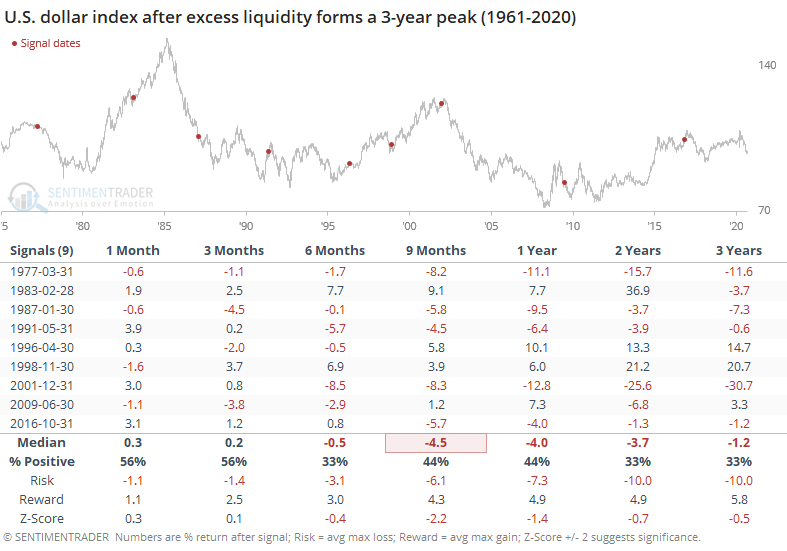
The dollar tended to decline.
But that wasn't necessarily a big positive for gold.
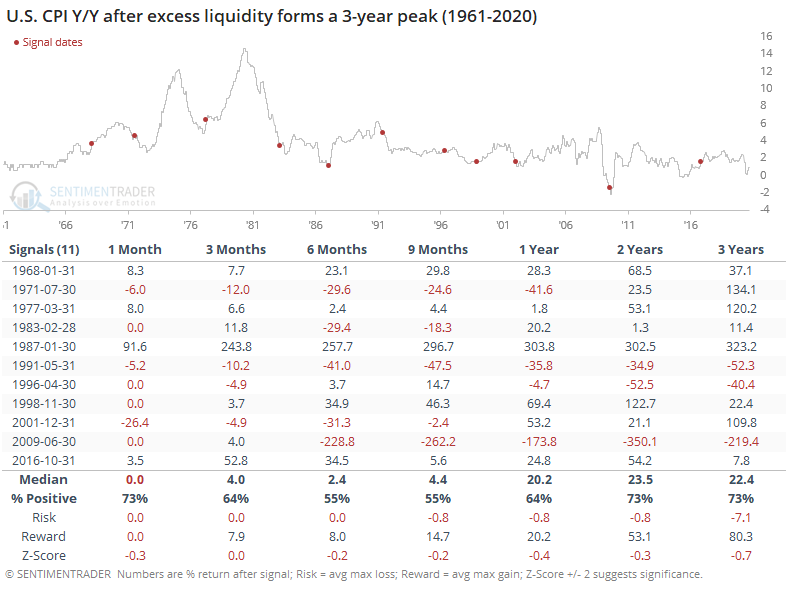
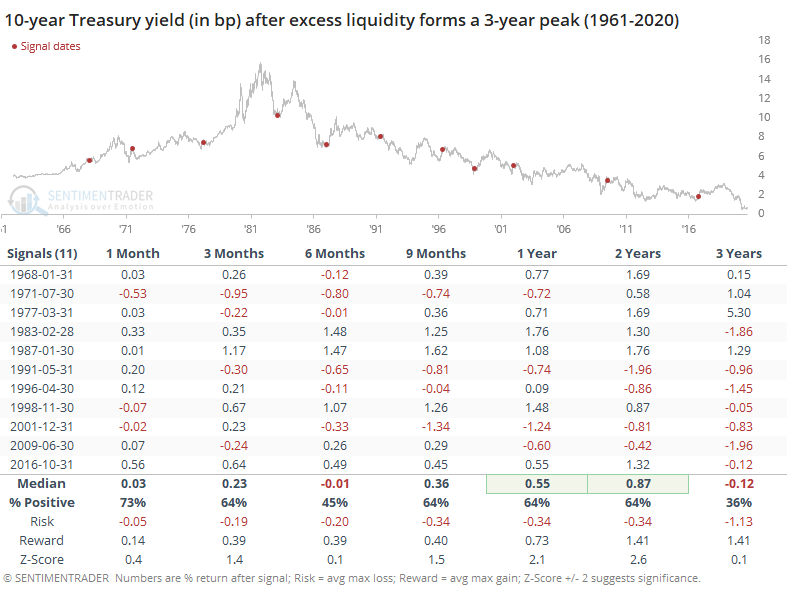
The growth in inflation was positive, with some exceptions.
And that tended to coincide with a rise in 10-year yields.
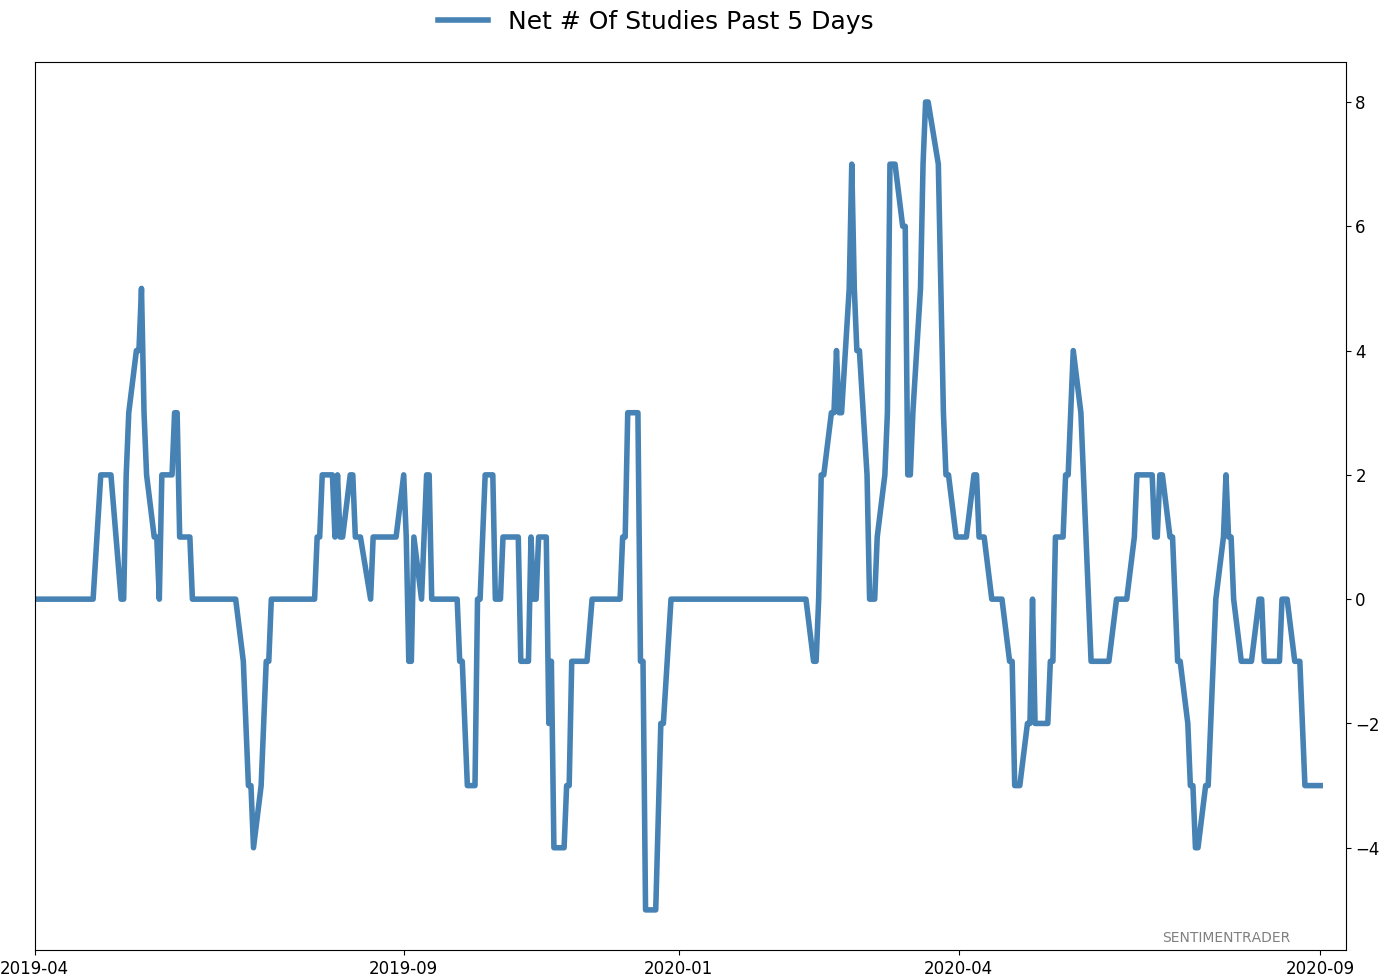
Active Studies
| Time Frame | Bullish | Bearish | | Short-Term | 0 | 1 | | Medium-Term | 1 | 12 | | Long-Term | 47 | 2 |
|
Indicators at Extremes
Portfolio
| Position | Weight % | Added / Reduced | Date | | Stocks | 15.2 | Reduced 4.2% | 2020-09-03 | | Bonds | 30.0 | Added 30% | 2020-09-09 | | Commodities | 2.4 | Reduced 2.1%
| 2020-09-04 | | Precious Metals | 5.0 | Added 5% | 2020-09-09 | | Special Situations | 4.9 | Added 5.1% | 2020-09-03 | | Cash | 42.5 | | |
|
Updates (Changes made today are underlined)
After stocks bottomed on March 23rd, they enjoyed a historic buying thrust and retraced a larger amount of the decline than "just a bear market rally" tends to. Through June, there were signs of breadth thrusts, recoveries, and trend changes that have an almost unblemished record at preceding higher prices over a 6-12 month time frame. On a shorter-term basis, our indicators have been showing high optimism, with Dumb Money Confidence recently above 80%, along with signs of reckless speculation during what appears to be an unhealthy market environment, historically a bad combination. While there are certainly some outlier indicators that are showing apathy or even outright pessimism, a weight-of-the-evidence approach suggests high risk over a multi-week to multi-month time frame. That has been the case since July, even arguably June and yet the major indexes hit continual new highs through late August. With the indicators and studies failing to precede any weakness, I've been hesitant to lower my already-low exposure. I am getting increasingly anxious about the oddities we're seeing, though, and lowered it again. This account is mostly about comfort with risk for me, and right now I'm not at all comfortable with any of it. In more than 25 years of experience, this is the oddest market I've ever seen. I lowered exposure again - likely the lowest I'm willing to go at this point given longer-term positives - and decided to switch to an equal-weight version of the S&P 500 index. I've become intensely uncomfortable with the concentration in the cap-weighted index. Our studies have been mixed with regard to the potential for the equal-weight version to outperform the cap version going forward, so historical support isn't overwhelming. I'm also increasingly interested again in energy stocks, starting with a small allocation. I got burned in March with the unprecedented geopolitical spat that hammered those stocks then but the longer-term setup is decent. In this account, I’ve roughly followed what has become known as the All Weather portfolio popularized by Ray Dalio. It allocates across four broad assets, designed to hold up no matter the market environment. The goal is modest positive returns while limiting large, sustained losses. I typically use popular ETFs, with low costs. At times, I will swap out for a fund I believe has better prospects, or simply lower fees if not. At other times, I will diverge quite a bit from baseline allocations, largely depending on the indicators and studies we discuss on the site. I've gotten away from this in the past, using "cash" as a substitute for "bonds" and with rates stuck at 0%, that has become less appetizing. I'm trying to get back more toward the baselines with less dramatic swings in either direction. The base allocation I use is the following: Stocks: 35%
Bonds: 45%
Precious Metals: 7.5%
Commodities: 7.5%
Cash / Special Opportunities: 5%
RETURN YTD: -0.9% 2019: 12.6%, 2018: 0.6%, 2017: 3.8%, 2016: 17.1%, 2015: 9.2%, 2014: 14.5%, 2013: 2.2%, 2012: 10.8%, 2011: 16.5%, 2010: 15.3%, 2009: 23.9%, 2008: 16.2%, 2007: 7.8%
|
|
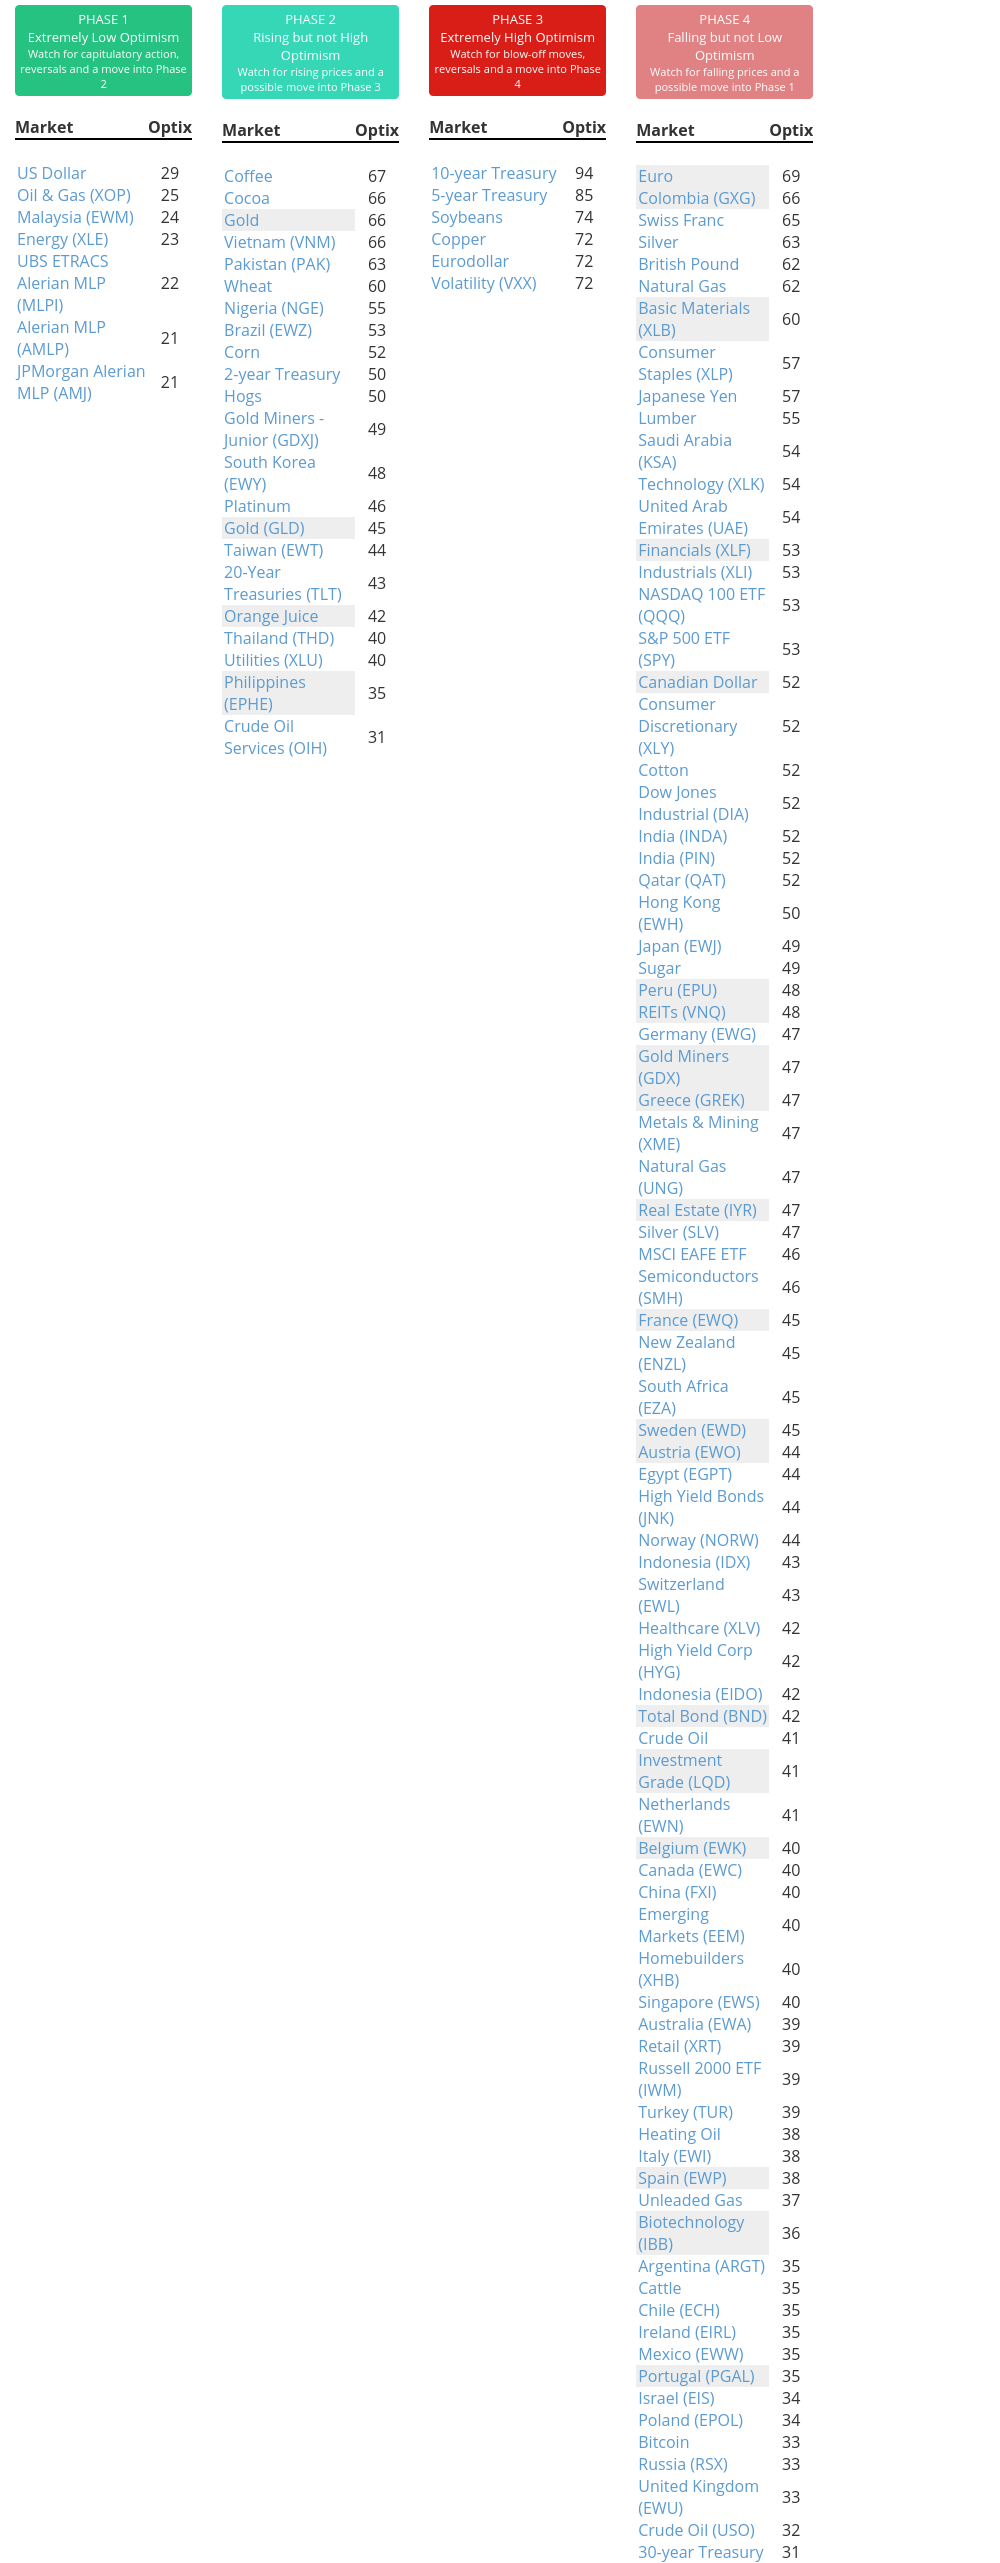
Phase Table
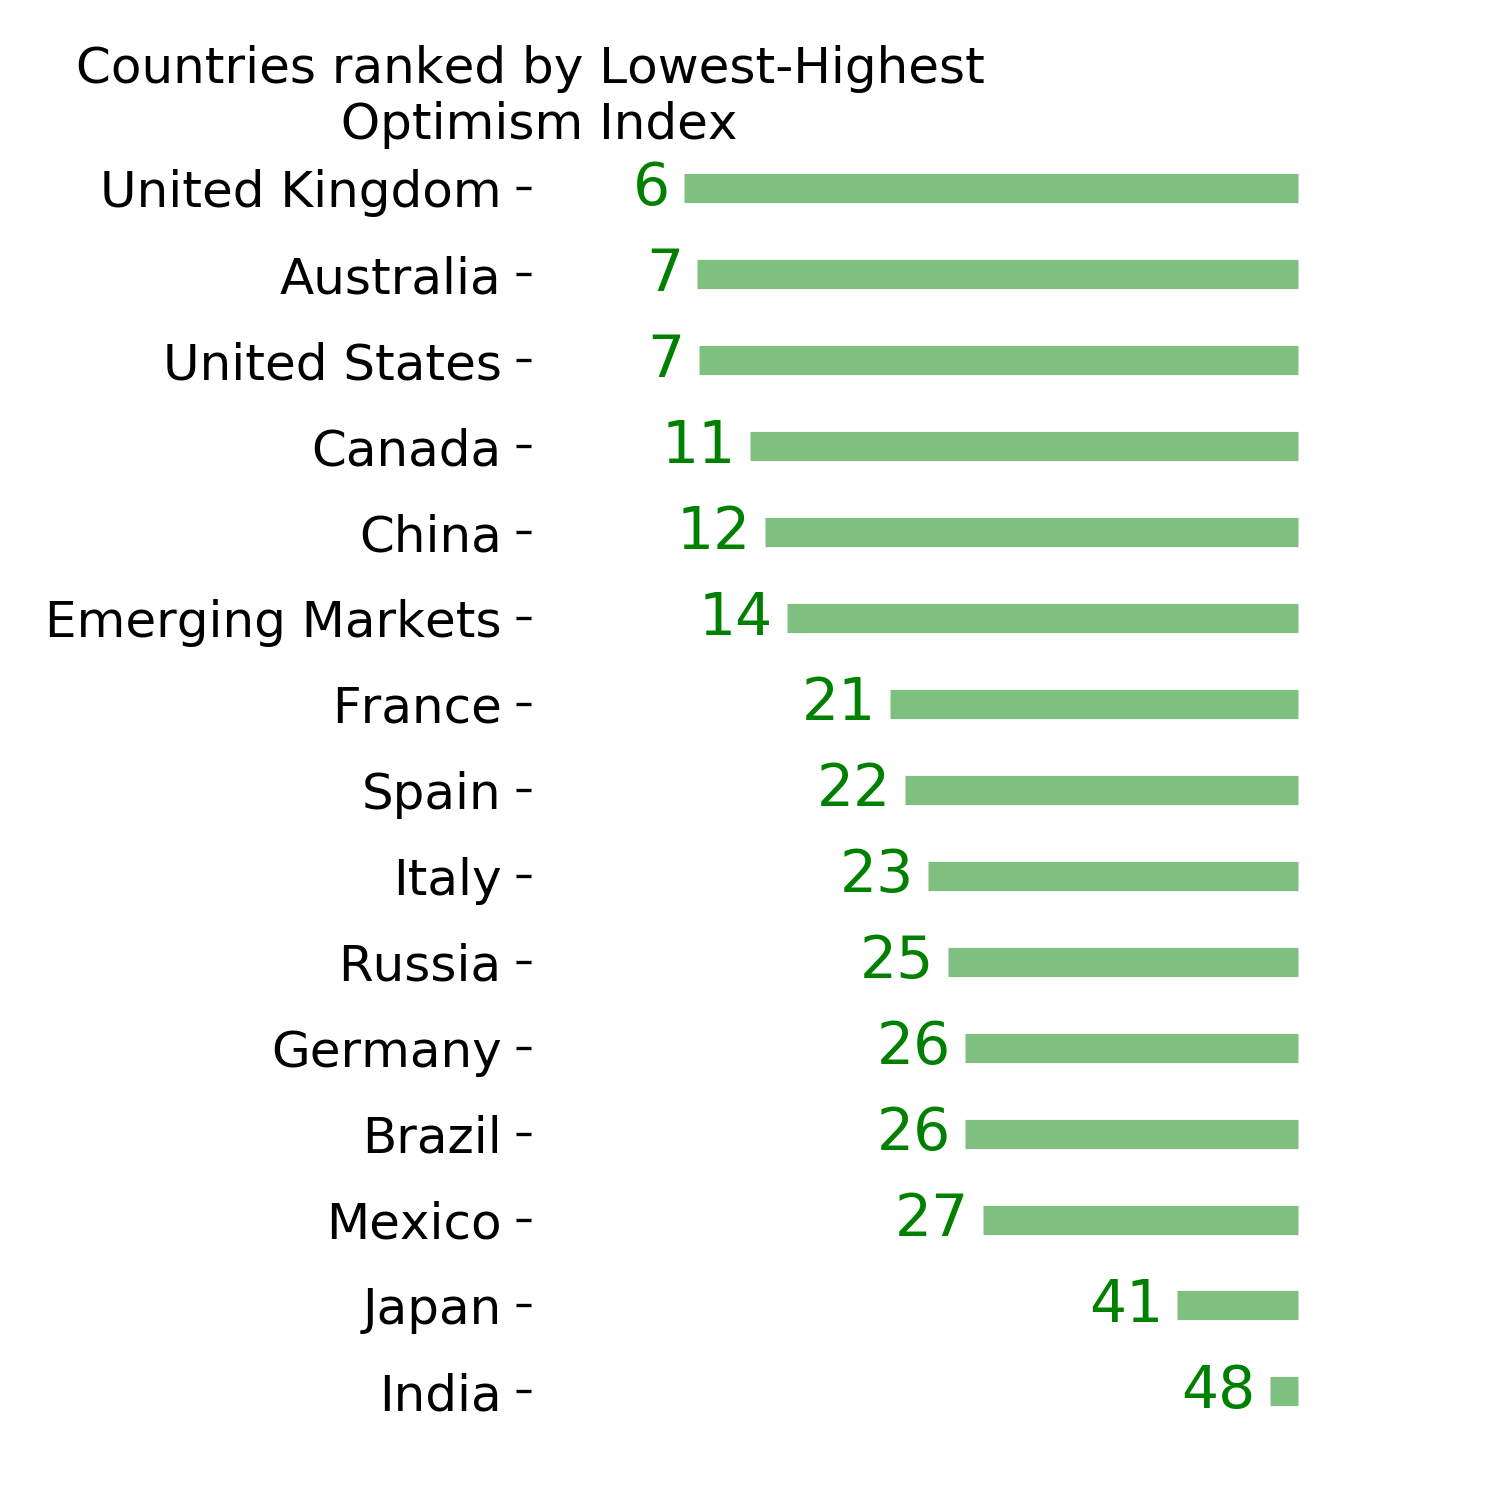
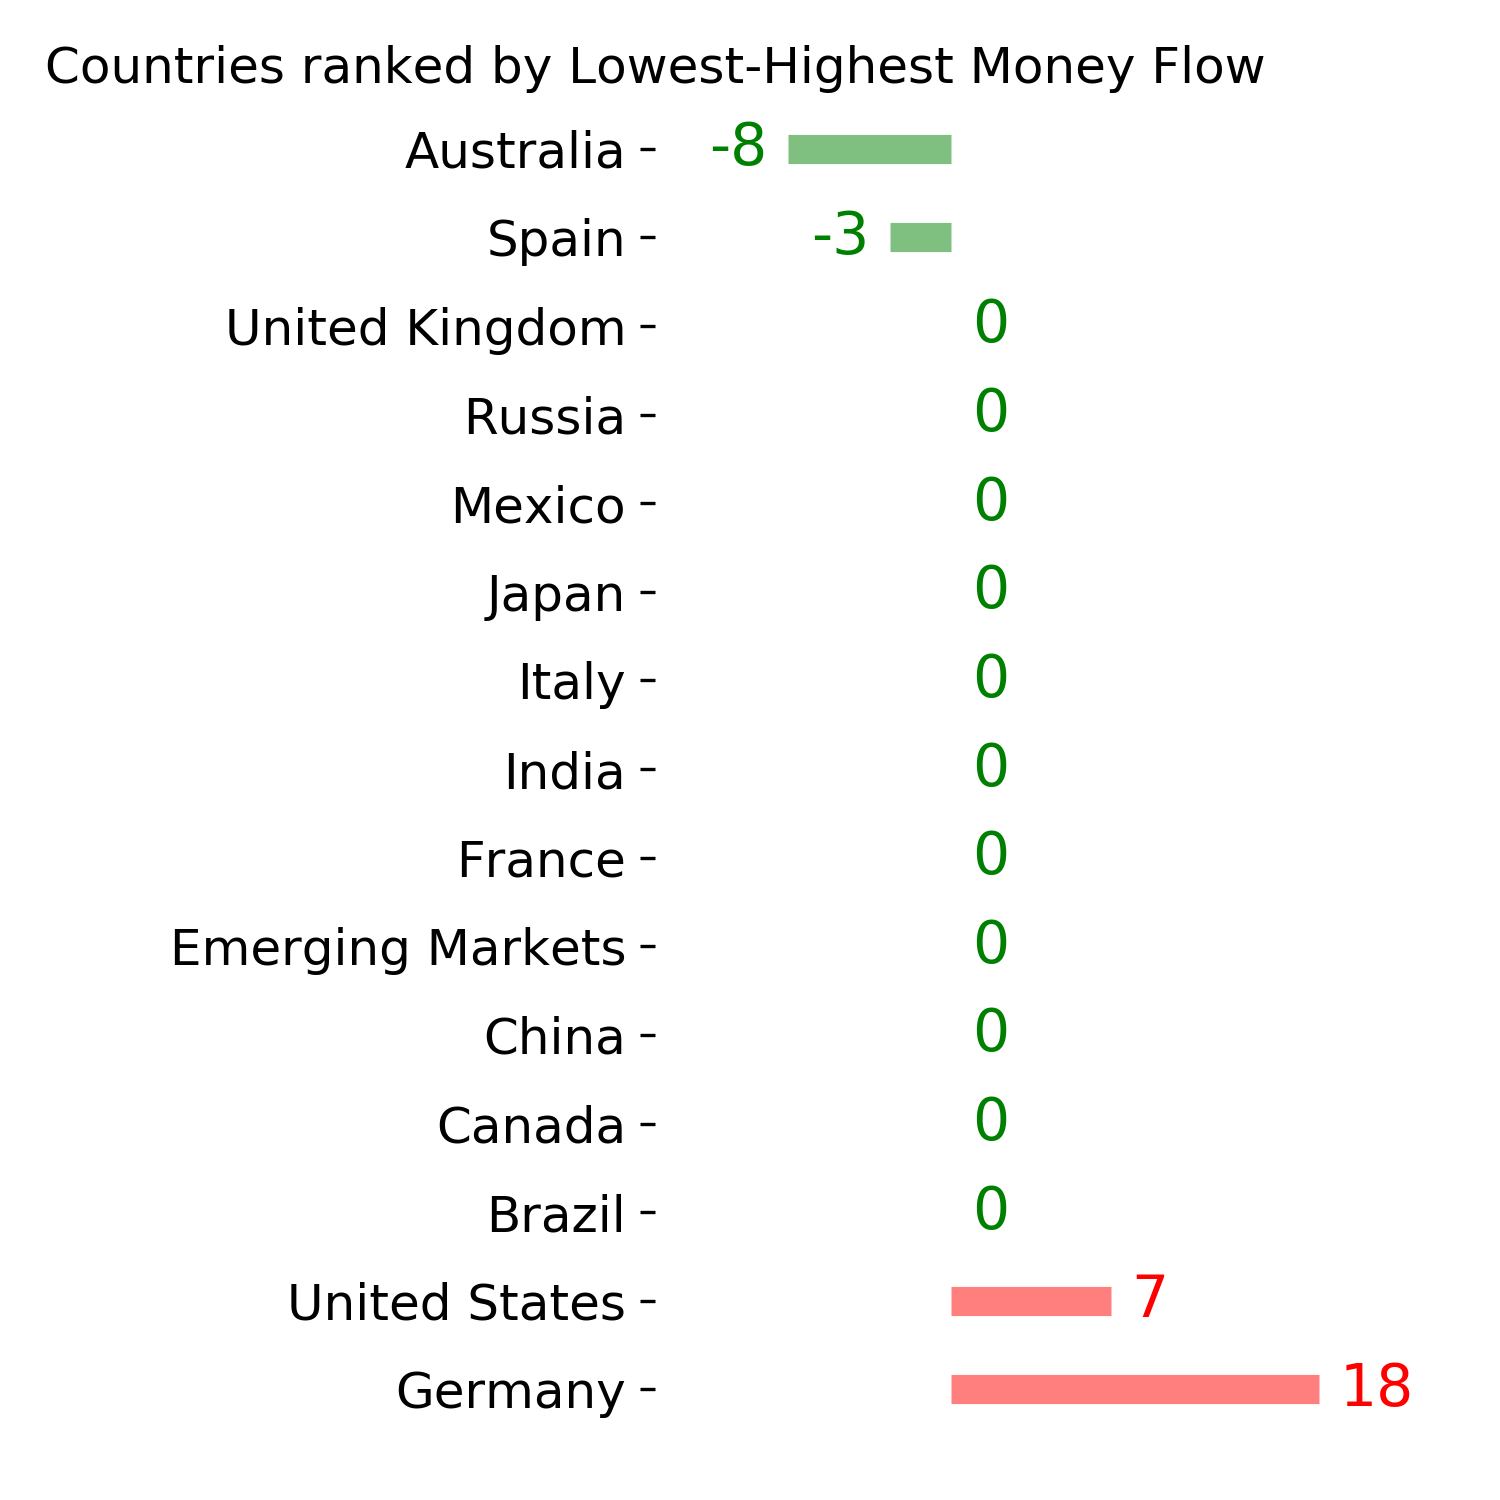
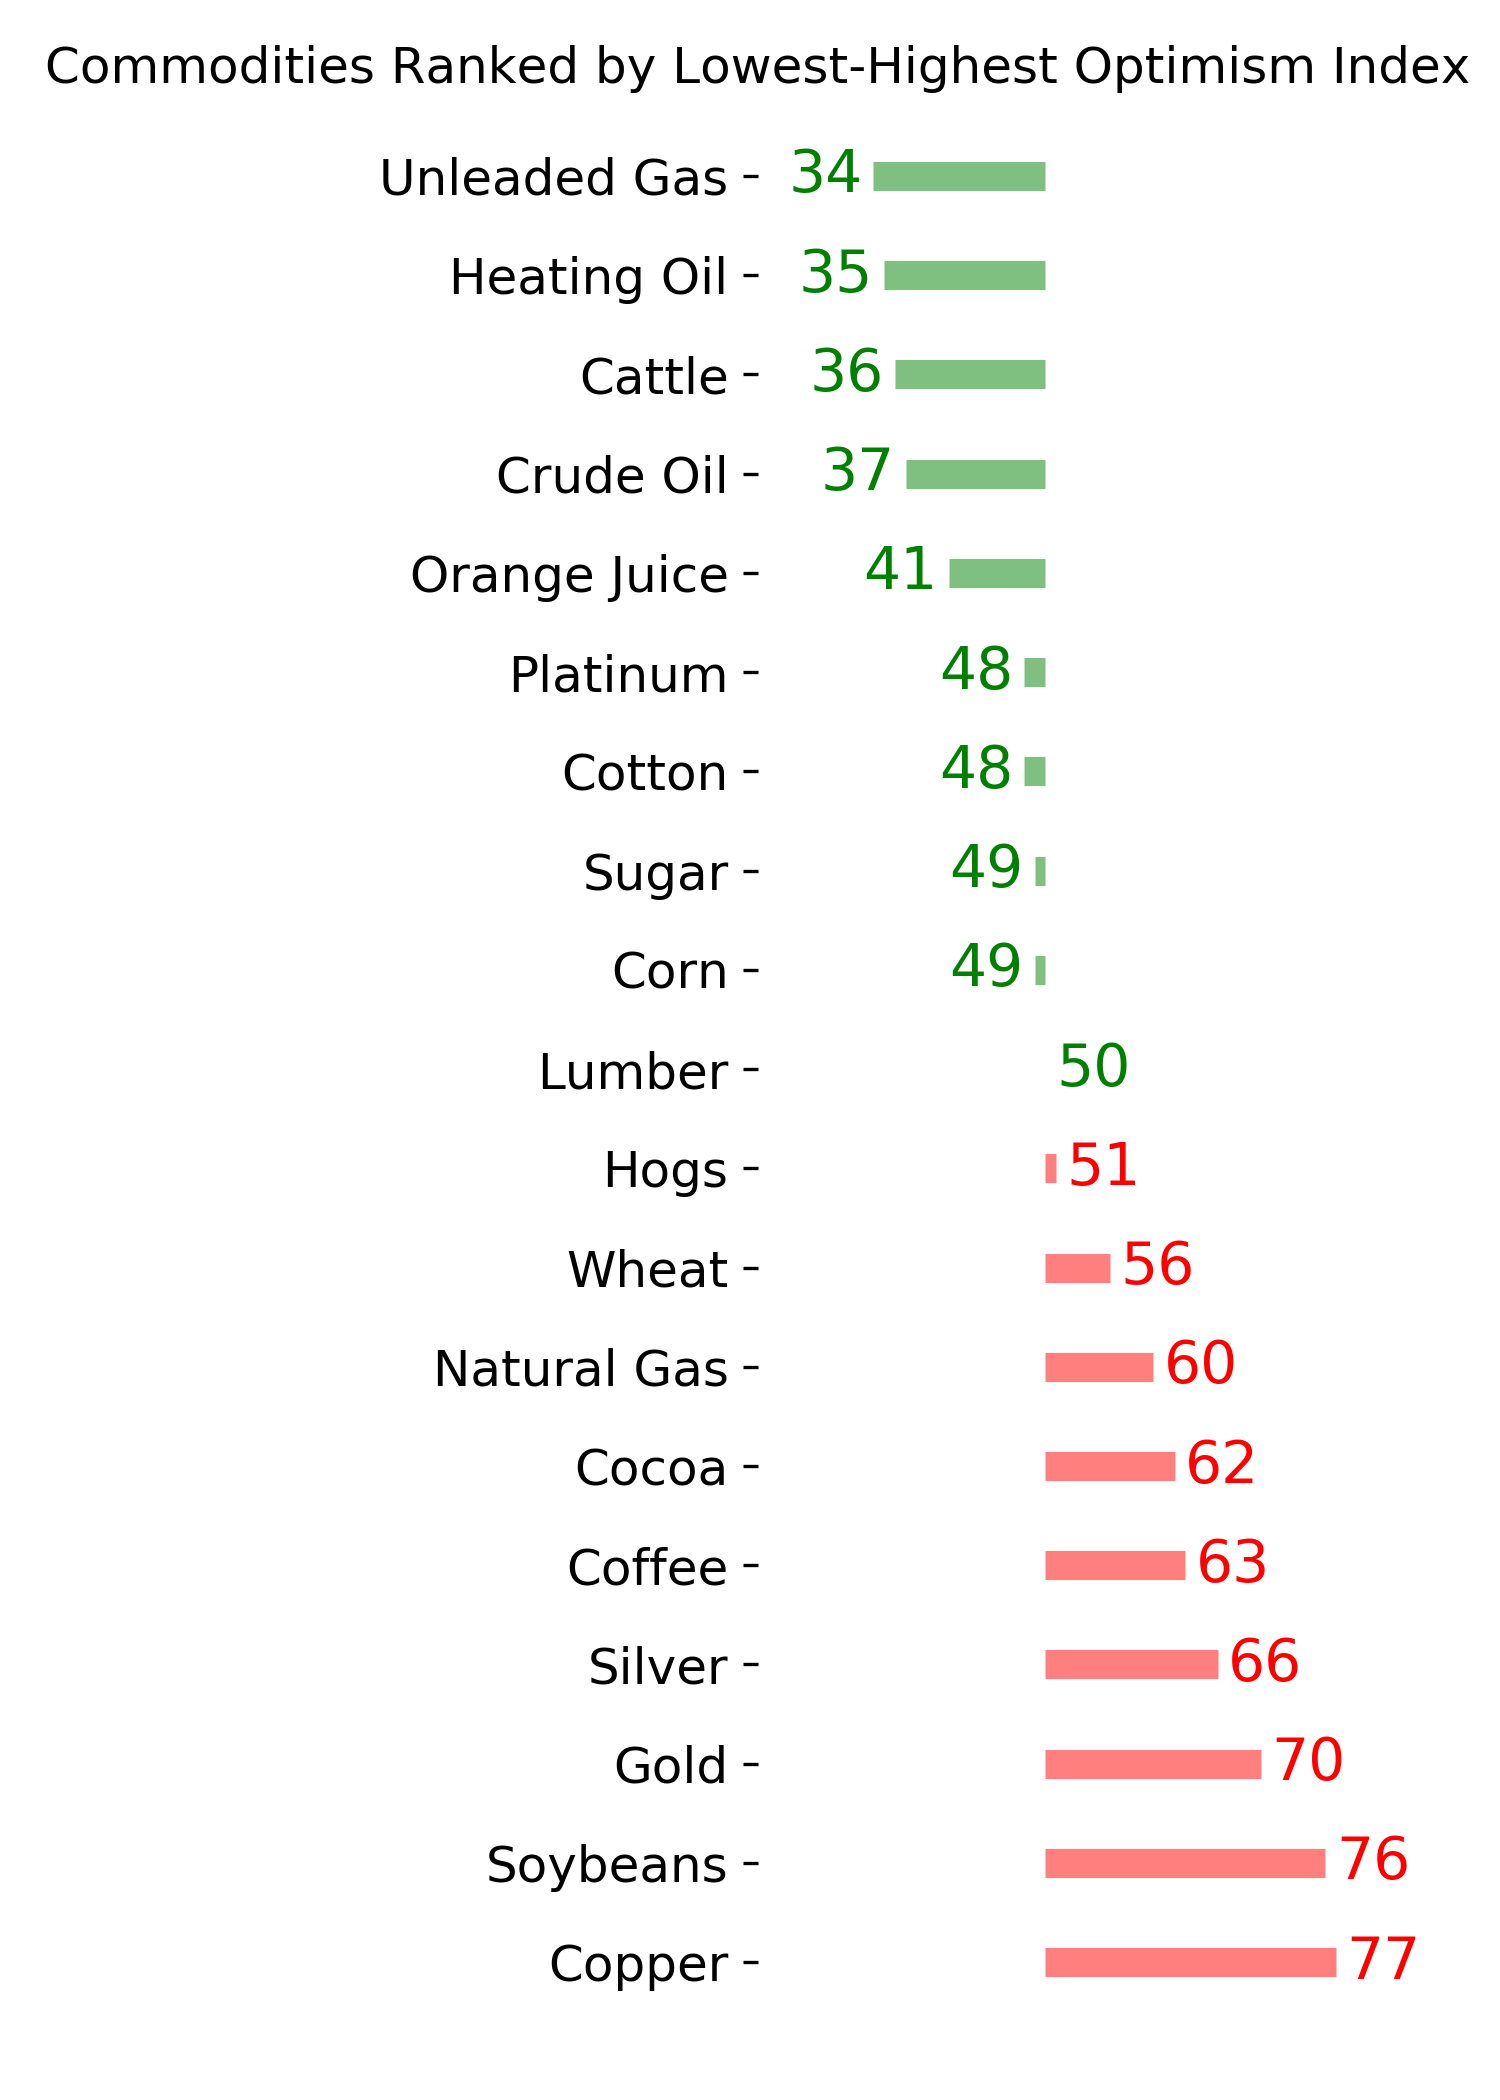
Ranks
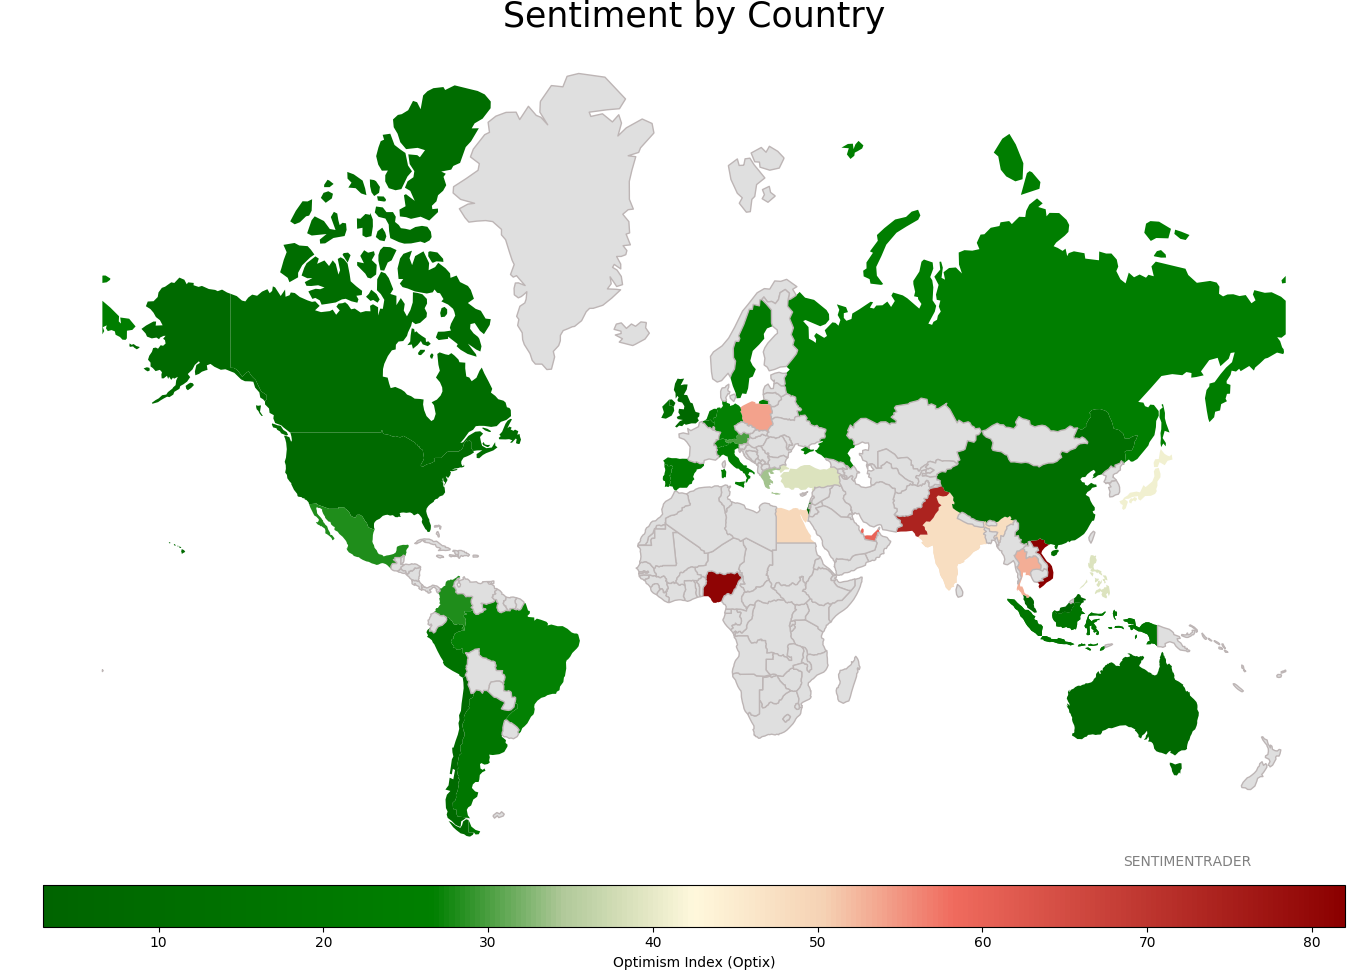
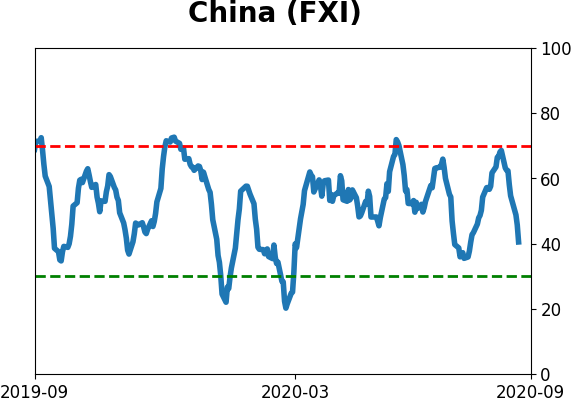
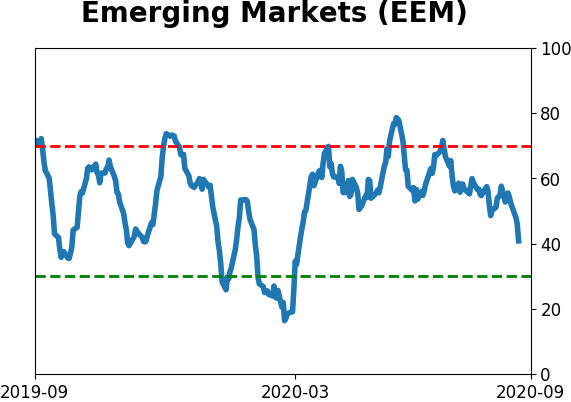
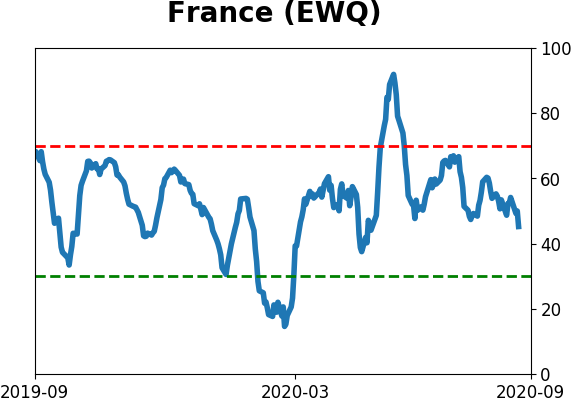
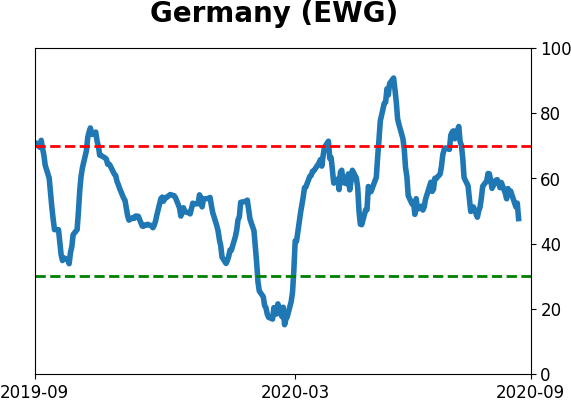
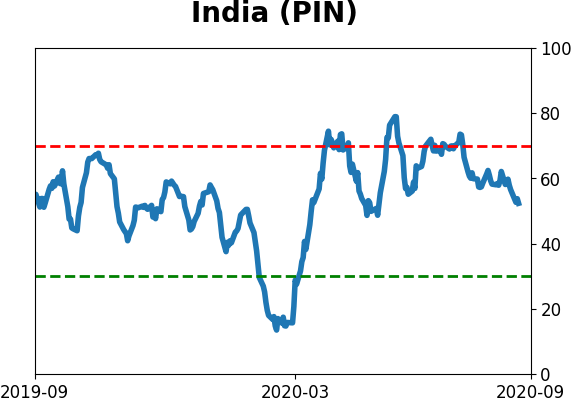
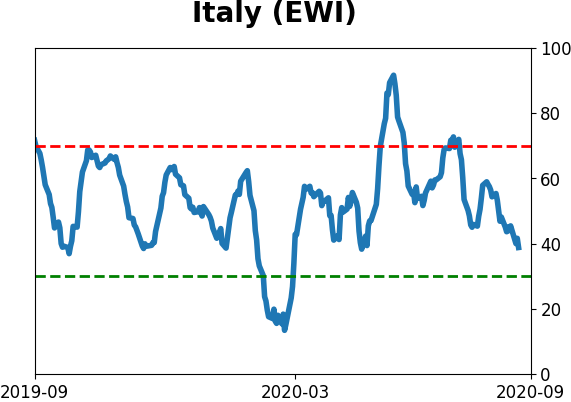
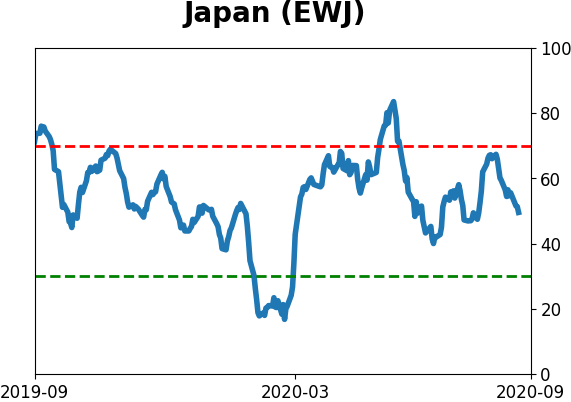
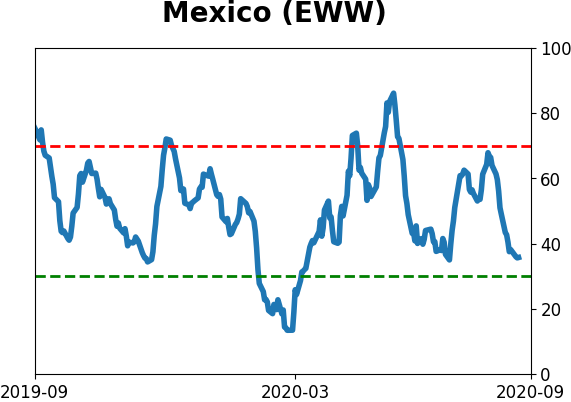
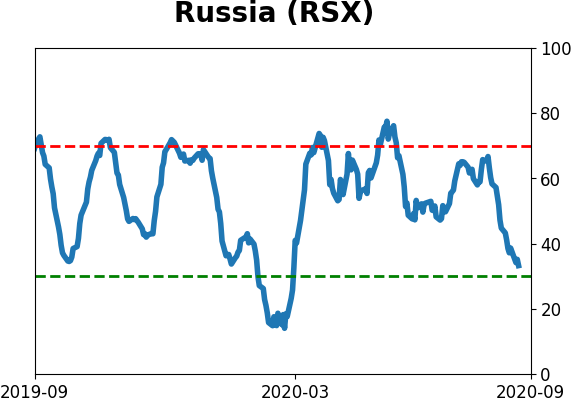
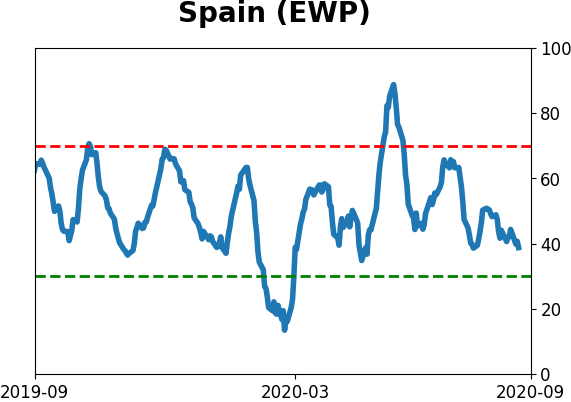
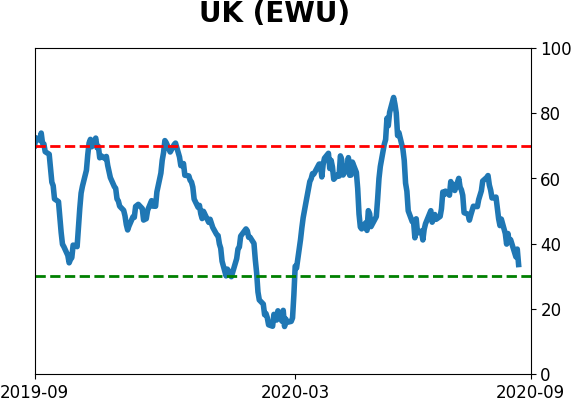
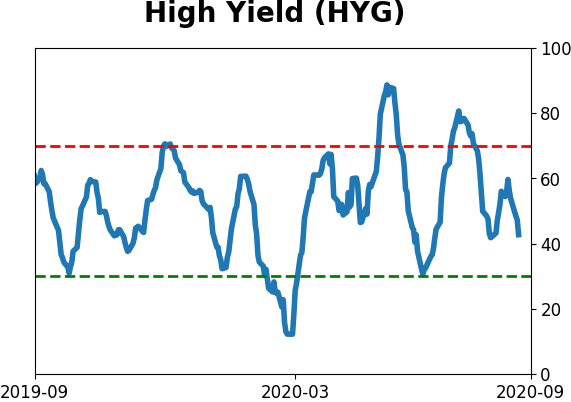
Sentiment Around The World
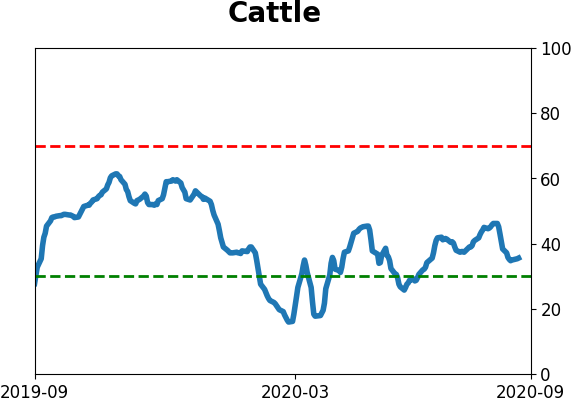
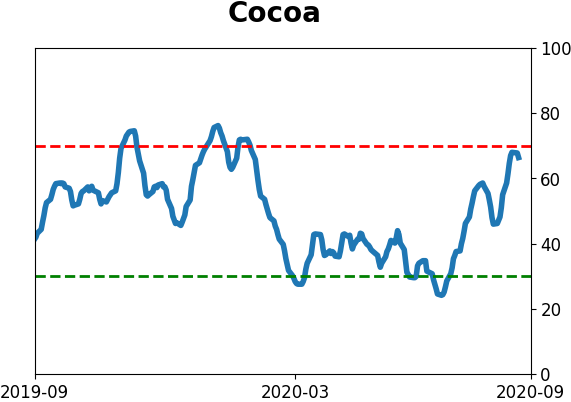
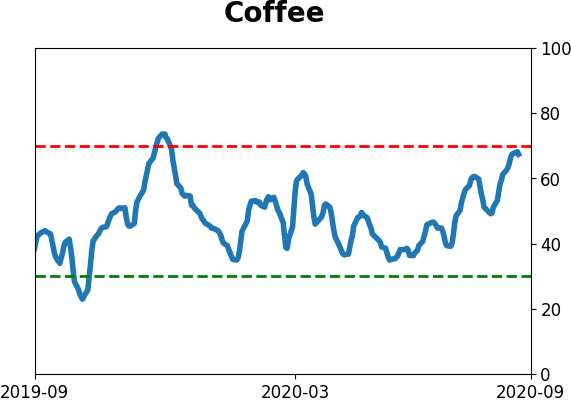
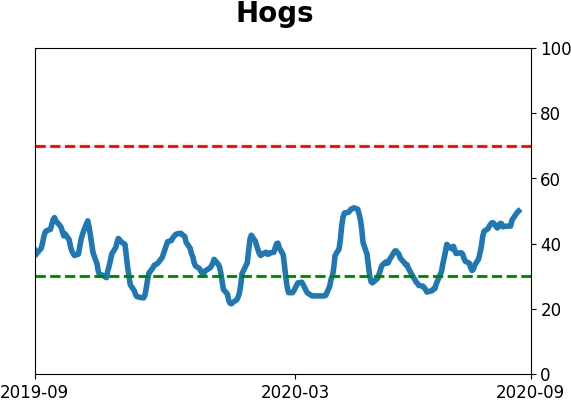
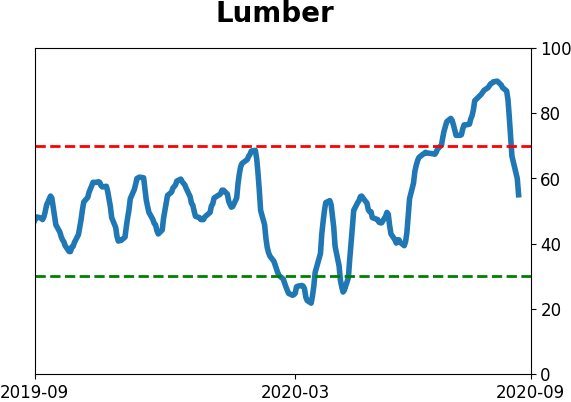
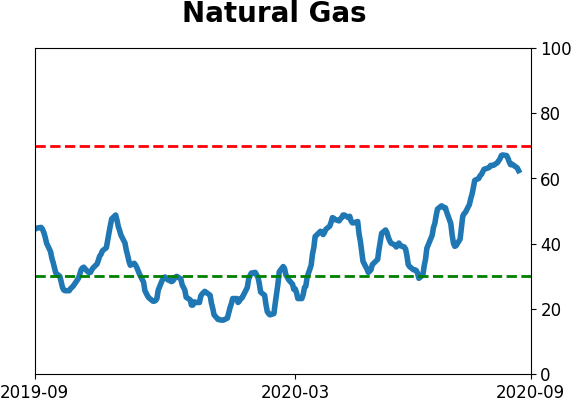
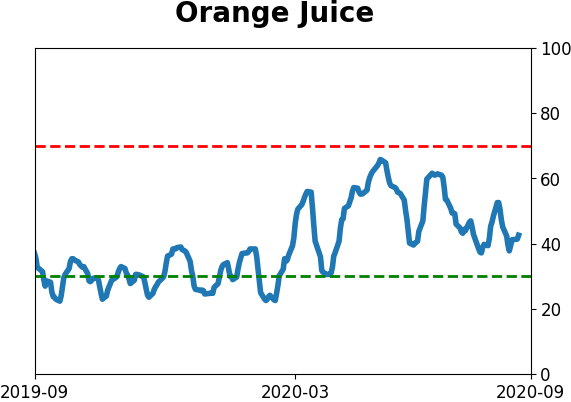
Optimism Index Thumbnails
|
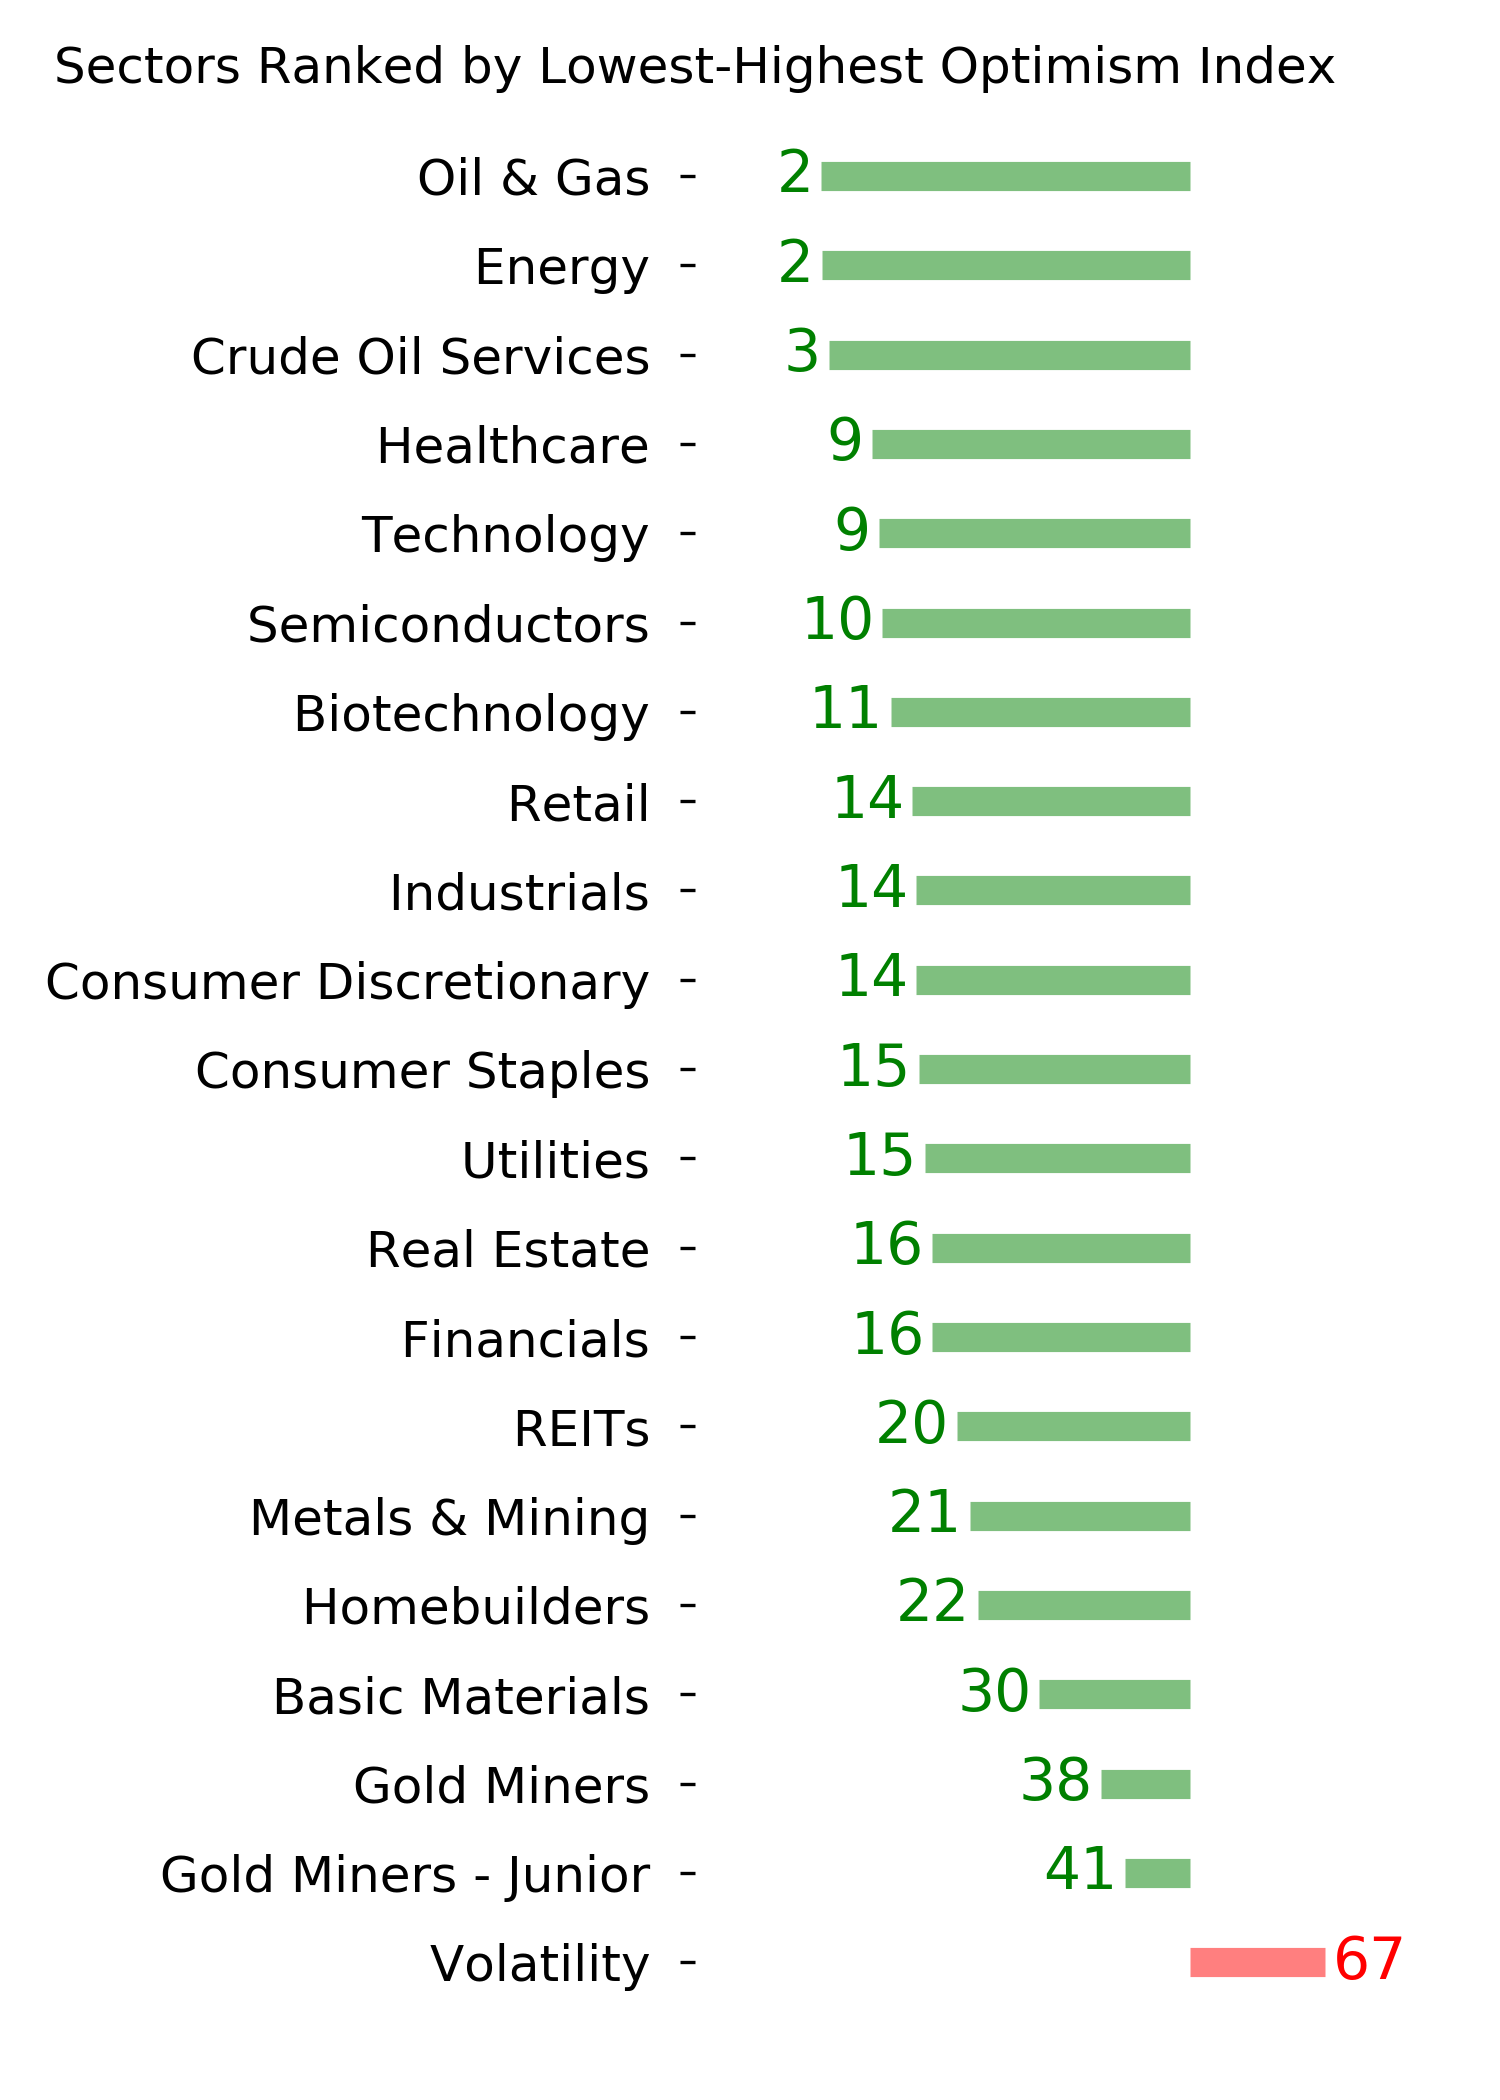
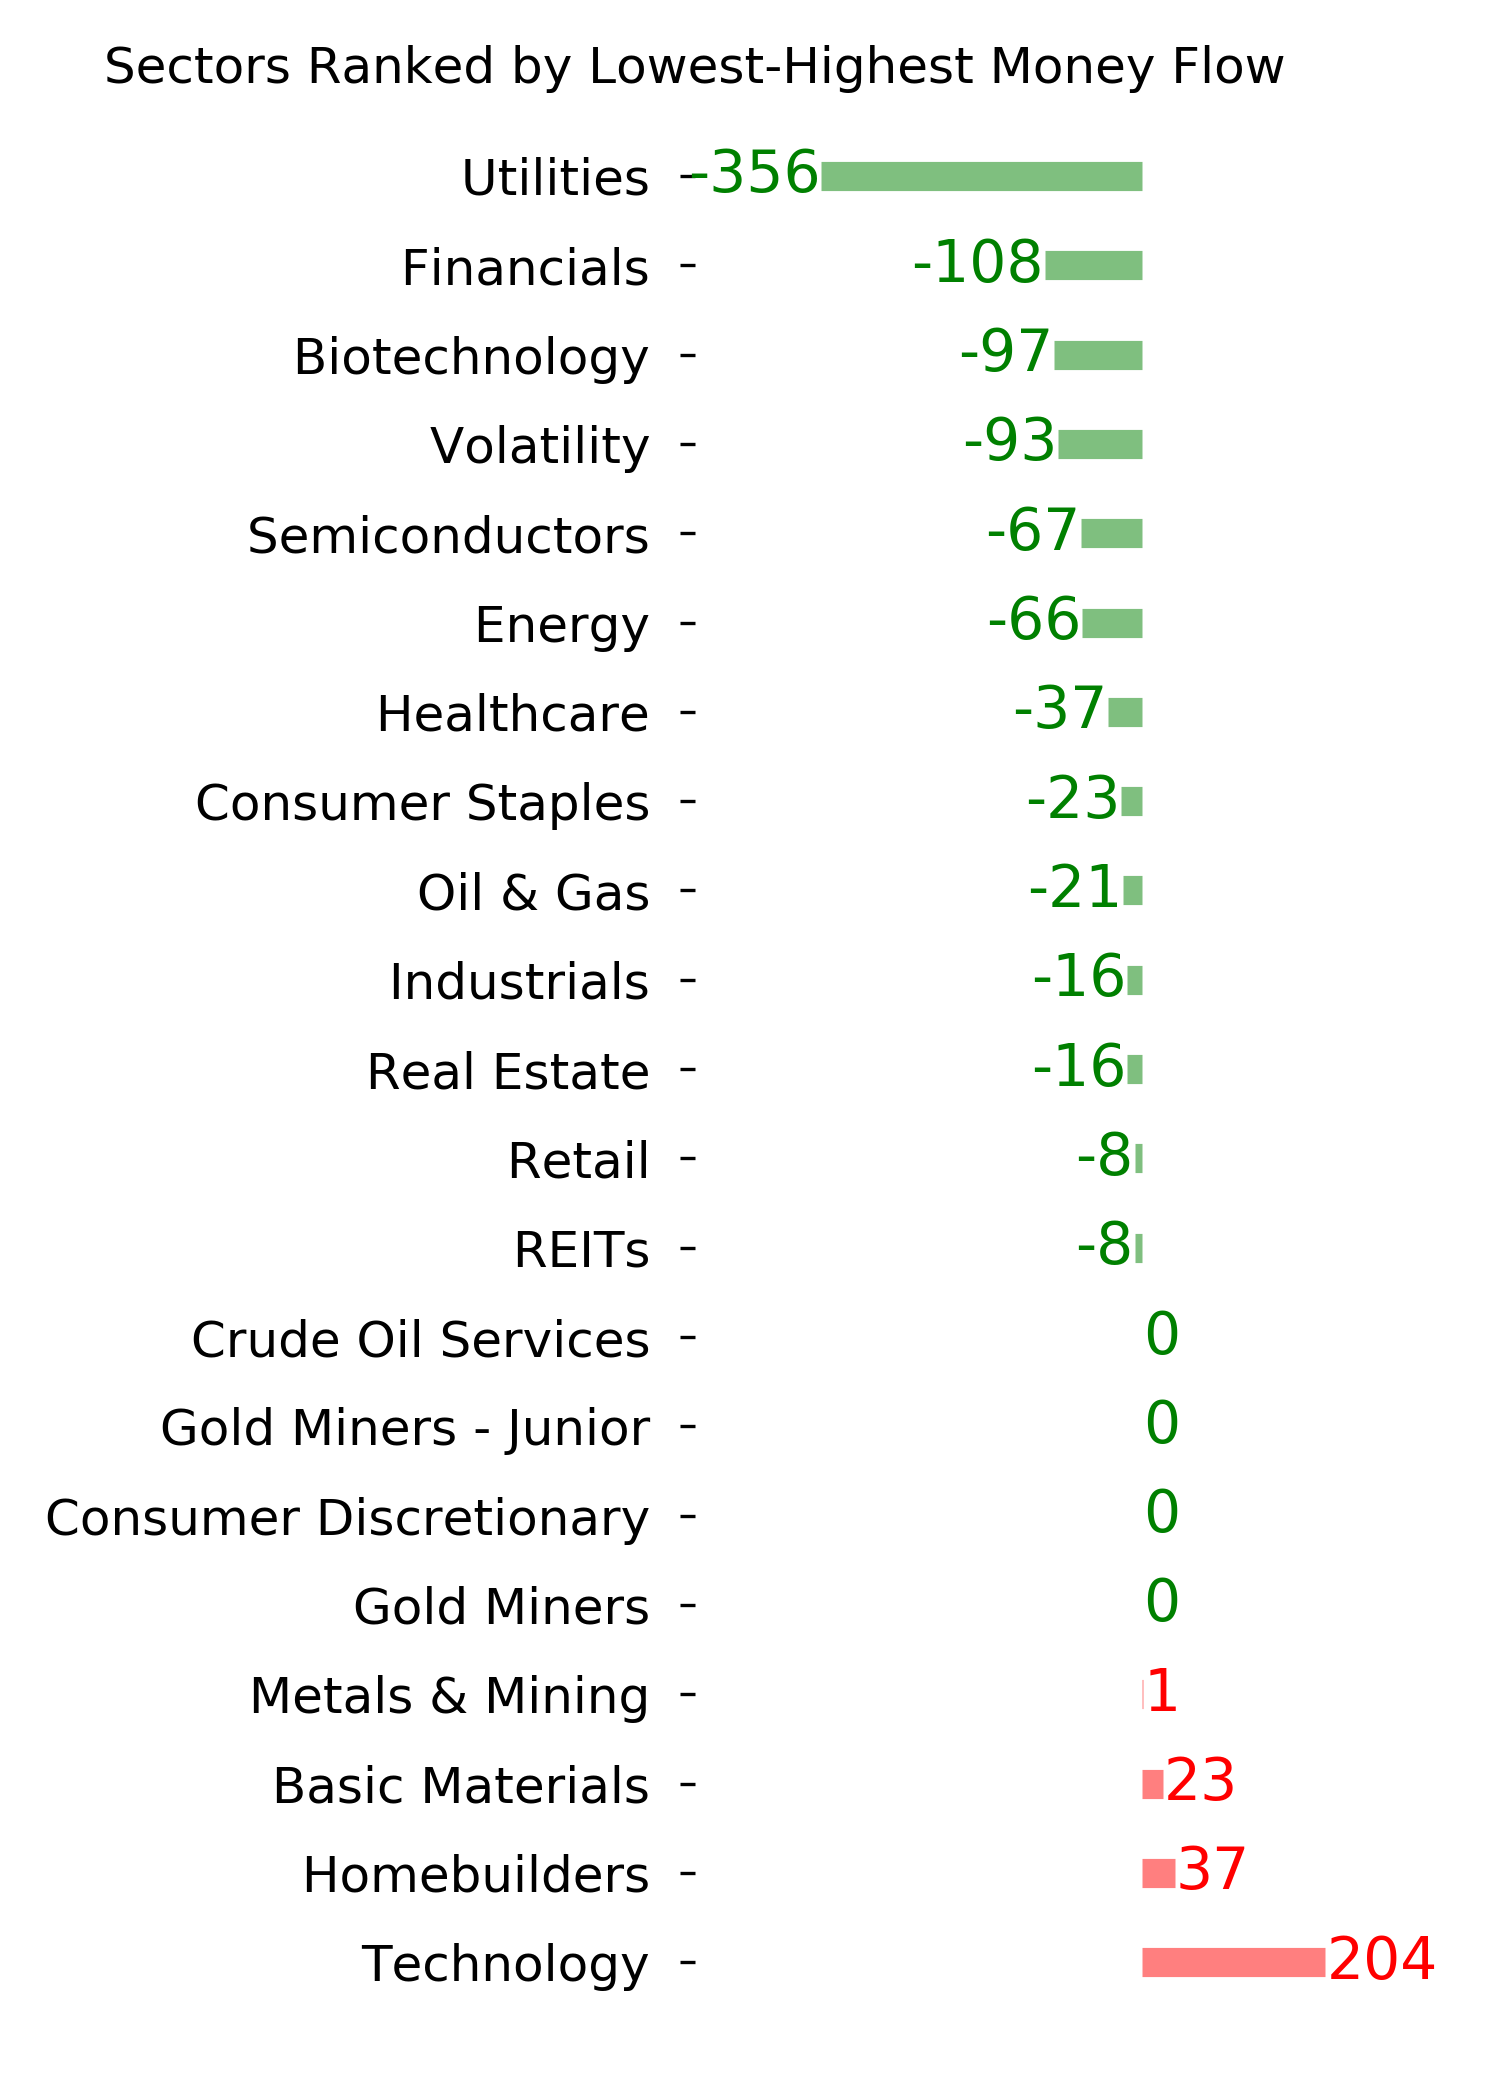
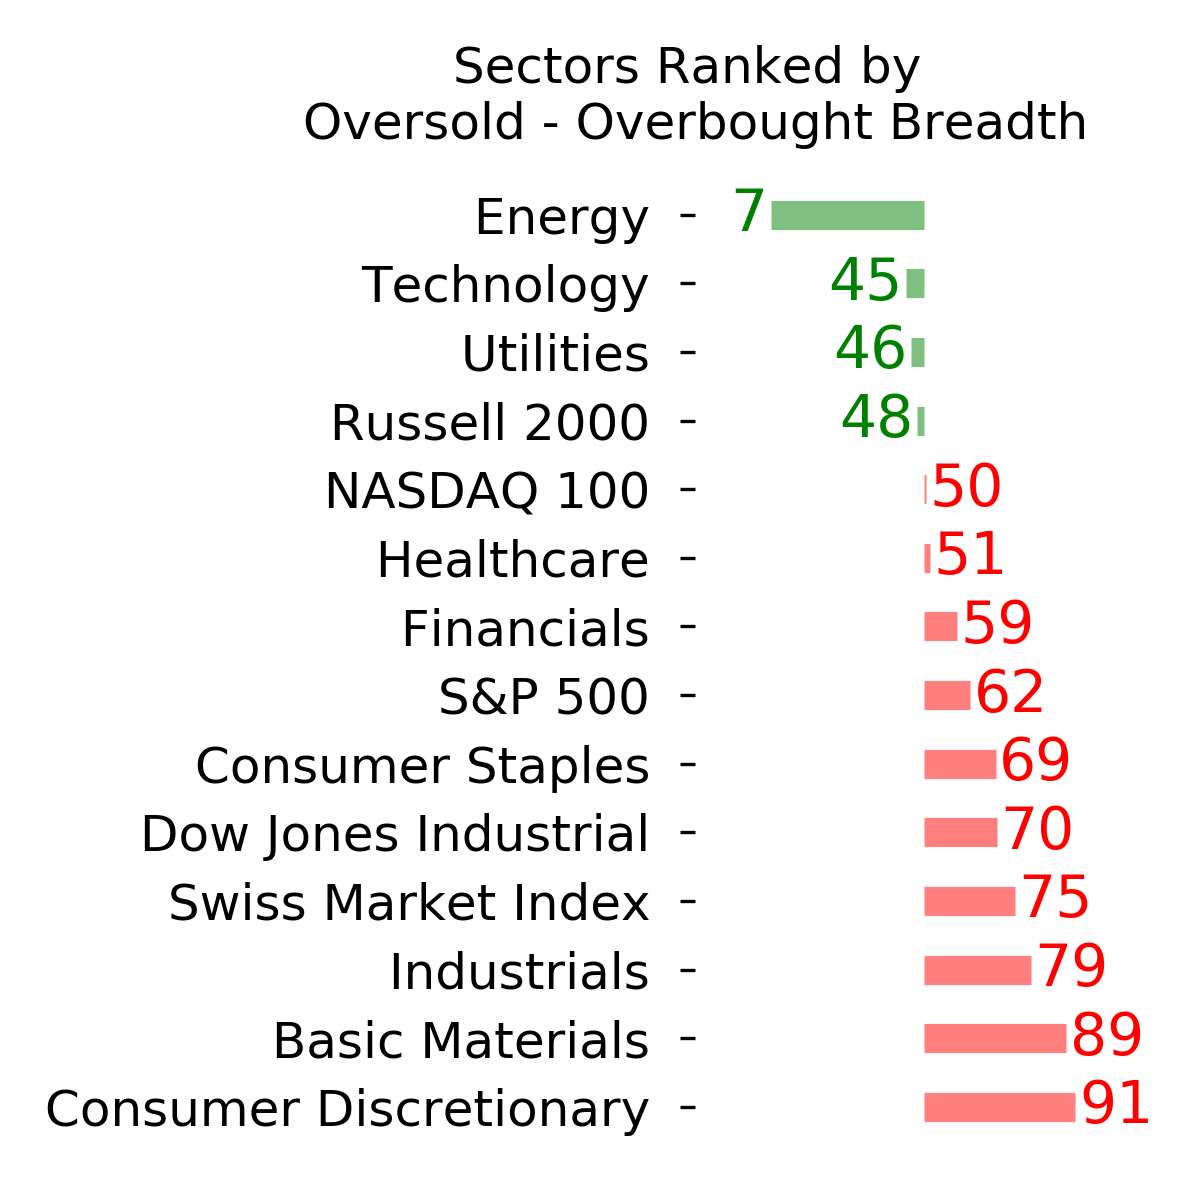
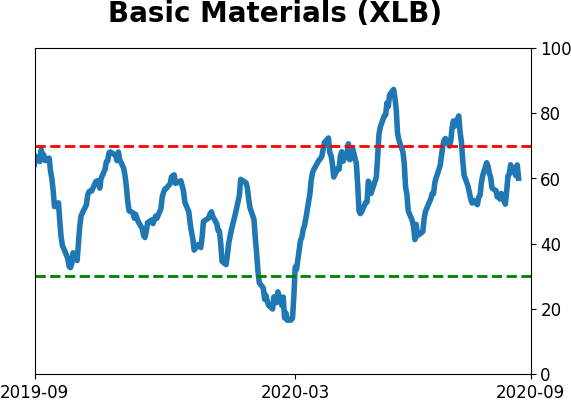
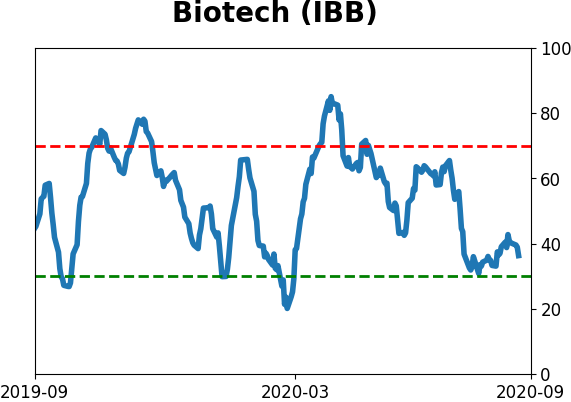
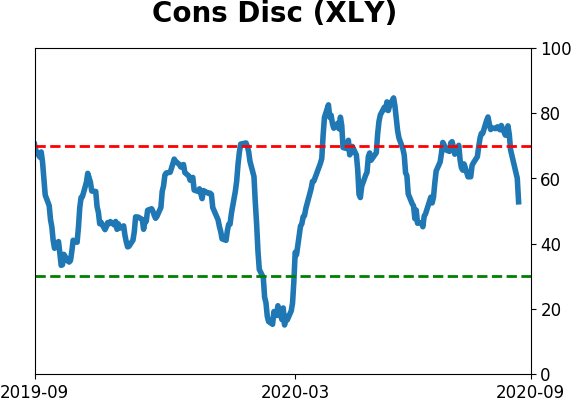
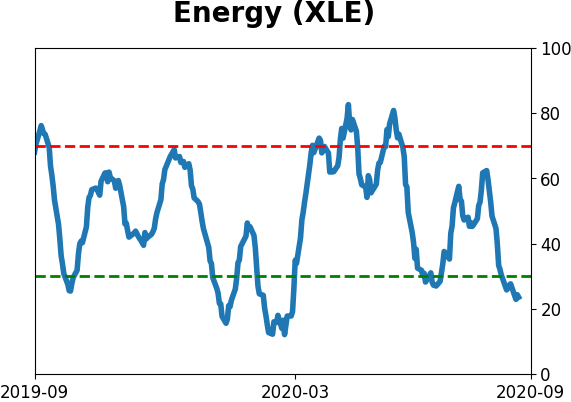
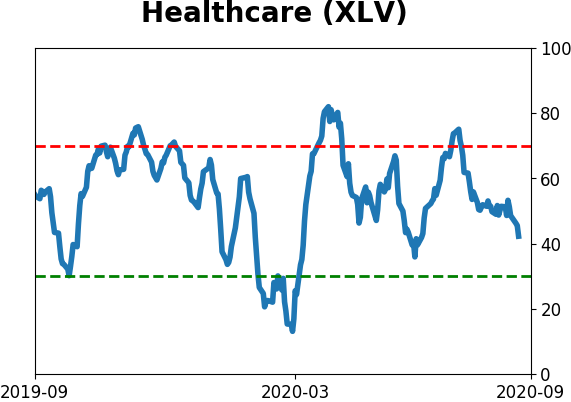
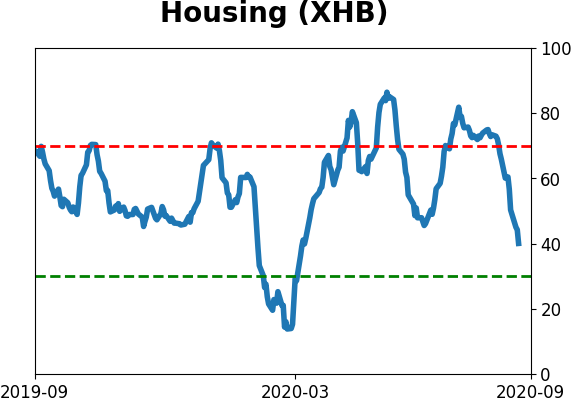
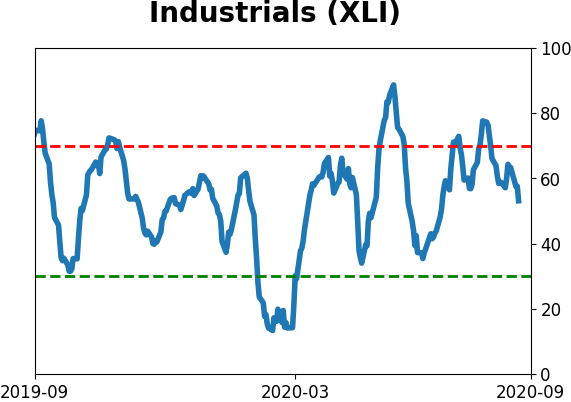
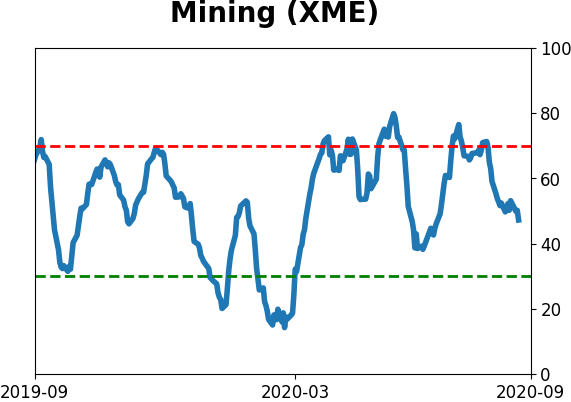
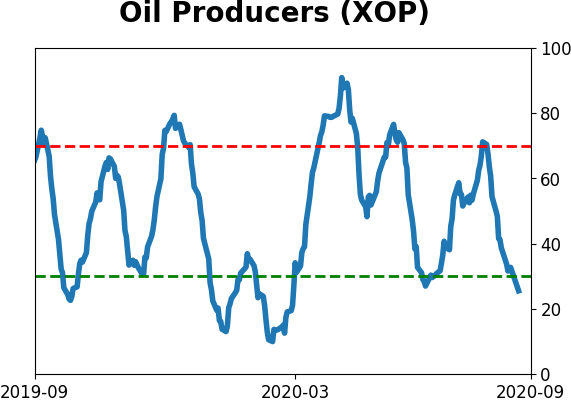
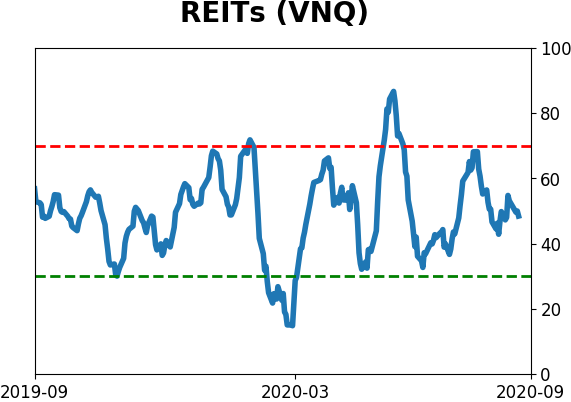
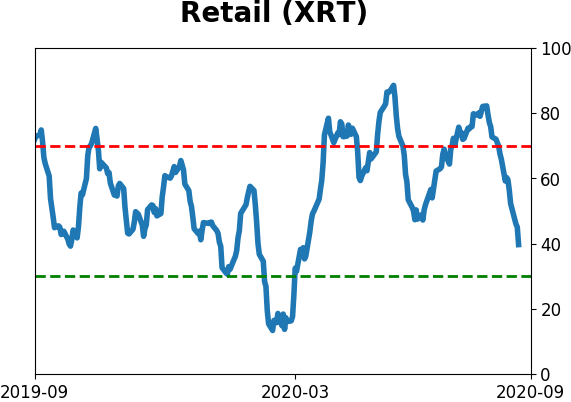
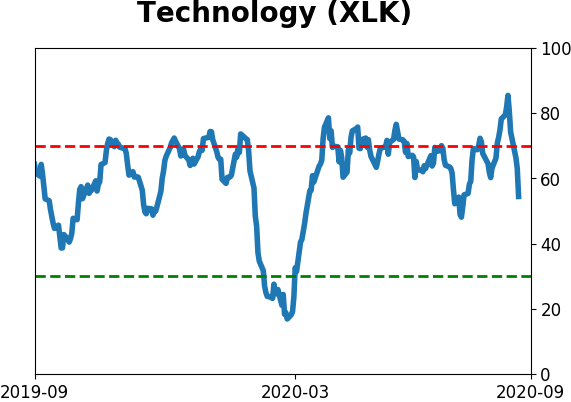
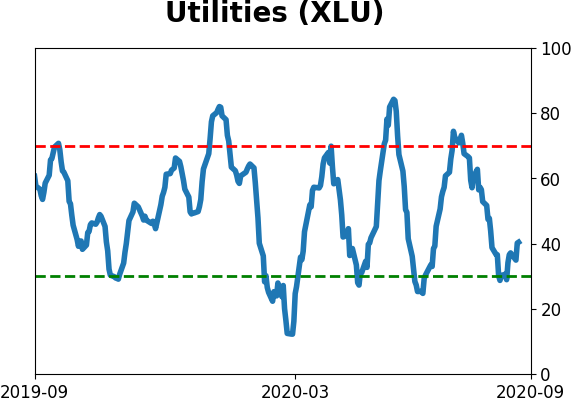
Sector ETF's - 10-Day Moving Average
|
|
|
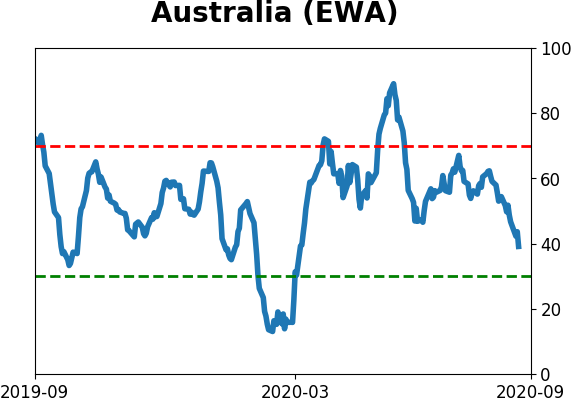
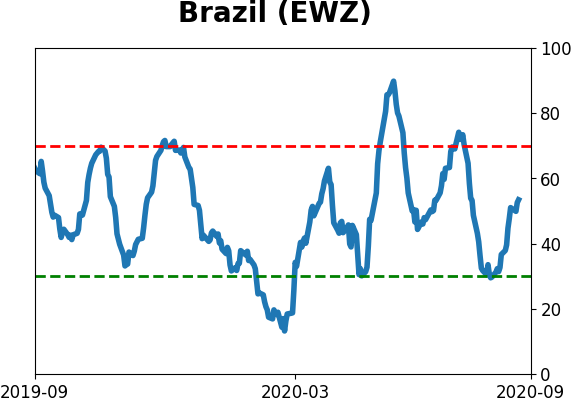
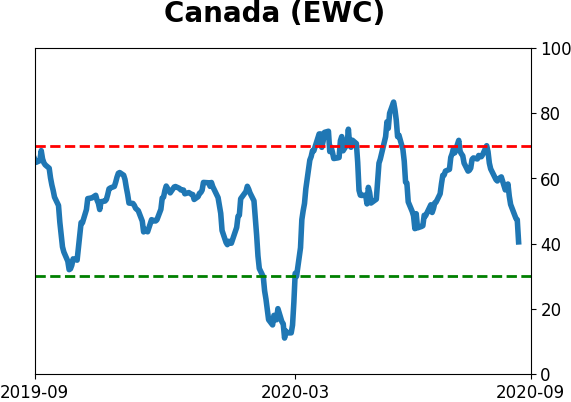
Country ETF's - 10-Day Moving Average
|
|
|
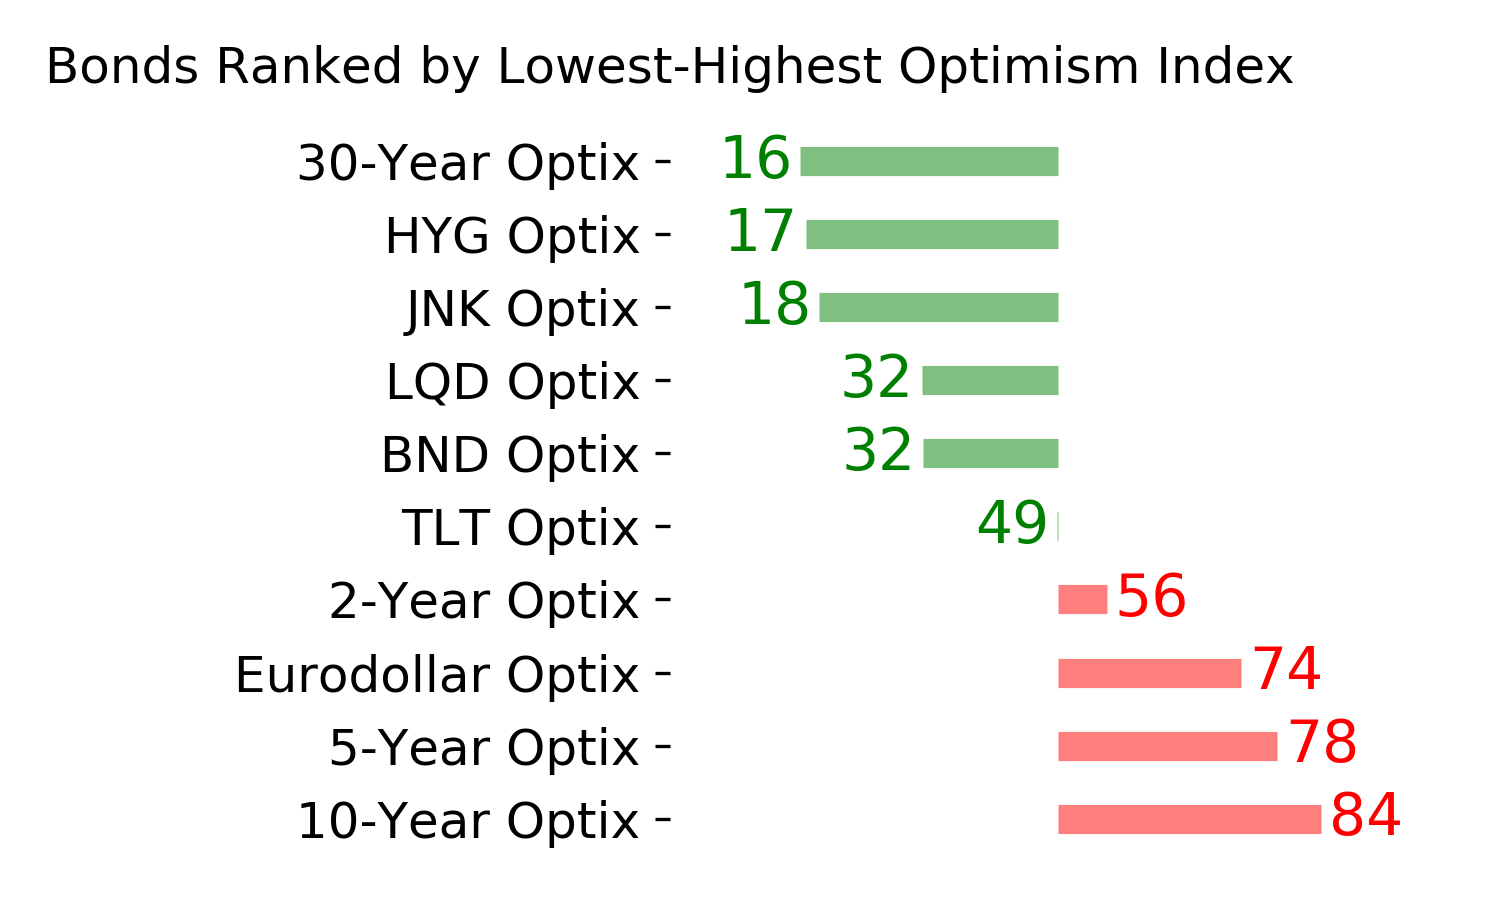
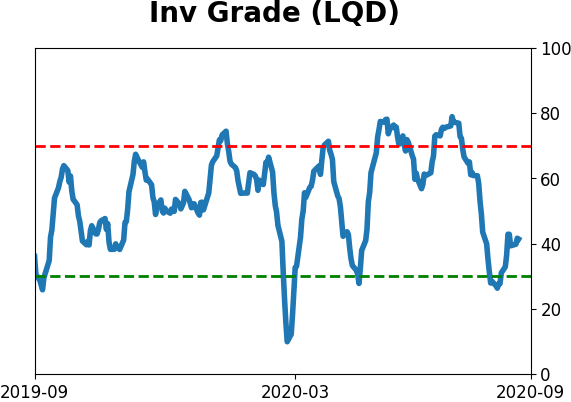
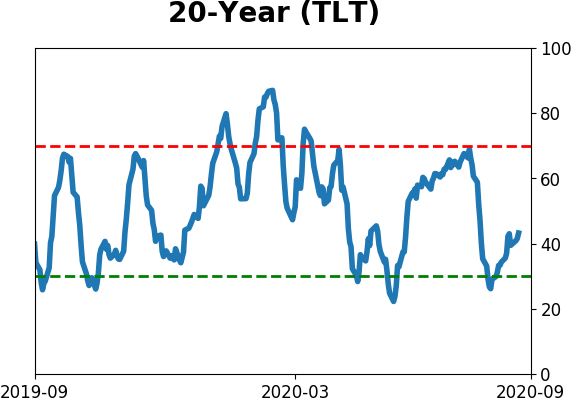
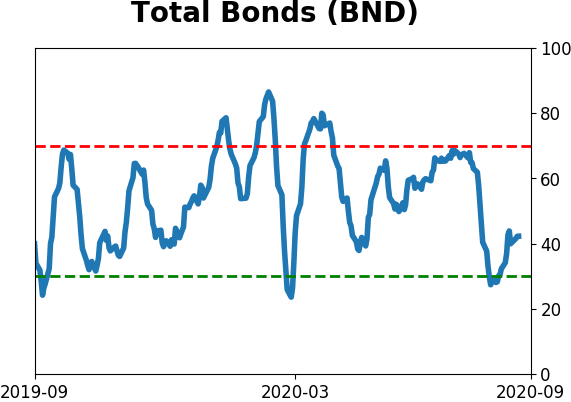
Bond ETF's - 10-Day Moving Average
|
|
|
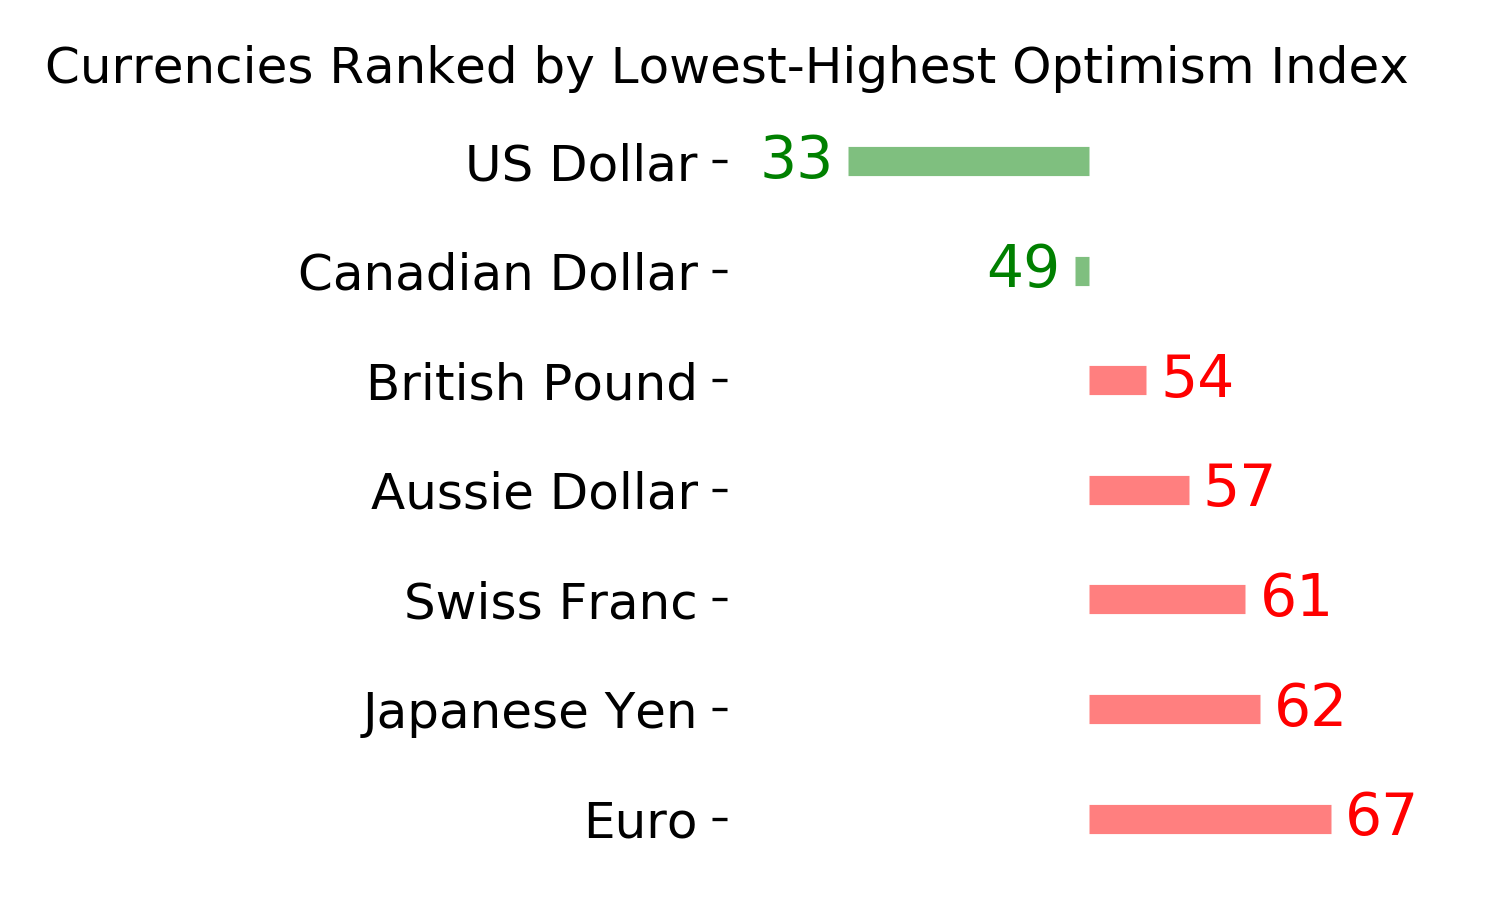
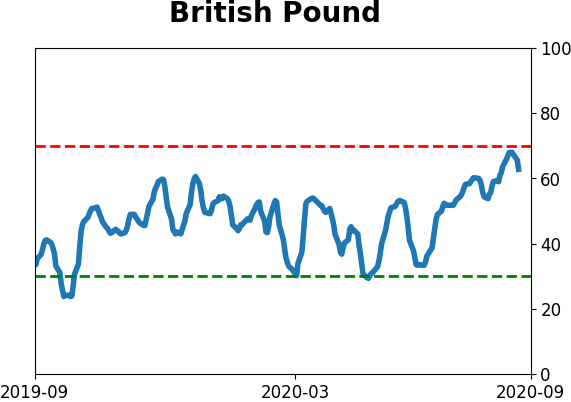
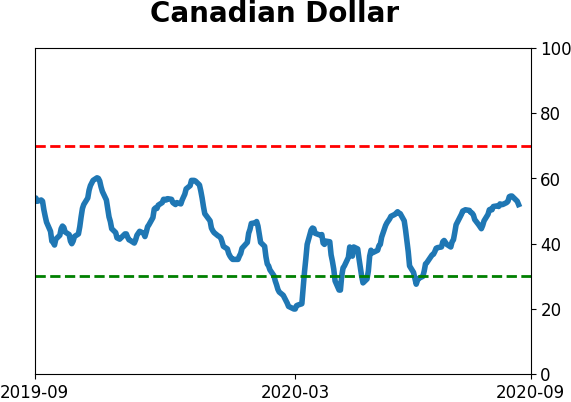
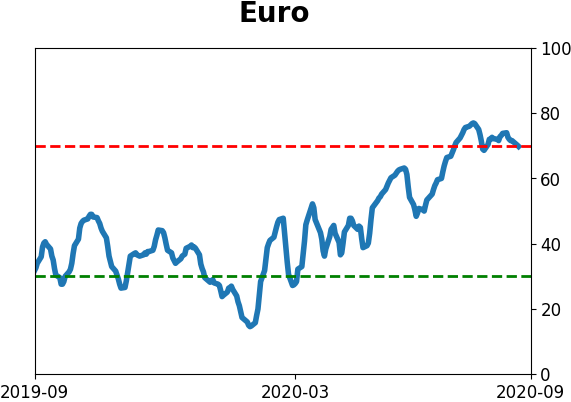
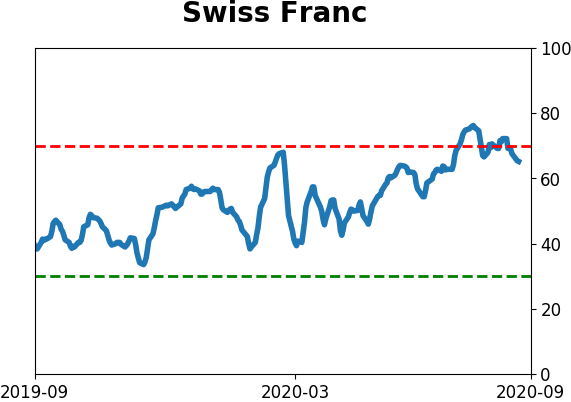
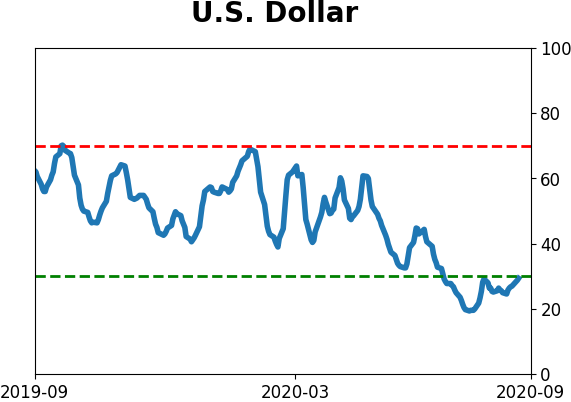
Currency ETF's - 5-Day Moving Average
|
|
|
Commodity ETF's - 5-Day Moving Average
|
|