Headlines
|
|
Macro Conditions Deteriorate as Bear Market Probability Rises:
The Bear Market Probability Model has risen to a high level at the same time that the Macro Index Model has deteriorated. This combination has almost invariably led to lower stock prices in the months ahead.
Bottom Line:
STOCKS: Hold
Sentiment continues to decline from the speculative February peak. With deteriorating breadth, this raises the risk of poor short- to medium-term returns until optimism and better breadth returns. See the Outlook & Allocations page for more. BONDS: Hold
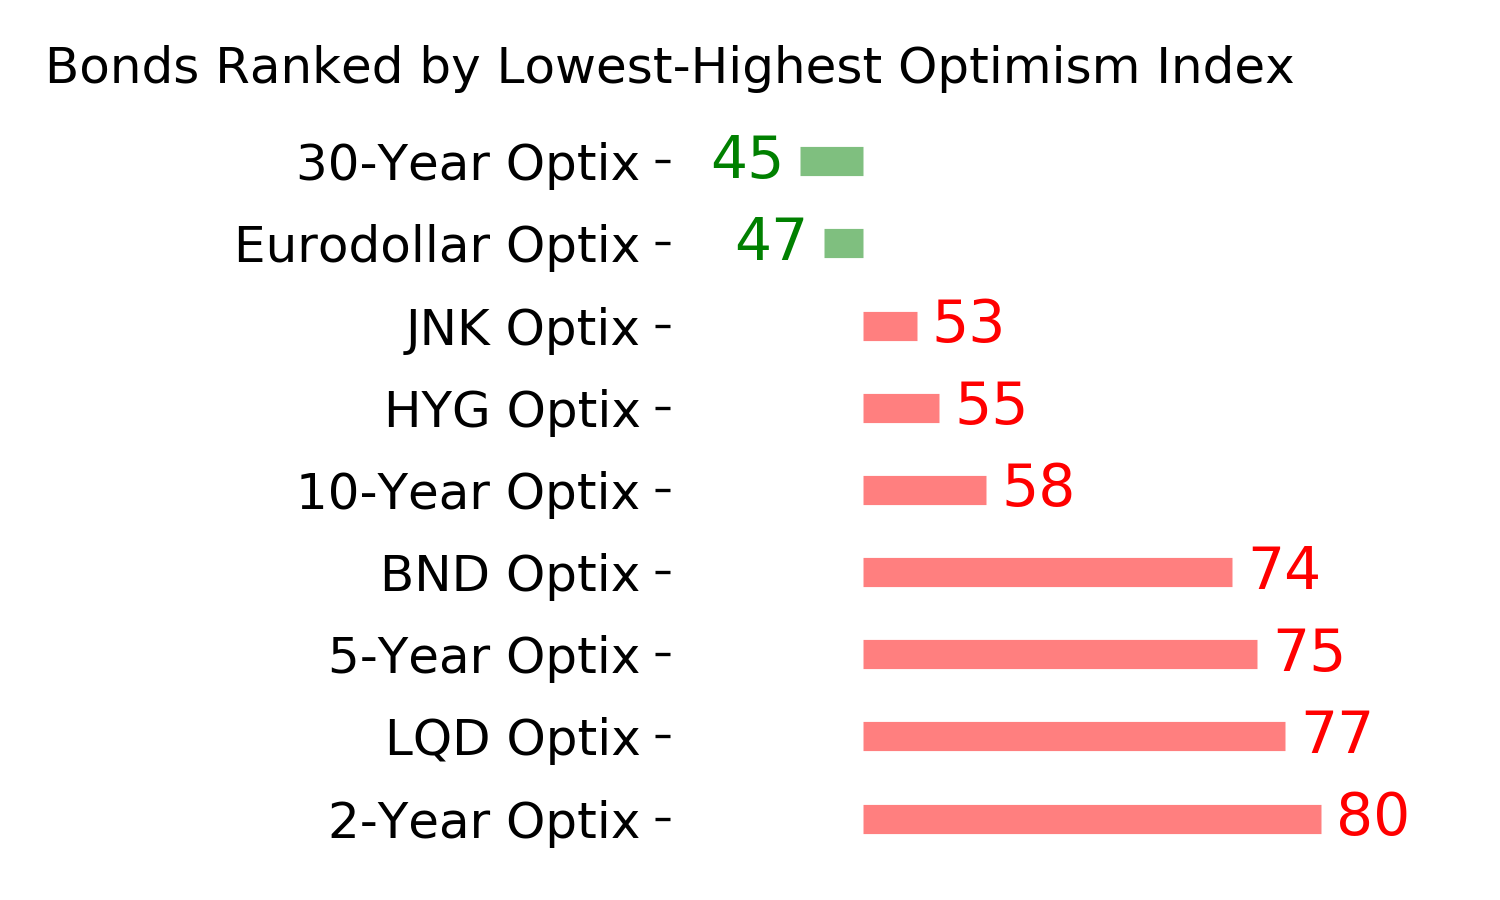
Various parts of the market got hit in March, with the lowest Bond Optimism Index we usually see during healthy environments. Bond prices have modest recovered and there is no edge among the data we follow. GOLD: Hold
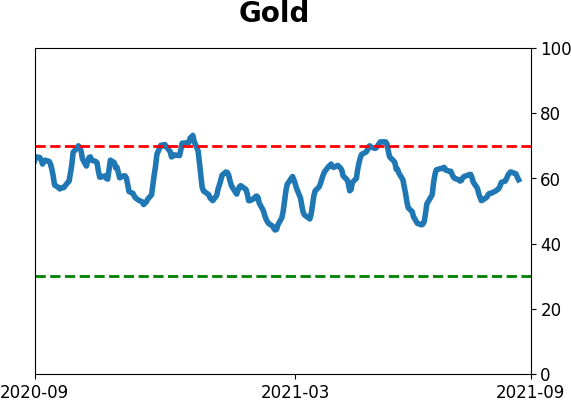
Gold and miners were rejected after trying to recover above their 200-day averages in May. Lately, some medium-term (not long-term) oversold extremes in breadth measures among miners have triggered.
|
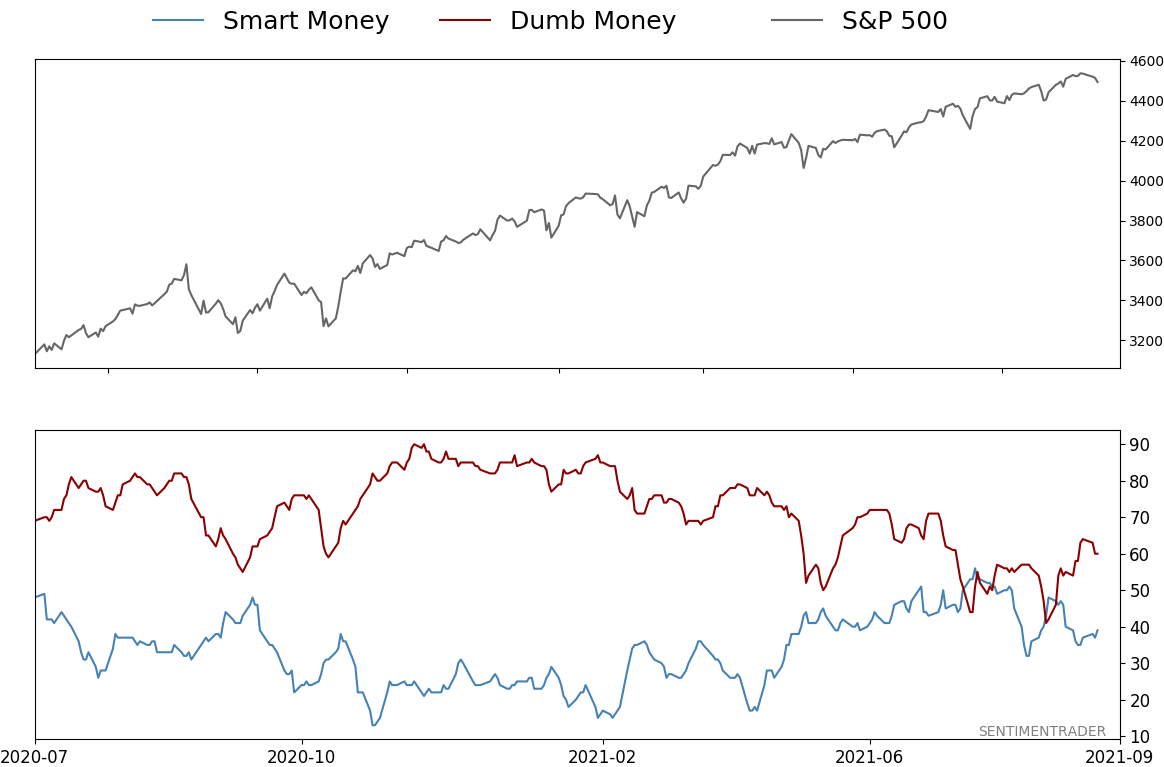
Smart / Dumb Money Confidence
|
Smart Money Confidence: 39%
Dumb Money Confidence: 60%
|
|
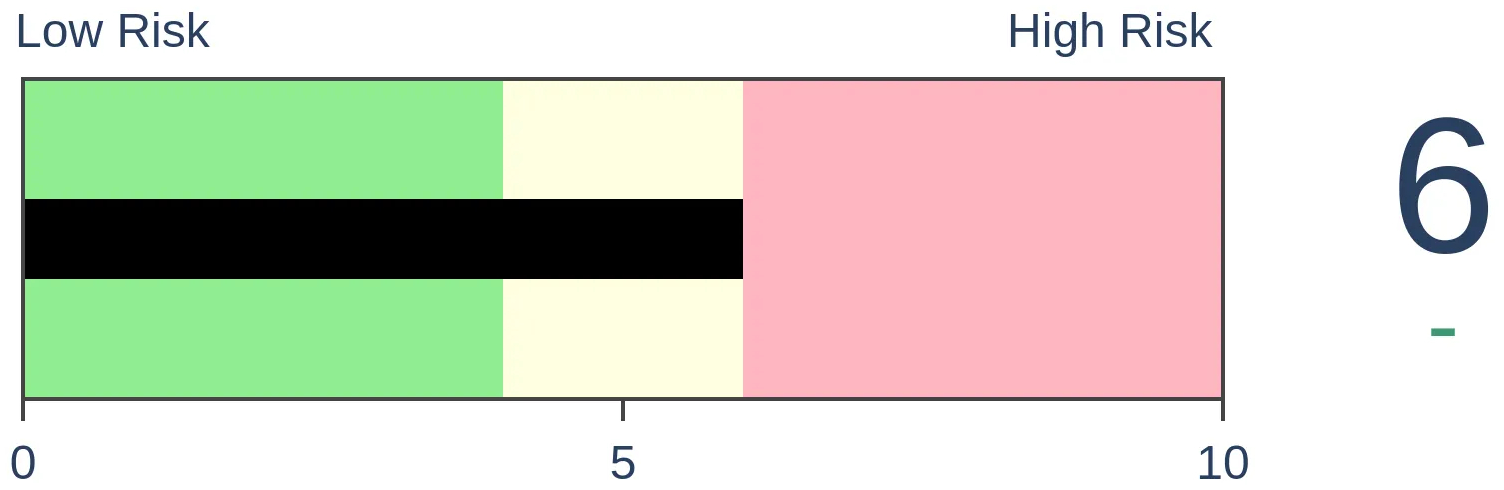
Risk Levels
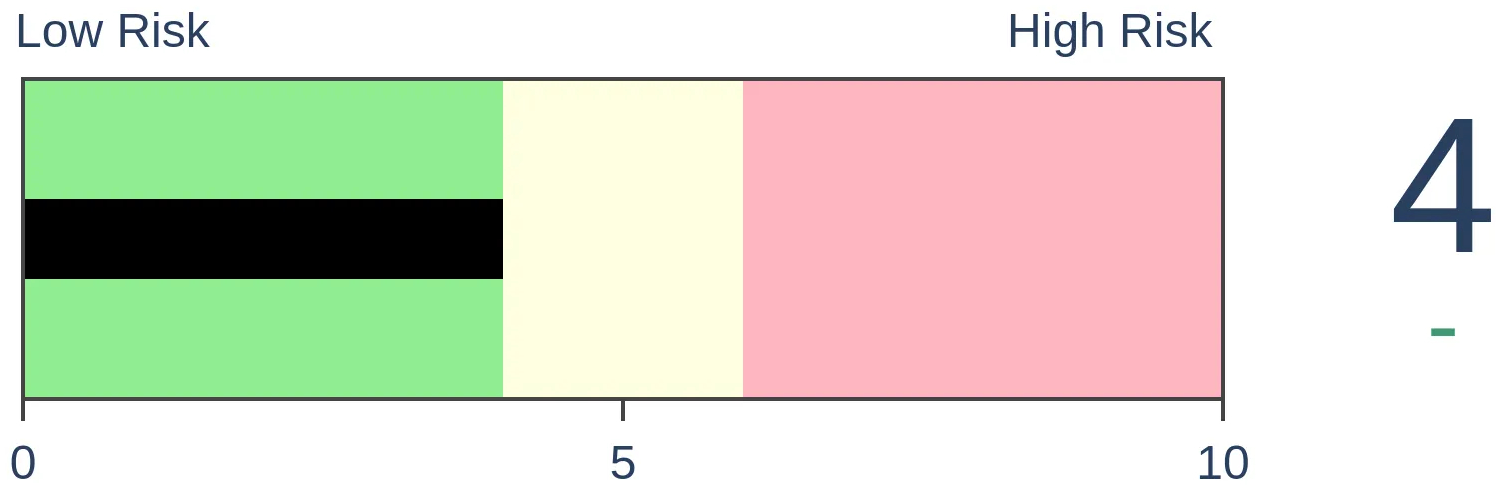
Stocks Short-Term

|
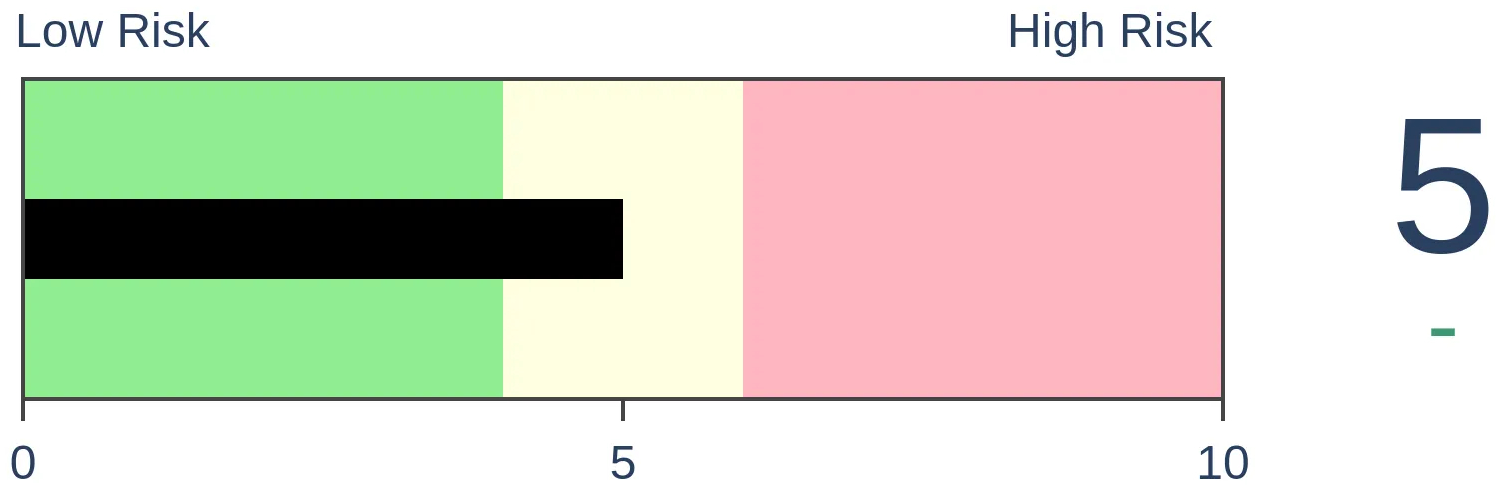
Stocks Medium-Term
|
|
Bonds

|
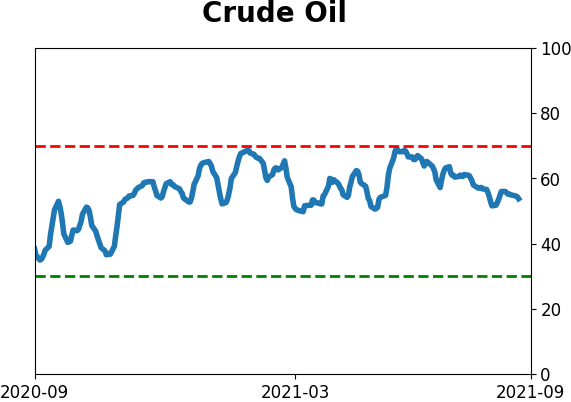
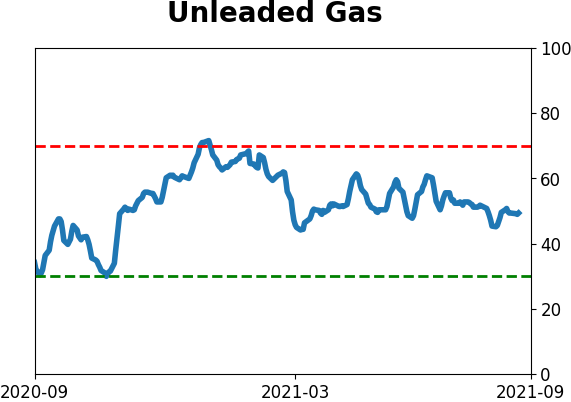
Crude Oil
|
|
Gold
|
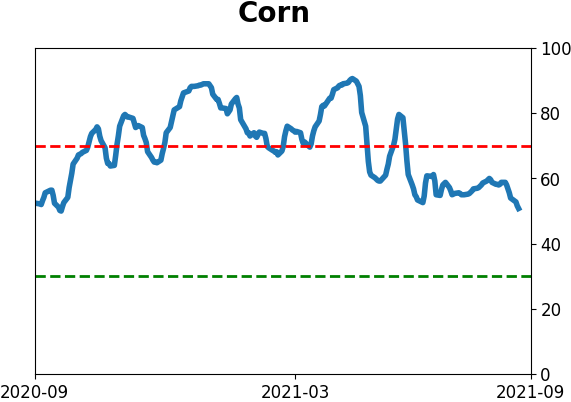
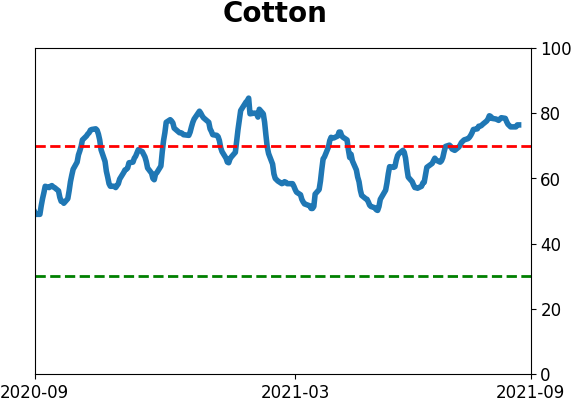
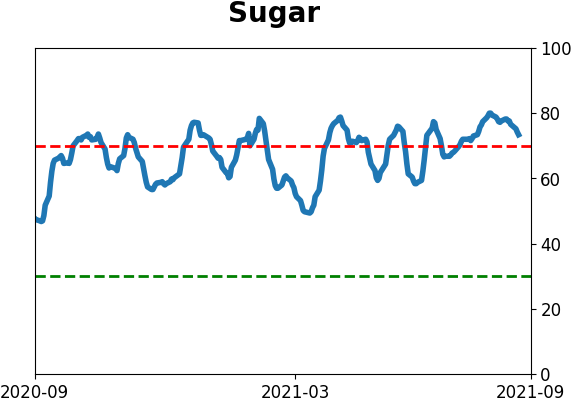
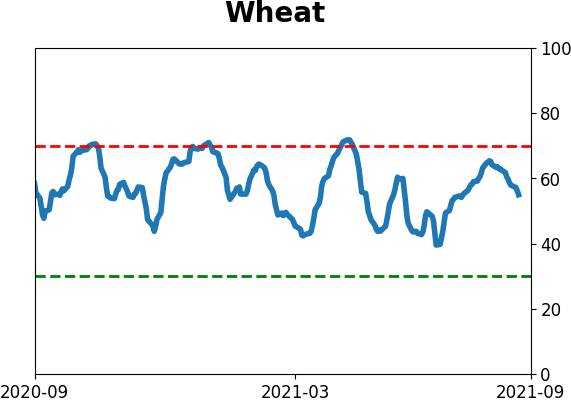
Agriculture

|
|
Research
By Jason Goepfert
BOTTOM LINE
The Bear Market Probability Model has risen to a high level at the same time that the Macro Index Model has deteriorated. This combination has almost invariably led to lower stock prices in the months ahead.
FORECAST / TIMEFRAME
SPX -- Down, Long-Term
|
Even as the major equity indexes vacillate near record highs, macro conditions are deteriorating and the probability of trouble is rising.
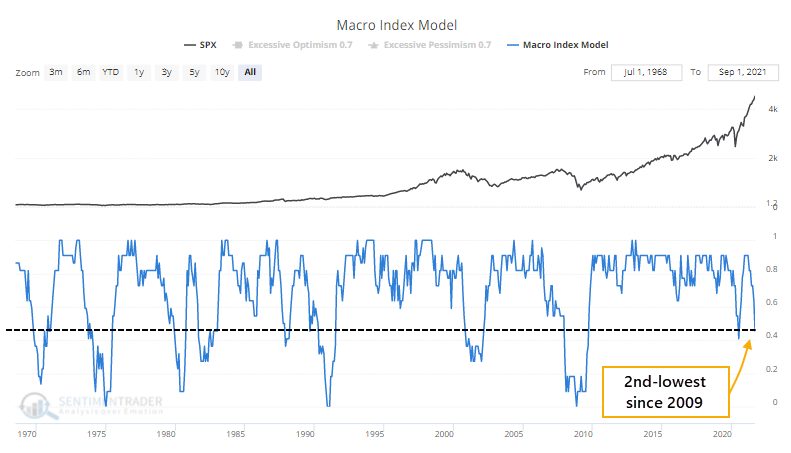
Last week, we saw that economic reports have been coming in below economists' expectations, both domestically and globally. As another reflection of those weak reports, our Macro Index Model has been deteriorating.
The U.S. stock market and U.S. economy move in the same direction in the long term. Macro deteriorates from time to time, which is normal during the ebb and flow of an economic expansion. To differentiate temporary slowdowns from real problems, we look for significant macro deterioration. The Macro Index Model combines 11 diverse indicators to determine the state of the U.S. economy.
Macro Index Model Inputs
- New Home Sales
- Housing Starts
- Building Permits
- Initial Claims
- Continued Claims
- Heavy Truck Sales
- 10 year - 3 month Treasury yield curve
- S&P 500 vs. its 10-month moving average
- ISM manufacturing PMI
- Margin debt
- Year-over-year headline inflation
This index leans towards housing and labor markets. Housing indicators are extremely useful as leading economic indicators and labor market indicators are very timely for calling recessions, with few false signals. Stock market investors should be bullish when the Macro Index is above 0.7 and bearish when the Macro Index is below or equal to 0.7.
Once the final reports were in for August, the model plunged below 46%, the 2nd-lowest reading of the past decade.
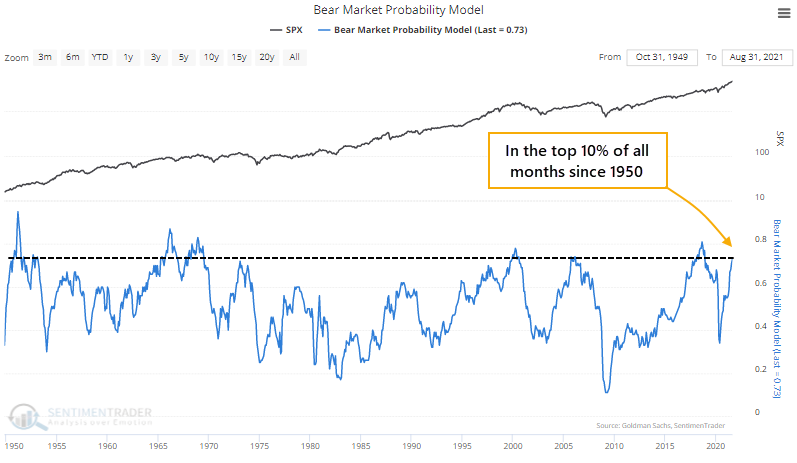
At the same time, the Bear Market Probability Model has jumped again. This is a model outlined by Goldman Sachs using five fundamental inputs.
Bear Market Probability Model Inputs
- The U.S. Unemployment Rate
- ISM Manufacturing Index
- Yield Curve
- Inflation Rate
- P/E Ratio
Each month's reading is ranked versus all other historical readings and assigned a score. The higher the score, the higher the probability of a bear market in the months ahead. Last May, the model was in the bottom 10% of all months since 1950. This month, it jumped into the top 10% of all months.
There is some overlap between the two models, with a correlation of +0.25 (out of a scale from -1.0 to +1.0) since 1968. However, it's still rare to see both of them at such extremes at the same time.
A RARE, AND UGLY, SIGNAL
The chart below shows the spread between the Bear Market Probability and Macro Index models. The higher the spread, the higher the probability of a bear market combined with poor macro conditions.
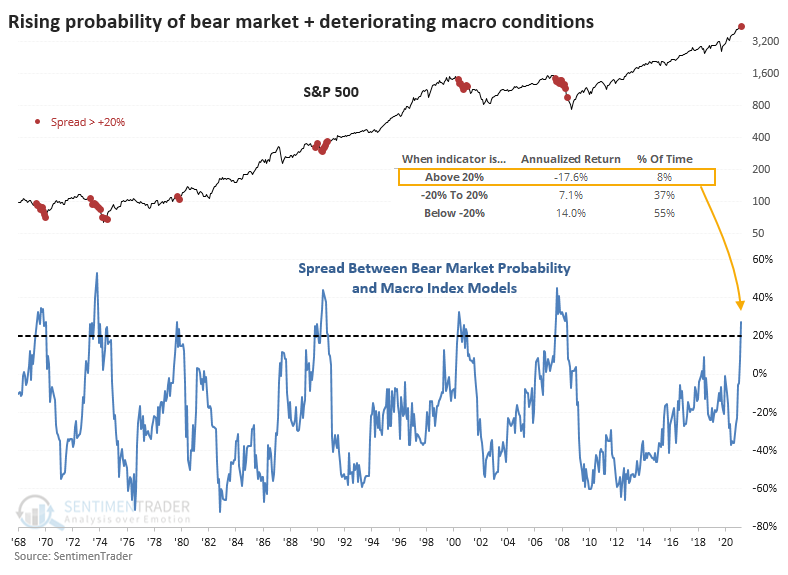
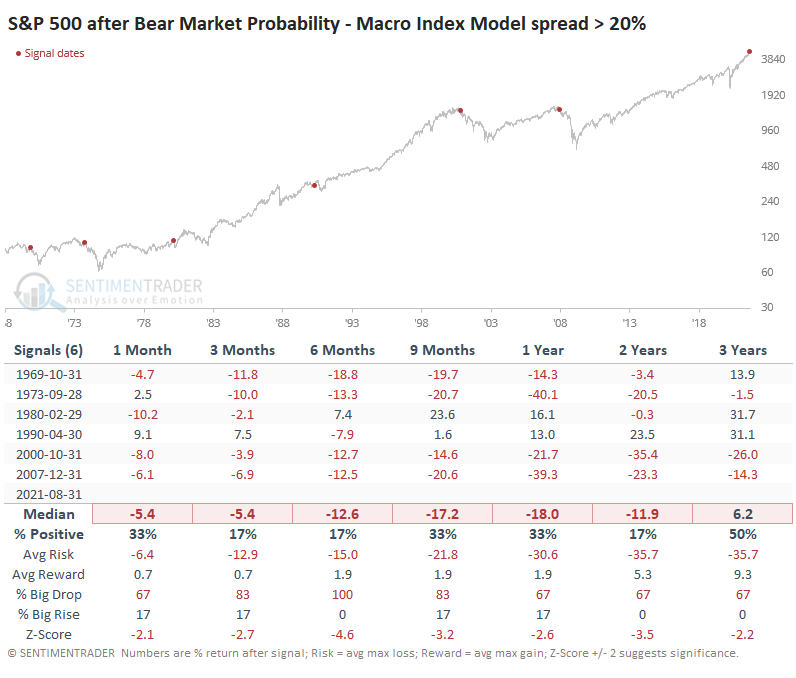
The chart shows that the S&P 500's annualized return is a horrid -17.6% when the spread is above 20% like it is now. The table below shows forward returns in the S&P after the spread crosses above +20% for the first time in at least a year.
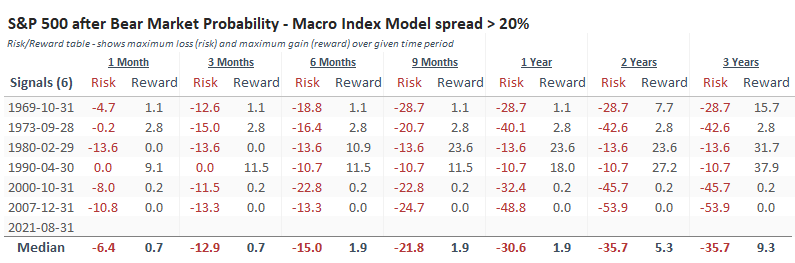
Looking at the Risk/Reward Table, it was ugly across most time frames up to two years later.
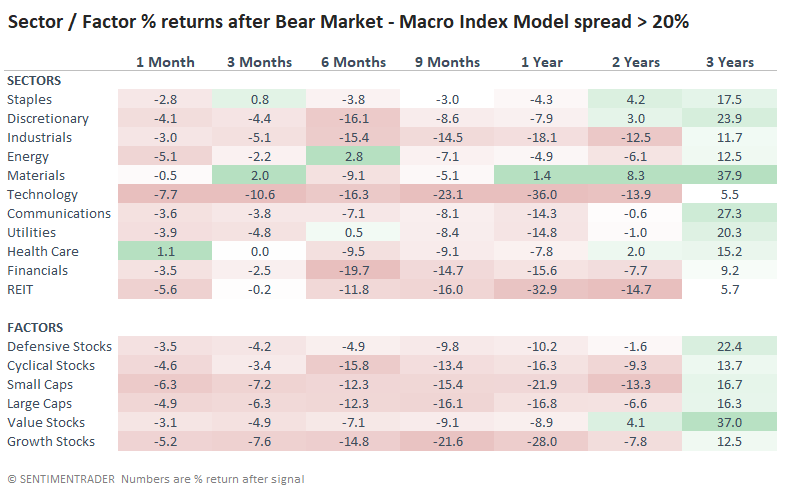
NOT MANY PLACES TO HIDE
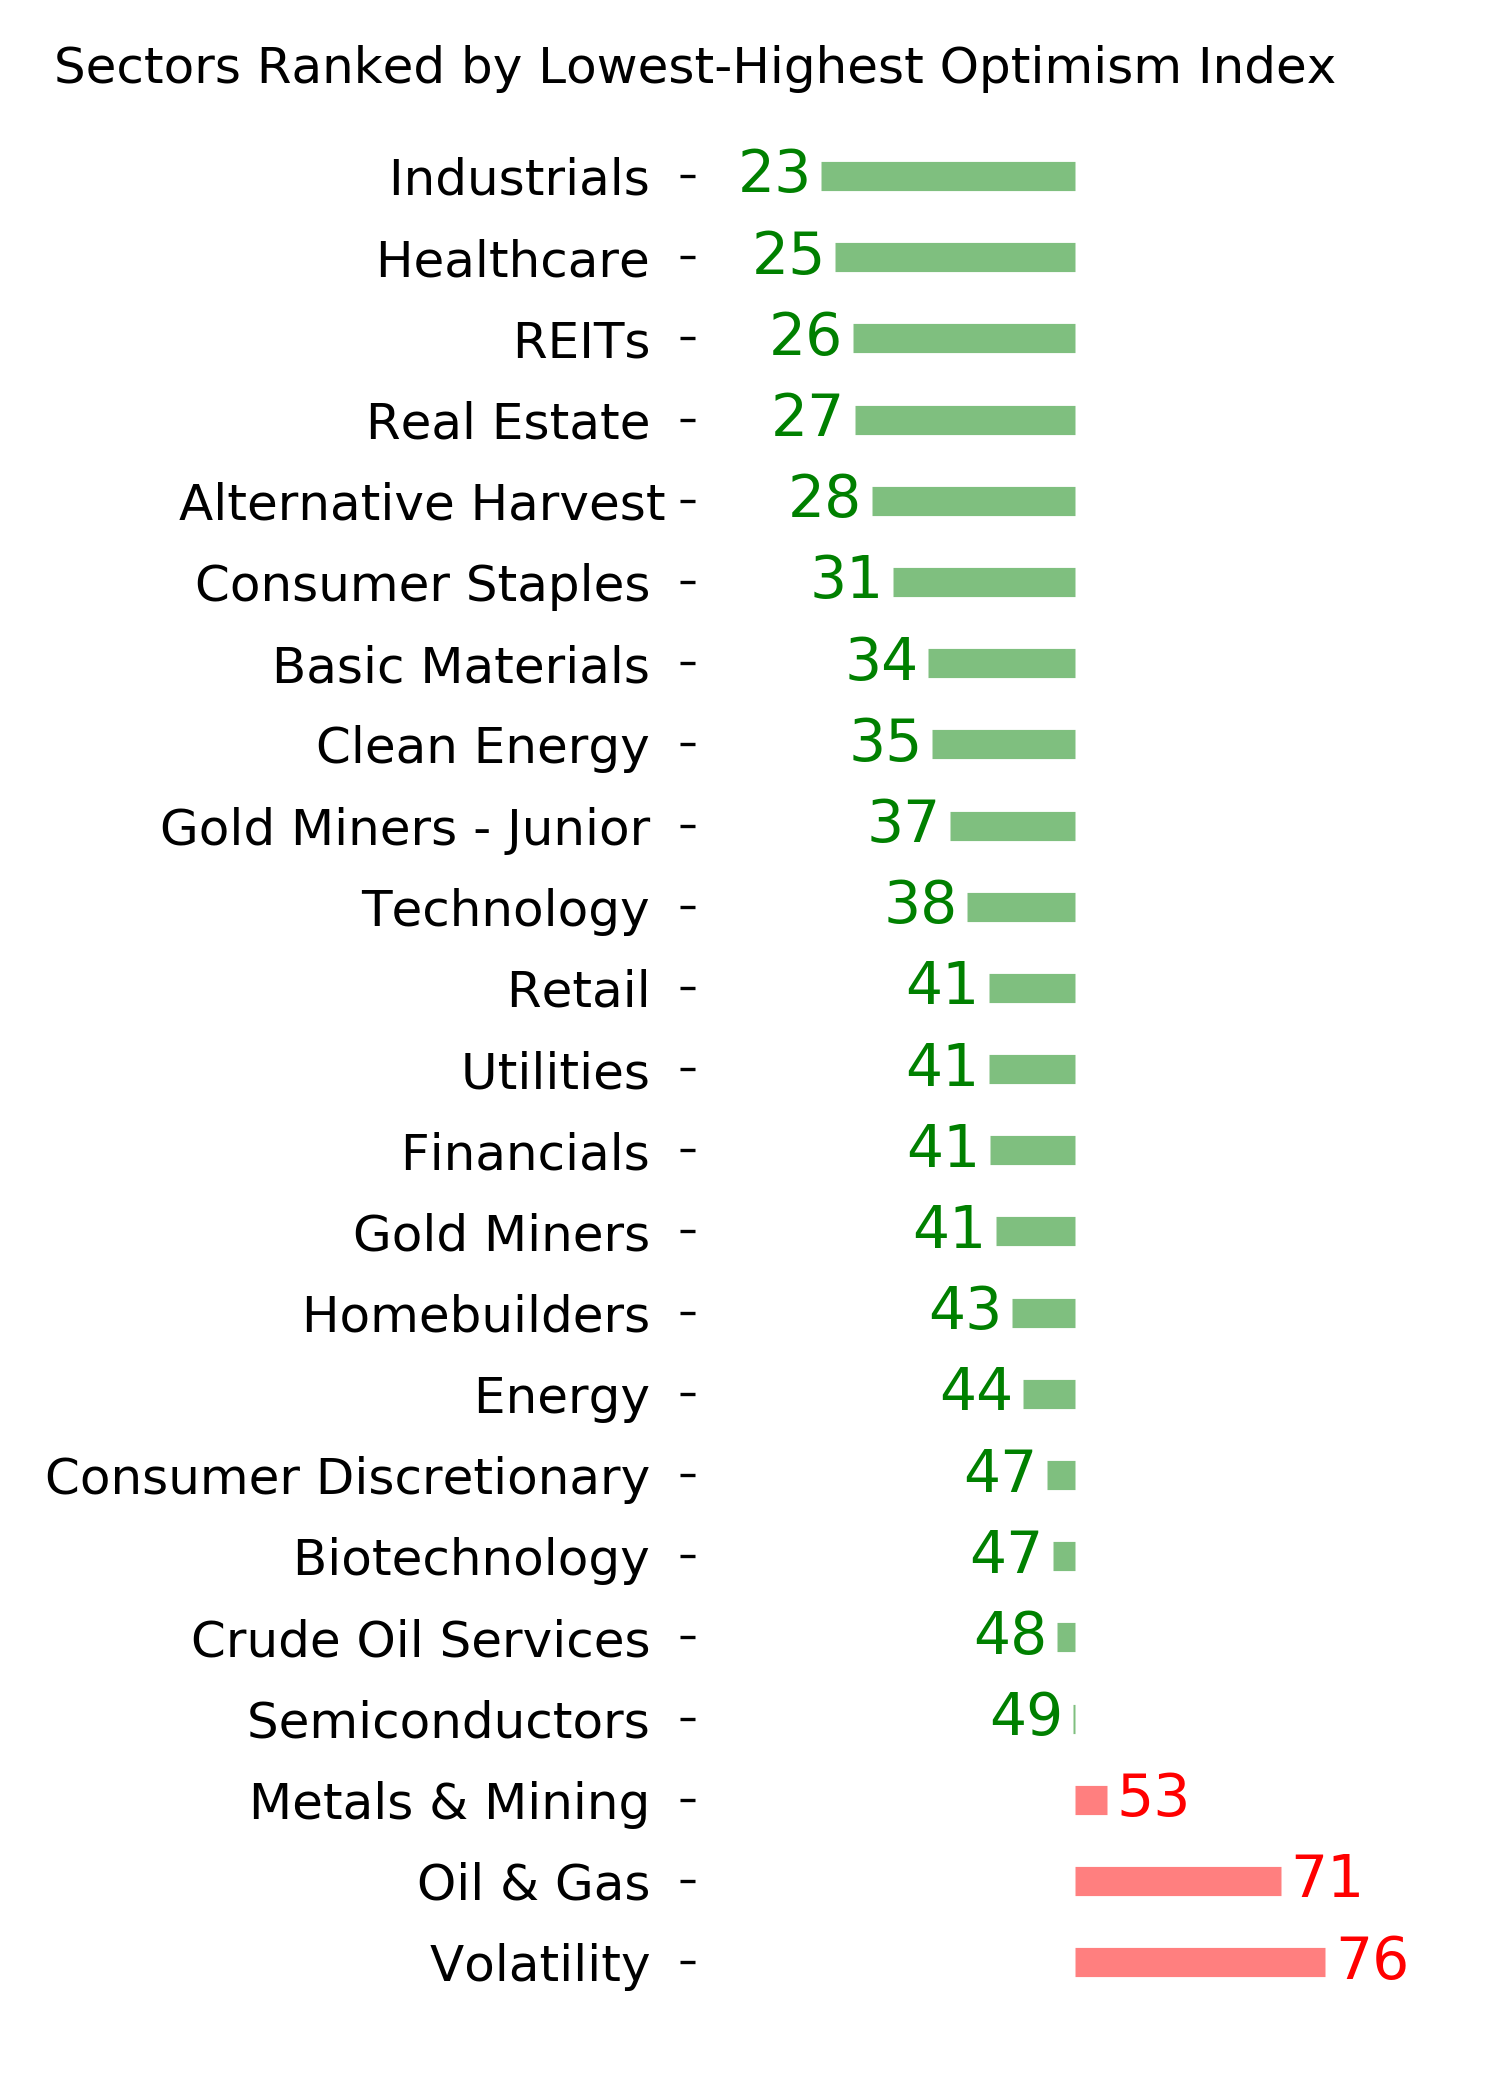
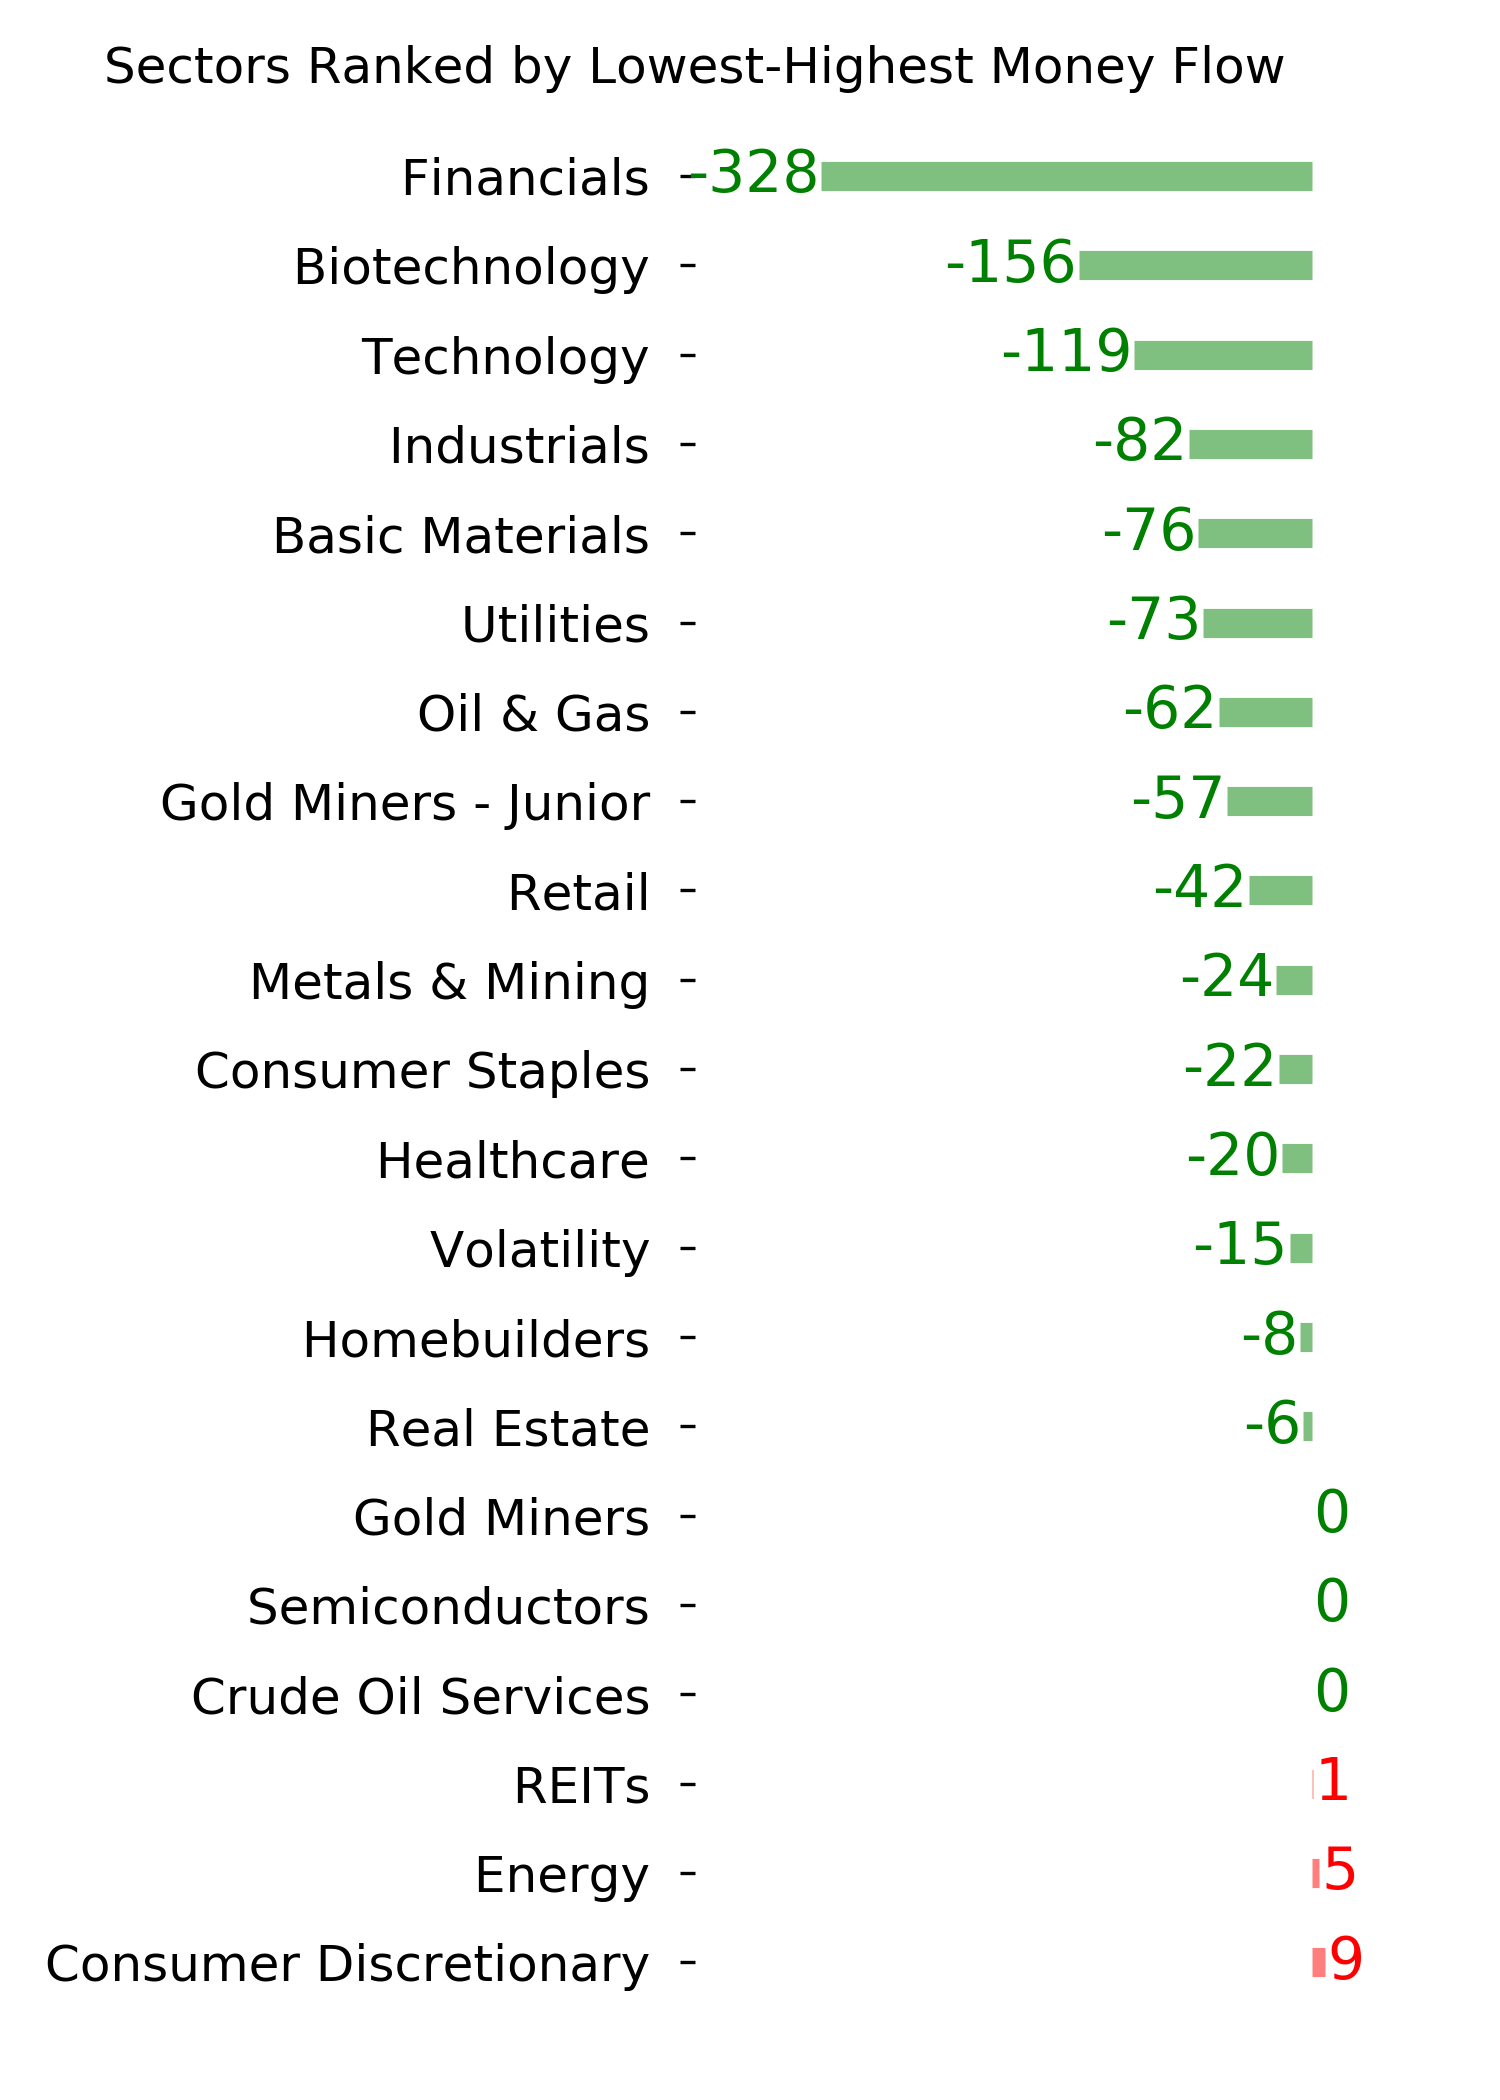
Among sectors and factors, there weren't many places to hide. The more defensive sectors tended to hold up the best, which is not a big surprise. Technology and Industrial stocks tended to suffer the worst returns.
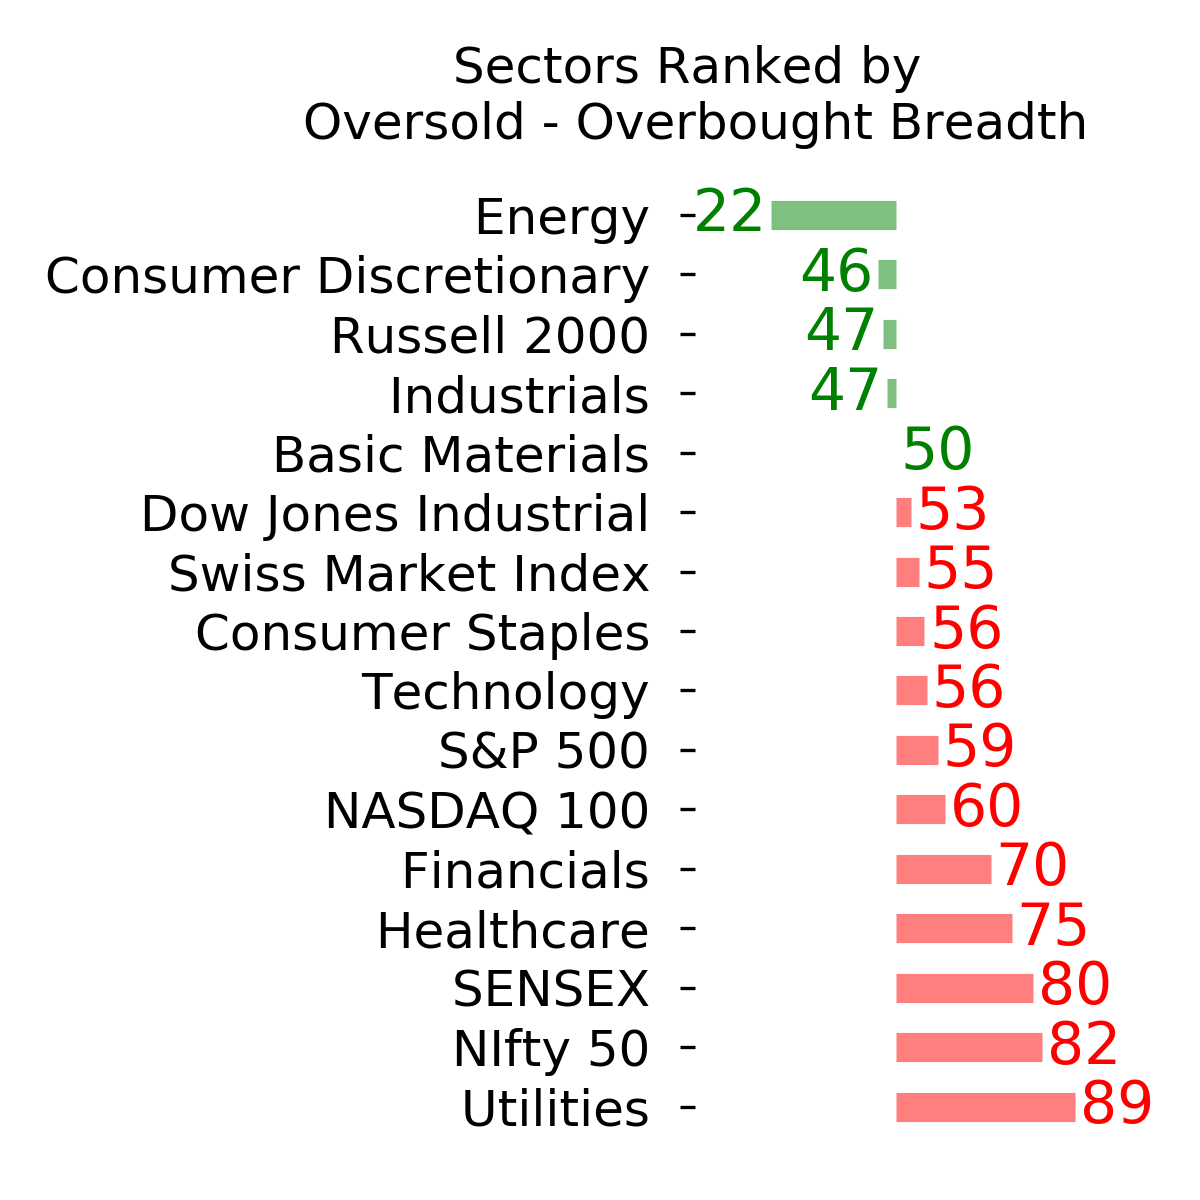
There is no good way to square this kind of outlook against some of the positives that have been triggered lately, most notably the breadth thrusts. A bearish argument would be much more lucid if the poor internal breadth conditions from earlier in the summer had persisted, but instead many of them have not only reversed but have given opposing (i.e. bullish) signals. This is confusing, no doubt.
The biggest risk for those counting on the thrusts is that when they occur when the indexes are trading at new highs instead of after a protracted decline, they have sometimes highlighted blow-off peaks. Given the backdrop from these models, that seems like a real risk here.
Active Studies
| Time Frame | Bullish | Bearish | | Short-Term | 0 | 6 | | Medium-Term | 5 | 3 | | Long-Term | 11 | 5 |
|
Indicators at Extremes
Portfolio
| Position | Description | Weight % | Added / Reduced | Date | | Stocks | RSP | 4.1 | Added 4.1% | 2021-05-19 | | Bonds | 23.9% BND, 6.9% SCHP | 30.7 | Reduced 7.1% | 2021-05-19 | | Commodities | GCC | 2.6 | Reduced 2.1%
| 2020-09-04 | | Precious Metals | GDX | 5.6 | Reduced 4.2% | 2021-05-19 | | Special Situations | 4.3% XLE, 2.2% PSCE | 7.6 | Reduced 5.6% | 2021-04-22 | | Cash | | 49.4 | | |
|
Updates (Changes made today are underlined)
Much of our momentum and trend work has remained positive for several months, with some scattered exceptions. Almost all sentiment-related work has shown a poor risk/reward ratio for stocks, especially as speculation drove to record highs in exuberance in February. Much of that has worn off, and most of our models are back toward neutral levels. There isn't much to be excited about here. The same goes for bonds and even gold. Gold has been performing well lately and is back above long-term trend lines. The issue is that it has a poor record of holding onto gains when attempting a long-term trend change like this, so we'll take a wait-and-see approach. RETURN YTD: 8.5% 2020: 8.1%, 2019: 12.6%, 2018: 0.6%, 2017: 3.8%, 2016: 17.1%, 2015: 9.2%, 2014: 14.5%, 2013: 2.2%, 2012: 10.8%, 2011: 16.5%, 2010: 15.3%, 2009: 23.9%, 2008: 16.2%, 2007: 7.8%
|
|
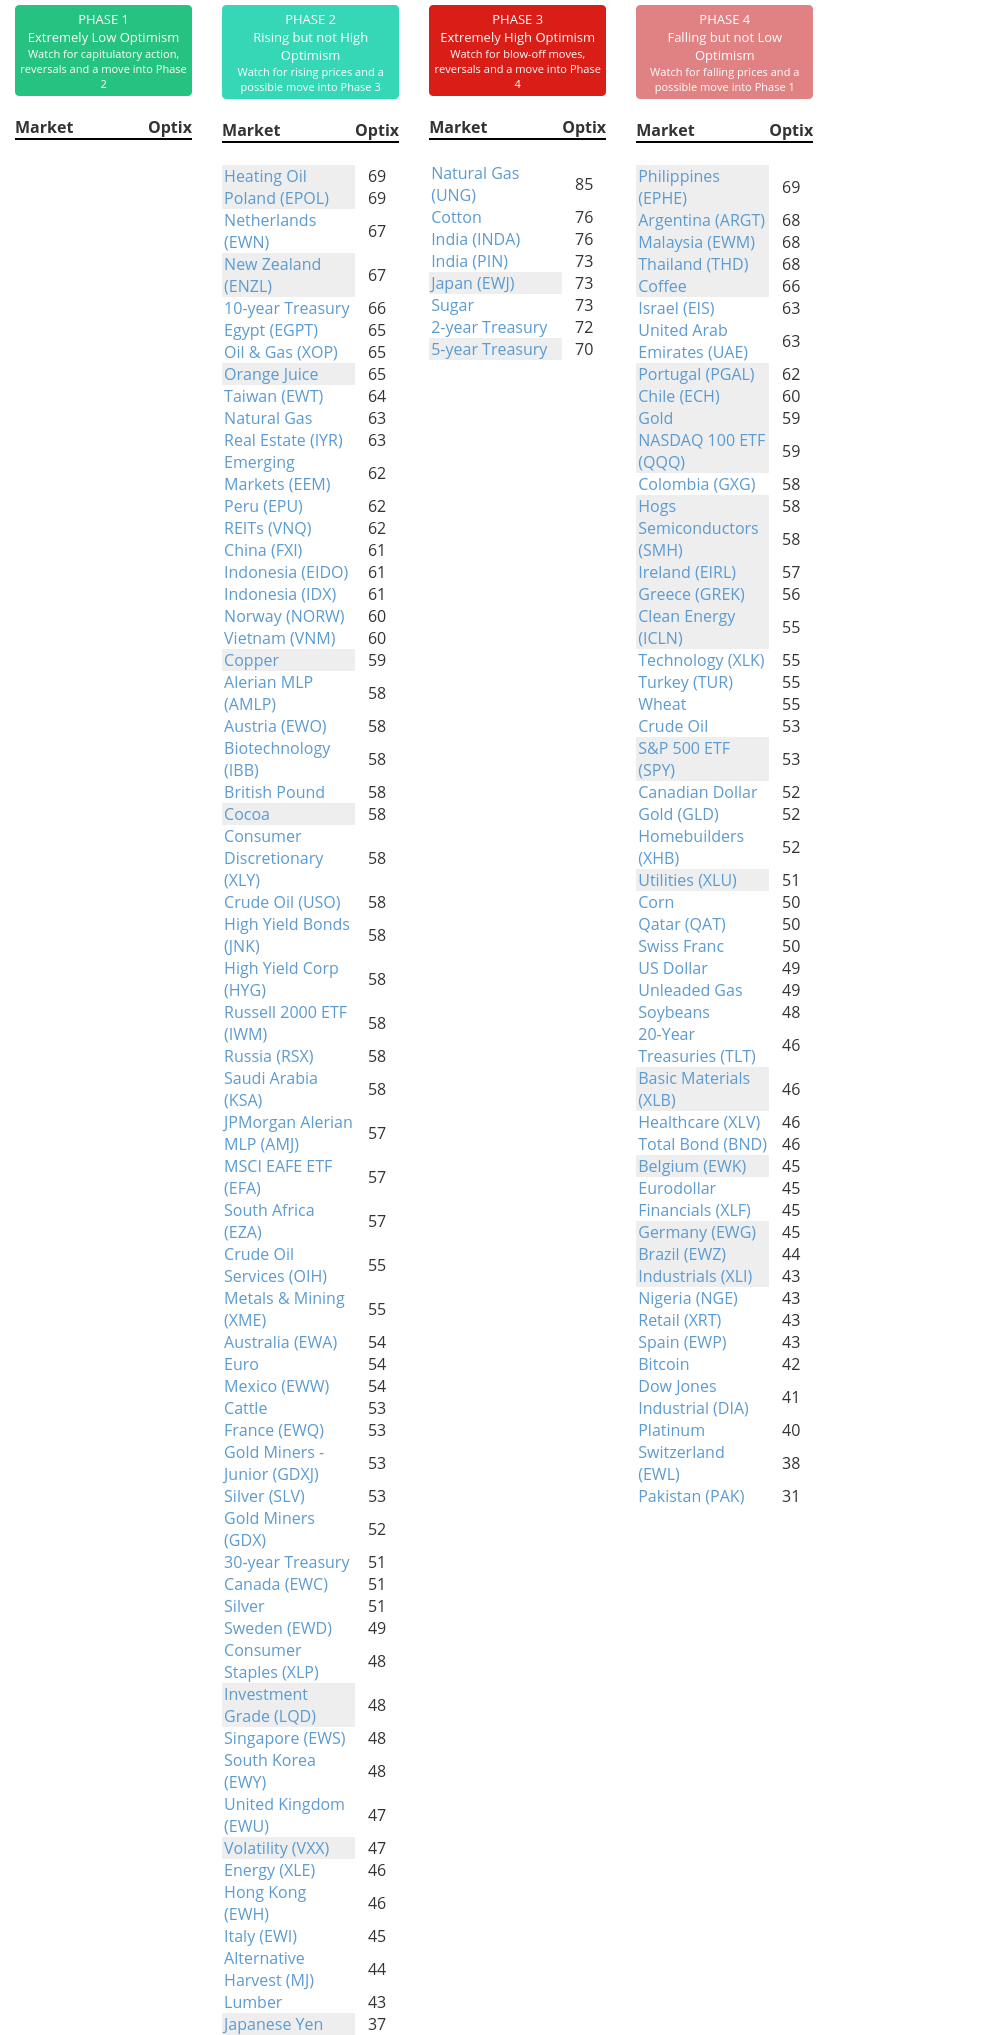
Phase Table
Ranks
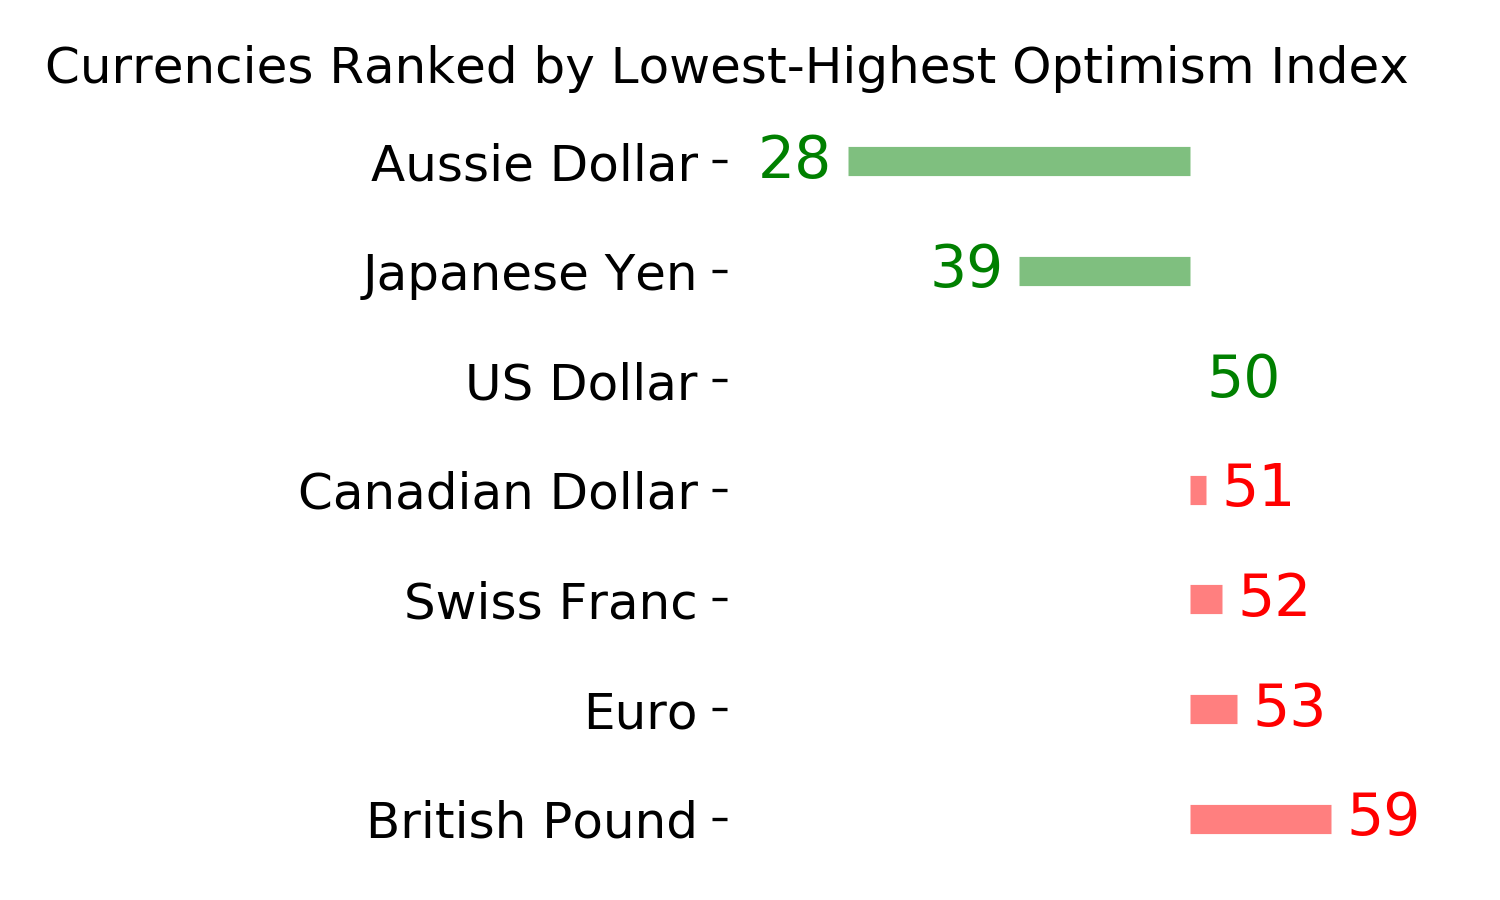
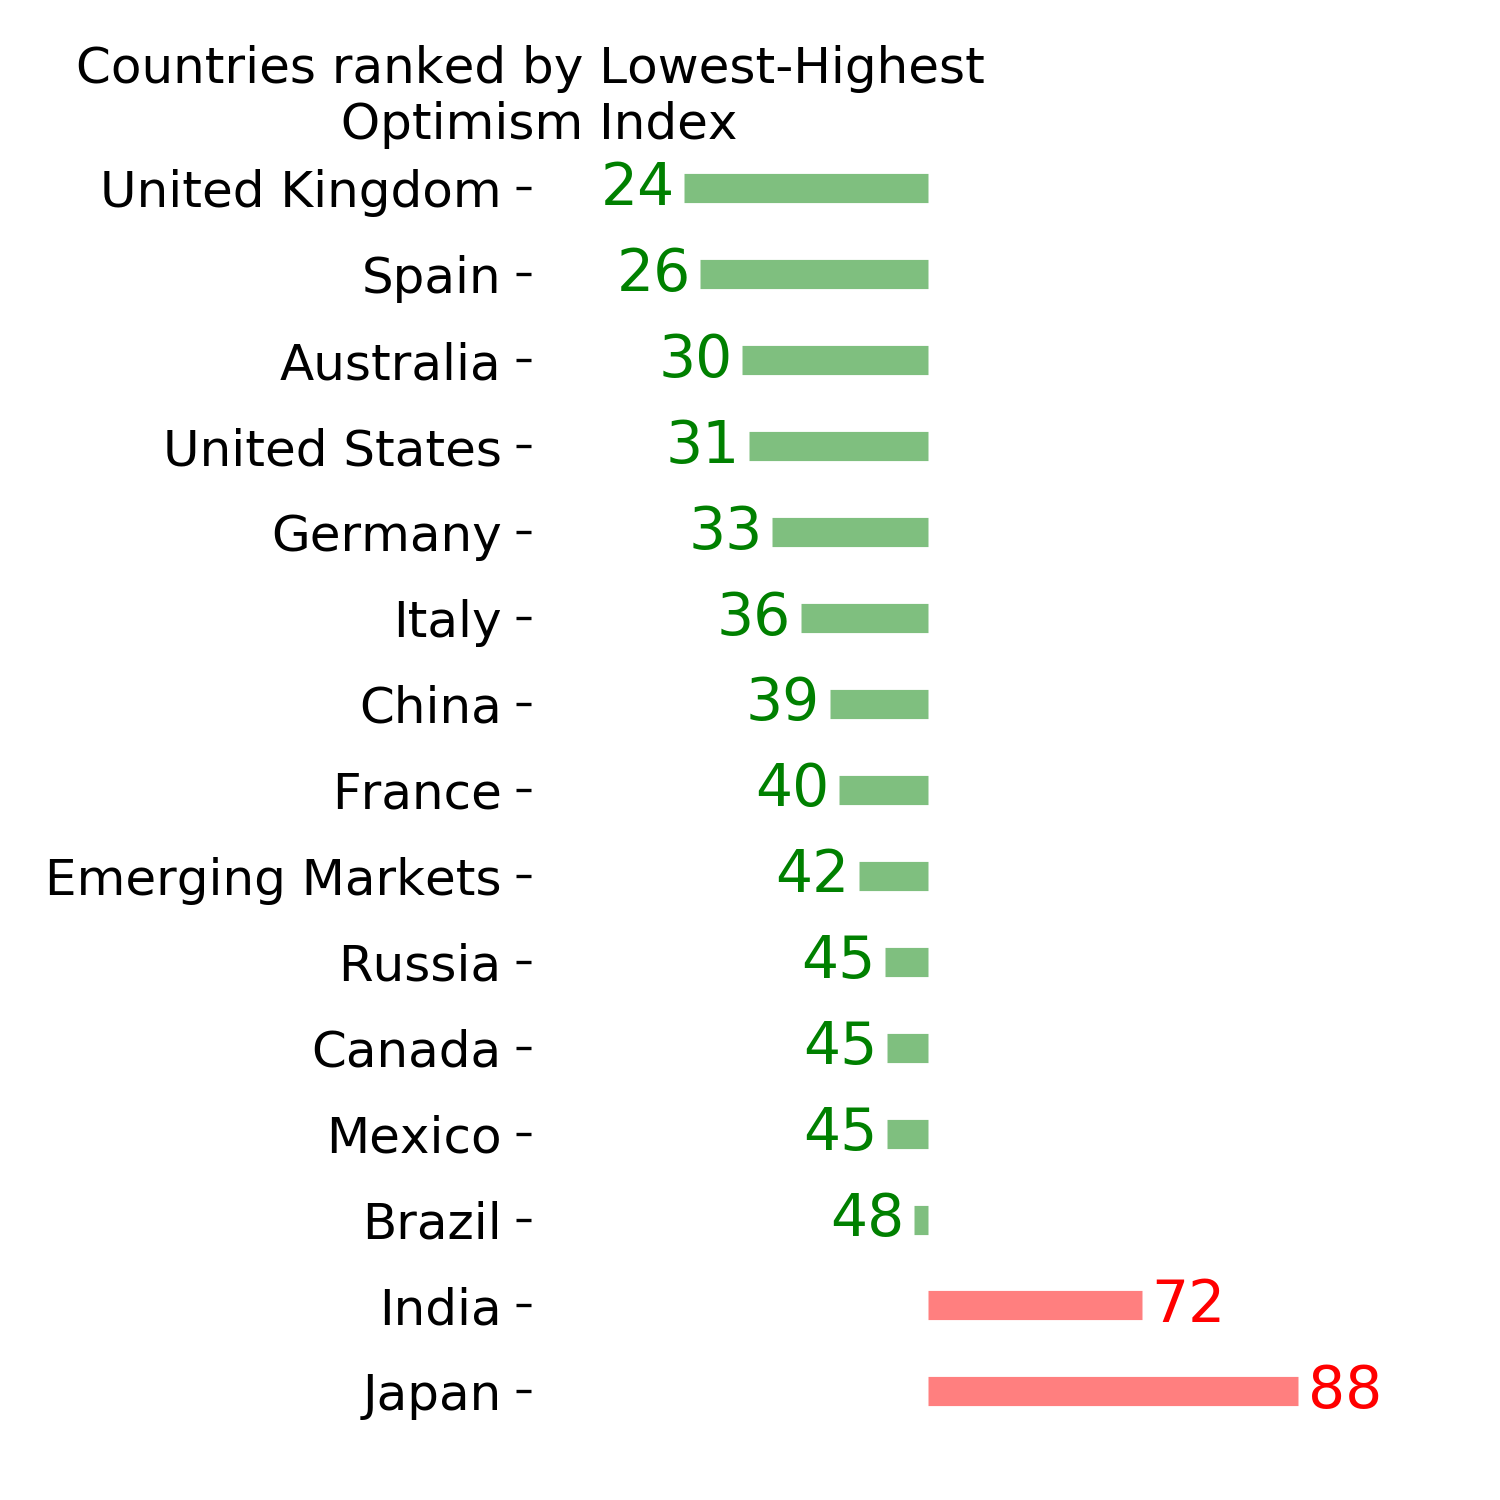
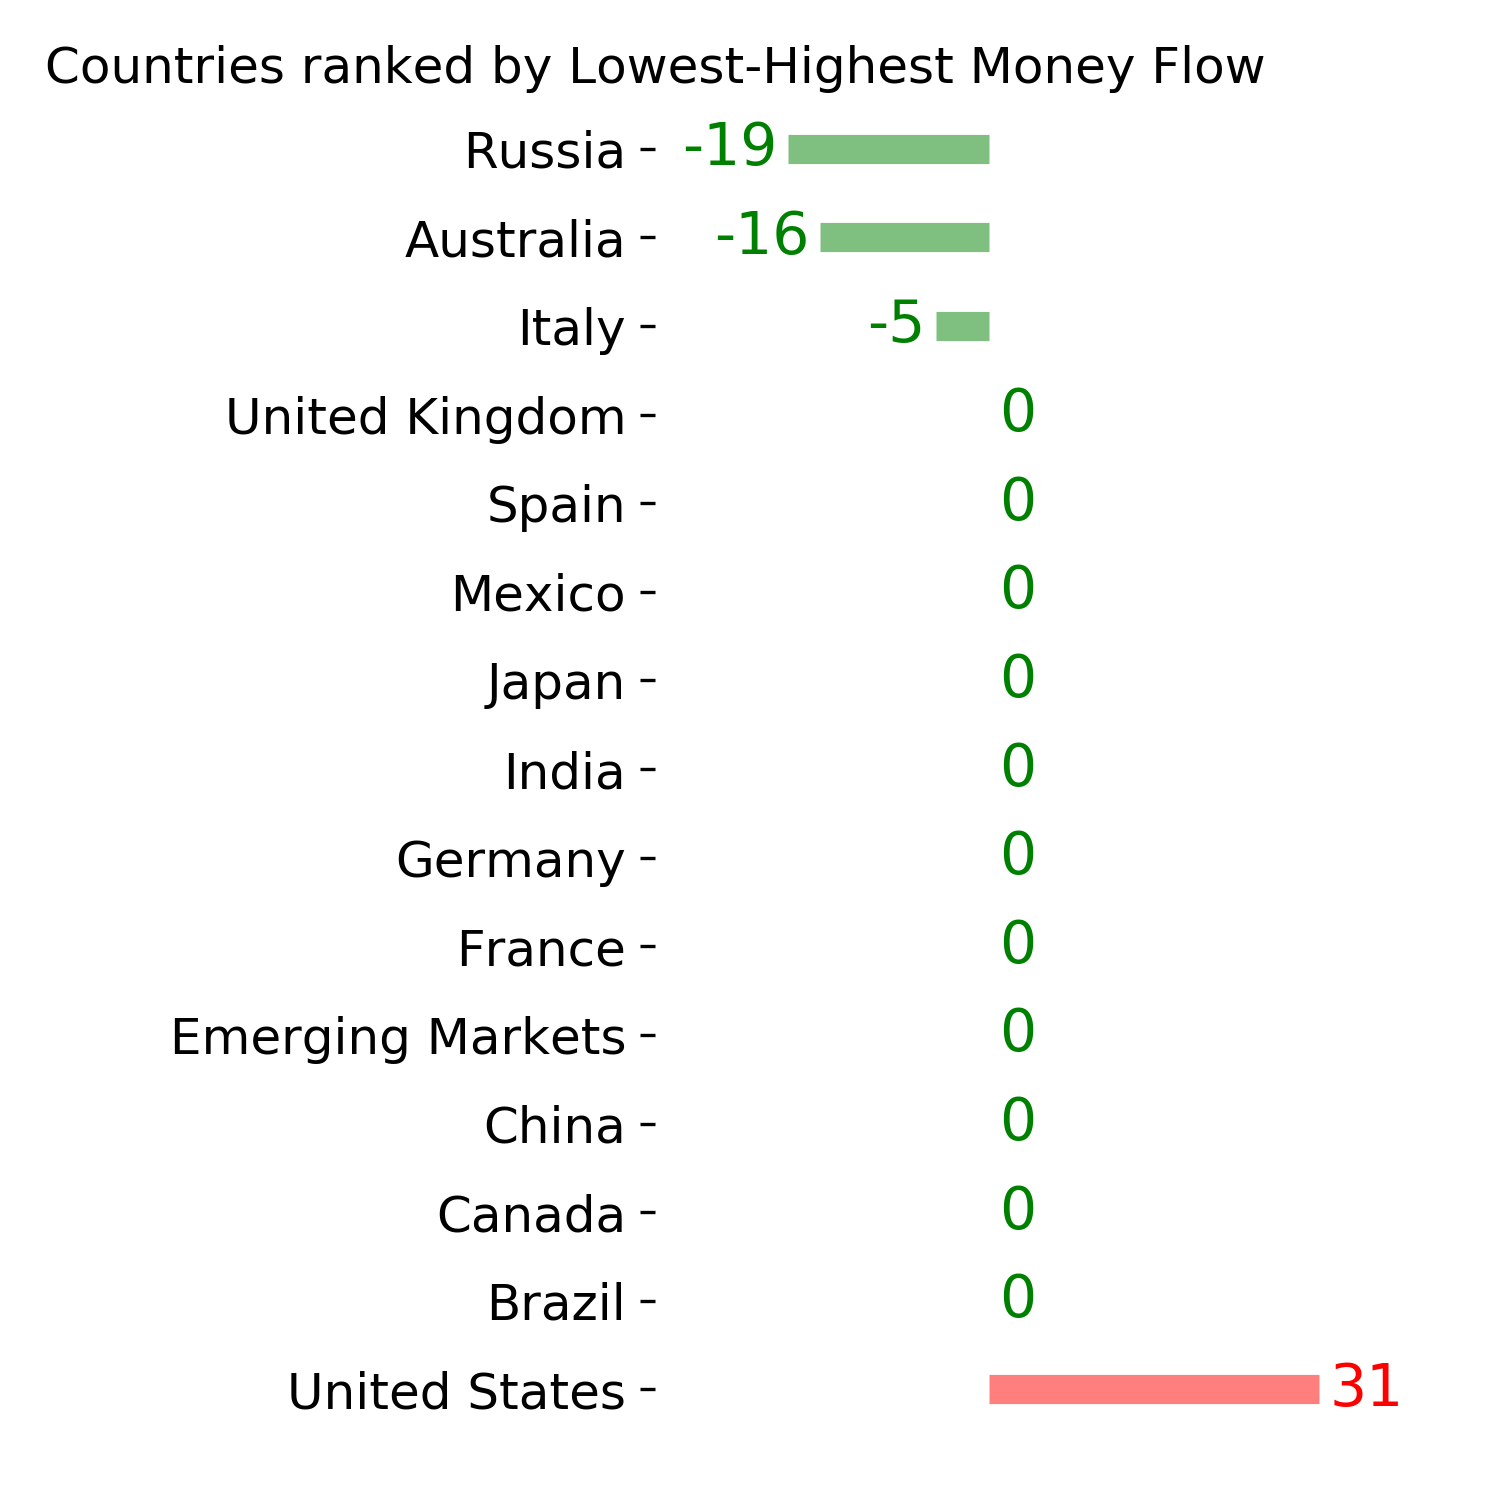
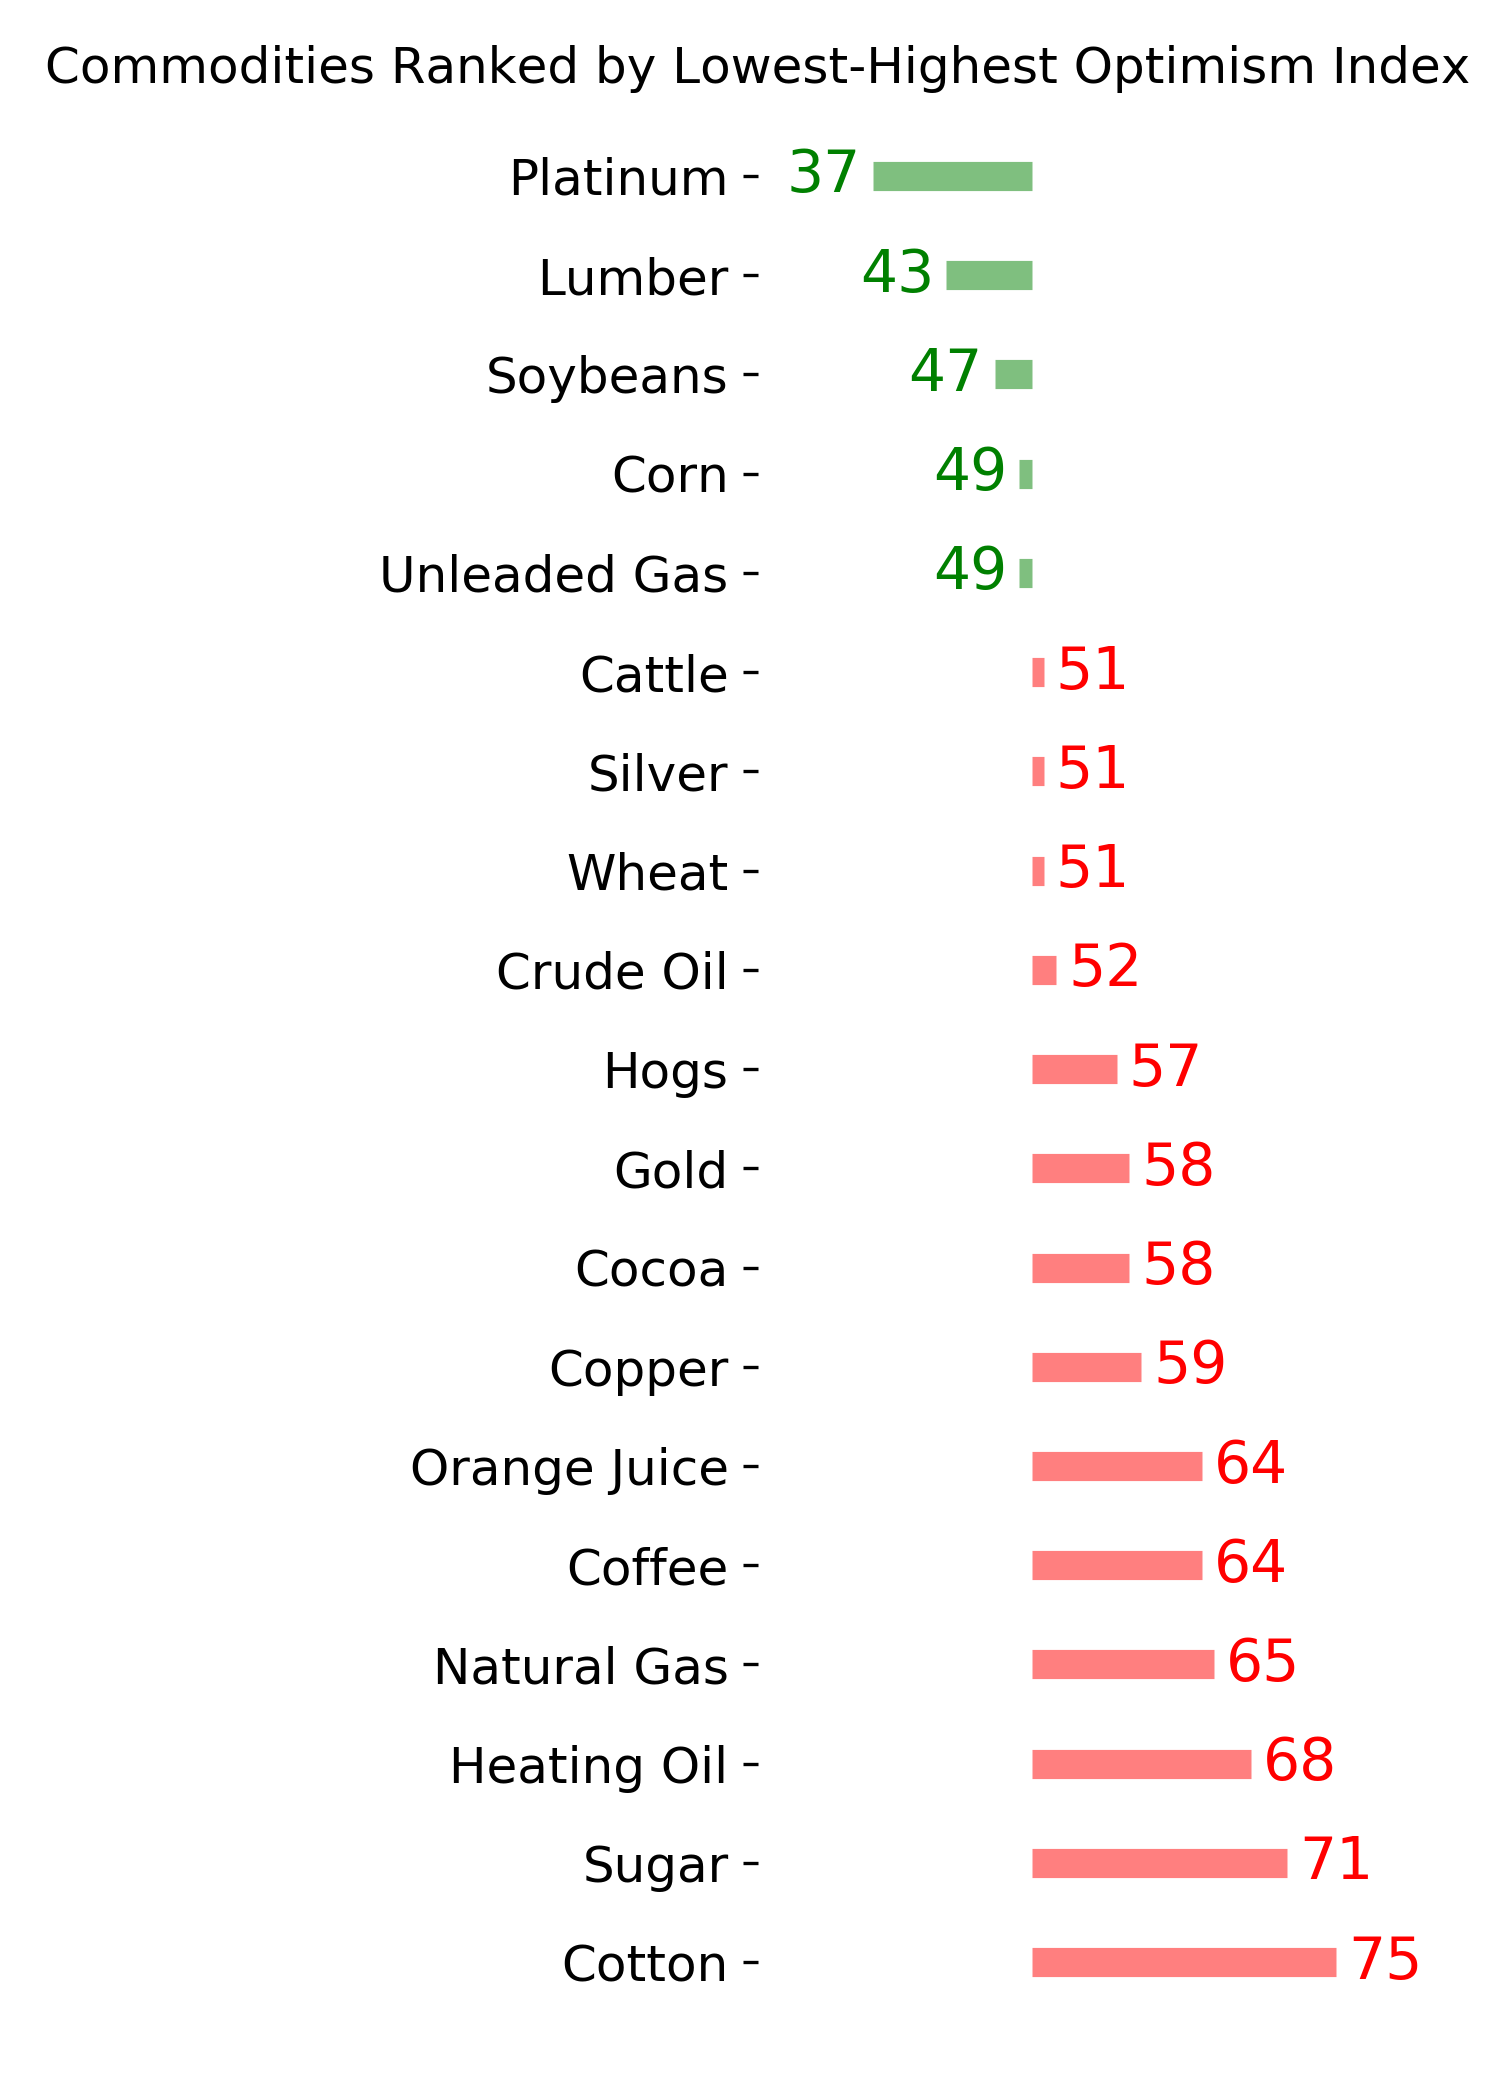
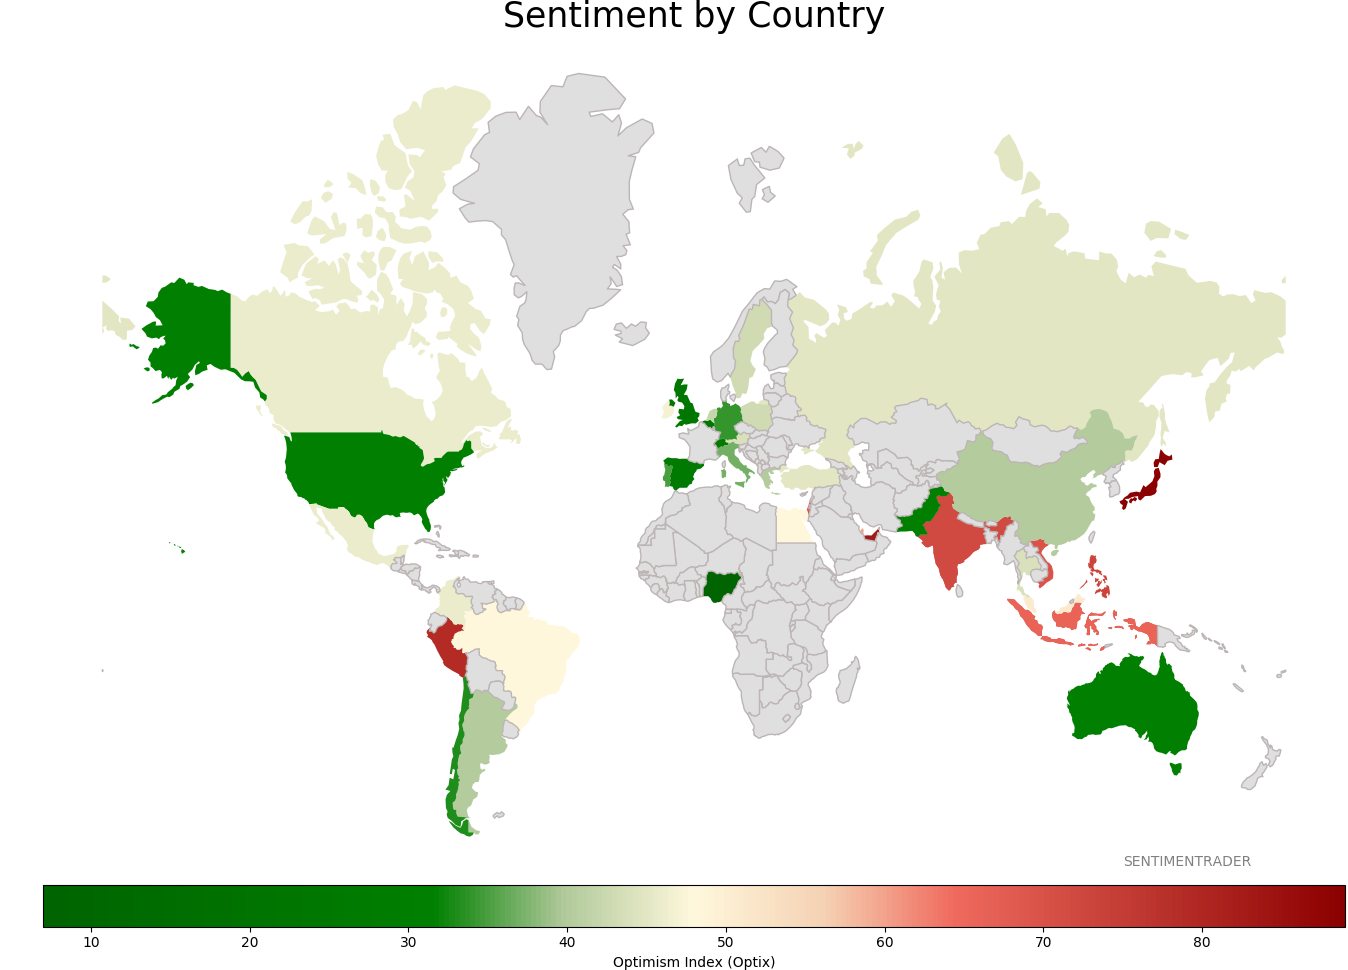
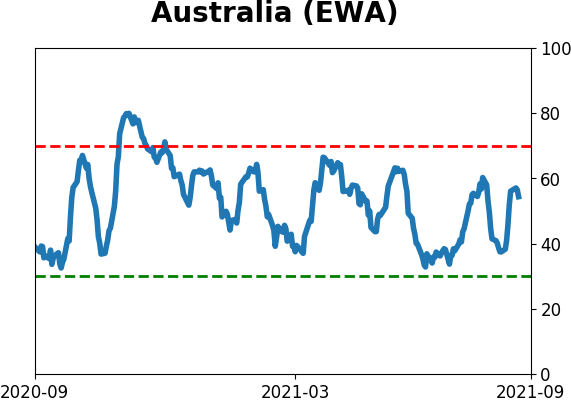
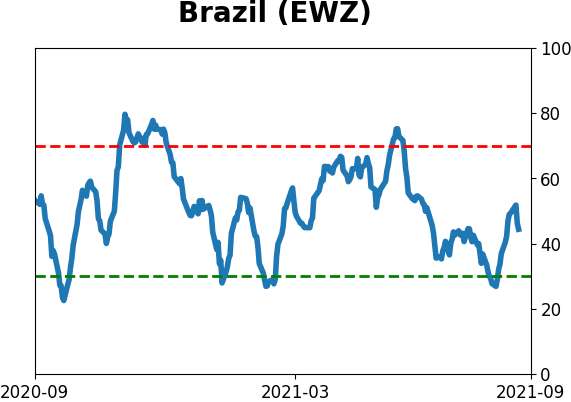
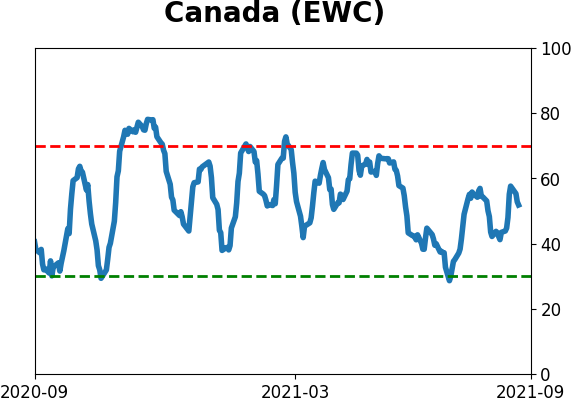
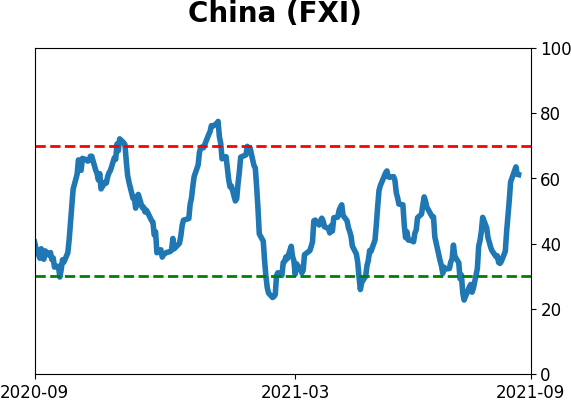
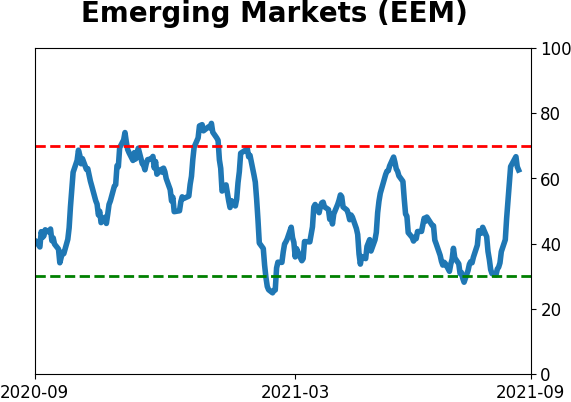
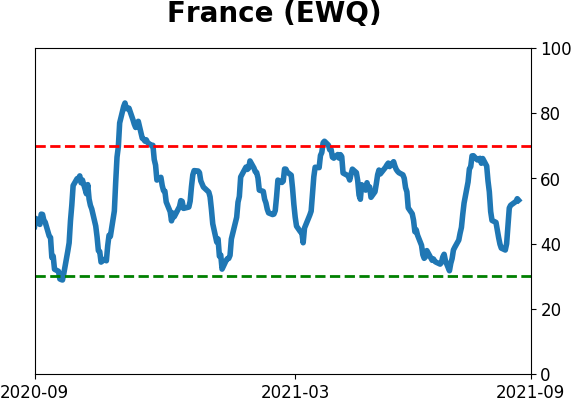
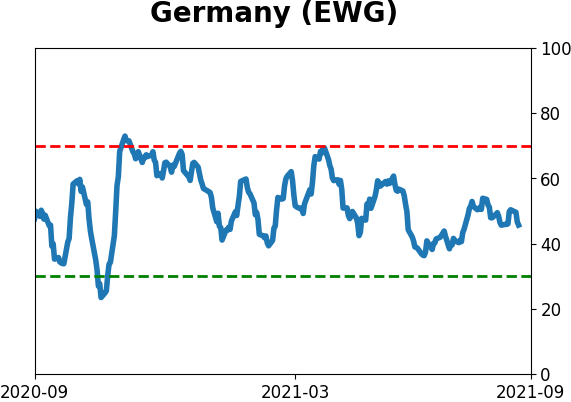
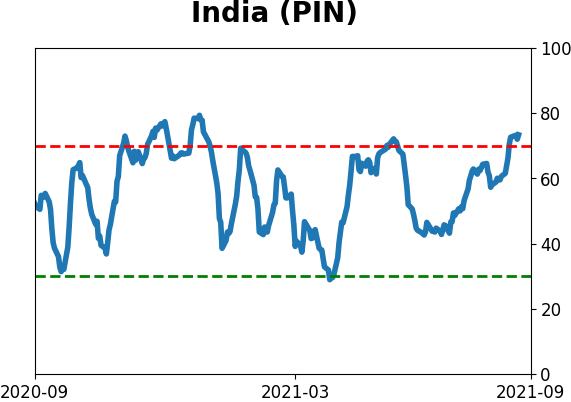
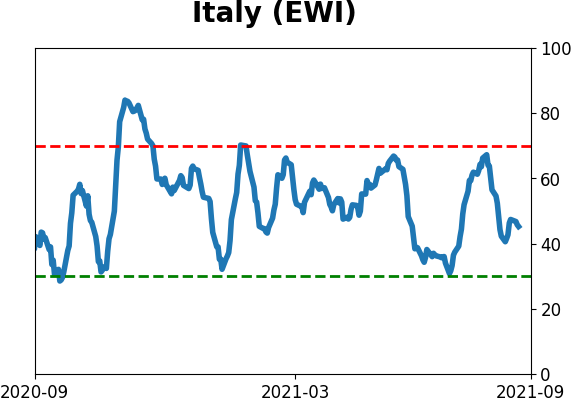
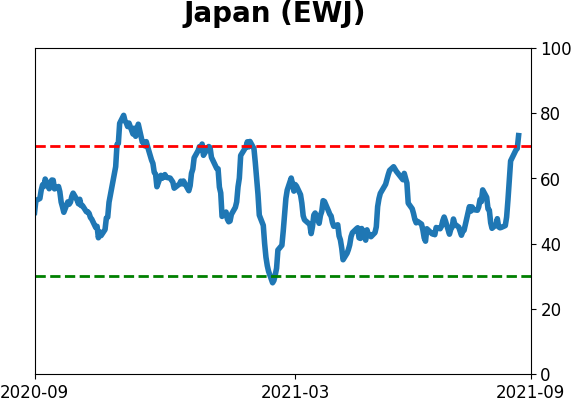
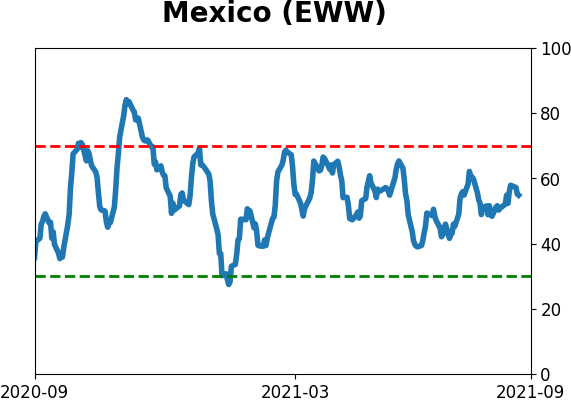
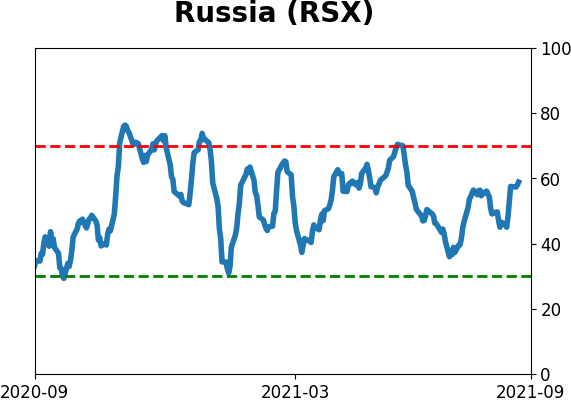
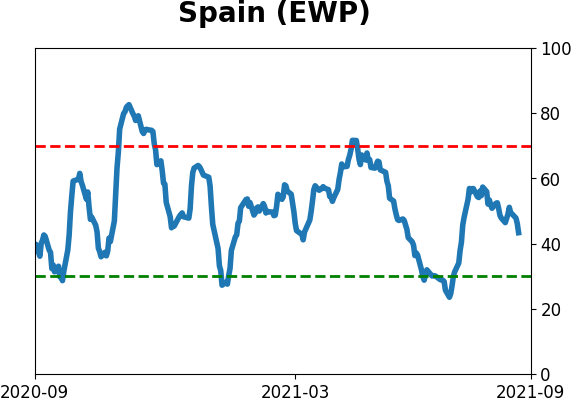
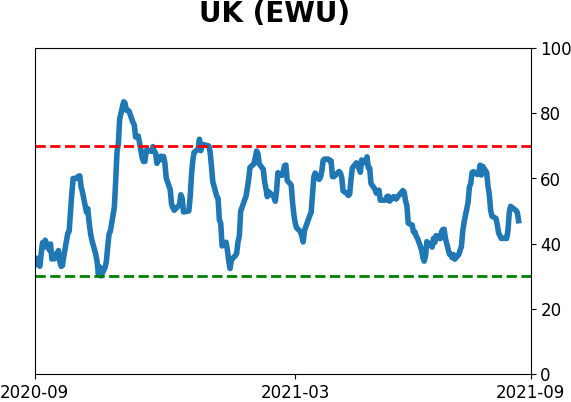
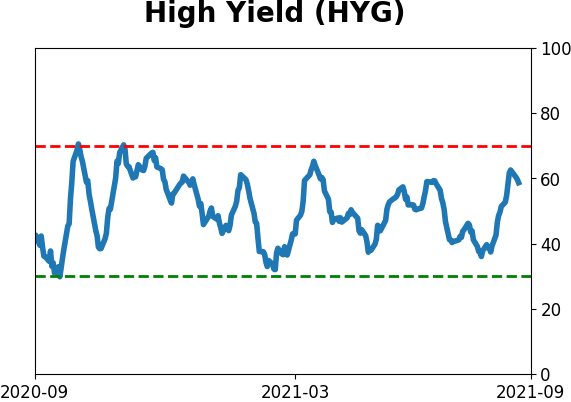
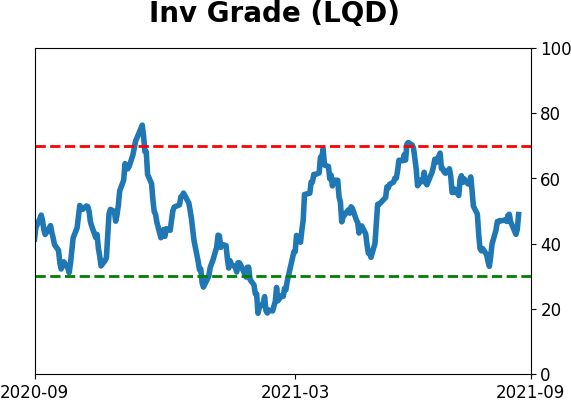
Sentiment Around The World
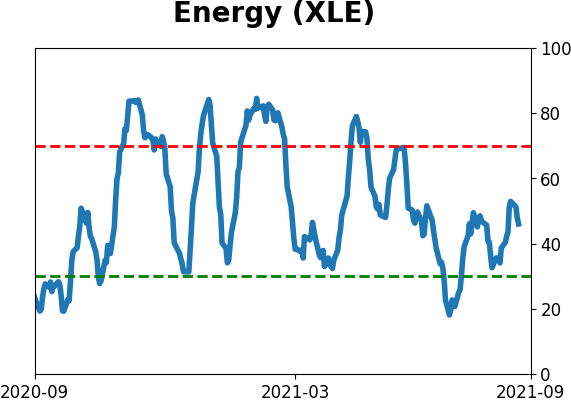
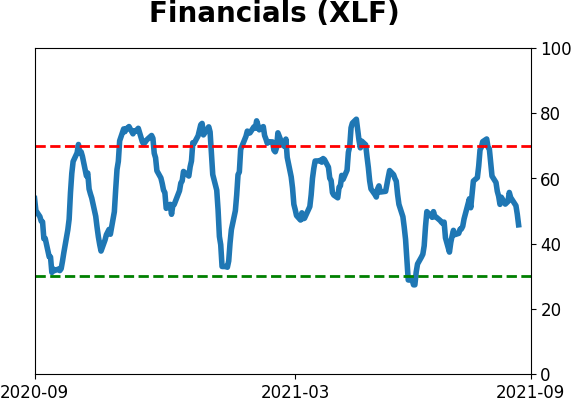
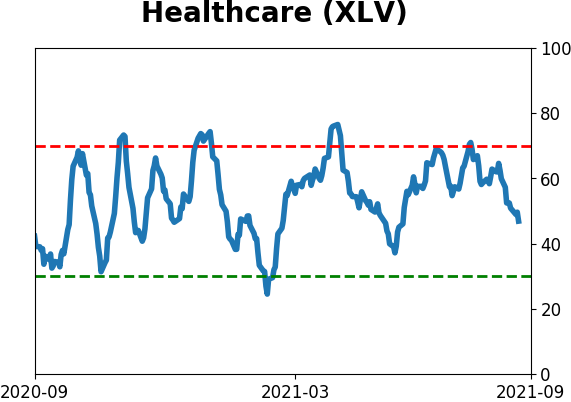
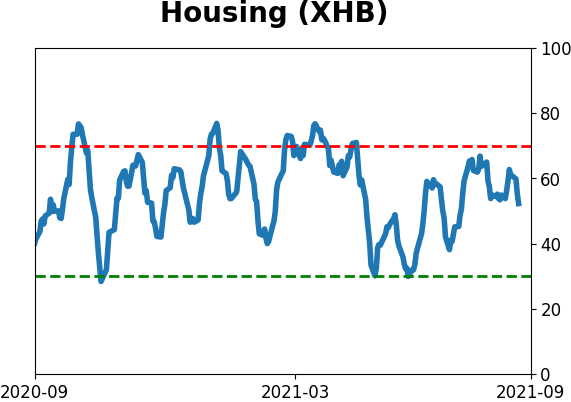
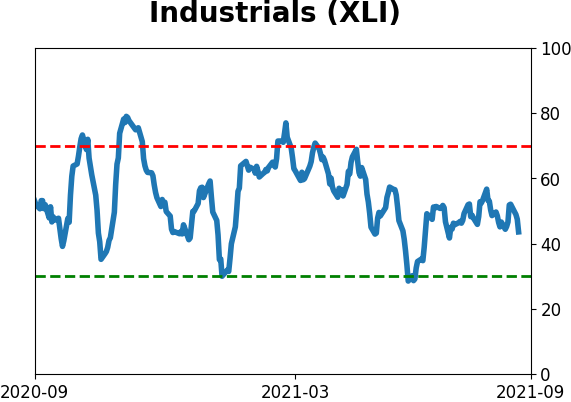
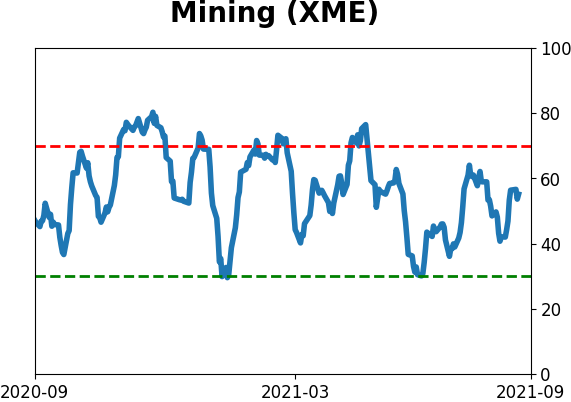
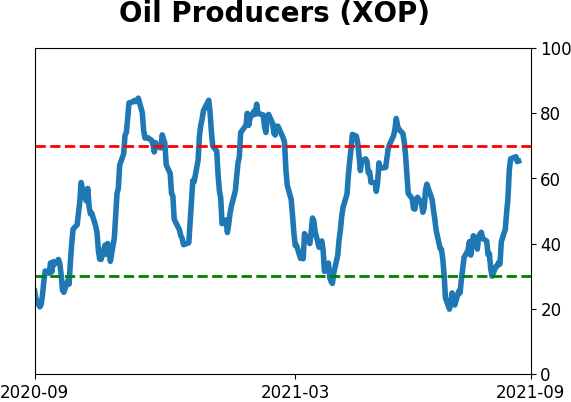
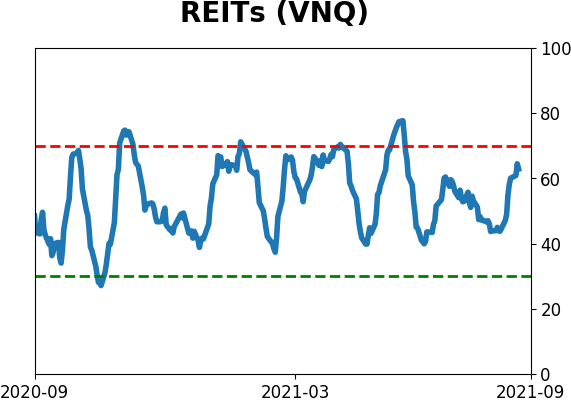
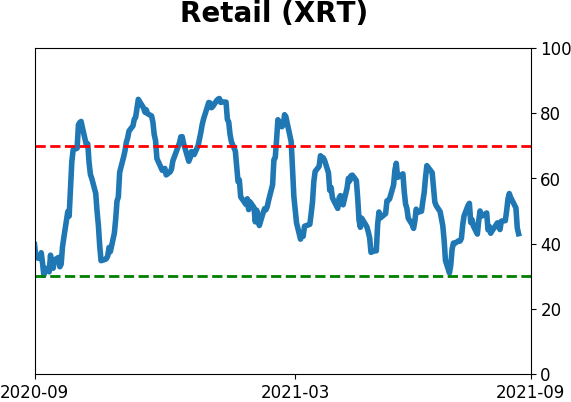
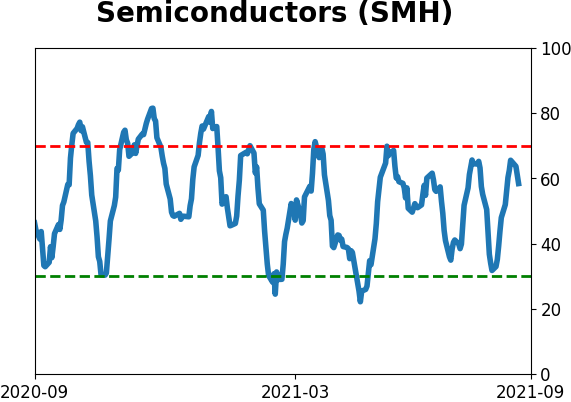
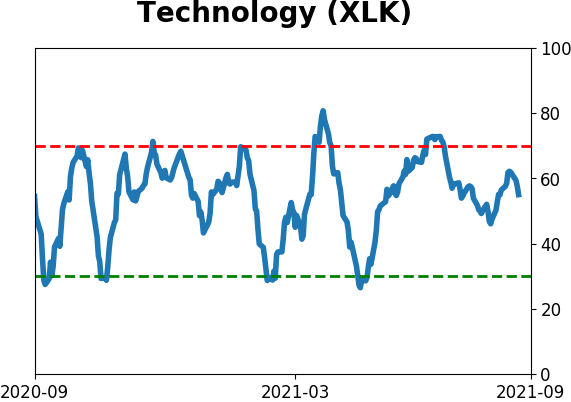
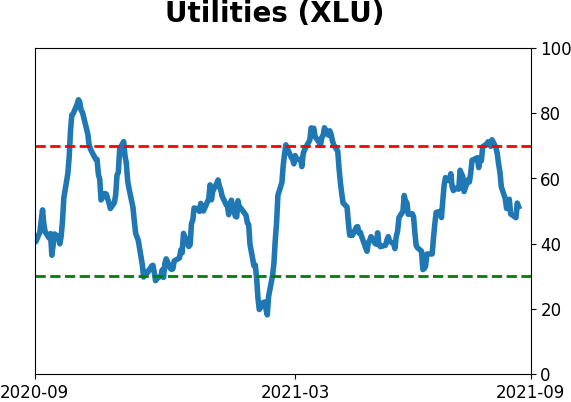
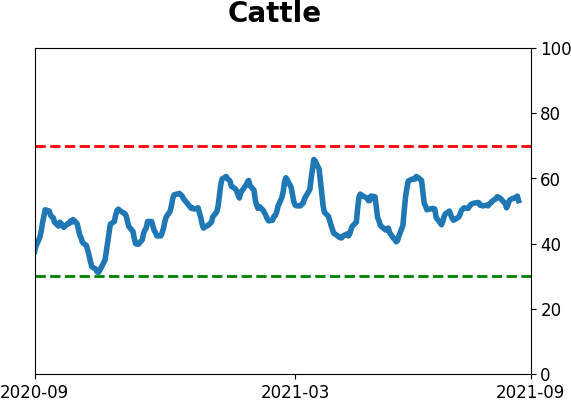
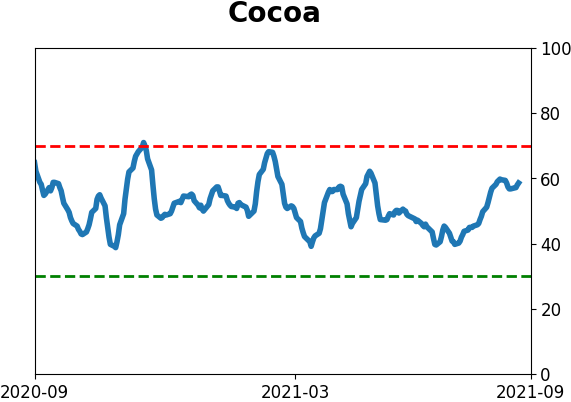
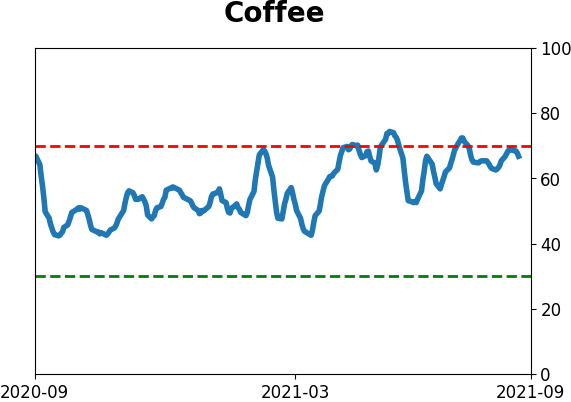
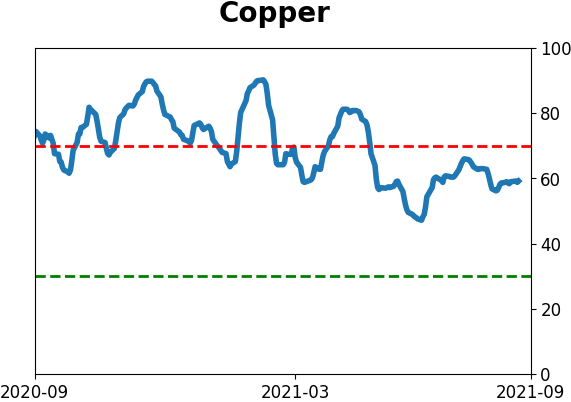
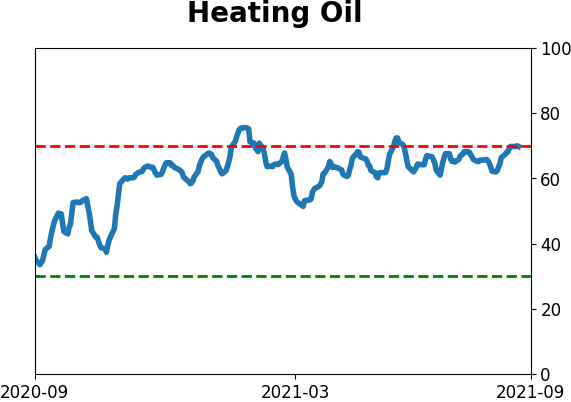
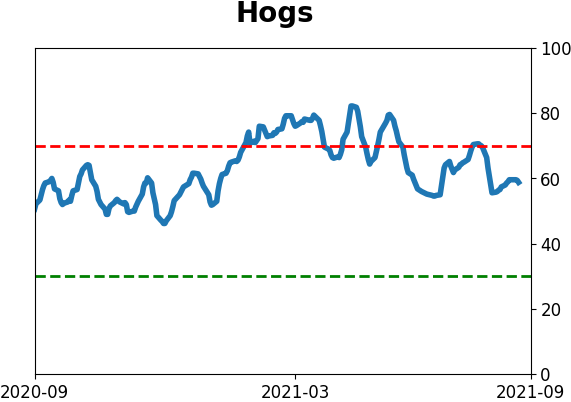
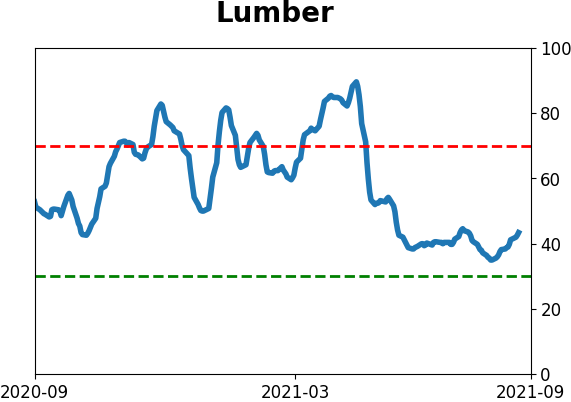
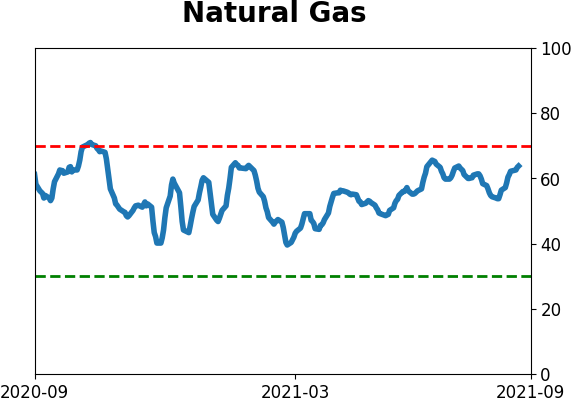
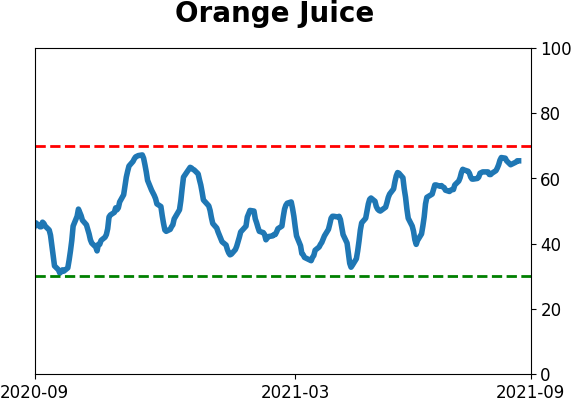
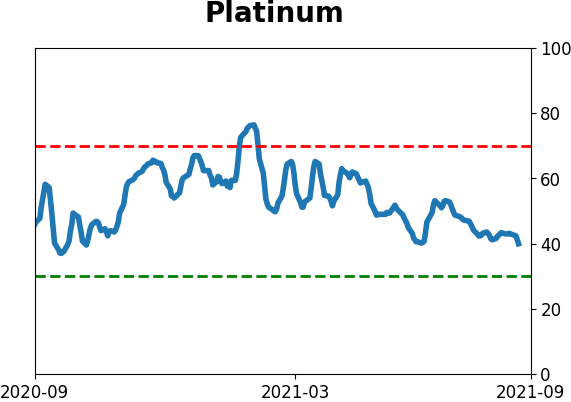
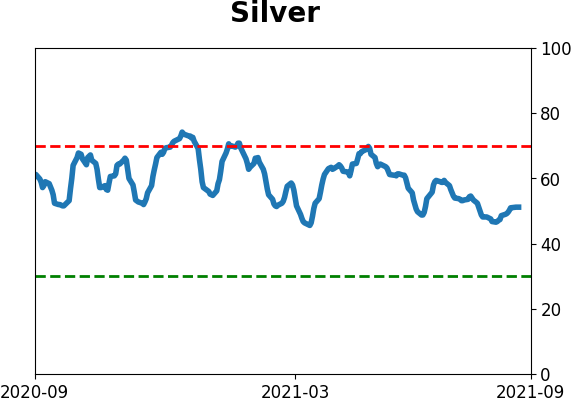
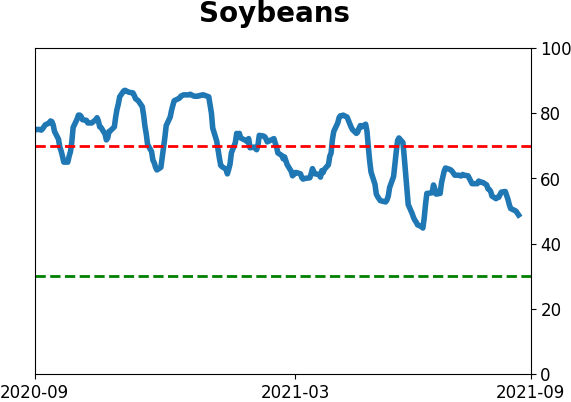
Optimism Index Thumbnails
|
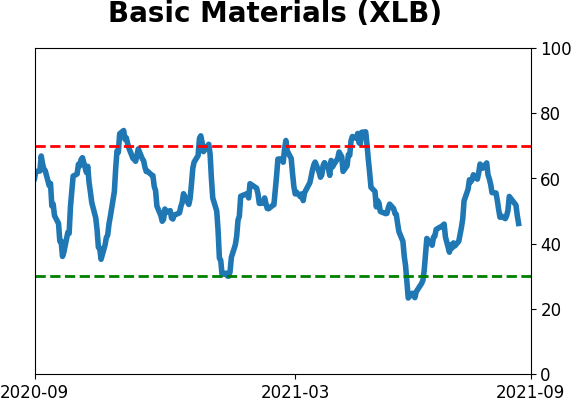
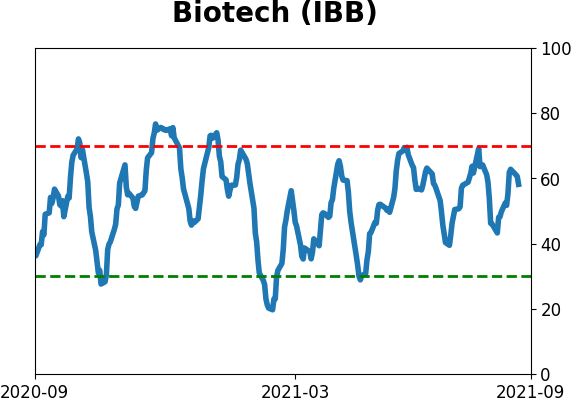
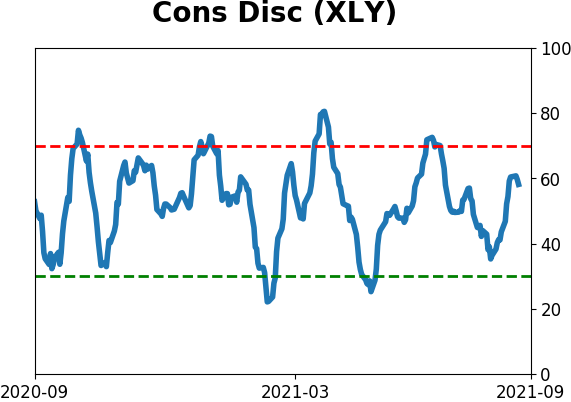
Sector ETF's - 10-Day Moving Average
|
|
|
Country ETF's - 10-Day Moving Average
|
|
|
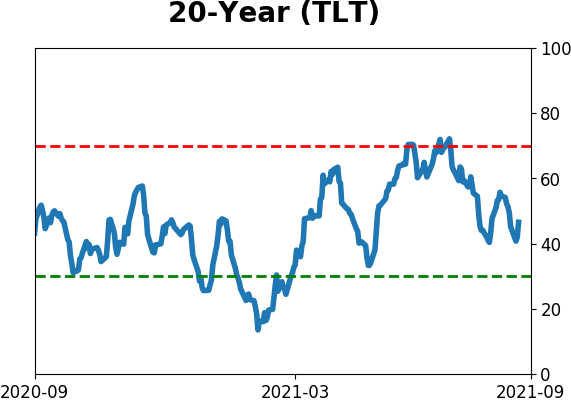
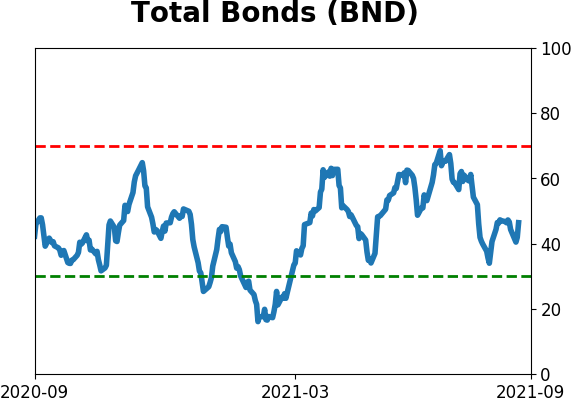
Bond ETF's - 10-Day Moving Average
|
|
|
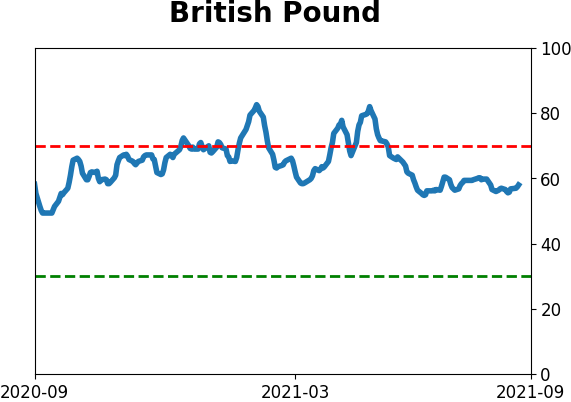
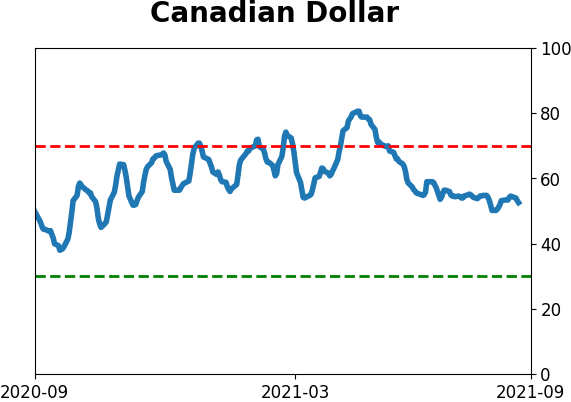
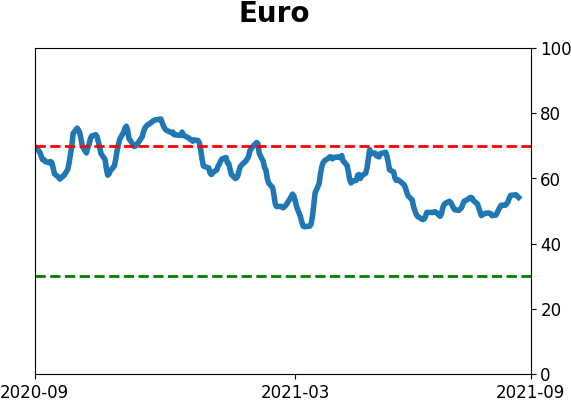
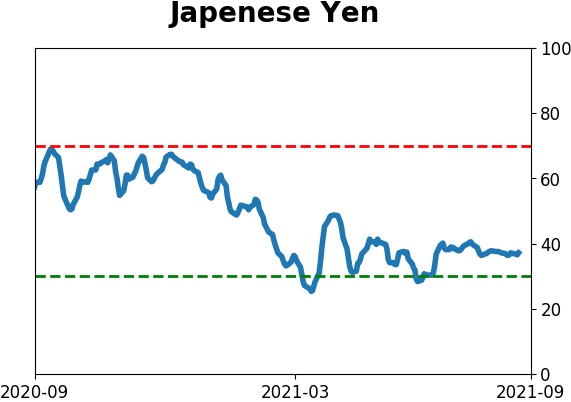
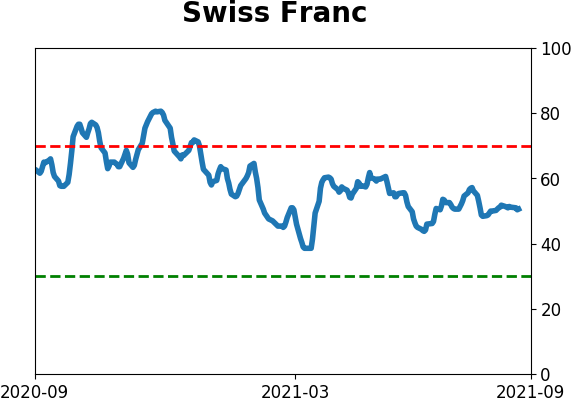
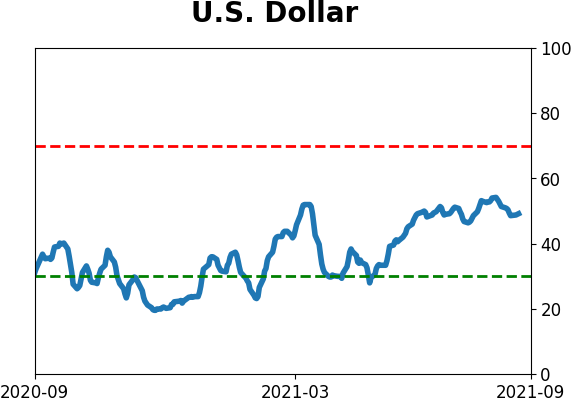
Currency ETF's - 5-Day Moving Average
|
|
|
Commodity ETF's - 5-Day Moving Average
|
|