Headlines
|
|
Nasdaq Joins the Breadth Thrust Party:
Over a 2-week period, stocks traded on the Nasdaq exchange saw an impressive thrust, with an average of more than 60% advancing issues and more than 65% of volume flowing into them. These thrusts have preceded very strong returns in the Nasdaq Composite.
Bottom Line:
STOCKS: Hold
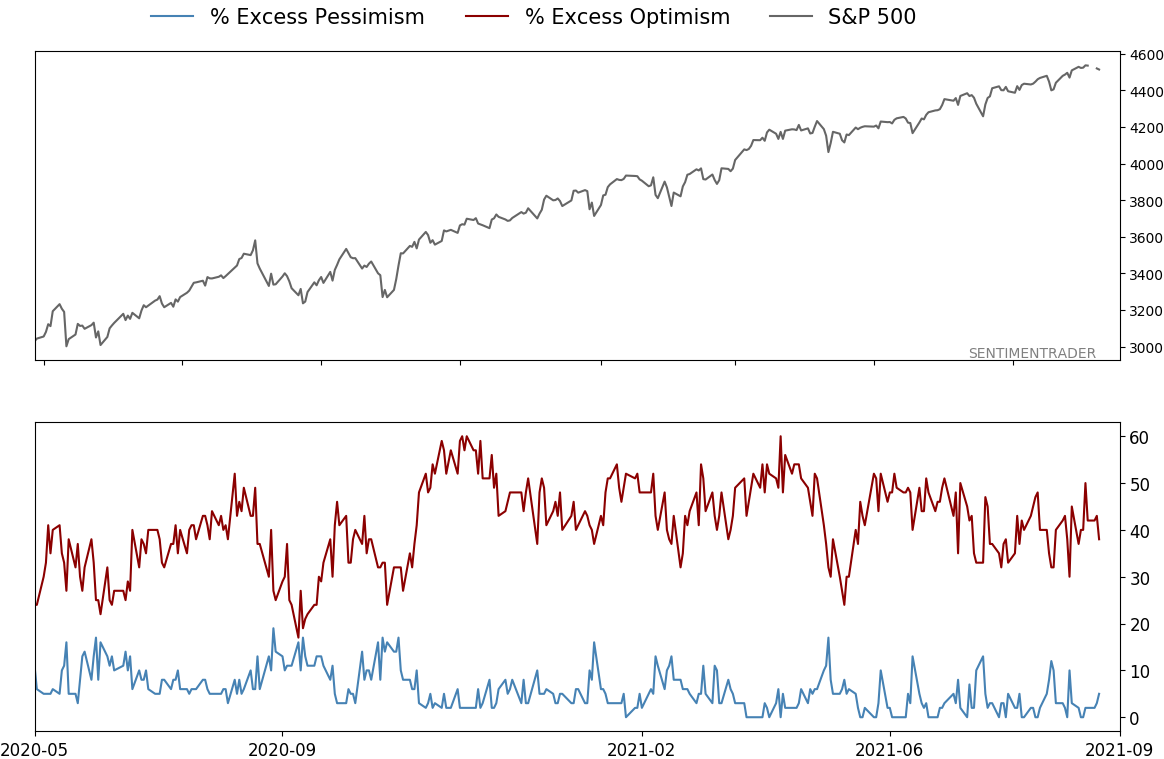
Sentiment continues to decline from the speculative February peak. With deteriorating breadth, this raises the risk of poor short- to medium-term returns until optimism and better breadth returns. See the Outlook & Allocations page for more. BONDS: Hold
Various parts of the market got hit in March, with the lowest Bond Optimism Index we usually see during healthy environments. Bond prices have modest recovered and there is no edge among the data we follow. GOLD: Hold
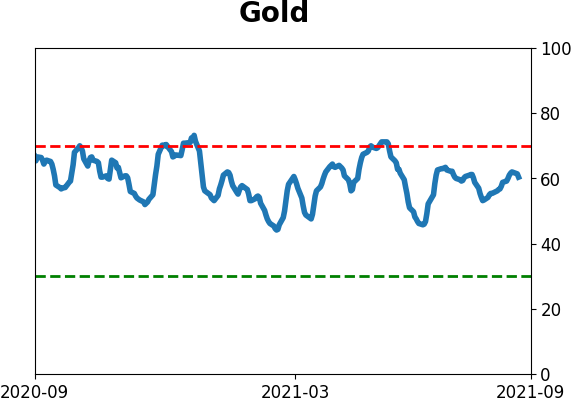
Gold and miners were rejected after trying to recover above their 200-day averages in May. Lately, some medium-term (not long-term) oversold extremes in breadth measures among miners have triggered.
|
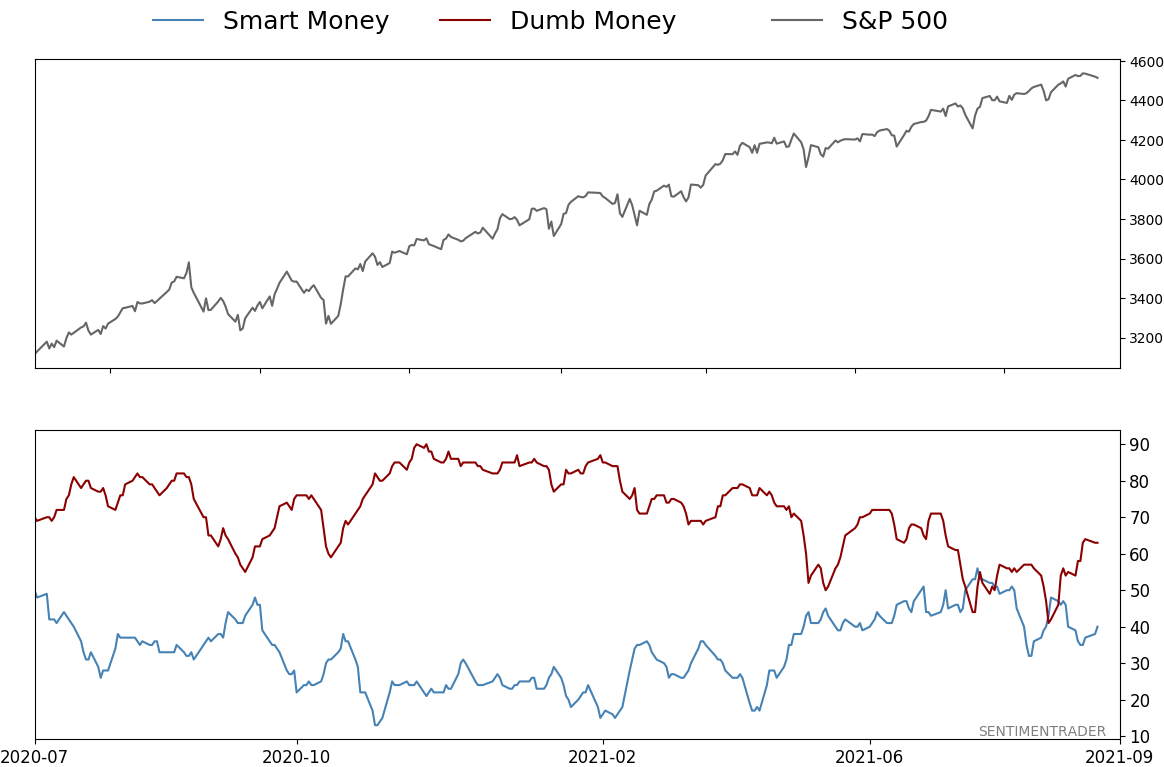
Smart / Dumb Money Confidence
|
Smart Money Confidence: 40%
Dumb Money Confidence: 63%
|
|
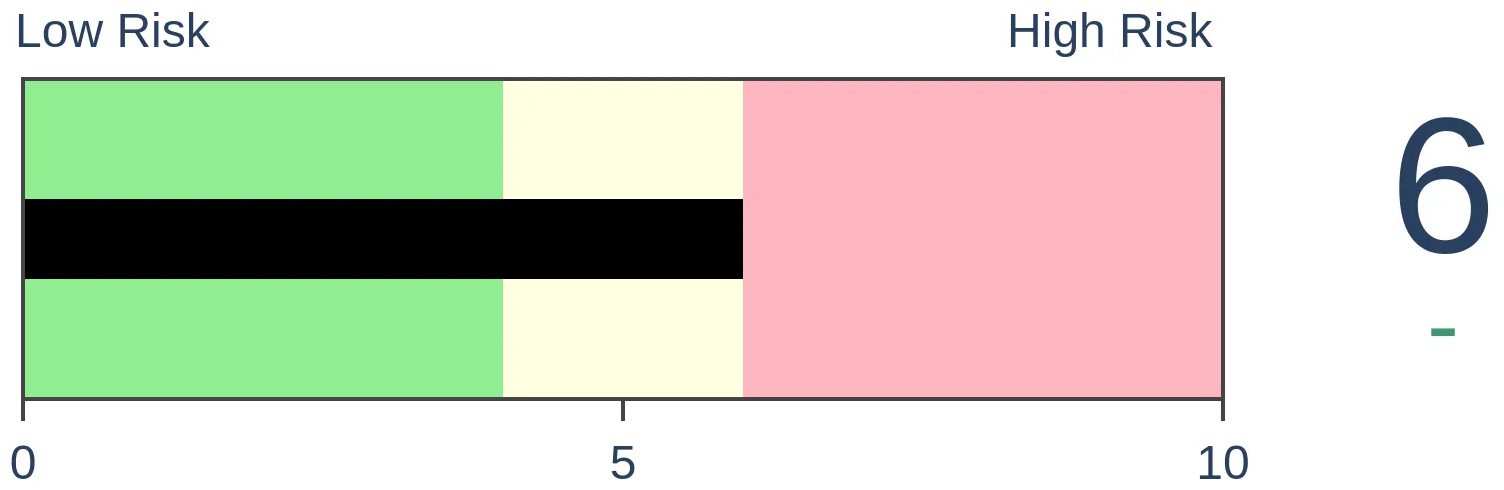
Risk Levels
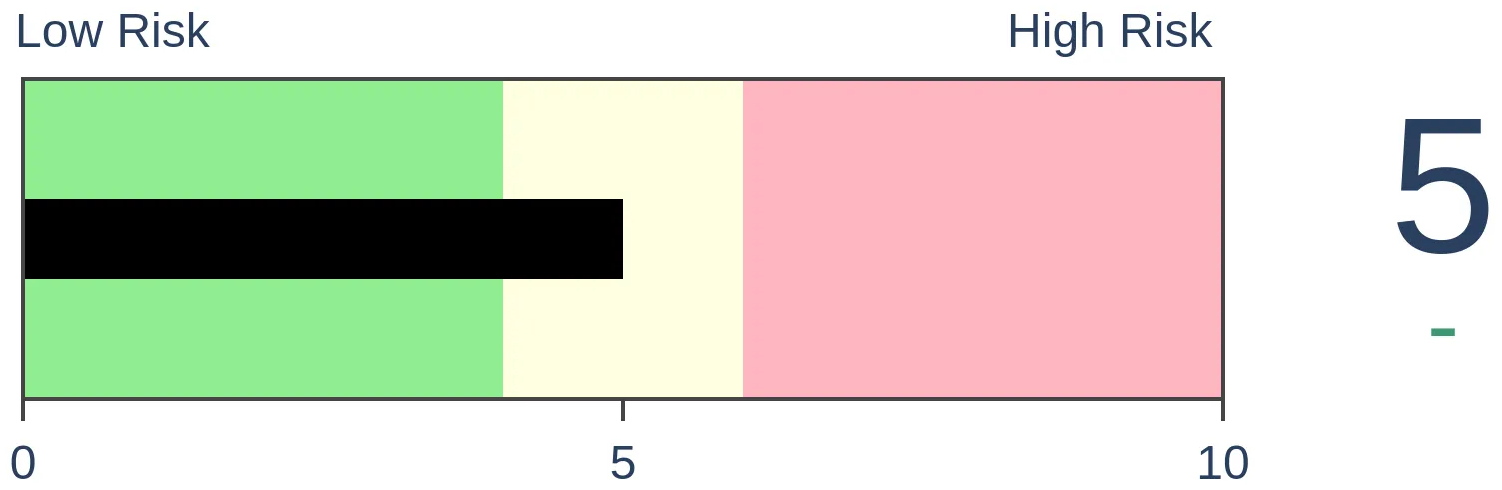
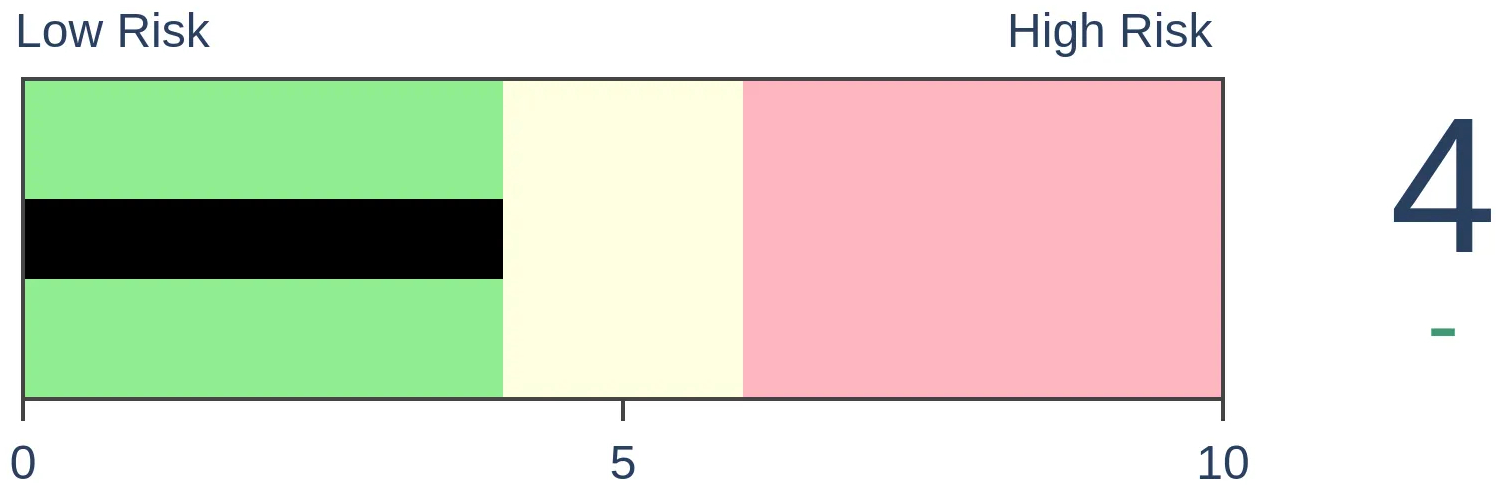
Stocks Short-Term

|
Stocks Medium-Term
|
|
Bonds

|
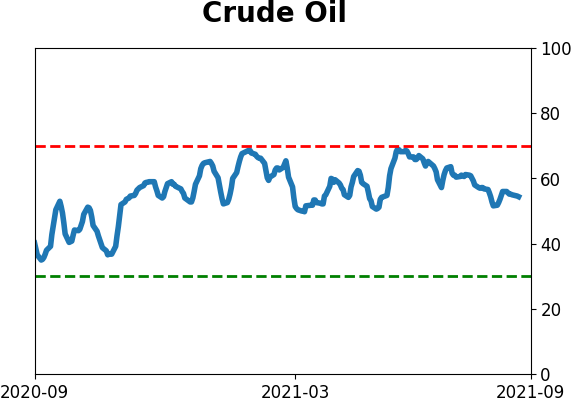
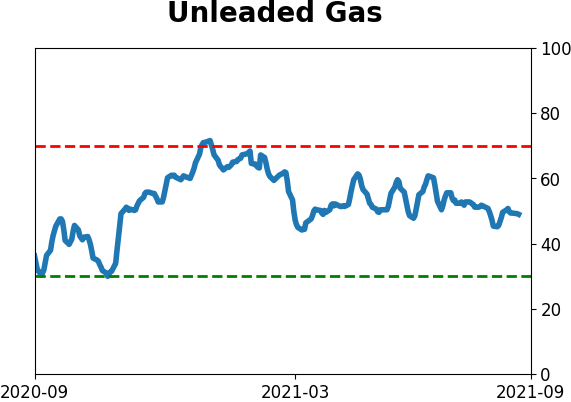
Crude Oil

|
|
Gold
|
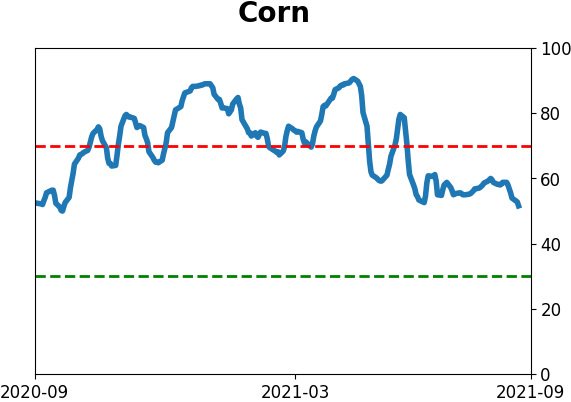
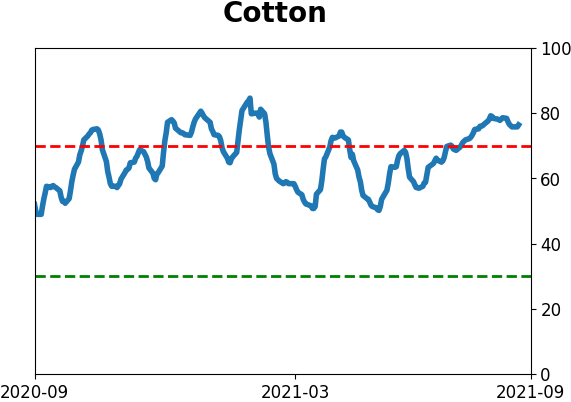
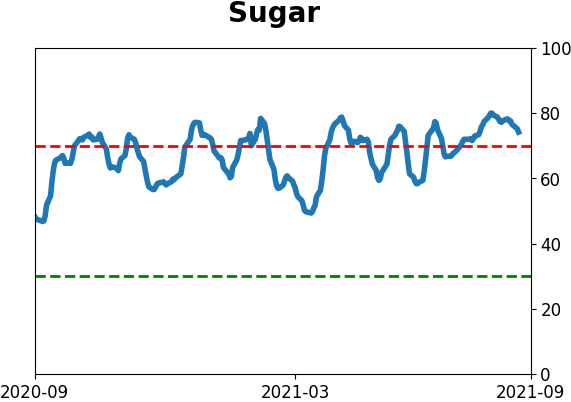
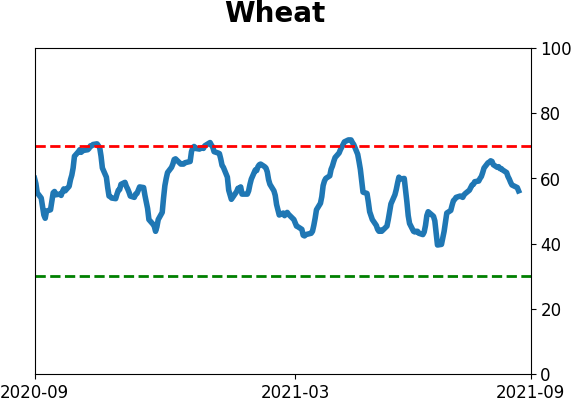
Agriculture
|
|
Research
By Jason Goepfert
BOTTOM LINE
Over a 2-week period, stocks traded on the Nasdaq exchange saw an impressive thrust, with an average of more than 60% advancing issues and more than 65% of volume flowing into them. These thrusts have preceded very strong returns in the Nasdaq Composite.
FORECAST / TIMEFRAME
XLK -- Up, Short-Term
|
Stocks traded on the NYSE decided to make a fool out of those worried about weak breadth. Last week, the Nasdaq joined the party.
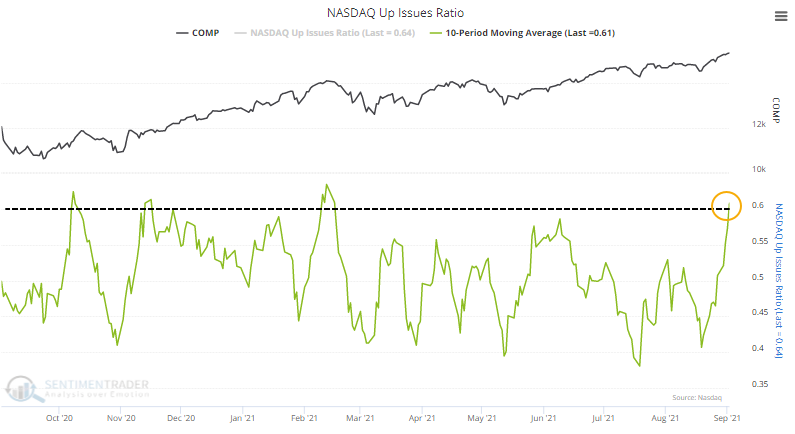
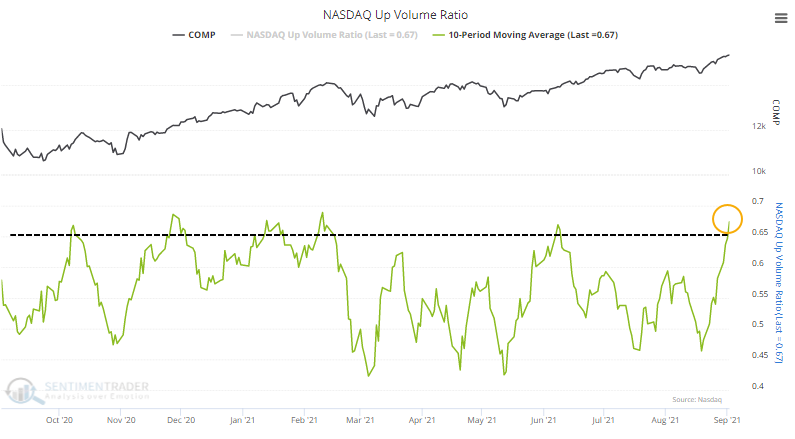
After weeks of disturbingly poor internal participation and a flurry of technical warning signs, stocks on the Nasdaq thrust higher last week. In a premium note, Dean showed a reversal signal in the Nasdaq McClellan Oscillator. We can see something similar in its component indicators, the Up Issues Ratio and Up Volume Ratio.
Over the past 10 days, an average of more than 60% of securities on the Nasdaq advanced.
Even more impressively, more than 65% of volume flowed into advancing issues on average each day. Granted, volume at the end of August tends to be tepid, but it was still focused on the winners.
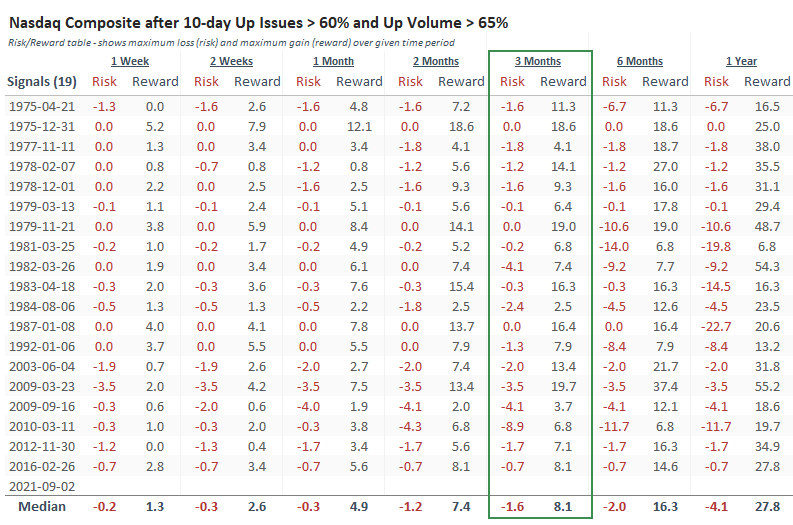
A SIGNAL WITH NO LOSSES
Thrusts like this have been exceptionally positive for forward returns.
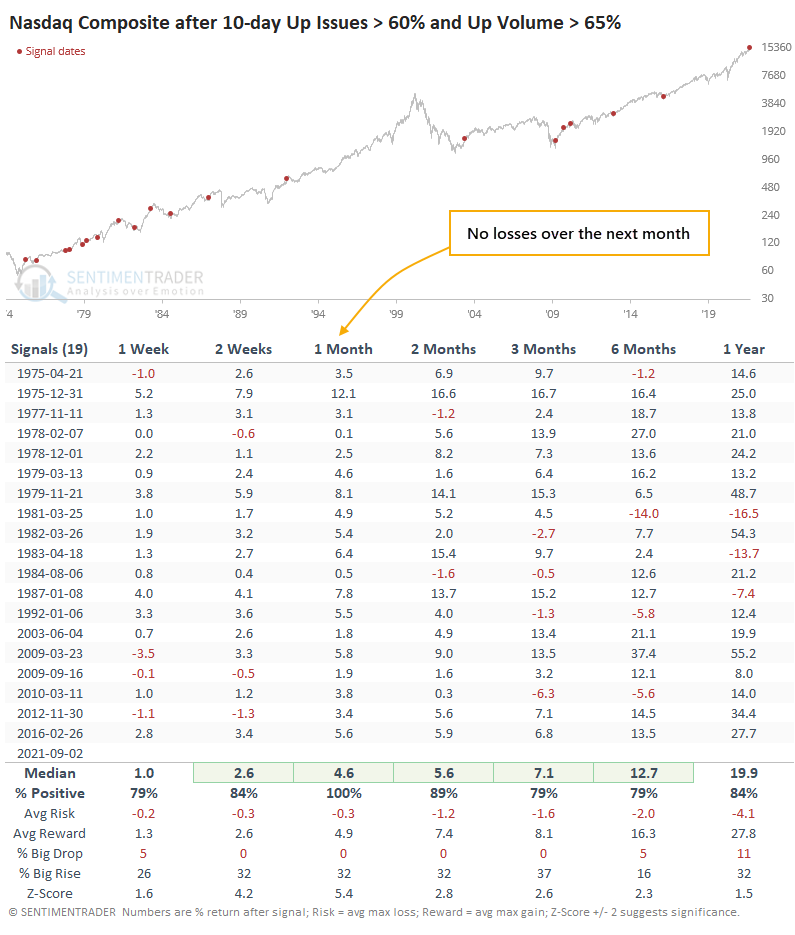
As we so often see after thrusts like this, the most notable aspect was the ridiculously skewed risk/reward ratio. Over the next three months, only one signal showed a loss at its worst point of more than -4.1%, while sixteen of them showed a gain at their best point of more than +4.1%.
Here's the rub, though...
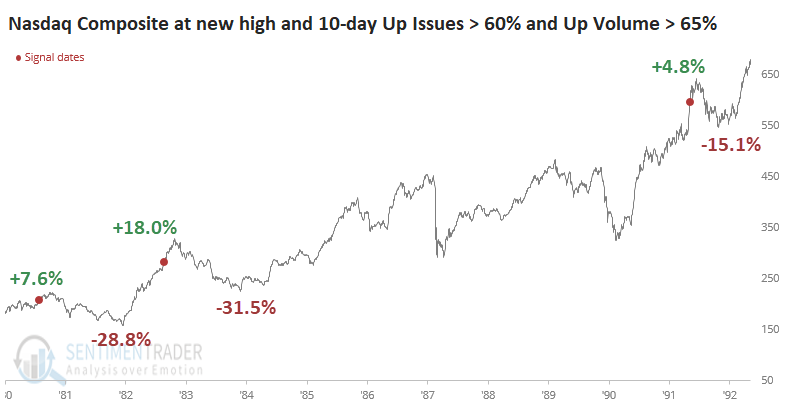
Oddly, the thrust triggered when the Composite was trading at a new high. Most of them came after protracted declines. Out of all the signals, only three others triggered with the Composite at (or even near) a multi-year high (1981-03-25, 1983-04-18, and 1992-01-06). The chart below shows how the Nasdaq rallied in the shorter term each time...and each of them was also a blow-off peak.
This is one more sign that the concerns from earlier this spring and summer, which never really had much impact (on the major indexes, anyway), are falling by the wayside. The internal thrusts in recent weeks have been impressive and carry a compelling historical record of more gains ahead.
The biggest concern, and it is a concern, is that these are occurring when the indexes are trading at record highs and valuations, which increases the probability that we're in the process of a blow-off peak.
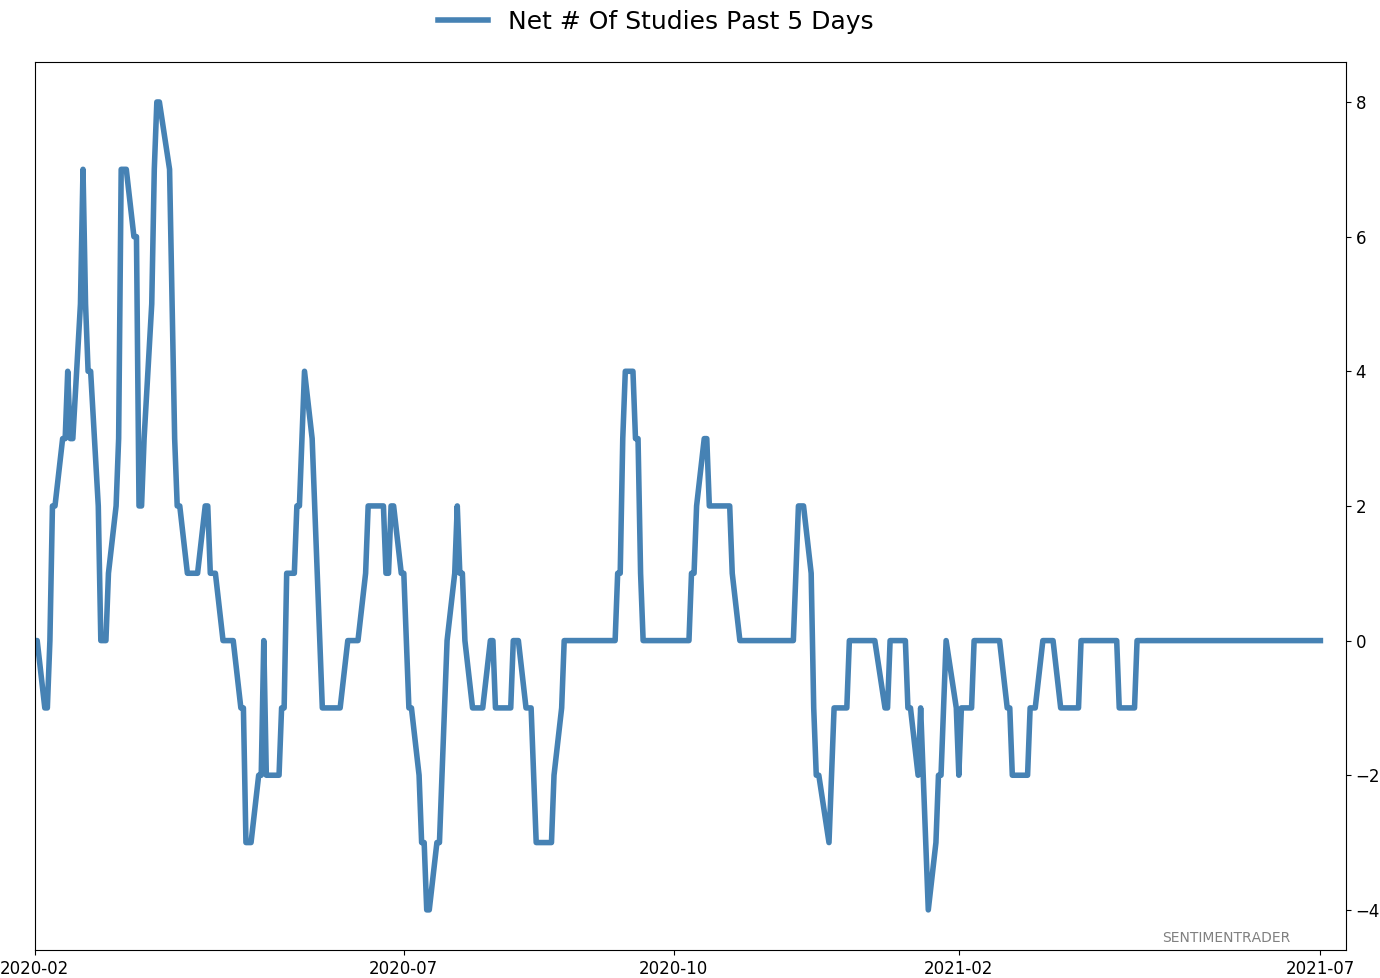
Active Studies
| Time Frame | Bullish | Bearish | | Short-Term | 0 | 6 | | Medium-Term | 5 | 3 | | Long-Term | 11 | 5 |
|
Indicators at Extremes
Portfolio
| Position | Description | Weight % | Added / Reduced | Date | | Stocks | RSP | 4.1 | Added 4.1% | 2021-05-19 | | Bonds | 23.9% BND, 6.9% SCHP | 30.7 | Reduced 7.1% | 2021-05-19 | | Commodities | GCC | 2.6 | Reduced 2.1%
| 2020-09-04 | | Precious Metals | GDX | 5.6 | Reduced 4.2% | 2021-05-19 | | Special Situations | 4.3% XLE, 2.2% PSCE | 7.6 | Reduced 5.6% | 2021-04-22 | | Cash | | 49.4 | | |
|
Updates (Changes made today are underlined)
Much of our momentum and trend work has remained positive for several months, with some scattered exceptions. Almost all sentiment-related work has shown a poor risk/reward ratio for stocks, especially as speculation drove to record highs in exuberance in February. Much of that has worn off, and most of our models are back toward neutral levels. There isn't much to be excited about here. The same goes for bonds and even gold. Gold has been performing well lately and is back above long-term trend lines. The issue is that it has a poor record of holding onto gains when attempting a long-term trend change like this, so we'll take a wait-and-see approach. RETURN YTD: 8.5% 2020: 8.1%, 2019: 12.6%, 2018: 0.6%, 2017: 3.8%, 2016: 17.1%, 2015: 9.2%, 2014: 14.5%, 2013: 2.2%, 2012: 10.8%, 2011: 16.5%, 2010: 15.3%, 2009: 23.9%, 2008: 16.2%, 2007: 7.8%
|
|
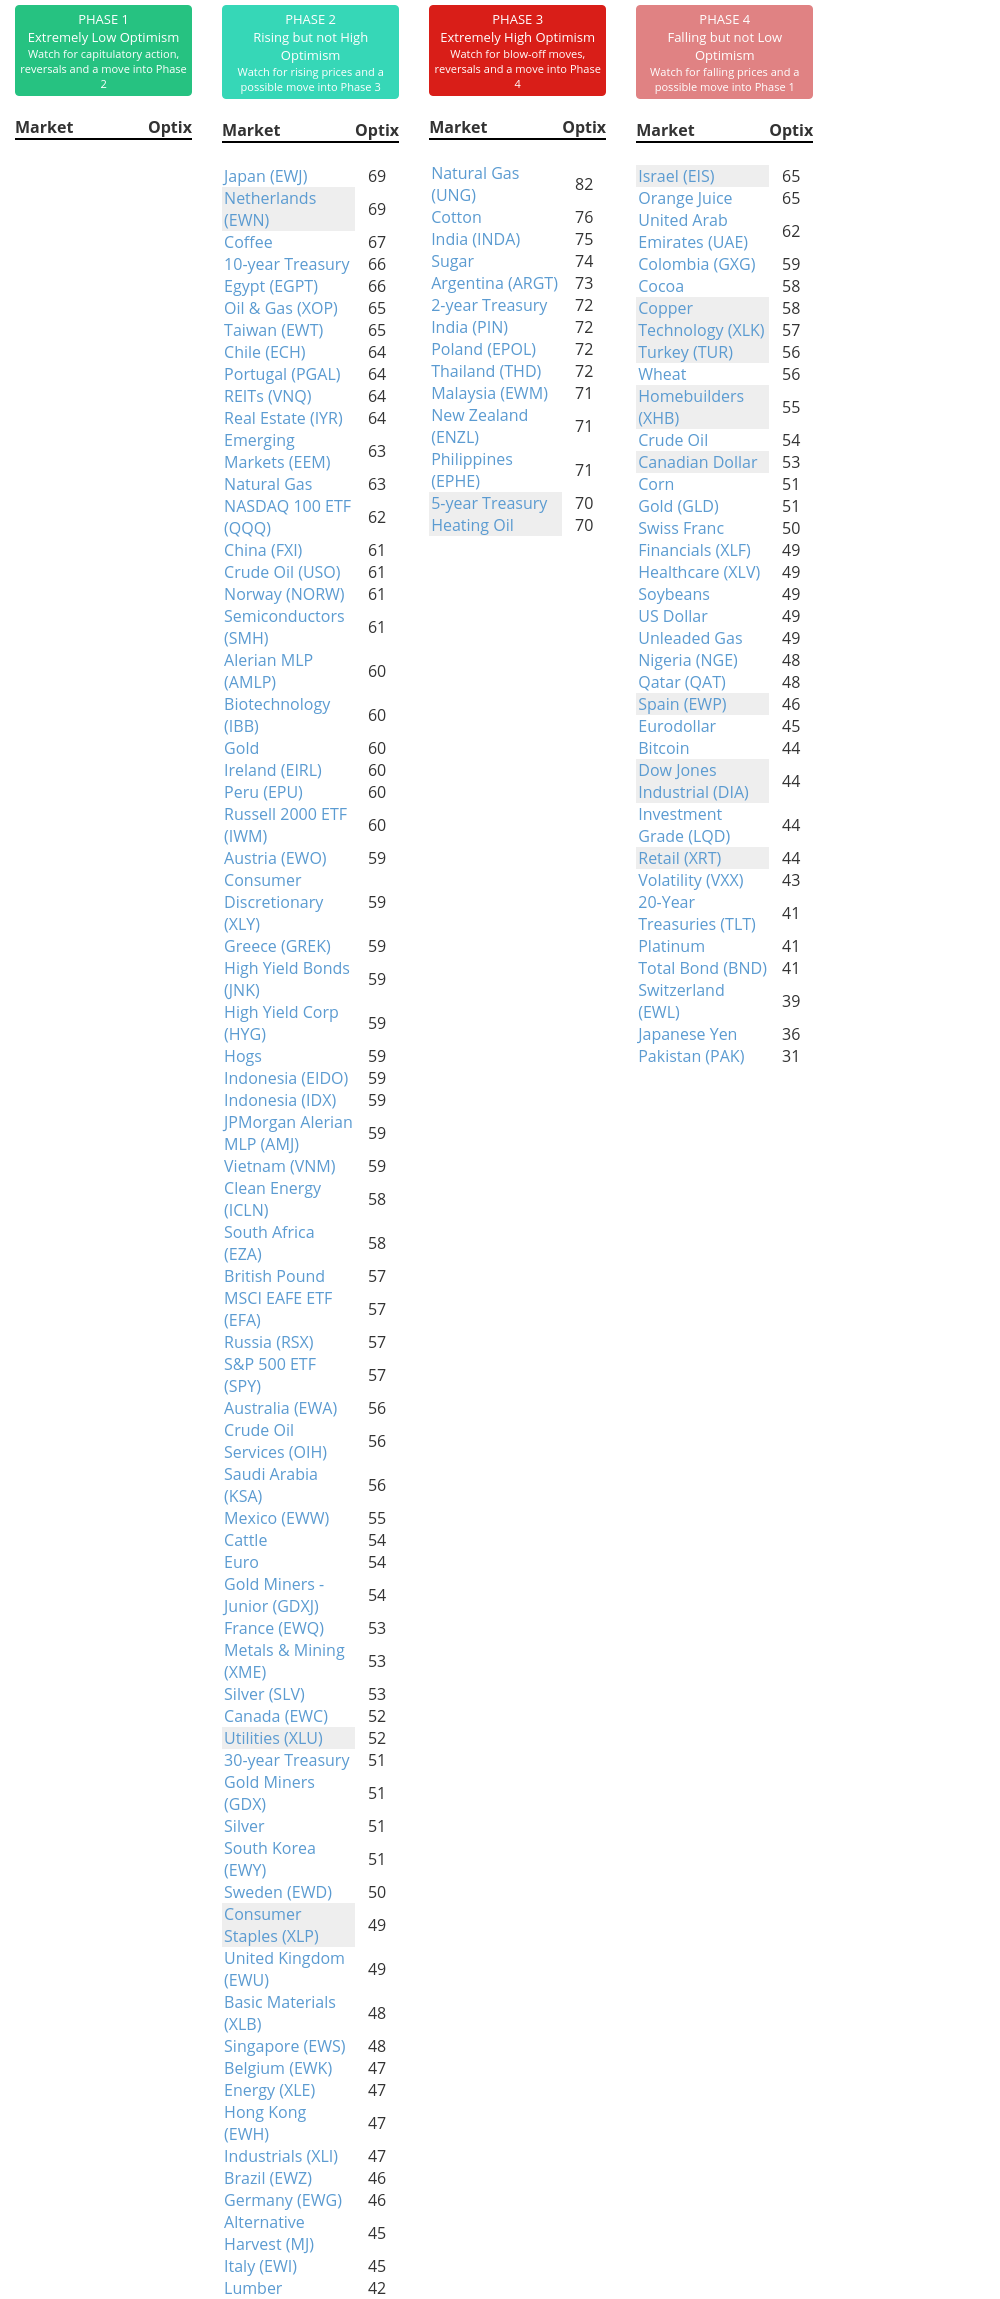
Phase Table
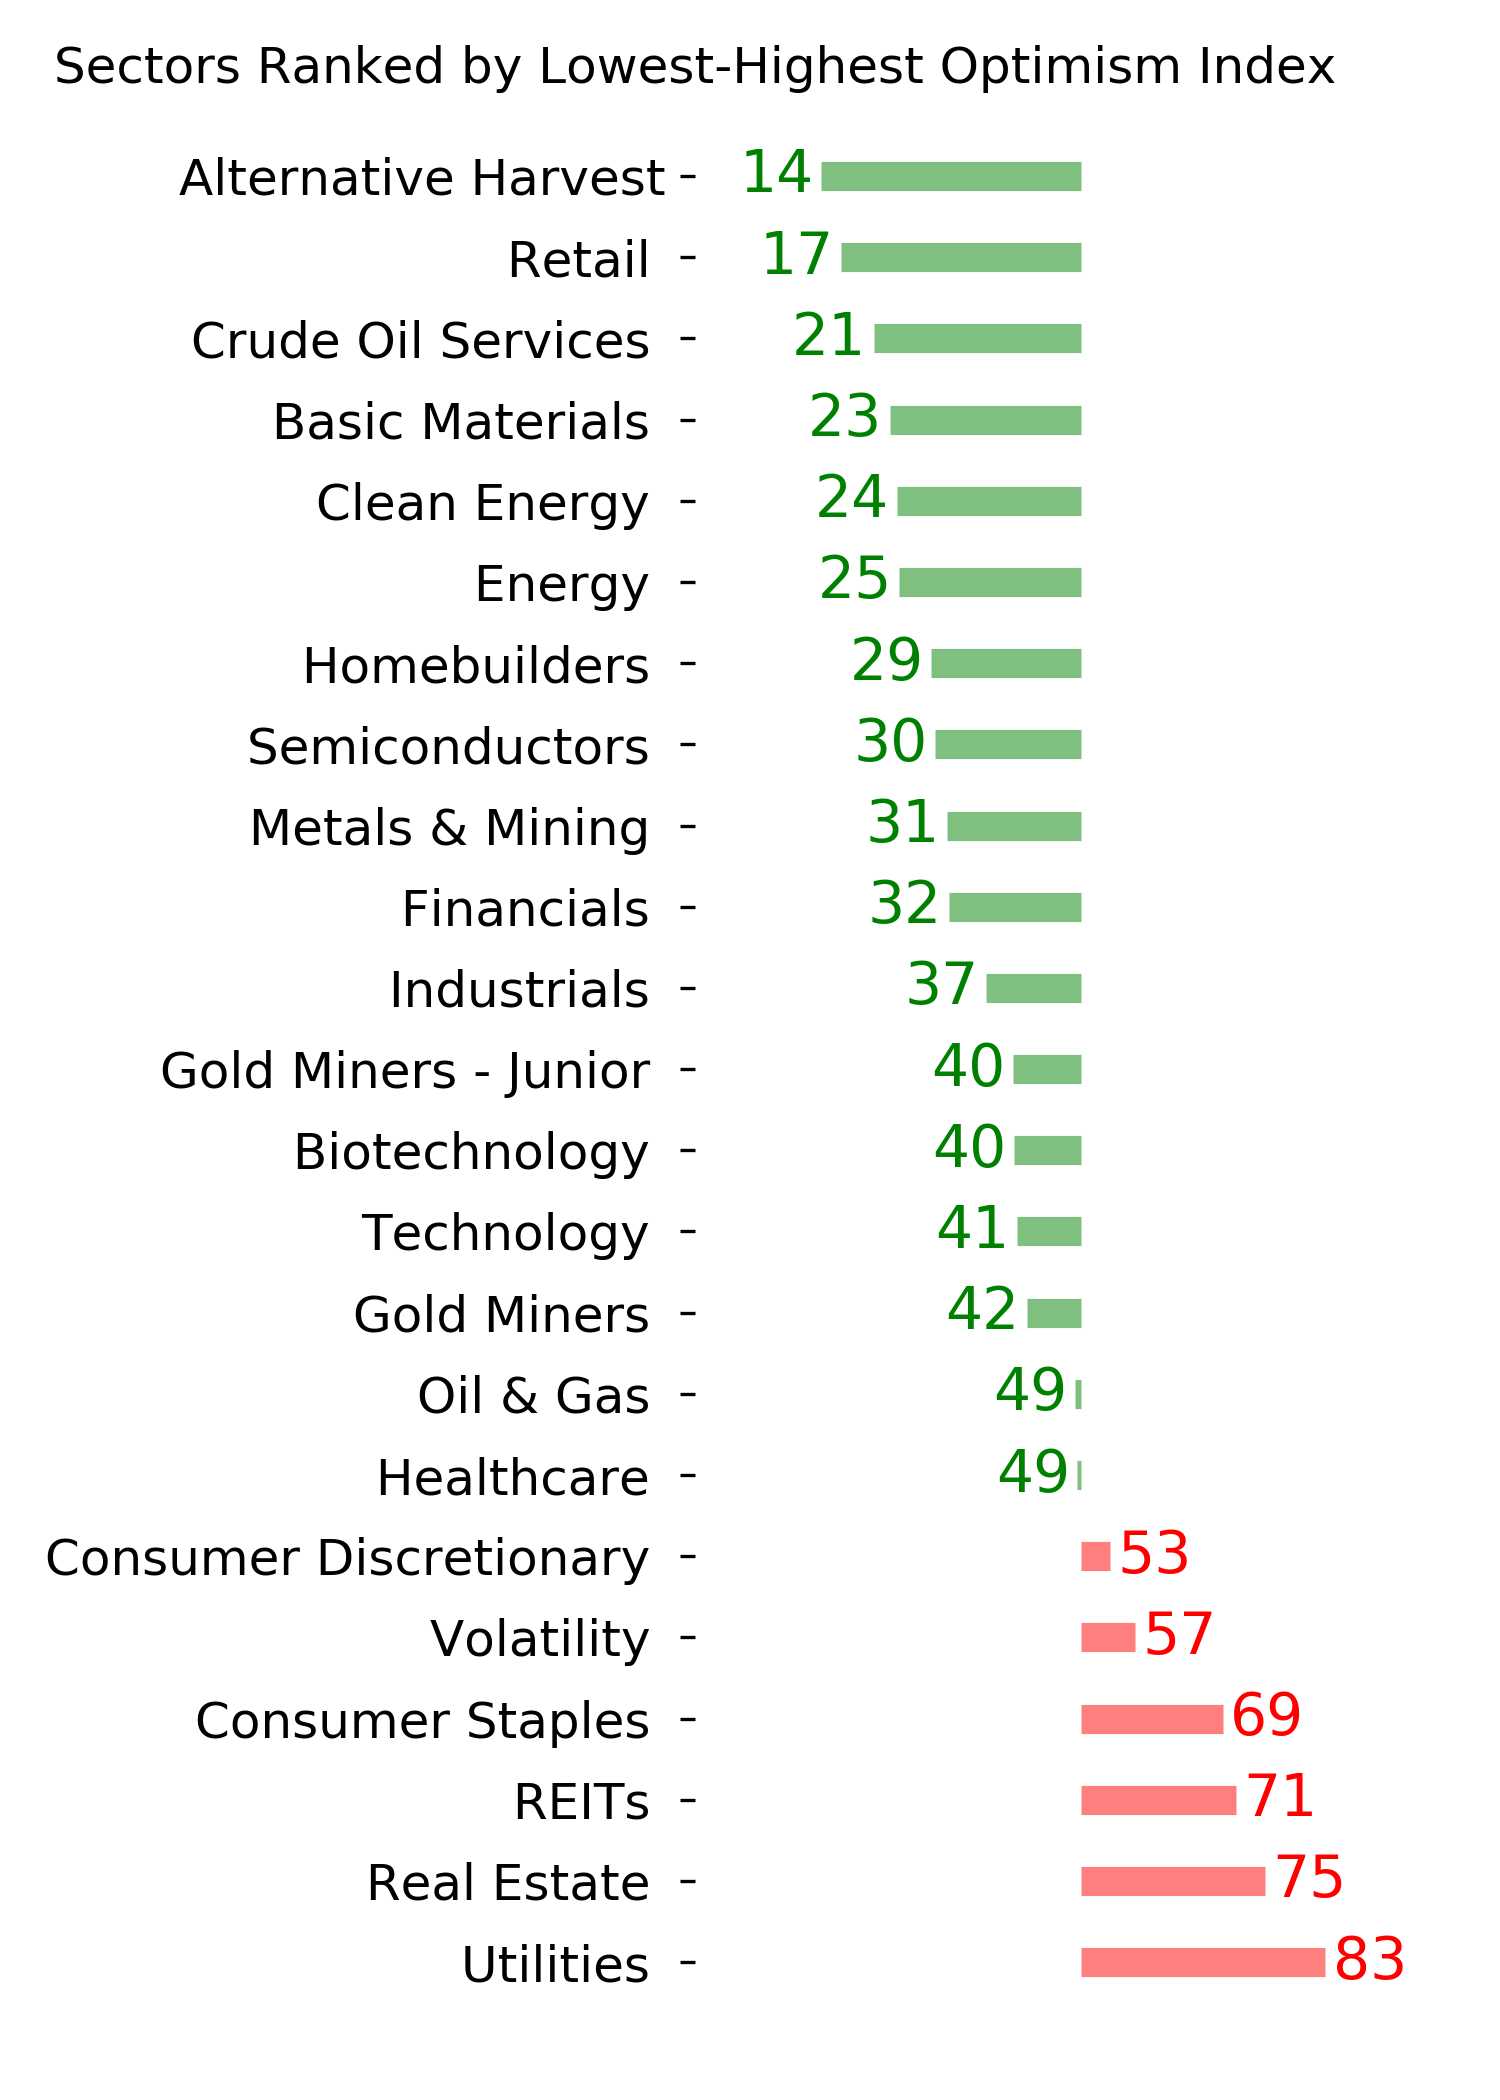
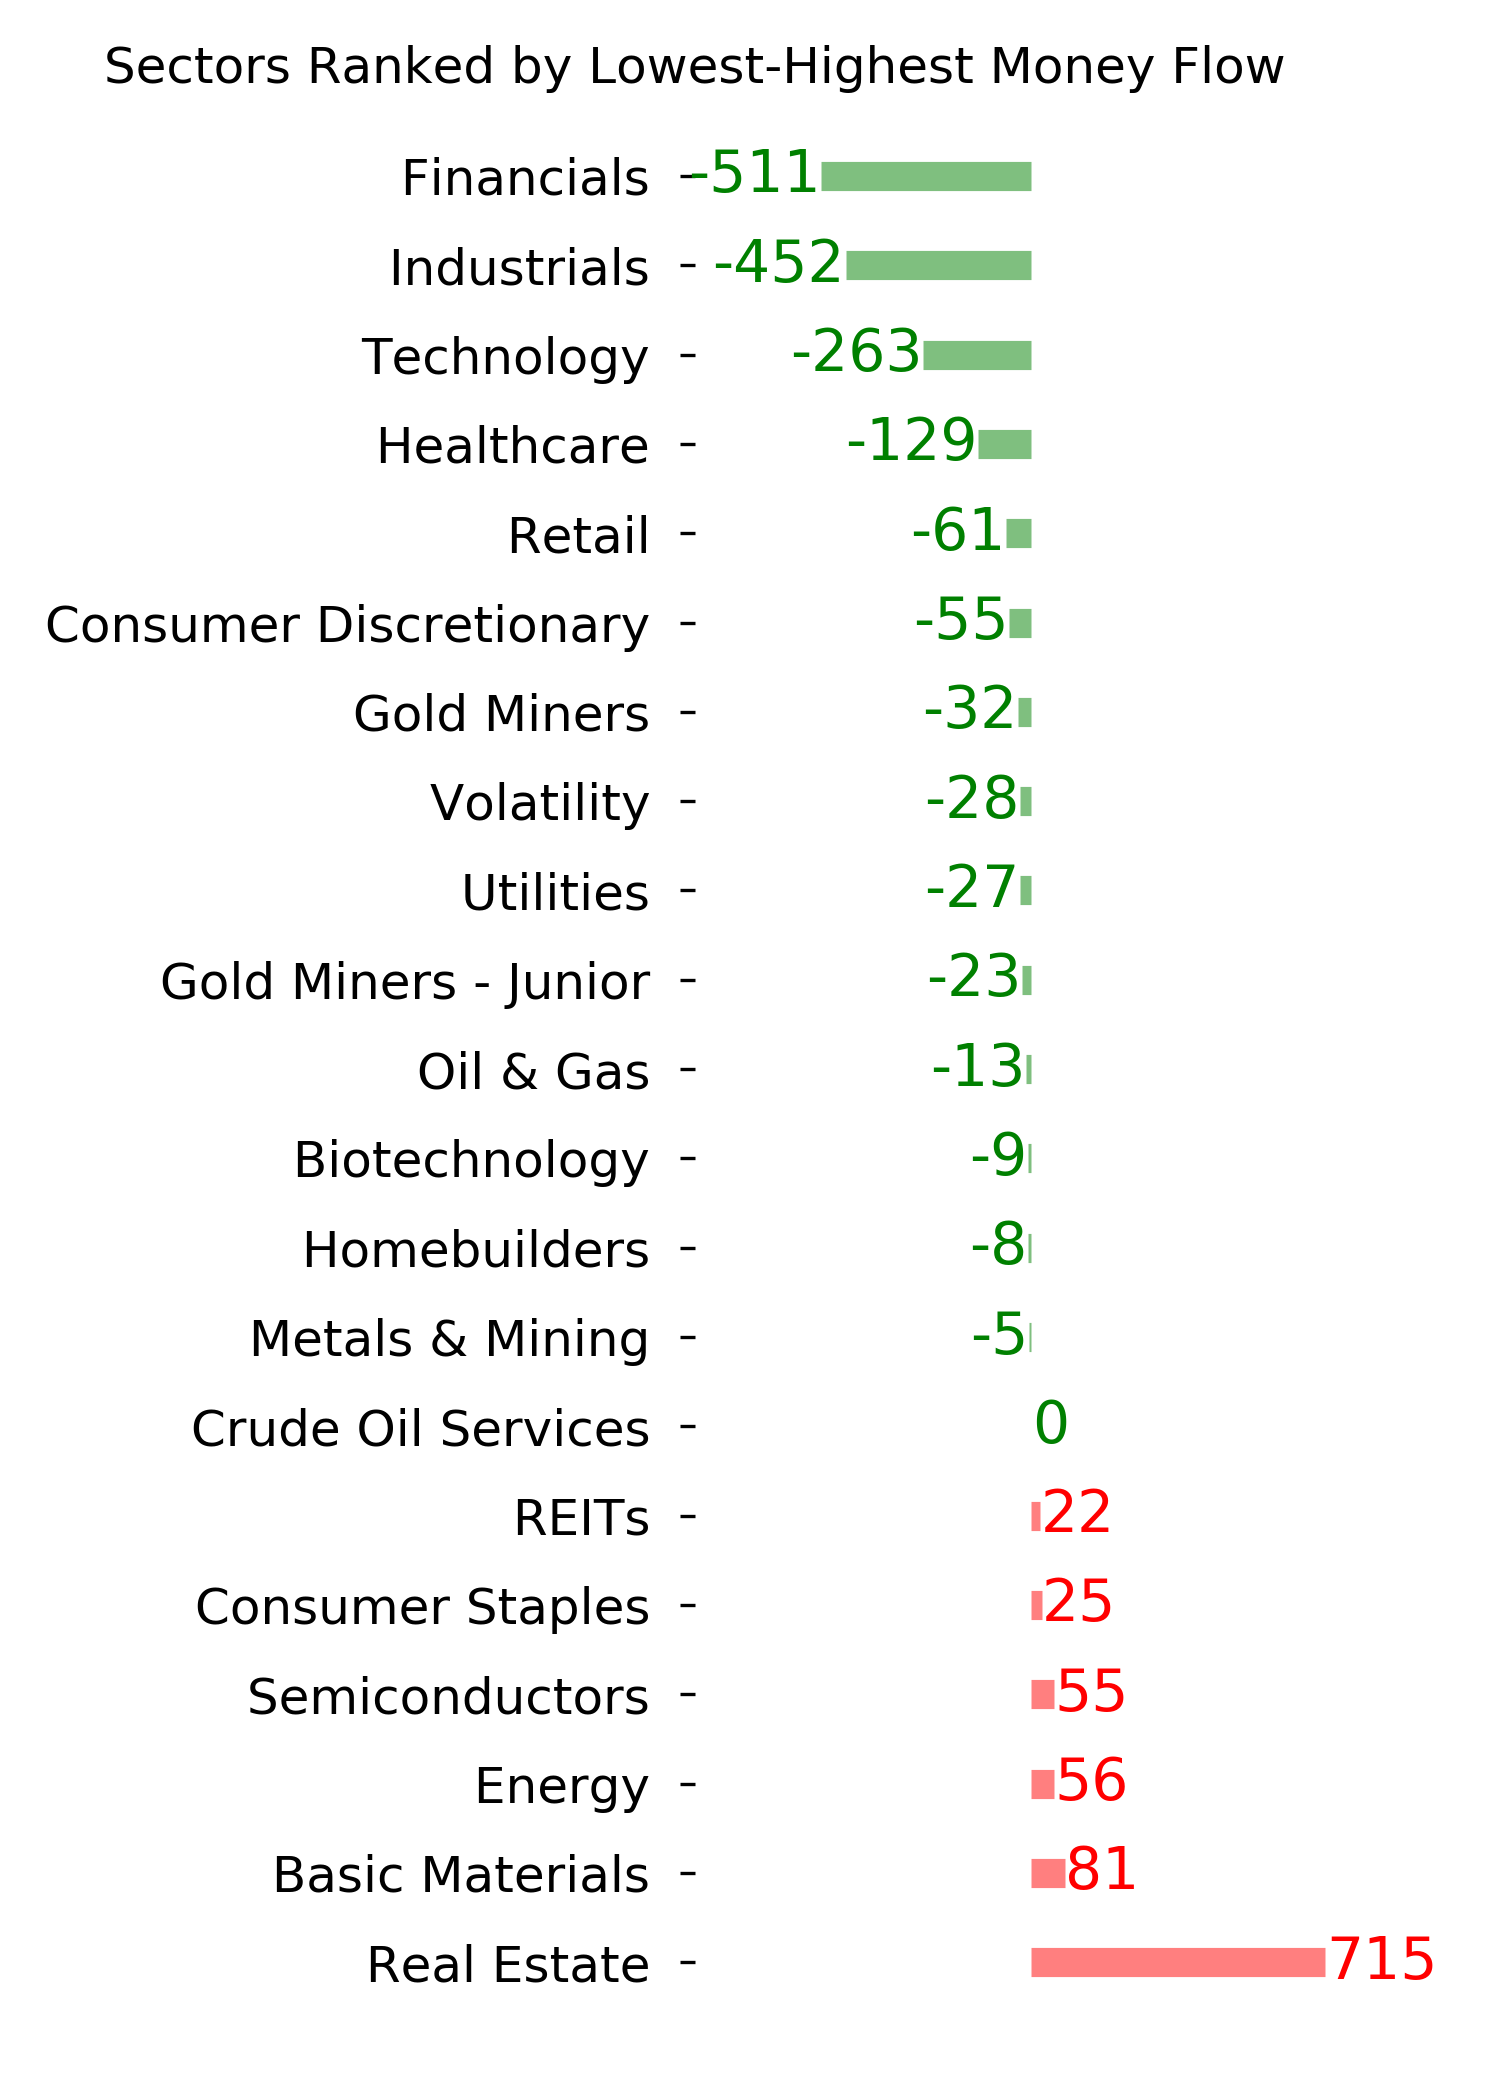
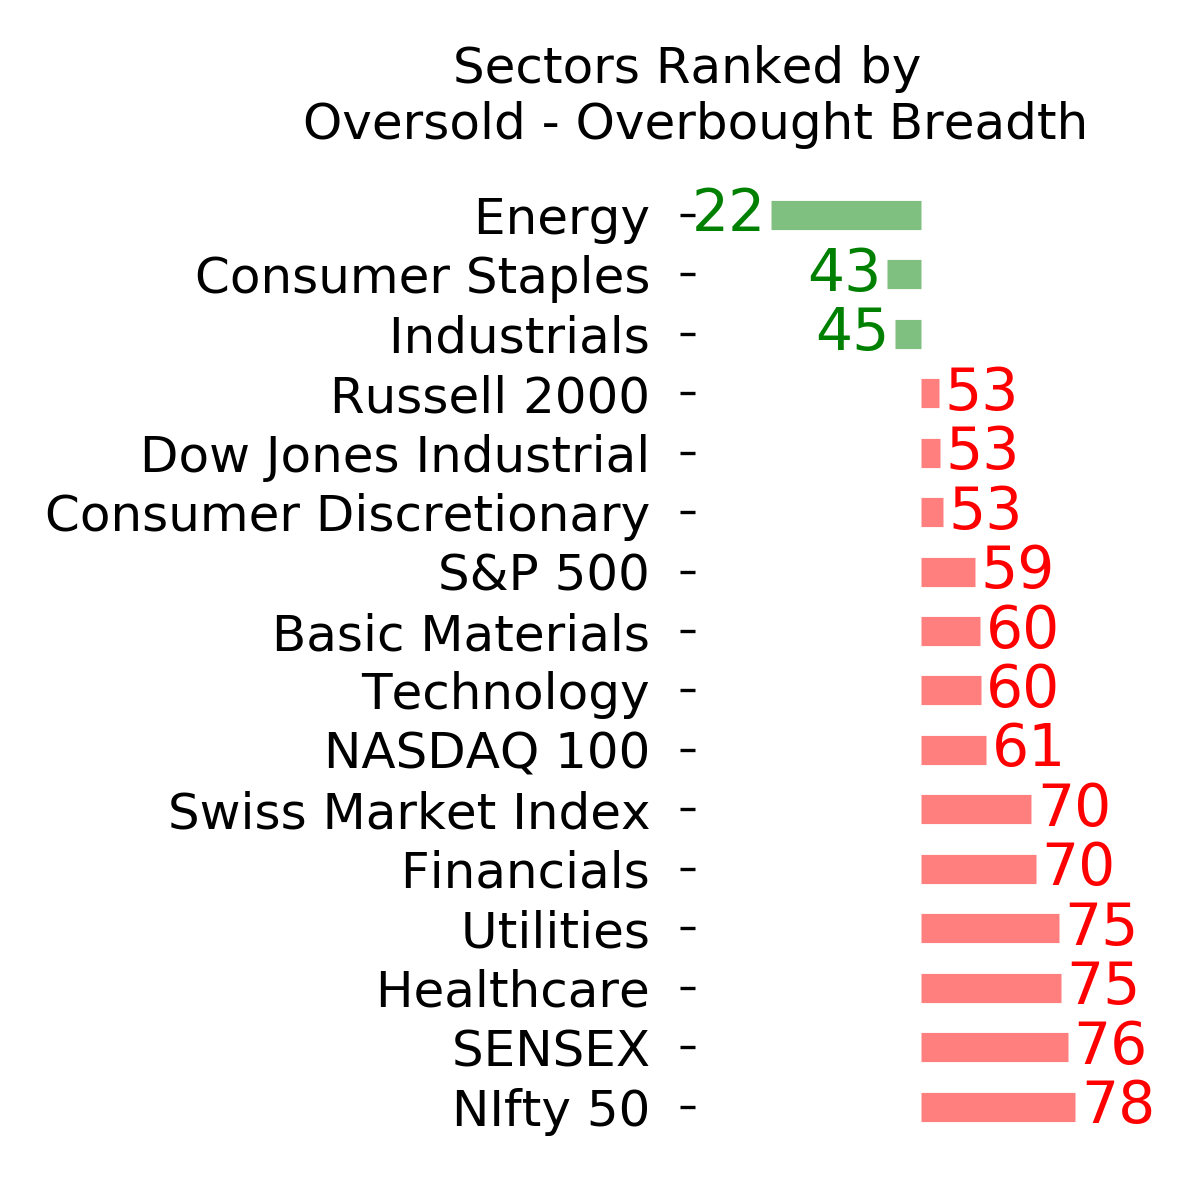
Ranks
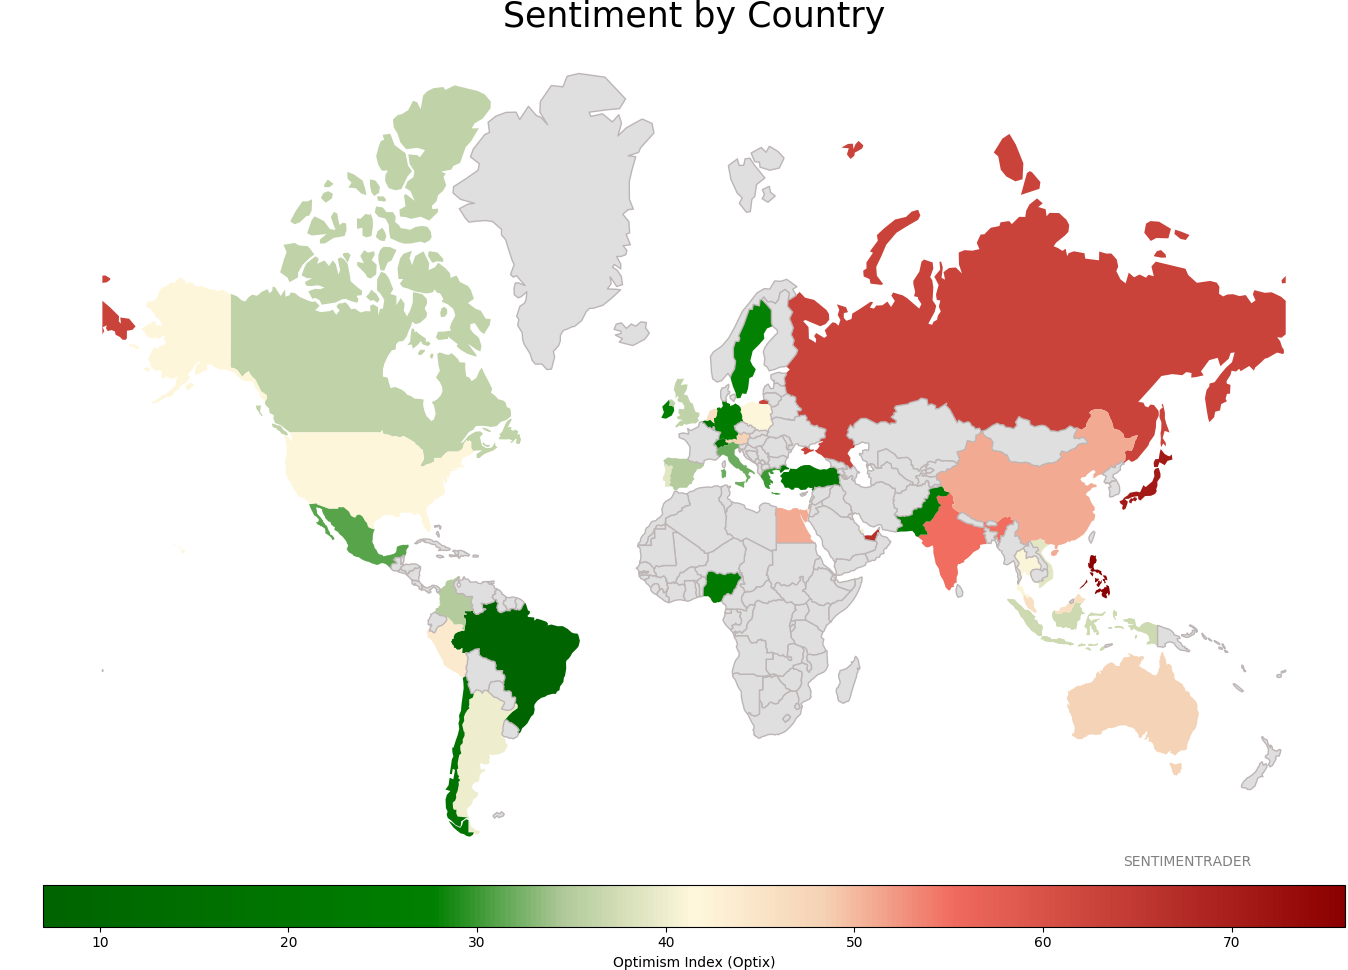
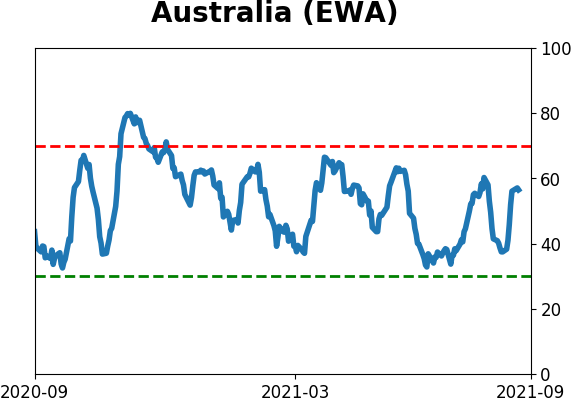
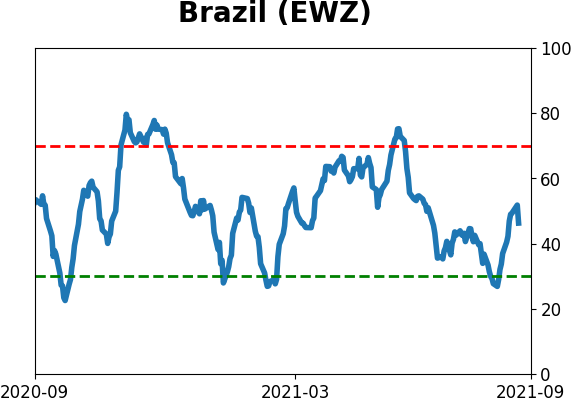
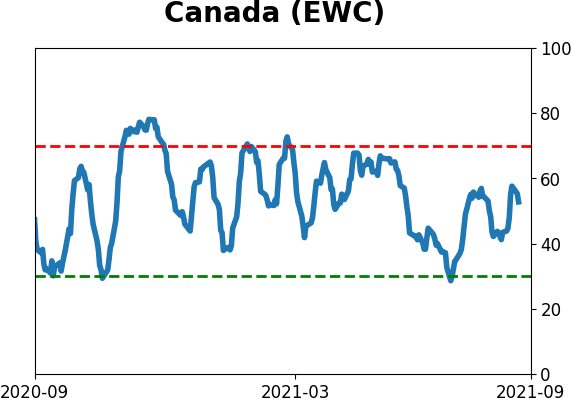
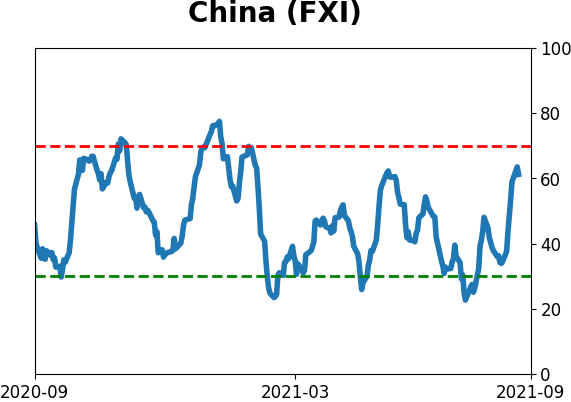
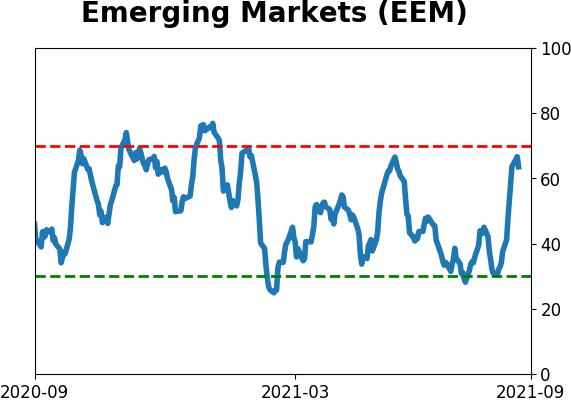
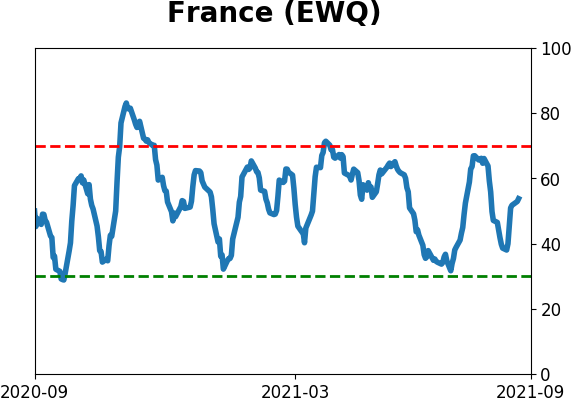
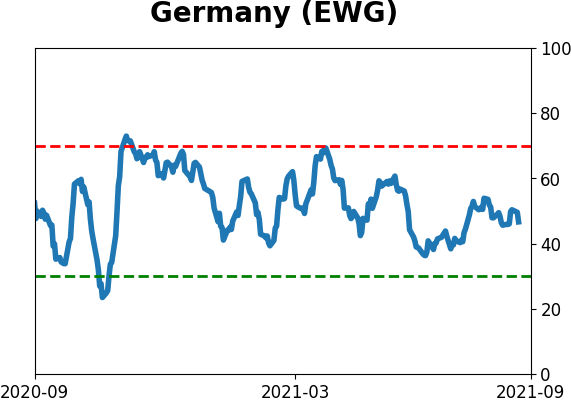
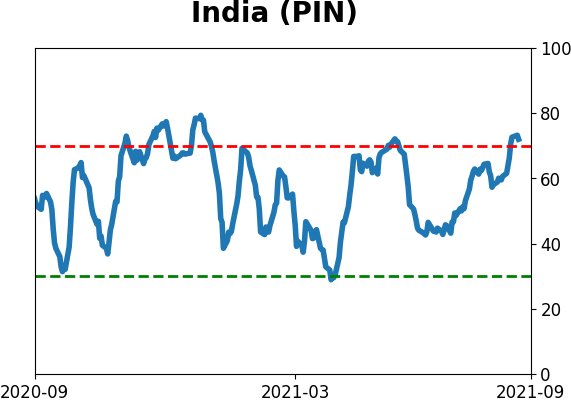
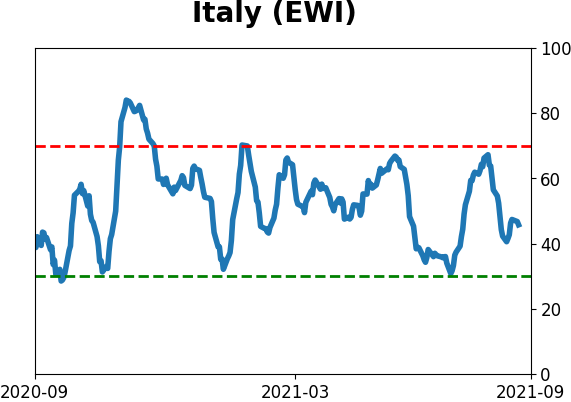
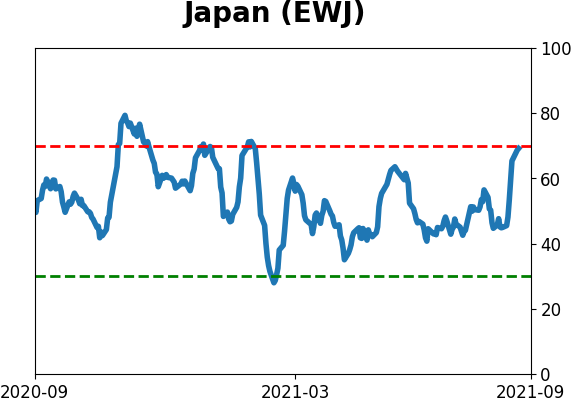
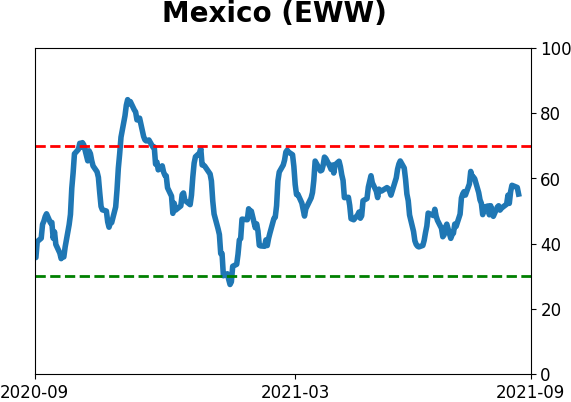
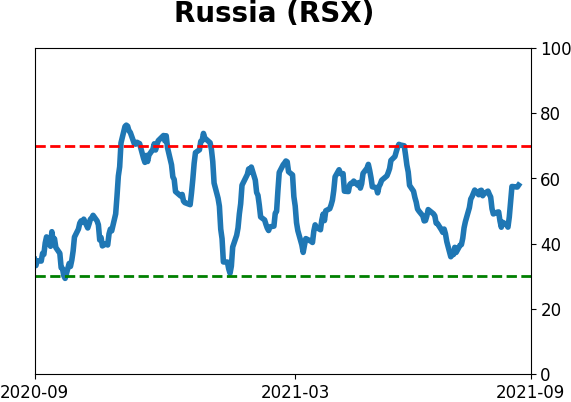
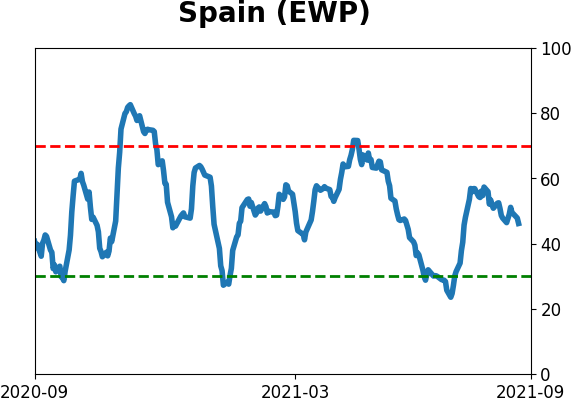
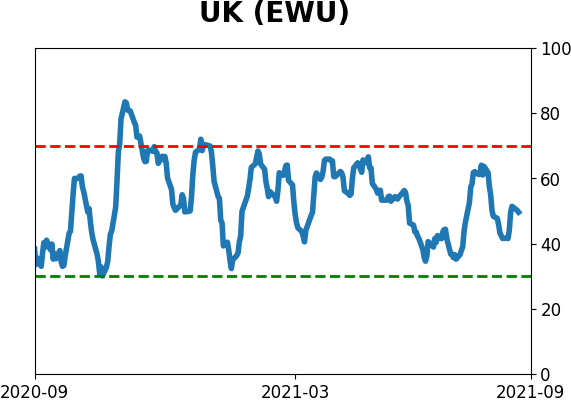
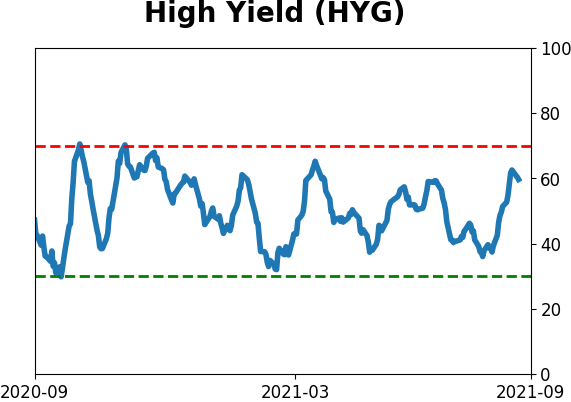
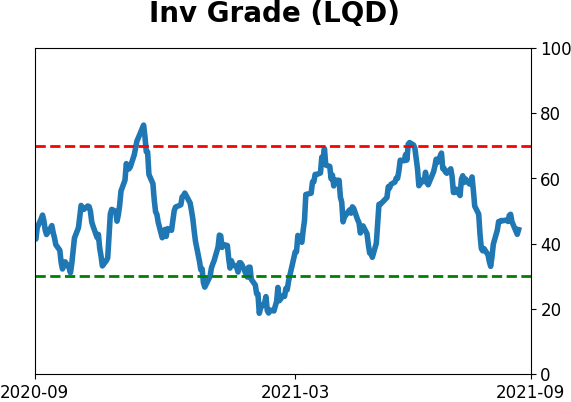
Sentiment Around The World
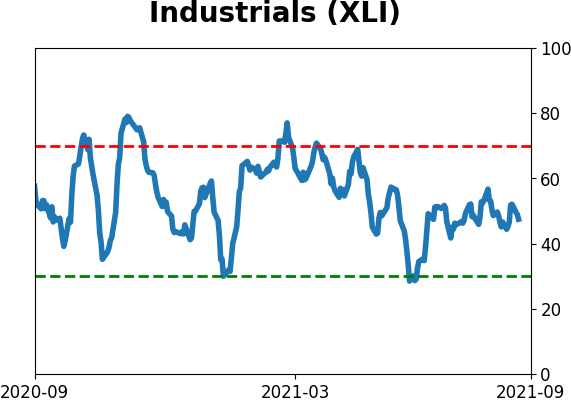
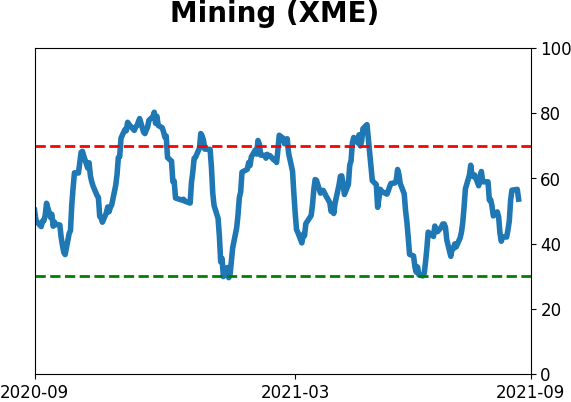
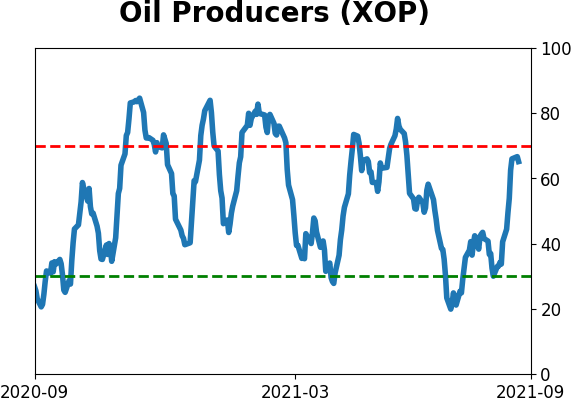
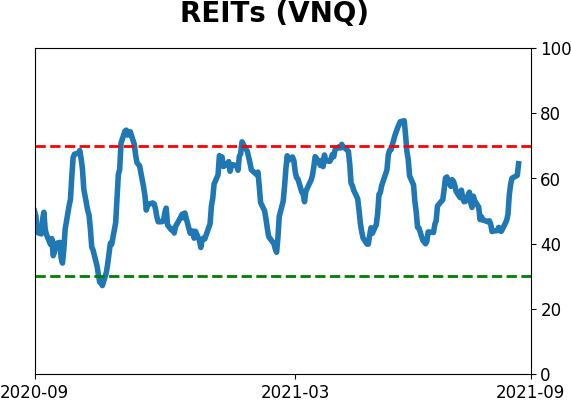
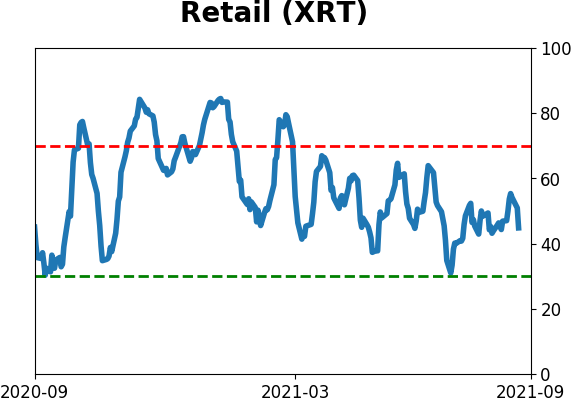
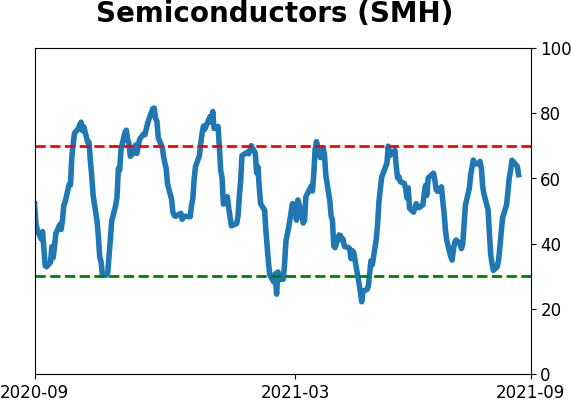
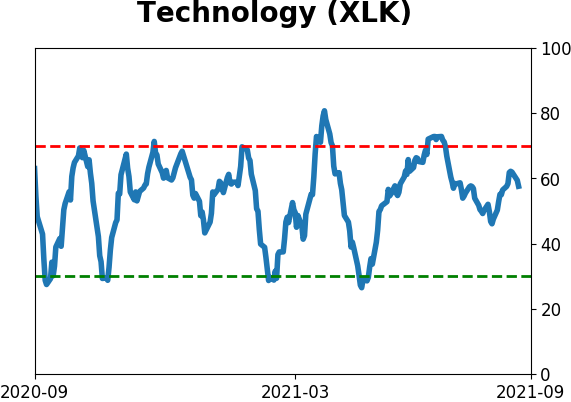
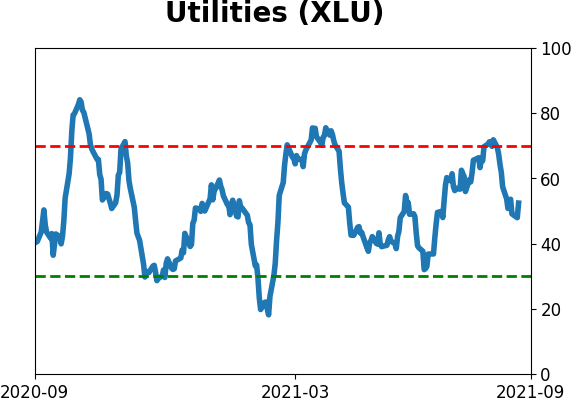
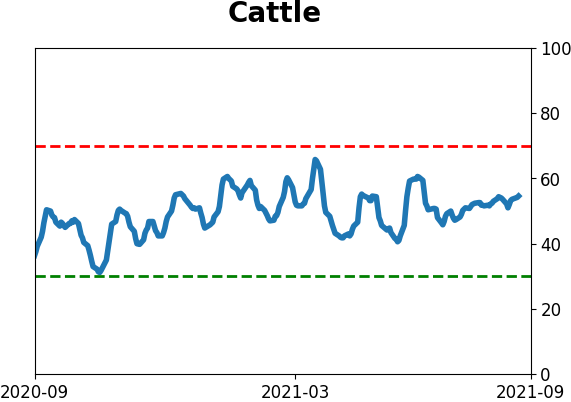
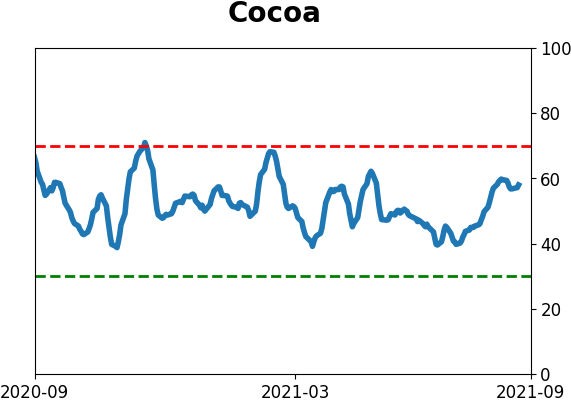
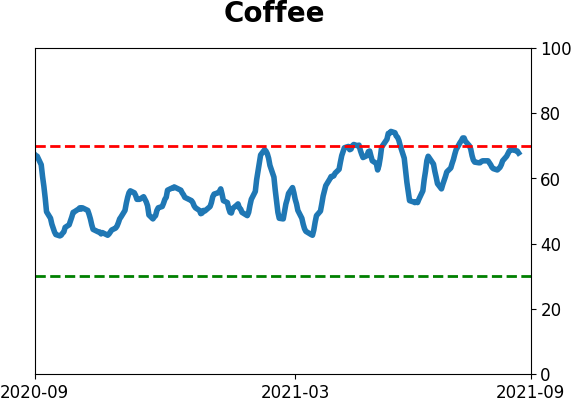
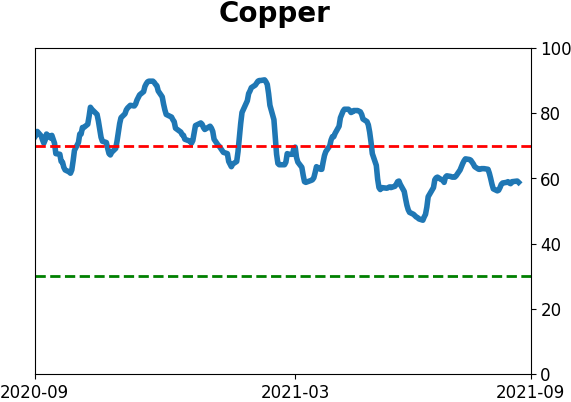
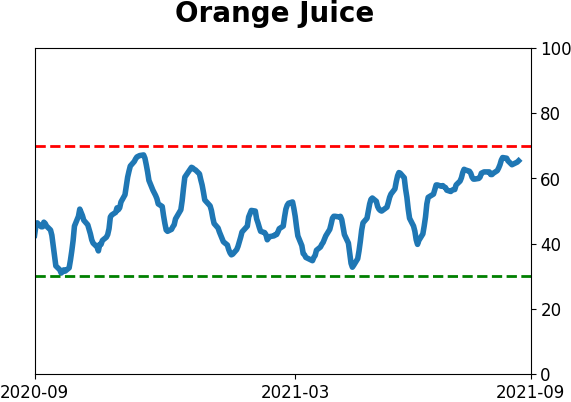
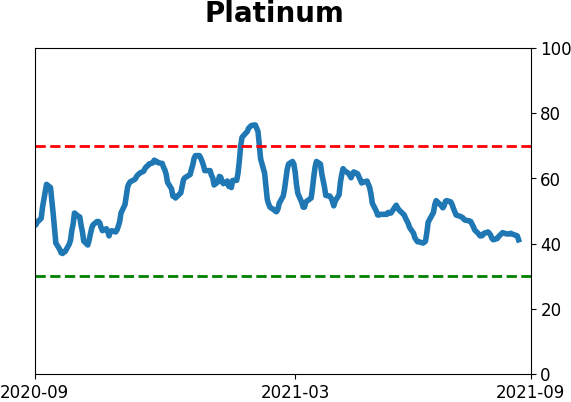
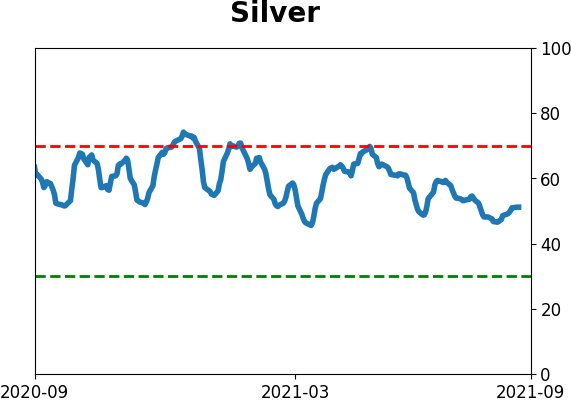
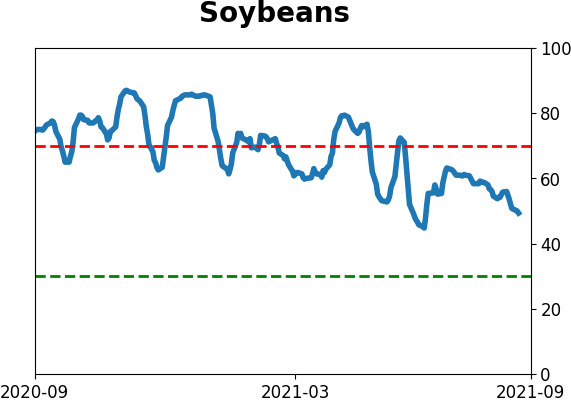
Optimism Index Thumbnails
|
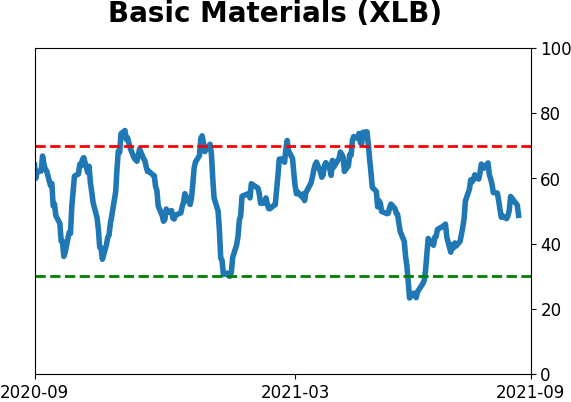
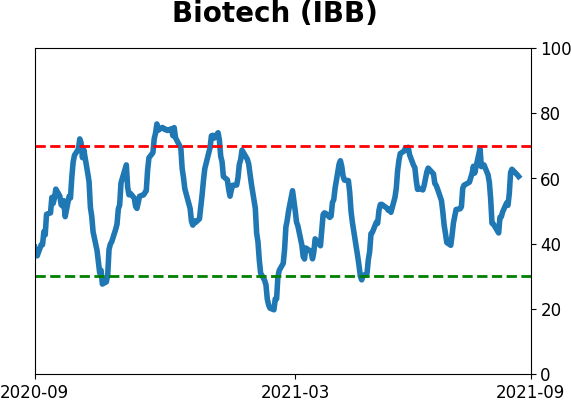
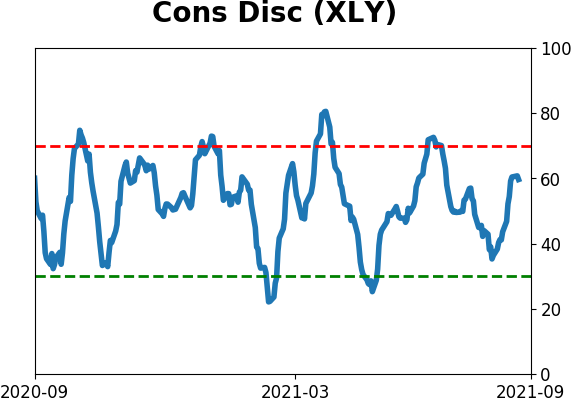
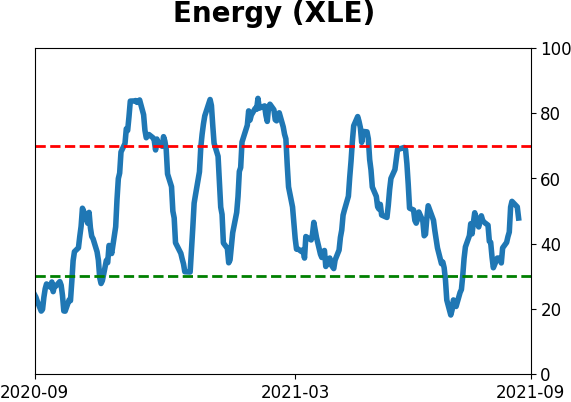
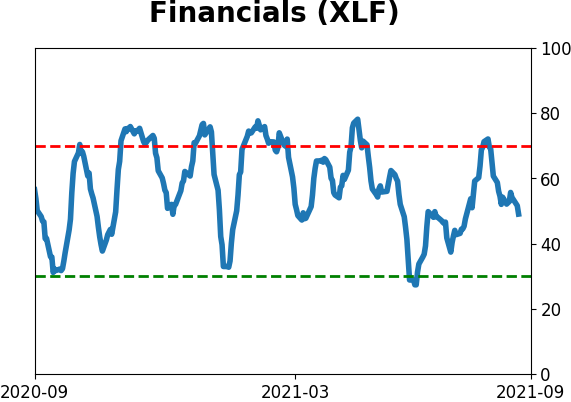
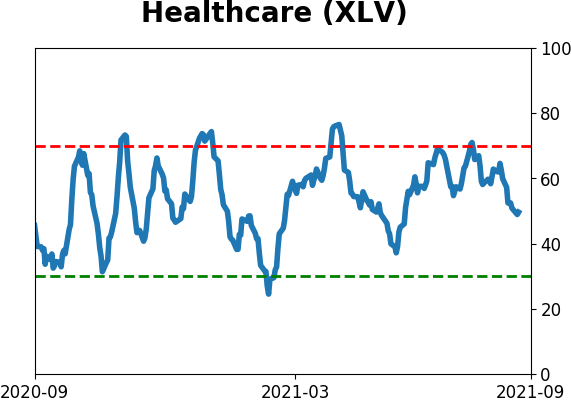
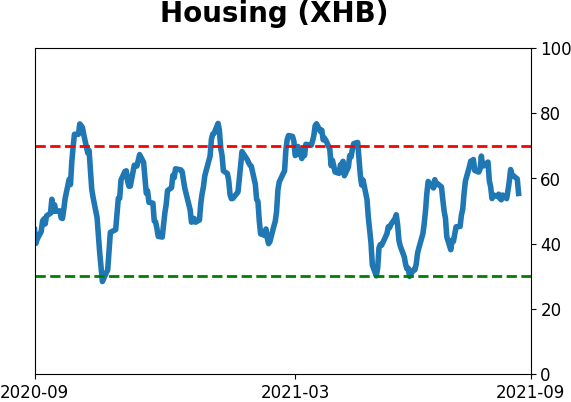
Sector ETF's - 10-Day Moving Average
|
|
|
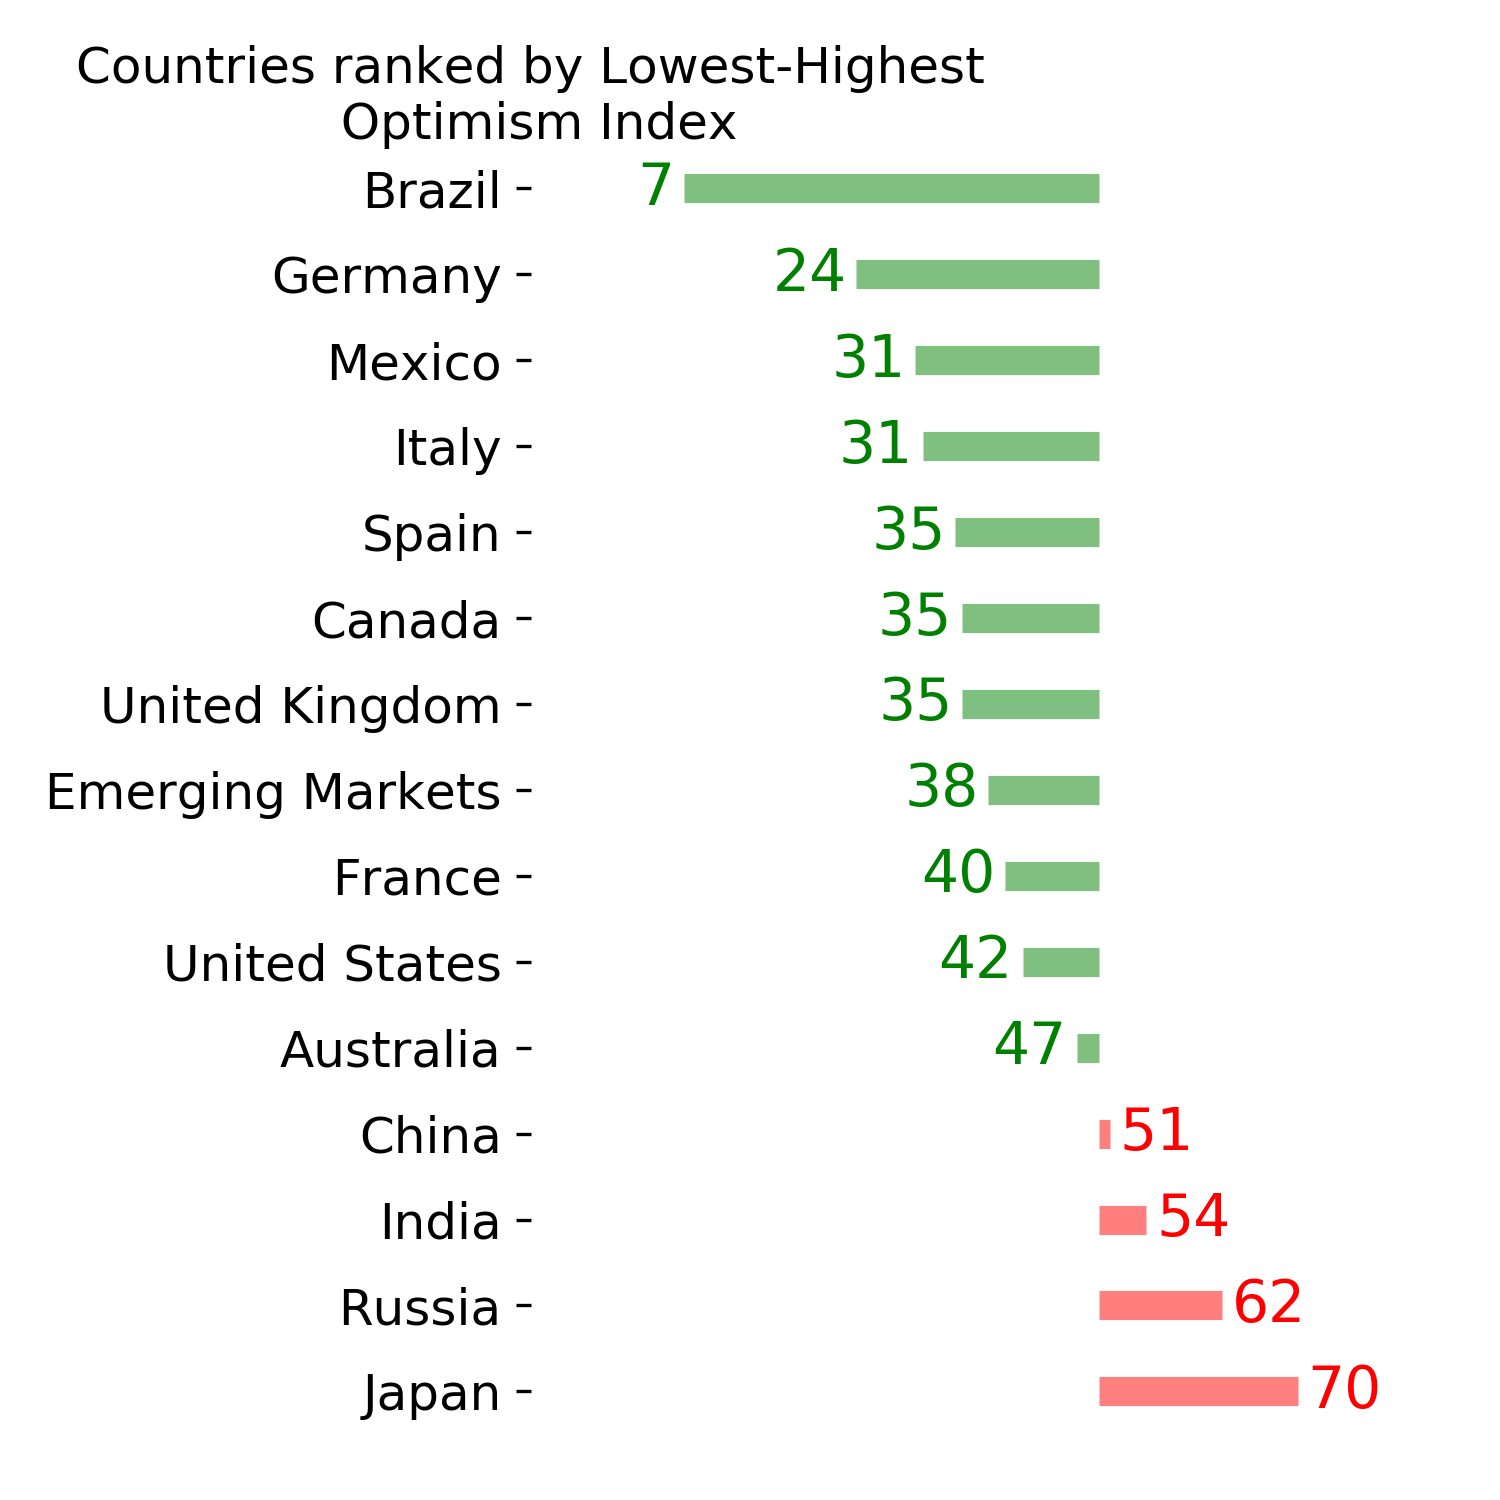
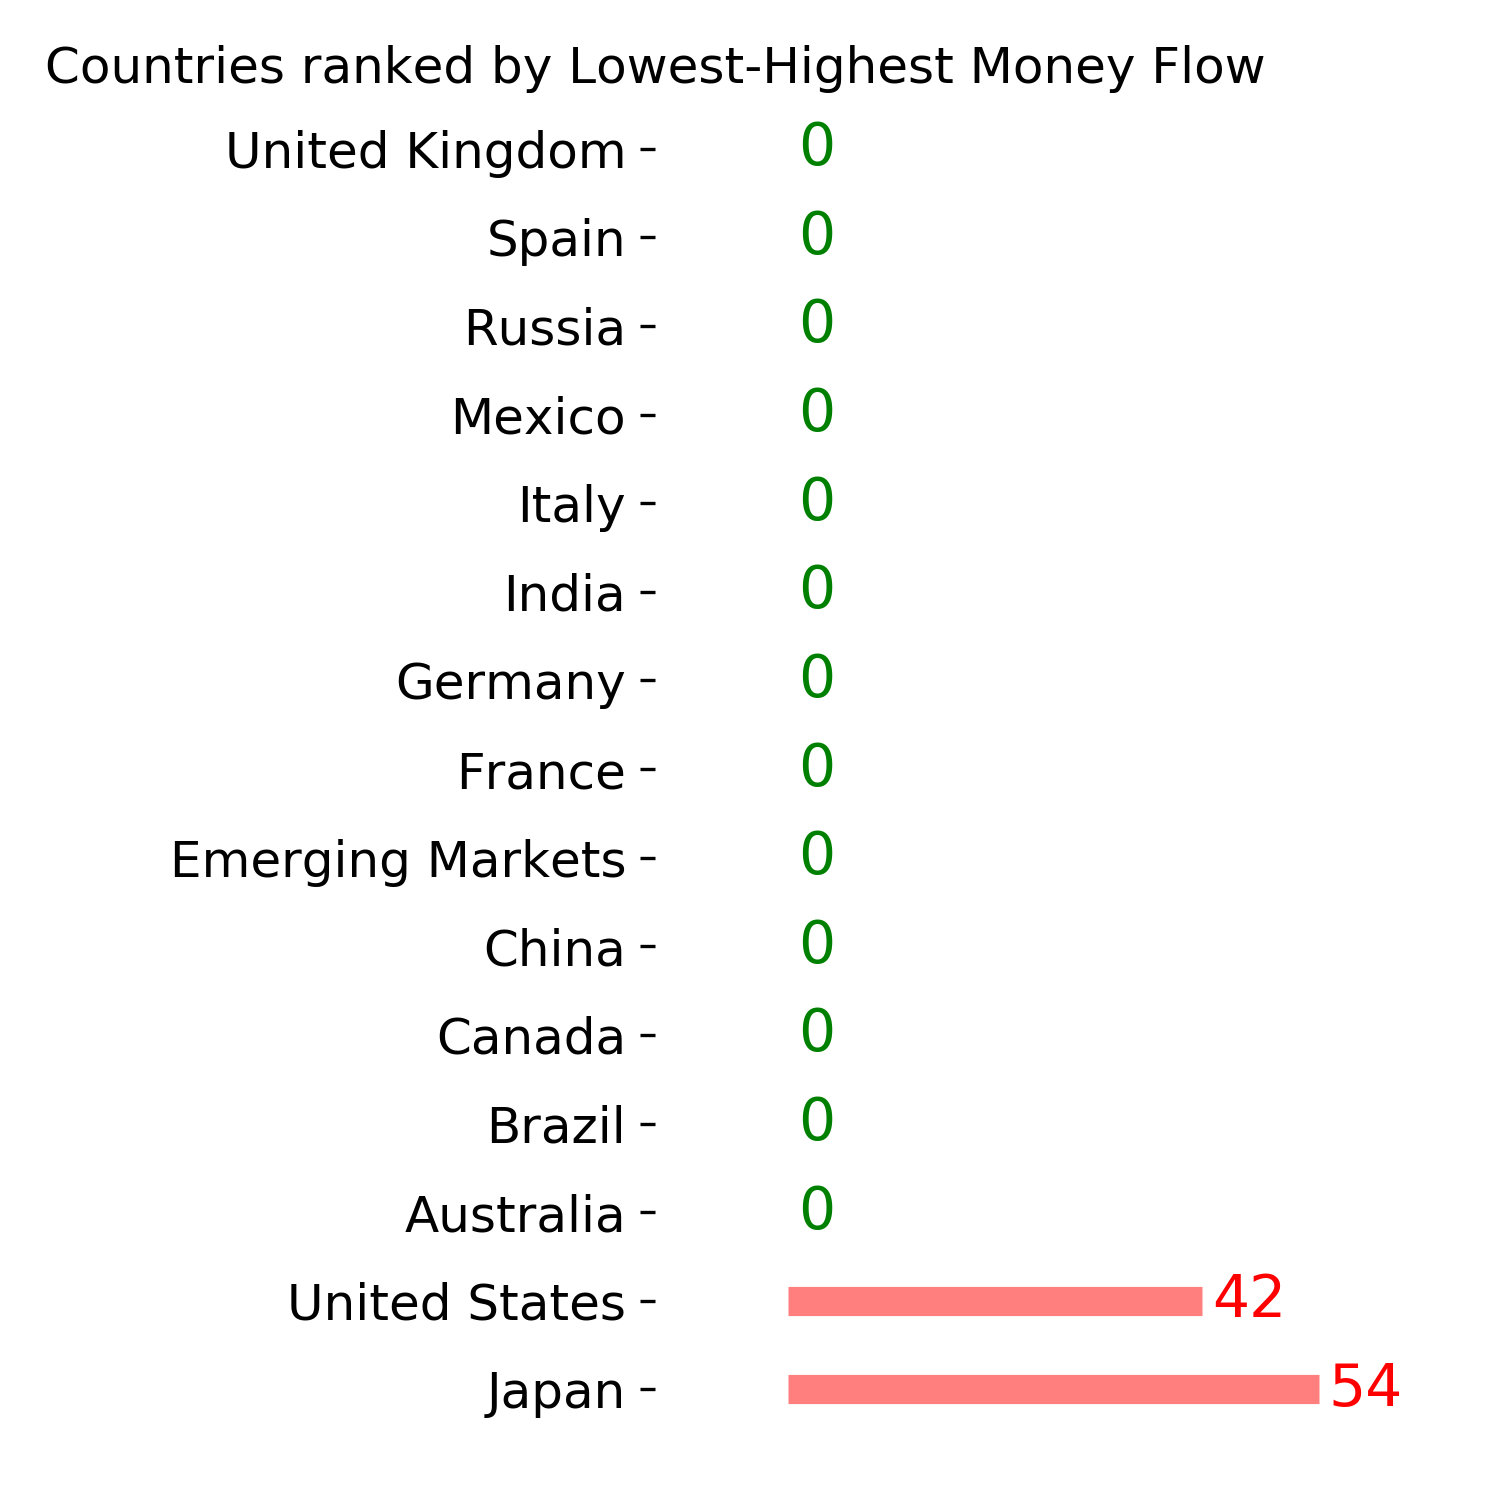
Country ETF's - 10-Day Moving Average
|
|
|
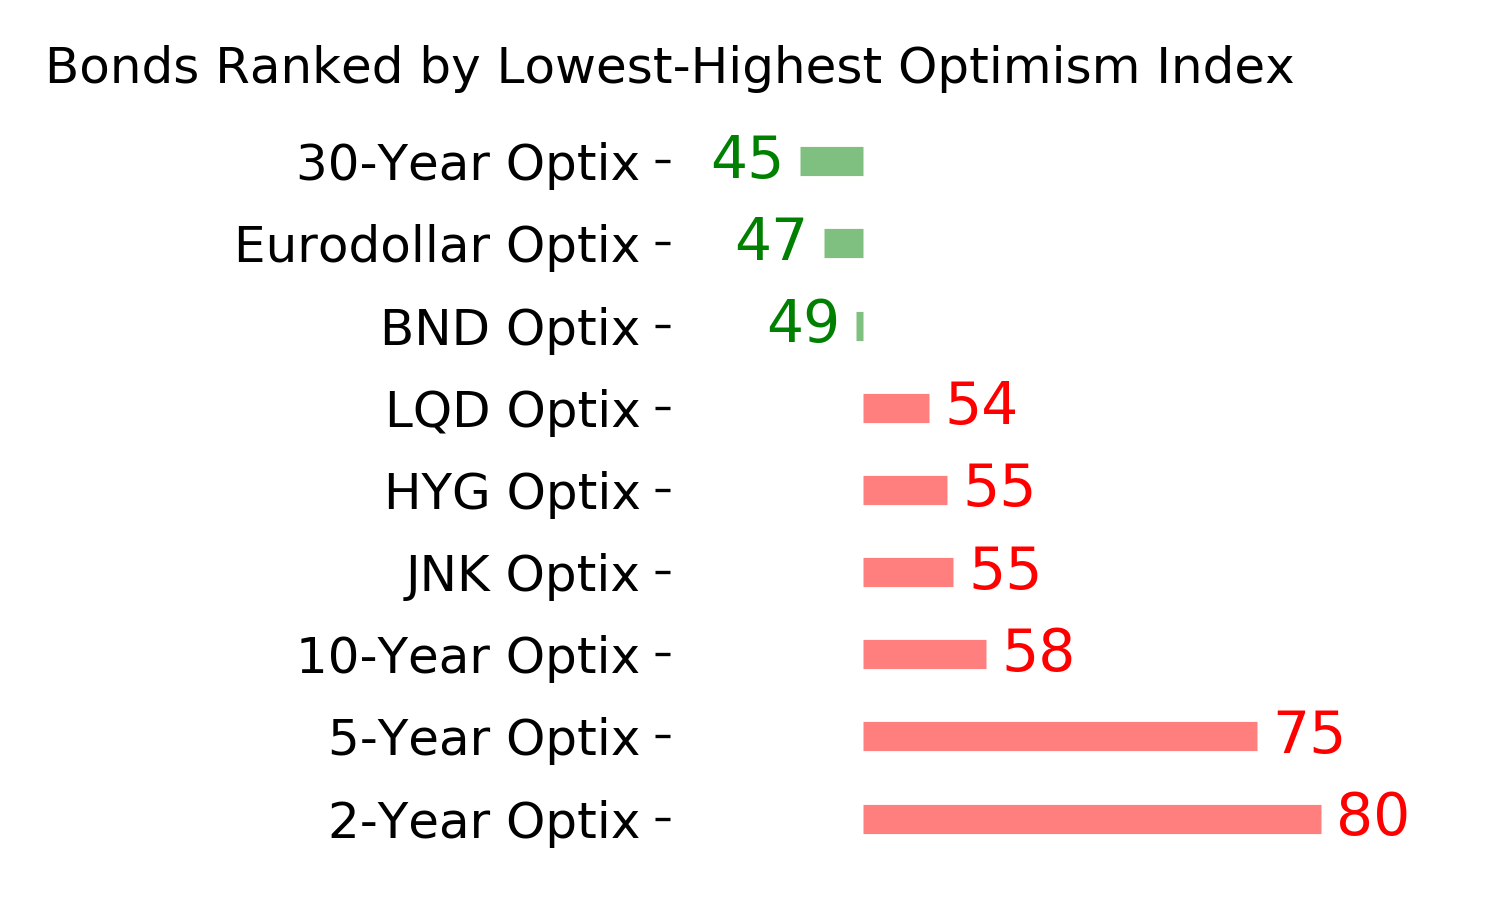
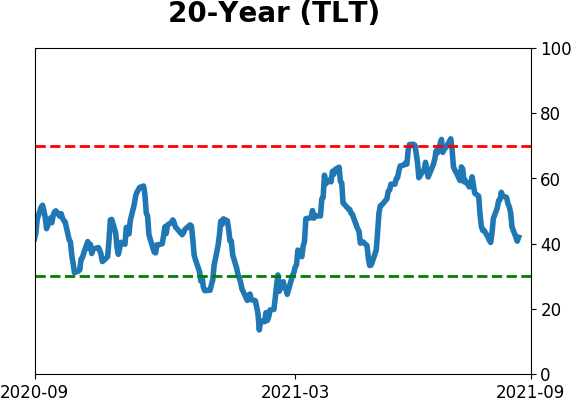
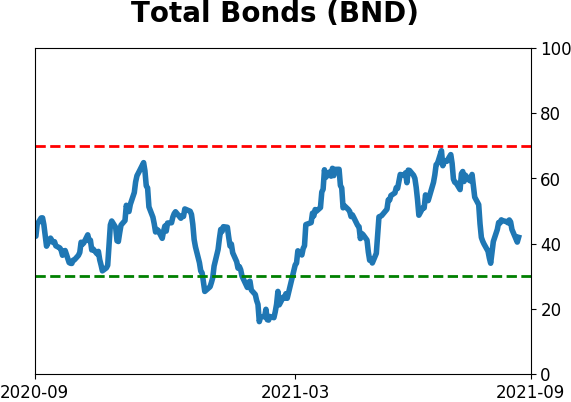
Bond ETF's - 10-Day Moving Average
|
|
|
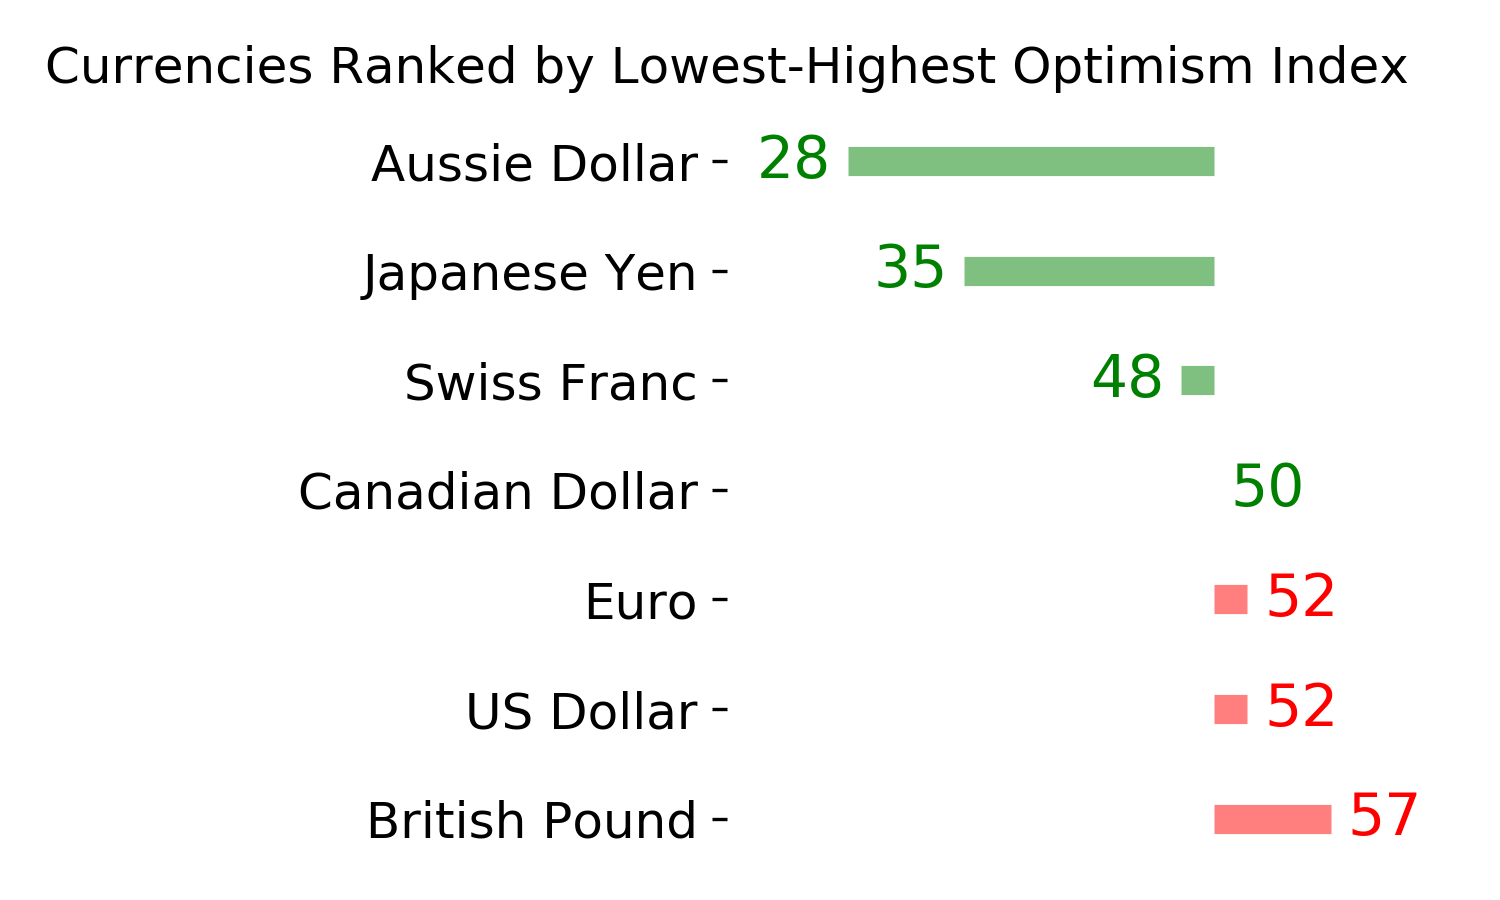
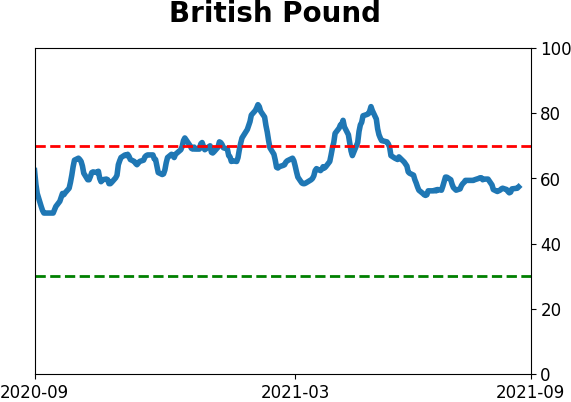
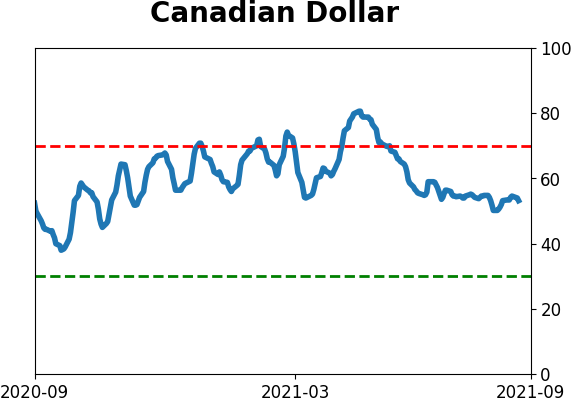
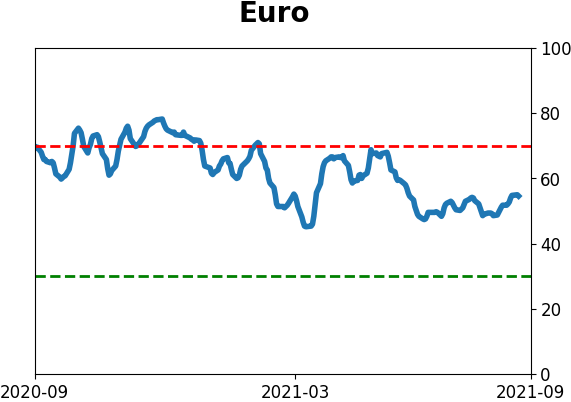
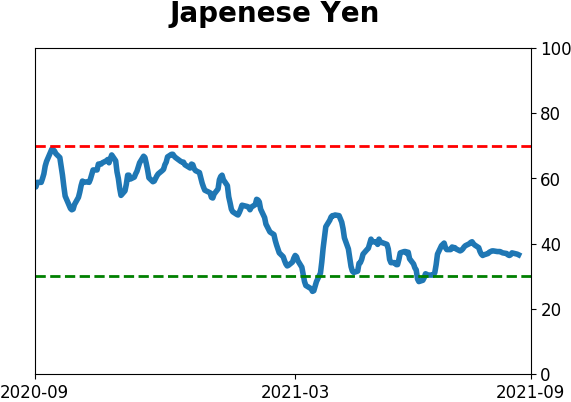
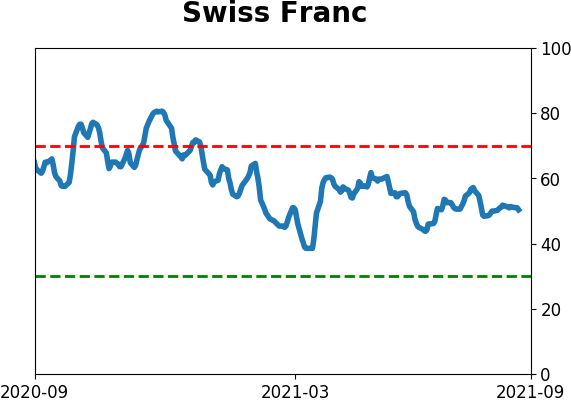
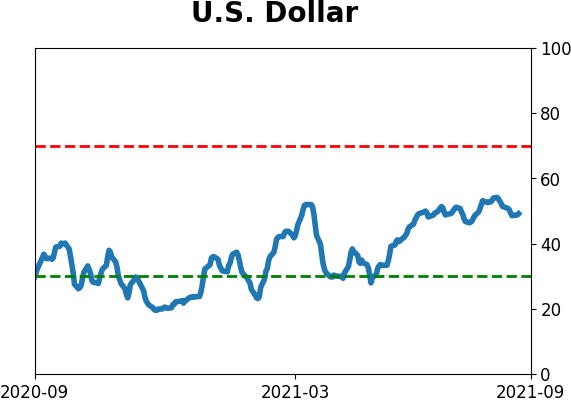
Currency ETF's - 5-Day Moving Average
|
|
|
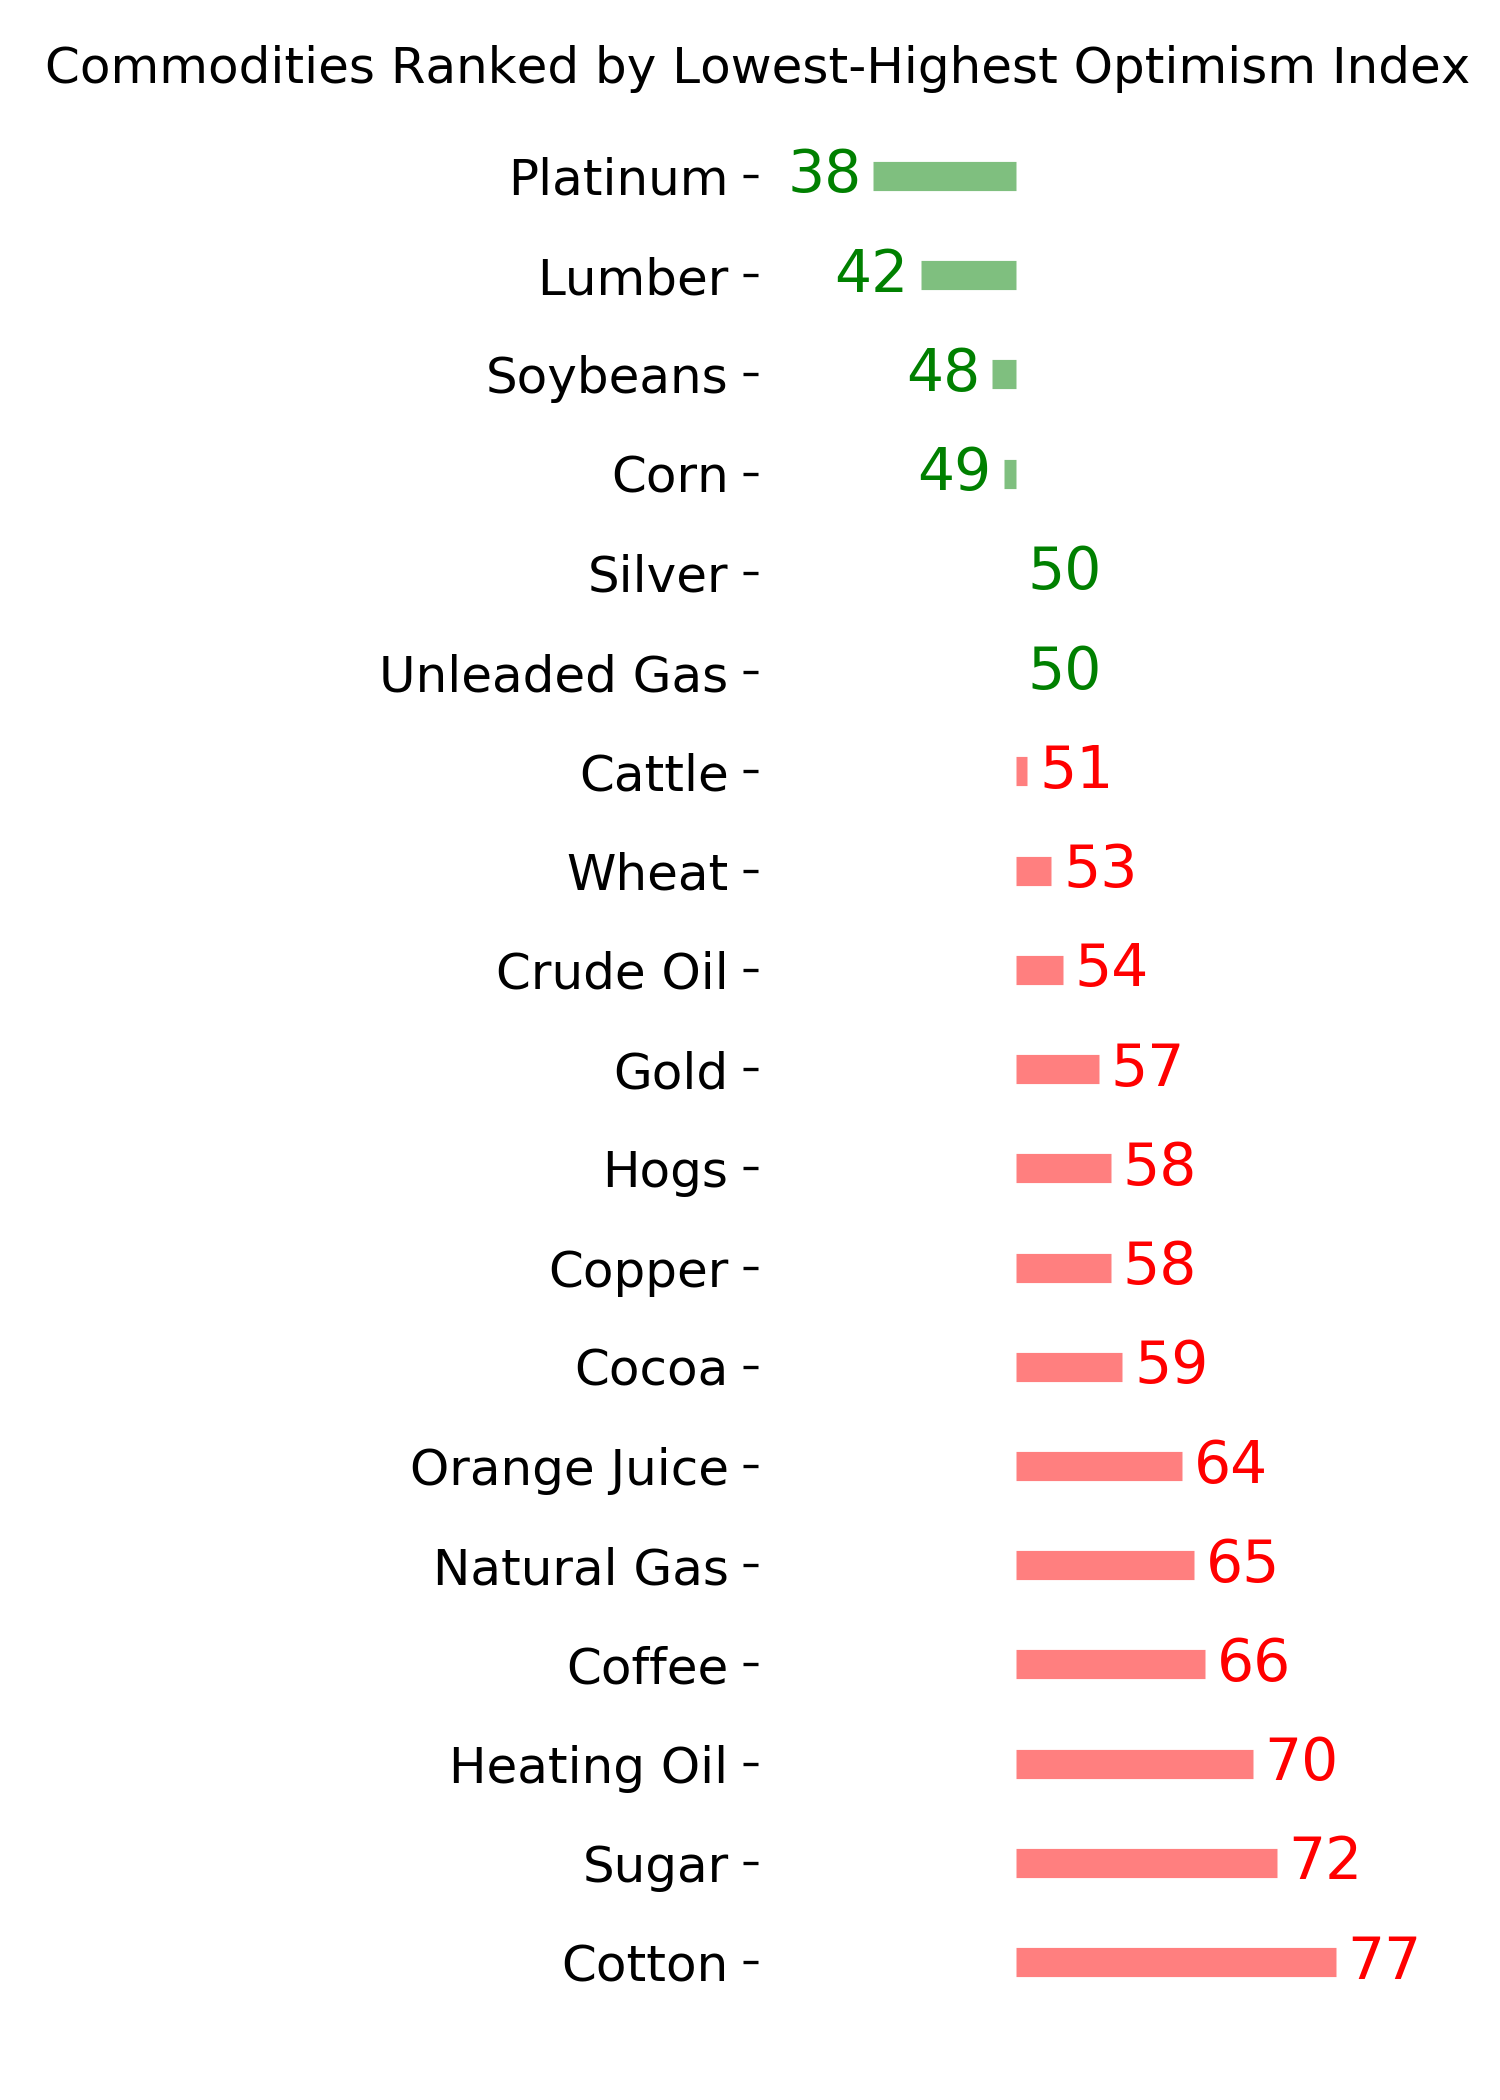
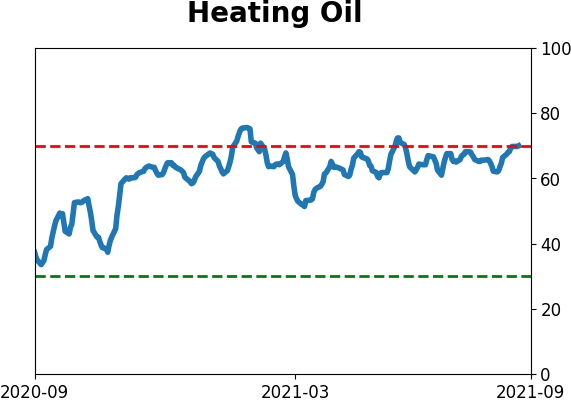
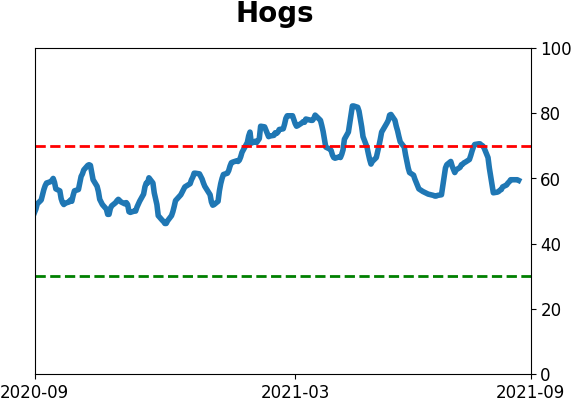
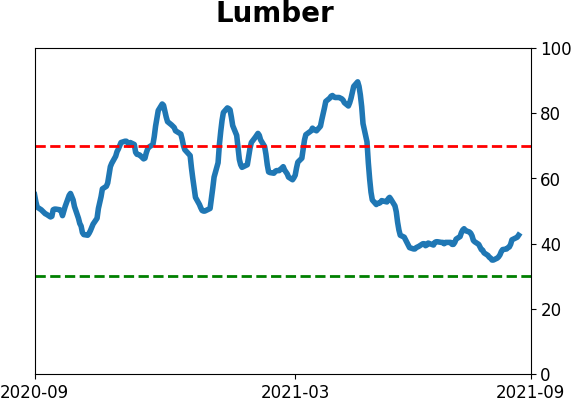
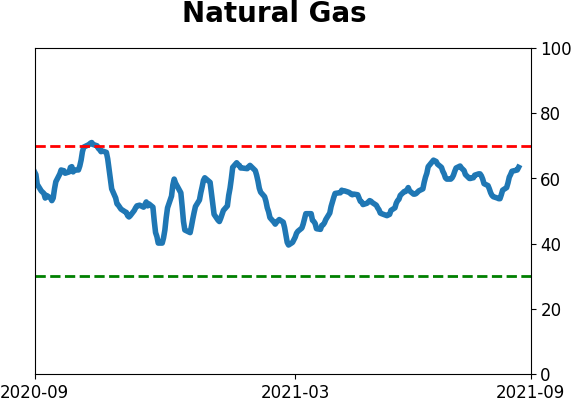
Commodity ETF's - 5-Day Moving Average
|
|