Headlines
|
|
A Record Rally Led by Utilities and Health Care:
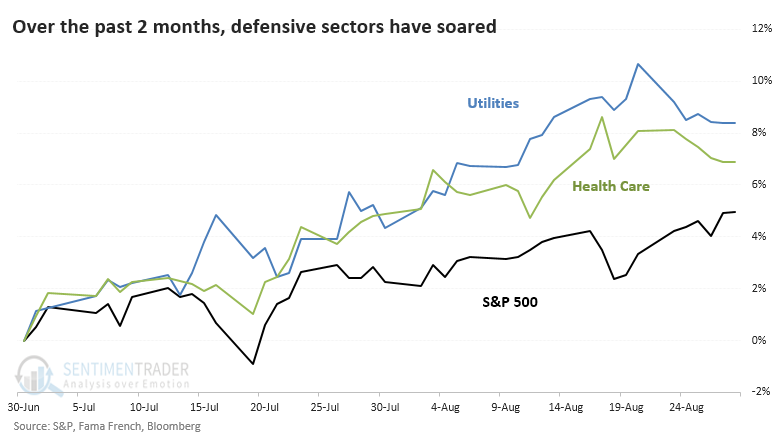
As the S&P 500 soared to new highs over the past couple of months, defensive sectors like Utilities and Health Care have outpaced the index. That has led to an unsupported view that it's a negative for the broader market.
Bottom Line:
STOCKS: Hold
Sentiment continues to decline from the speculative February peak. With deteriorating breadth, this raises the risk of poor short- to medium-term returns until optimism and better breadth returns. See the Outlook & Allocations page for more. BONDS: Hold
Various parts of the market got hit in March, with the lowest Bond Optimism Index we usually see during healthy environments. Bond prices have modest recovered and there is no edge among the data we follow. GOLD: Hold
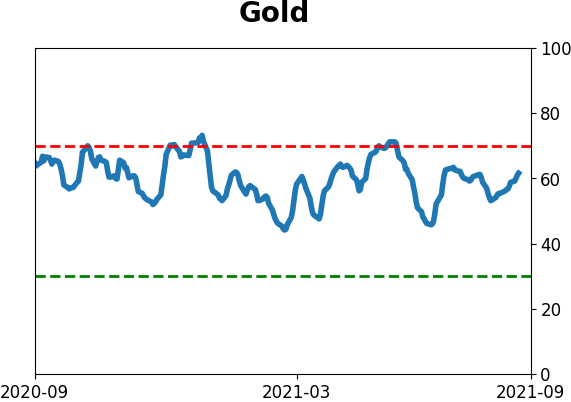
Gold and miners were rejected after trying to recover above their 200-day averages in May. Lately, some medium-term (not long-term) oversold extremes in breadth measures among miners have triggered.
|
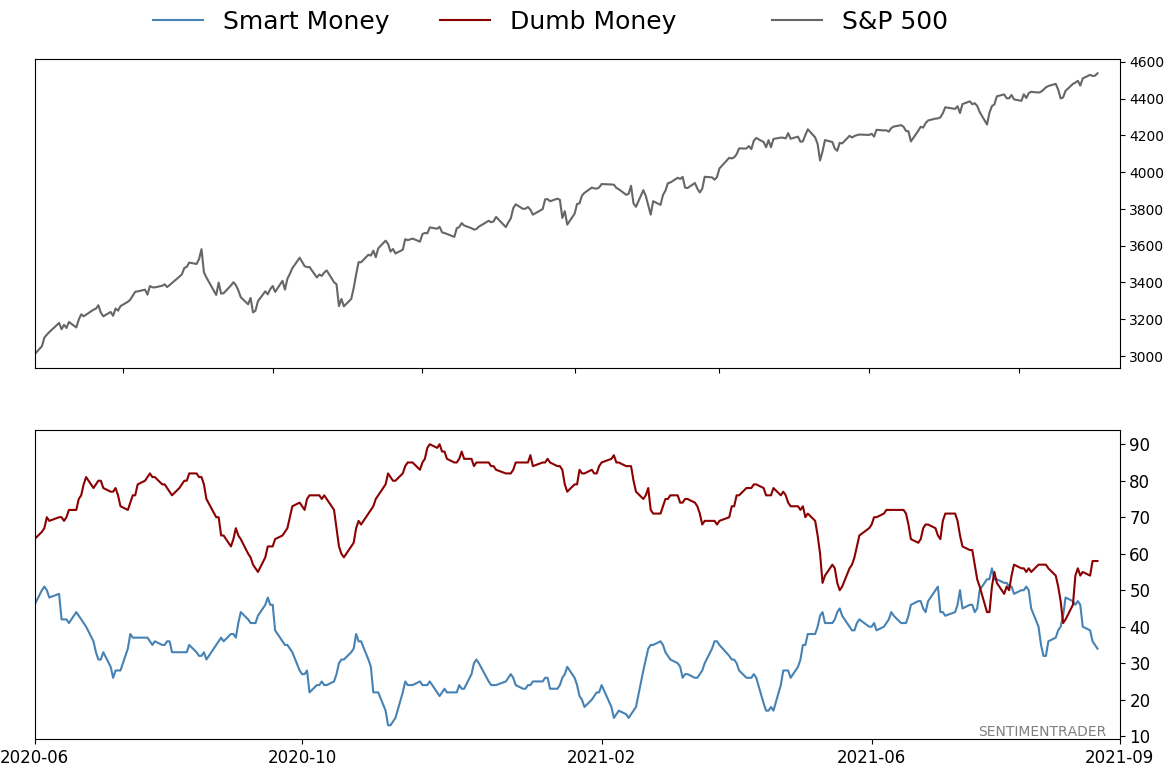
Smart / Dumb Money Confidence
|
Smart Money Confidence: 34%
Dumb Money Confidence: 58%
|
|
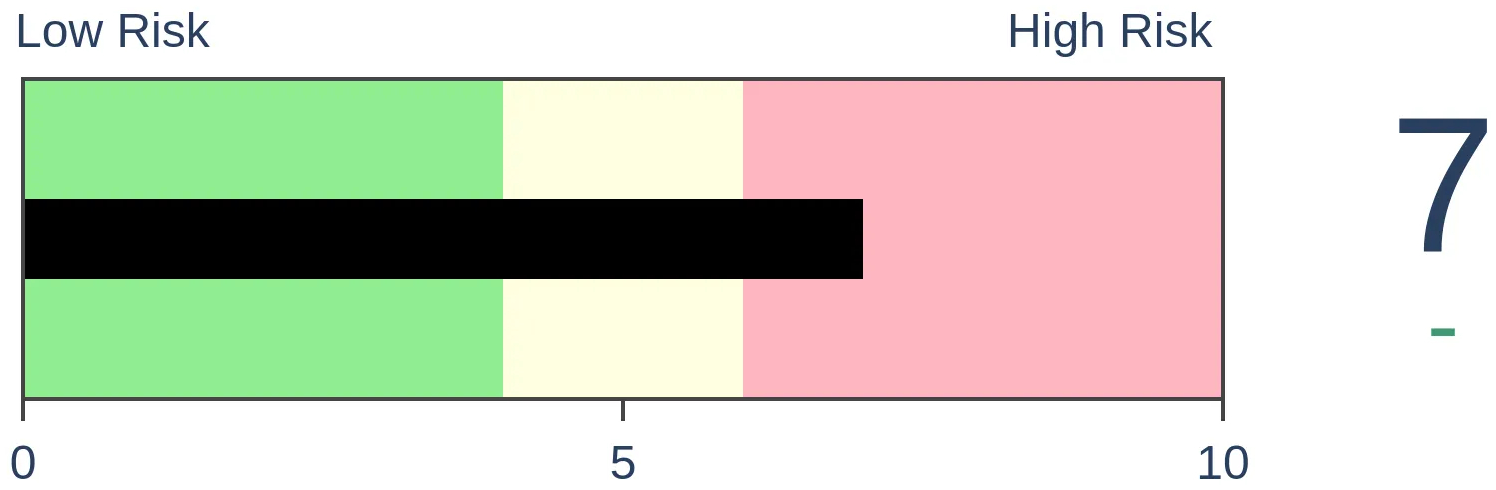
Risk Levels
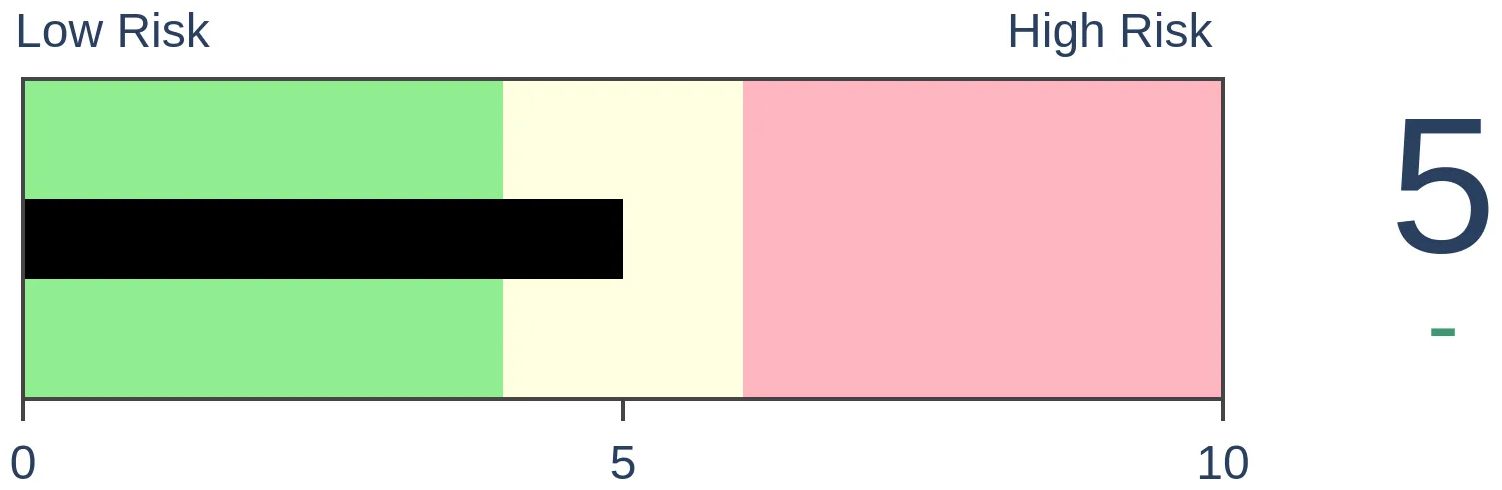
Stocks Short-Term
|
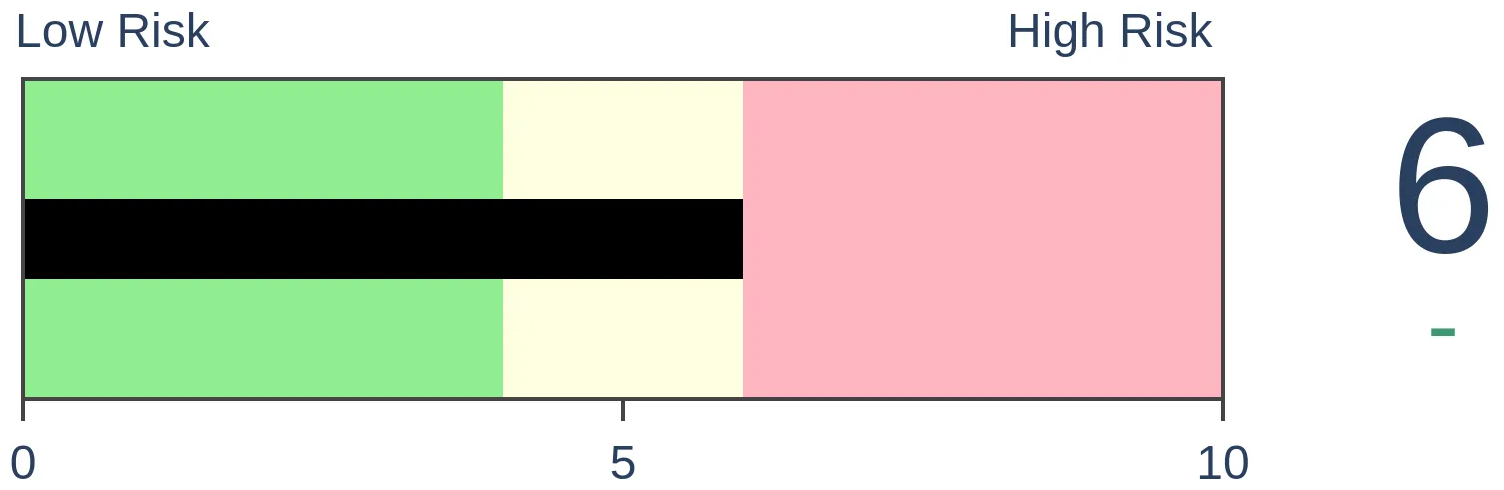
Stocks Medium-Term

|
|
Bonds
|
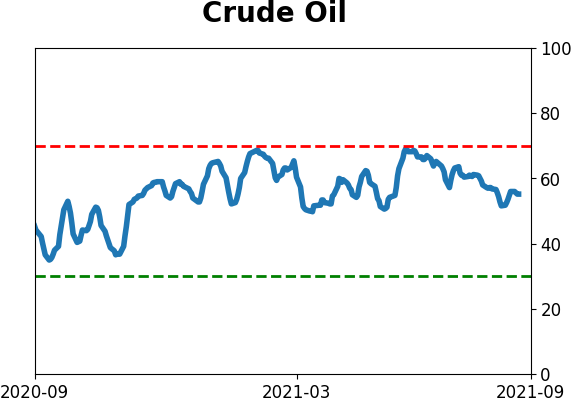
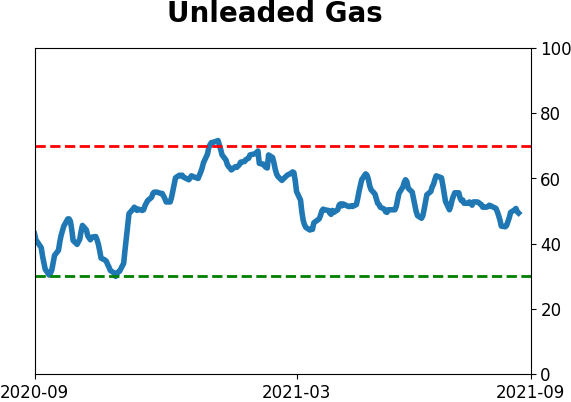
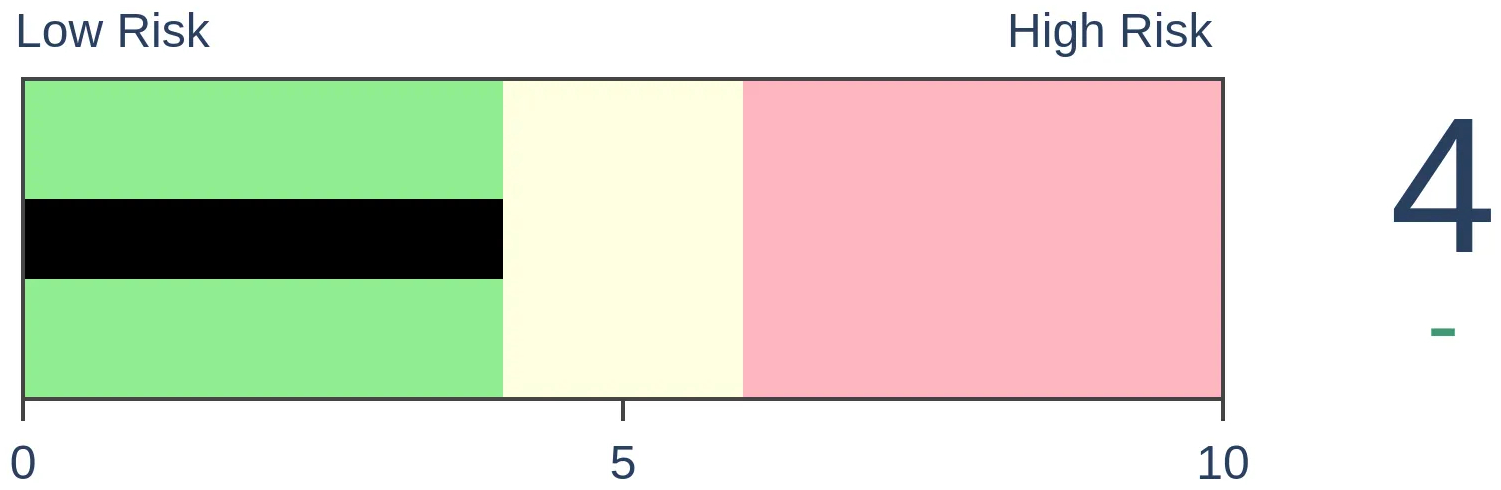
Crude Oil

|
|
Gold
|
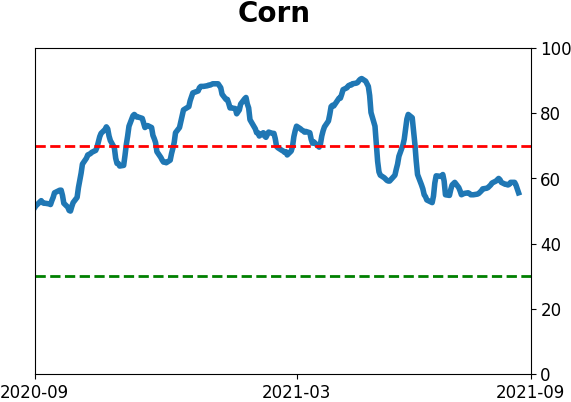
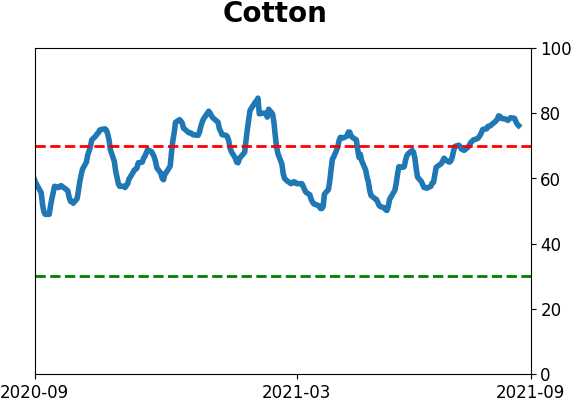
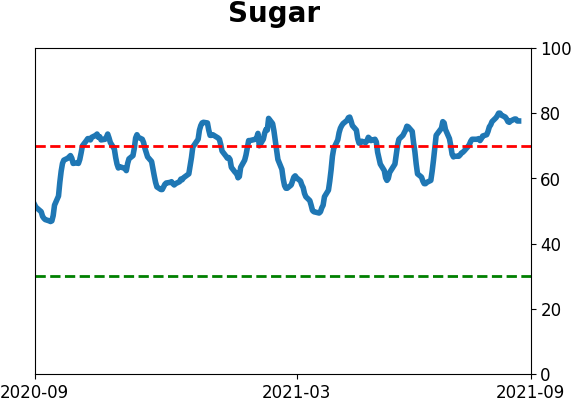
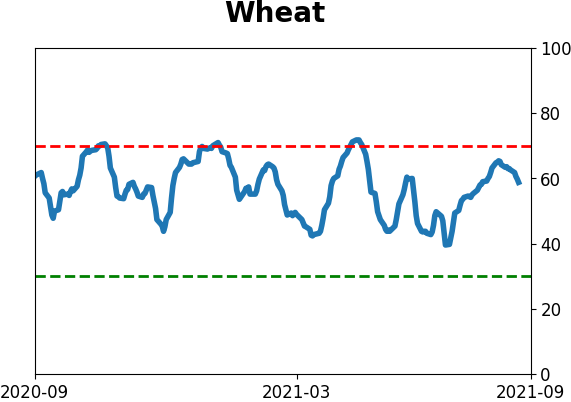
Agriculture
|
|
Research
By Jason Goepfert
BOTTOM LINE
As the S&P 500 soared to new highs over the past couple of months, defensive sectors like Utilities and Health Care have outpaced the index. That has led to an unsupported view that it's a negative for the broader market.
FORECAST / TIMEFRAME
None
|
Since the start of the quarter, an odd thing has happened. A couple of the most defensive sectors in the market have far outpaced the momentum run in the S&P 500.
As noted in the Wall Street Journal:
"Some of the hottest stocks in the U.S. are pointing to an economic cool-down. Utilities and healthcare are among the best-performing groups in the S&P 500 so far this quarter, with gains of 7.8% and 6.6%, respectively, compared with a 4.9% rise in the broad stock index."
This can be an issue for some investors because:
"The gains are noteworthy because investors typically pile into those types of stocks when they are expecting the outlook to darken. Visits to the doctor and electricity use are less apt to decline in a pinch than spending on vacations or new furniture.
But rallies in these so-called defensive sectors can presage broader market retreats, investors say, potentially spelling out a fresh test for a market whose post-pandemic rise has surprised many stock-market bulls."
We can see the relatively impressive rise in those two sectors versus the S&P in the chart below.
NOT A GREAT BEAR MARKET SIGNAL
So, should we worry? Is this really a sign that investors are doubting the recovery and stocks are about to tumble?
Meh.
The table below shows every time since 1928 when the S&P 500 closed at an all-time high, with more than a 4% gain over the past two months. But during those two-month stretches, both Utilities and Health Care outpaced the gains in the S&P by at least +2%.
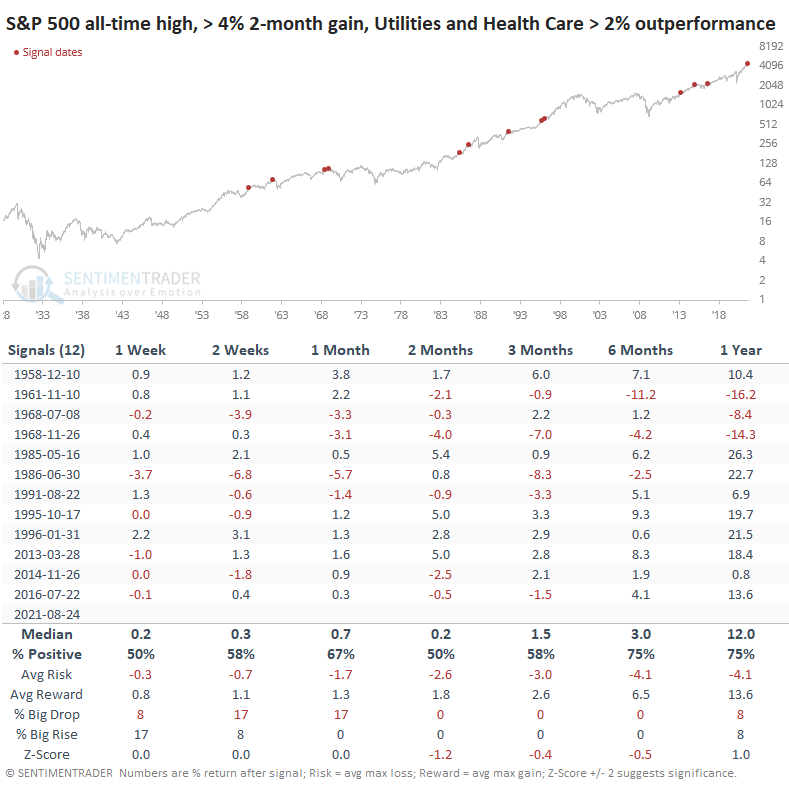
The S&P's gains going forward weren't all that impressive. It underperformed a random return over the next 2-6 months and risk was higher than reward up to 3 months later. It was especially vulnerable over the next couple of months. Even so, only a couple of them (1961 and 1968) preceded bear markets.
If this is truly a reason for concern, then the opposite condition should prove to be, well, the opposite. If the S&P soars to a new high while Utilites and Health Care underperform by 2% or more, then it should precede better returns.
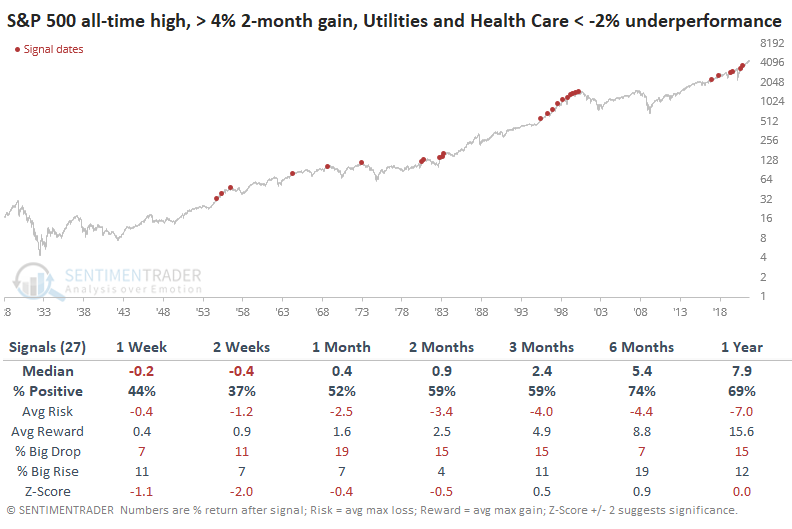
That certainly wasn't the case in the short-term, but was over the medium-term. Even so, the S&P's one-year return after these signals was quite a bit less than after the defensive-led signals.
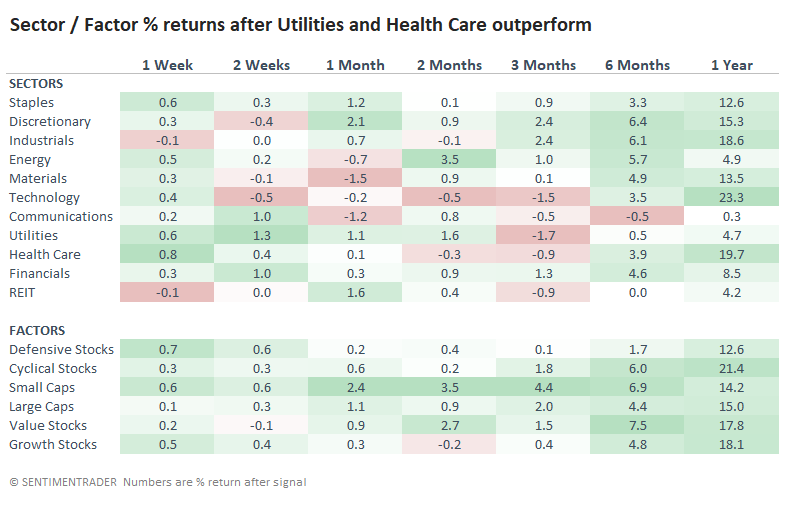
DEFENSIVE STOCKS SHOWED POOR RETURNS
After defensive-led rallies to new highs, it would make sense to expect Defensive stocks to continue to outperform. That wasn't the case, with Defensive stocks leading to an average return of only +1.7% over the next six months versus +6.0% for Cyclicals. Interestingly, once again Value stocks showed a positive tendency. That has been a consistent theme among most of the studies we've looked at for months.
There are some reasons for caution ahead. Most of them are shorter-term in nature, and buyers haven't been interested in considering them, anyway. But some of those reasons that are being discussed don't have much, or any, empirical support. A "defensive-led recovery" is one of those apparent non-factors.
Active Studies
| Time Frame | Bullish | Bearish | | Short-Term | 0 | 6 | | Medium-Term | 5 | 3 | | Long-Term | 11 | 5 |
|
Indicators at Extremes
Portfolio
| Position | Description | Weight % | Added / Reduced | Date | | Stocks | RSP | 4.1 | Added 4.1% | 2021-05-19 | | Bonds | 23.9% BND, 6.9% SCHP | 30.7 | Reduced 7.1% | 2021-05-19 | | Commodities | GCC | 2.6 | Reduced 2.1%
| 2020-09-04 | | Precious Metals | GDX | 5.6 | Reduced 4.2% | 2021-05-19 | | Special Situations | 4.3% XLE, 2.2% PSCE | 7.6 | Reduced 5.6% | 2021-04-22 | | Cash | | 49.4 | | |
|
Updates (Changes made today are underlined)
Much of our momentum and trend work has remained positive for several months, with some scattered exceptions. Almost all sentiment-related work has shown a poor risk/reward ratio for stocks, especially as speculation drove to record highs in exuberance in February. Much of that has worn off, and most of our models are back toward neutral levels. There isn't much to be excited about here. The same goes for bonds and even gold. Gold has been performing well lately and is back above long-term trend lines. The issue is that it has a poor record of holding onto gains when attempting a long-term trend change like this, so we'll take a wait-and-see approach. RETURN YTD: 8.7% 2020: 8.1%, 2019: 12.6%, 2018: 0.6%, 2017: 3.8%, 2016: 17.1%, 2015: 9.2%, 2014: 14.5%, 2013: 2.2%, 2012: 10.8%, 2011: 16.5%, 2010: 15.3%, 2009: 23.9%, 2008: 16.2%, 2007: 7.8%
|
|
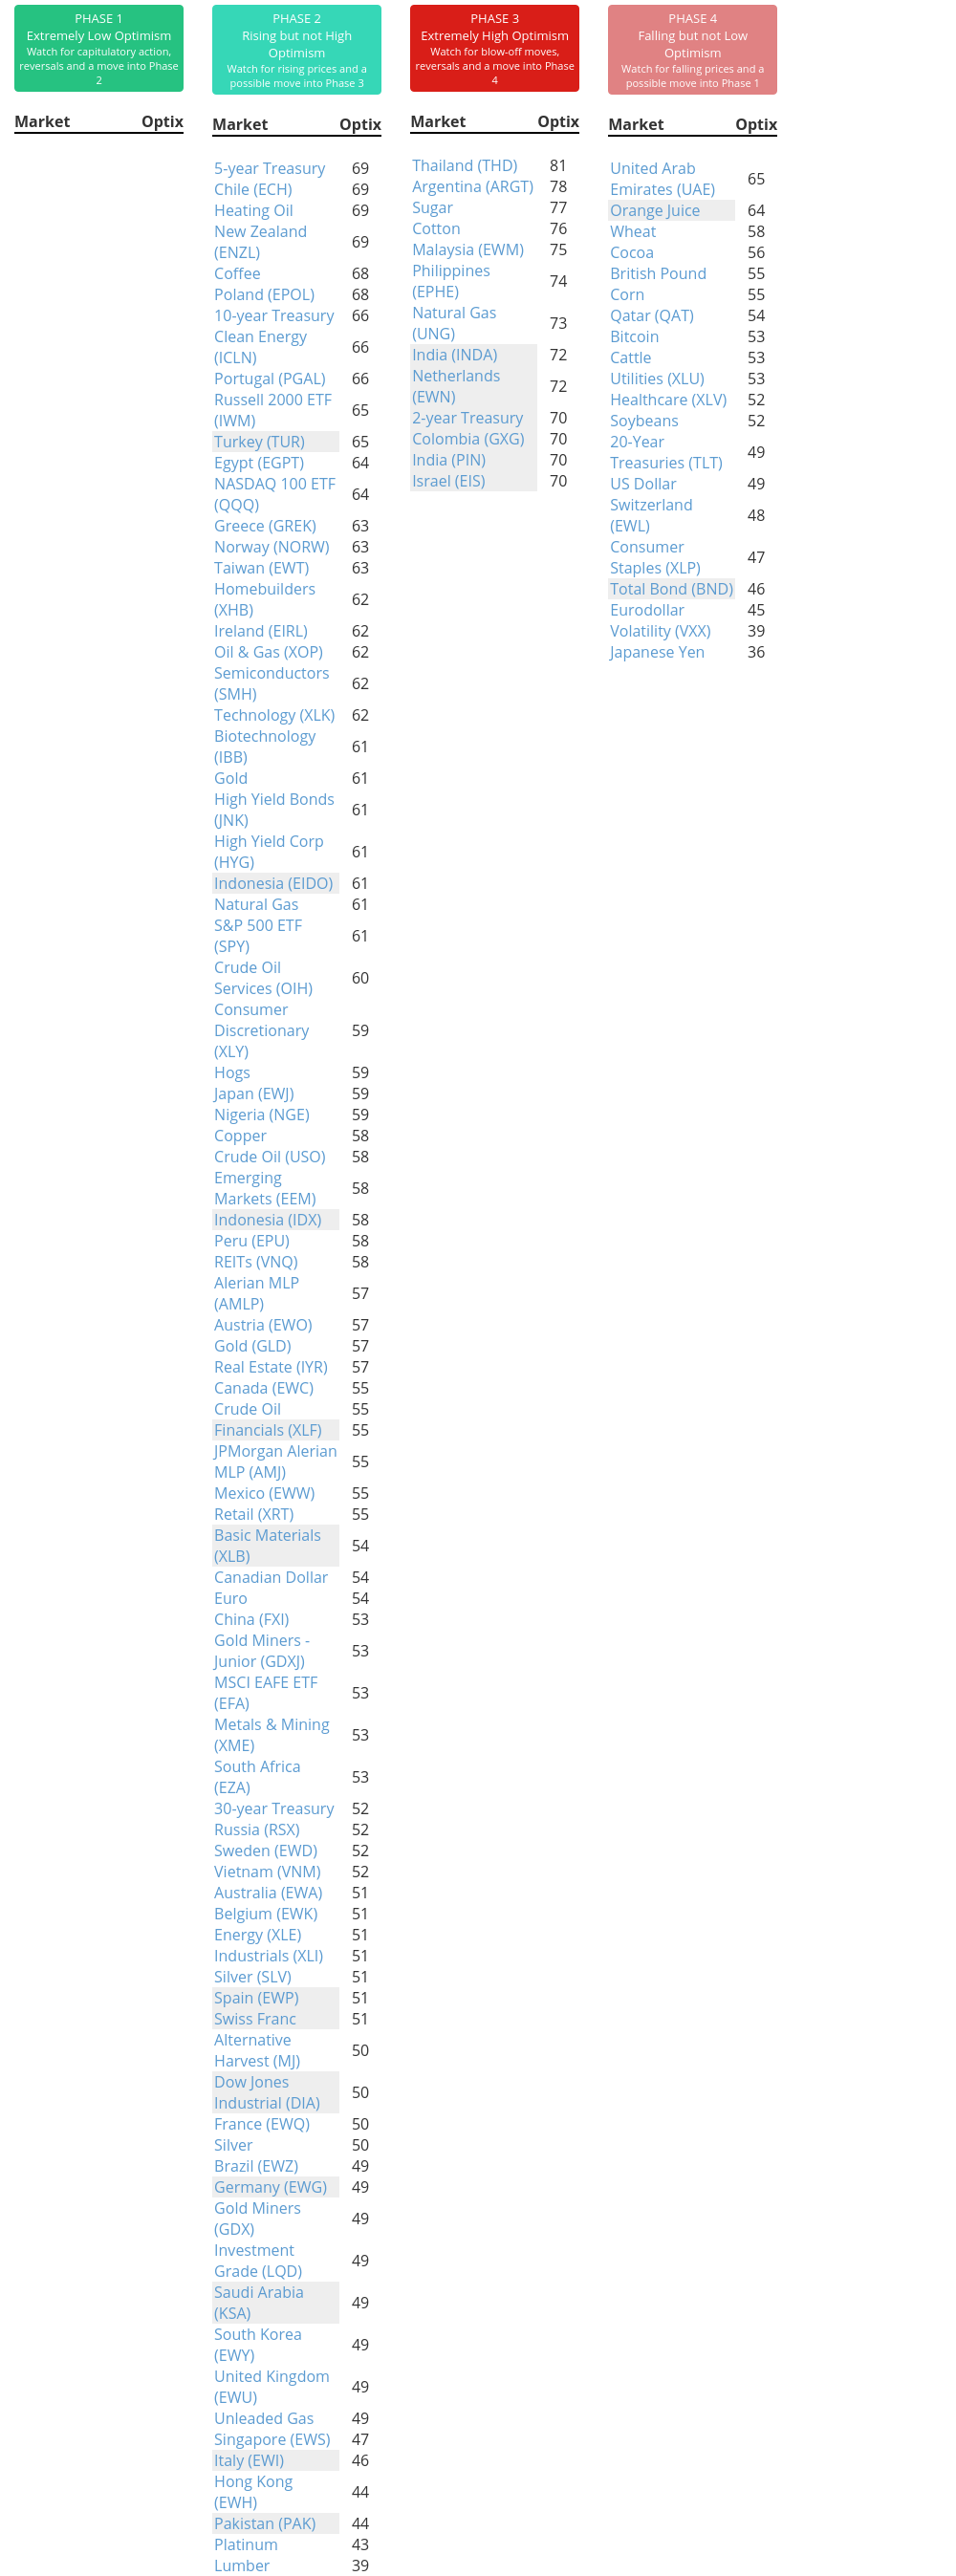
Phase Table
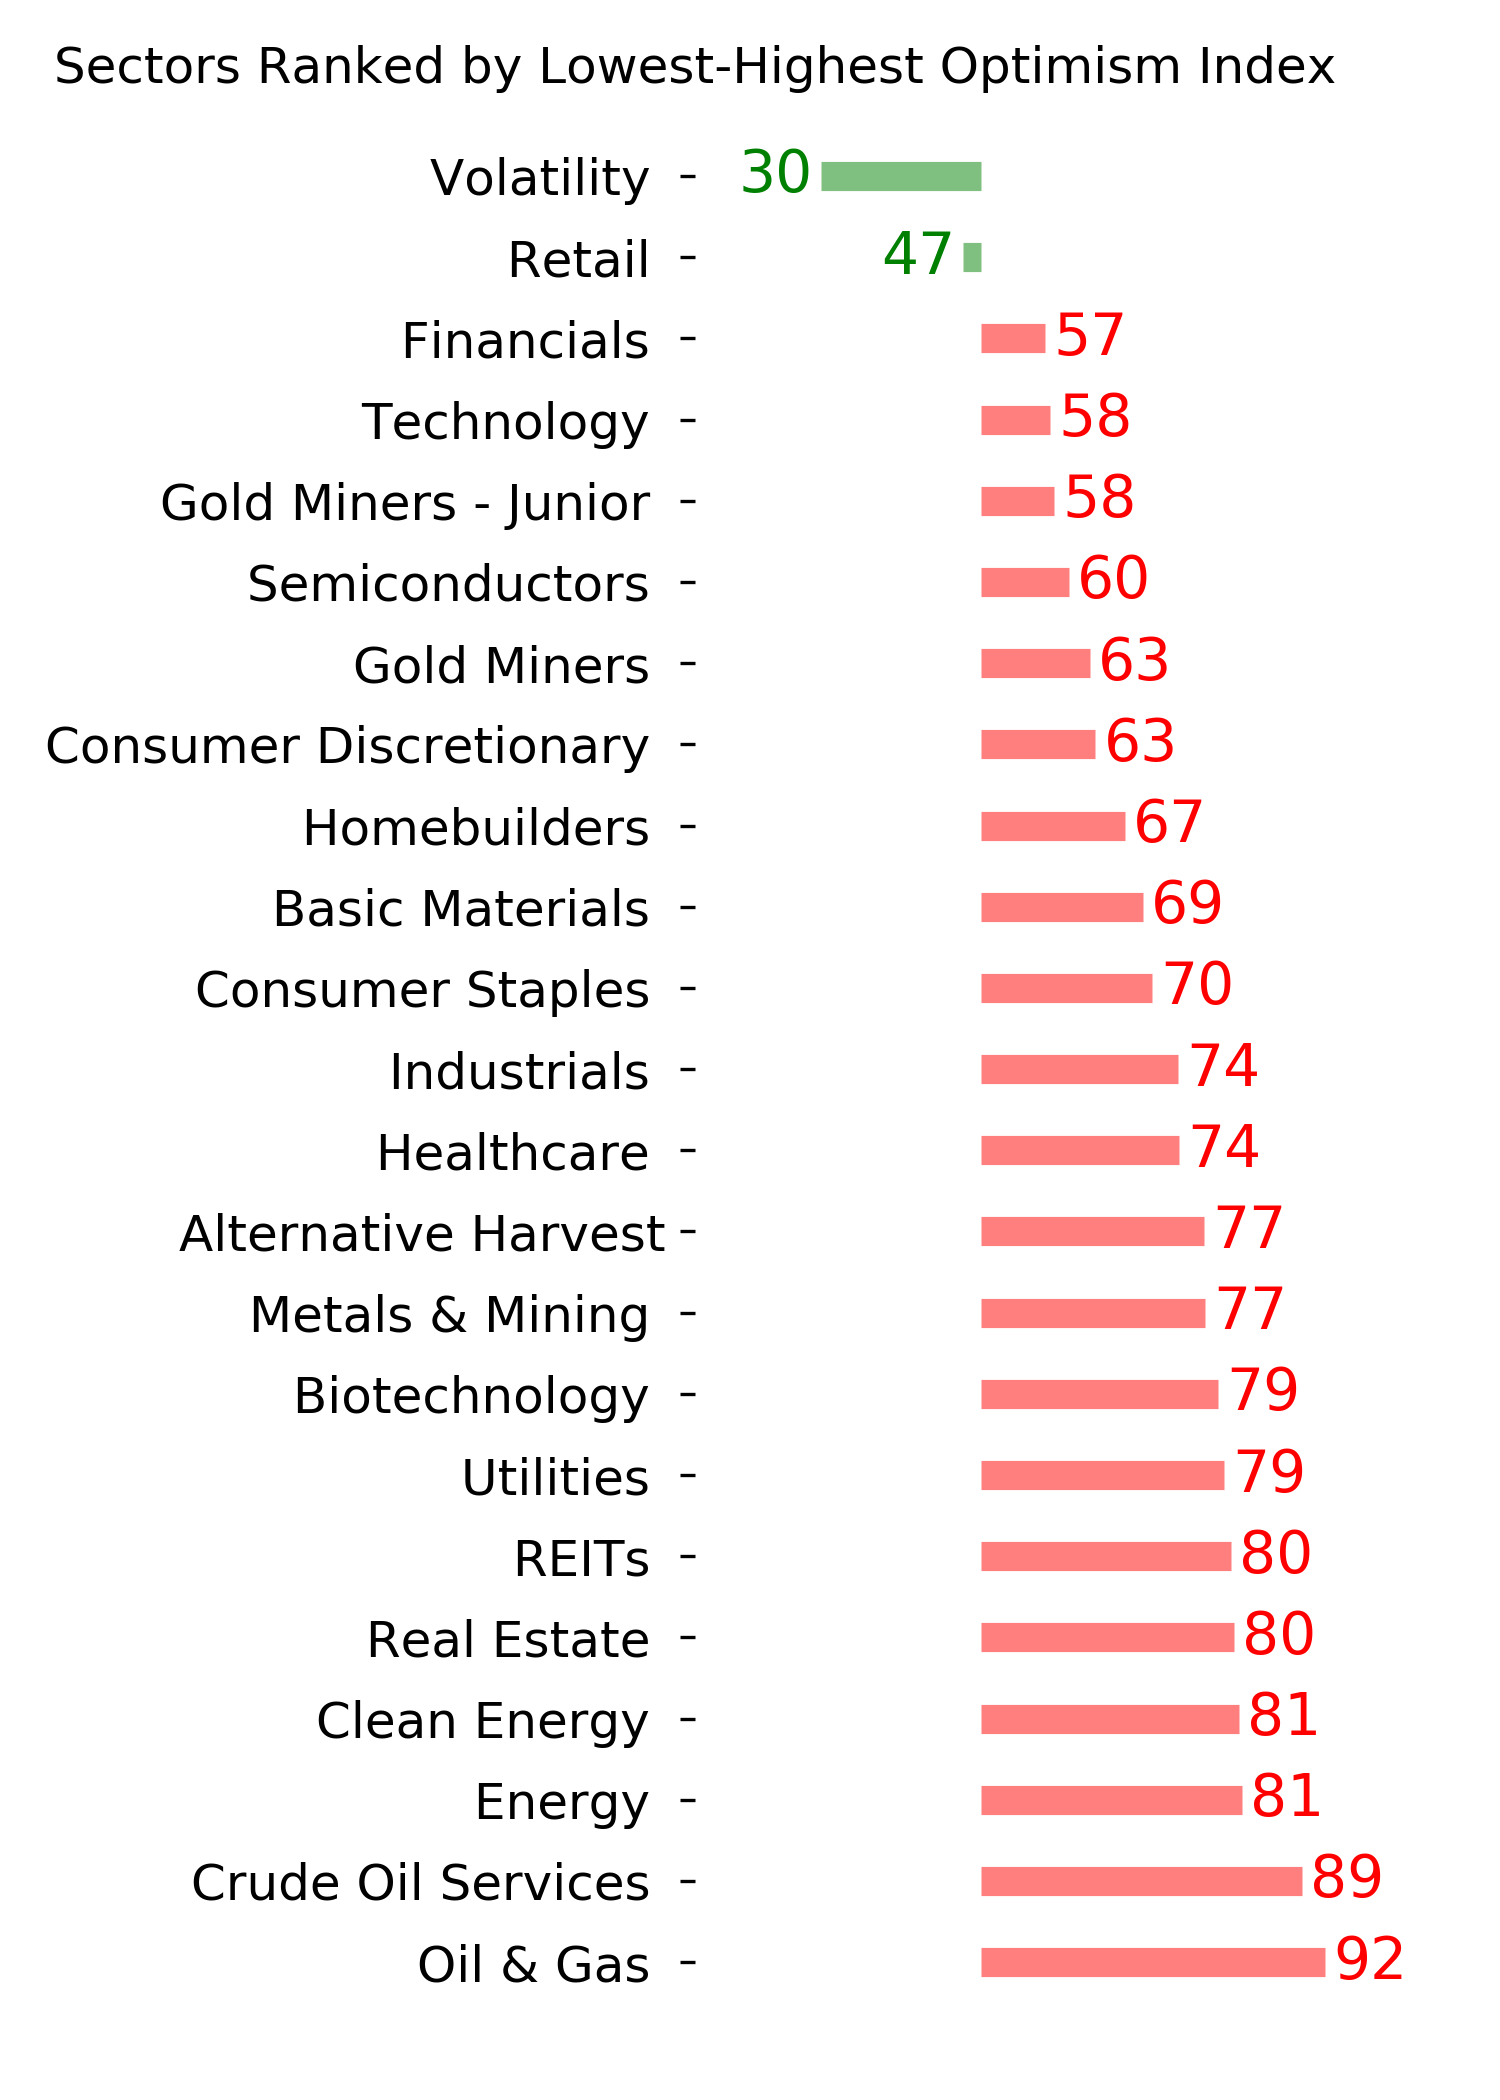
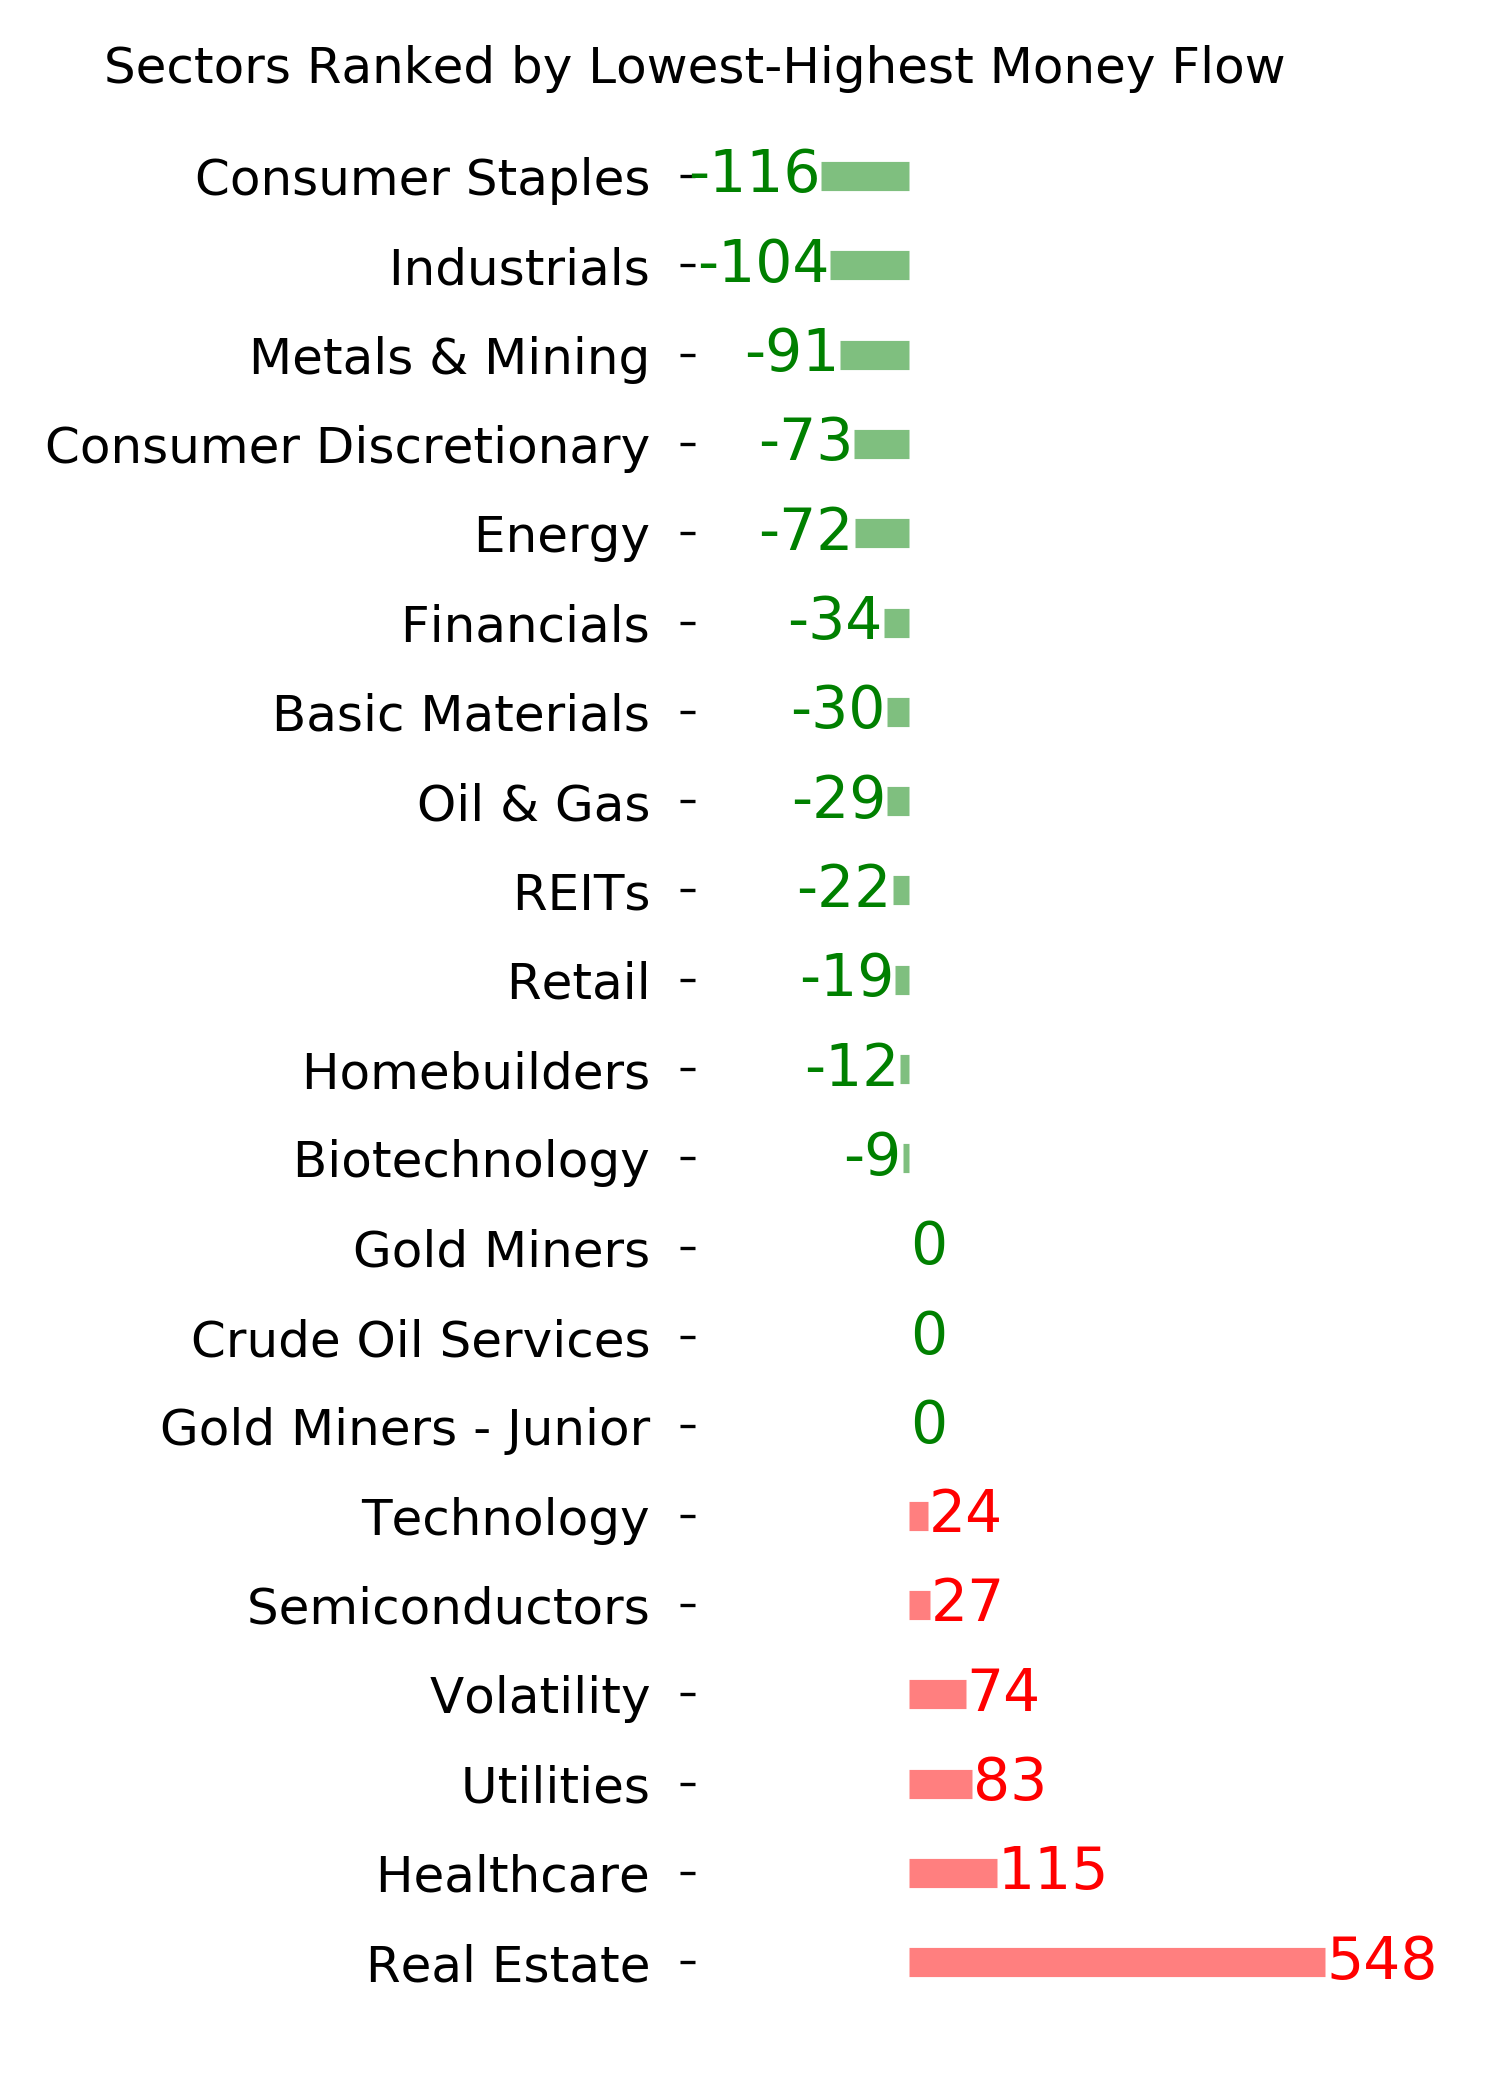
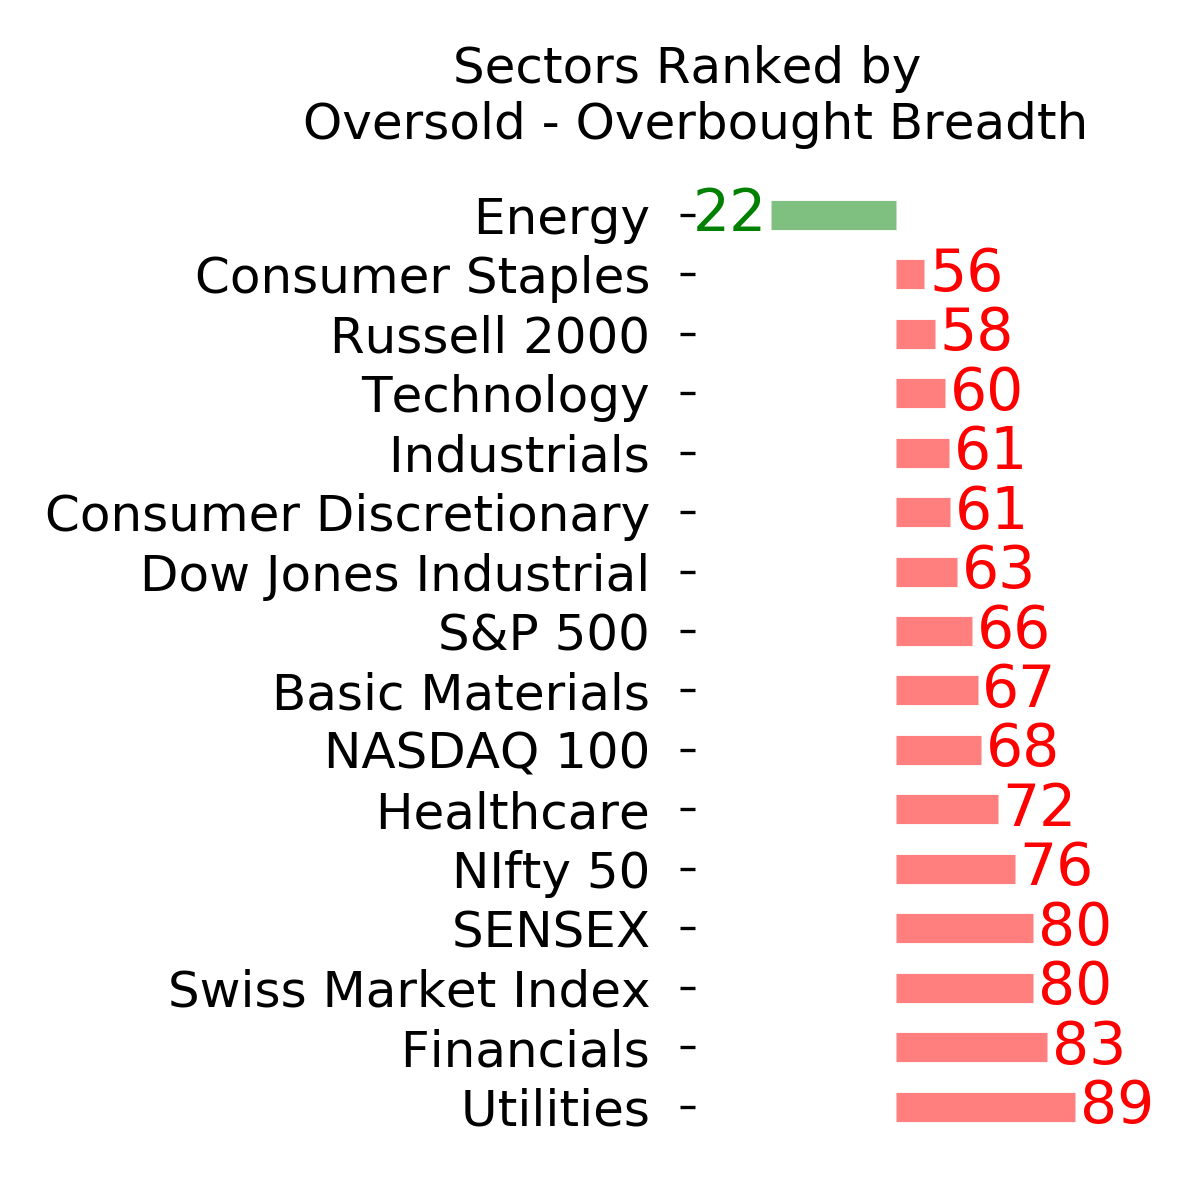
Ranks
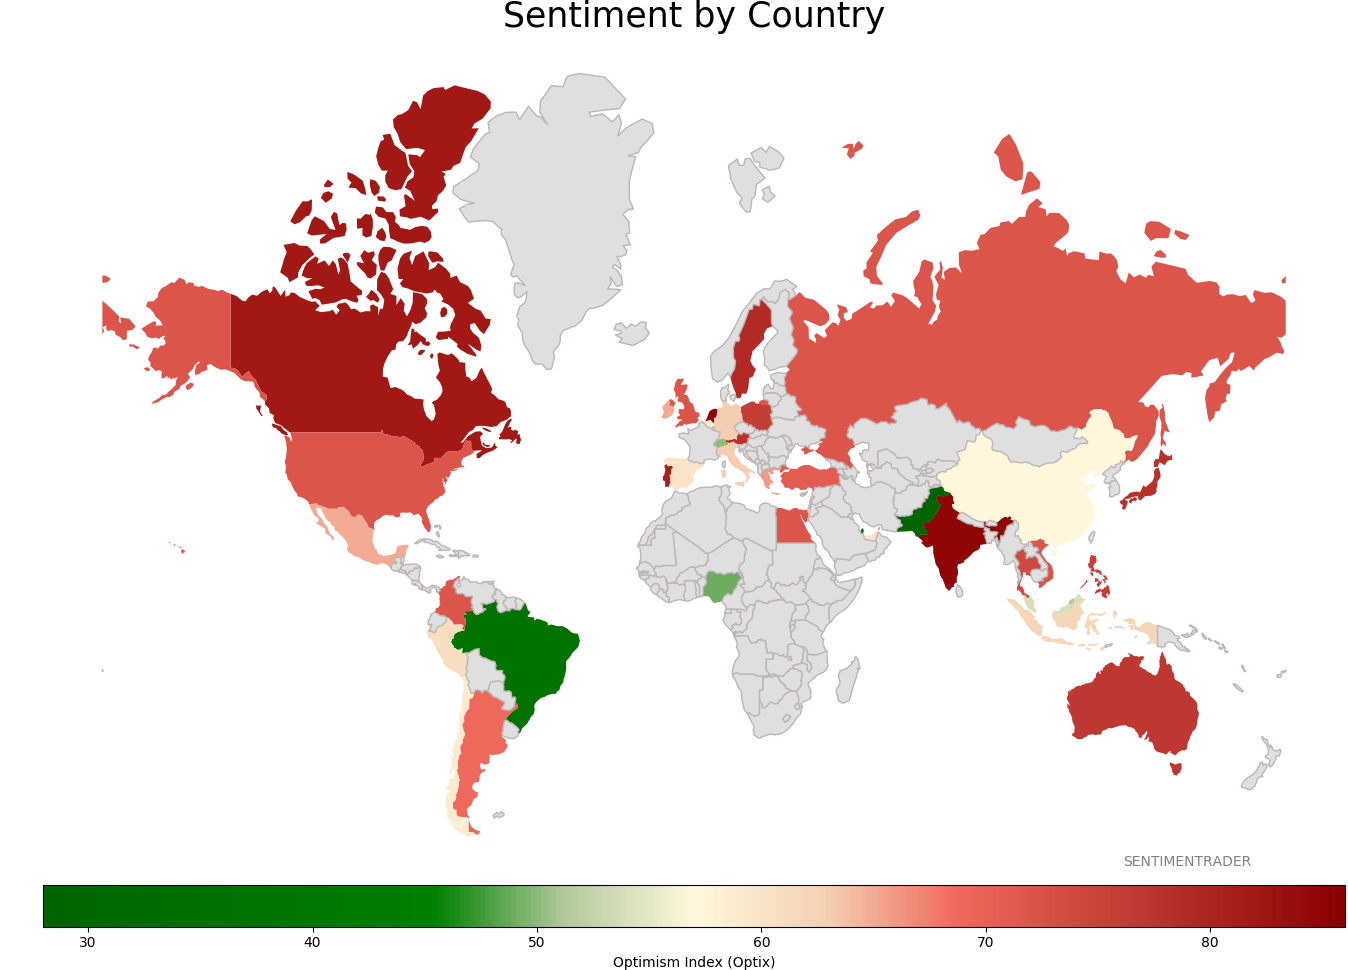
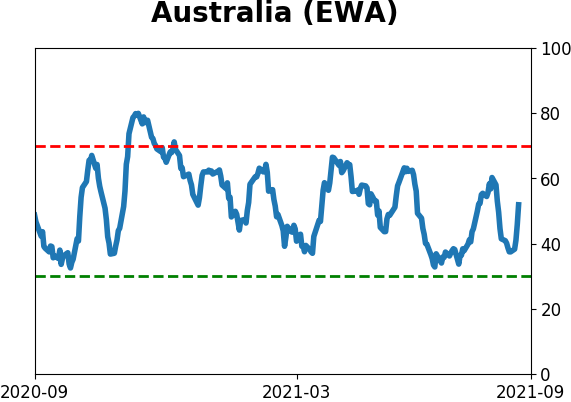
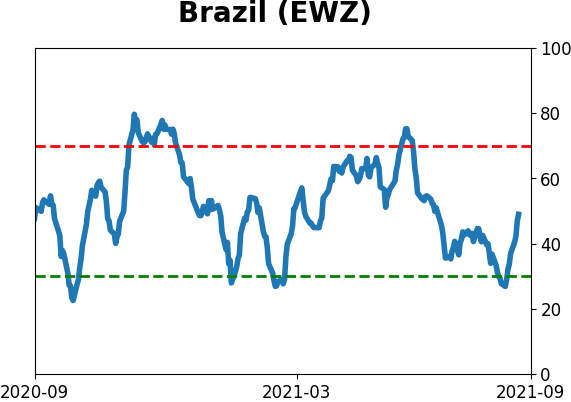
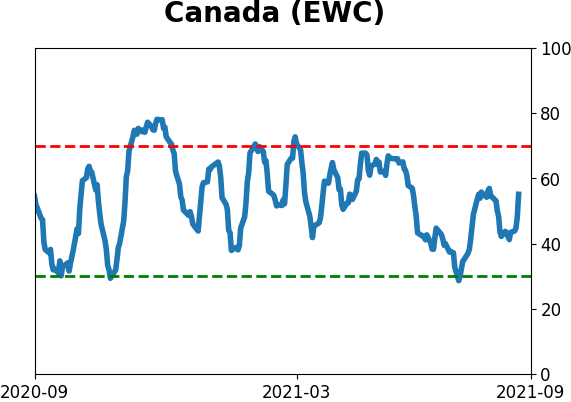
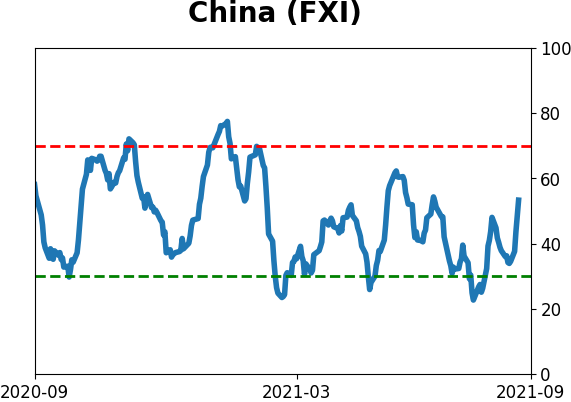
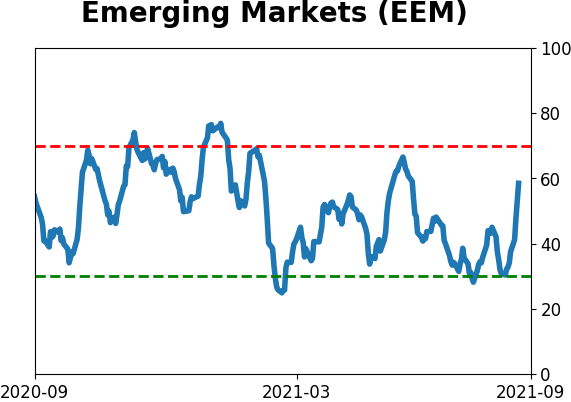
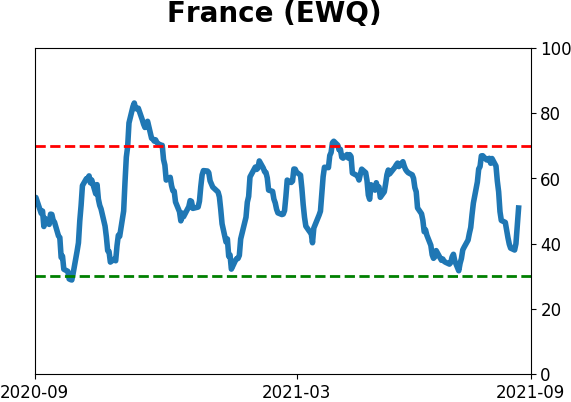
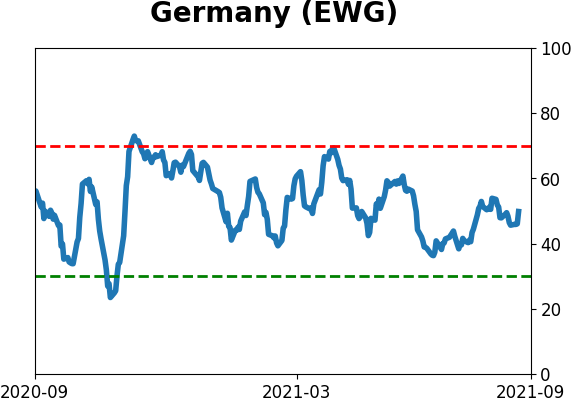
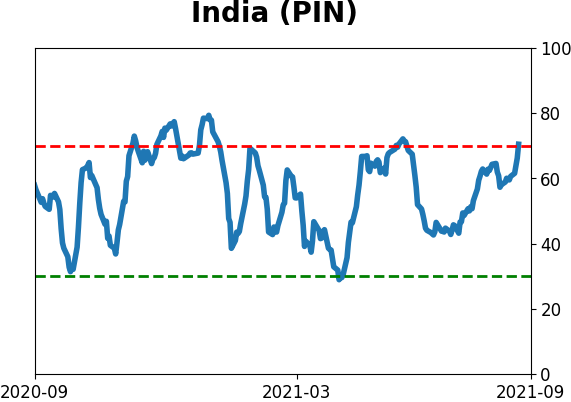
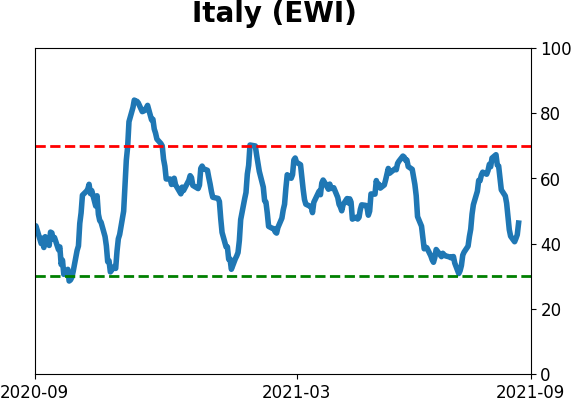
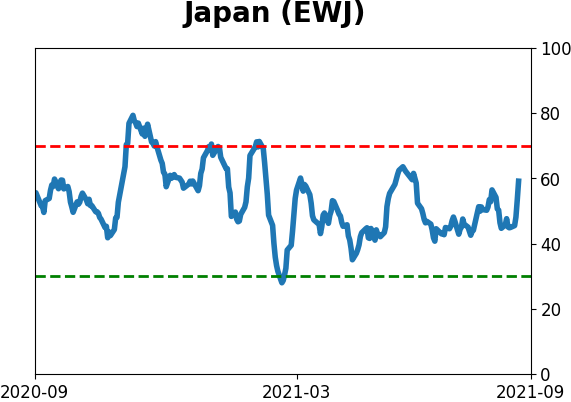
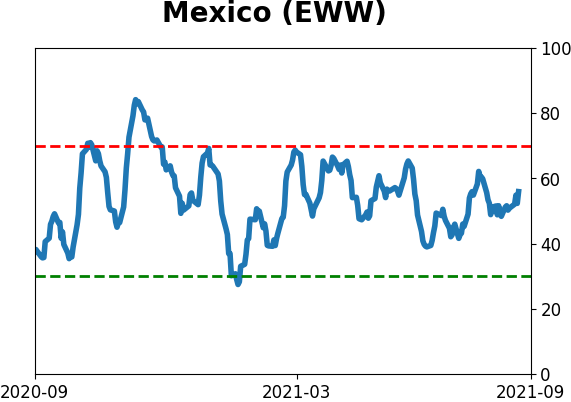
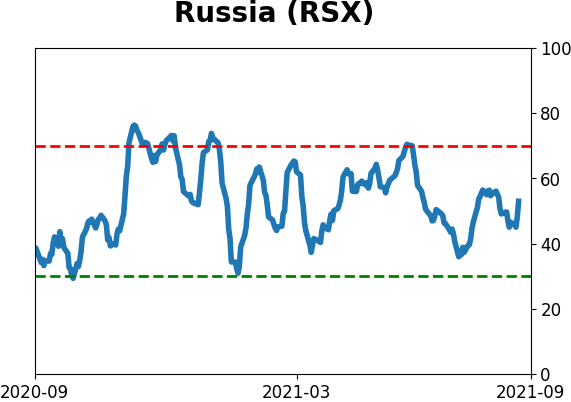
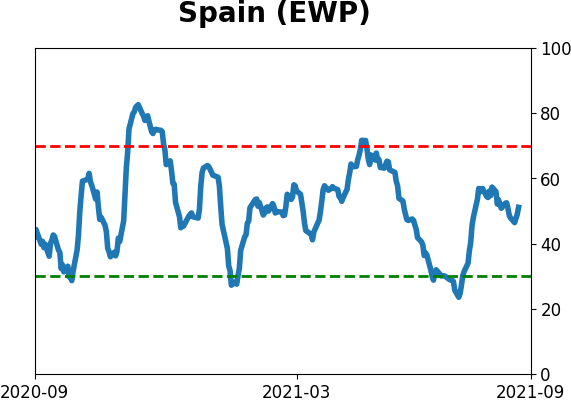
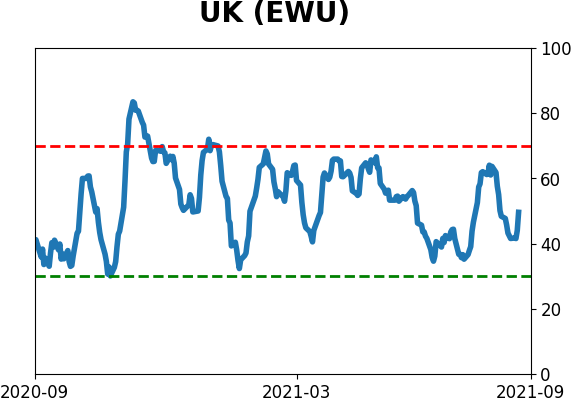
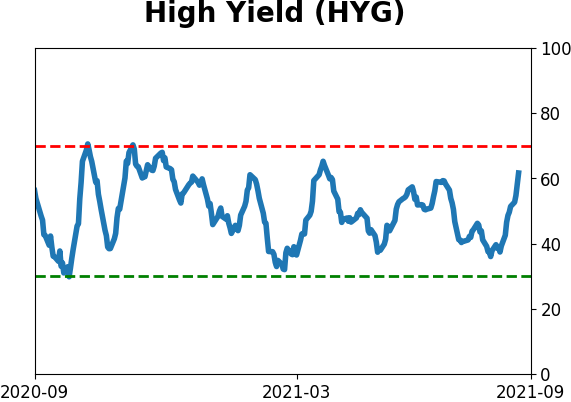
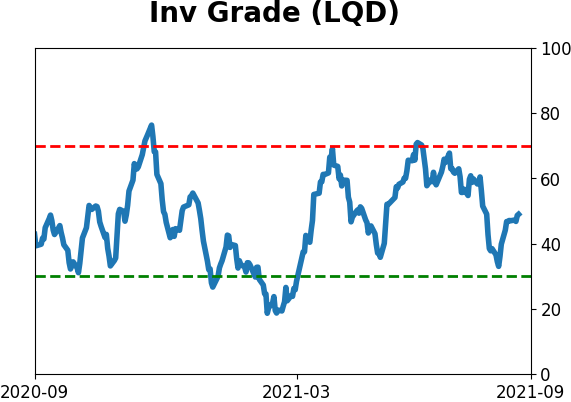
Sentiment Around The World
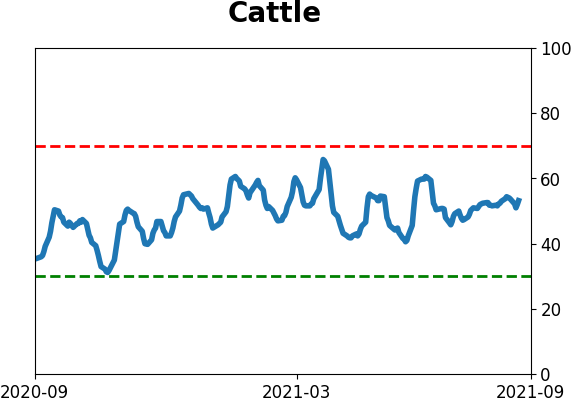
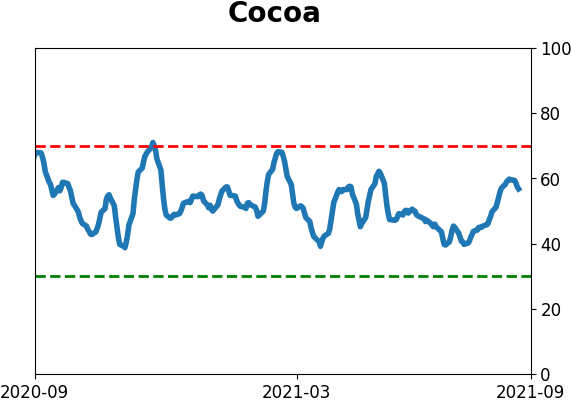
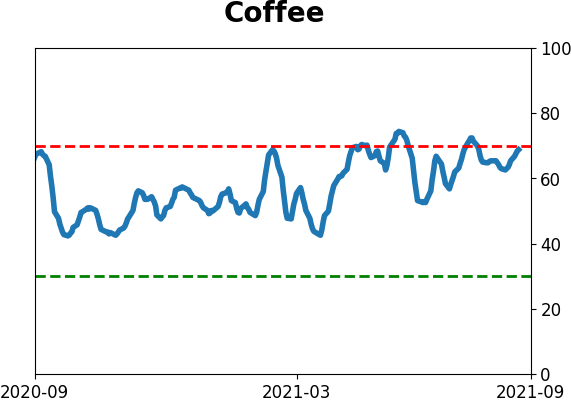
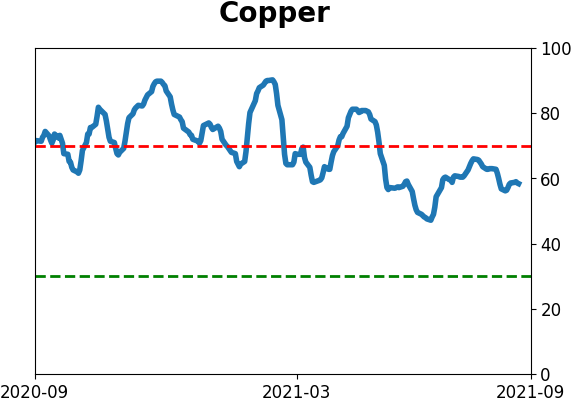
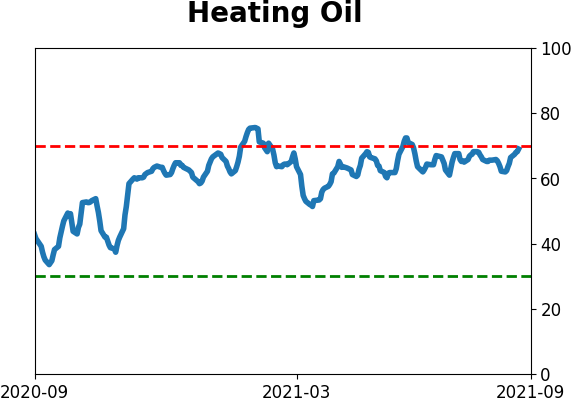
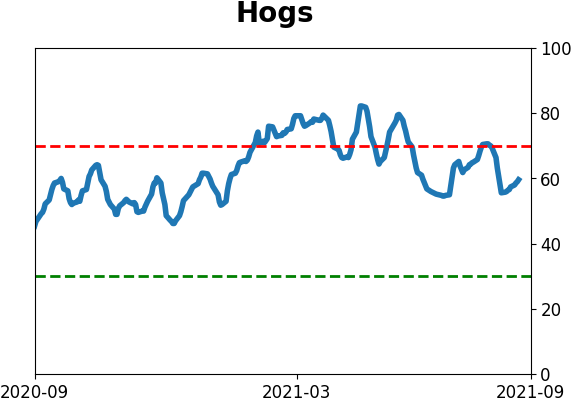
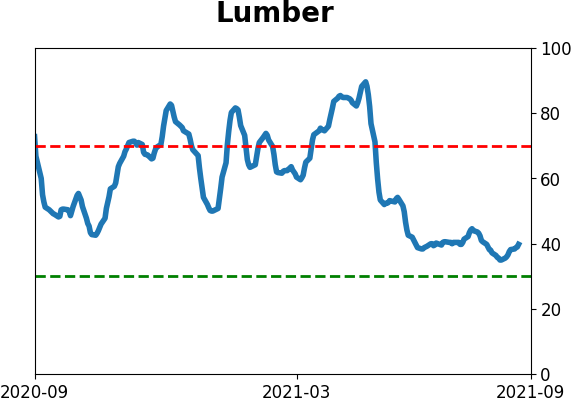
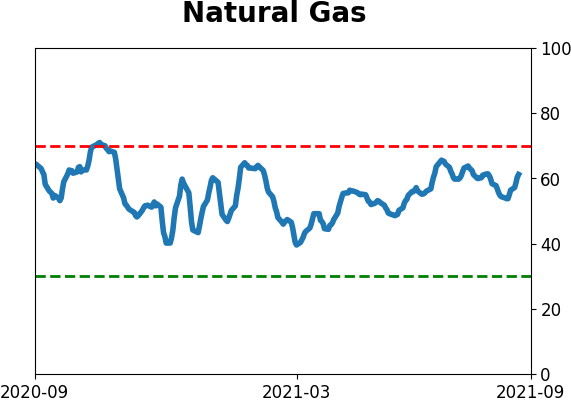
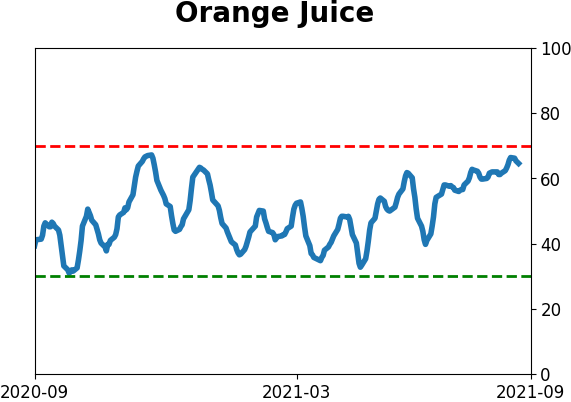
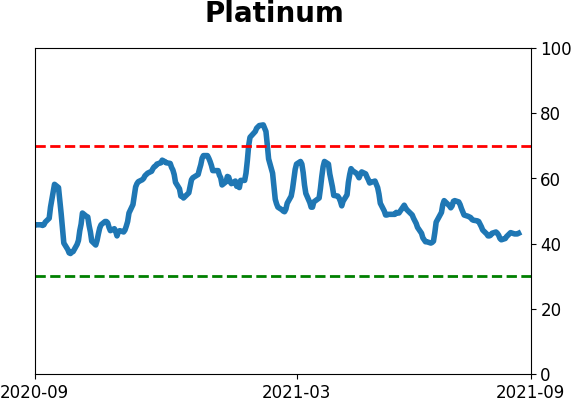
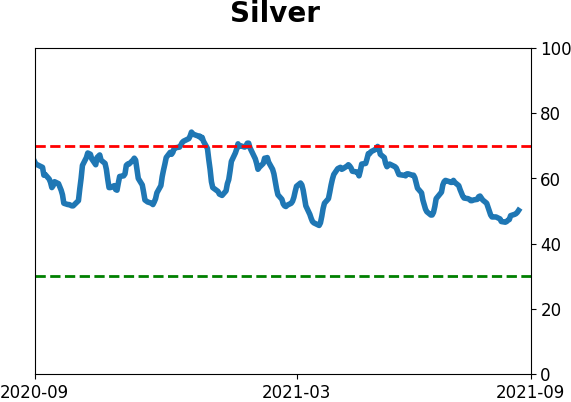
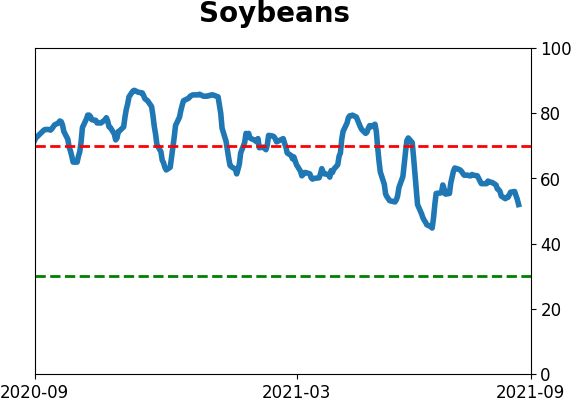
Optimism Index Thumbnails
|
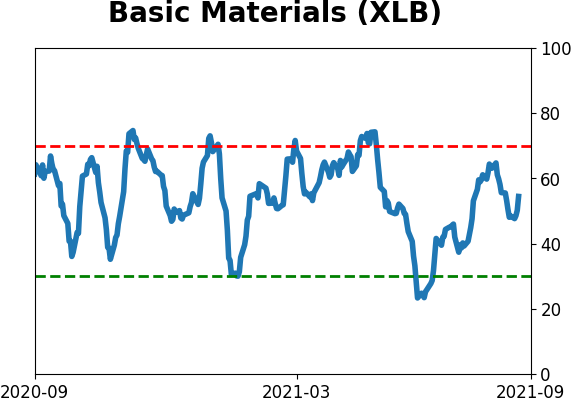
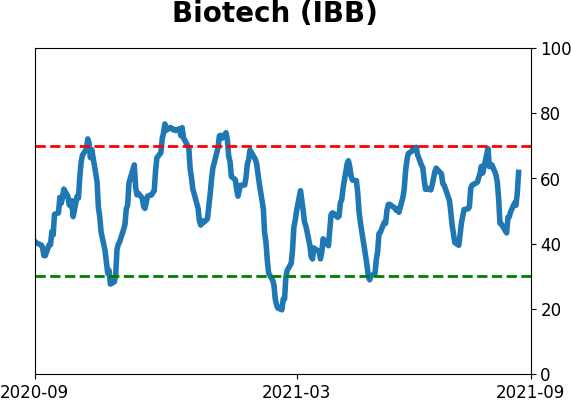
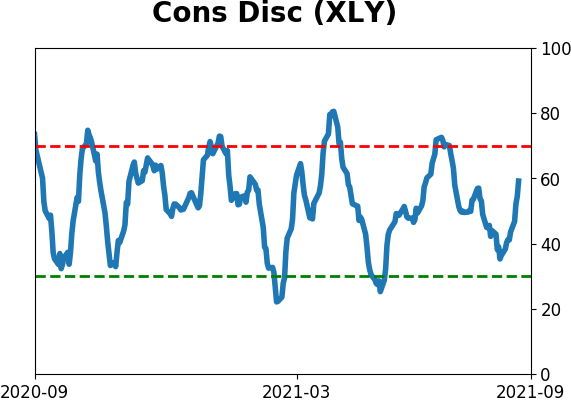
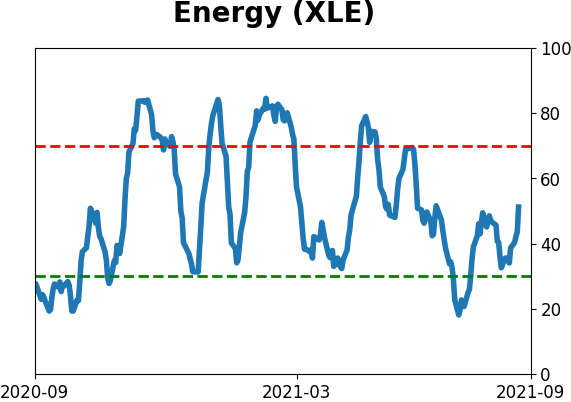
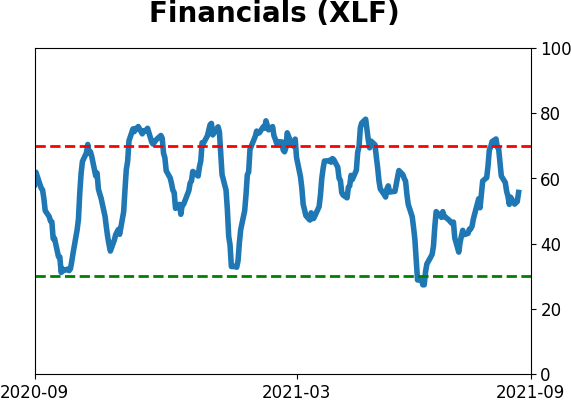
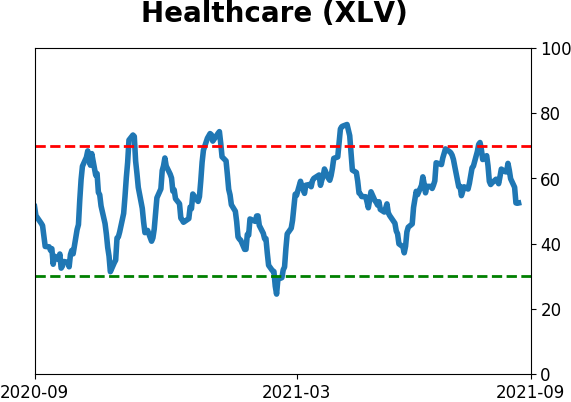
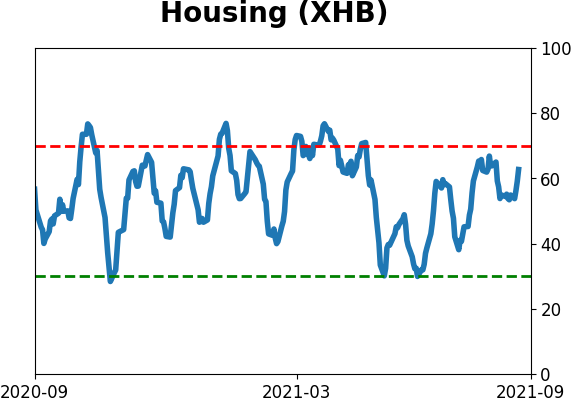
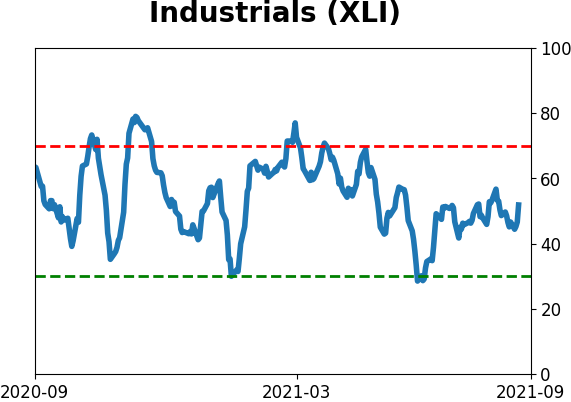
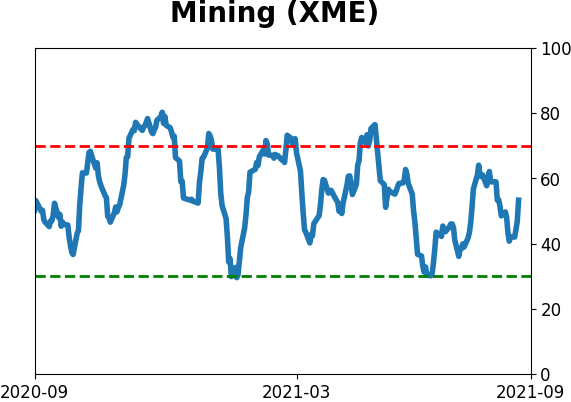
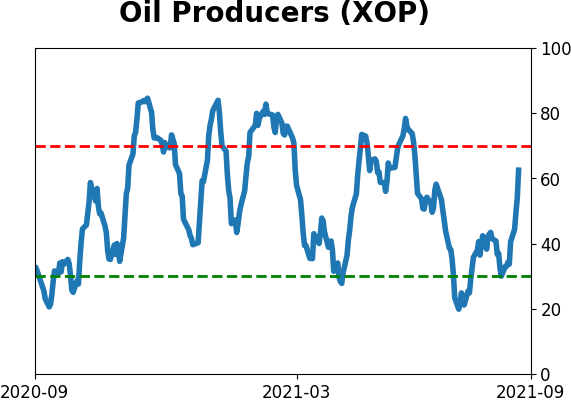
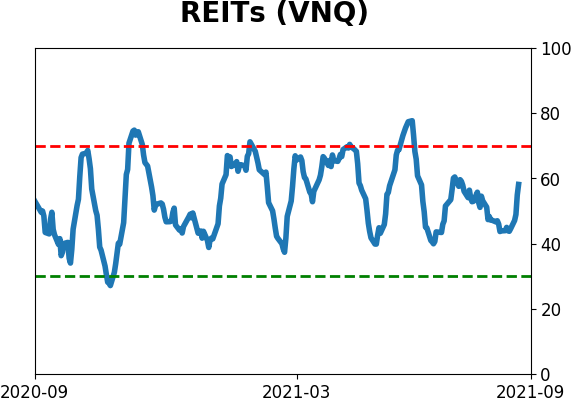
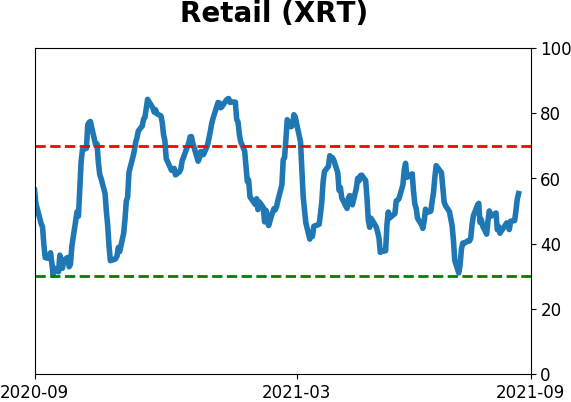
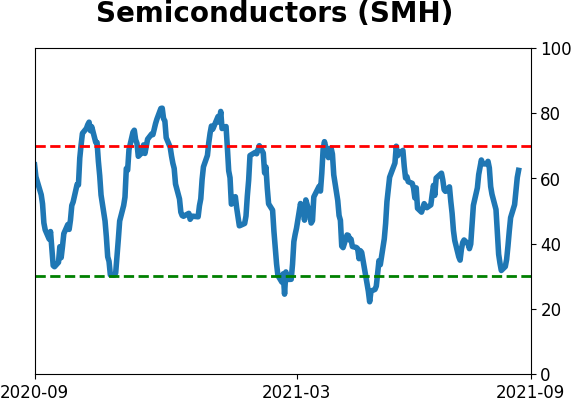
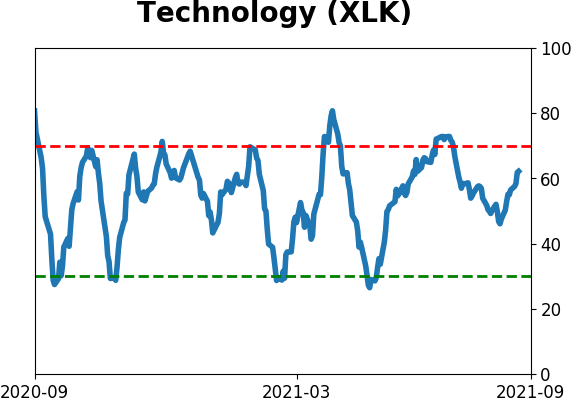
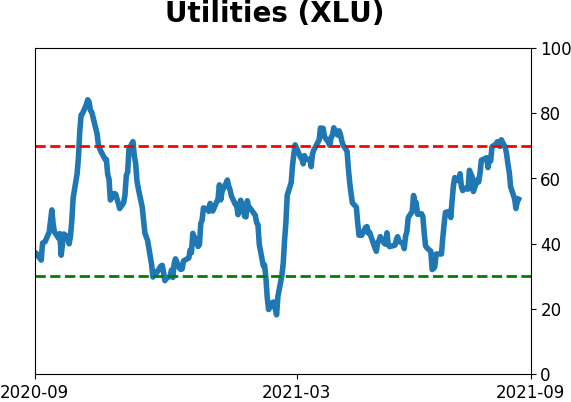
Sector ETF's - 10-Day Moving Average
|
|
|
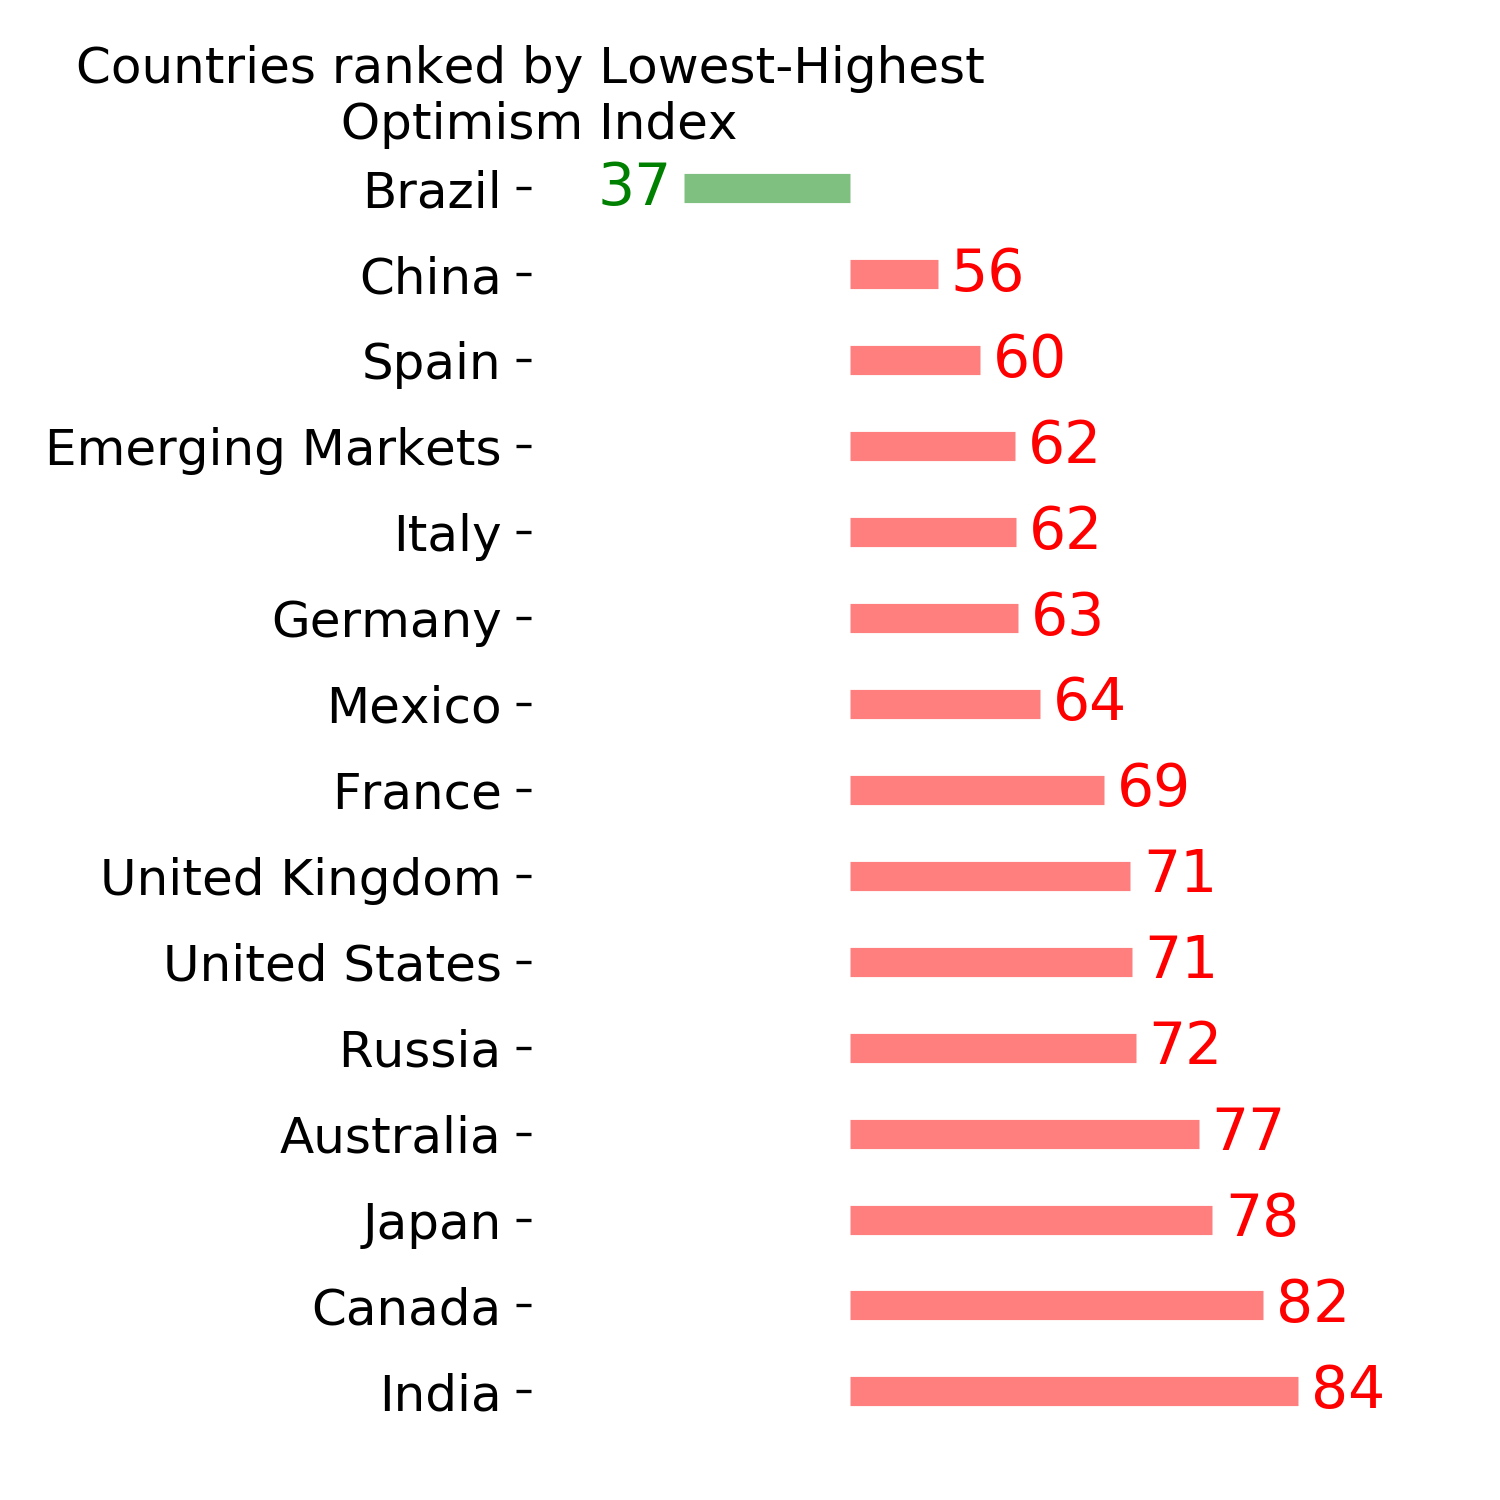
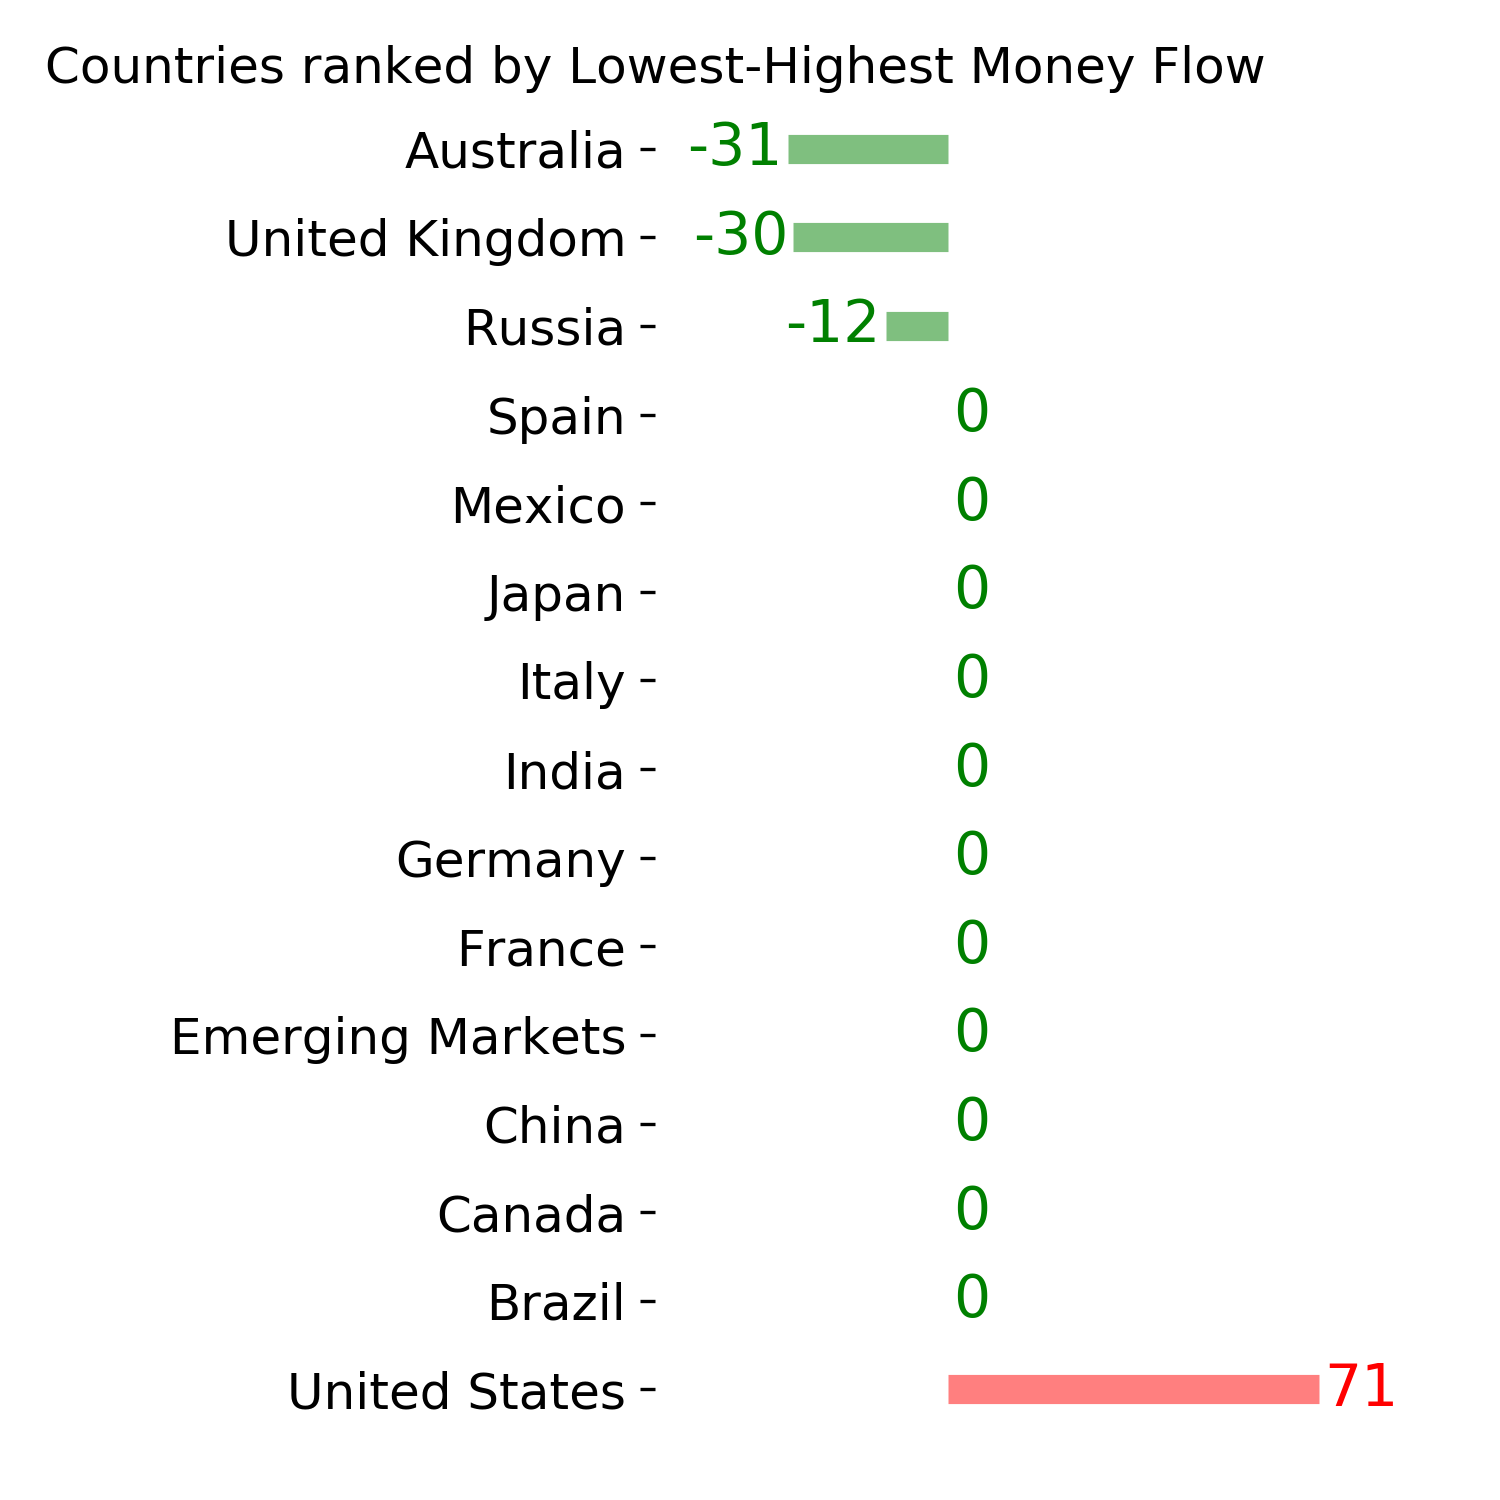
Country ETF's - 10-Day Moving Average
|
|
|
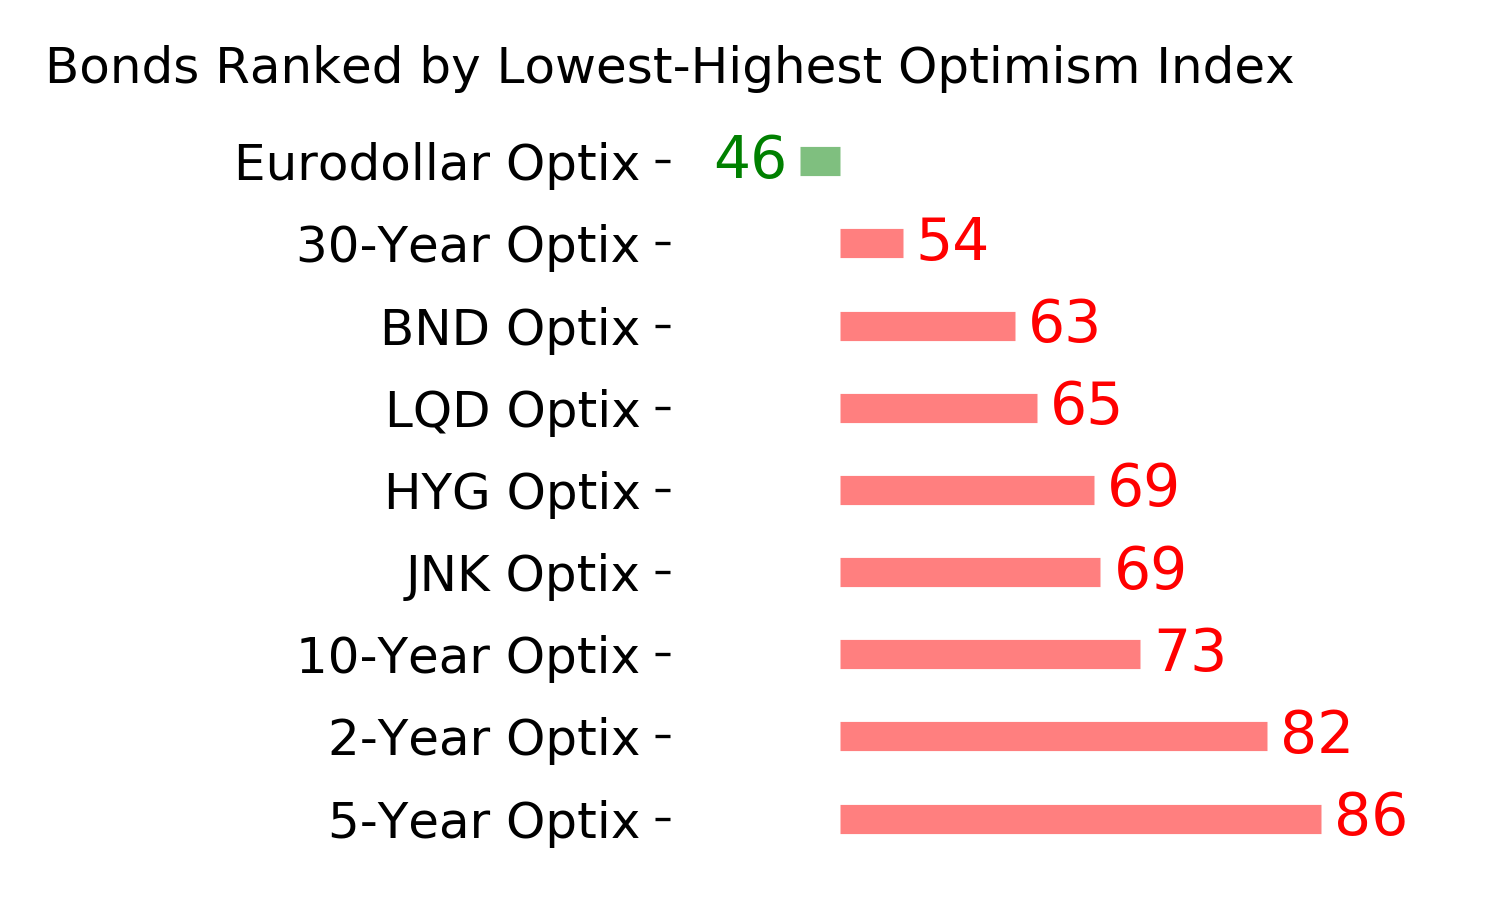
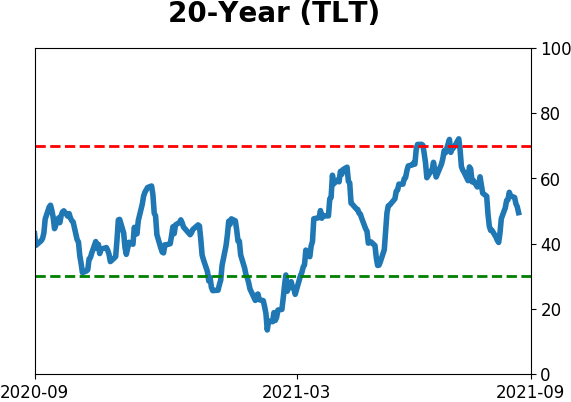
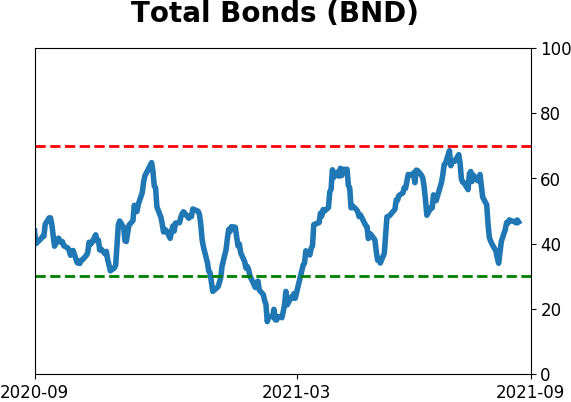
Bond ETF's - 10-Day Moving Average
|
|
|
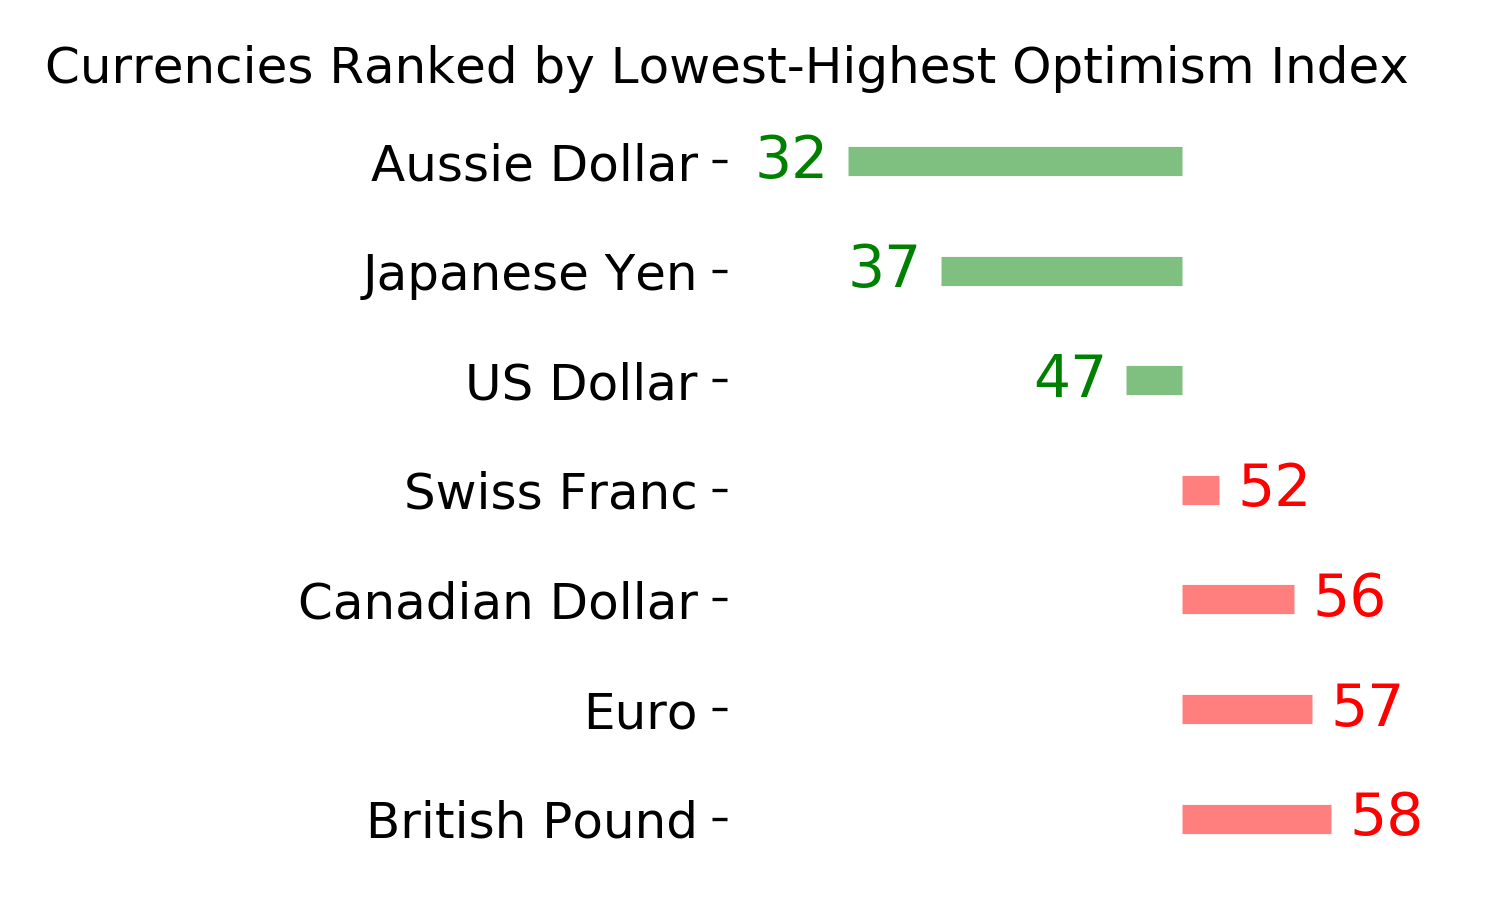
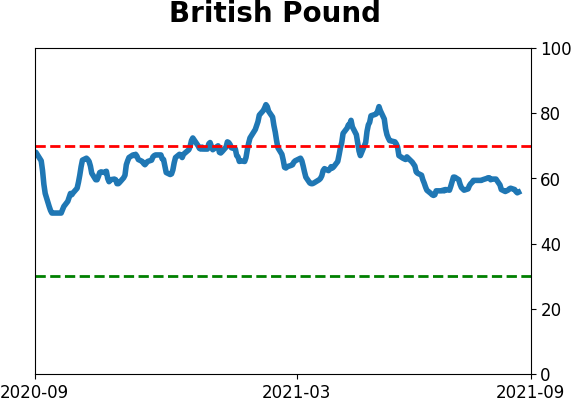
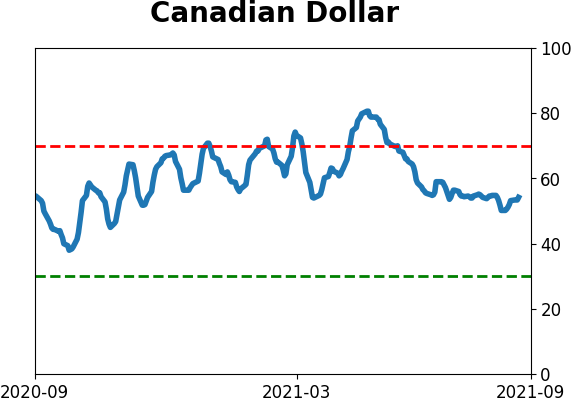
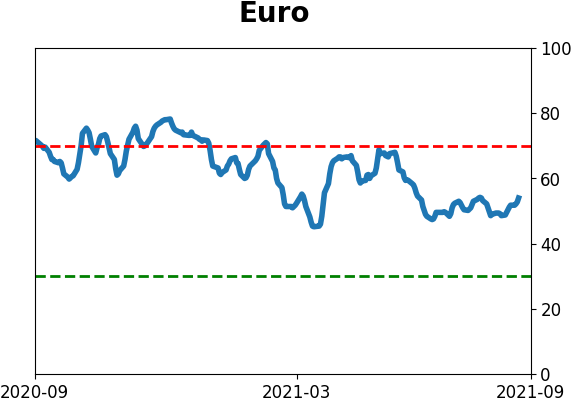
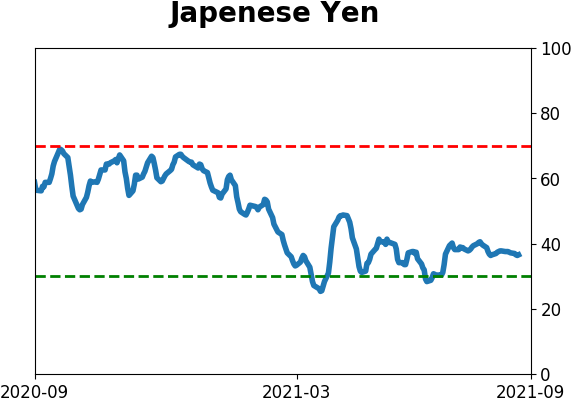
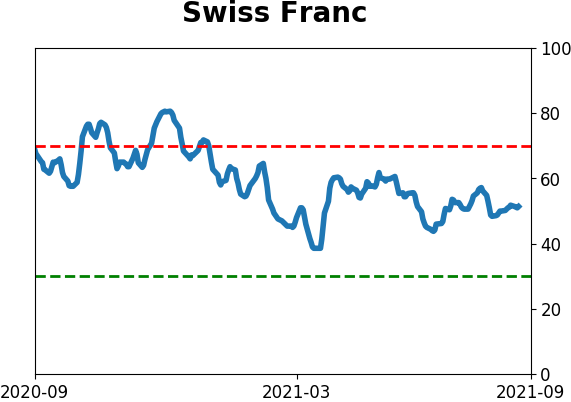
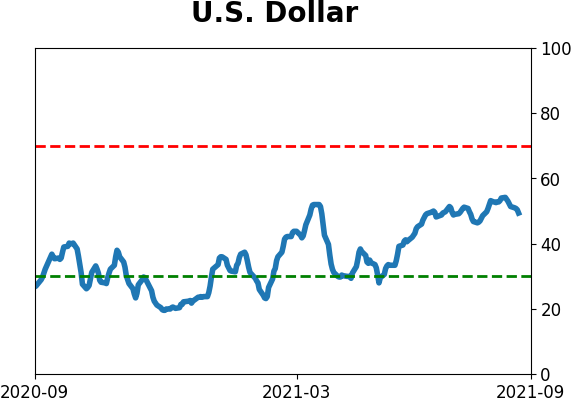
Currency ETF's - 5-Day Moving Average
|
|
|
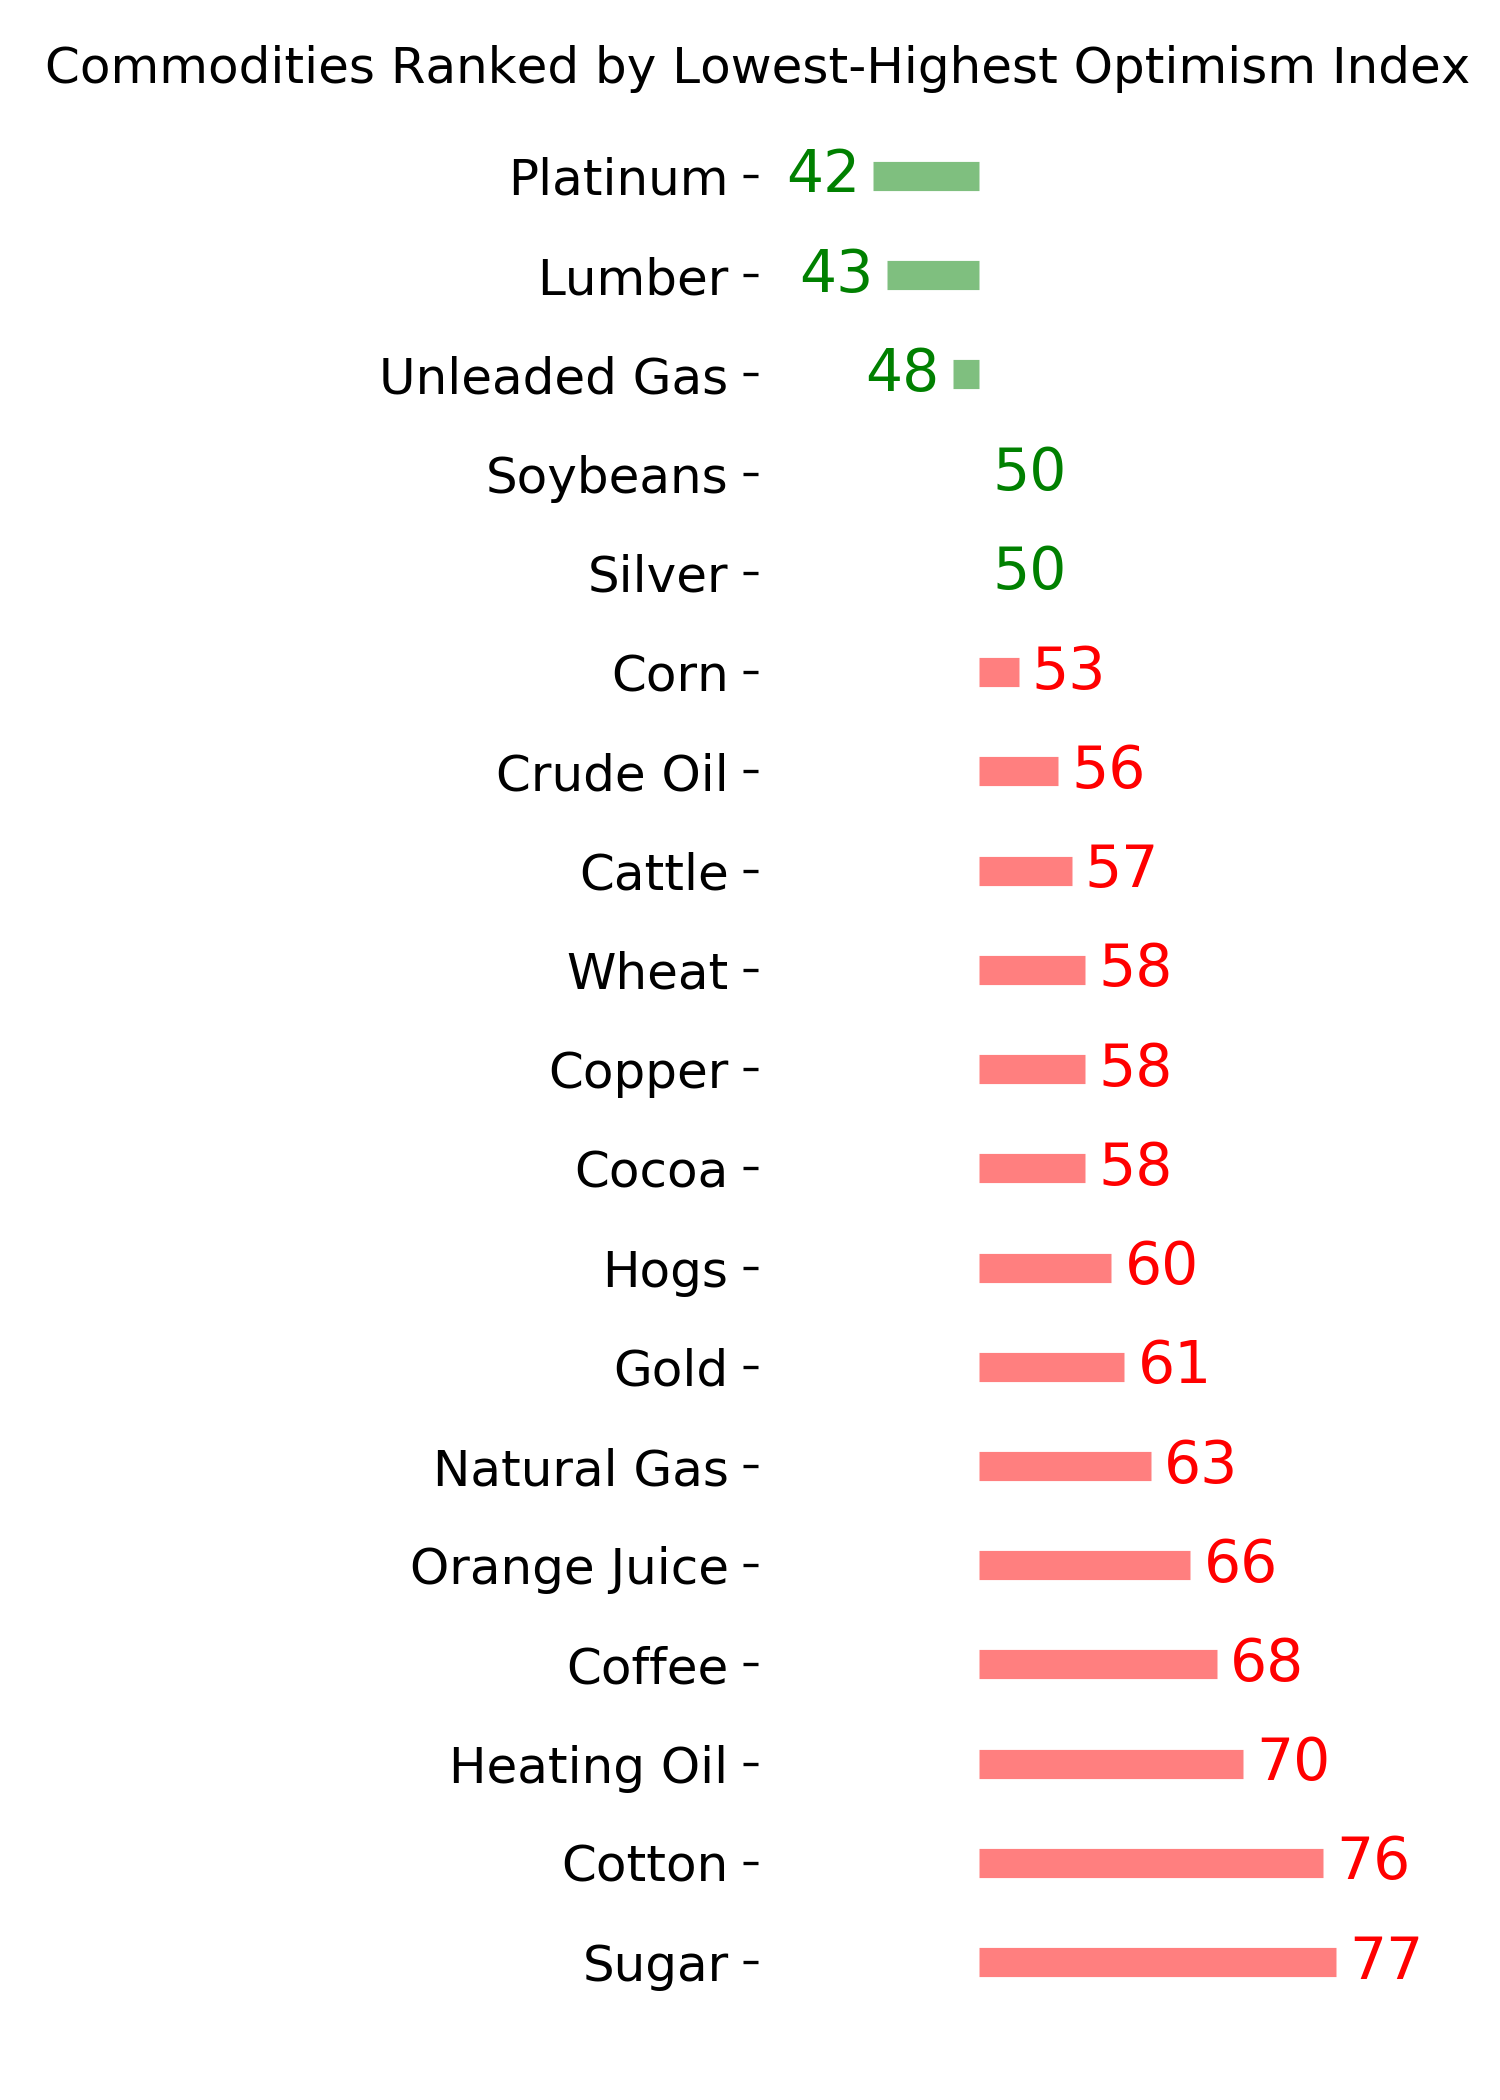
Commodity ETF's - 5-Day Moving Average
|
|