Headlines
|
|
Another Month, Another Record High:
September has the lowest probability of seeing a new high in stocks, and when the S&P 500 (and other indexes) close the month of August at an all-time high, short-term returns tended to be terrible.
Bottom Line:
STOCKS: Hold
Sentiment continues to decline from the speculative February peak. With deteriorating breadth, this raises the risk of poor short- to medium-term returns until optimism and better breadth returns. See the Outlook & Allocations page for more. BONDS: Hold
Various parts of the market got hit in March, with the lowest Bond Optimism Index we usually see during healthy environments. Bond prices have modest recovered and there is no edge among the data we follow. GOLD: Hold
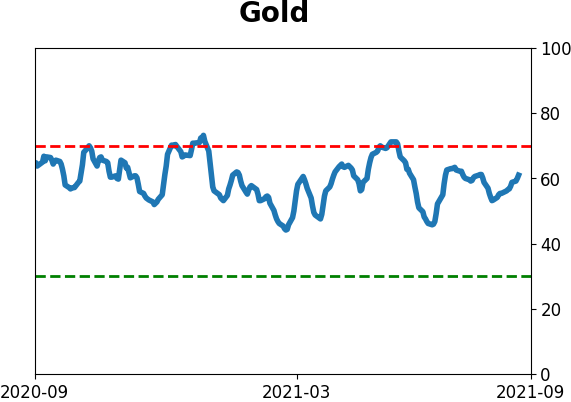
Gold and miners were rejected after trying to recover above their 200-day averages in May. Lately, some medium-term (not long-term) oversold extremes in breadth measures among miners have triggered.
|
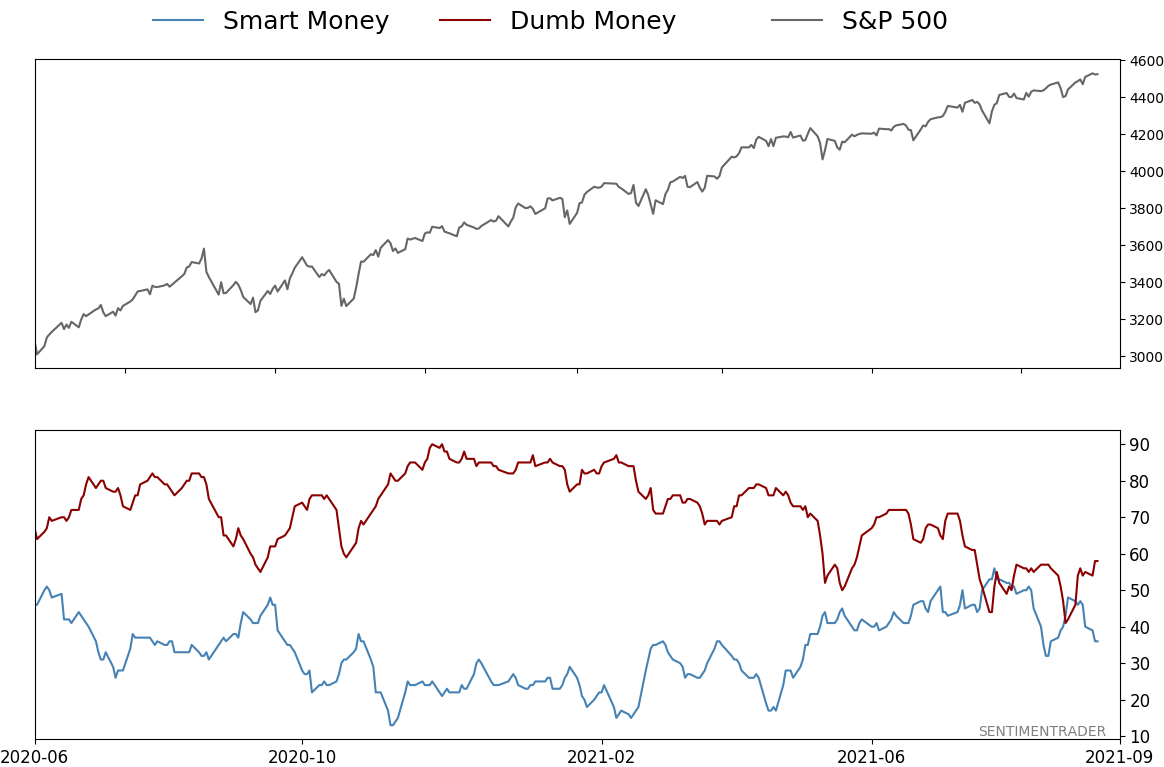
Smart / Dumb Money Confidence
|
Smart Money Confidence: 36%
Dumb Money Confidence: 58%
|
|
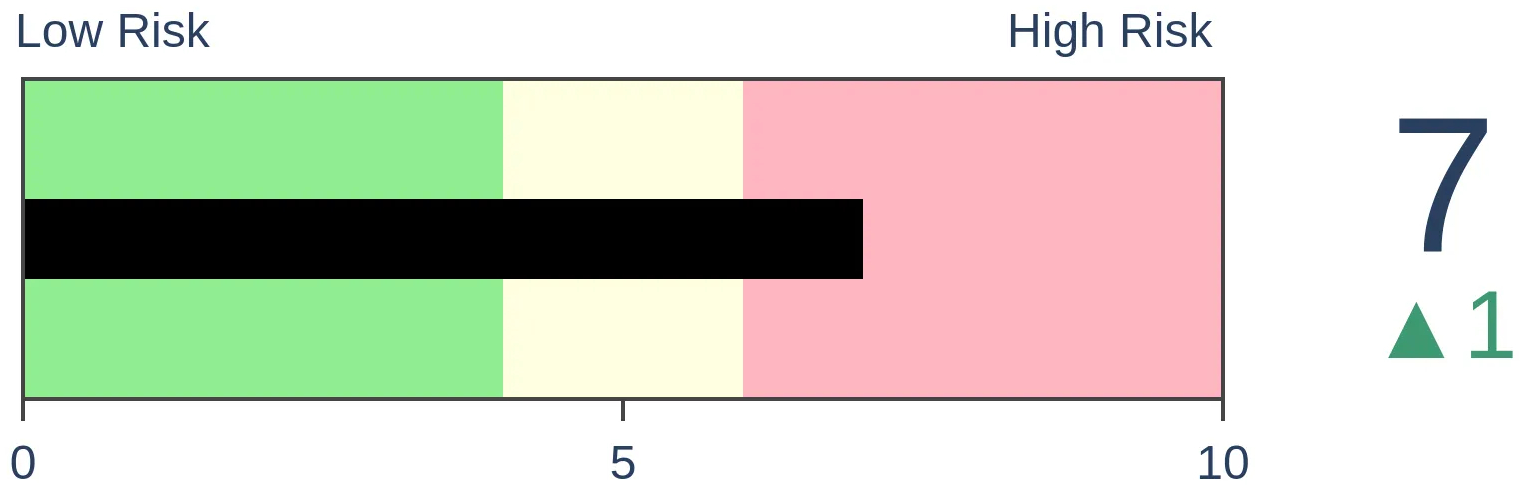
Risk Levels
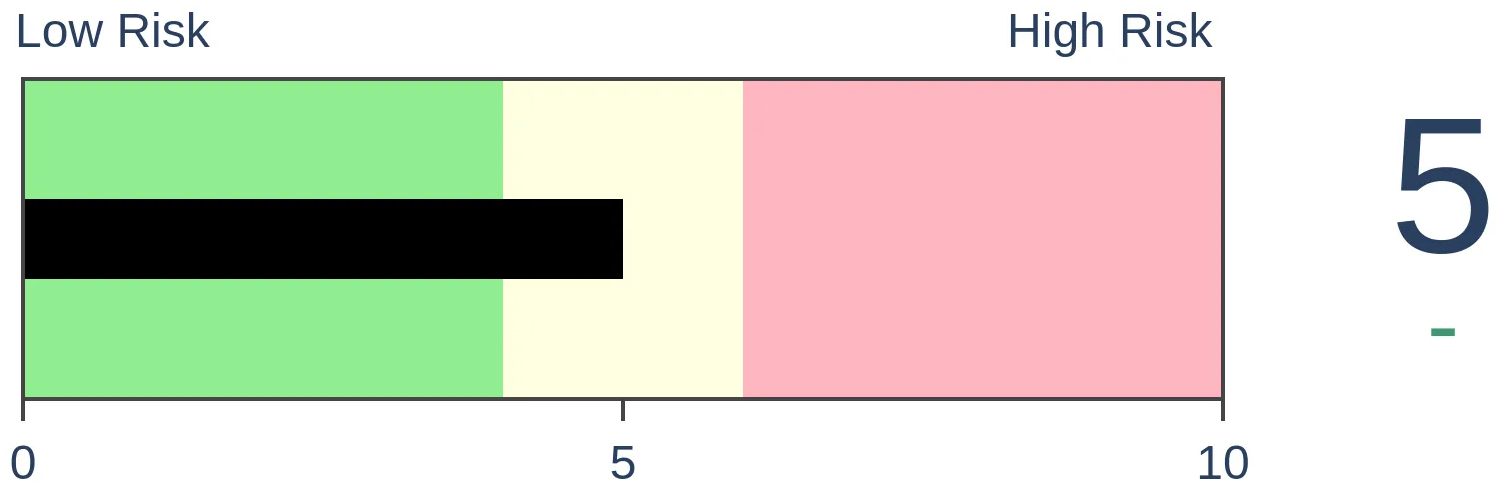
Stocks Short-Term
|
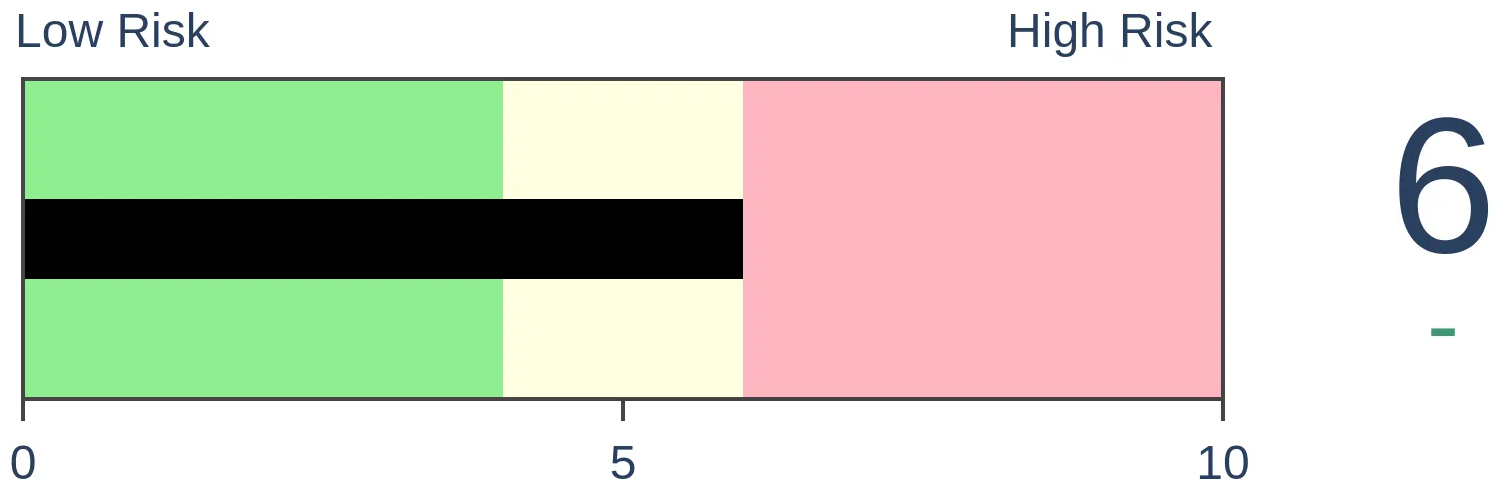
Stocks Medium-Term
|
|
Bonds
|
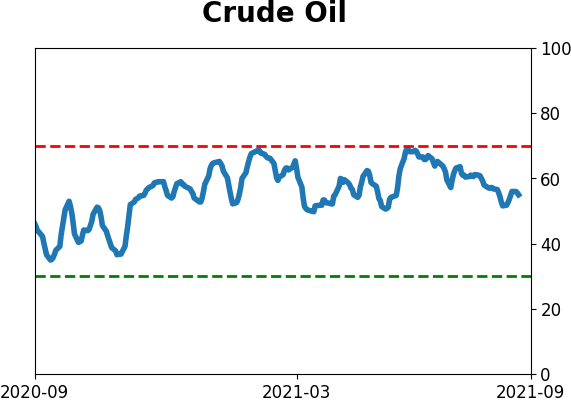
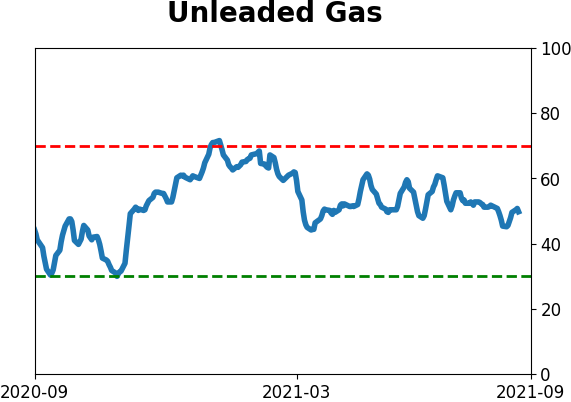
Crude Oil

|
|
Gold

|
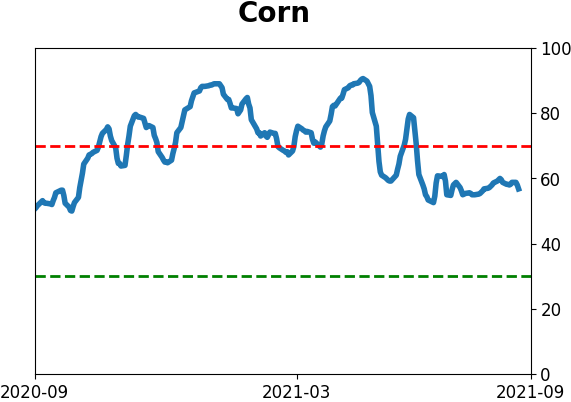
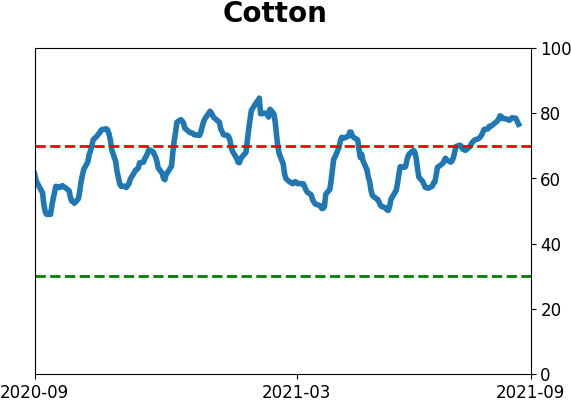
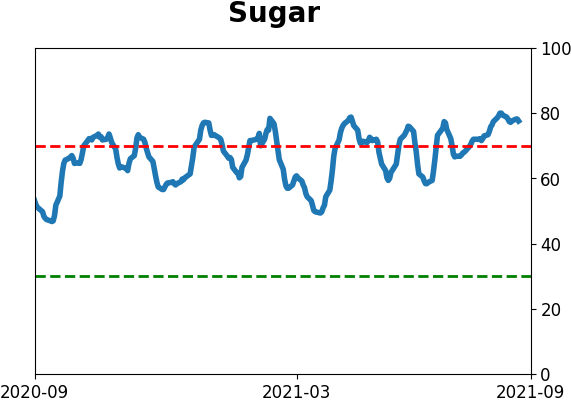
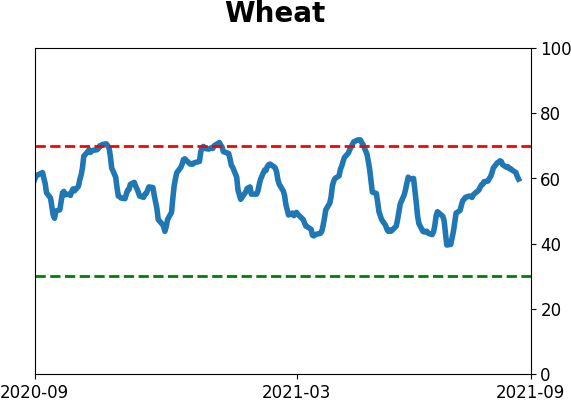
Agriculture
|
|
Research
By Jason Goepfert
BOTTOM LINE
September has the lowest probability of seeing a new high in stocks, and when the S&P 500 (and other indexes) close the month of August at an all-time high, short-term returns tended to be terrible.
FORECAST / TIMEFRAME
SPY -- Down, Short-Term
|
This year will go down in the history books as one of the best for investors. It already has in many respects, as we outlined two months ago. And it just keeps going.
September and October are well-known as being the most challenging for traders, as stocks have tended to see their worst returns and highest volatility. In a premium post yesterday, Jay showed that over the past 120 years, if an investor held the Dow Industrials only during September and October, their return would have been -74% (though it hasn't been nearly as bad since 2008).
It's relatively unusual for the S&P 500 to close at a record high in August. It would be even more unusual if it did it in September.
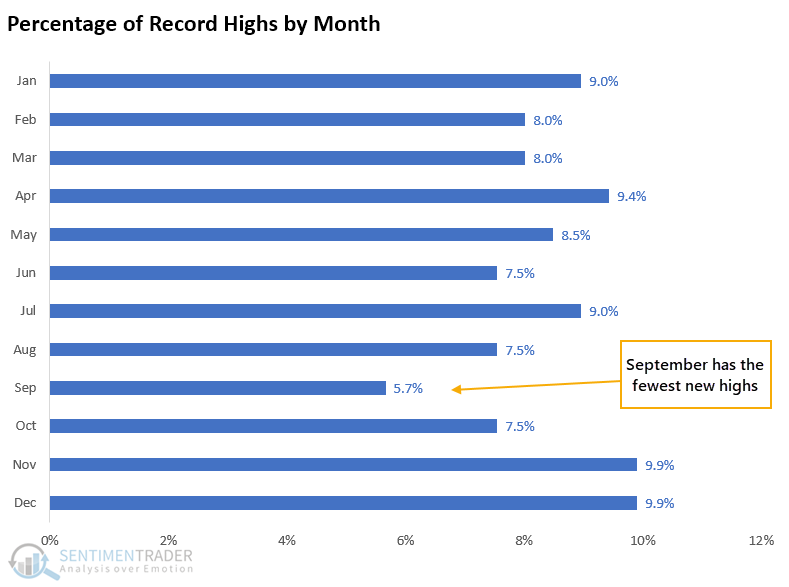
Since 1928, there have been 1,124 months, of which 212 closed at a record high. Out of those, only 12 occurred in September.
A SHORT-TERM WARNING
Stocks have rolled right over every possible negative in 2021, and seasonality is a tertiary factor anyway. So maybe we need to take the following table with a big grain of salt. It shows returns in the S&P 500 after it closes the month of August at an all-time high, and it's a sea of red.
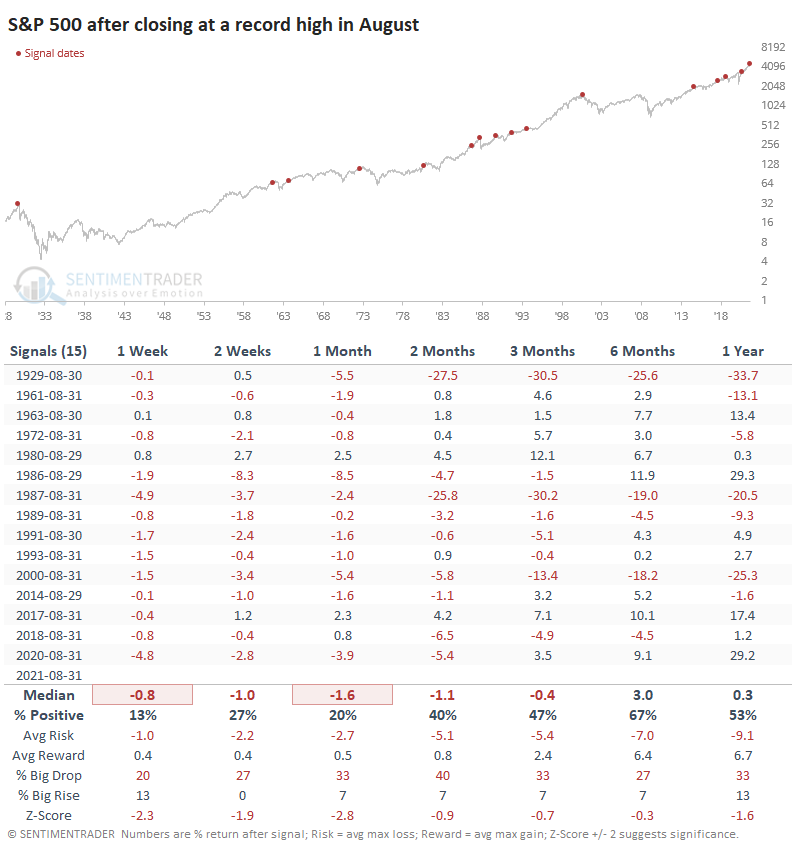
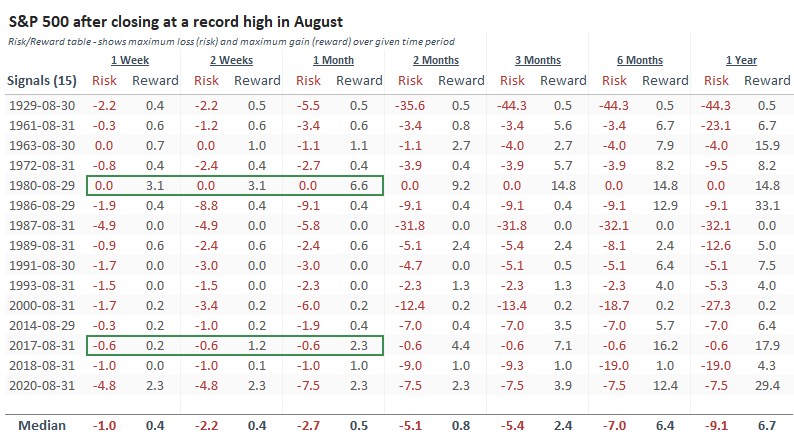
Even though by definition, momentum was strong, the S&P had an incredibly hard time holding onto its gains over the next month. Most remarkably, the Risk/Reward Table shows that only two signals saw more reward than risk during the next month.
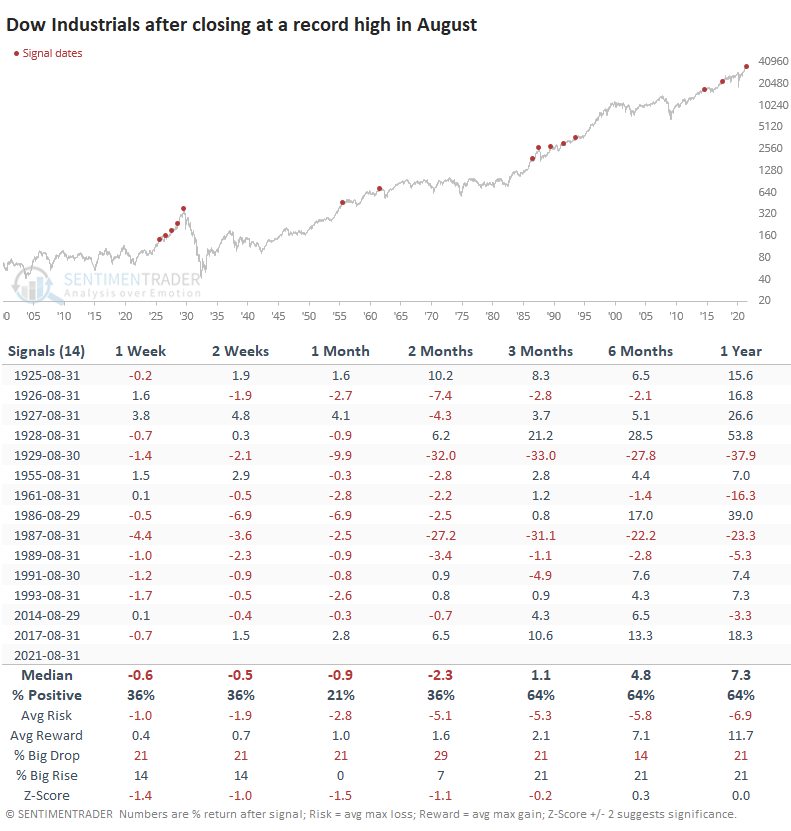
THE S&P WAS THE WORST
Looking at the other major indexes, the Dow Industrials also closed August at an all-time high. It, too, had a strong tendency to see some backing-and-filling over the next month or so, with an extremely poor risk/reward ratio up to two months later.
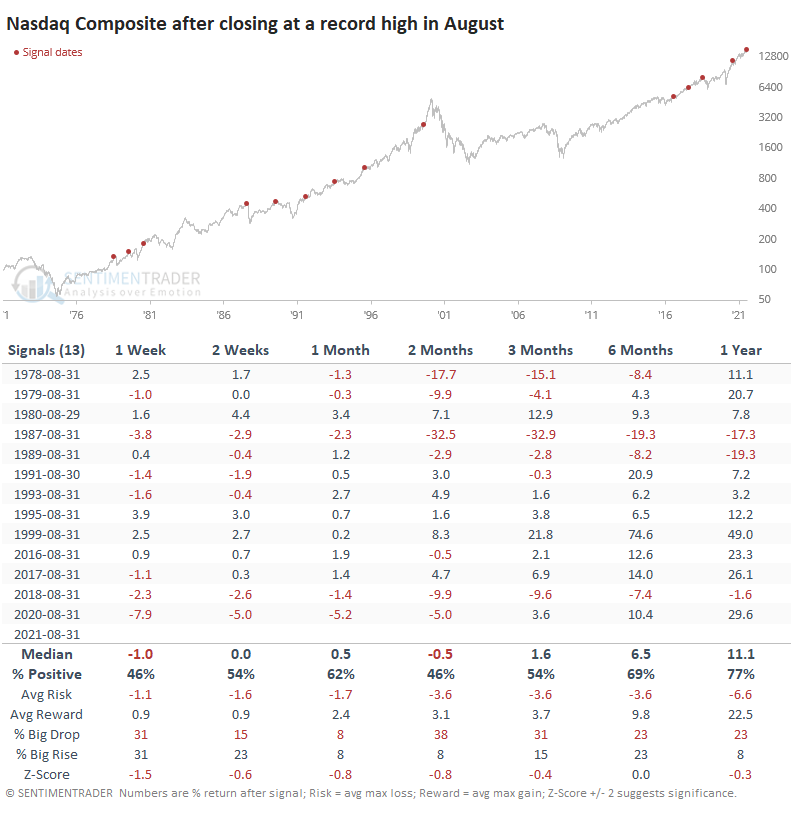
The Nasdaq Composite often does its own thing, and we can see from the table below that it had less of a tendency to see weakness after a new high in August. The last two signals saw a wicked pullback for traders, for what that's worth.
This has been a historic year for momentum in stocks, and when it is high-quality, momentum usually rolls over every other factor until it stops for whatever random reason. There is zero evidence that's going to be the case any time soon. Breadth has been questionable, which puts a dent in the "high-quality momentum" argument, but then there was an incredibly impressive thrust last week, so maybe that's moot. Buyers have been able to make doubters look like fools in 2021, and based on September's tendency, they have their work cut out for them again.
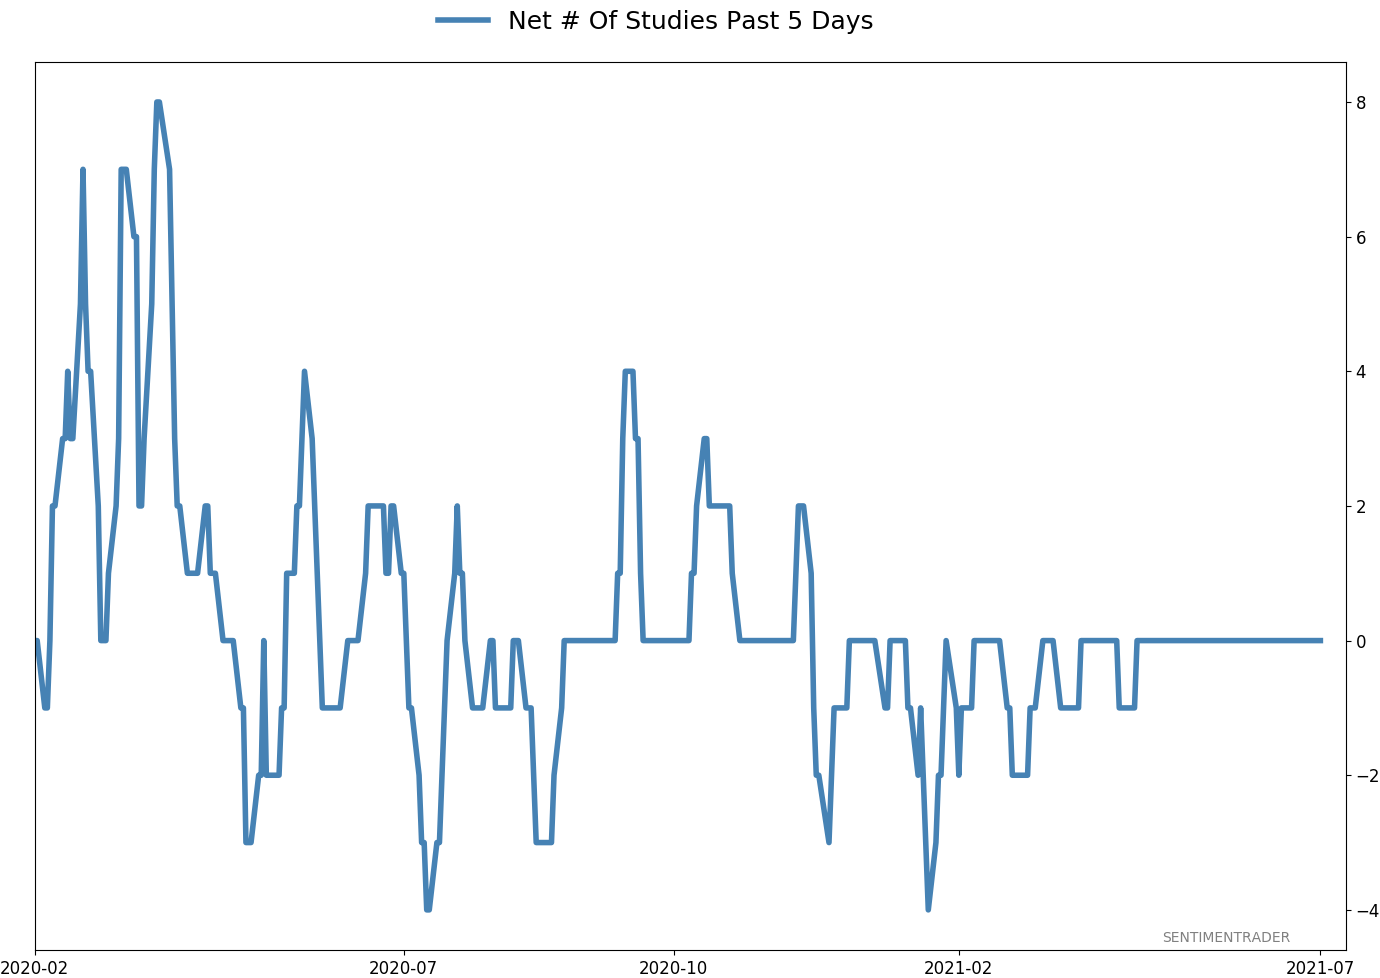
Active Studies
| Time Frame | Bullish | Bearish | | Short-Term | 0 | 6 | | Medium-Term | 5 | 3 | | Long-Term | 11 | 5 |
|
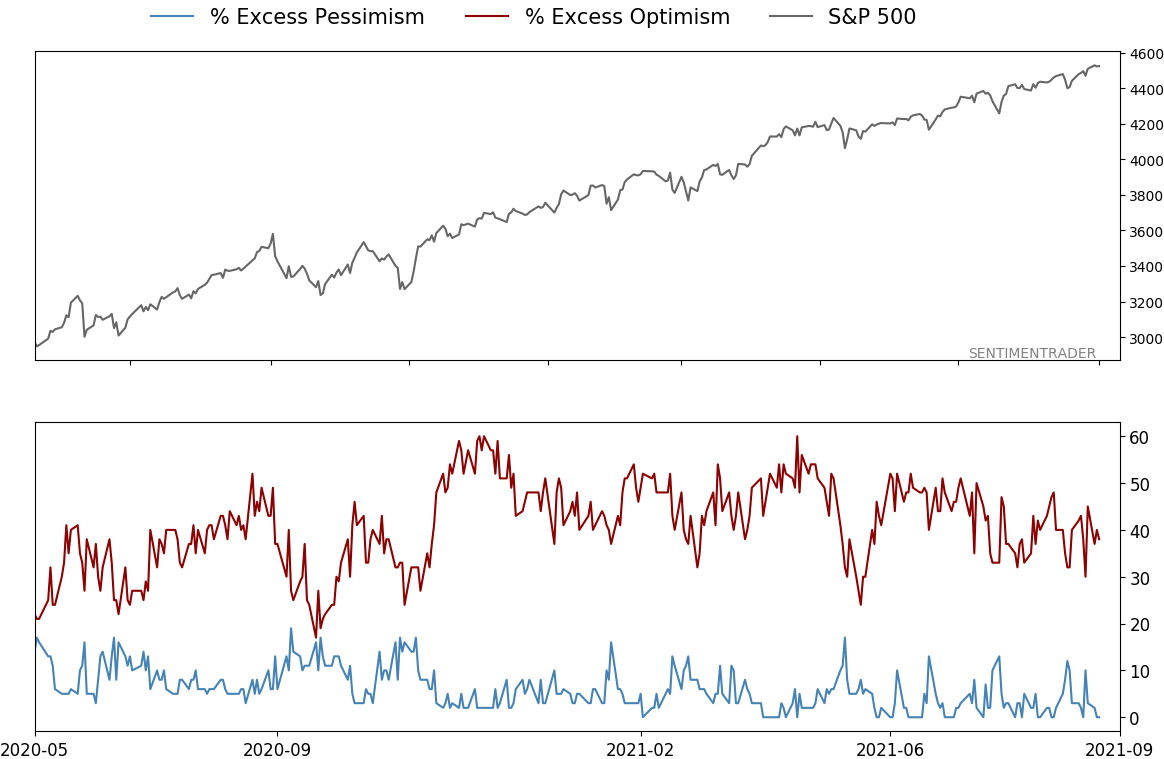
Indicators at Extremes
|
% Showing Pessimism: 0%
Bullish for Stocks
|
|
Portfolio
| Position | Description | Weight % | Added / Reduced | Date | | Stocks | RSP | 4.1 | Added 4.1% | 2021-05-19 | | Bonds | 23.9% BND, 6.9% SCHP | 30.7 | Reduced 7.1% | 2021-05-19 | | Commodities | GCC | 2.6 | Reduced 2.1%
| 2020-09-04 | | Precious Metals | GDX | 5.6 | Reduced 4.2% | 2021-05-19 | | Special Situations | 4.3% XLE, 2.2% PSCE | 7.6 | Reduced 5.6% | 2021-04-22 | | Cash | | 49.4 | | |
|
Updates (Changes made today are underlined)
Much of our momentum and trend work has remained positive for several months, with some scattered exceptions. Almost all sentiment-related work has shown a poor risk/reward ratio for stocks, especially as speculation drove to record highs in exuberance in February. Much of that has worn off, and most of our models are back toward neutral levels. There isn't much to be excited about here. The same goes for bonds and even gold. Gold has been performing well lately and is back above long-term trend lines. The issue is that it has a poor record of holding onto gains when attempting a long-term trend change like this, so we'll take a wait-and-see approach. RETURN YTD: 8.5% 2020: 8.1%, 2019: 12.6%, 2018: 0.6%, 2017: 3.8%, 2016: 17.1%, 2015: 9.2%, 2014: 14.5%, 2013: 2.2%, 2012: 10.8%, 2011: 16.5%, 2010: 15.3%, 2009: 23.9%, 2008: 16.2%, 2007: 7.8%
|
|
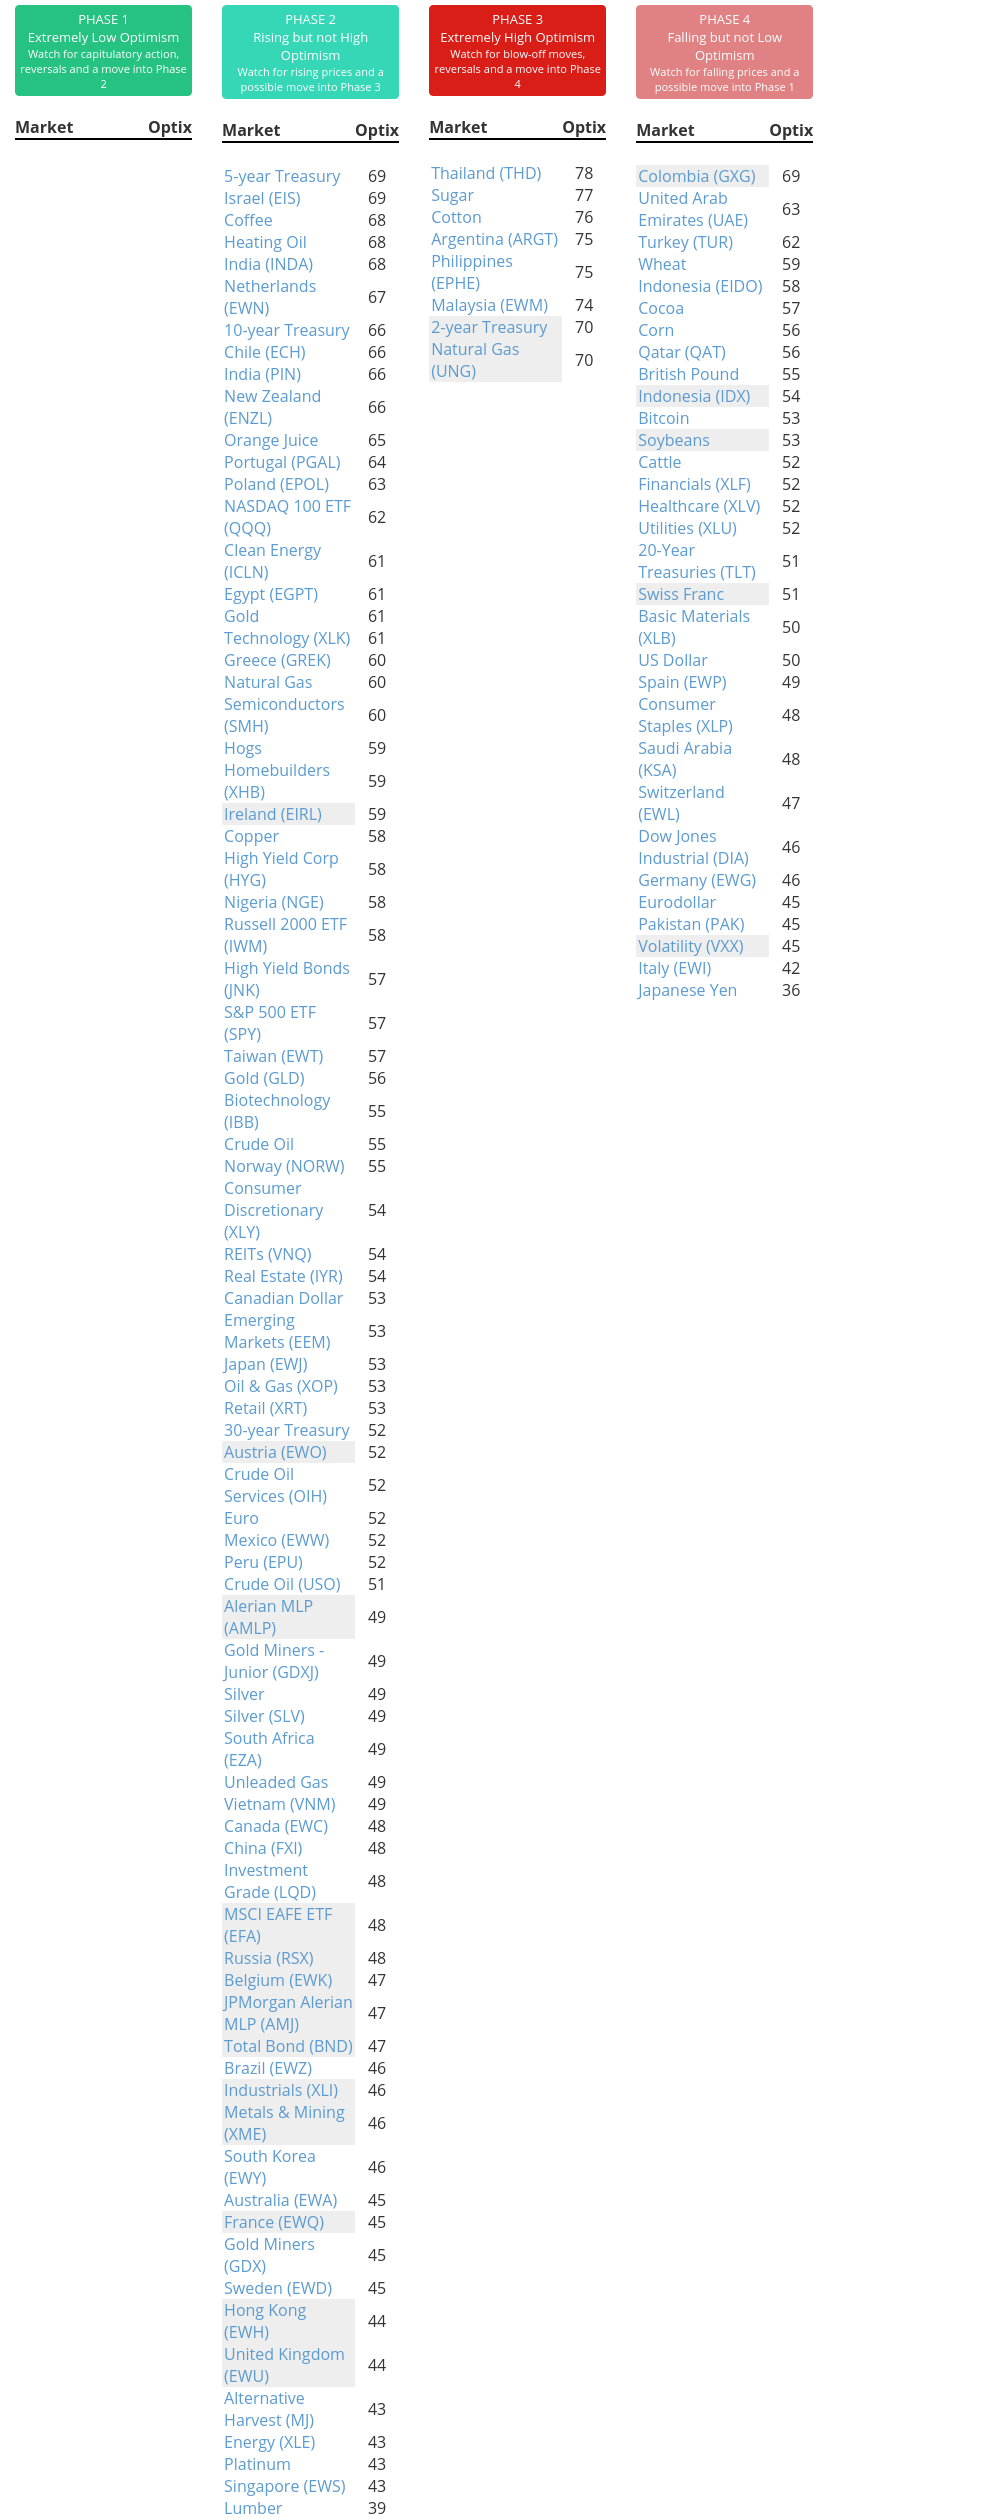
Phase Table
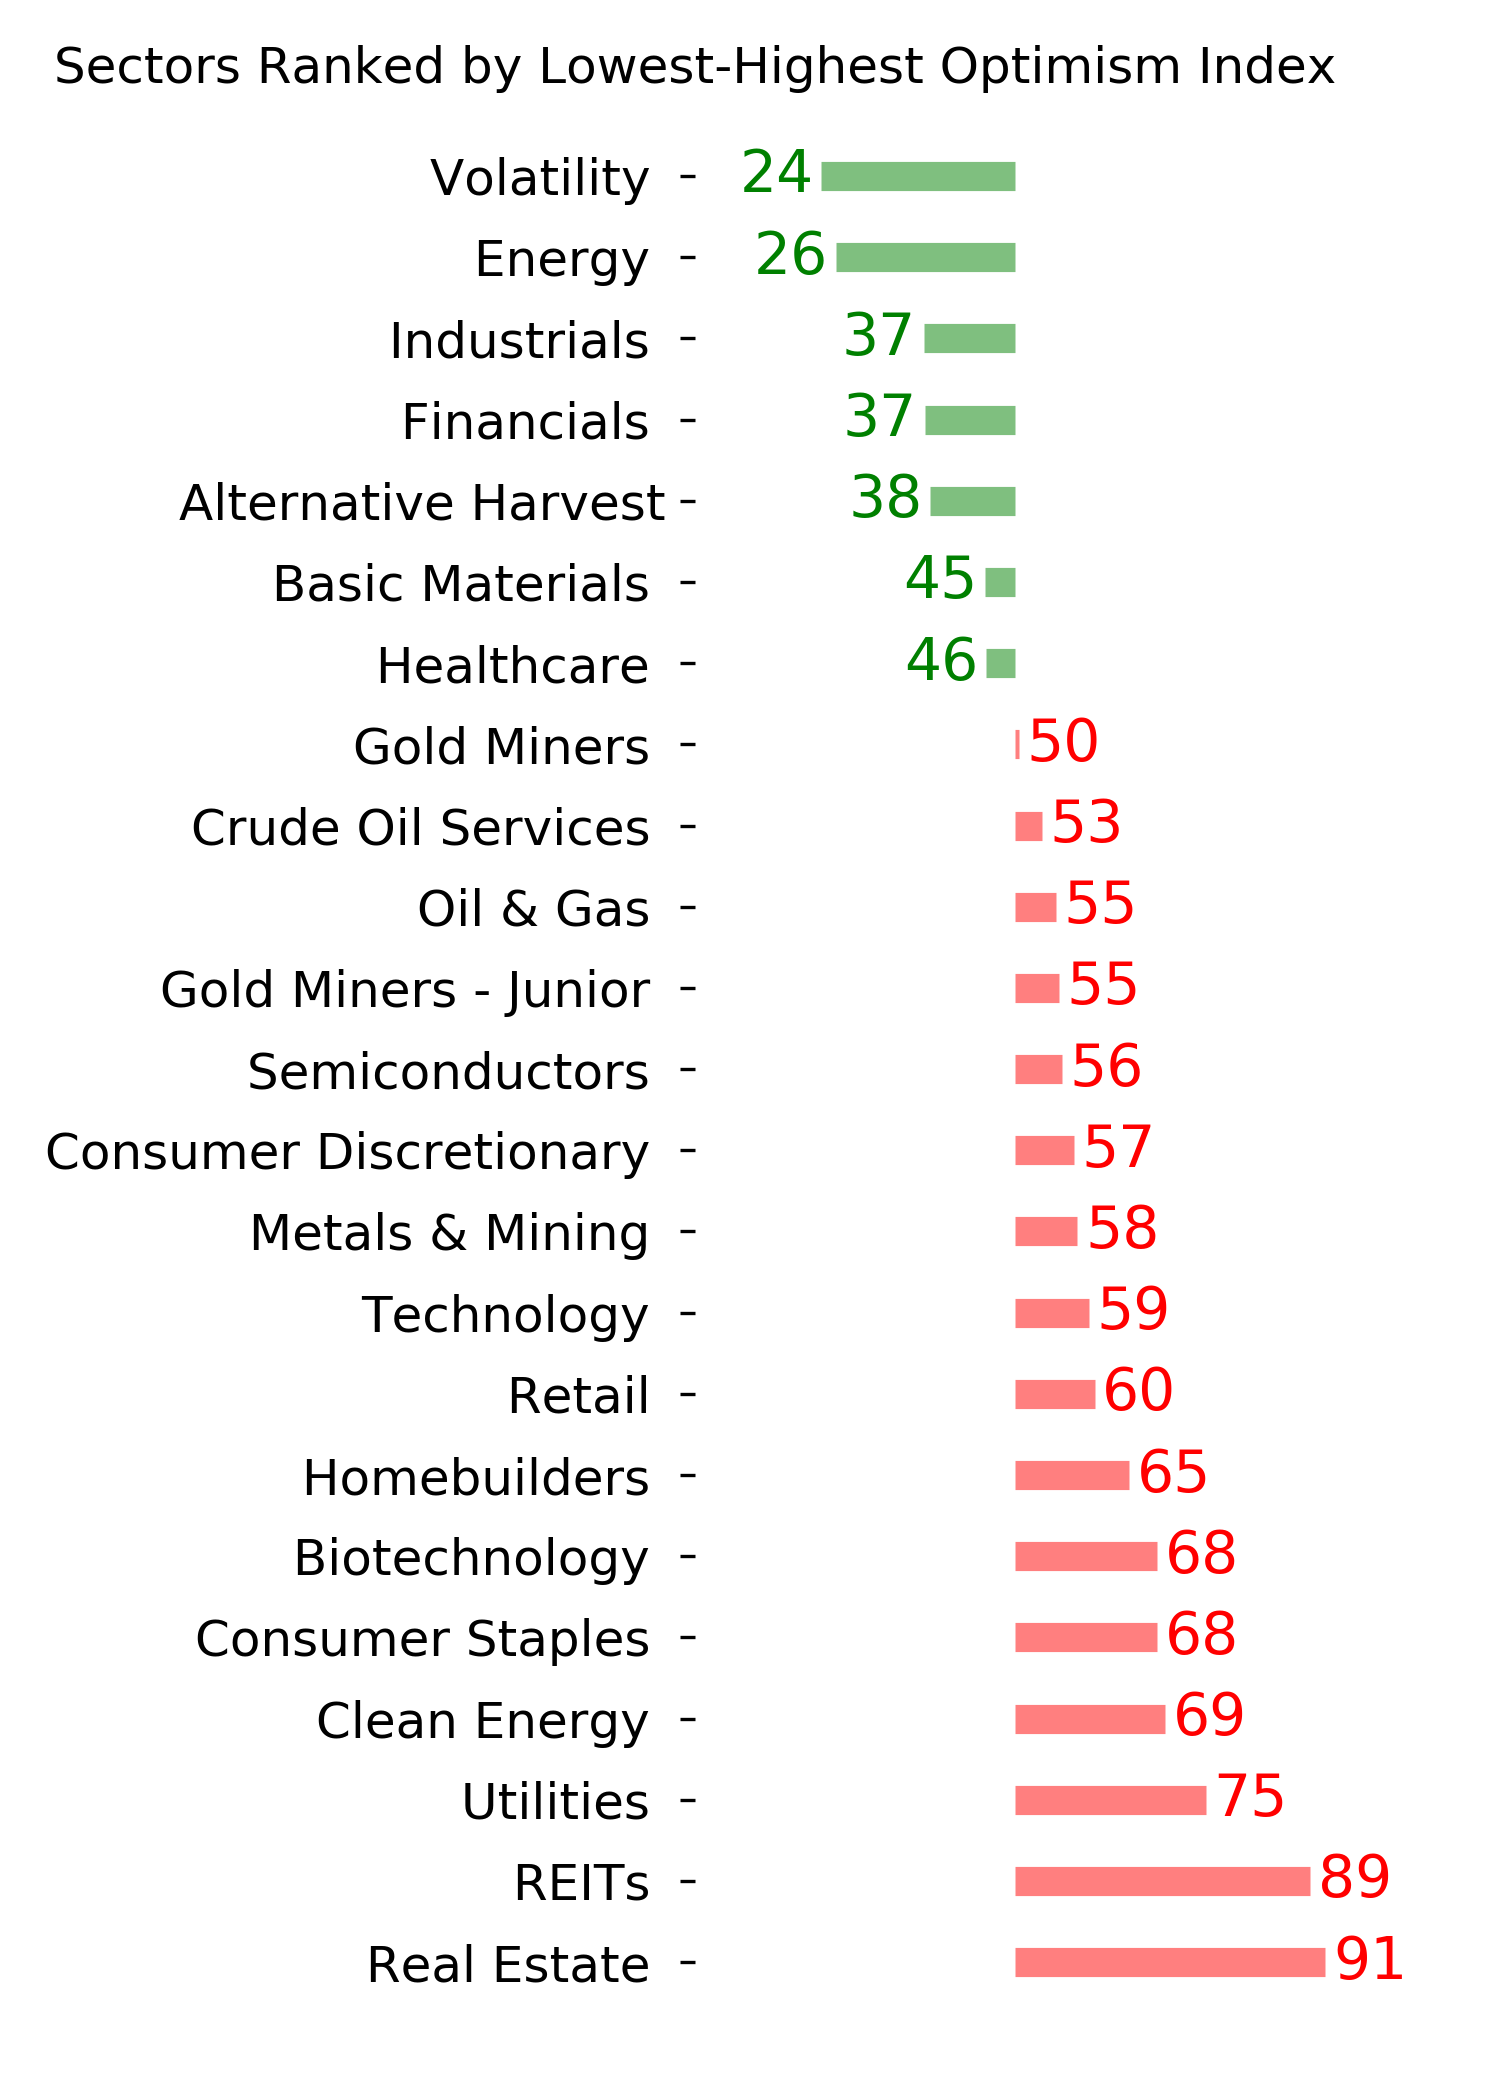
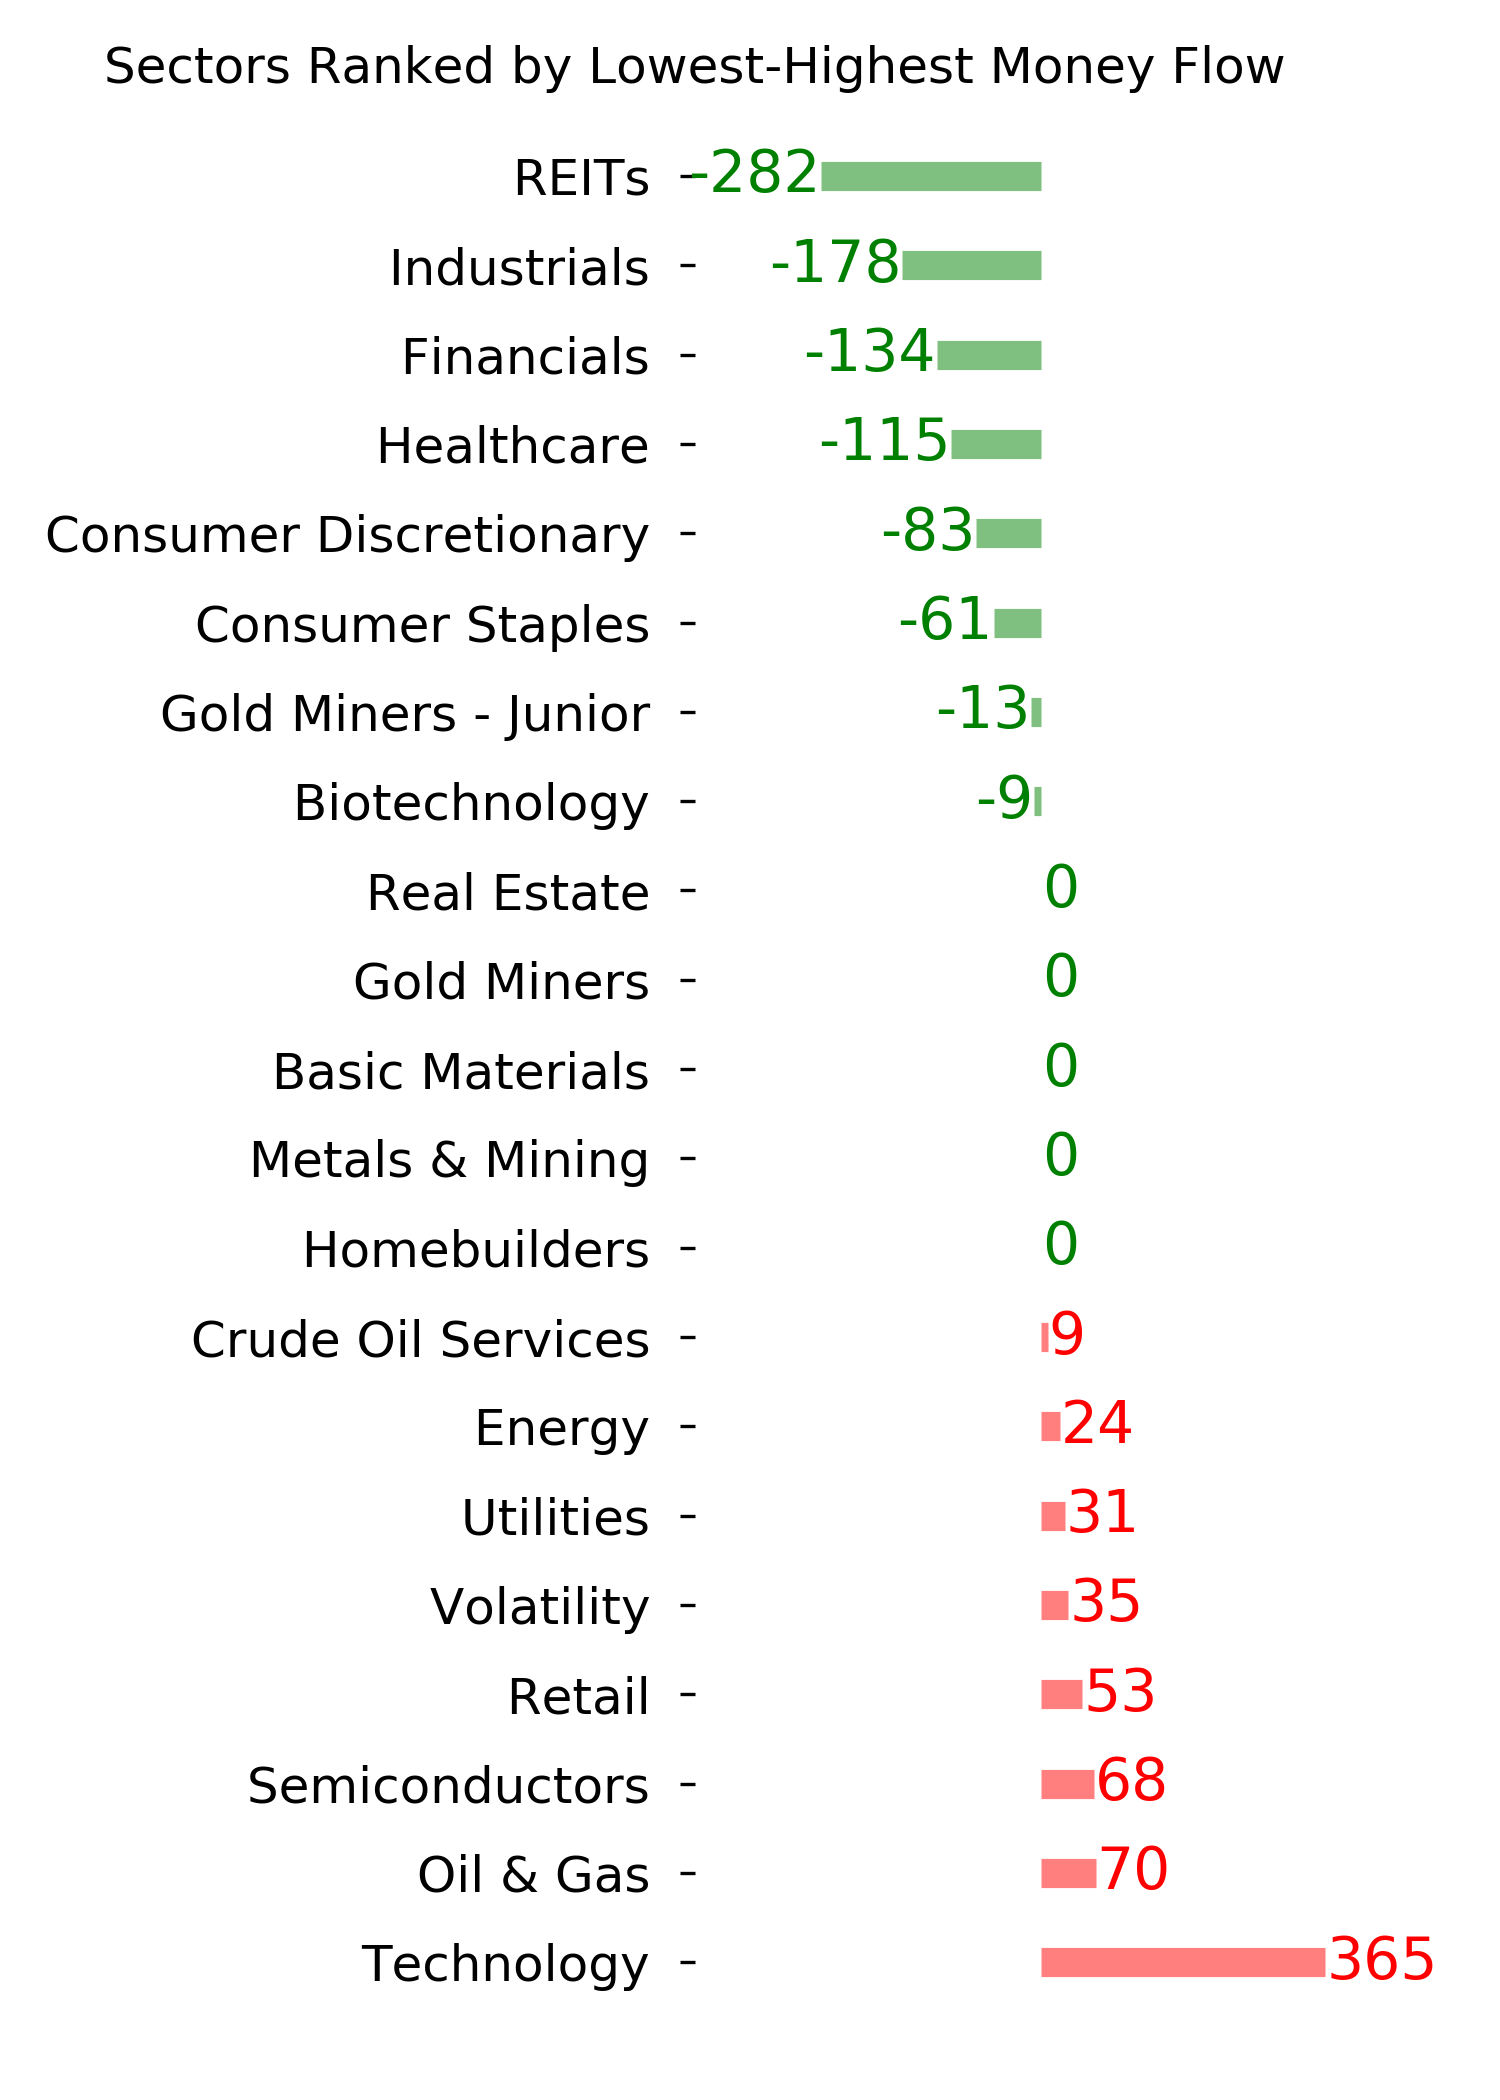
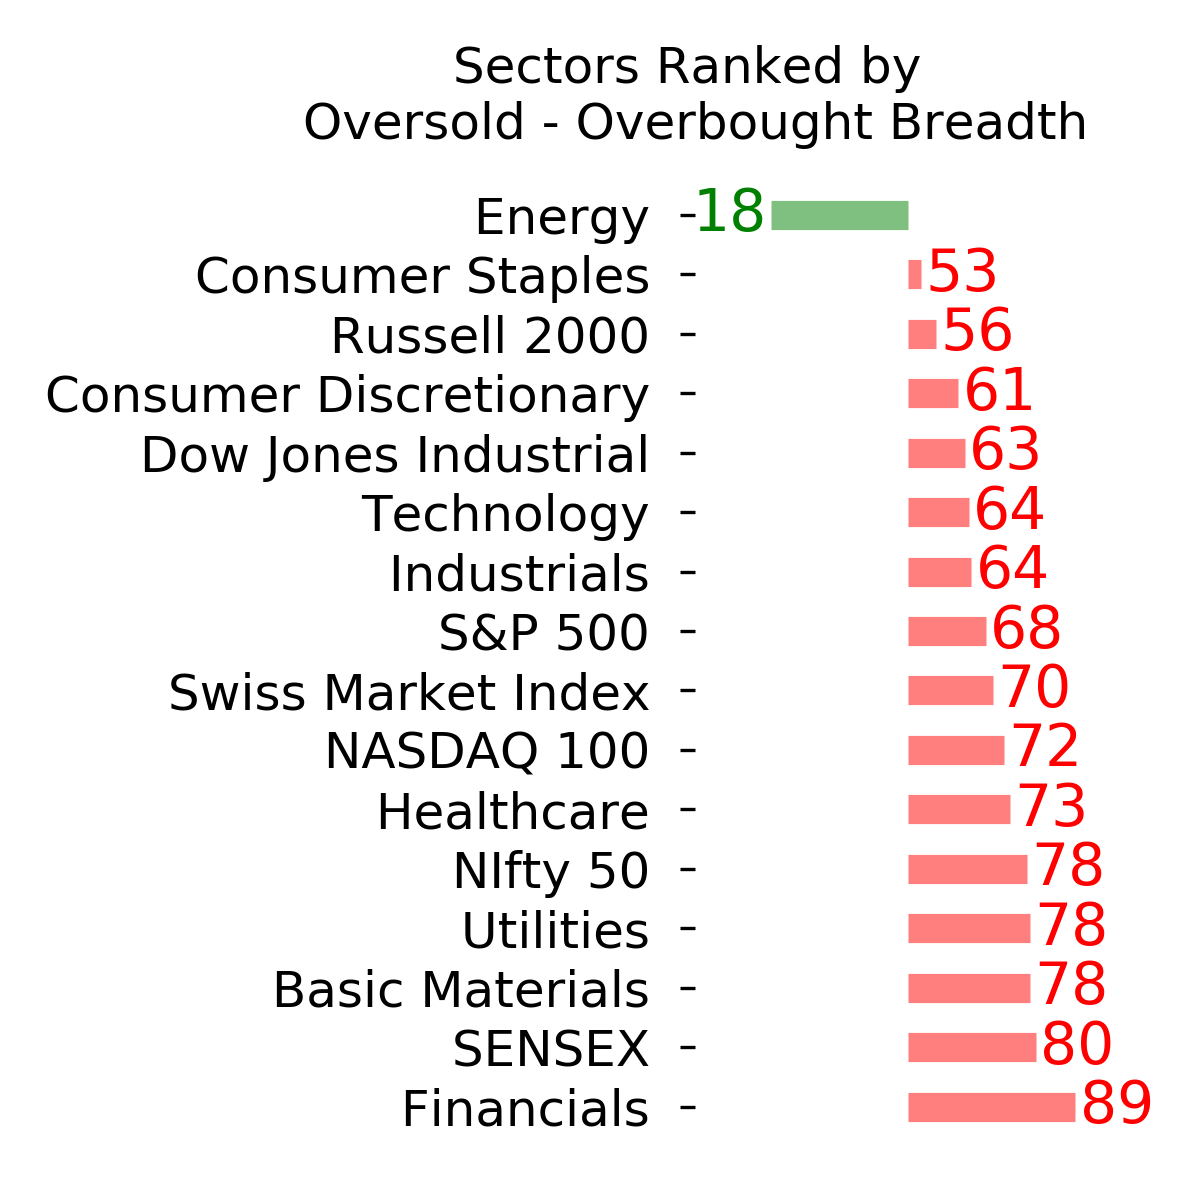
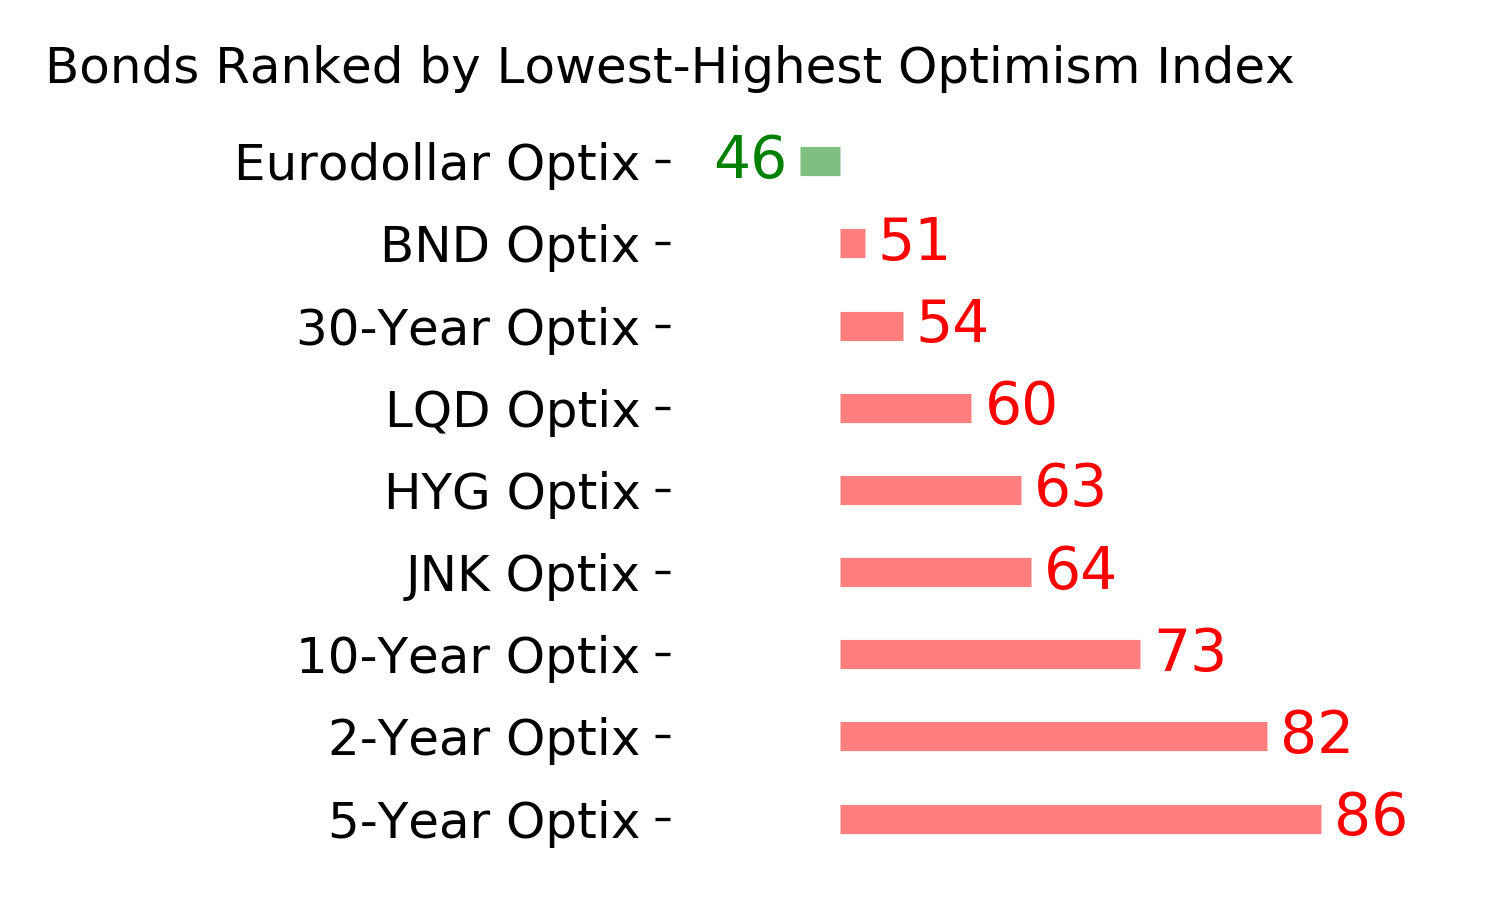
Ranks
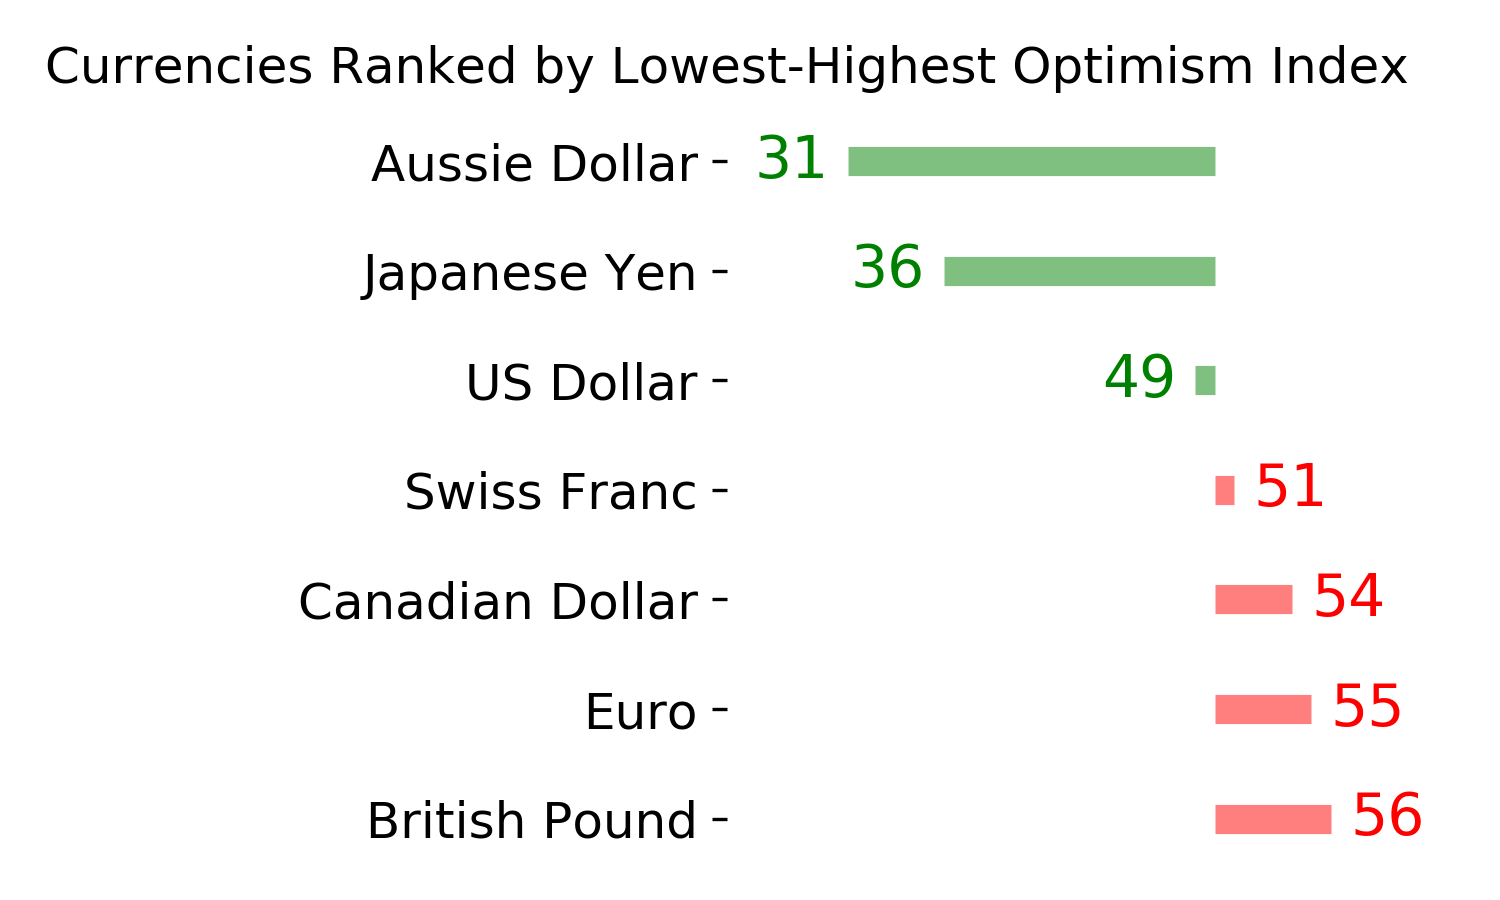
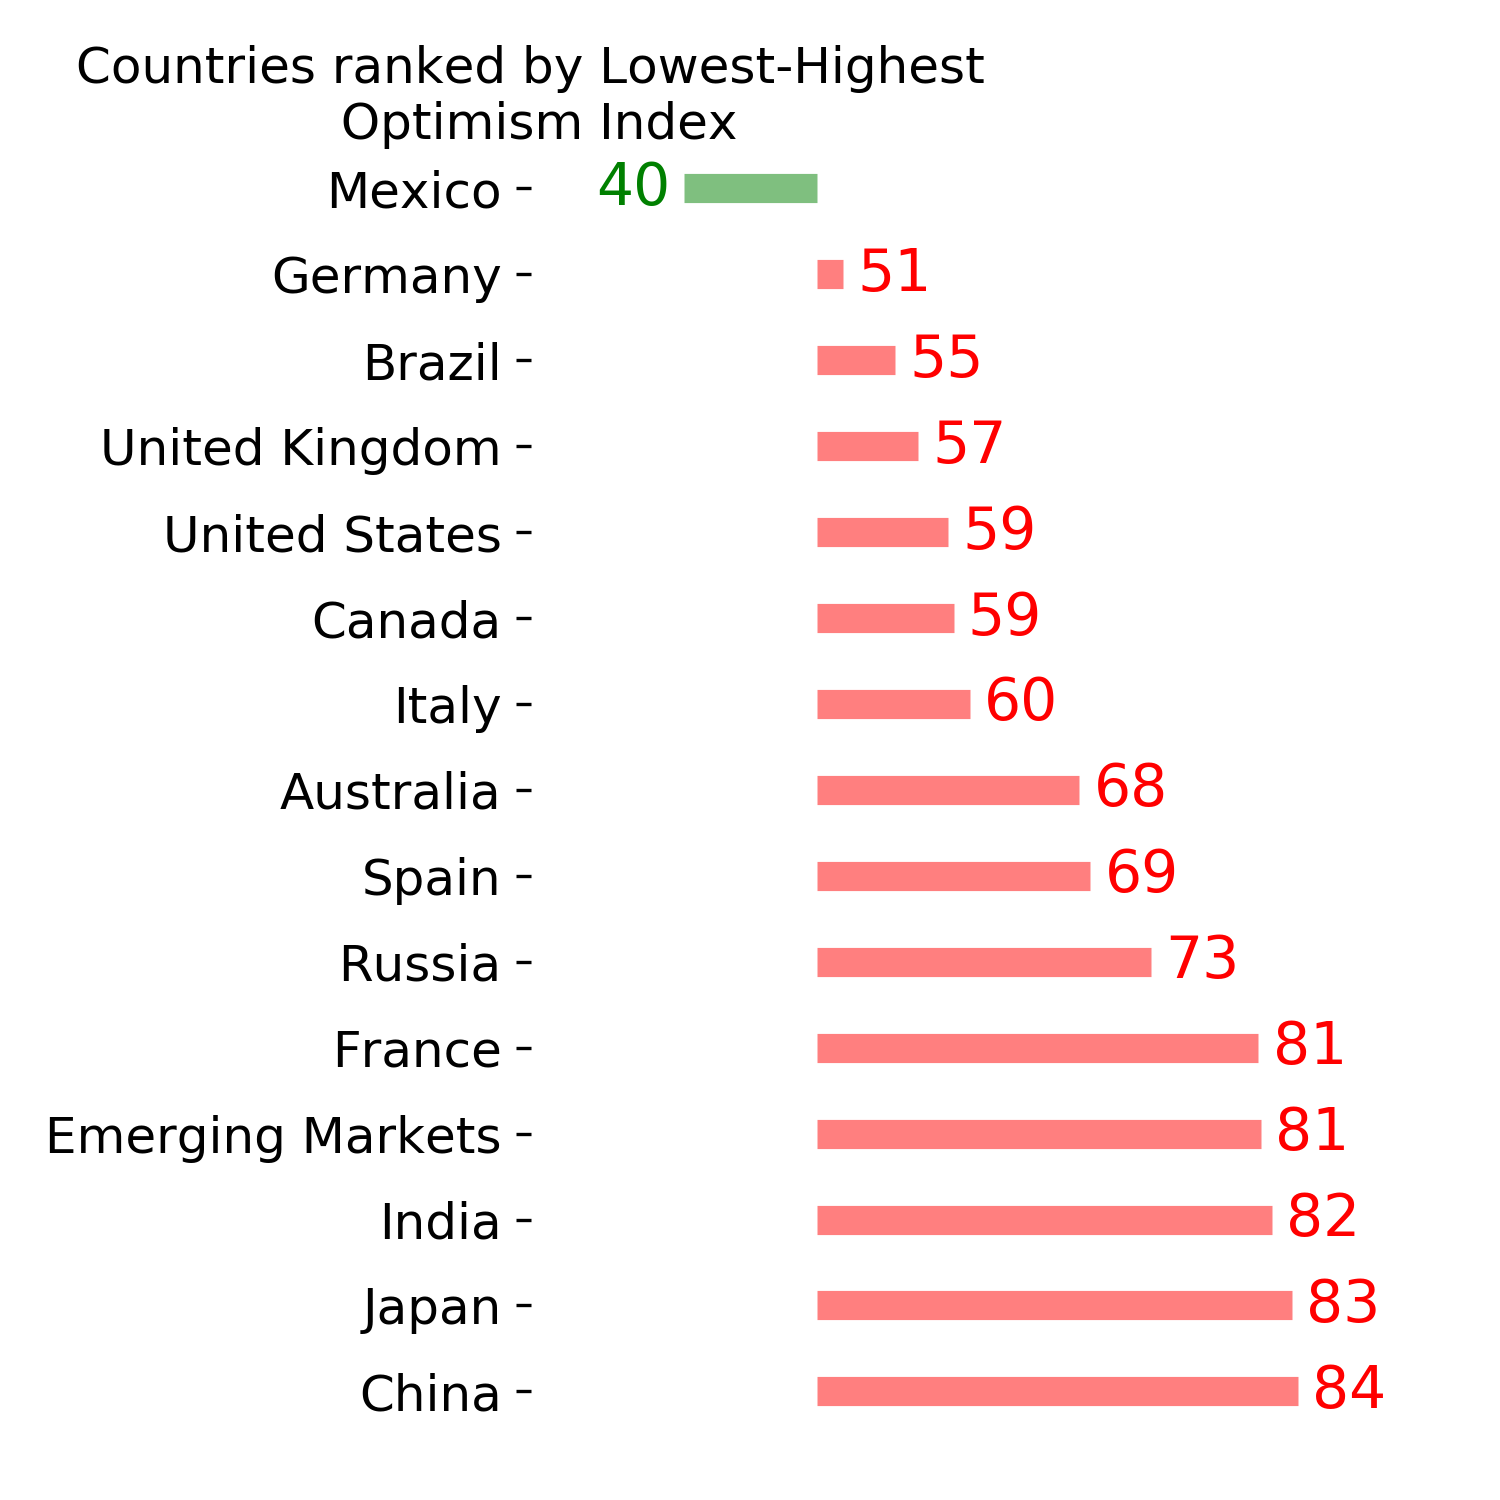
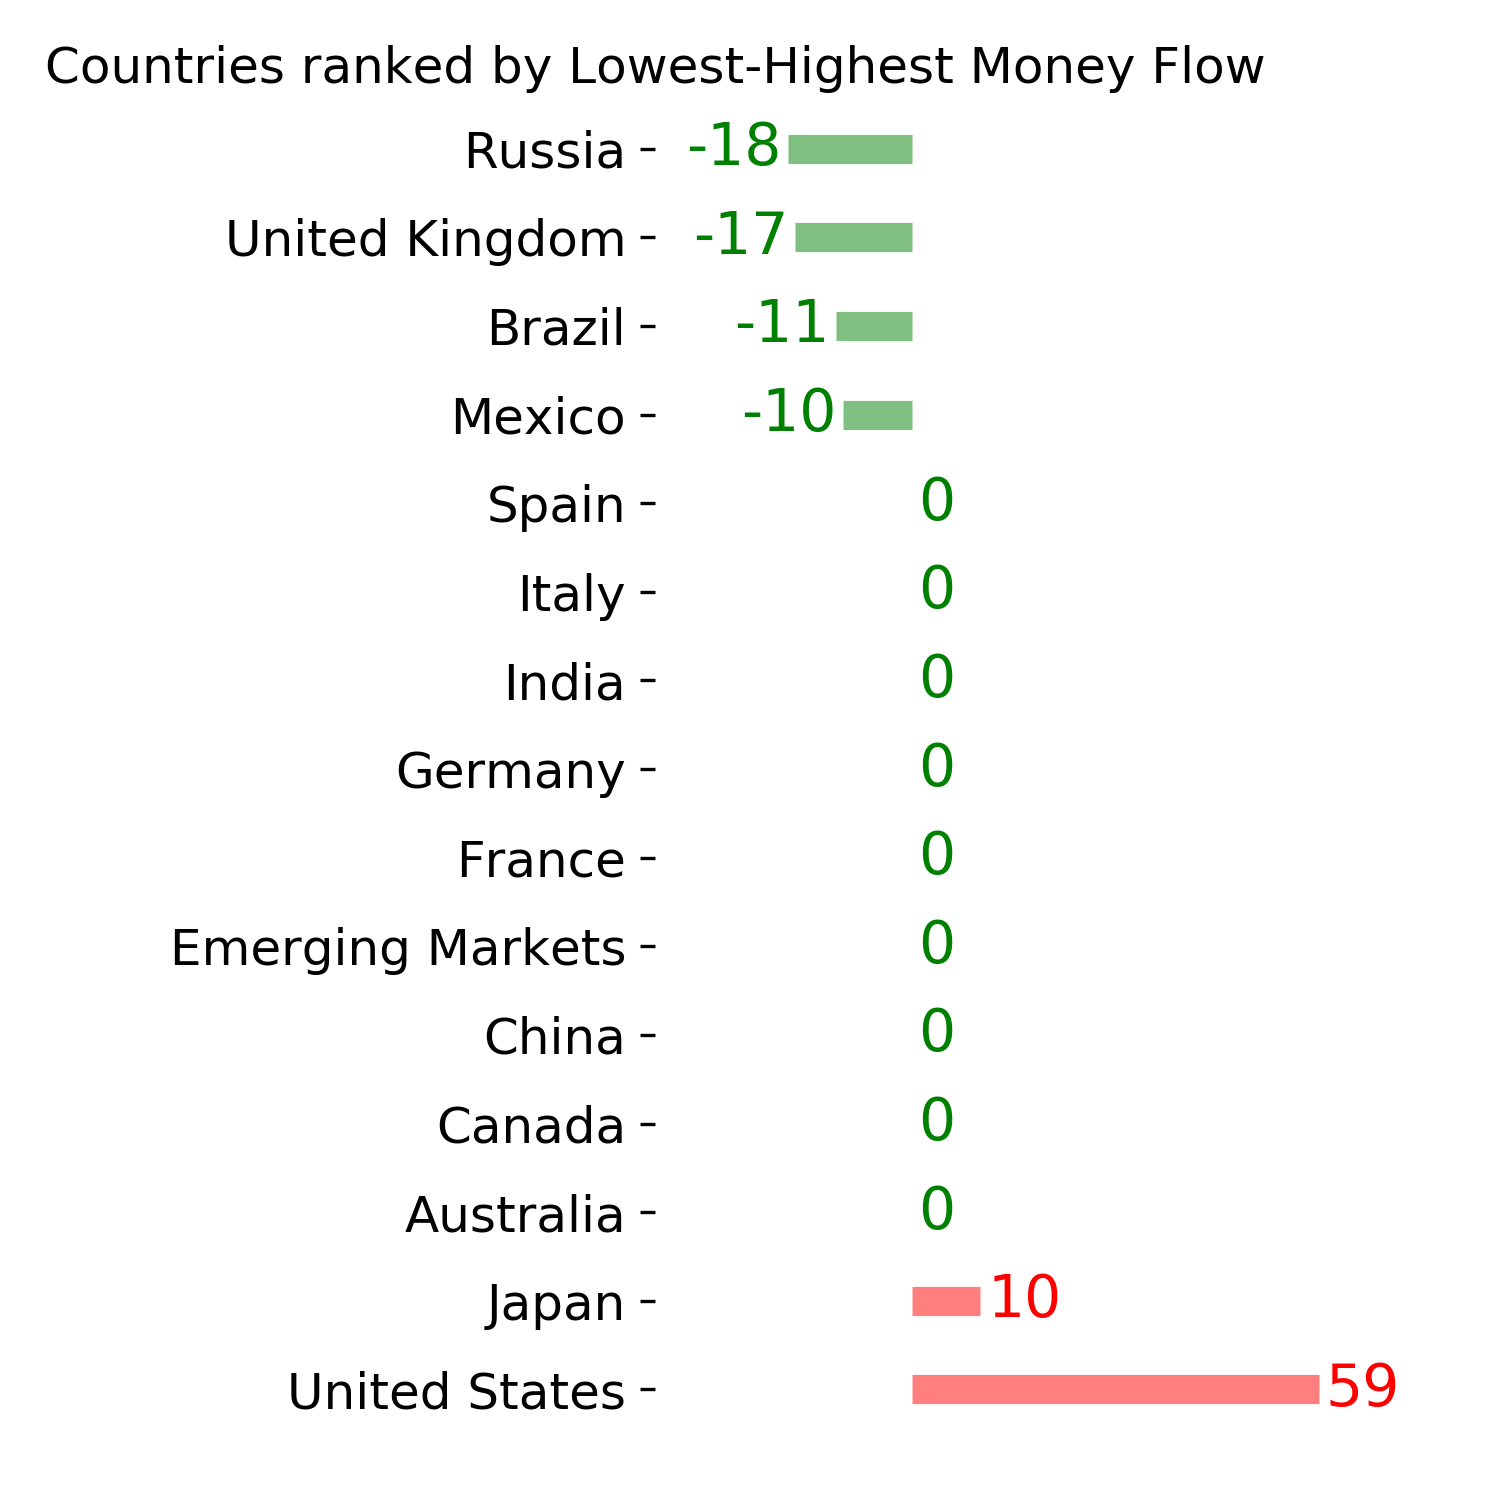
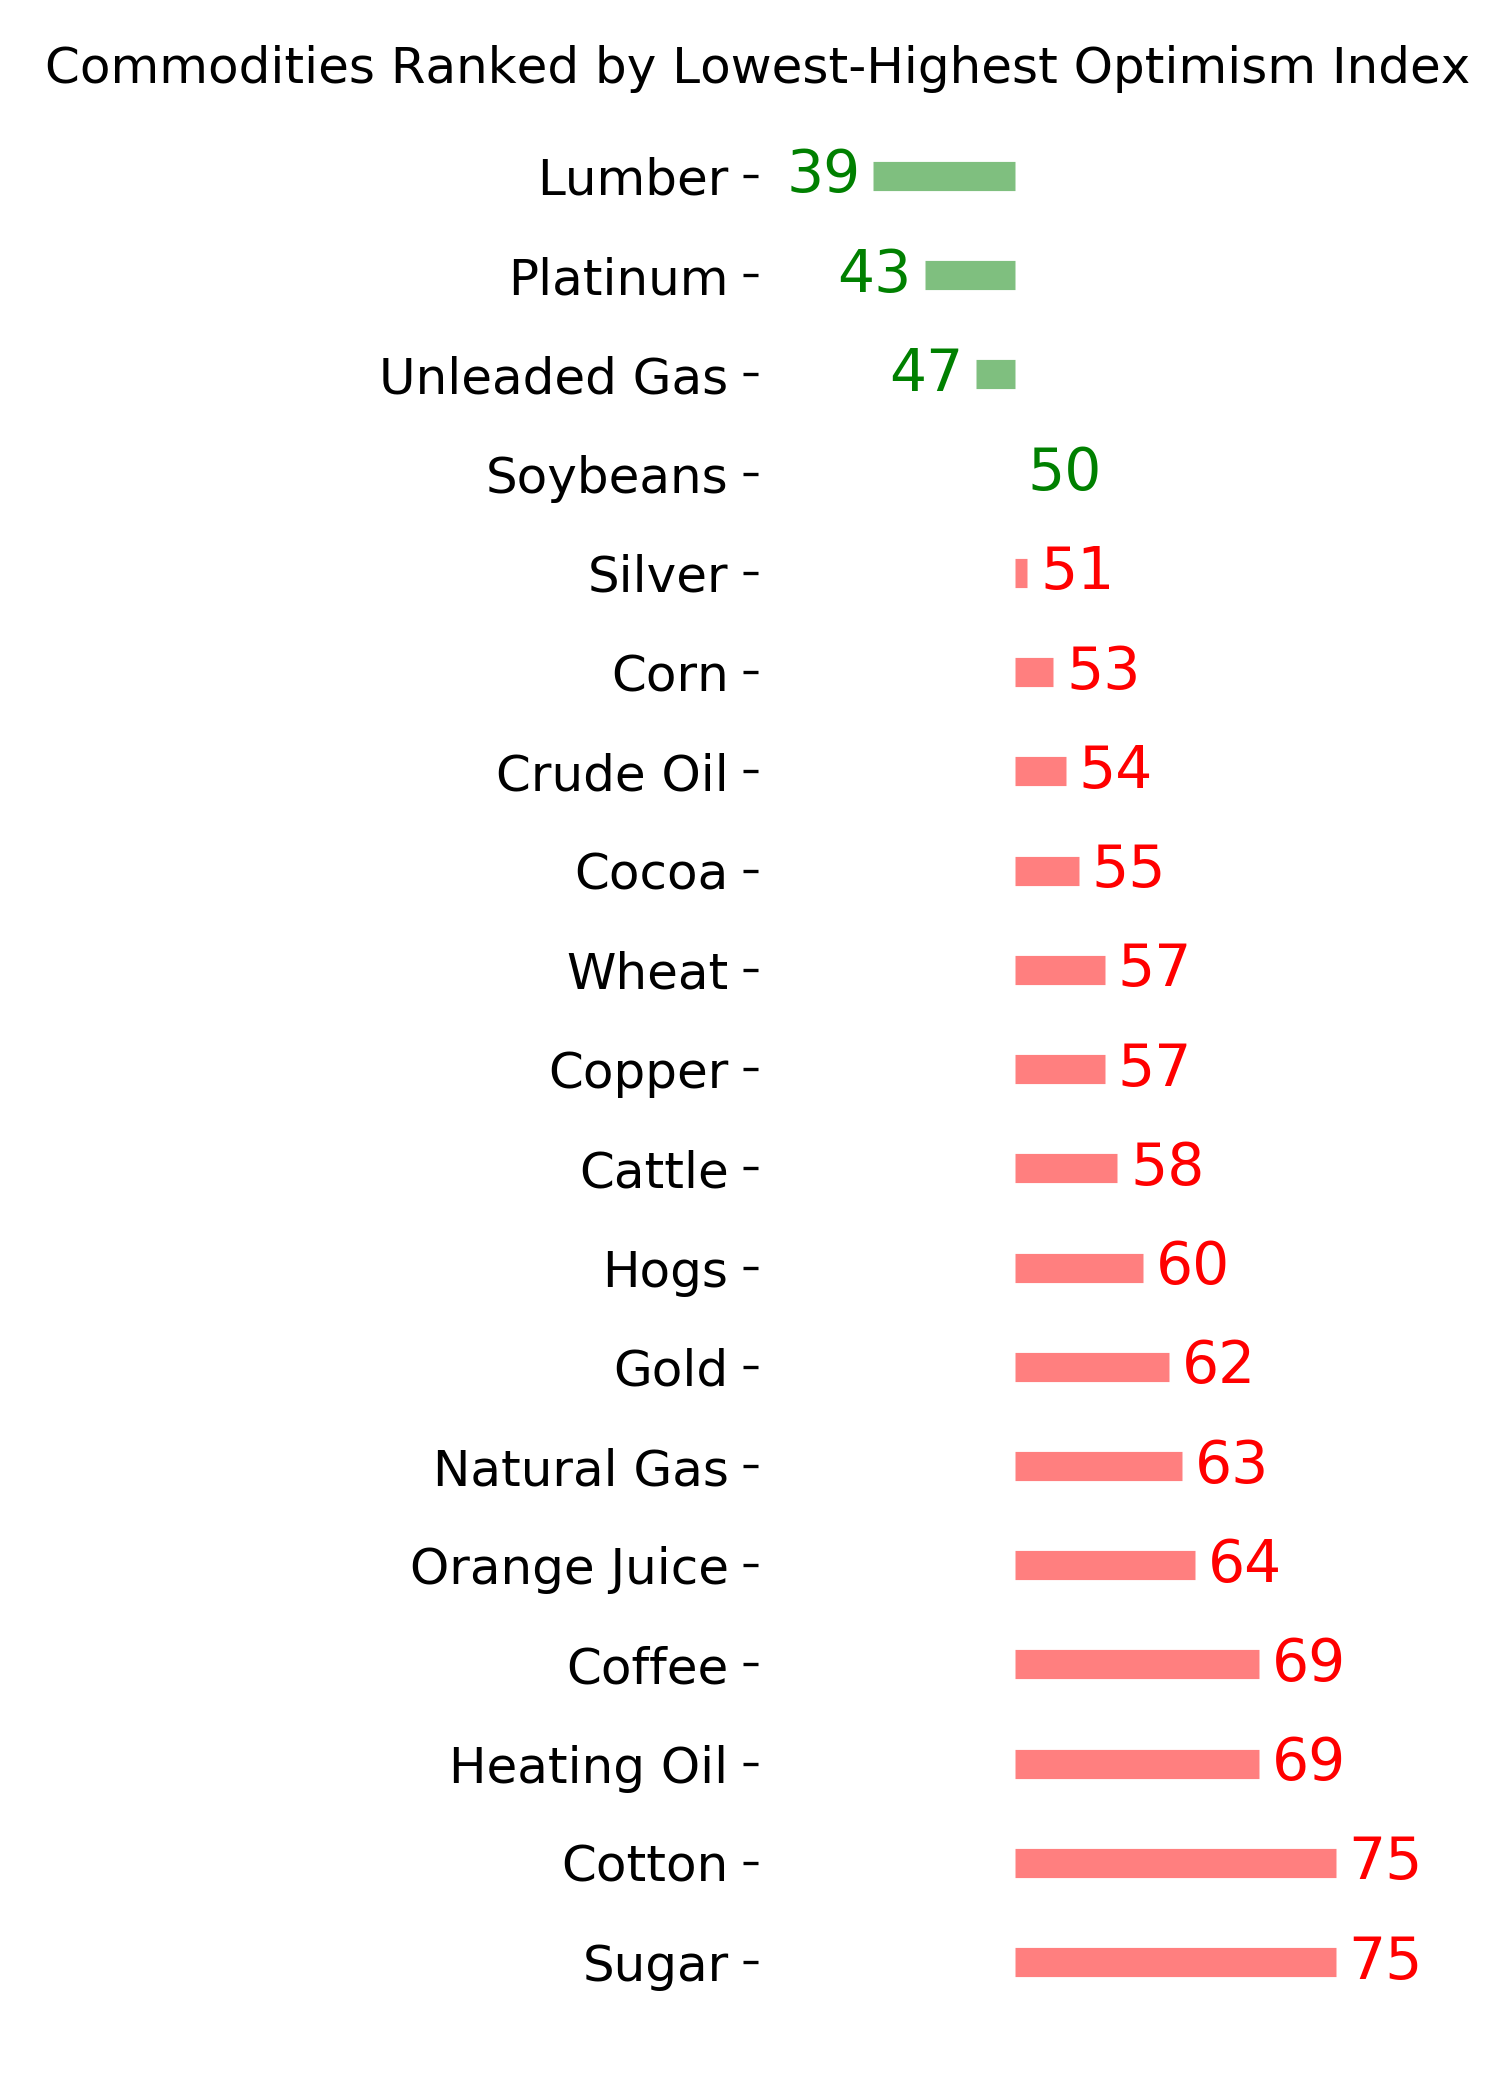
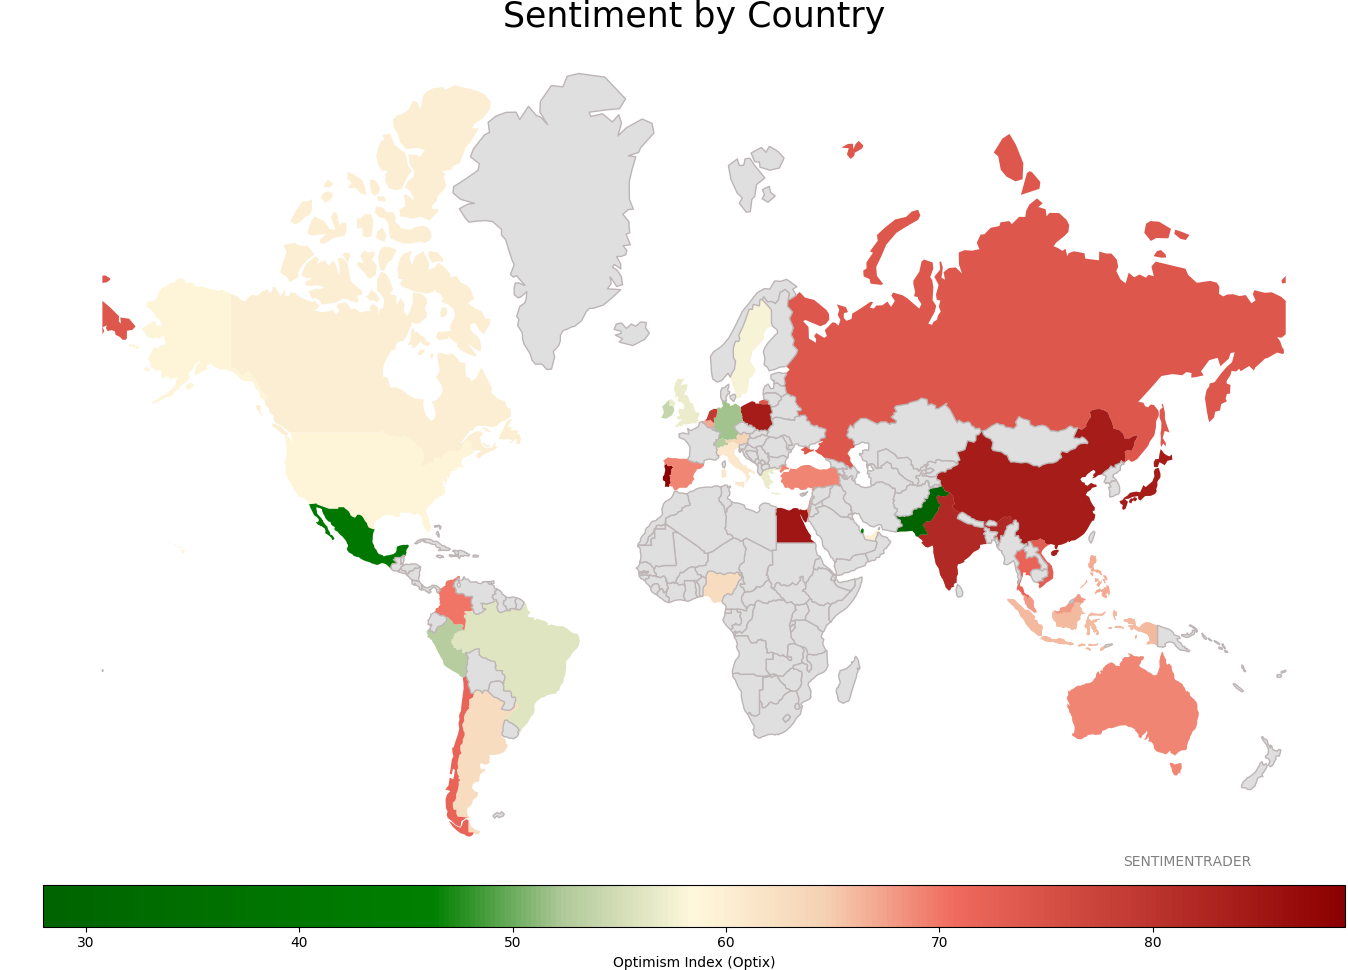
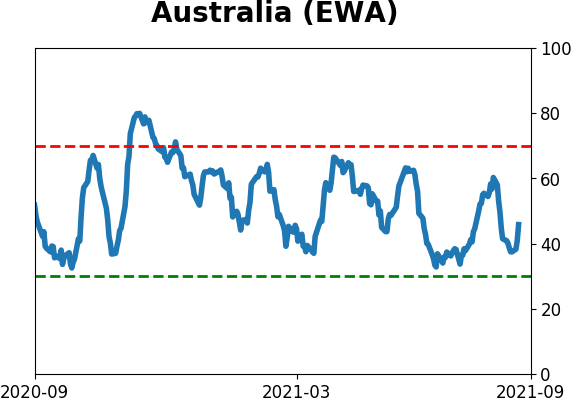
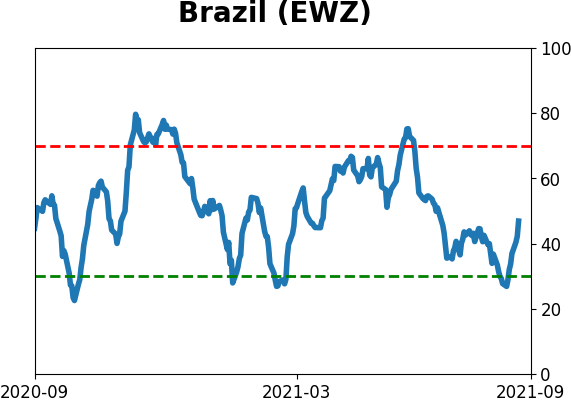
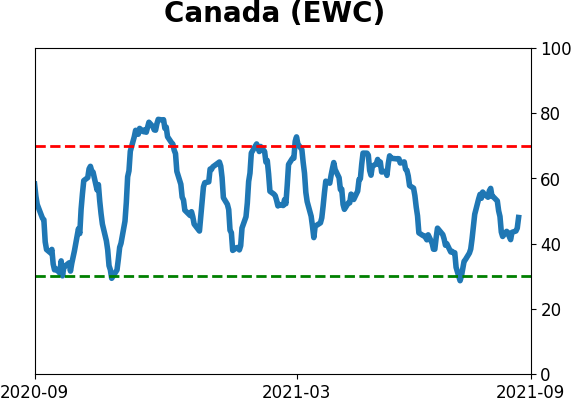
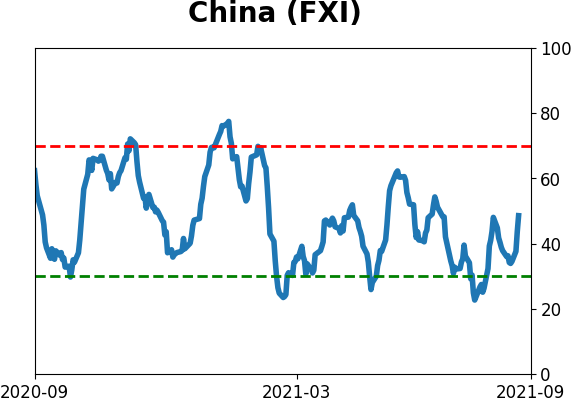
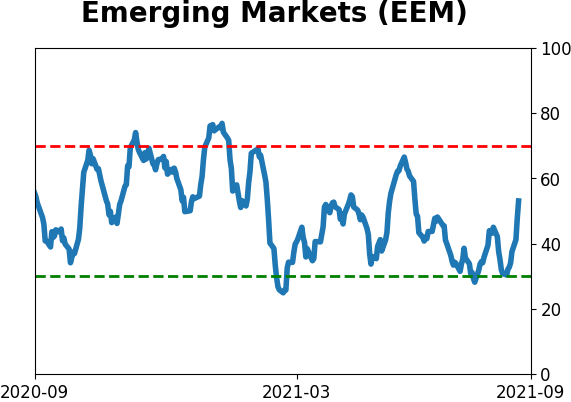
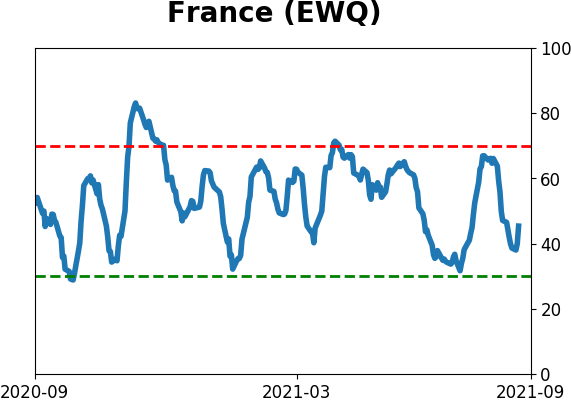
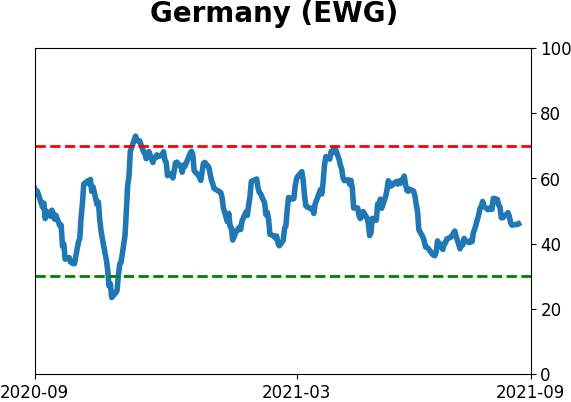
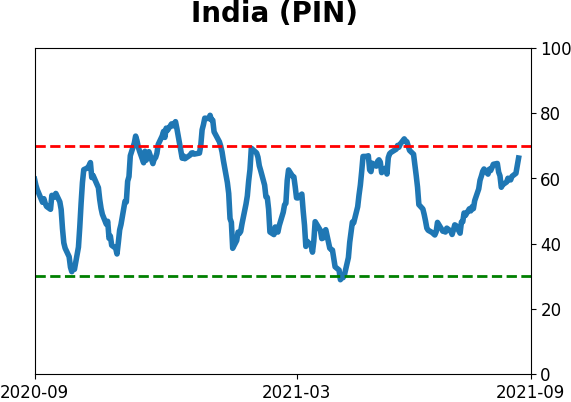
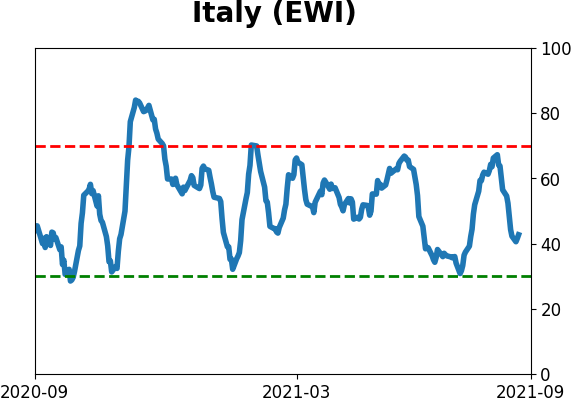
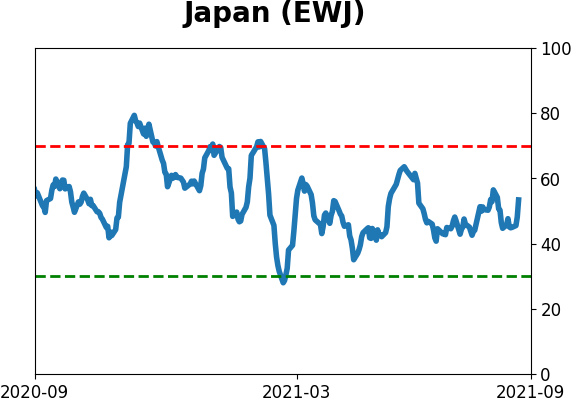
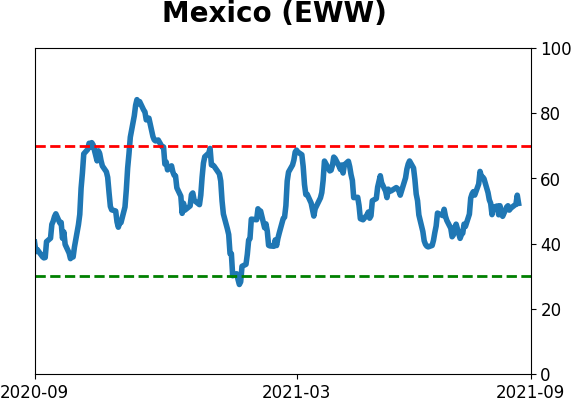
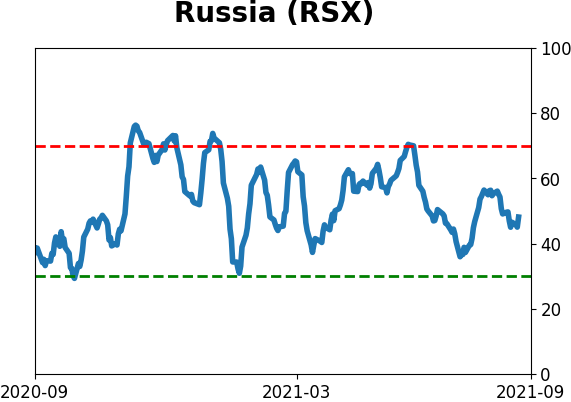
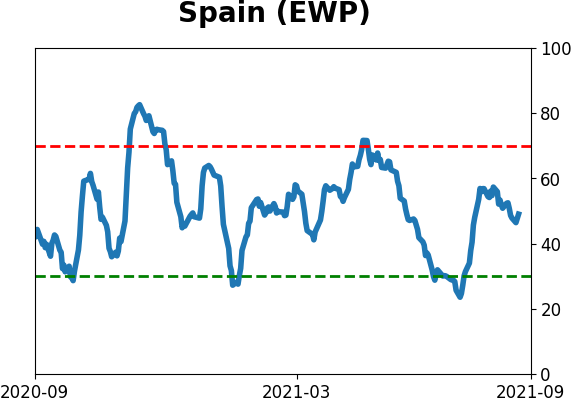
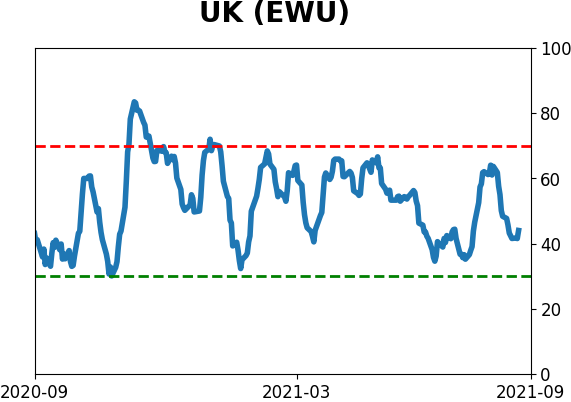
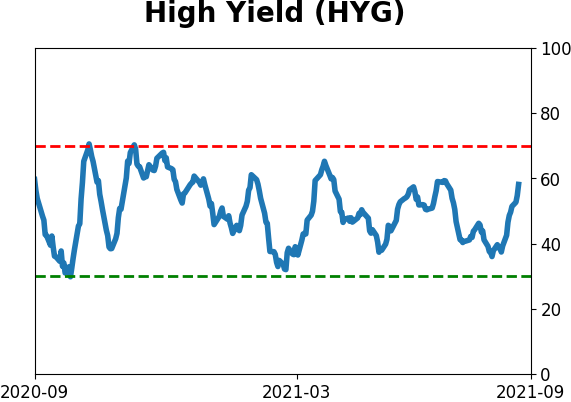
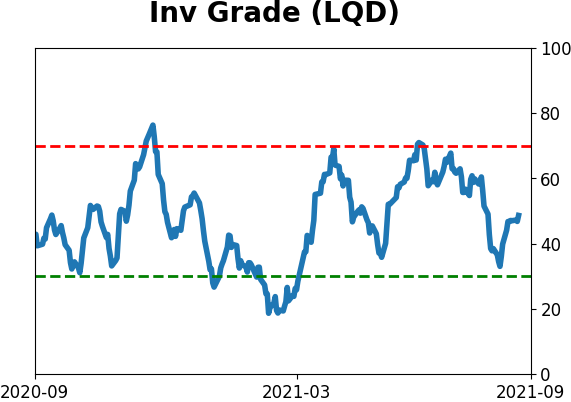
Sentiment Around The World
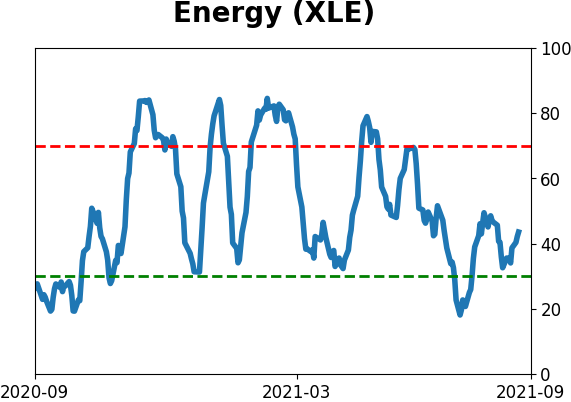
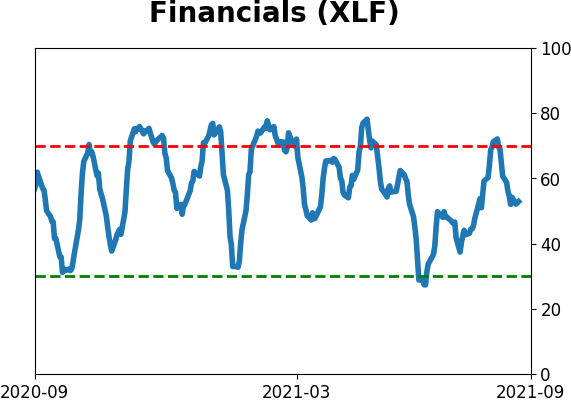
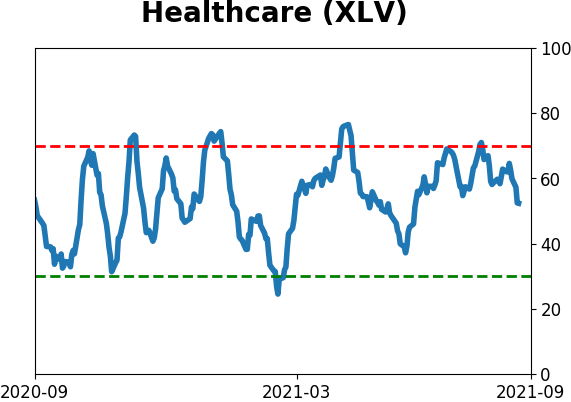
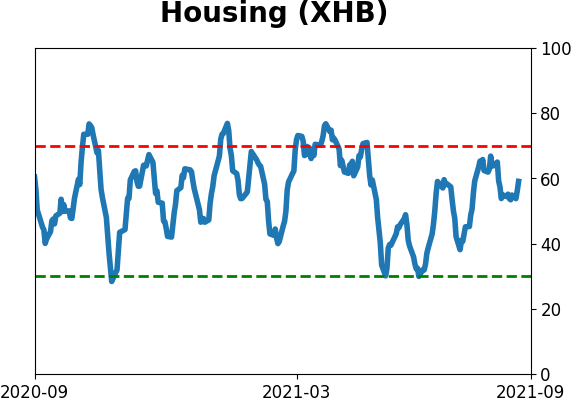
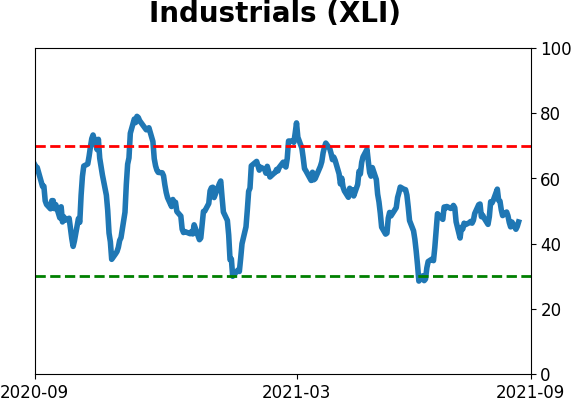
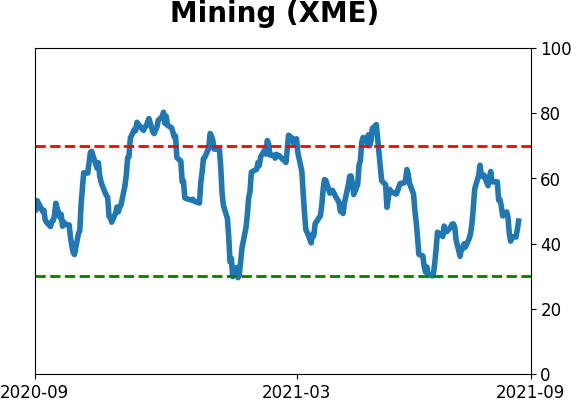
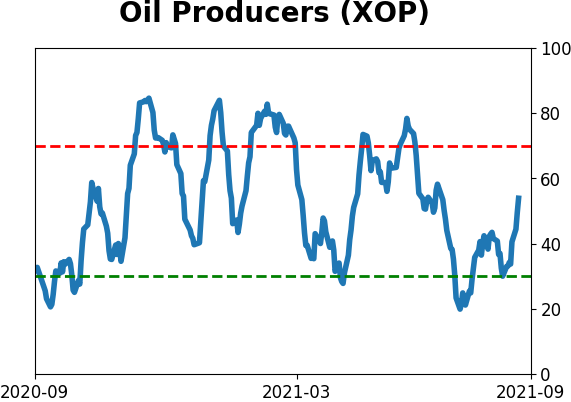
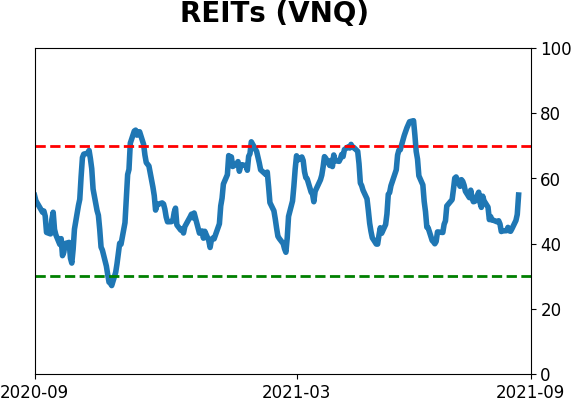
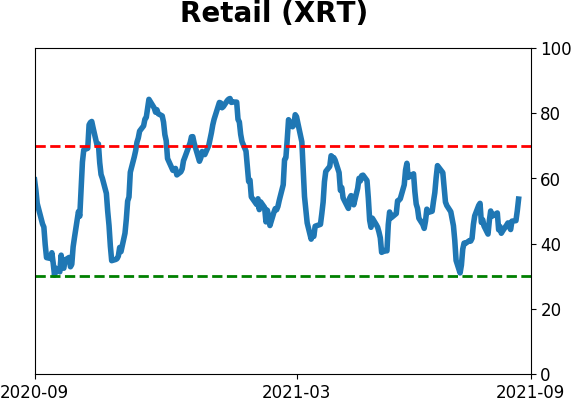
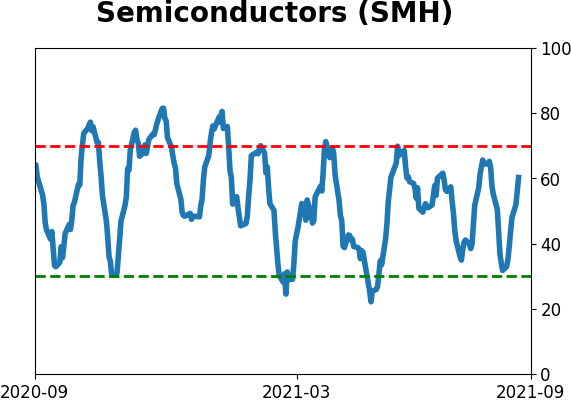
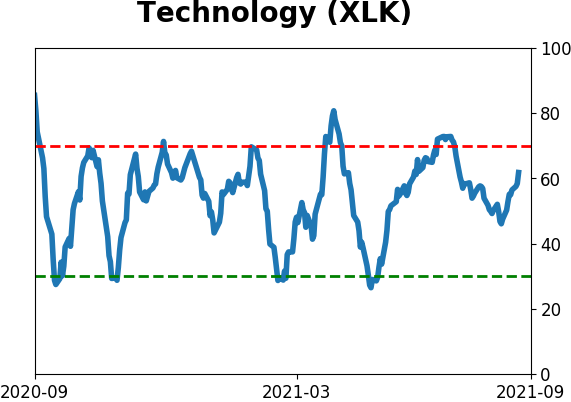
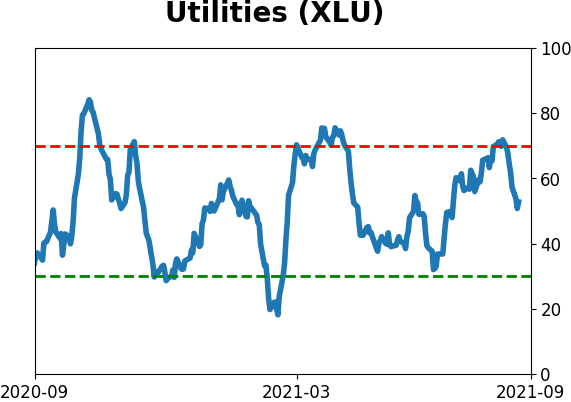
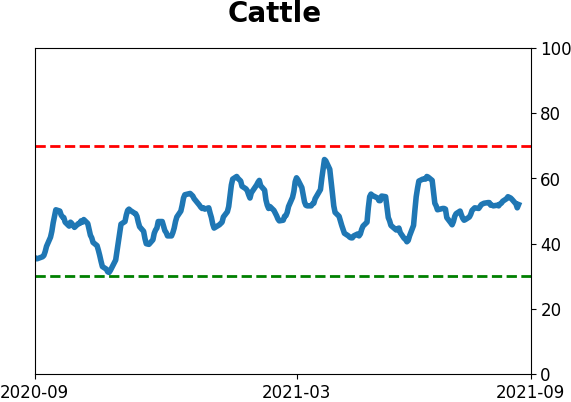
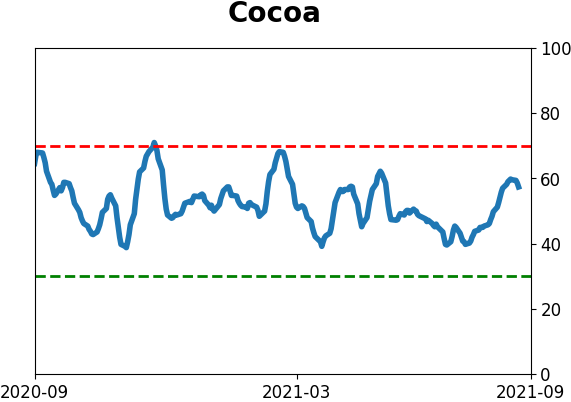
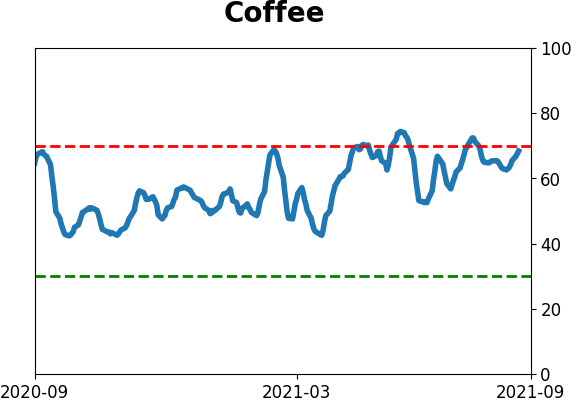
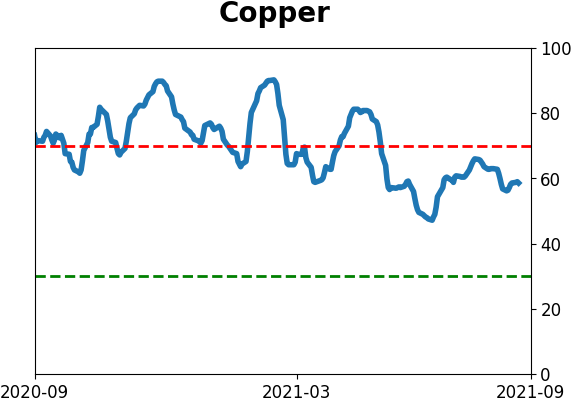
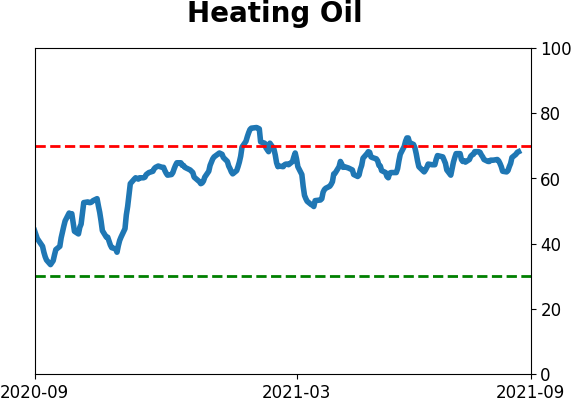
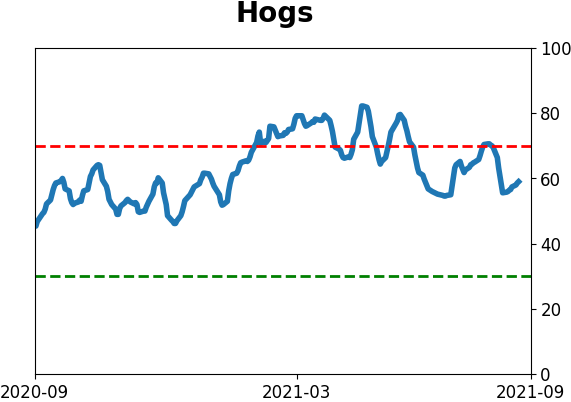
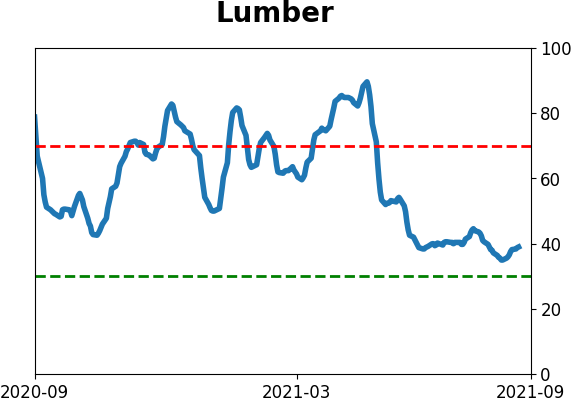
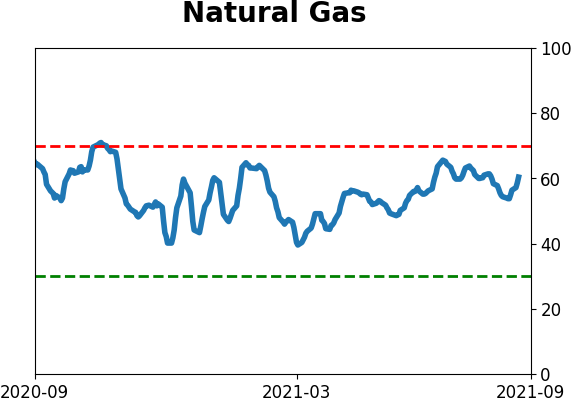
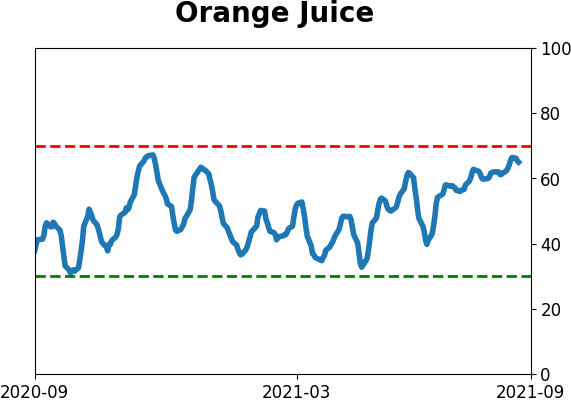
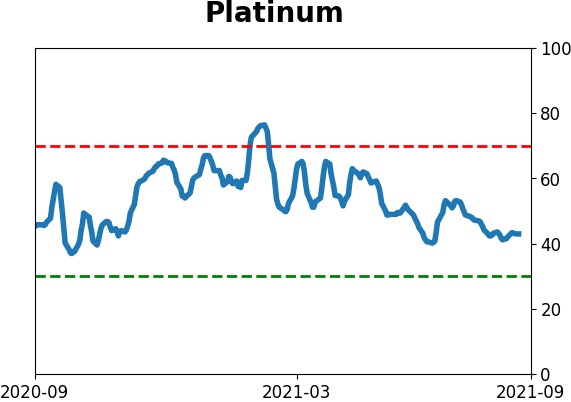
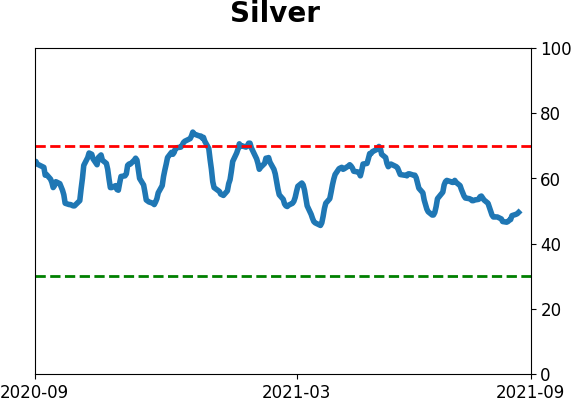
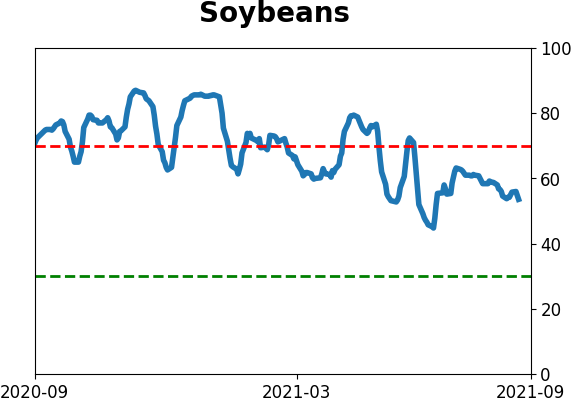
Optimism Index Thumbnails
|
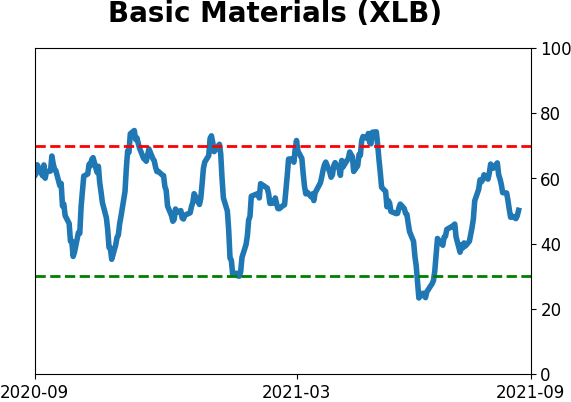
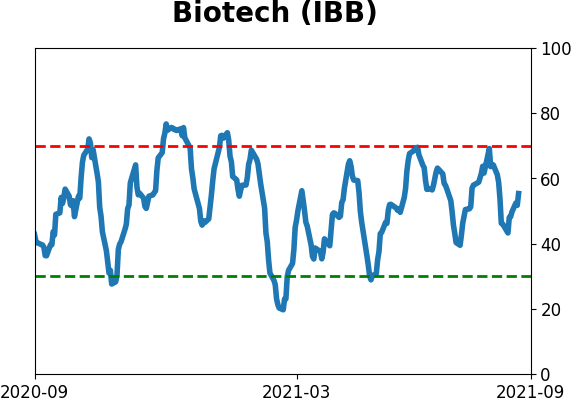
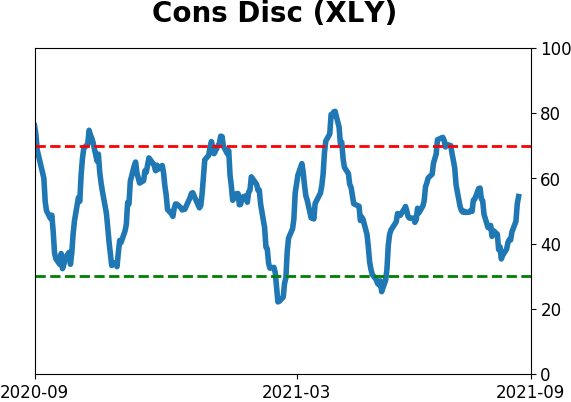
Sector ETF's - 10-Day Moving Average
|
|
|
Country ETF's - 10-Day Moving Average
|
|
|
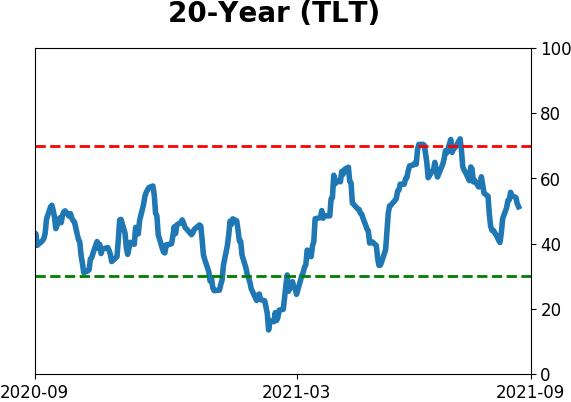
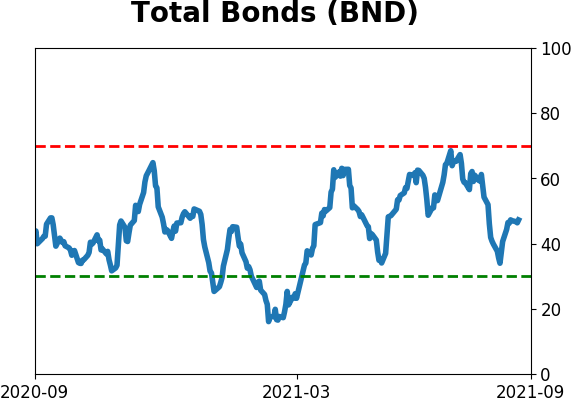
Bond ETF's - 10-Day Moving Average
|
|
|
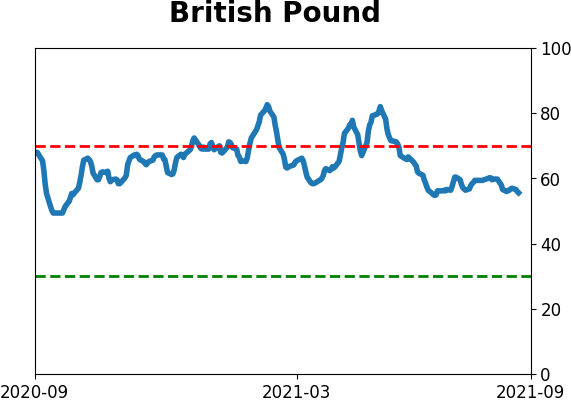
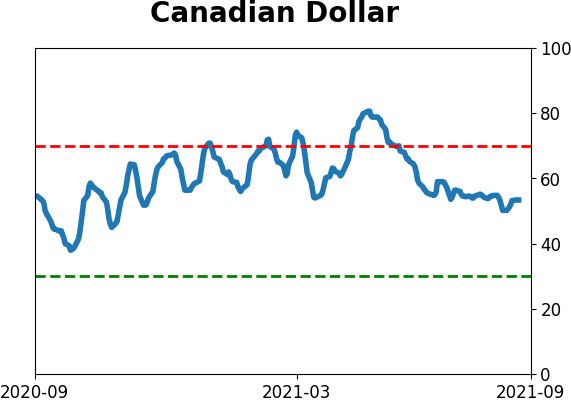
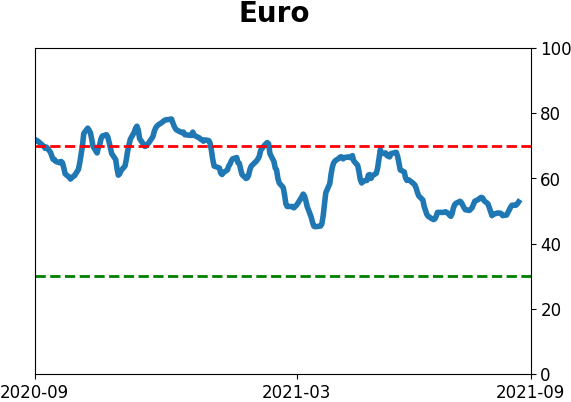
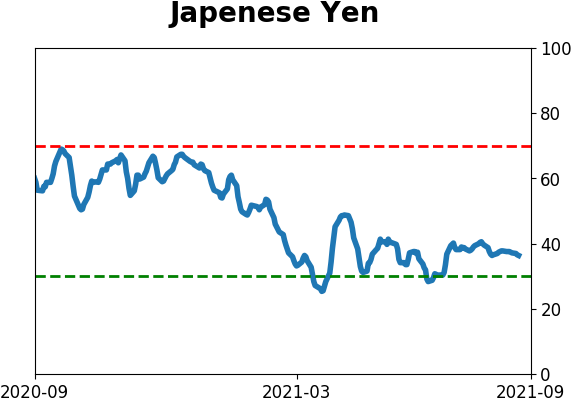
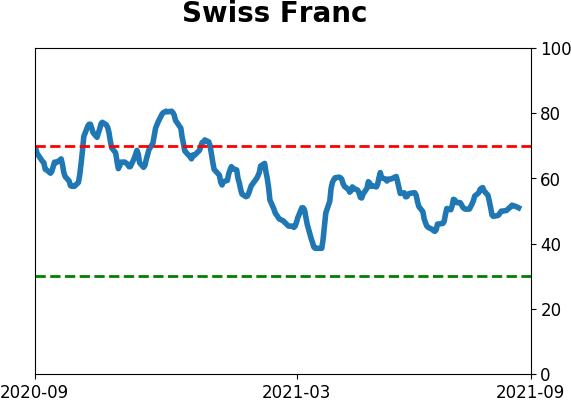
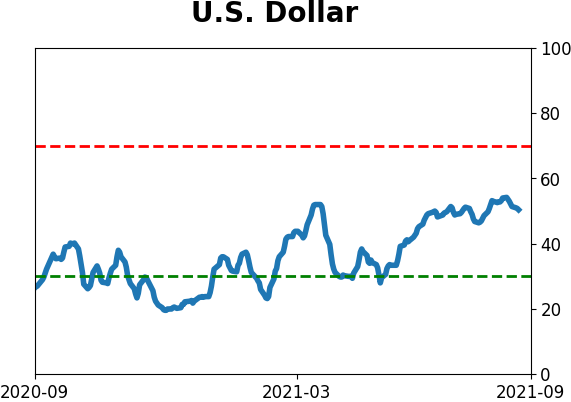
Currency ETF's - 5-Day Moving Average
|
|
|
Commodity ETF's - 5-Day Moving Average
|
|