Headlines
|
|
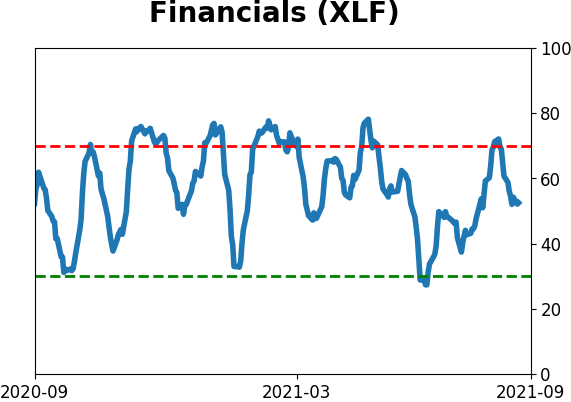
A Big Turnaround in Financials' Medium Term Trends:
Within only a few weeks of fewer than 20% of financial stocks holding above their 50-day moving averages, already more than 95% have regained their averages. That's a quick turnaround and similar thrusts tended to precede more gains for the sector.
Bottom Line:
STOCKS: Hold
Sentiment continues to decline from the speculative February peak. With deteriorating breadth, this raises the risk of poor short- to medium-term returns until optimism and better breadth returns. See the Outlook & Allocations page for more. BONDS: Hold
Various parts of the market got hit in March, with the lowest Bond Optimism Index we usually see during healthy environments. Bond prices have modest recovered and there is no edge among the data we follow. GOLD: Hold
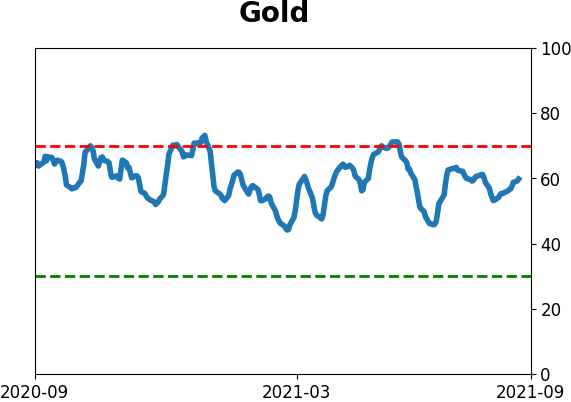
Gold and miners were rejected after trying to recover above their 200-day averages in May. Lately, some medium-term (not long-term) oversold extremes in breadth measures among miners have triggered.
|
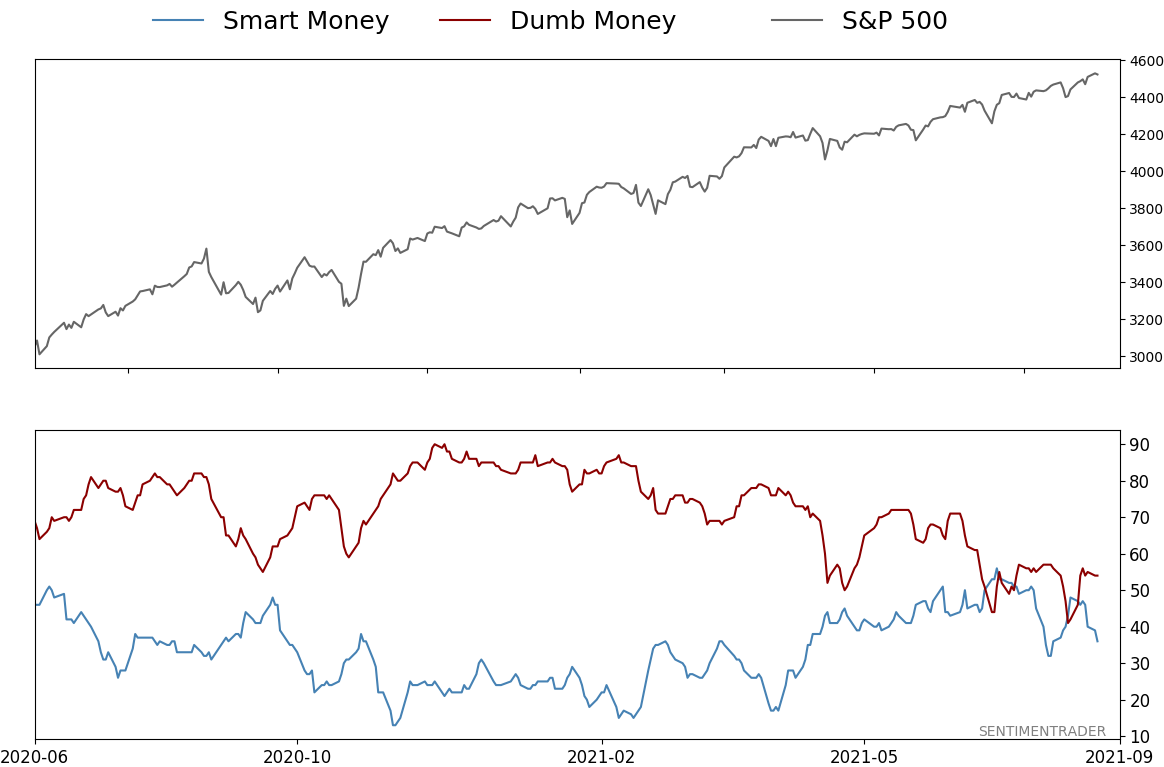
Smart / Dumb Money Confidence
|
Smart Money Confidence: 36%
Dumb Money Confidence: 54%
|
|
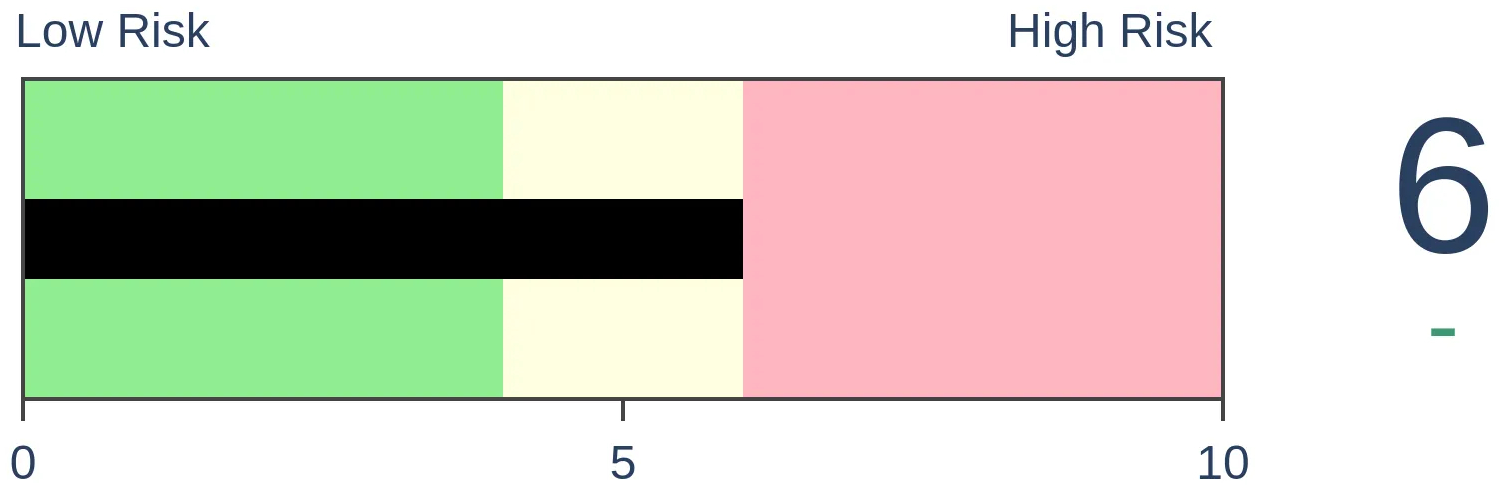
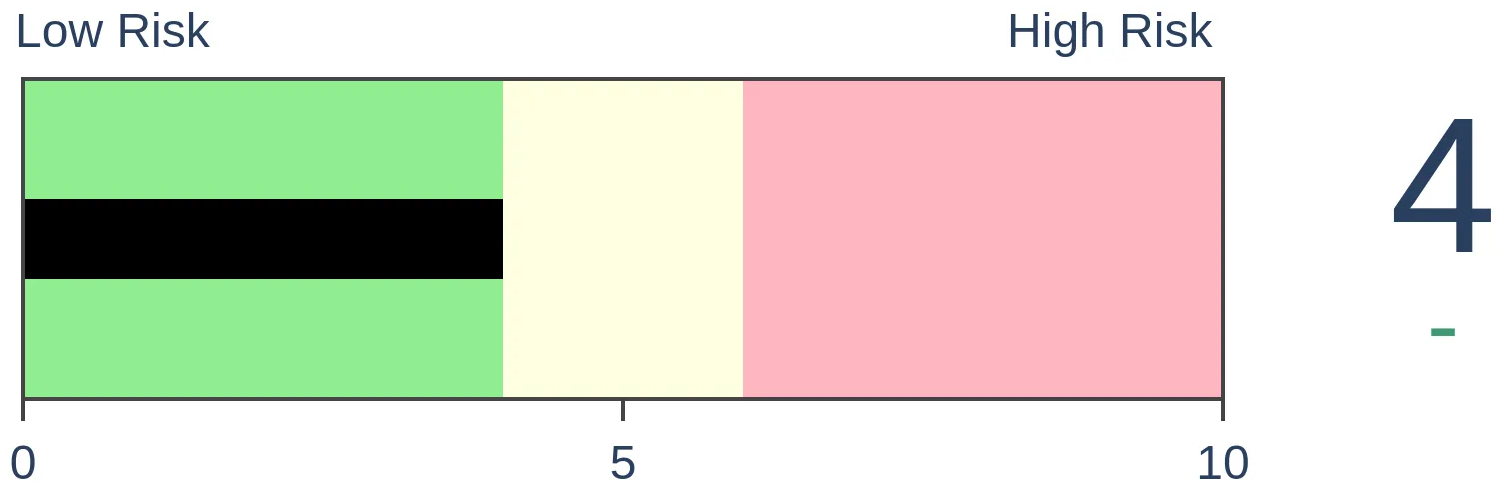
Risk Levels
Stocks Short-Term
|
Stocks Medium-Term
|
|
Bonds

|
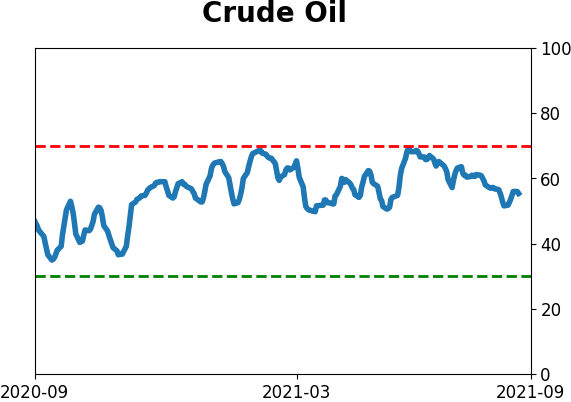
Crude Oil

|
|
Gold
|
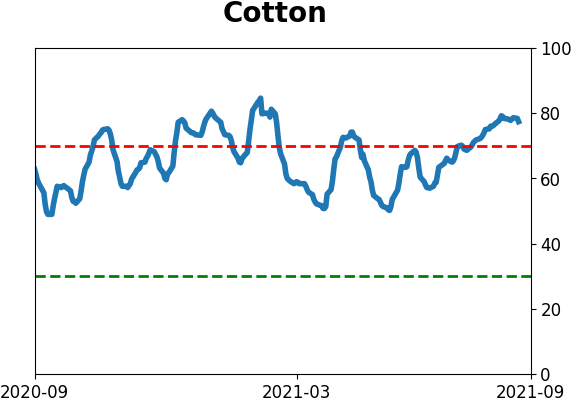
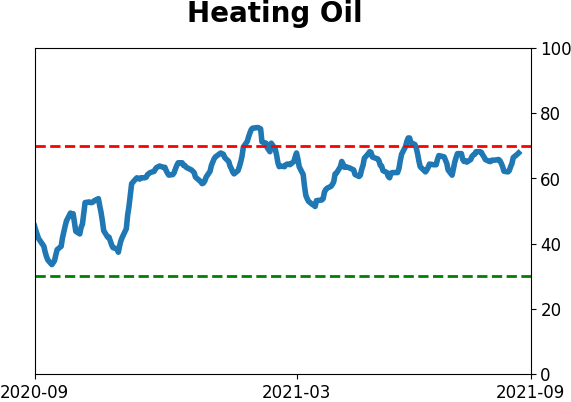
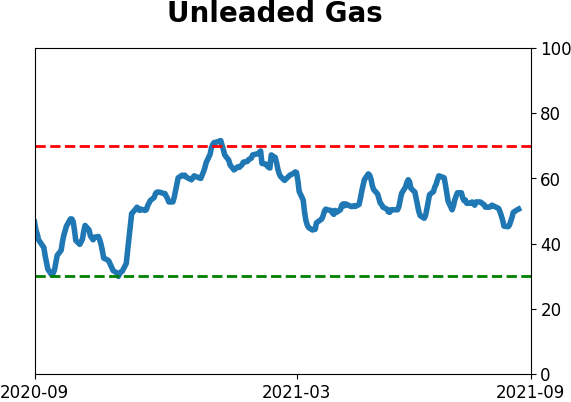
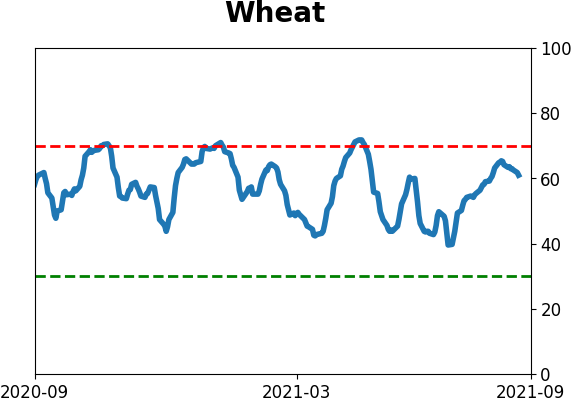
Agriculture
|
|
Research
By Jason Goepfert
BOTTOM LINE
Within only a few weeks of fewer than 20% of financial stocks holding above their 50-day moving averages, already more than 95% have regained their averages. That's a quick turnaround and similar thrusts tended to precede more gains for the sector.
FORECAST / TIMEFRAME
XLF -- Up, Long-Term
|
Financial stocks have had a big thrust in recent weeks. Dean has highlighted this several times in the premium notes (here and here).
After lagging the broader market and reaching modest oversold levels in June and July, the estimable Liz Ann Sonders noted that the percentage of Financial stocks trading above their 50-day moving averages has gone from a low level to a very high one.
Within 30 days, the sector cycled from having fewer than 20% of its members above their medium-term averages to having more than 95% of them above.
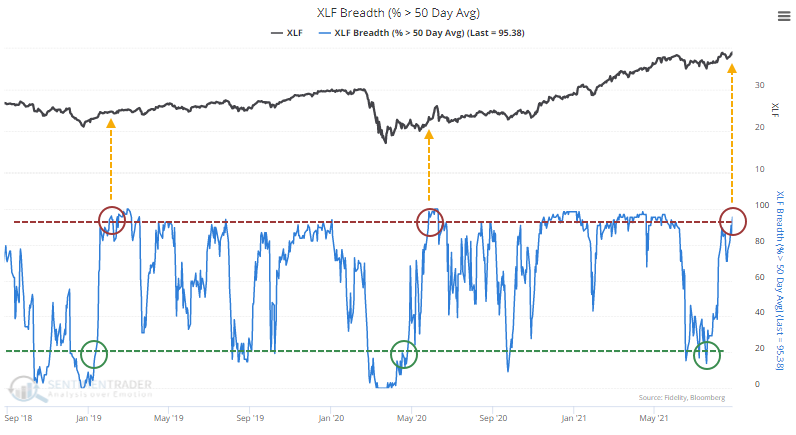
In the past five years, the only times this has triggered were February 2019 and May 2020, both leading to double-digit gains.
A GOOD SIGN OF A QUICK SHIFT IN SENTIMENT
Whenever medium-term participation in Financials cycles from a low to a very high level in a relatively short number of days, the sector has tended to keep going. There have been 42 such signals over the past 70 years, and 38 of them led to a positive one-year total return (with one of the losses being a minuscule -0.3%).
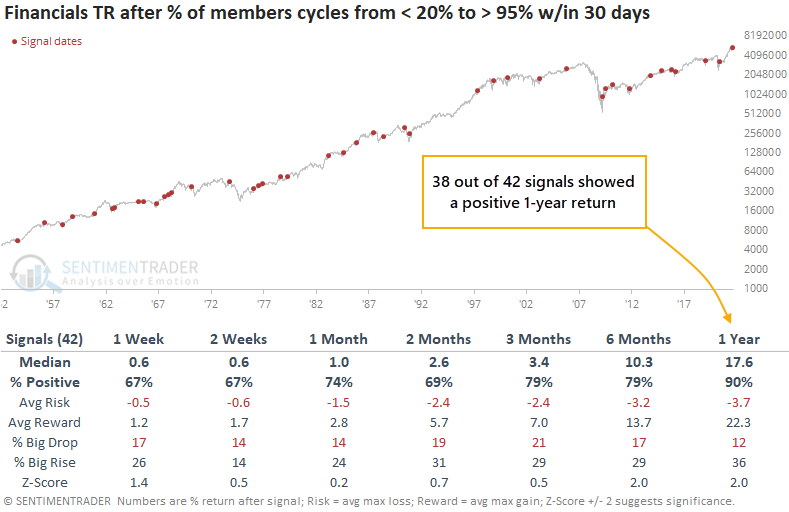
Context is important, so the table below narrows down the signals to only include times when Financials were not in a correction at the time.
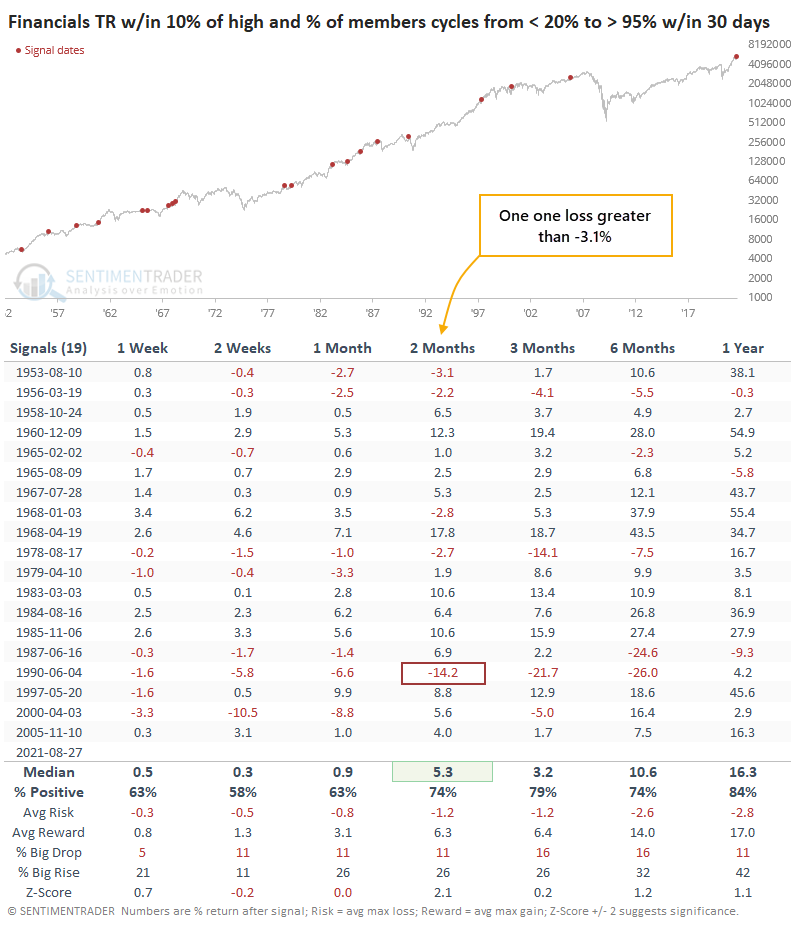
Again, returns going forward were good, with the most impressive returns being over the next two months. Reward was more than 5 times risk, and only one signal showed a loss greater than -3.1% (granted, that was a large loss).
WATCH THE DOWNSIDE
The more we restrict the conditions, the smaller the sample size, but at the same time, get closer to conditions like we have now. So, if we look only at signals that triggered when Financials were sitting at a new high at the time, there was only one (temporarily) large loss.
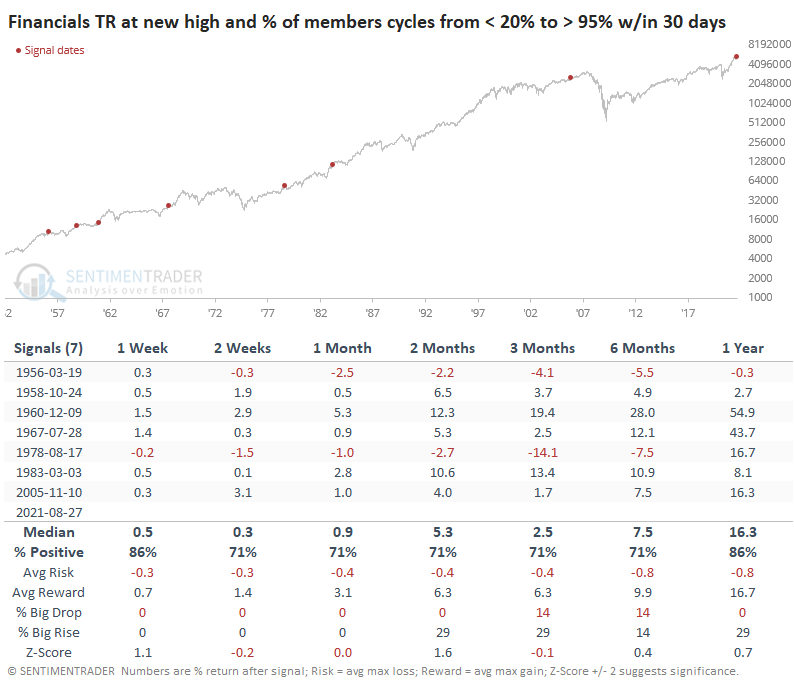
Again, the most impressive aspect was the risk/reward ratio, which we can see in more detail in the chart below.
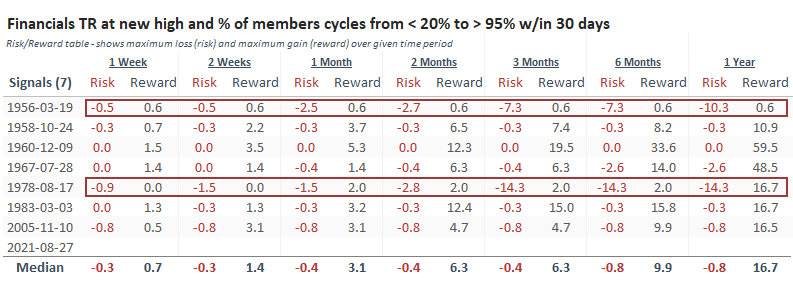
It's interesting to note that the two losing signals started losing almost immediately, with very little upside. The five winning signals started winning almost right away, with minimal downside. It's tough to read that much into such a tiny sample size, but it would suggest that if Financials can keep buyers' interest in the week(s) ahead, then it bodes well for the longer term as well.
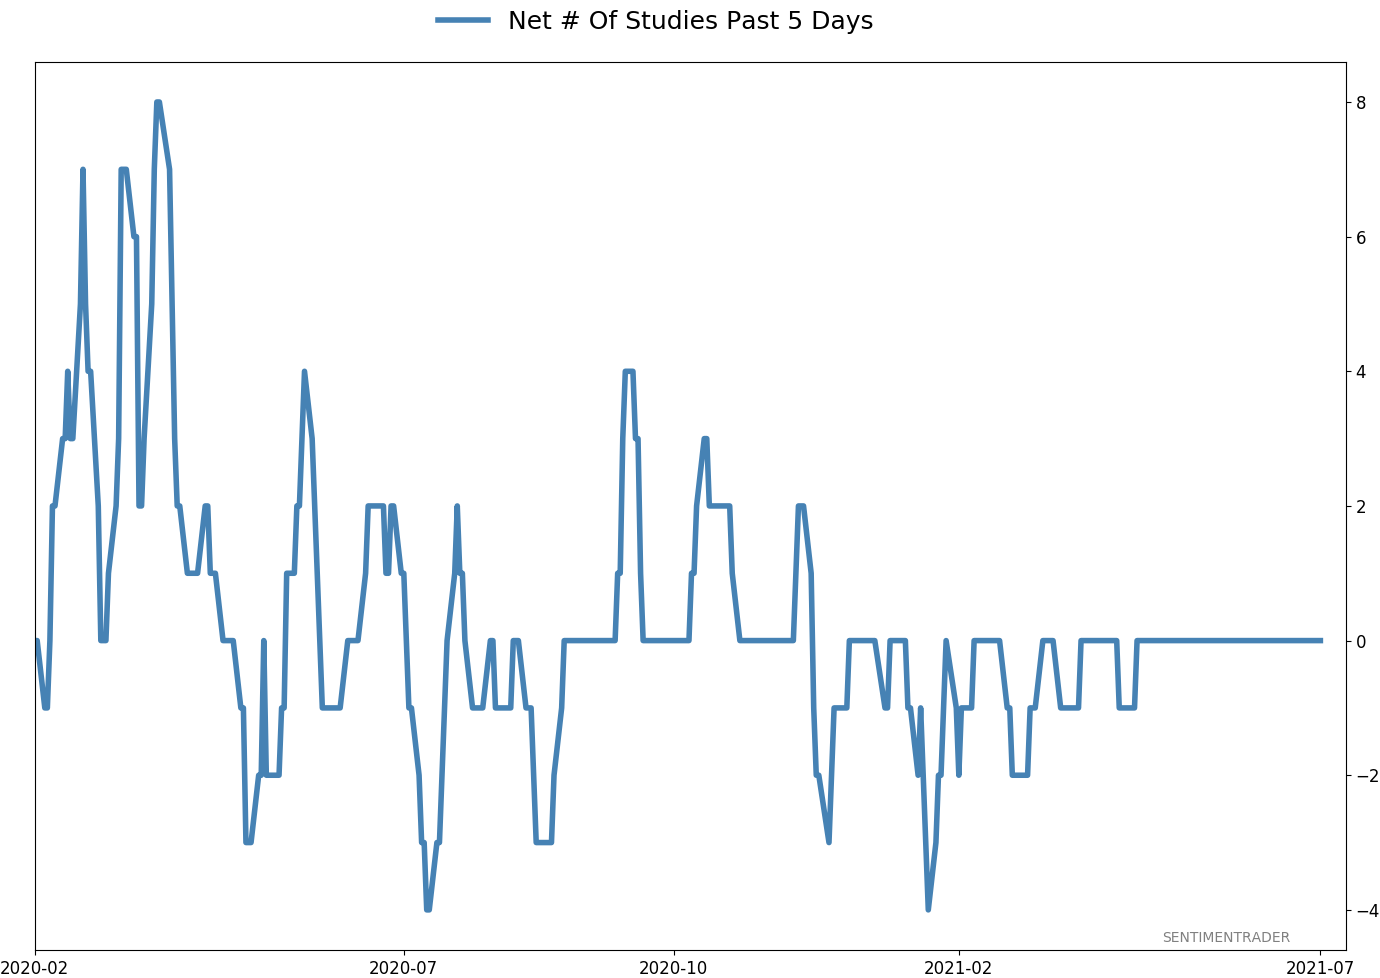
Active Studies
| Time Frame | Bullish | Bearish | | Short-Term | 0 | 5 | | Medium-Term | 5 | 3 | | Long-Term | 11 | 5 |
|
Indicators at Extremes
|
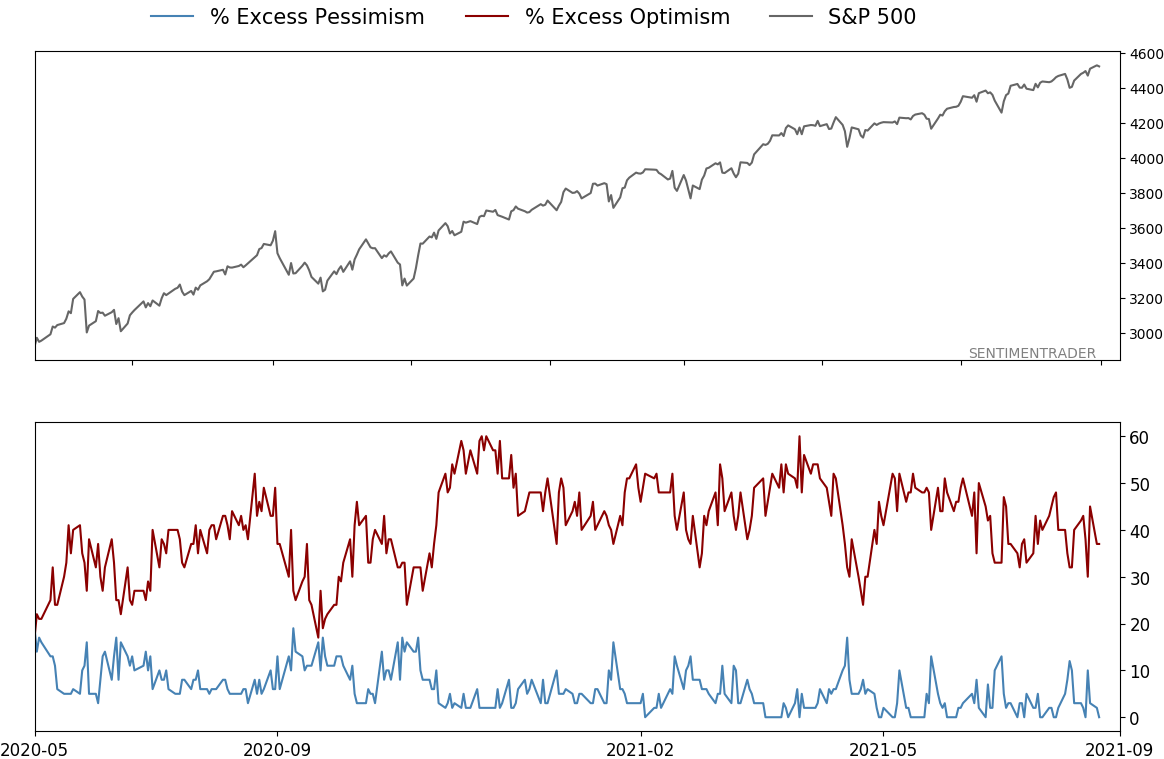
% Showing Pessimism: 0%
Bullish for Stocks
|
|
Portfolio
| Position | Description | Weight % | Added / Reduced | Date | | Stocks | RSP | 4.1 | Added 4.1% | 2021-05-19 | | Bonds | 23.9% BND, 6.9% SCHP | 30.7 | Reduced 7.1% | 2021-05-19 | | Commodities | GCC | 2.6 | Reduced 2.1%
| 2020-09-04 | | Precious Metals | GDX | 5.6 | Reduced 4.2% | 2021-05-19 | | Special Situations | 4.3% XLE, 2.2% PSCE | 7.6 | Reduced 5.6% | 2021-04-22 | | Cash | | 49.4 | | |
|
Updates (Changes made today are underlined)
Much of our momentum and trend work has remained positive for several months, with some scattered exceptions. Almost all sentiment-related work has shown a poor risk/reward ratio for stocks, especially as speculation drove to record highs in exuberance in February. Much of that has worn off, and most of our models are back toward neutral levels. There isn't much to be excited about here. The same goes for bonds and even gold. Gold has been performing well lately and is back above long-term trend lines. The issue is that it has a poor record of holding onto gains when attempting a long-term trend change like this, so we'll take a wait-and-see approach. RETURN YTD: 8.6% 2020: 8.1%, 2019: 12.6%, 2018: 0.6%, 2017: 3.8%, 2016: 17.1%, 2015: 9.2%, 2014: 14.5%, 2013: 2.2%, 2012: 10.8%, 2011: 16.5%, 2010: 15.3%, 2009: 23.9%, 2008: 16.2%, 2007: 7.8%
|
|
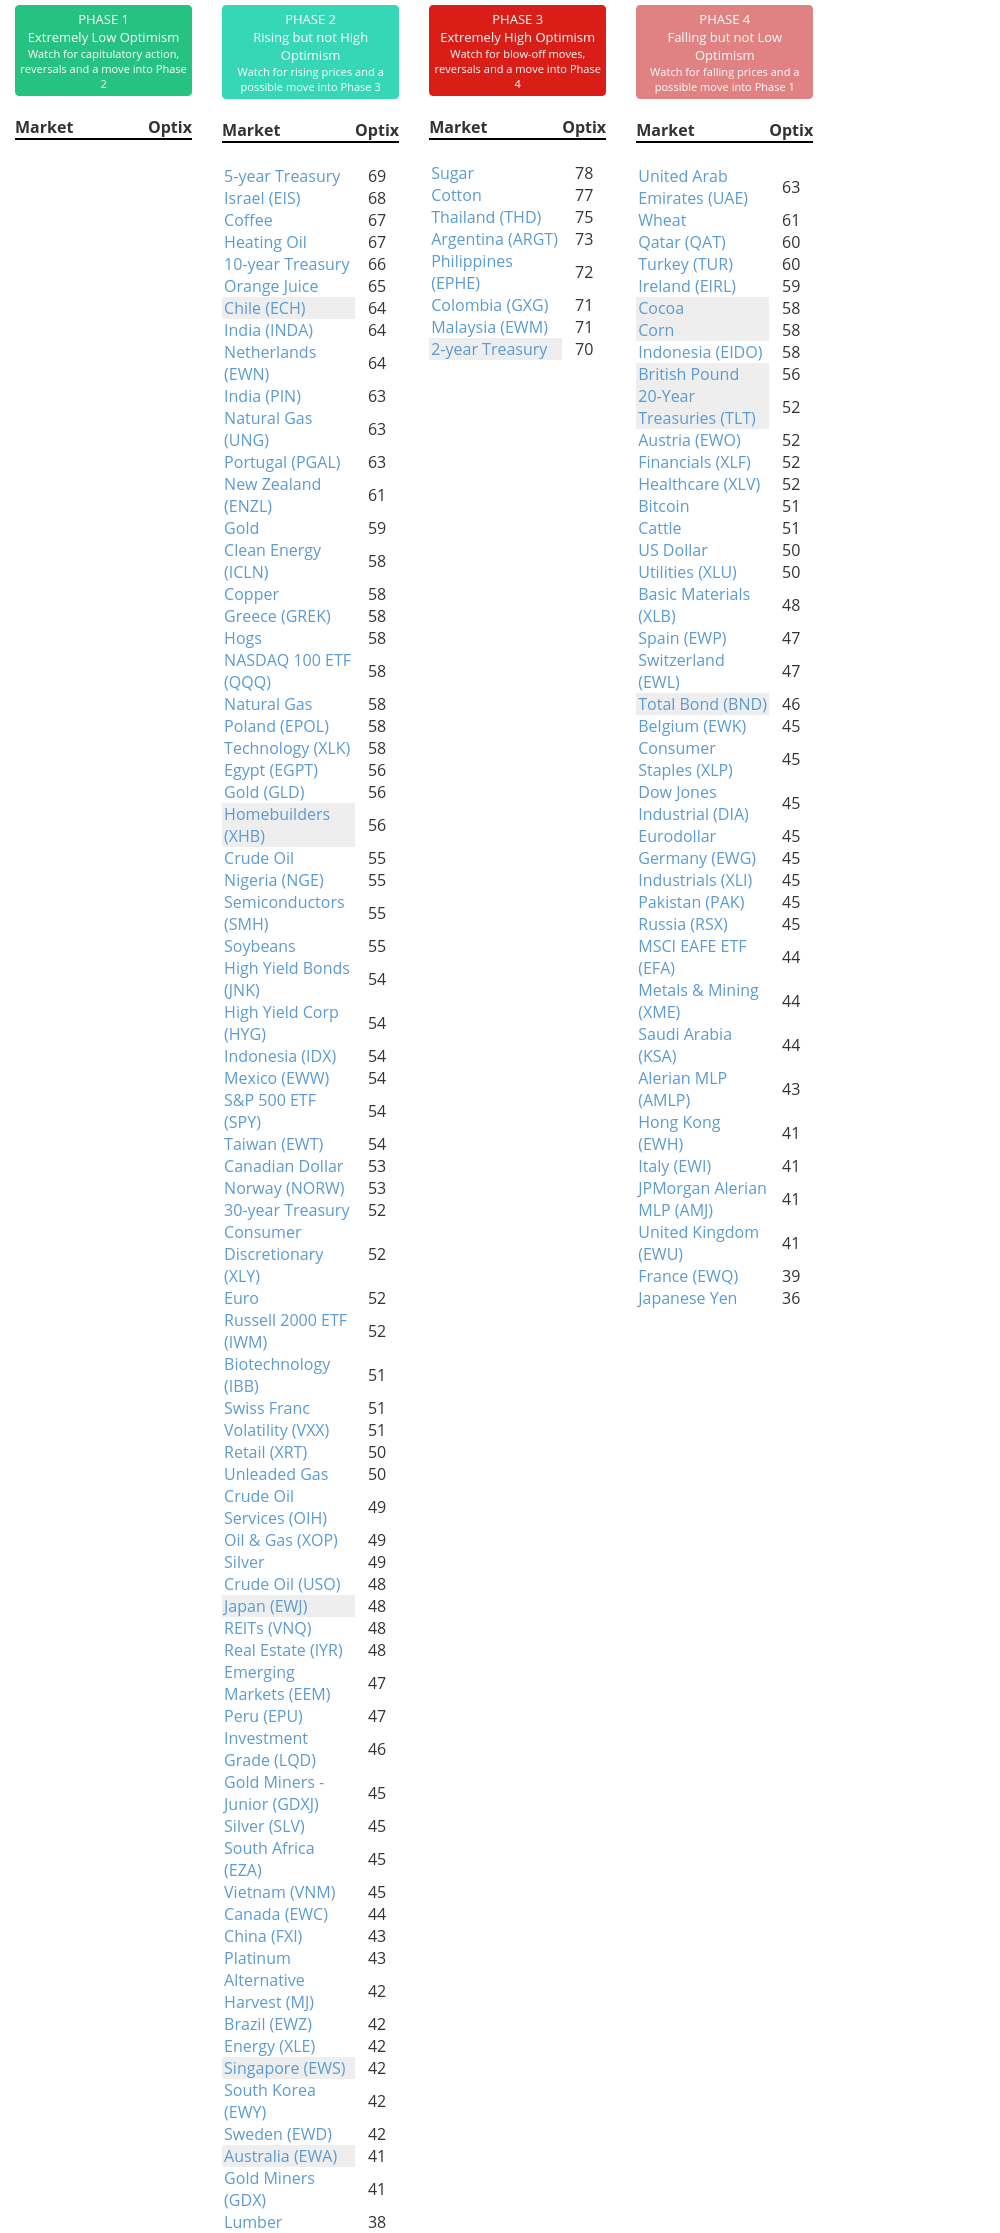
Phase Table
Ranks
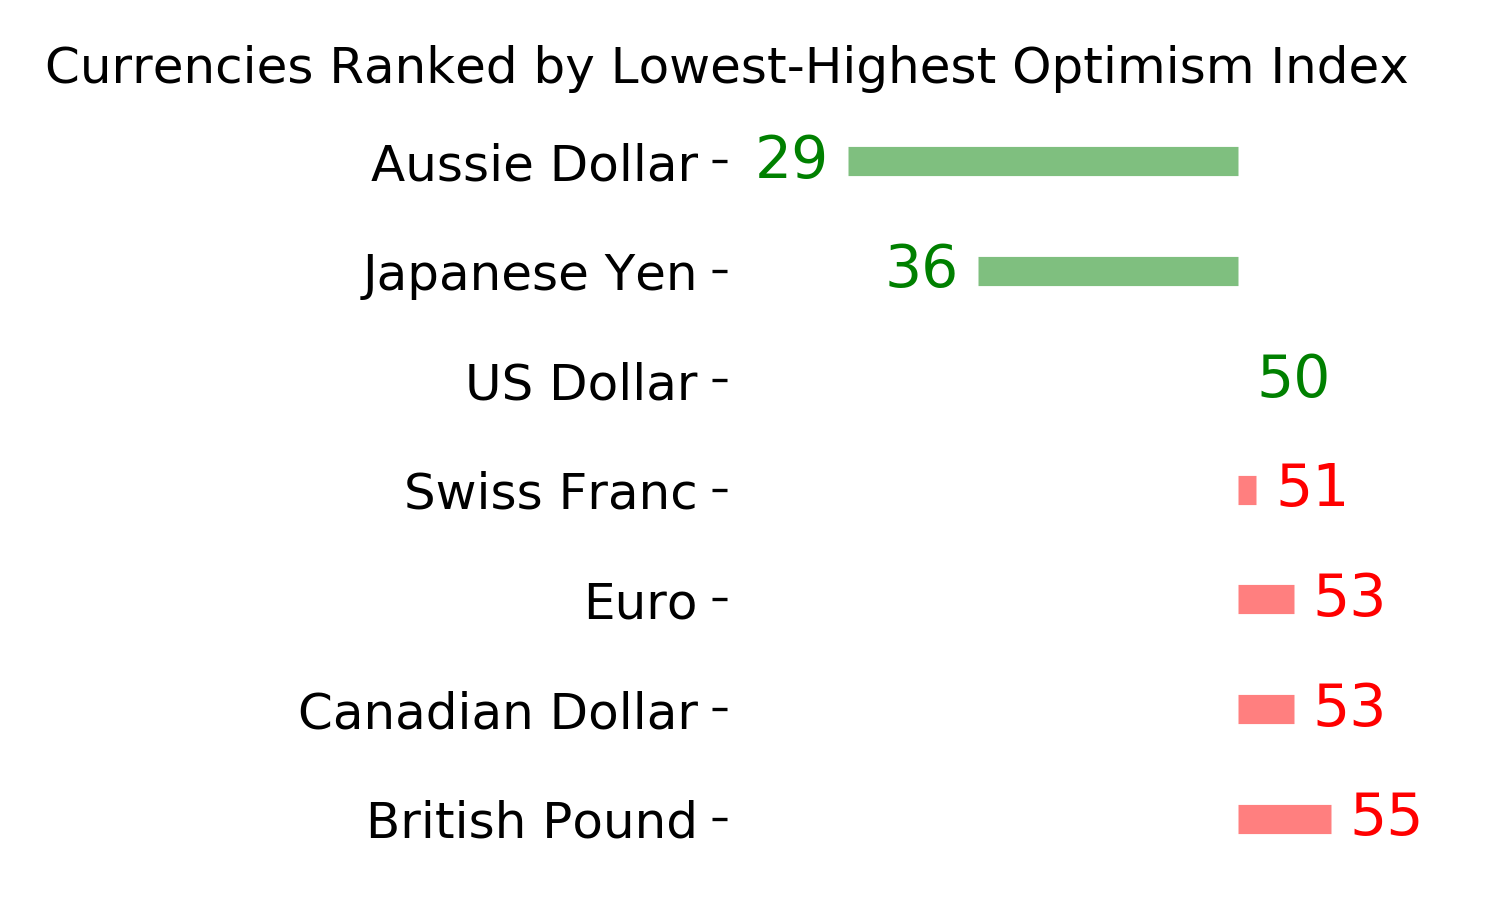
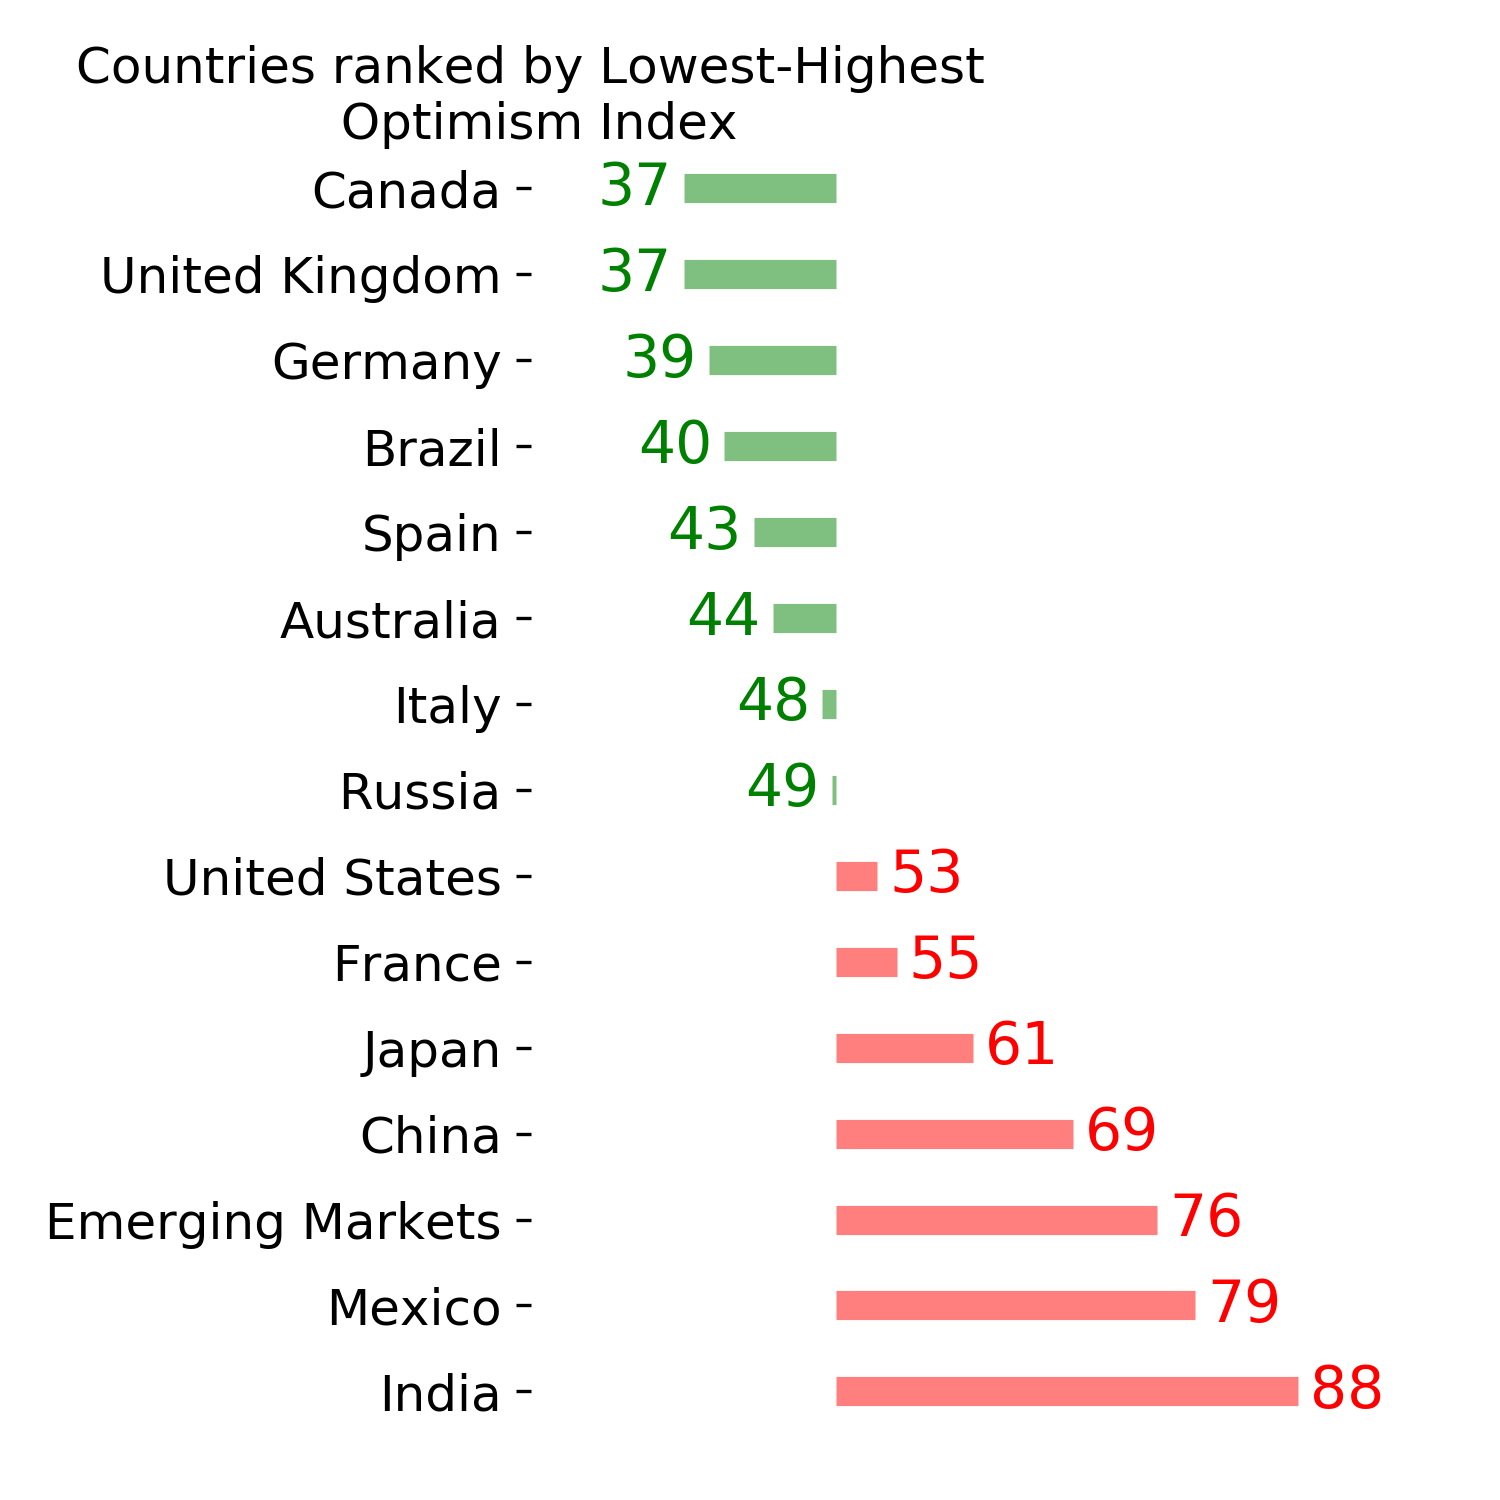
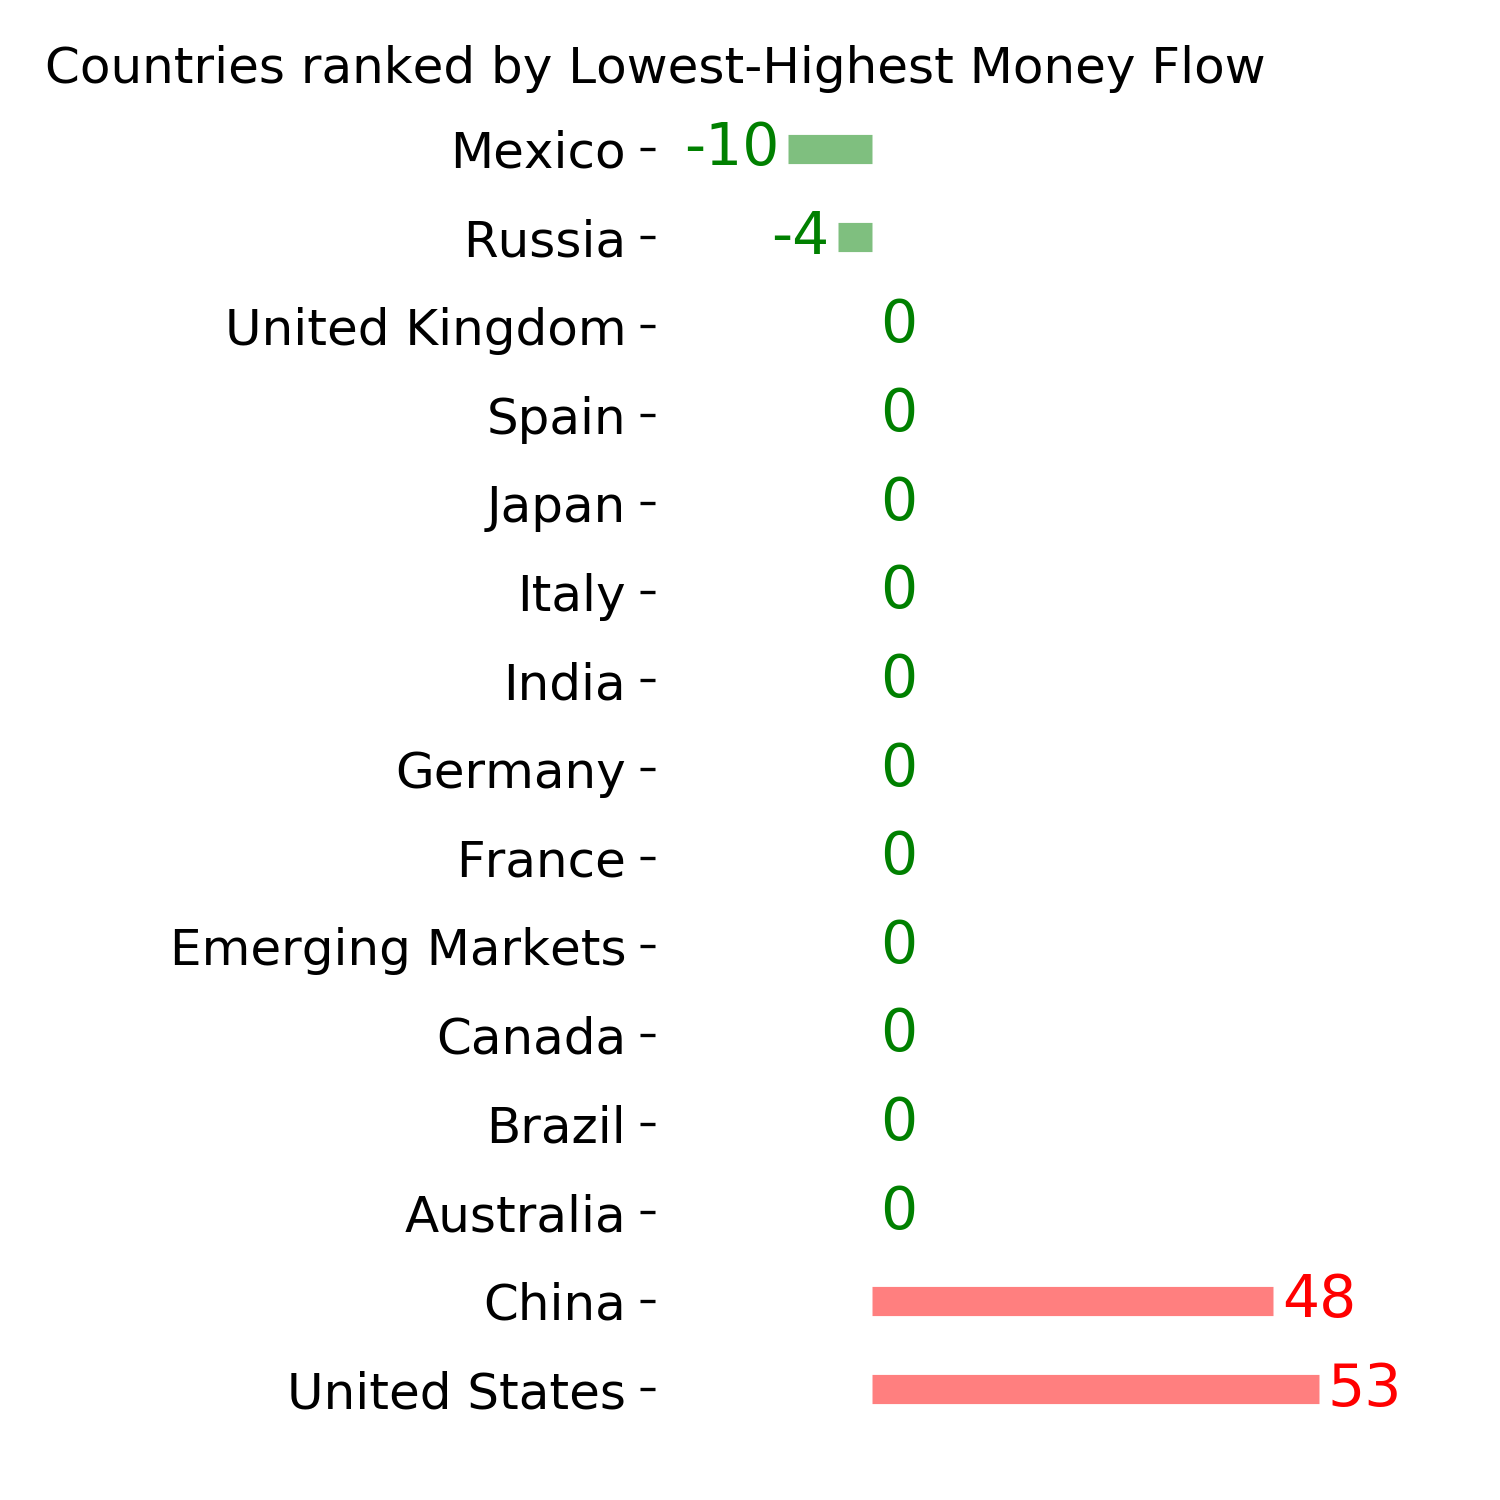
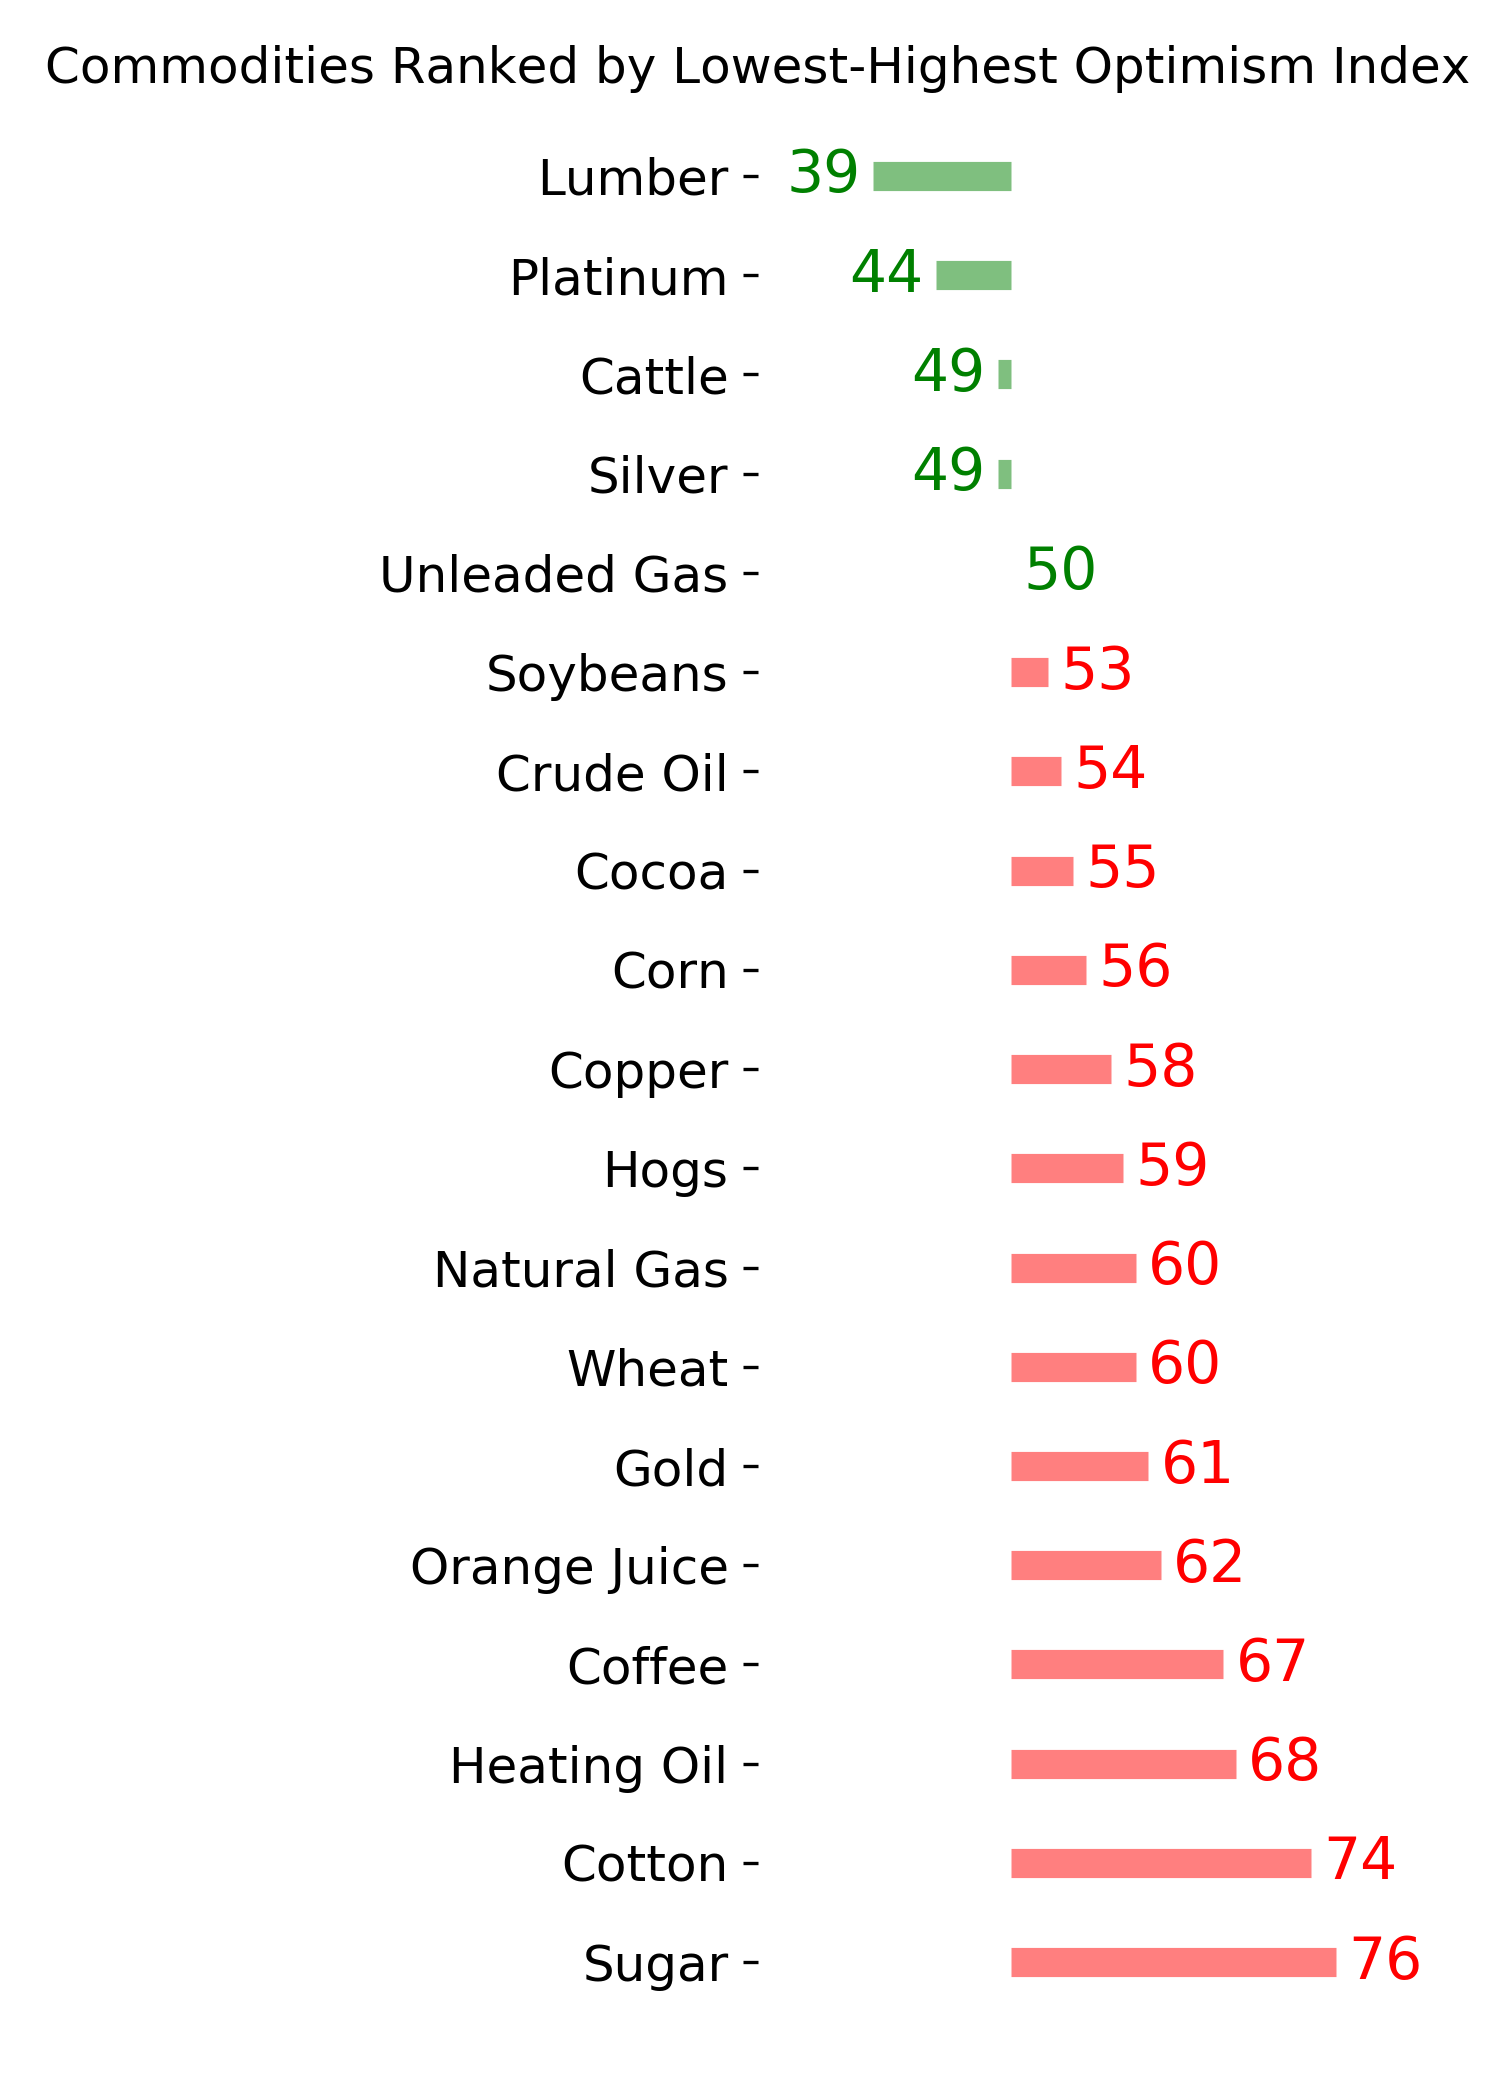
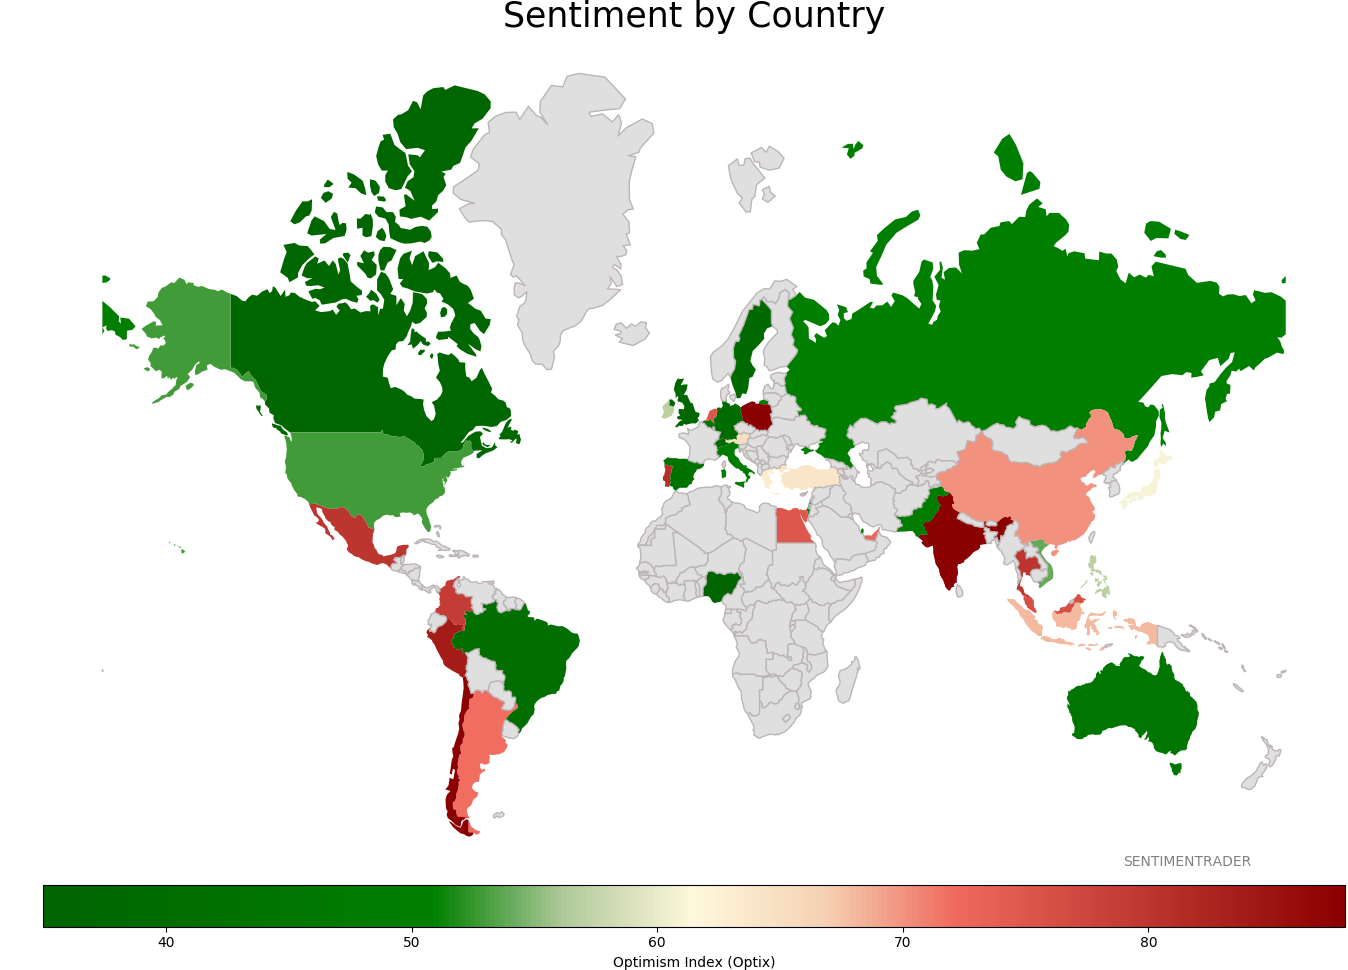
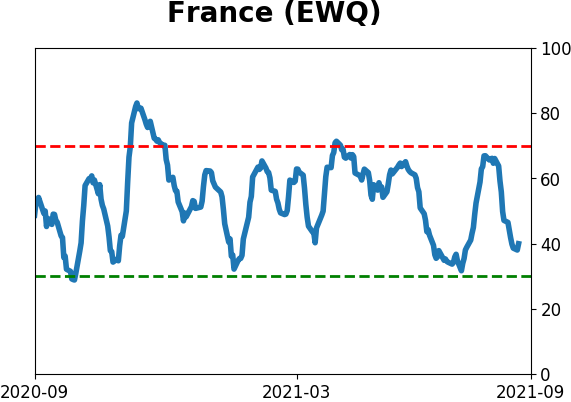
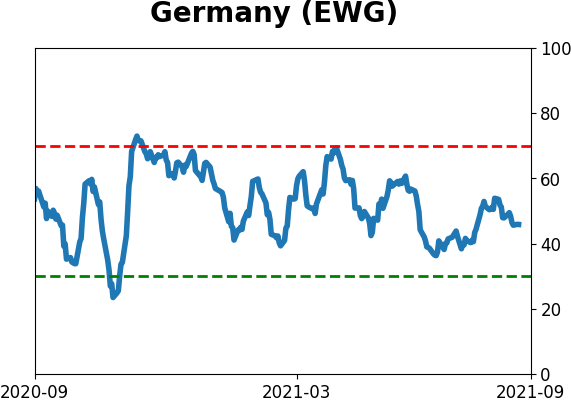
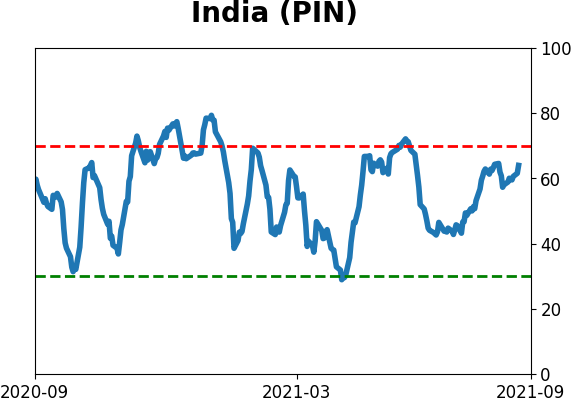
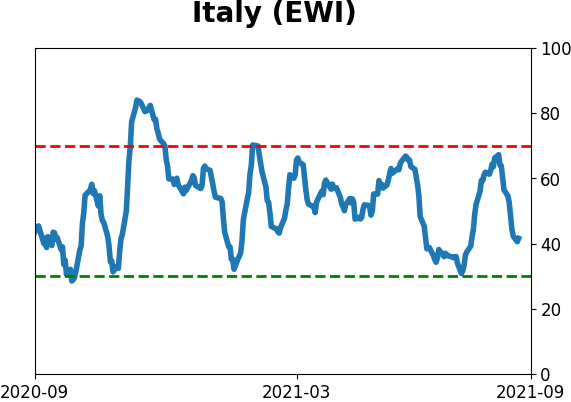
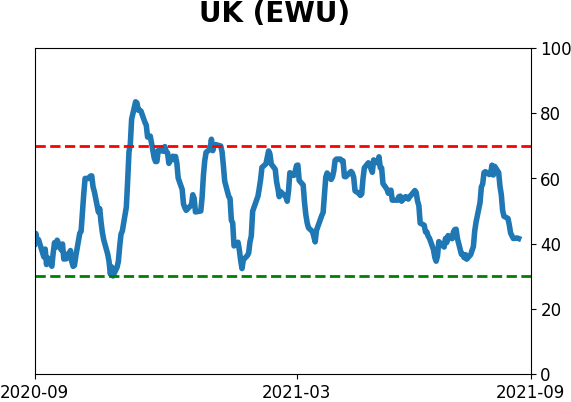
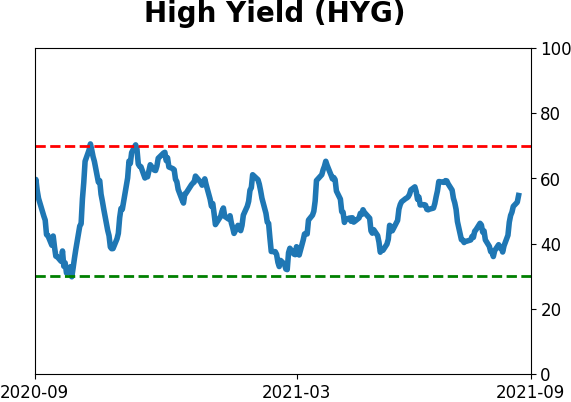
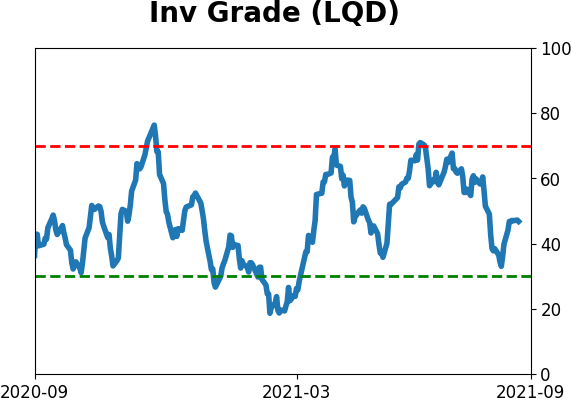
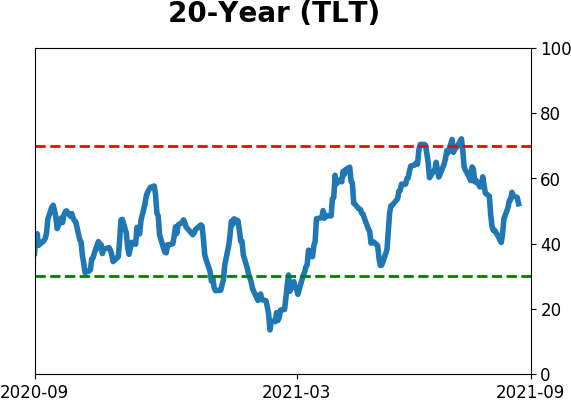
Sentiment Around The World
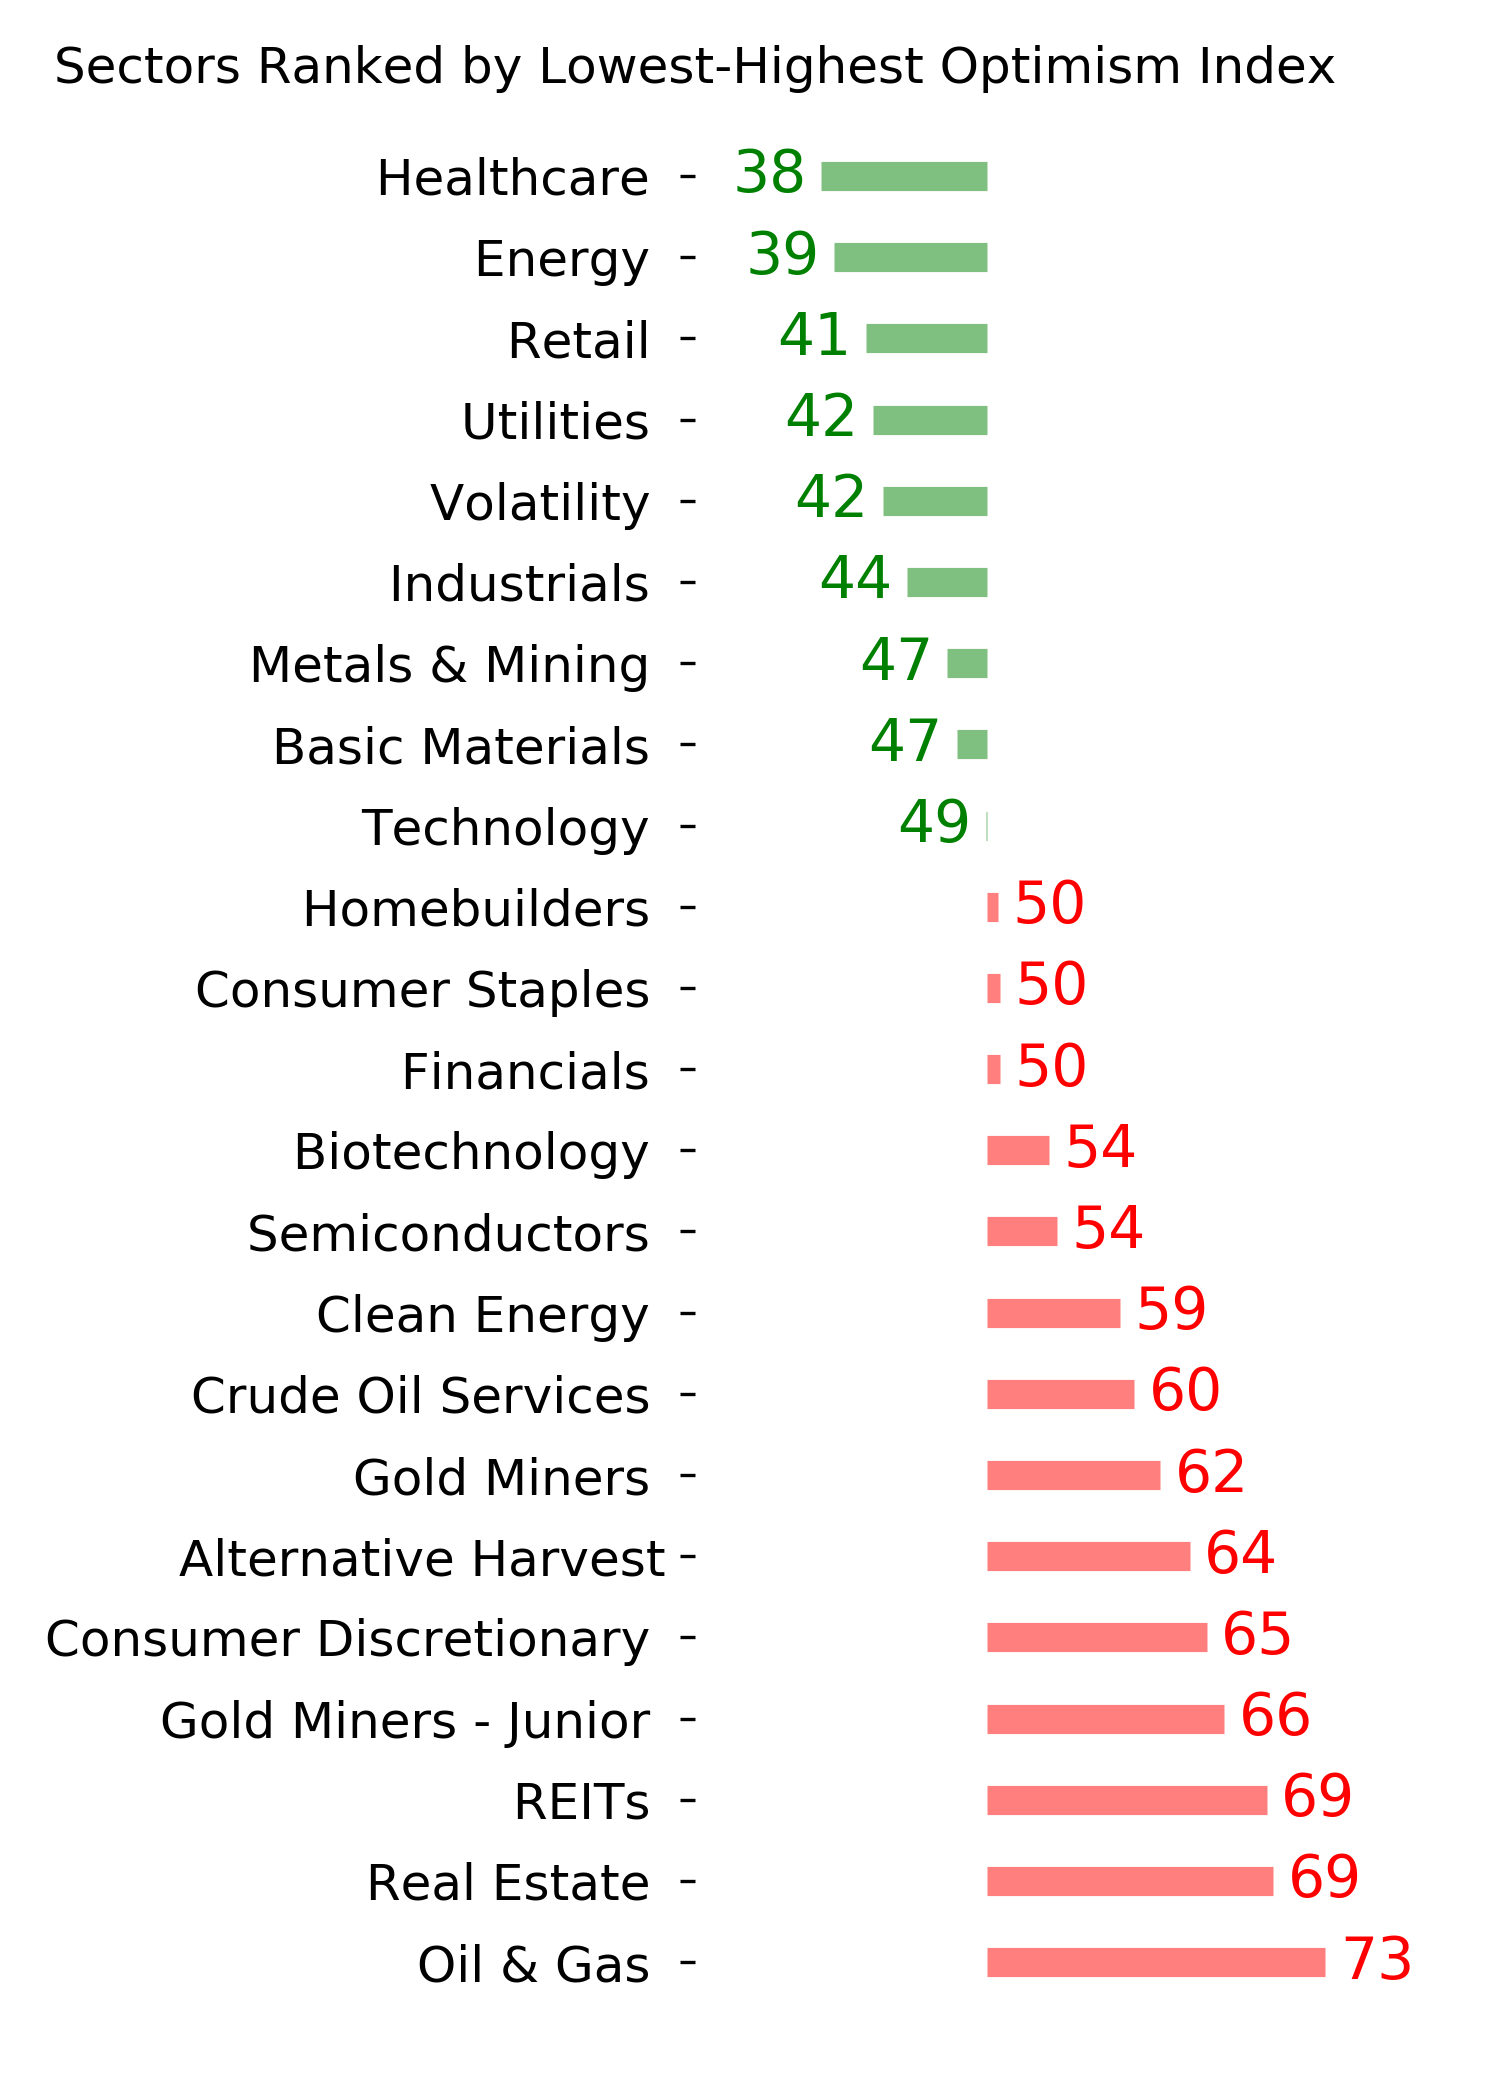
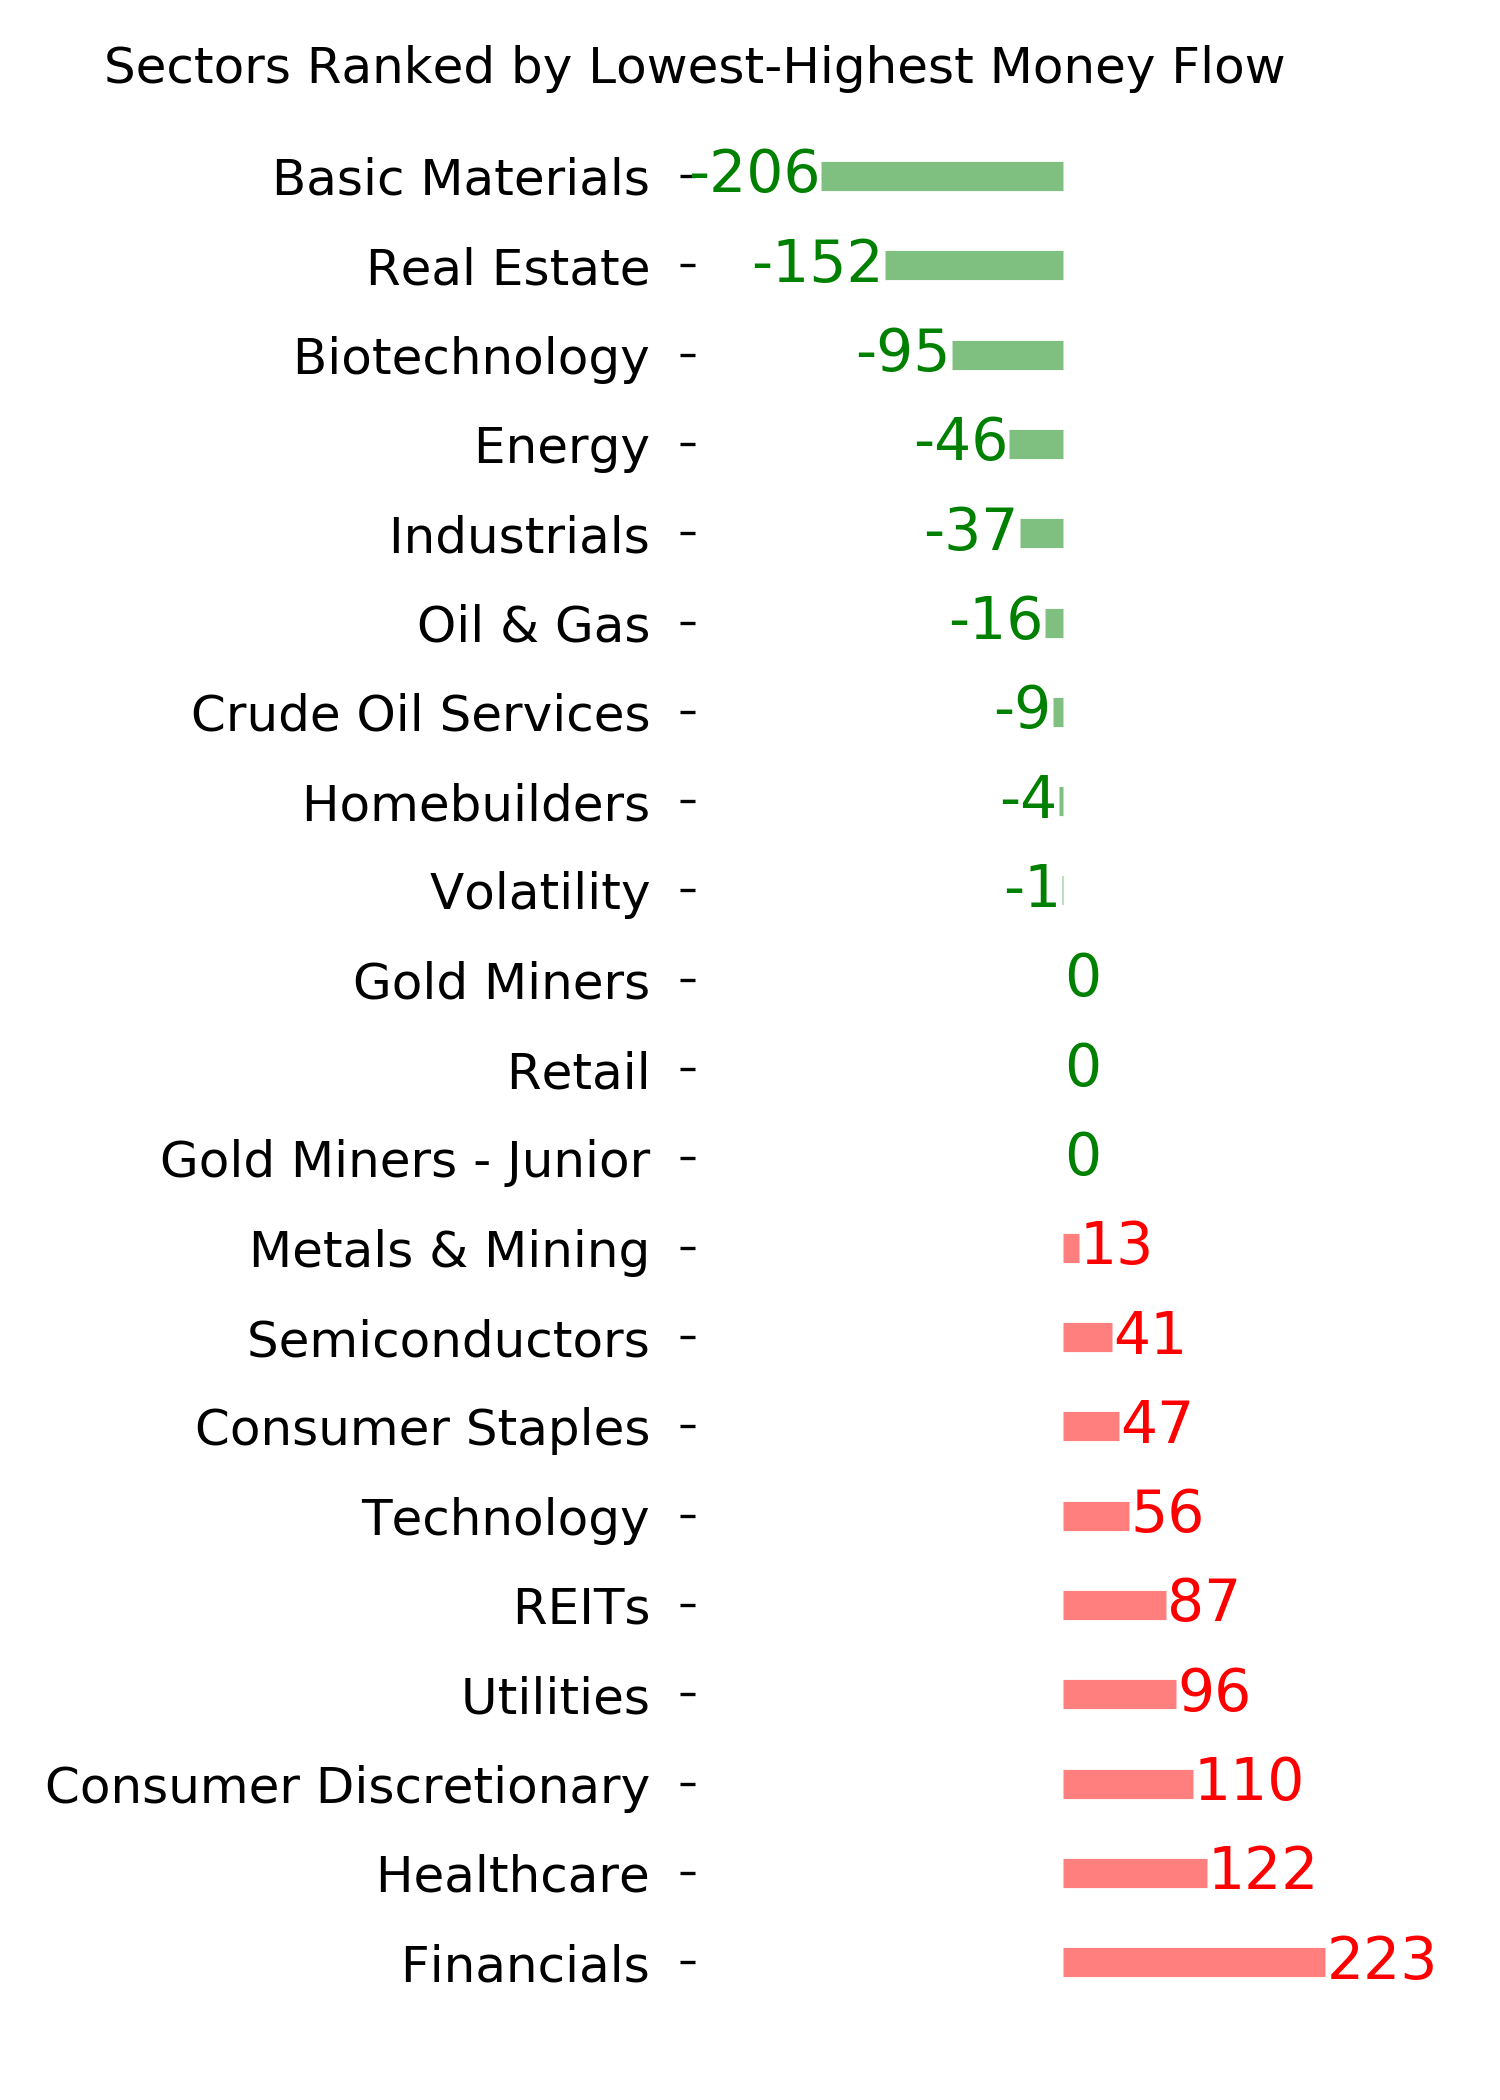
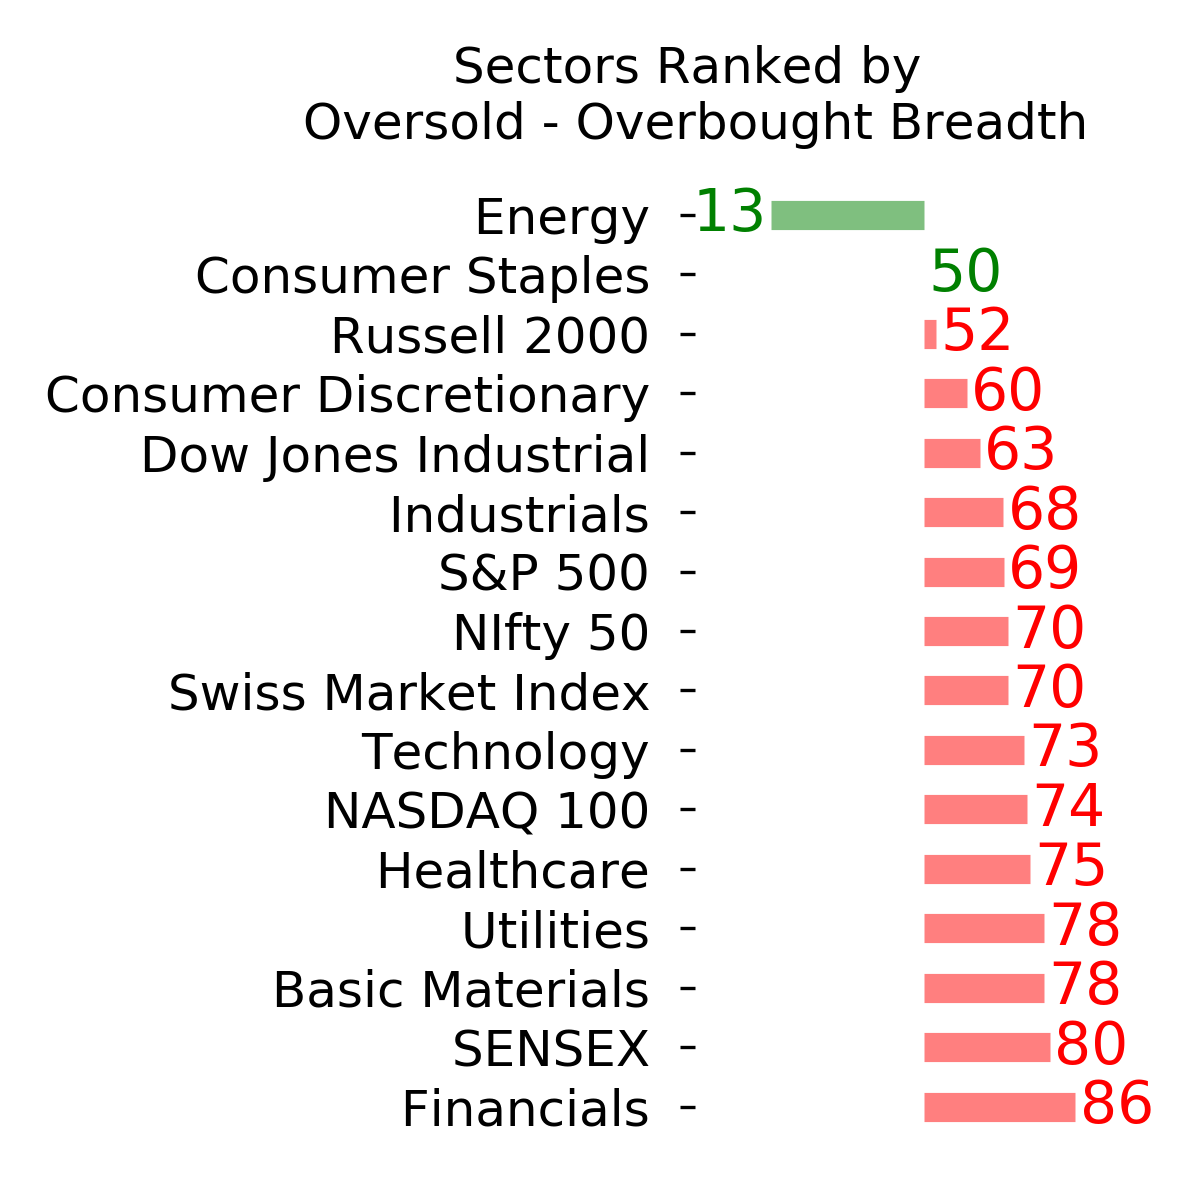
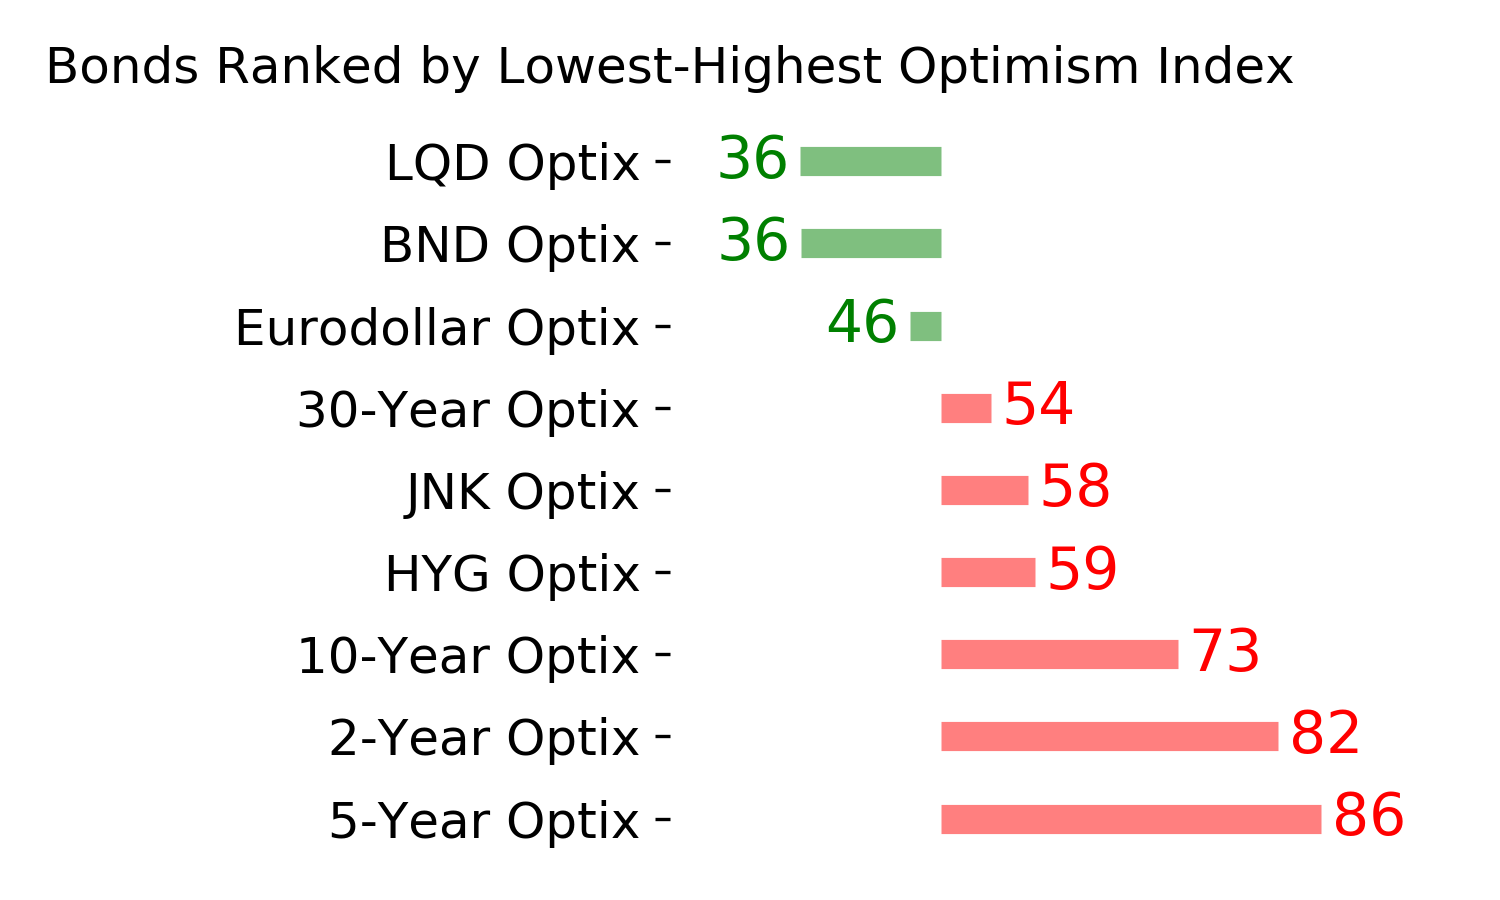
Optimism Index Thumbnails
|
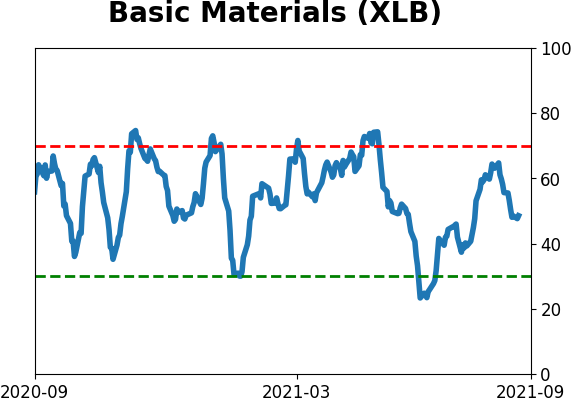
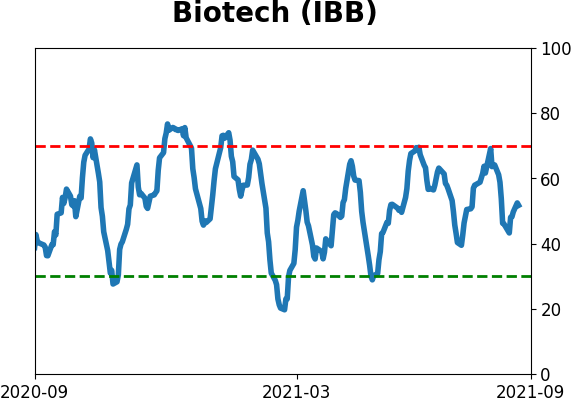
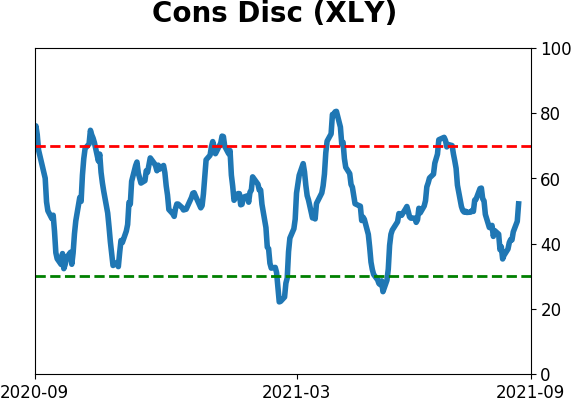
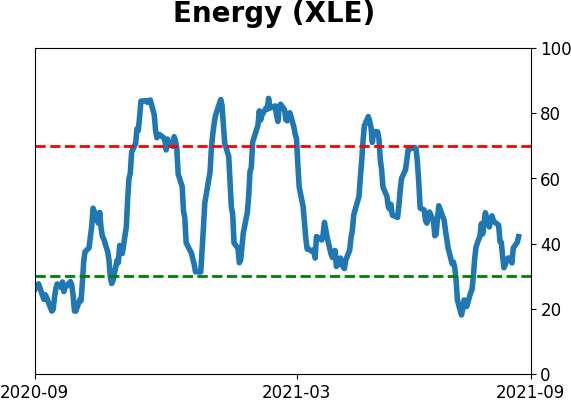
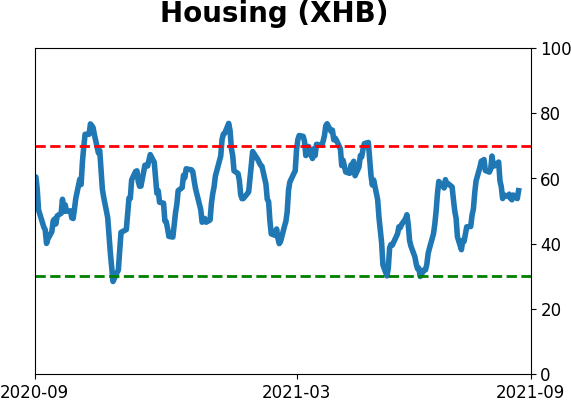
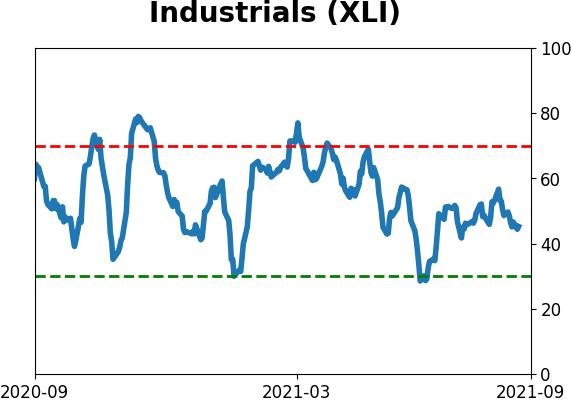
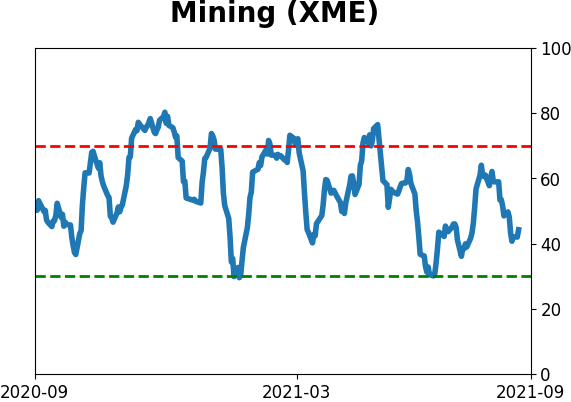
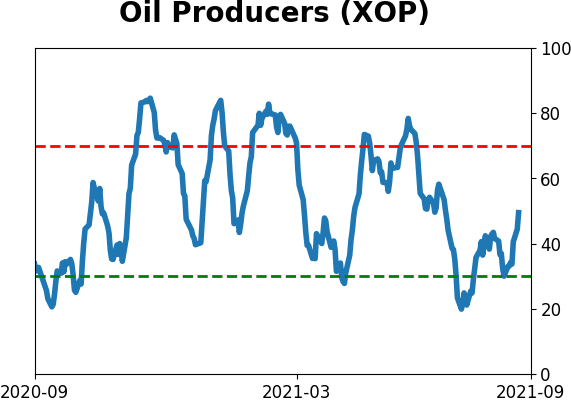
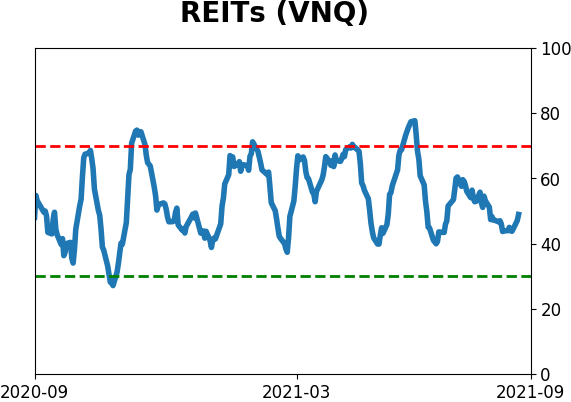
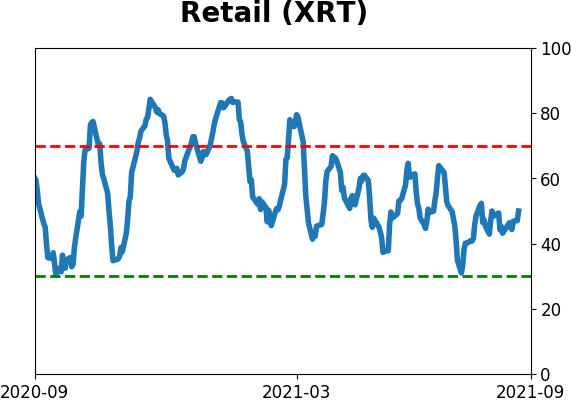
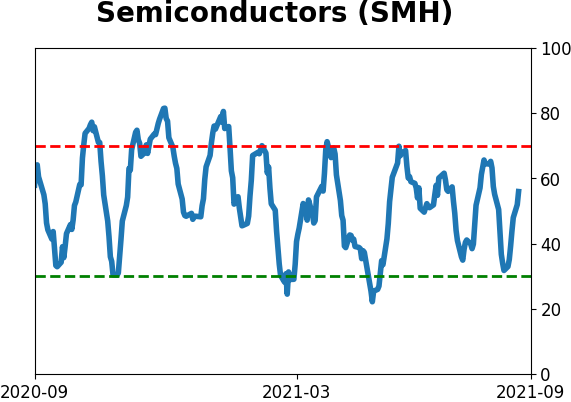
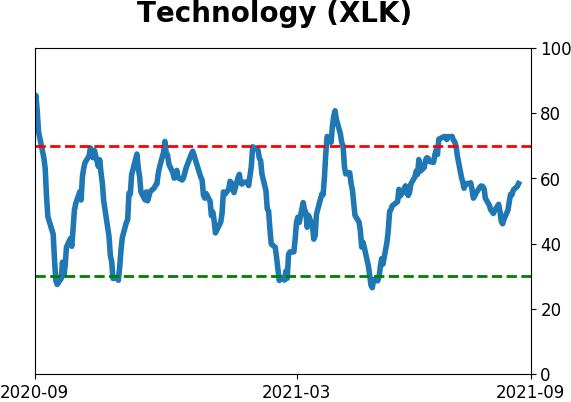
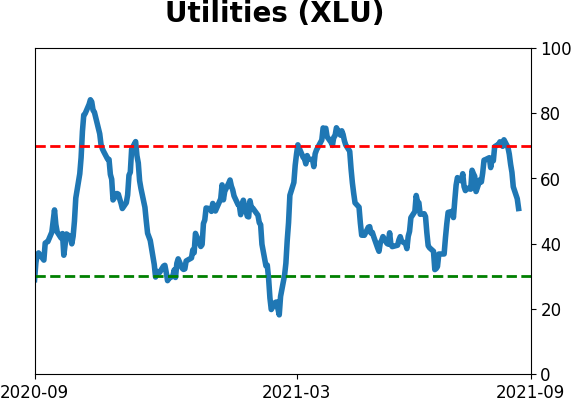
Sector ETF's - 10-Day Moving Average
|
|
|
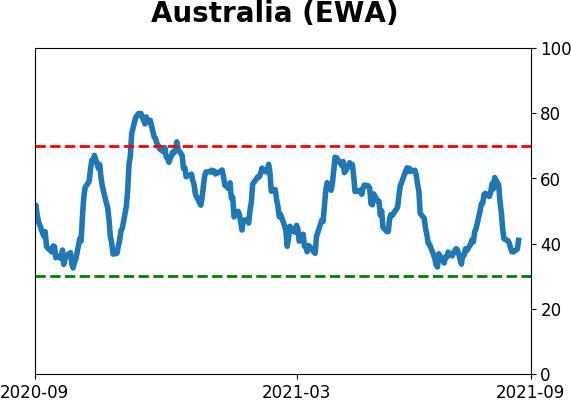
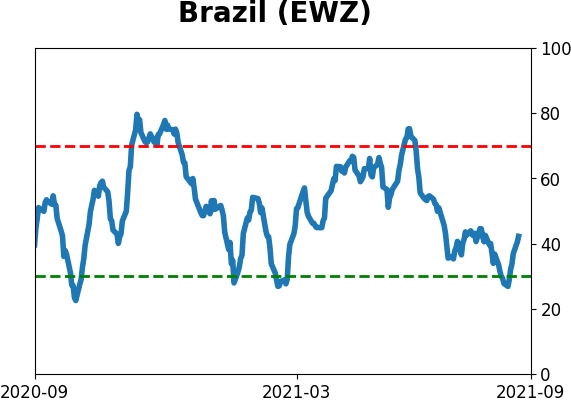
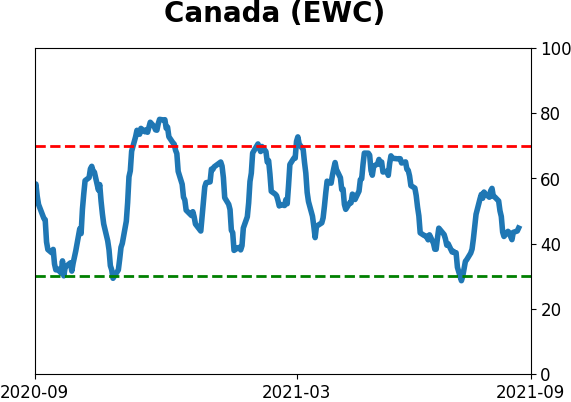
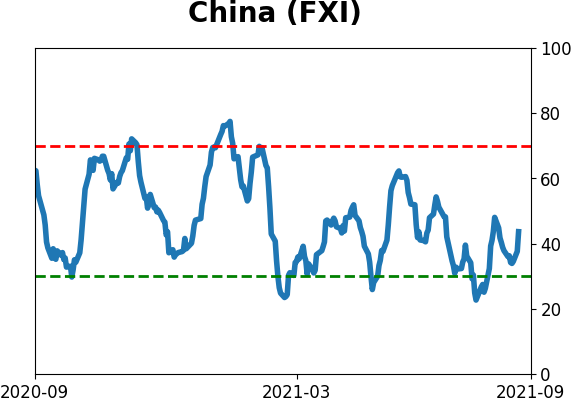
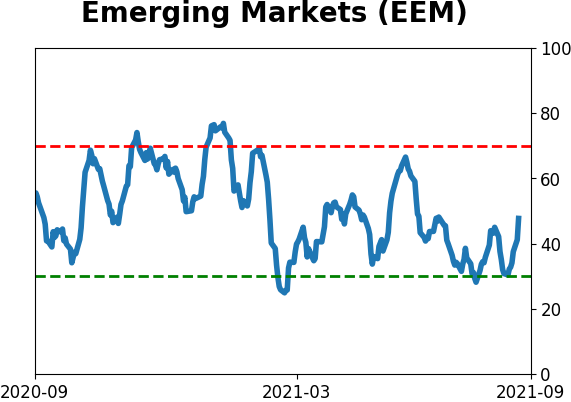
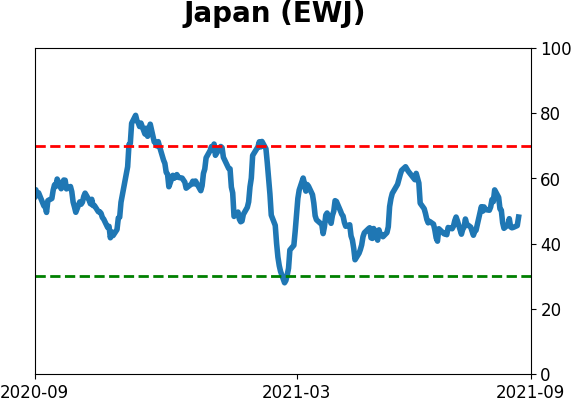
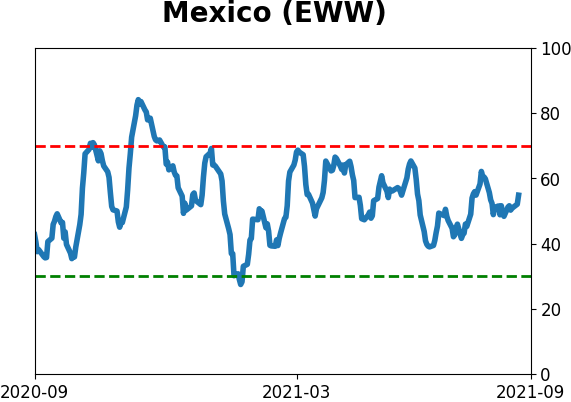
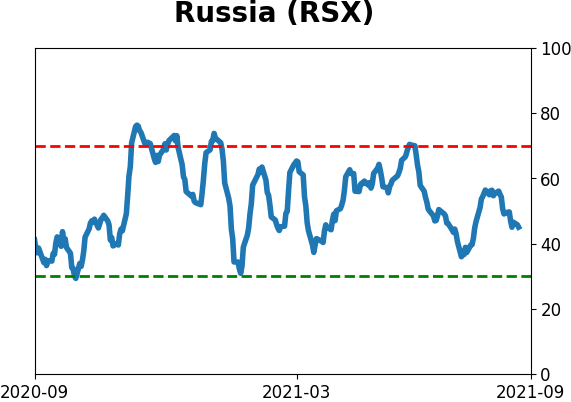
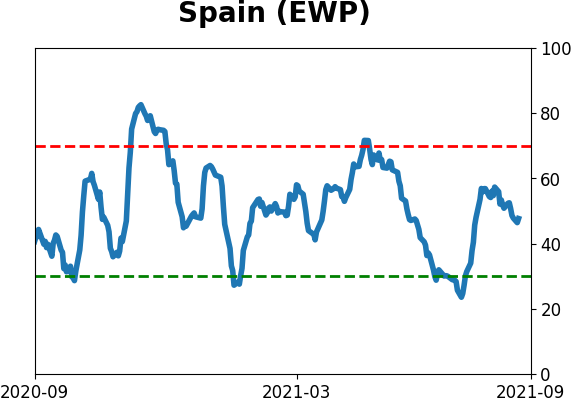
Country ETF's - 10-Day Moving Average
|
|
|
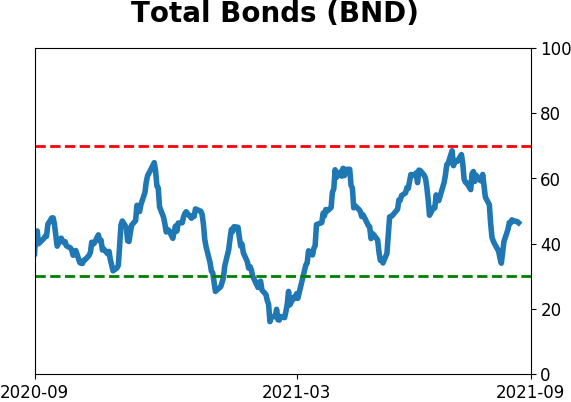
Bond ETF's - 10-Day Moving Average
|
|
|
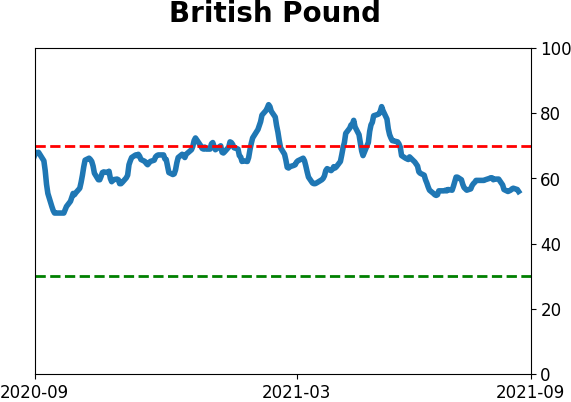
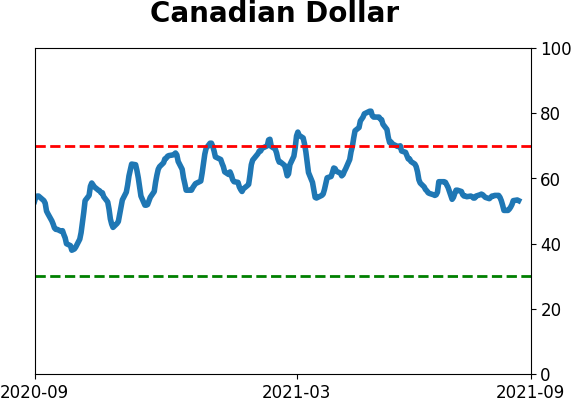
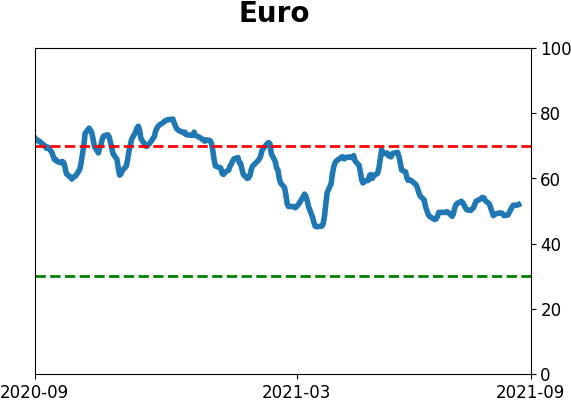
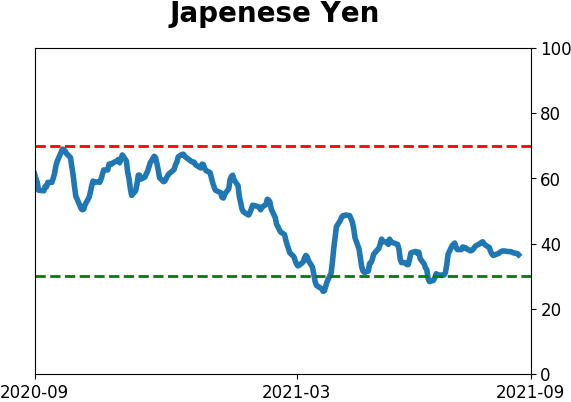
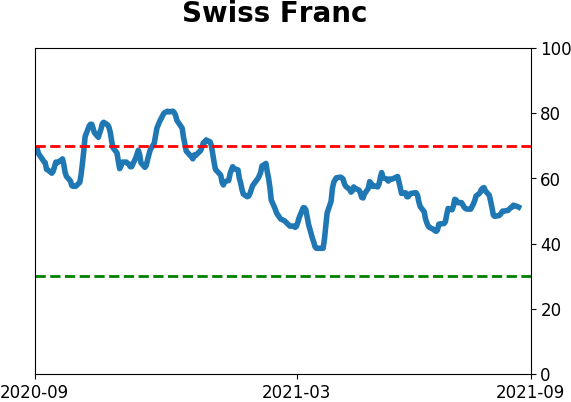
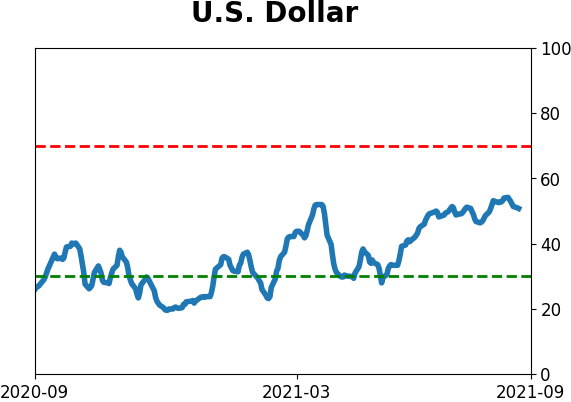
Currency ETF's - 5-Day Moving Average
|
|
|
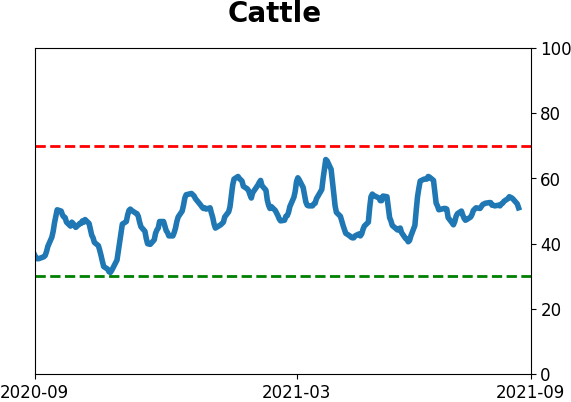
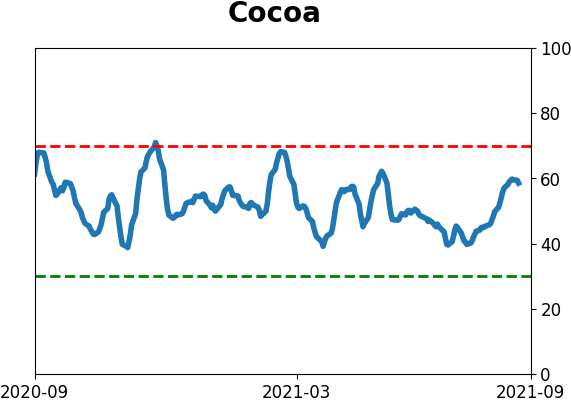
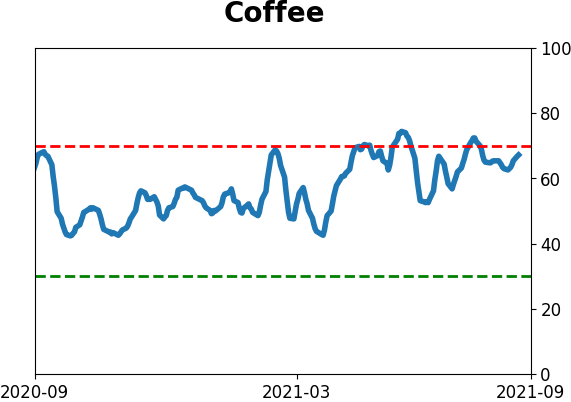
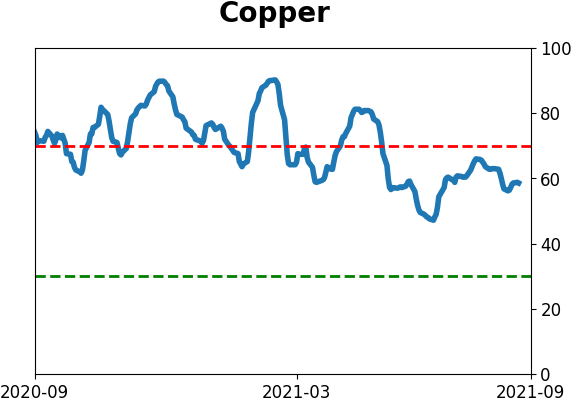
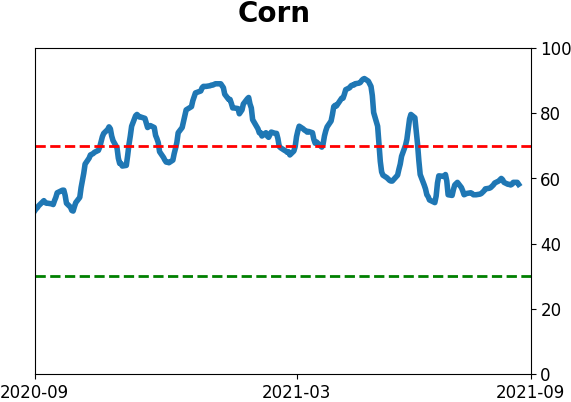
Commodity ETF's - 5-Day Moving Average
|
|