Headlines
|
|
Gold Is Holding Up While Miners Struggle:
As gold rose toward the upper end of its 2-month range this week, gold mining stocks remained near the lower end of their range. That has led to weakness in the months ahead.
Bottom Line:
STOCKS: Hold
Sentiment continues to decline from the speculative February peak. With deteriorating breadth, this raises the risk of poor short- to medium-term returns until optimism and better breadth returns. See the Outlook & Allocations page for more. BONDS: Hold
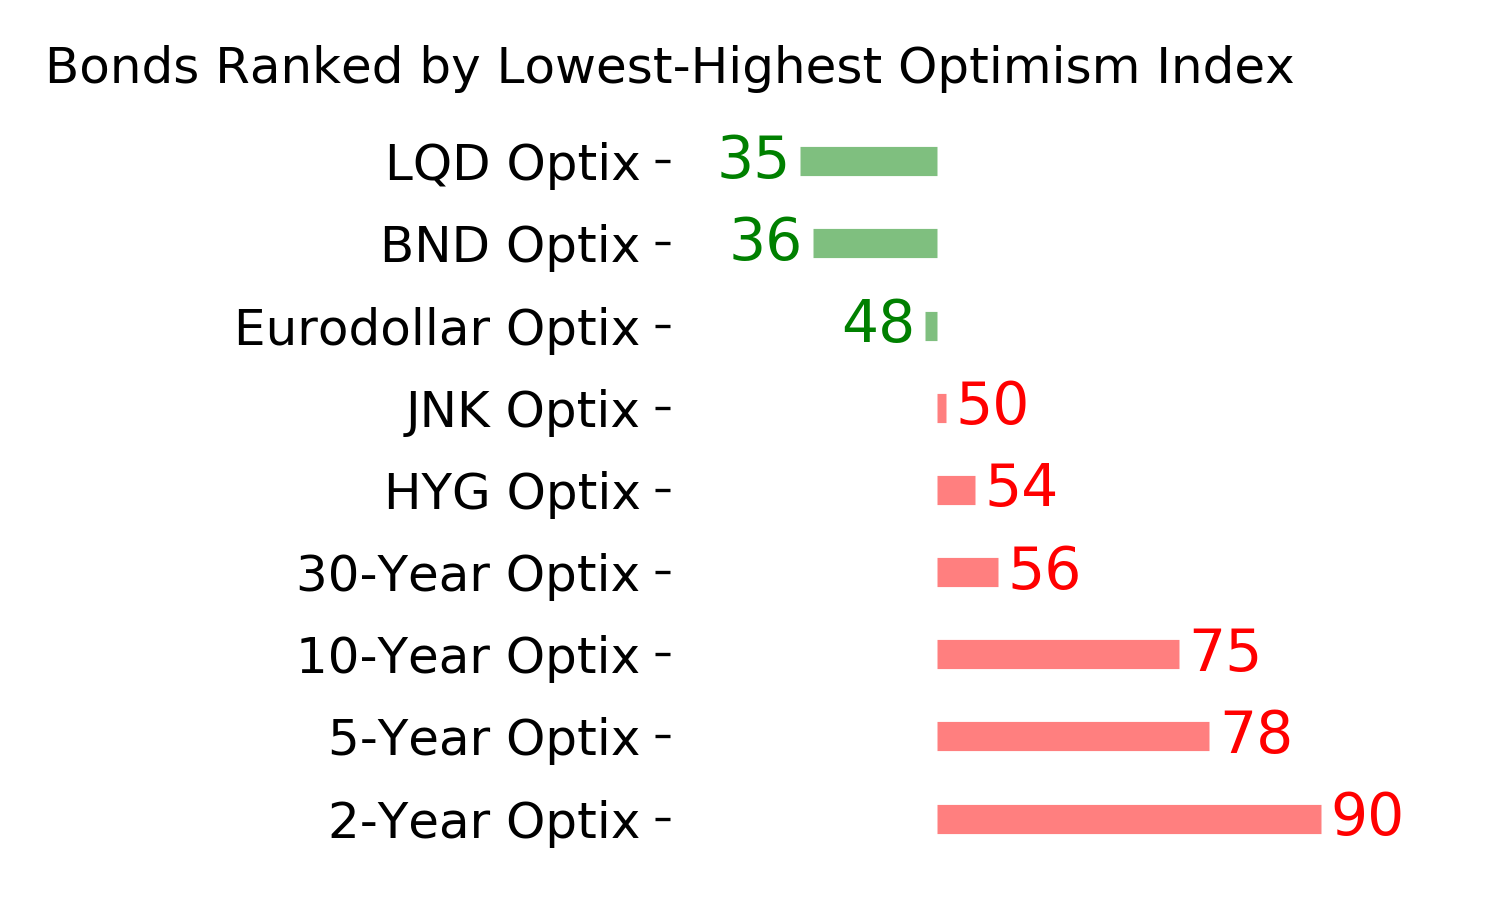
Various parts of the market got hit in March, with the lowest Bond Optimism Index we usually see during healthy environments. Bond prices have modest recovered and there is no edge among the data we follow. GOLD: Hold
Gold and miners were rejected after trying to recover above their 200-day averages in May. Lately, some medium-term (not long-term) oversold extremes in breadth measures among miners have triggered.
|
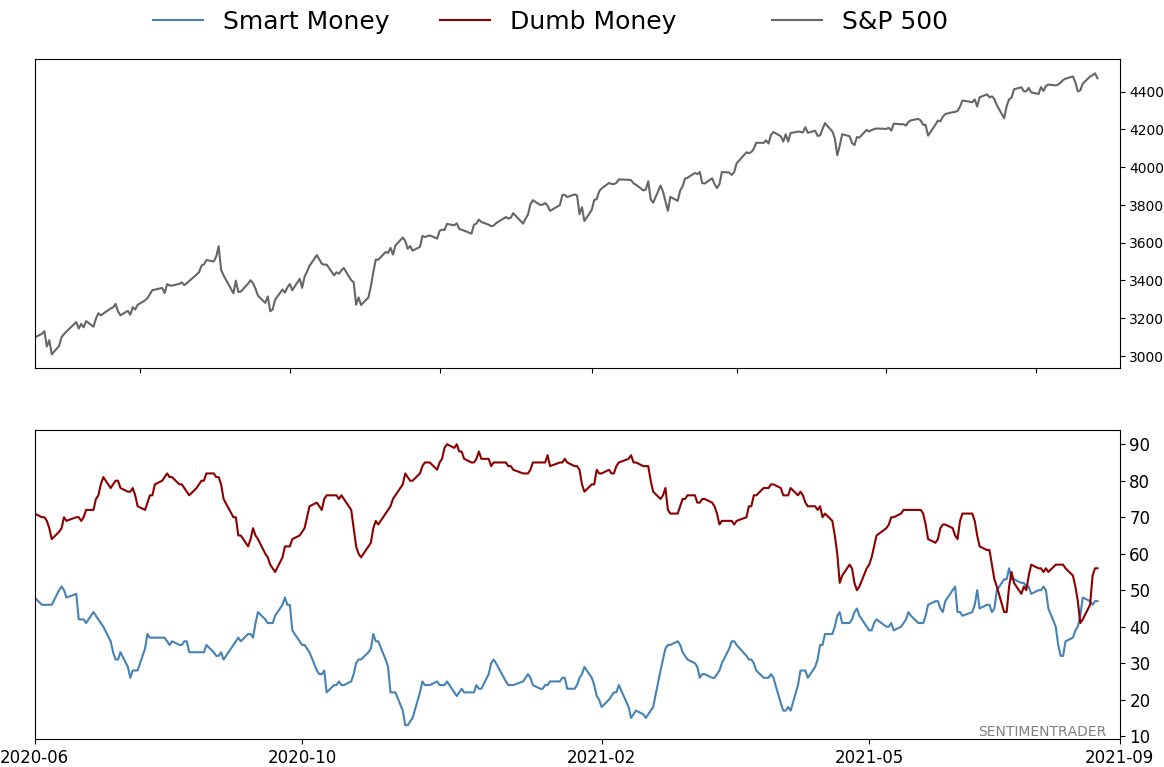
Smart / Dumb Money Confidence
|
Smart Money Confidence: 47%
Dumb Money Confidence: 56%
|
|
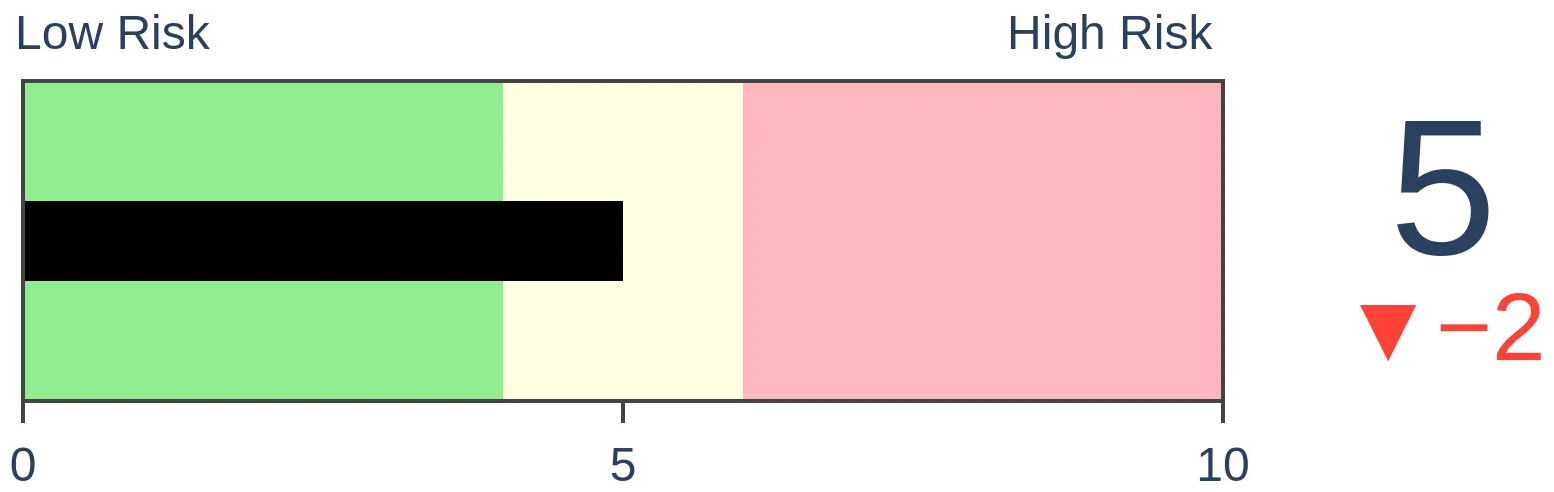
Risk Levels
Stocks Short-Term
|
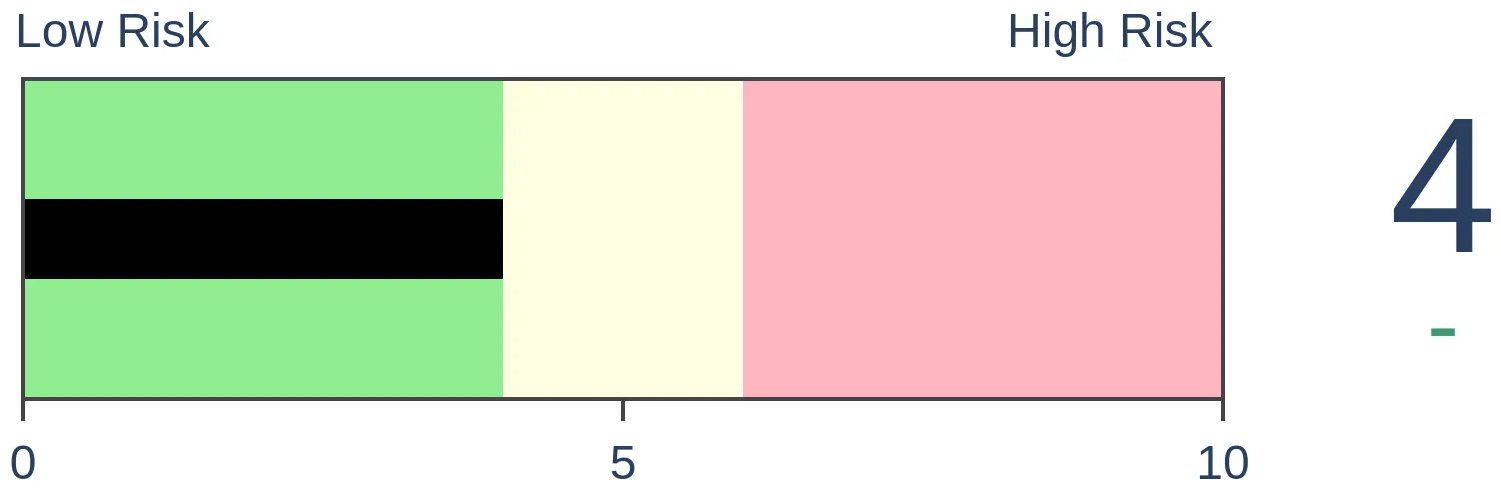
Stocks Medium-Term

|
|
Bonds

|
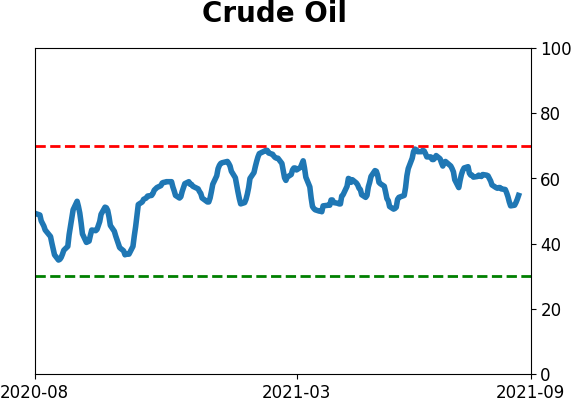
Crude Oil

|
|
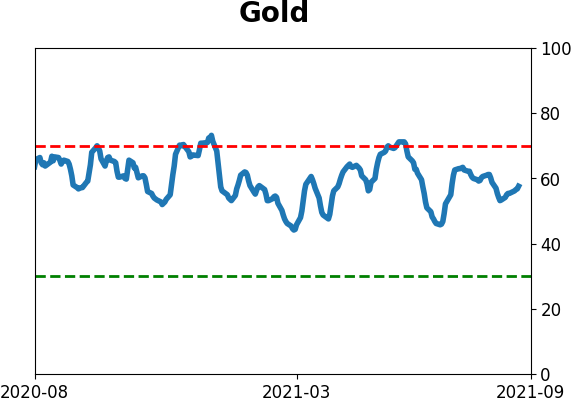
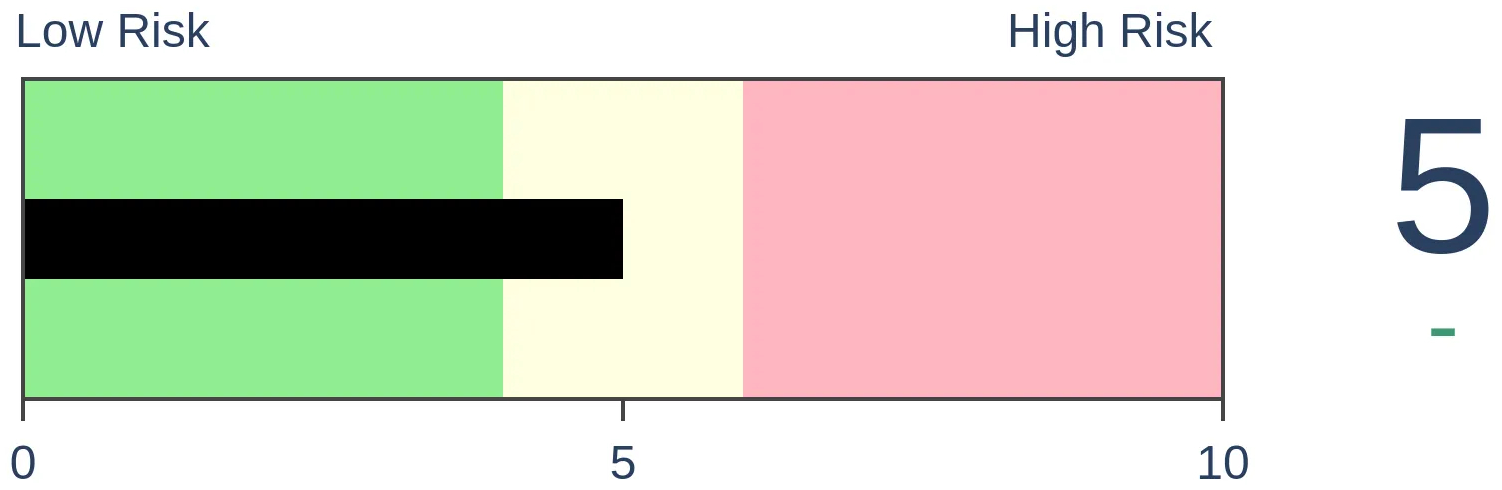
Gold
|
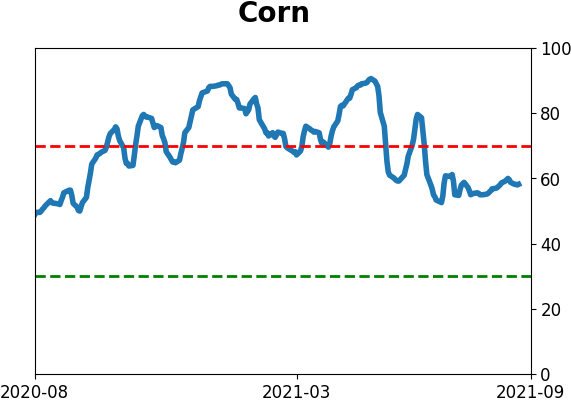
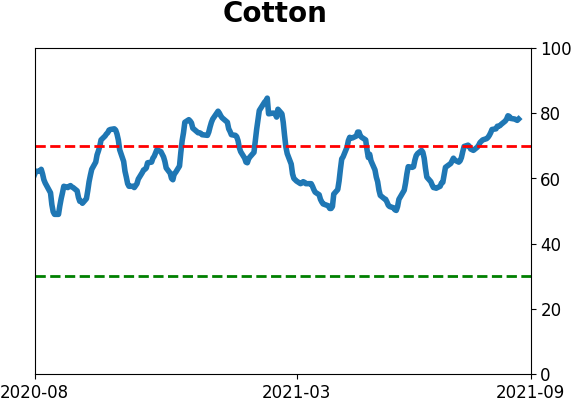
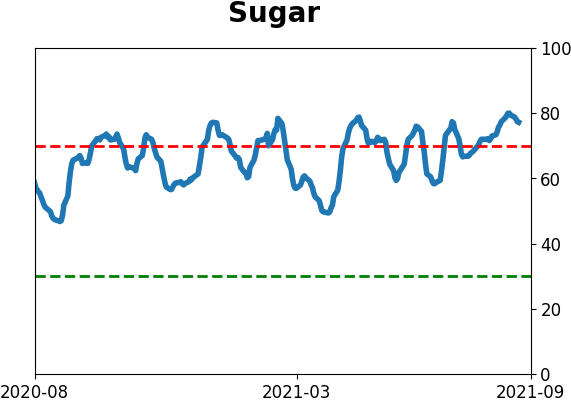
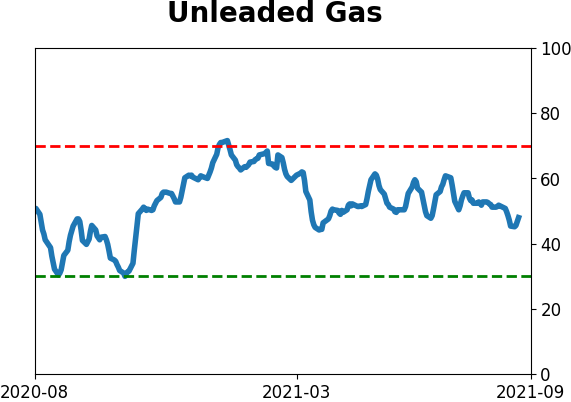
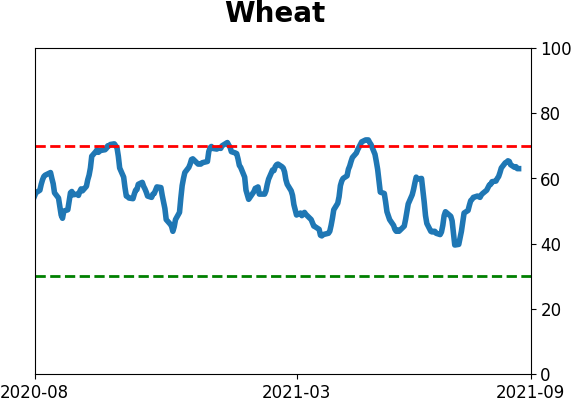
Agriculture
|
|
Research
By Jason Goepfert
BOTTOM LINE
As gold rose toward the upper end of its 2-month range this week, gold mining stocks remained near the lower end of their range. That has led to weakness in the months ahead.
FORECAST / TIMEFRAME
None
|
When gold tries to change its long-term trend, it usually struggles, as we discussed in May. Its sensitivity to economic surprises and interest rates also didn't help the outlook.
After a June plunge, though, gold has been treading water until recently. After a good week, gold is now trading in the upper end of its 2-month range. Gold mining stocks, however, are struggling.
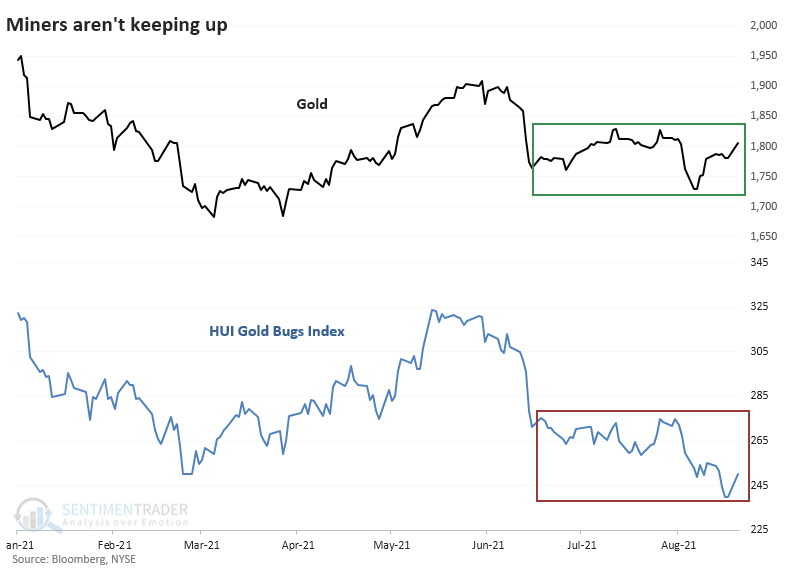
Looking at each of them relative to their ranges of the past 2 months, we can see how stark this divergence is.
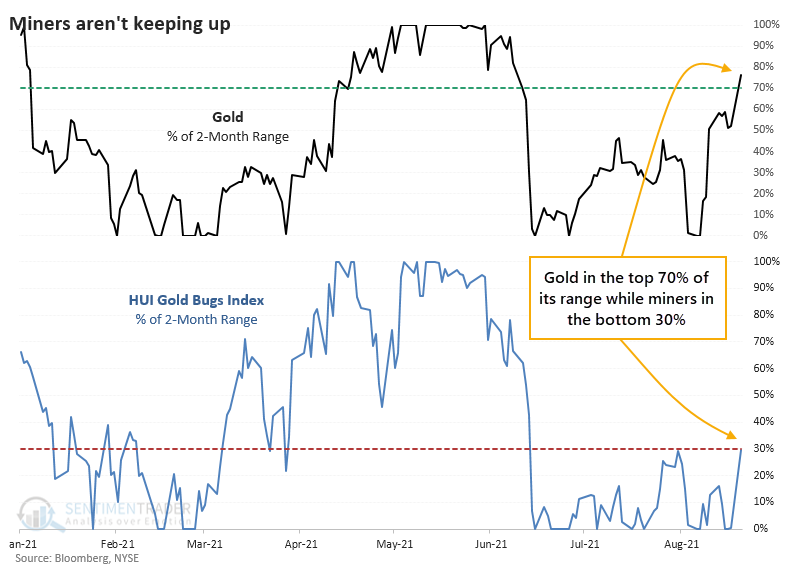
NOT A GREAT SIGN FOR MINERS
When mining stocks were in a downtrend at the time, this was not a good sign. The table below shows returns in the HUI Gold Bugs index when there were similar divergences between the price of gold and miners. This only includes signals when the Gold Bugs index was trading below its 200-day moving average.
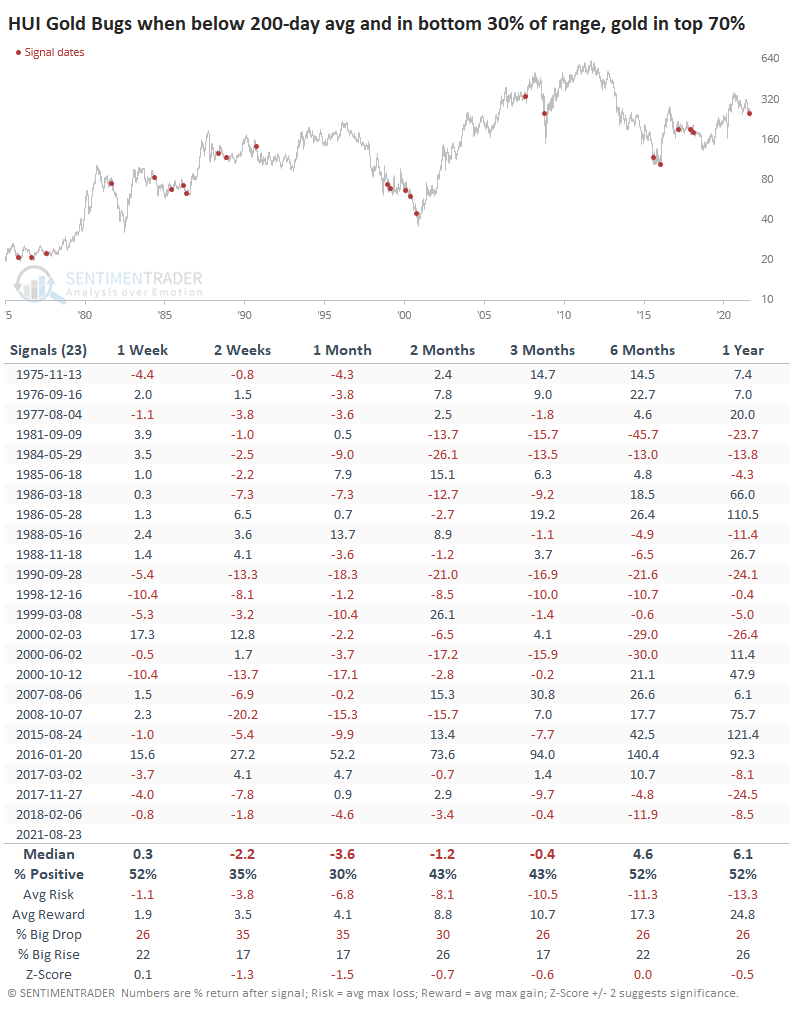
Medium-term returns for miners were weak. Consistency was very poor, and the risk/reward was either skewed toward risk or was evenly matched at best. That's not the best setup for gold bugs.
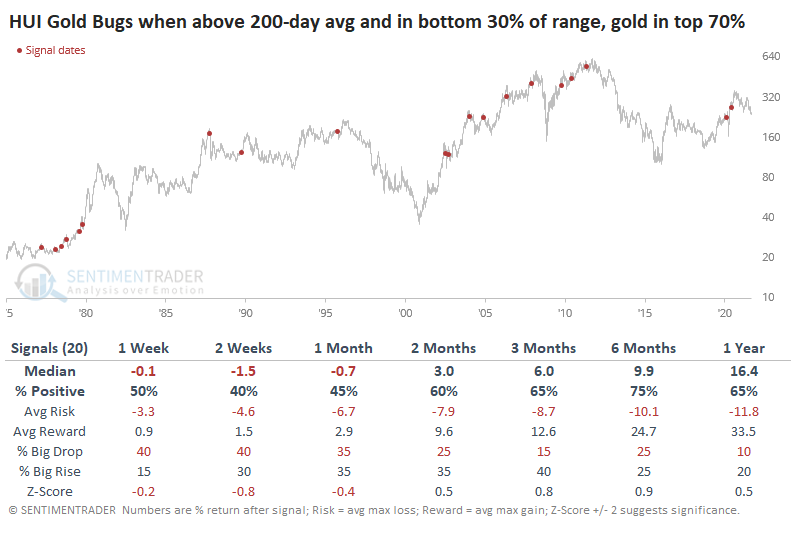
If miners were in an uptrend at the time of these signals, it was better for medium- to long-term returns.
NOT GREAT FOR GOLD, EITHER
While there is a high positive correlation between the price of gold and the performance of gold mining stocks, it's not perfect. So, we might think that if gold is doing relatively better than miners, it was a good sign for gold going forward. 'Twas not to be.
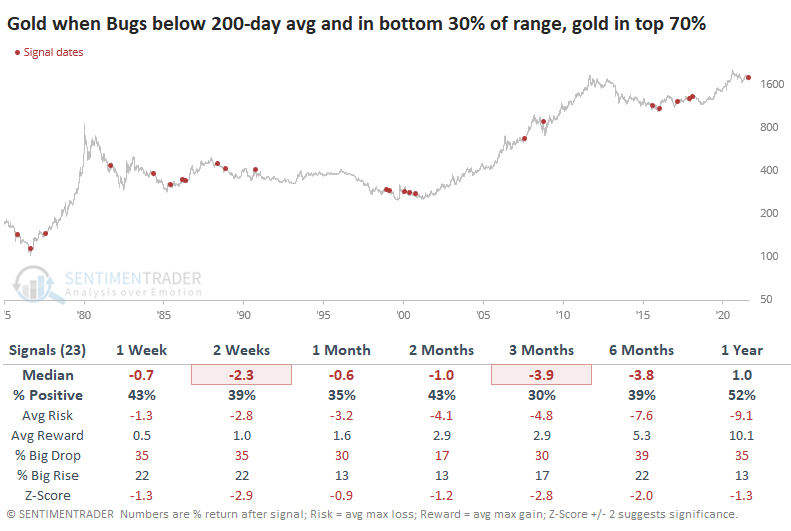
Across all time frames, gold performed worse than during random periods. Relative strength in gold didn't translate into stronger returns.
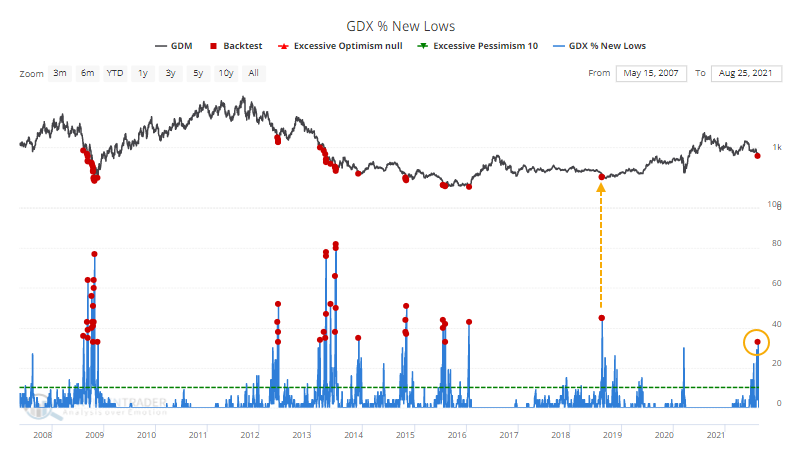
Weakness over the past few weeks, in particular, has meant that some of the breadth metrics among miners are starting to reach oversold levels.
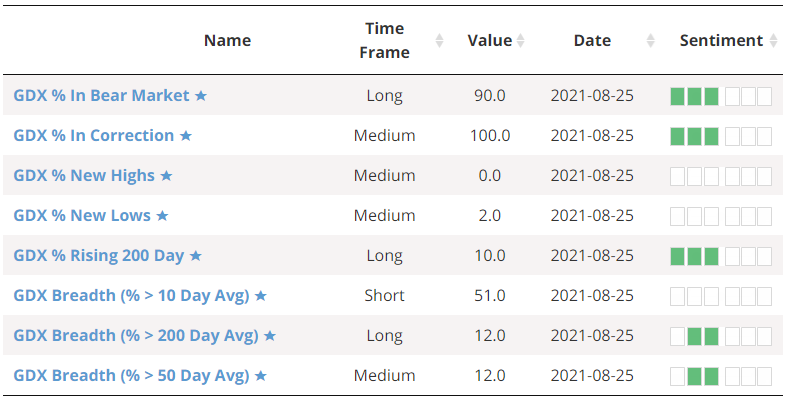
On August 19, more than a third of mining stocks fell to a 52-week low, the most in 3 years. It triggered right at the bottom in 2018. It's a high number for a medium-term washout but is well under the 50% or higher figure we see during long-term panics.
Since May, we've struggled to find much that has consistently preceded strong positive returns in gold or miners. That's still the case. There are some modest extremes among miner breadth metrics, maybe even enough to expect a multi-week or longer bounce. There just isn't enough consistency among what we've been watching to suggest that it's a high probability setup.
Active Studies
| Time Frame | Bullish | Bearish | | Short-Term | 0 | 5 | | Medium-Term | 4 | 3 | | Long-Term | 11 | 5 |
|
Indicators at Extremes
Portfolio
| Position | Description | Weight % | Added / Reduced | Date | | Stocks | RSP | 4.1 | Added 4.1% | 2021-05-19 | | Bonds | 23.9% BND, 6.9% SCHP | 30.7 | Reduced 7.1% | 2021-05-19 | | Commodities | GCC | 2.6 | Reduced 2.1%
| 2020-09-04 | | Precious Metals | GDX | 5.6 | Reduced 4.2% | 2021-05-19 | | Special Situations | 4.3% XLE, 2.2% PSCE | 7.6 | Reduced 5.6% | 2021-04-22 | | Cash | | 49.4 | | |
|
Updates (Changes made today are underlined)
Much of our momentum and trend work has remained positive for several months, with some scattered exceptions. Almost all sentiment-related work has shown a poor risk/reward ratio for stocks, especially as speculation drove to record highs in exuberance in February. Much of that has worn off, and most of our models are back toward neutral levels. There isn't much to be excited about here. The same goes for bonds and even gold. Gold has been performing well lately and is back above long-term trend lines. The issue is that it has a poor record of holding onto gains when attempting a long-term trend change like this, so we'll take a wait-and-see approach. RETURN YTD: 8.2% 2020: 8.1%, 2019: 12.6%, 2018: 0.6%, 2017: 3.8%, 2016: 17.1%, 2015: 9.2%, 2014: 14.5%, 2013: 2.2%, 2012: 10.8%, 2011: 16.5%, 2010: 15.3%, 2009: 23.9%, 2008: 16.2%, 2007: 7.8%
|
|
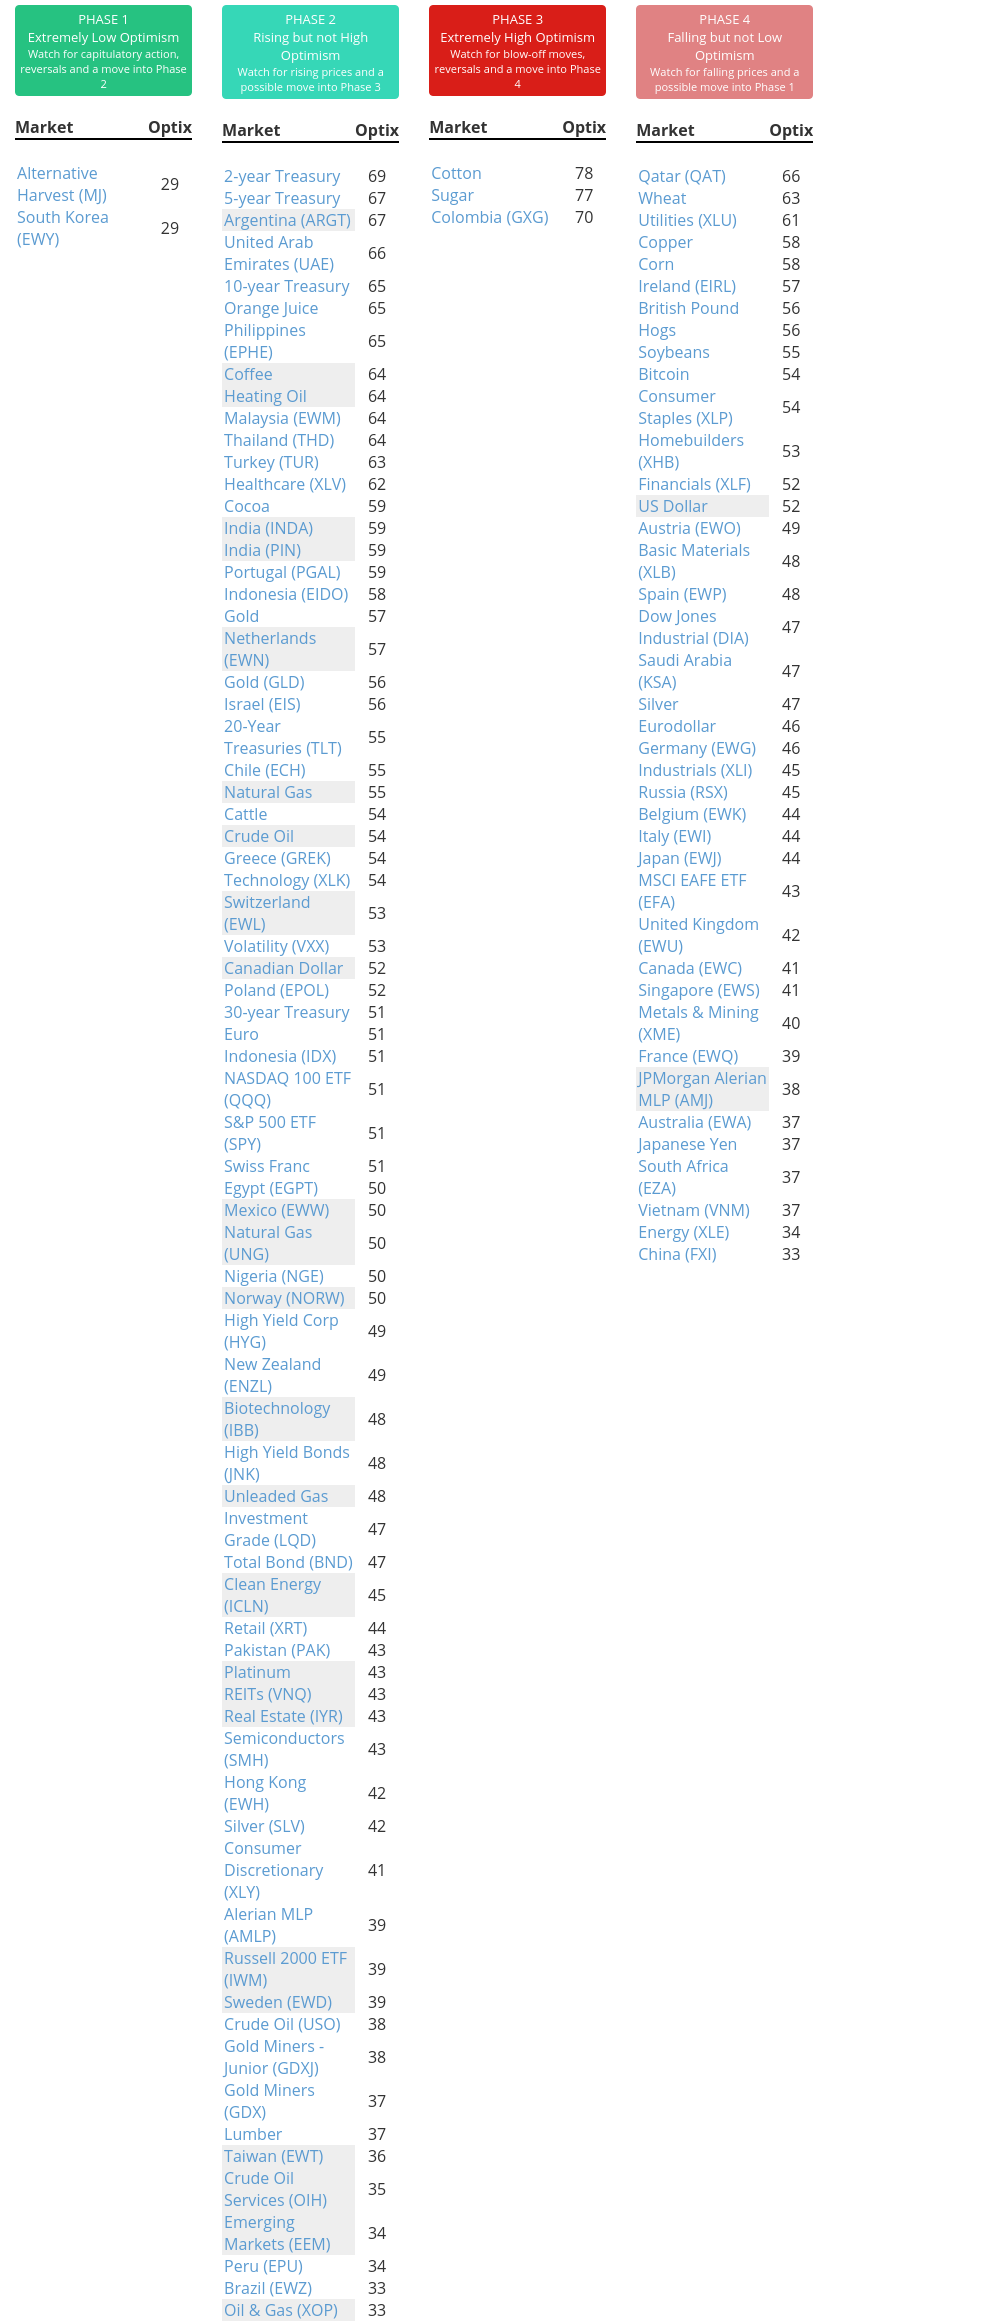
Phase Table
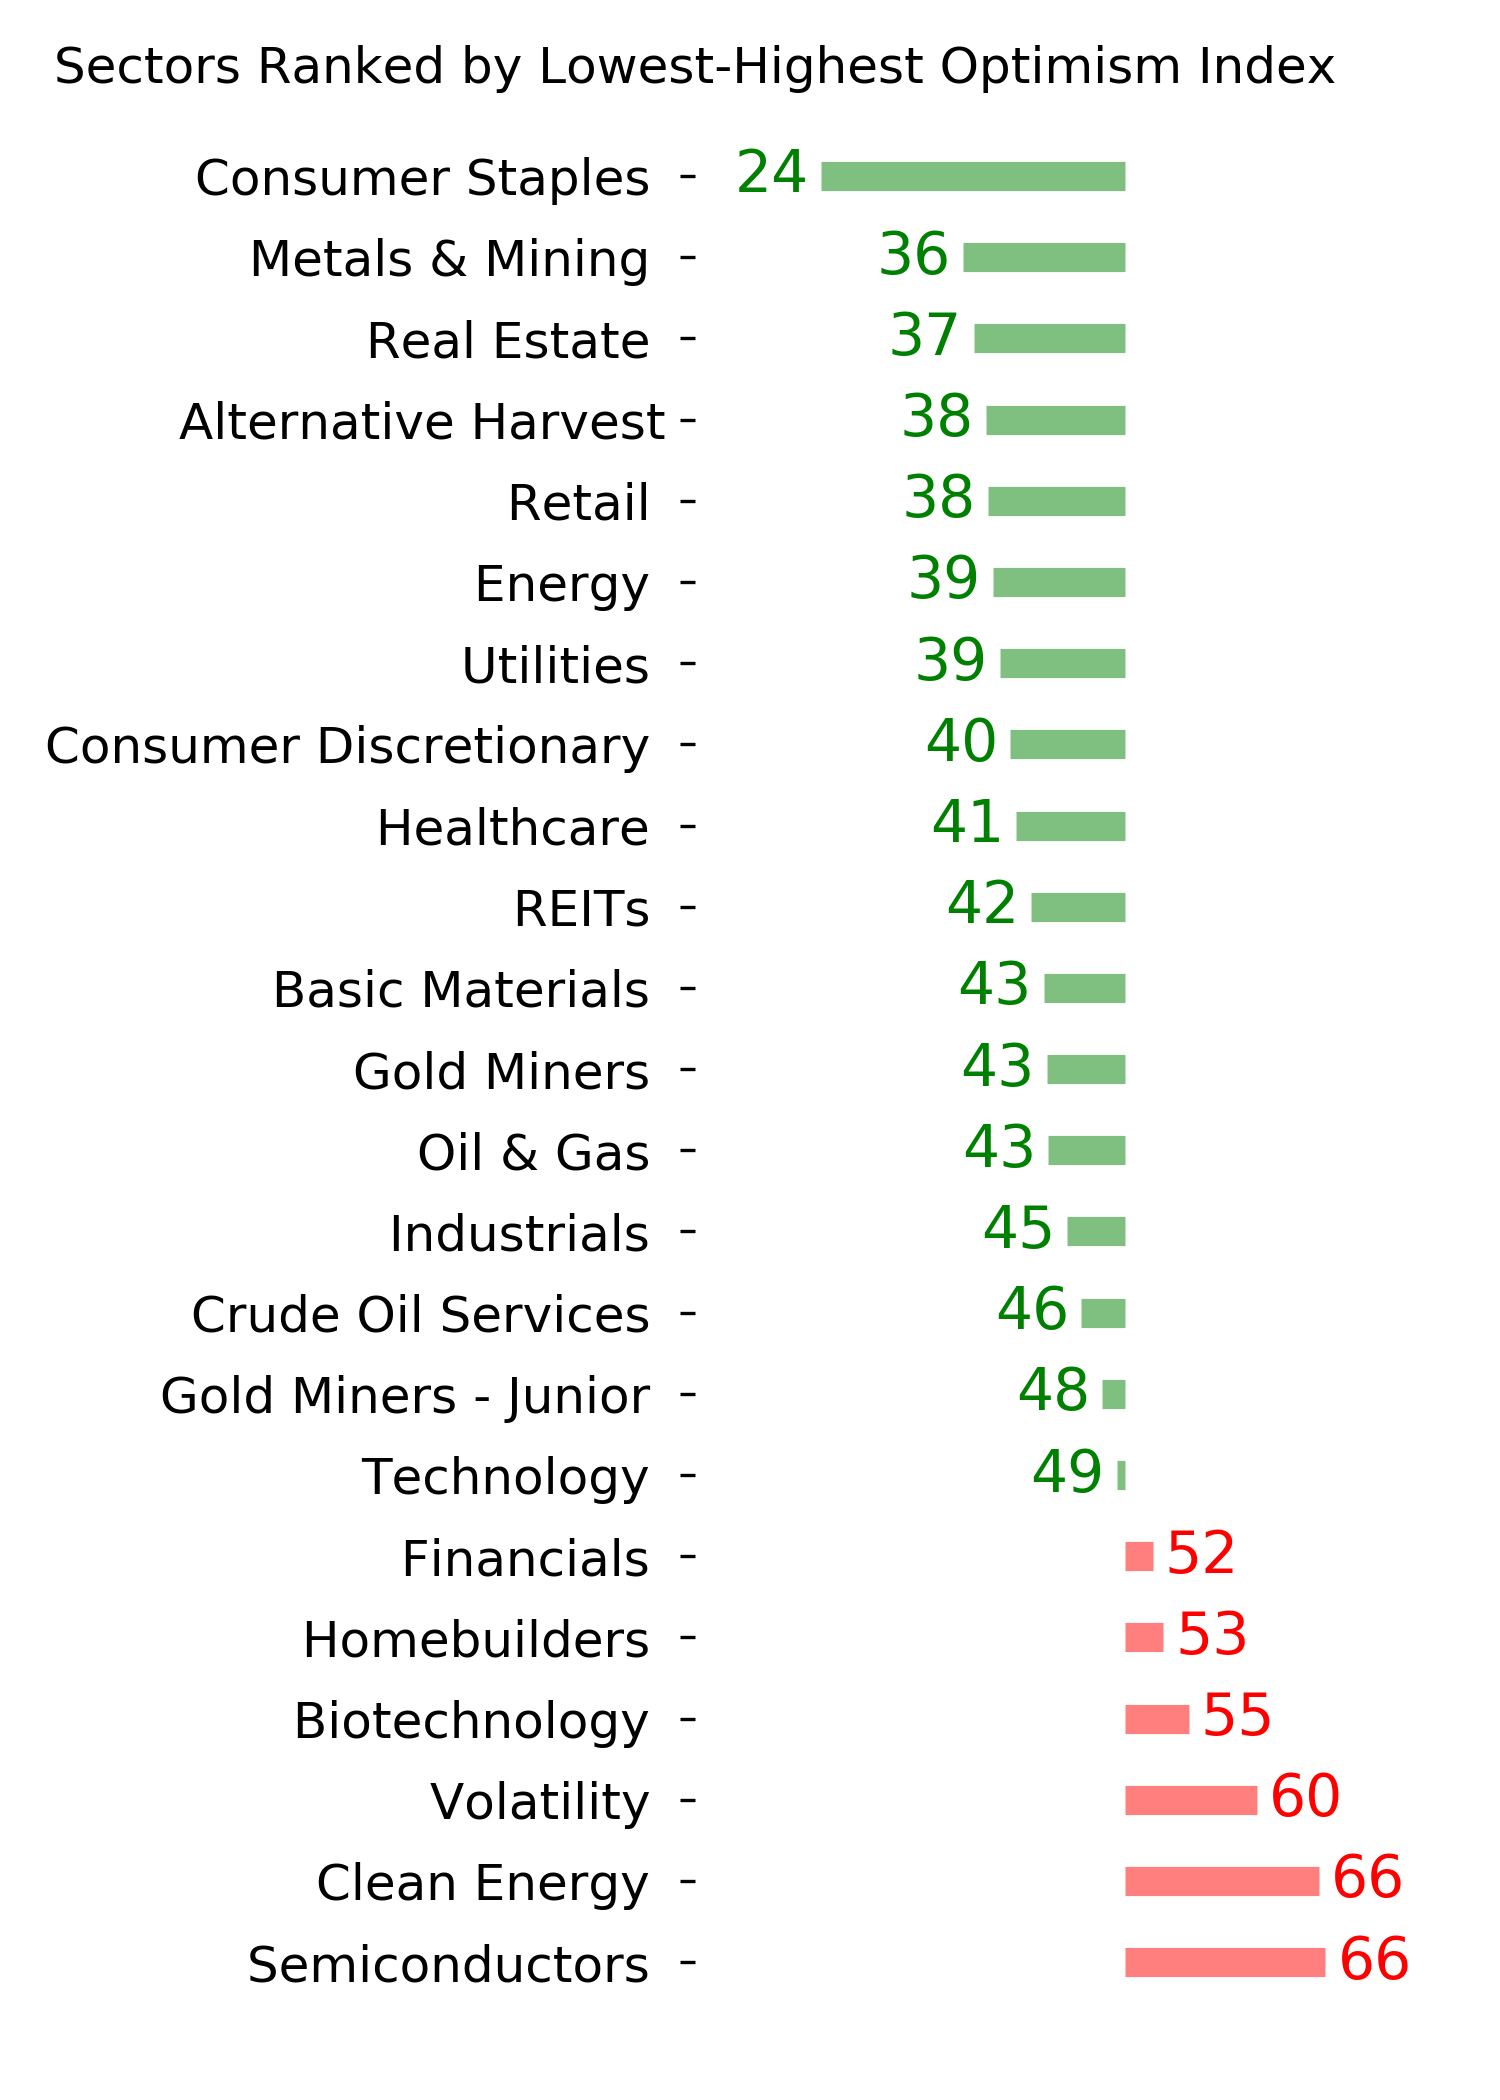
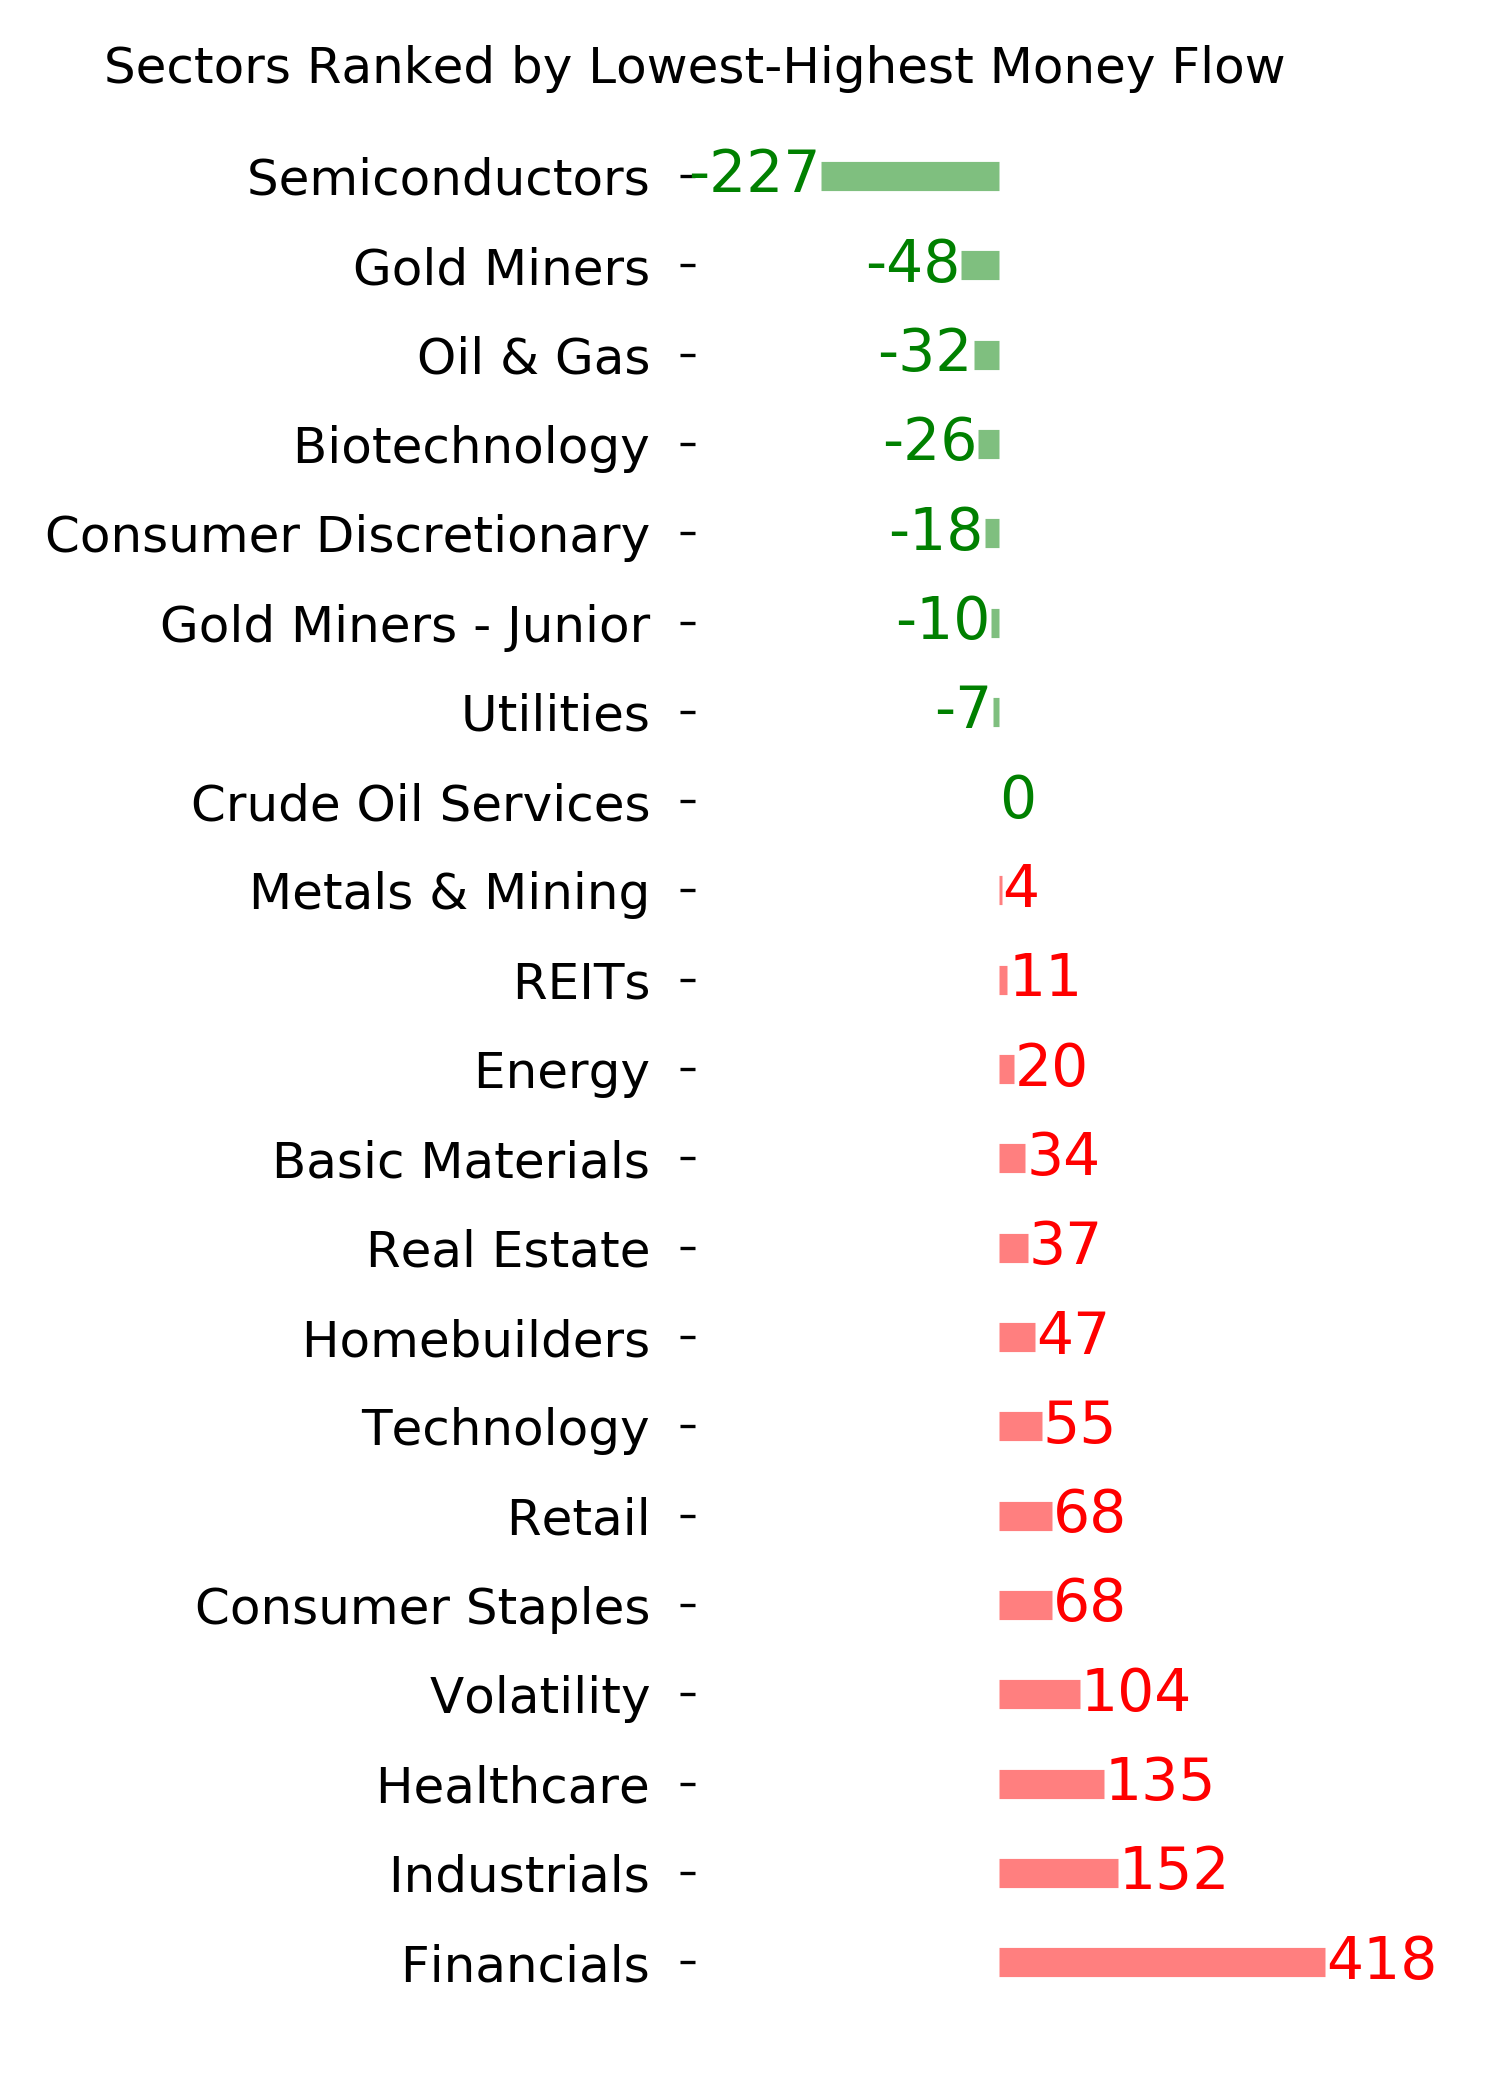
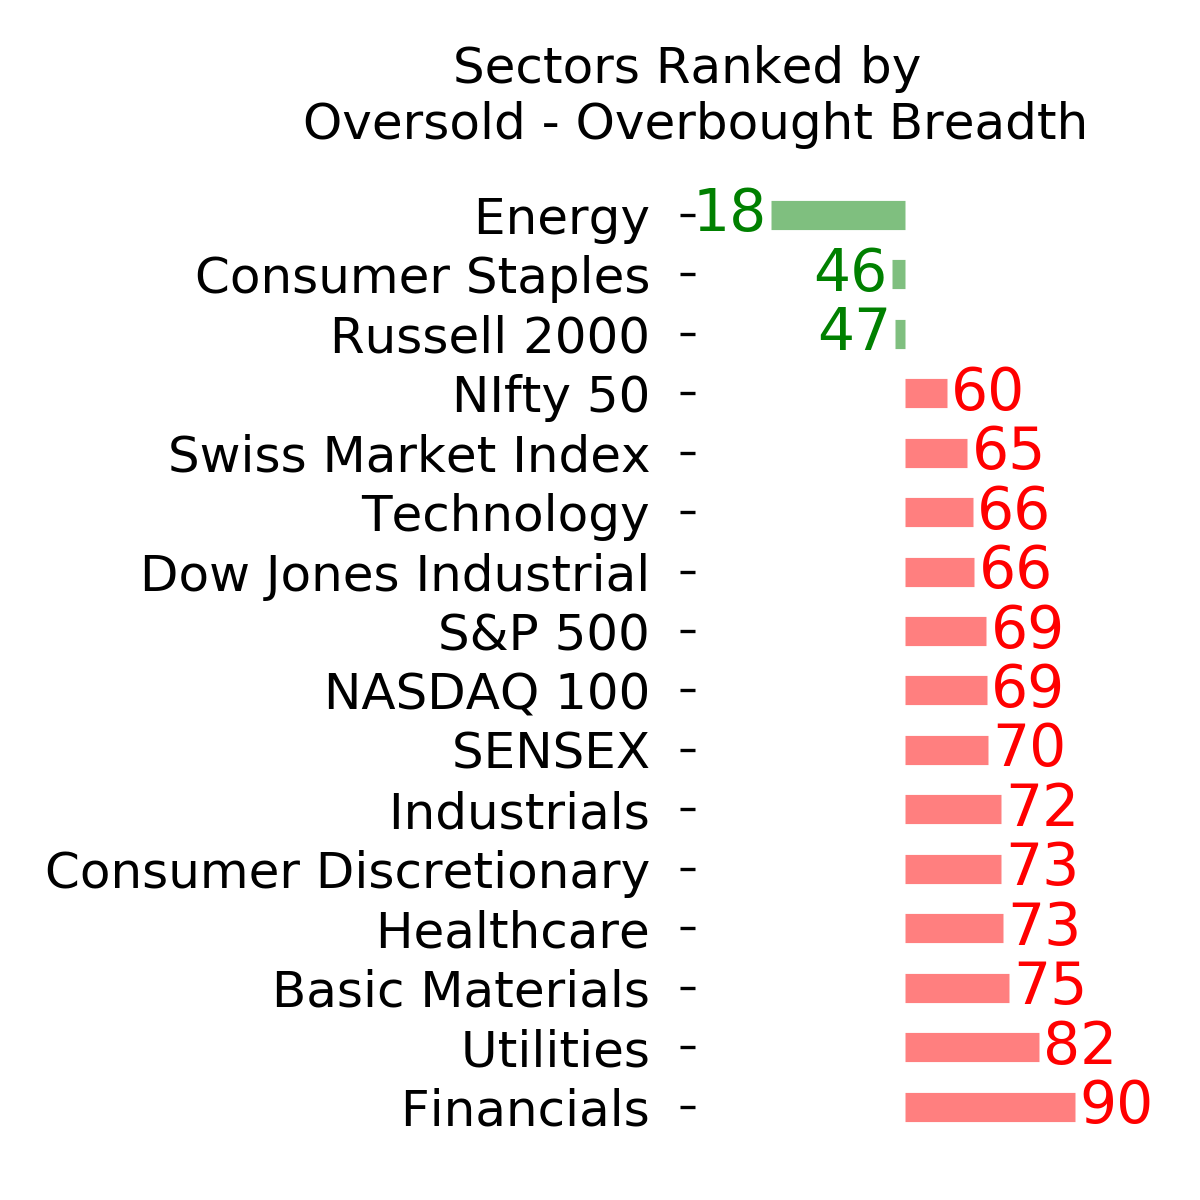
Ranks
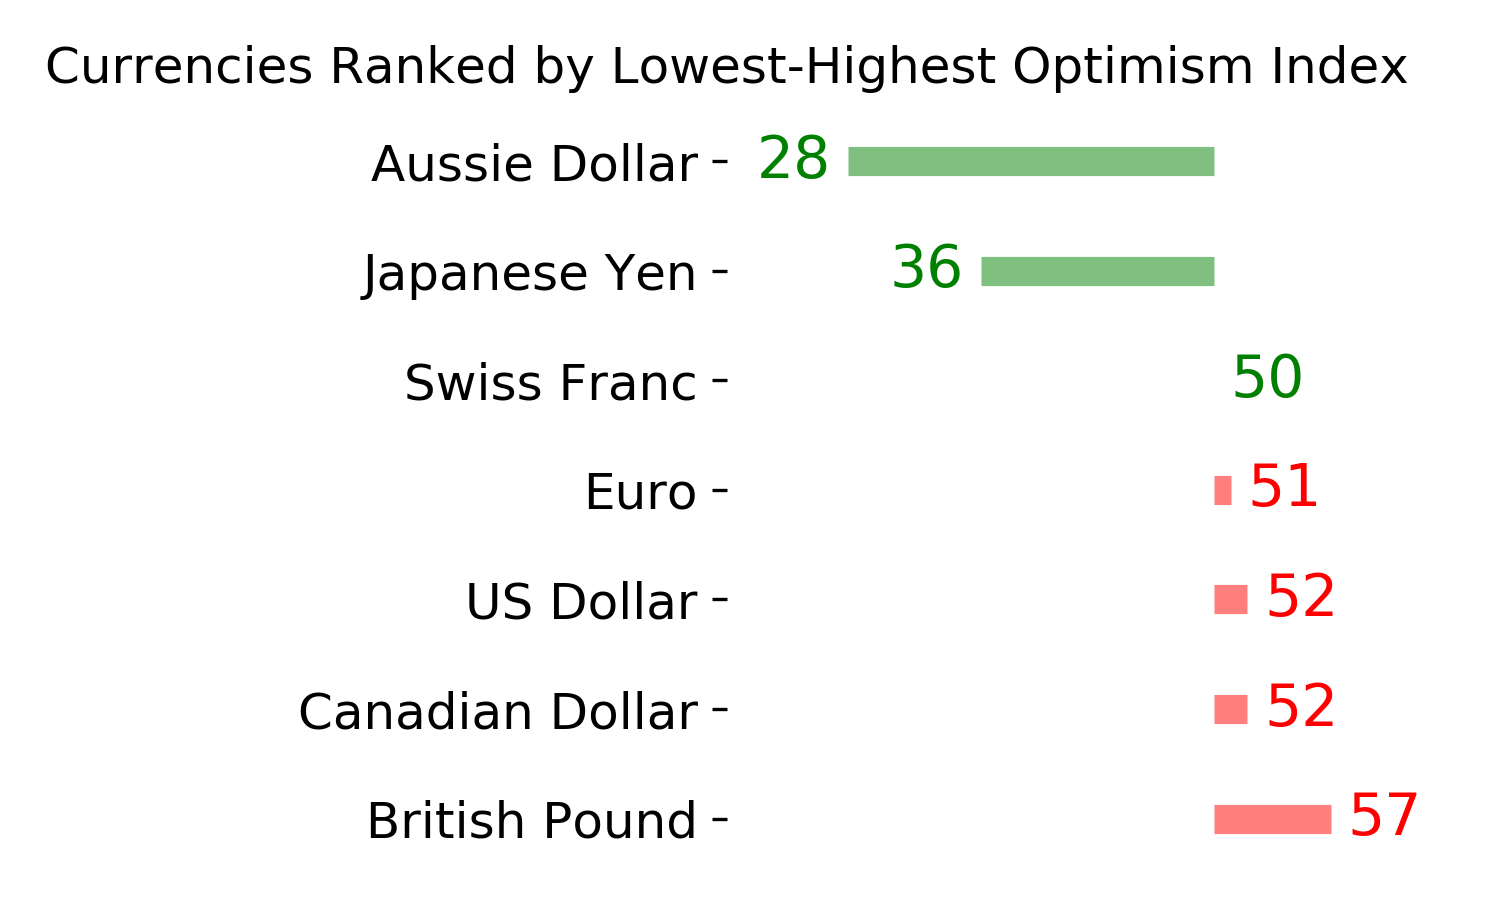
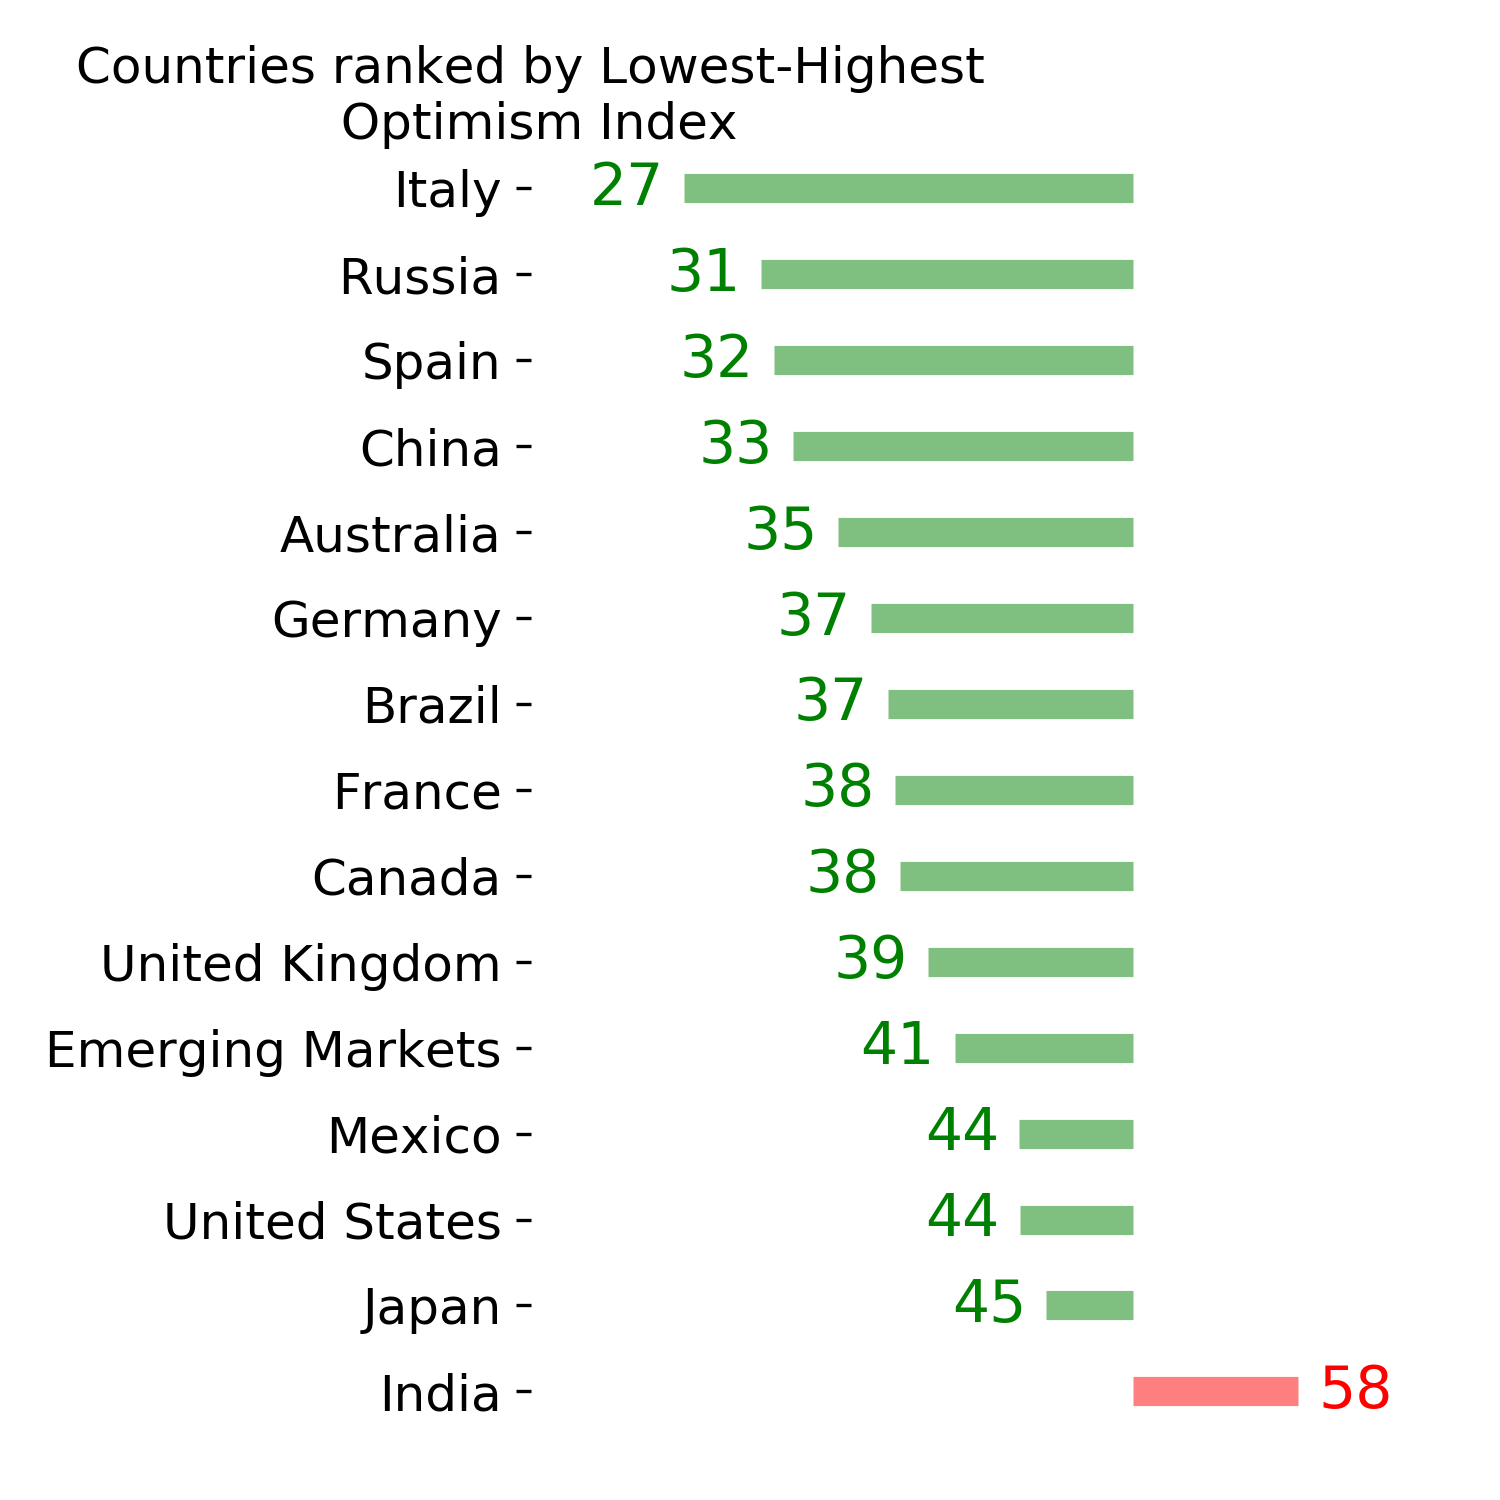
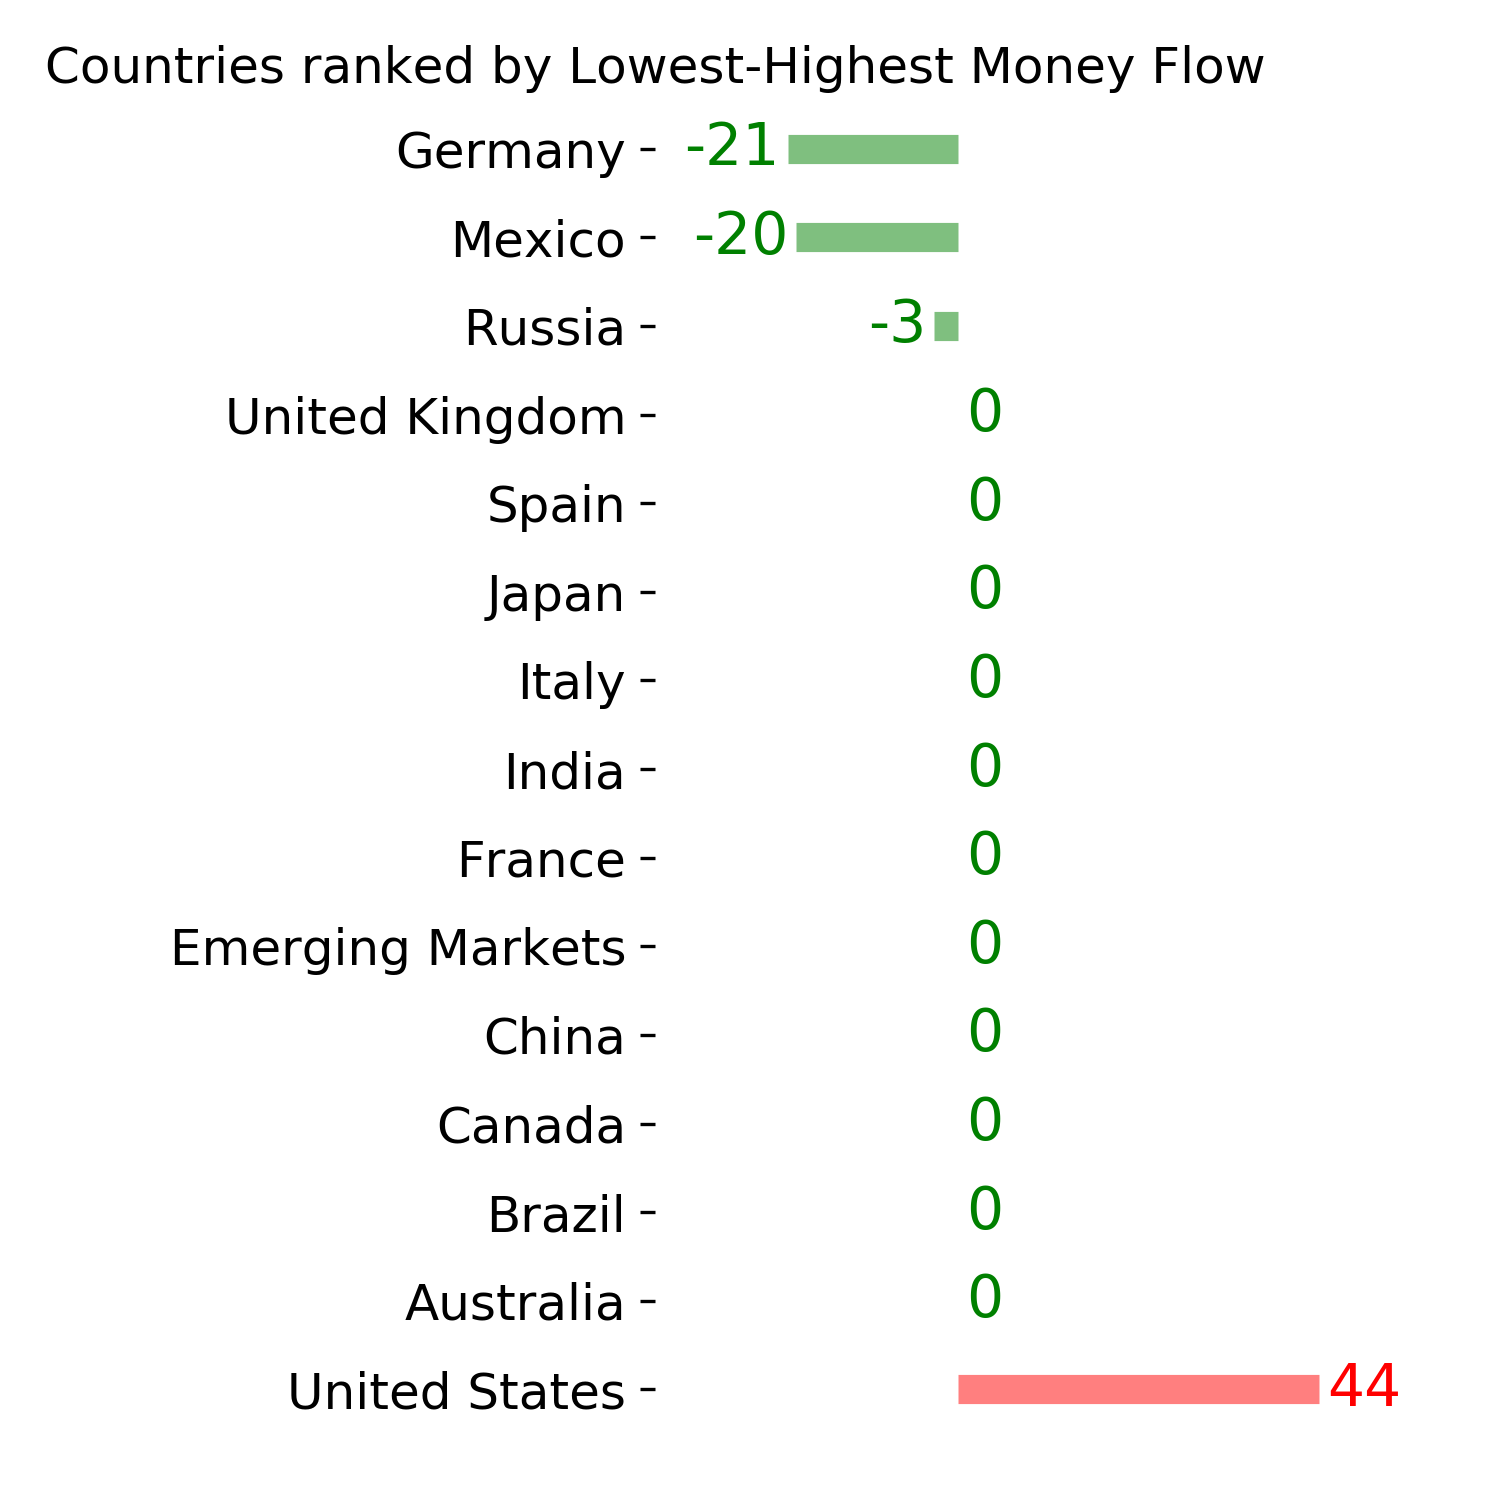
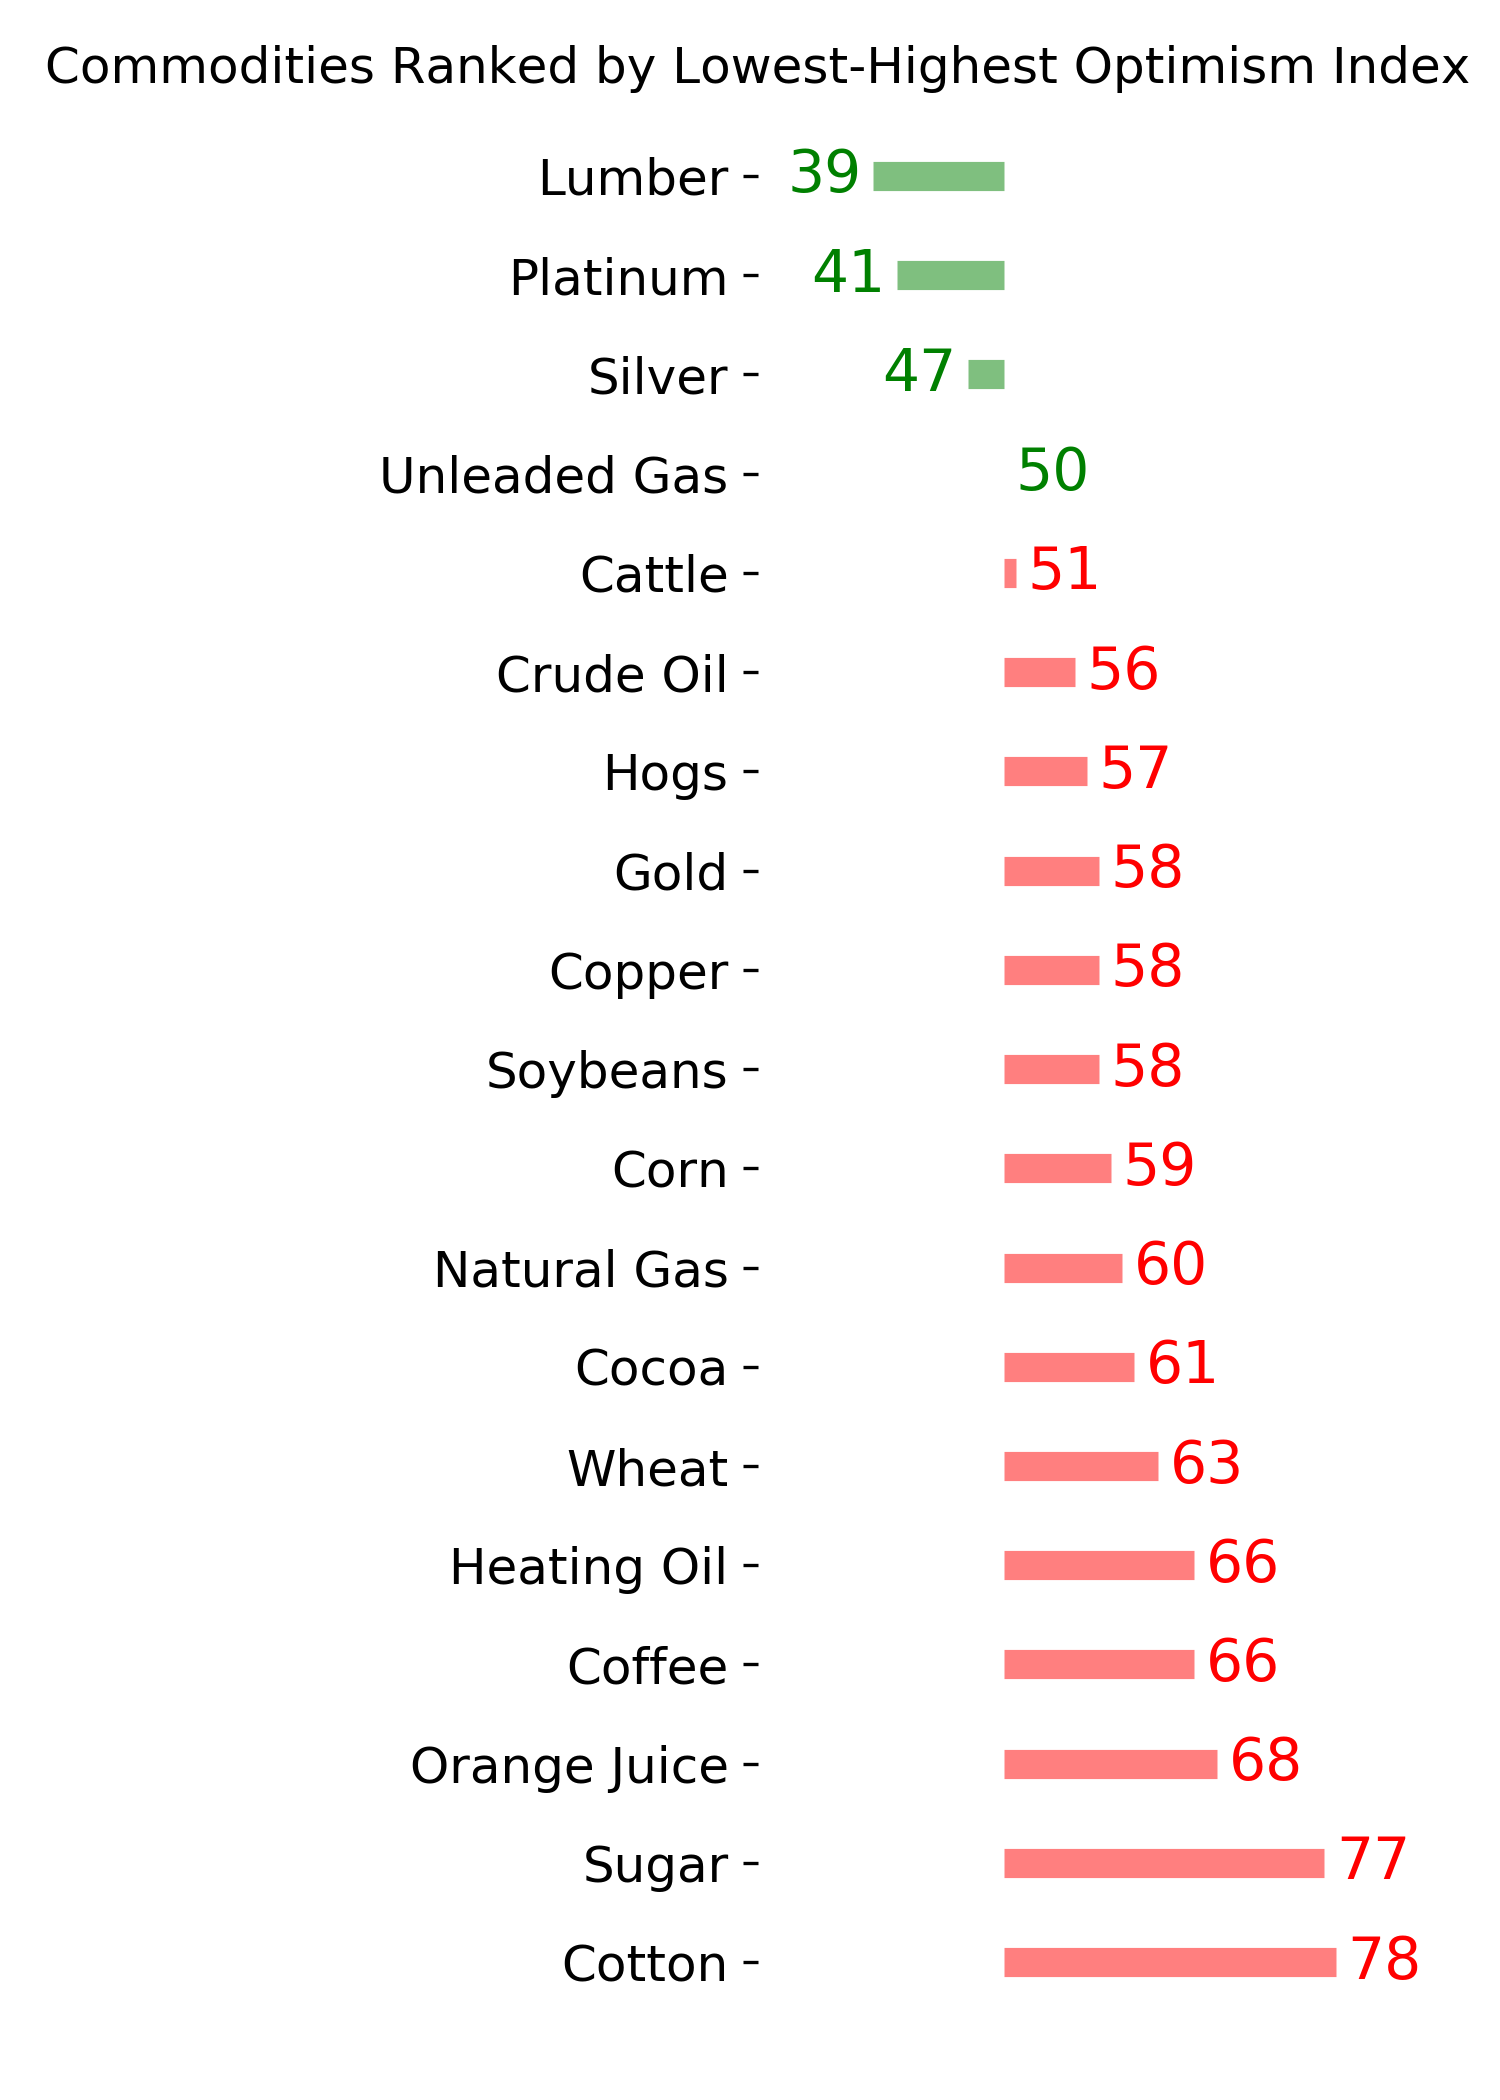
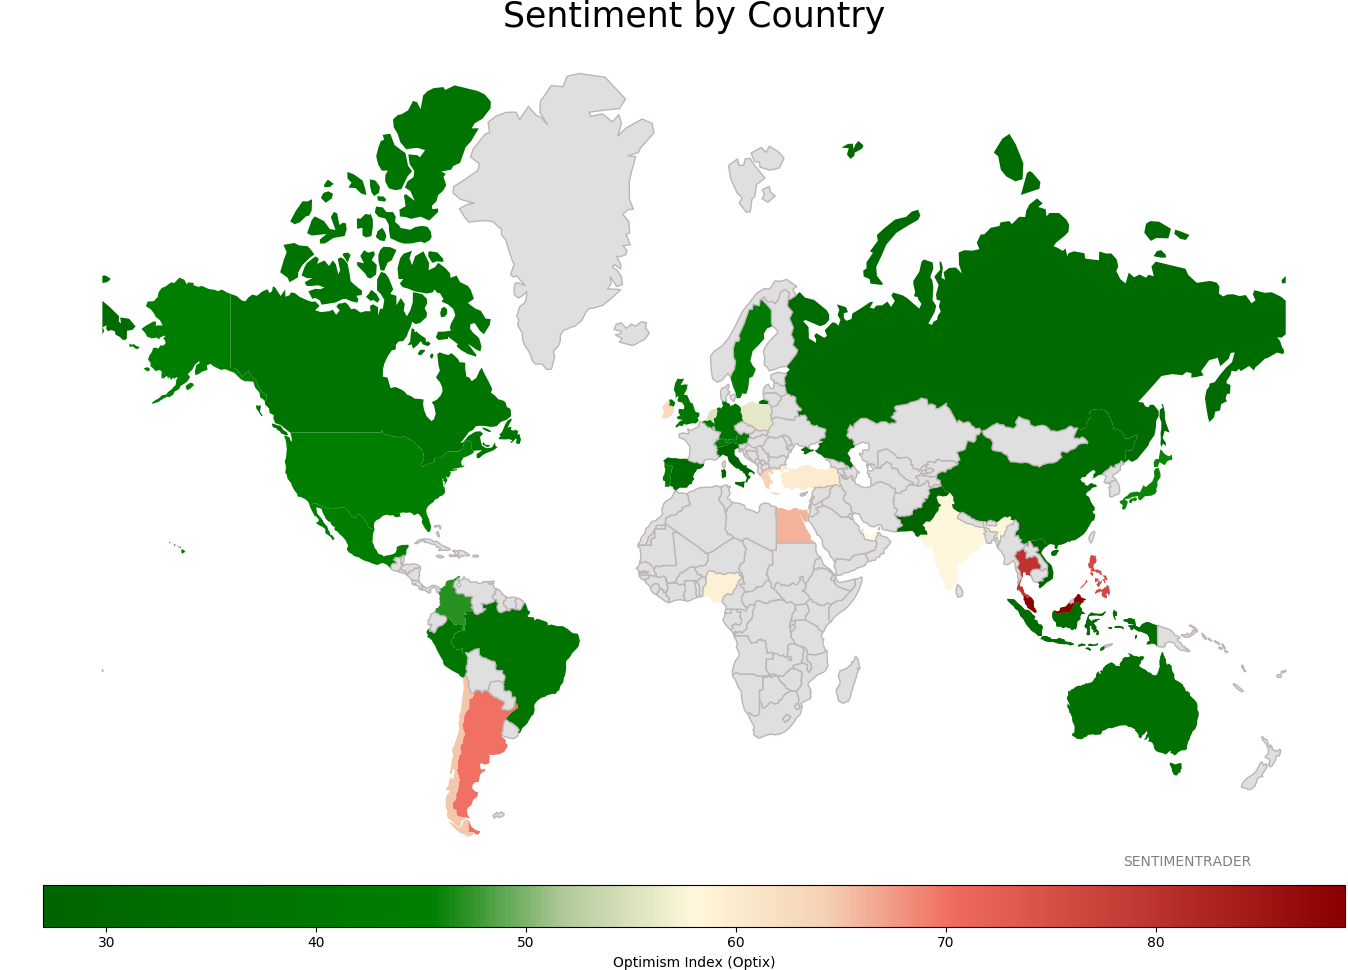
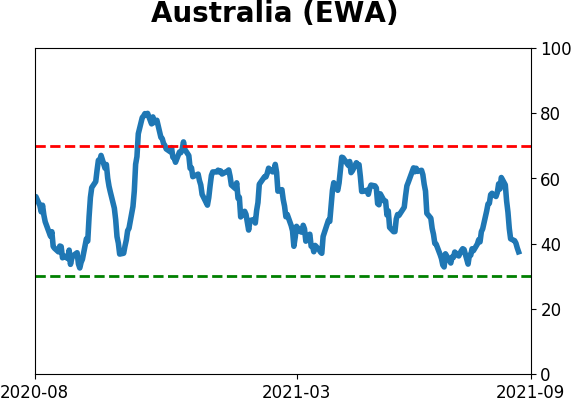
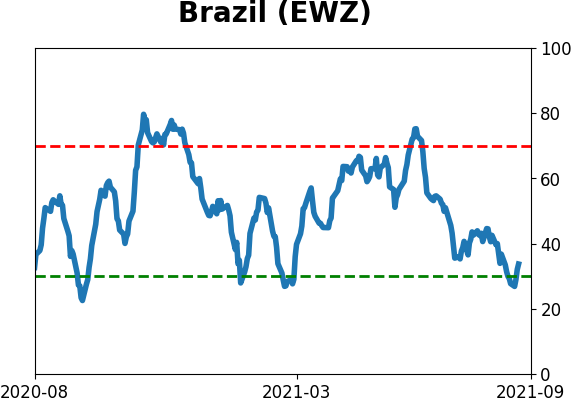
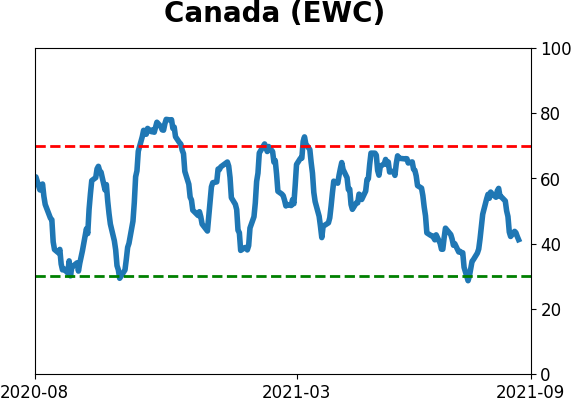
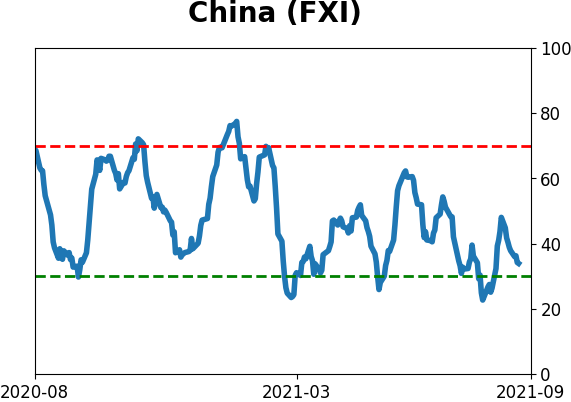
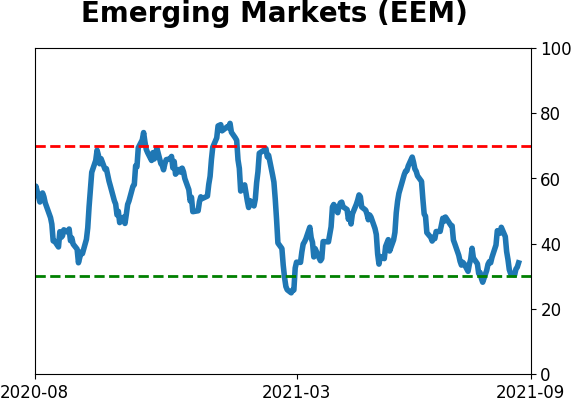
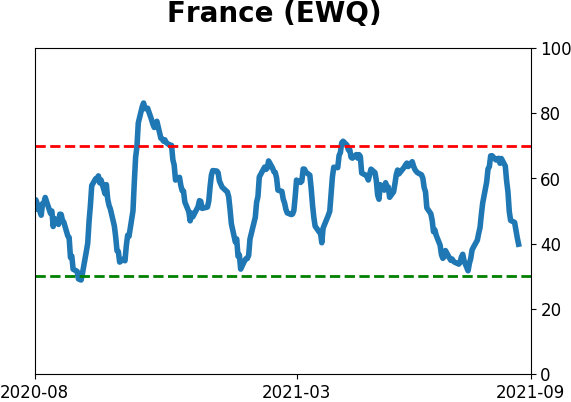
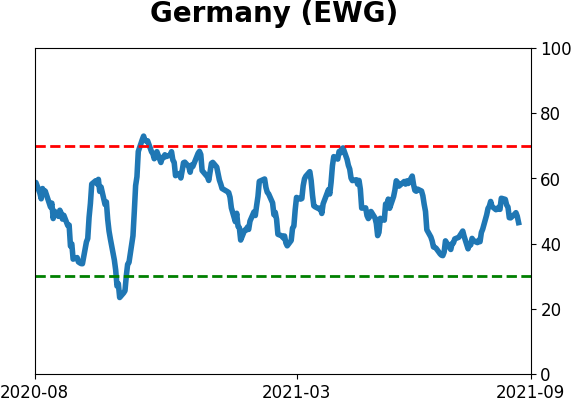
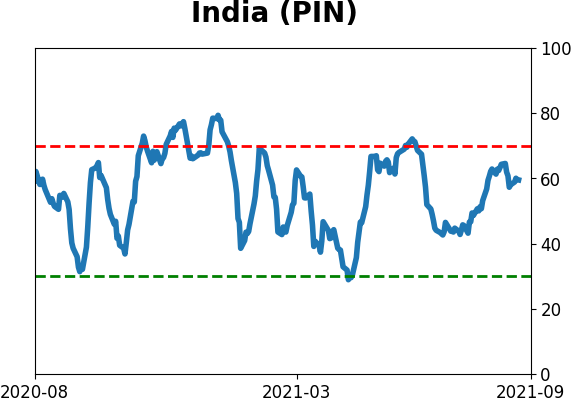
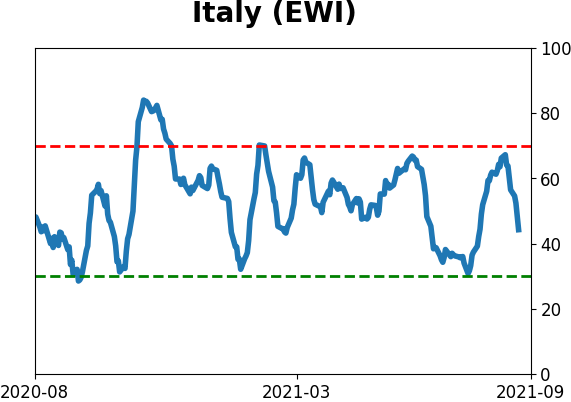
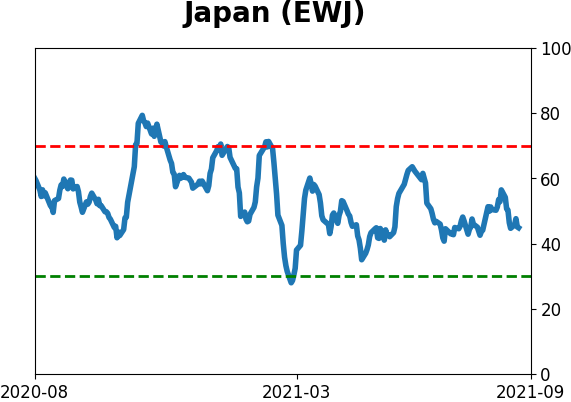
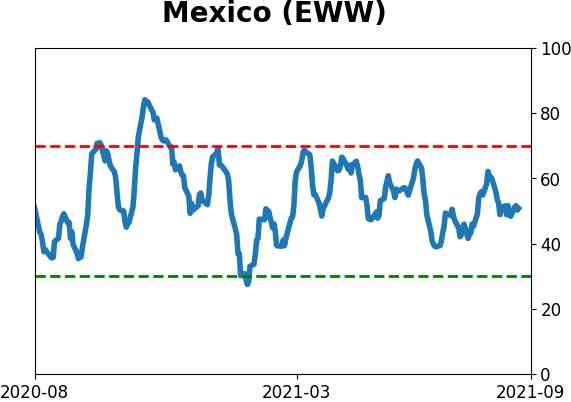
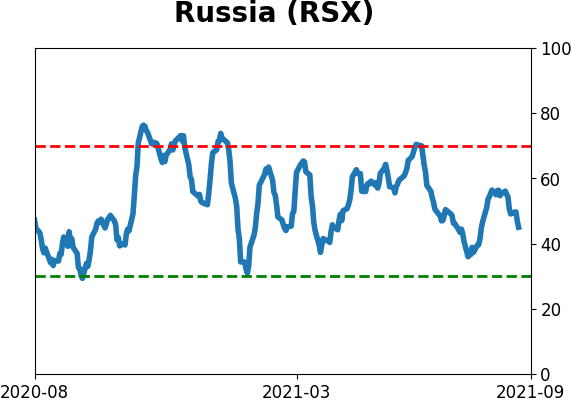
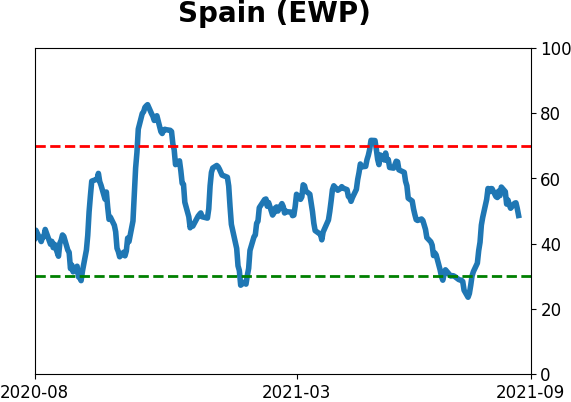
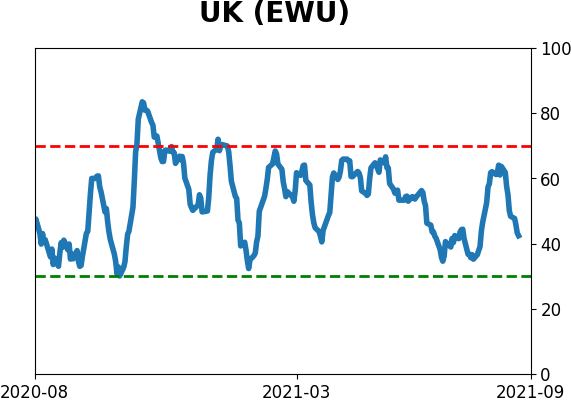
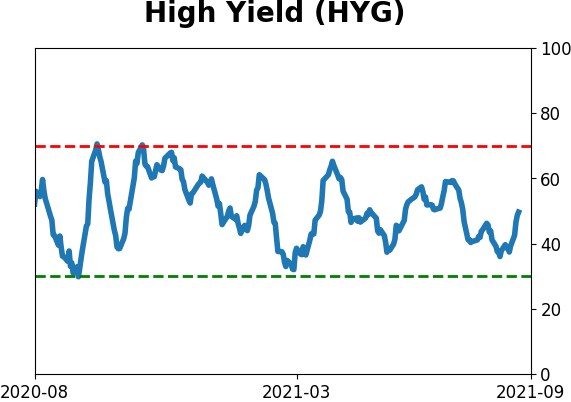
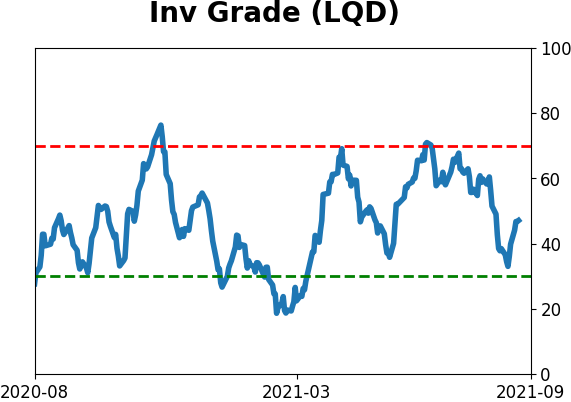
Sentiment Around The World
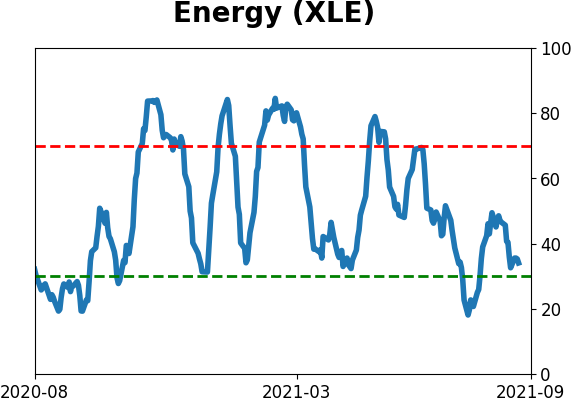
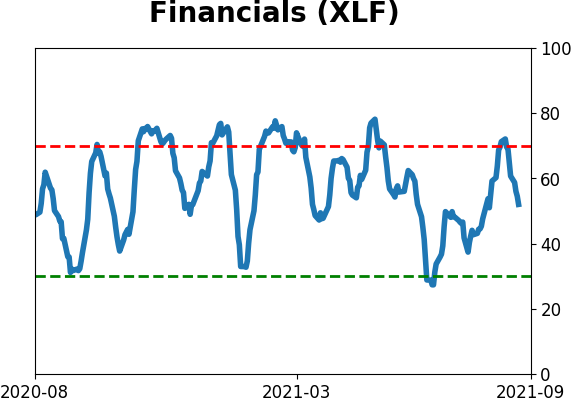
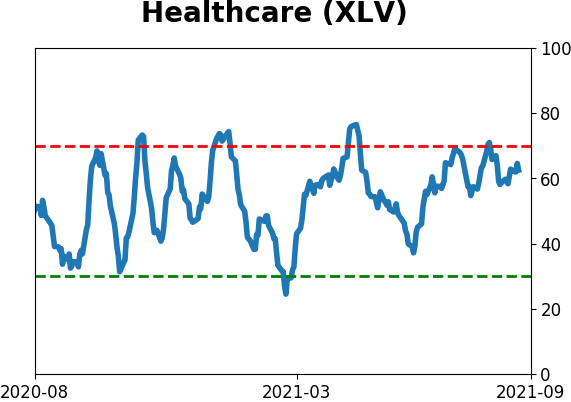
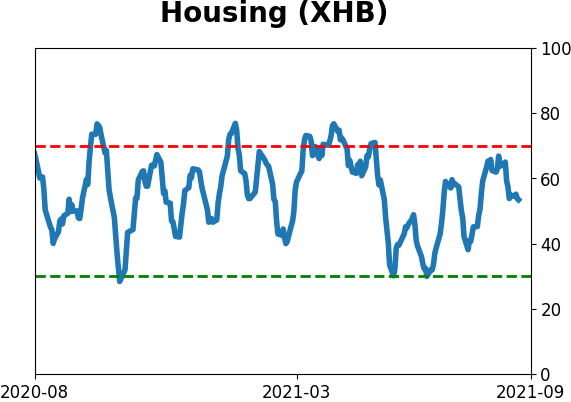
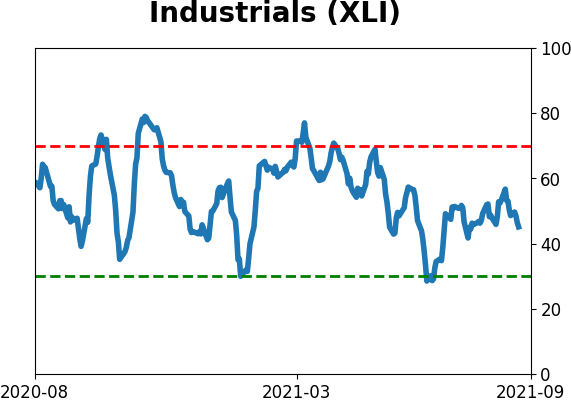
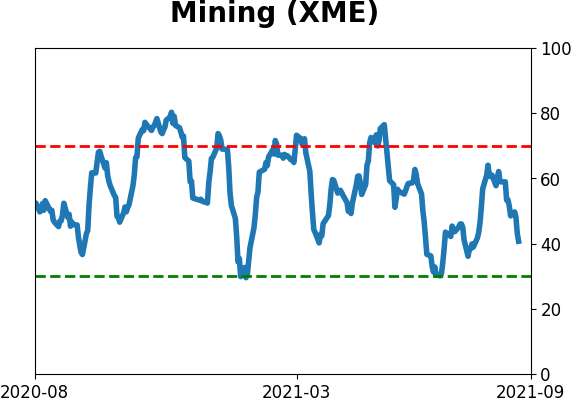
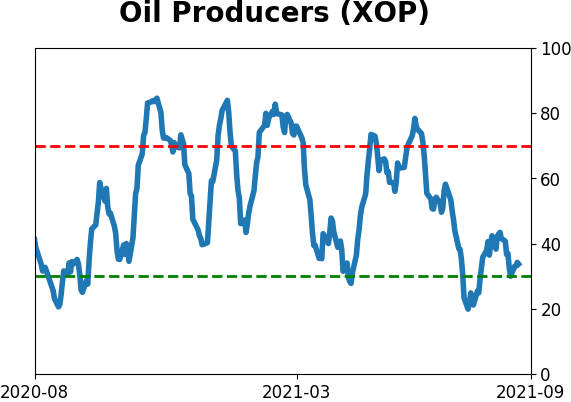
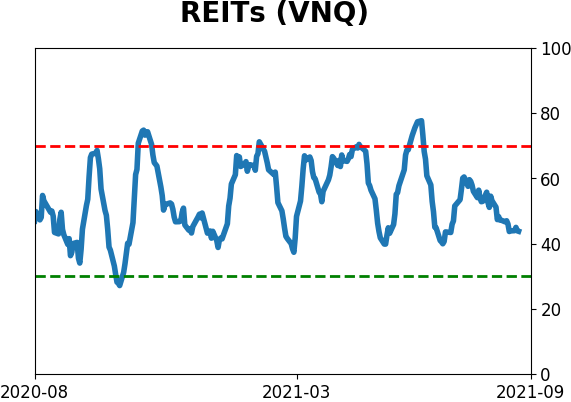
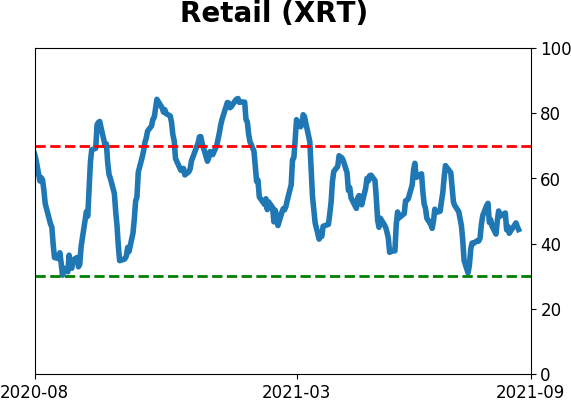
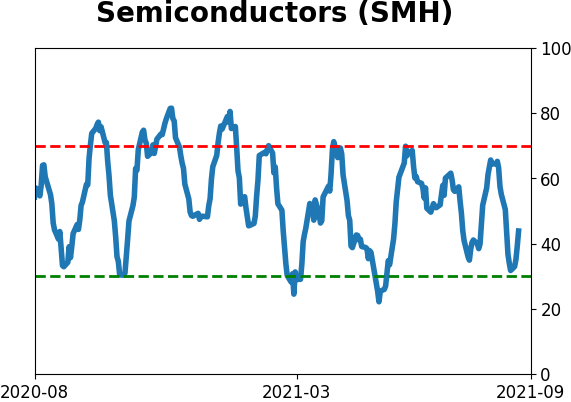
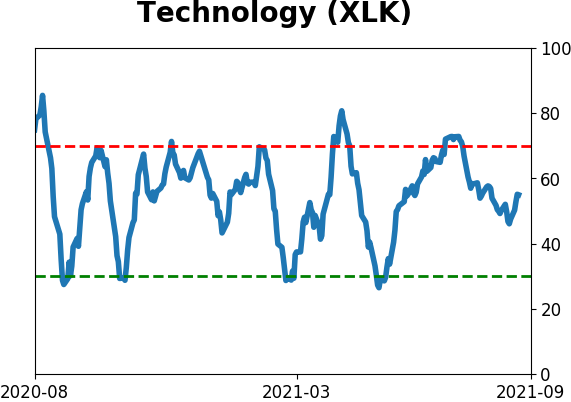
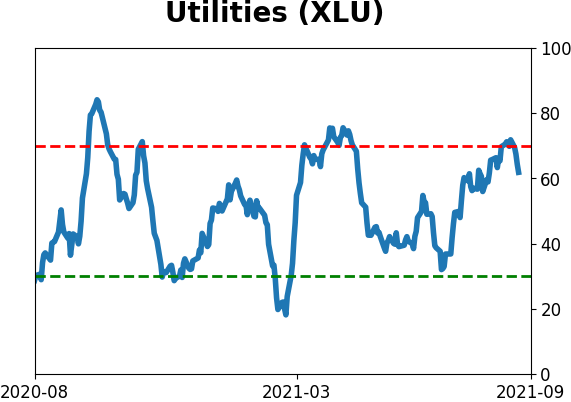
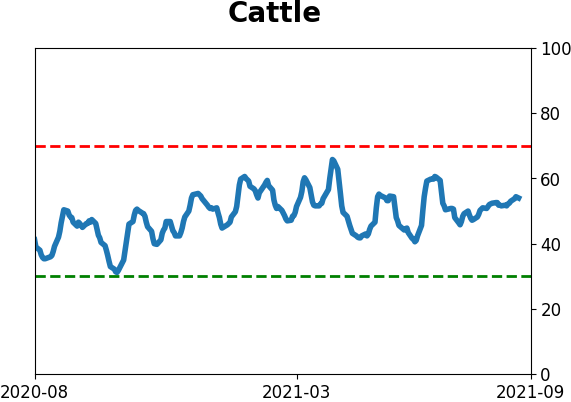
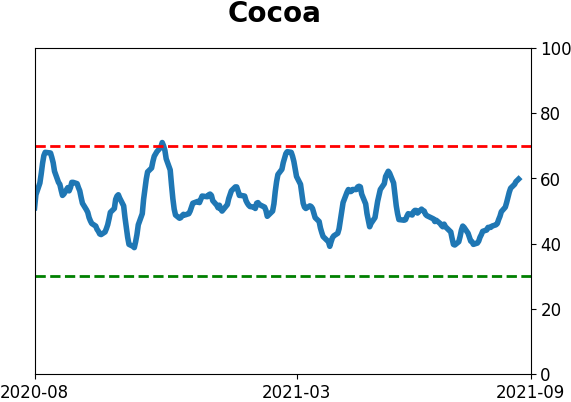
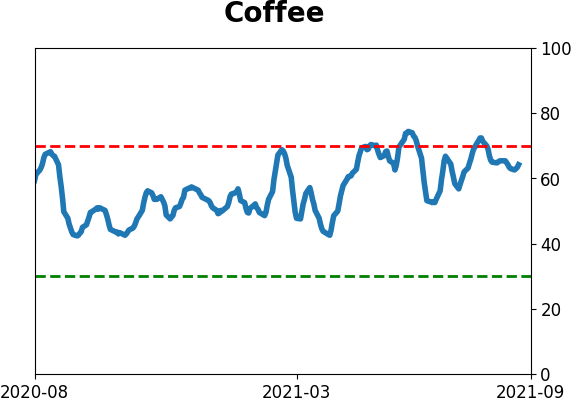
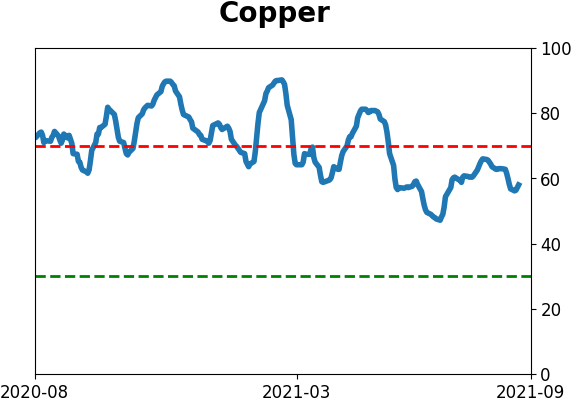
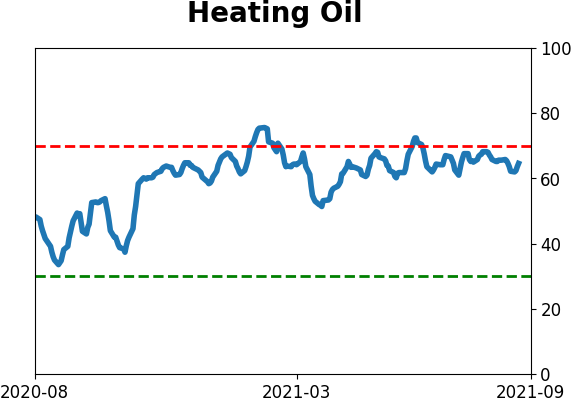
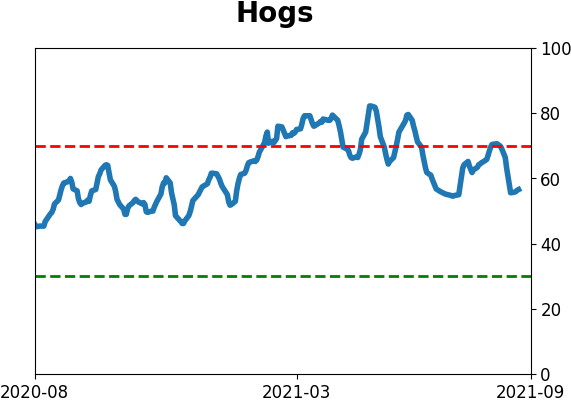
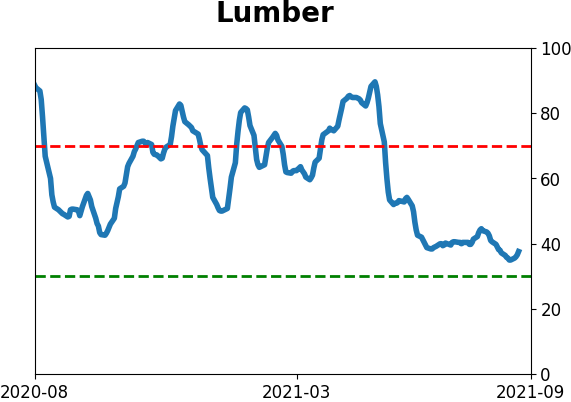
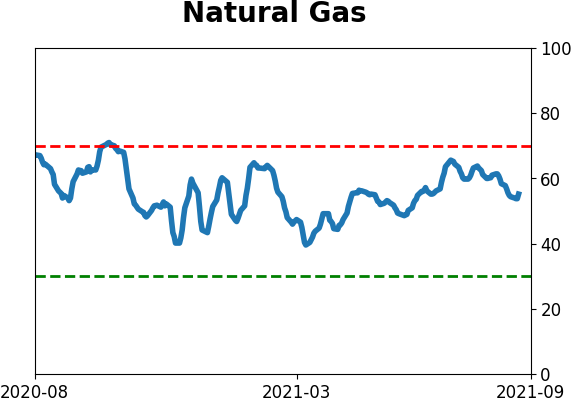
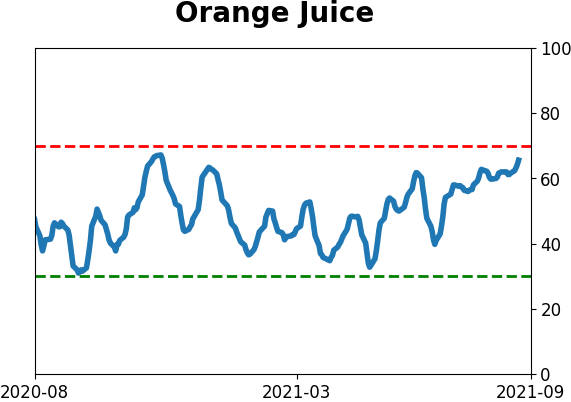
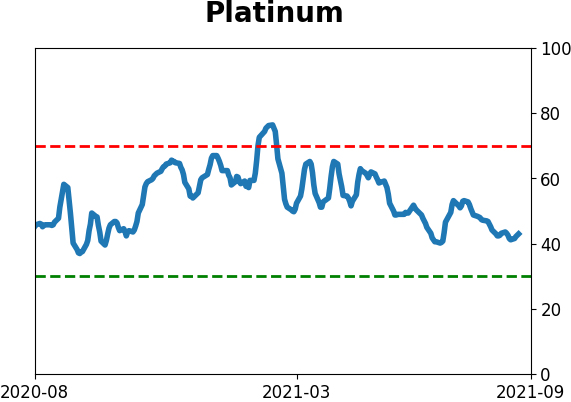
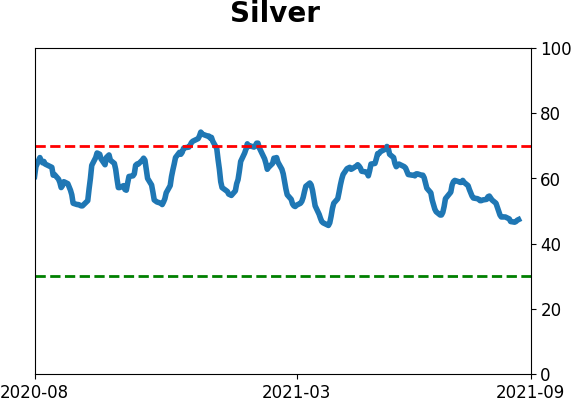
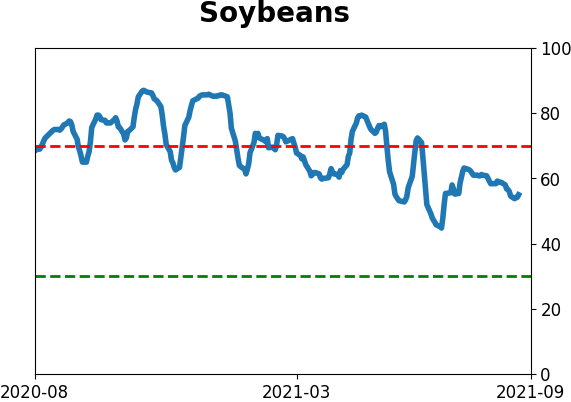
Optimism Index Thumbnails
|
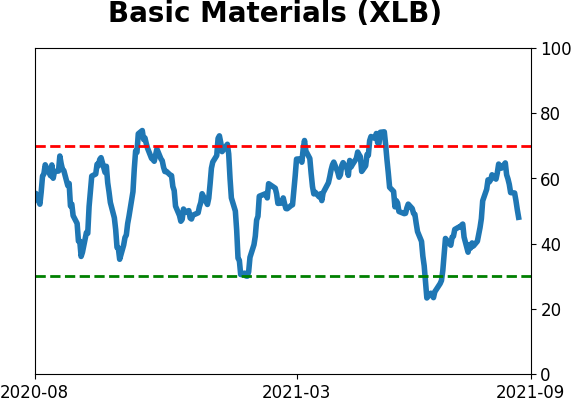
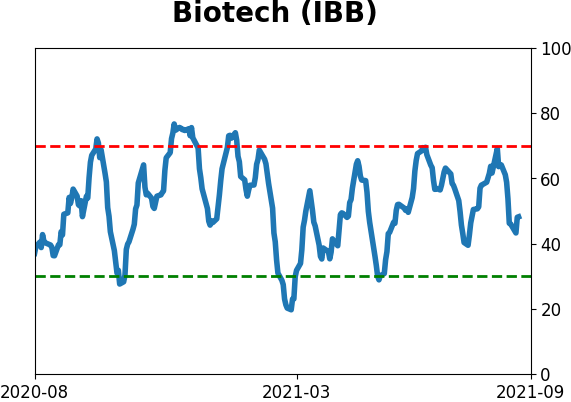
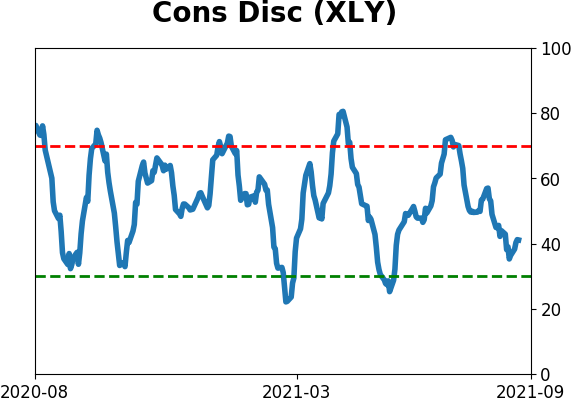
Sector ETF's - 10-Day Moving Average
|
|
|
Country ETF's - 10-Day Moving Average
|
|
|
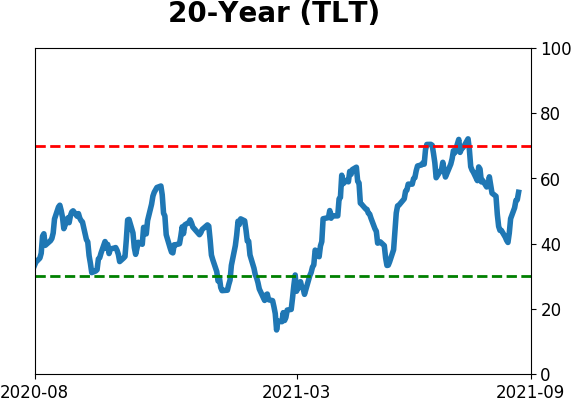
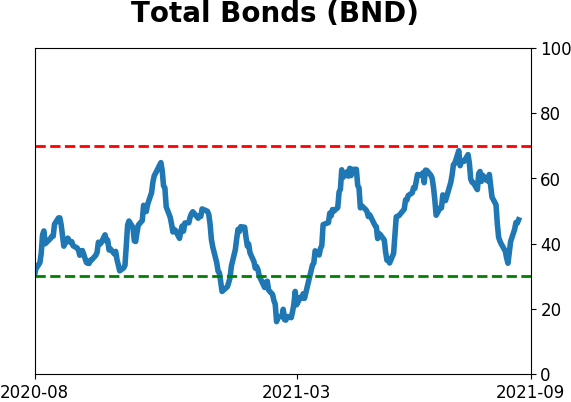
Bond ETF's - 10-Day Moving Average
|
|
|
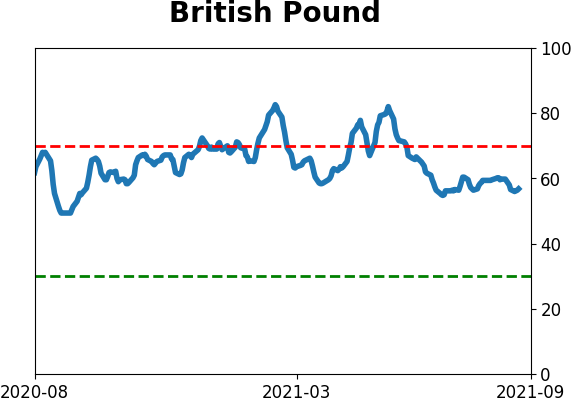
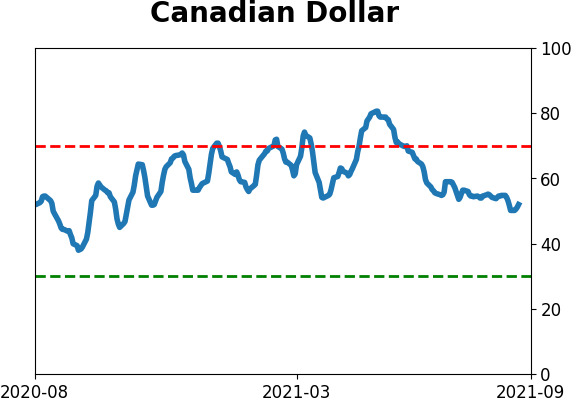
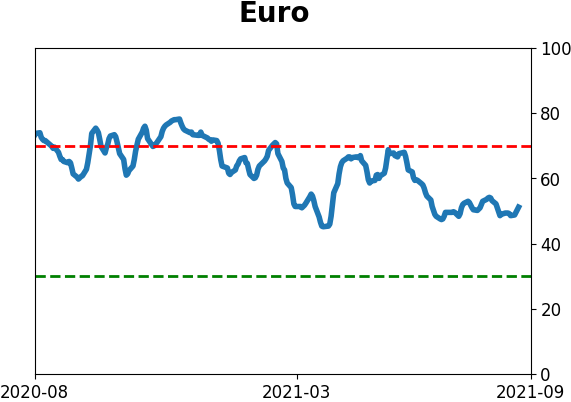
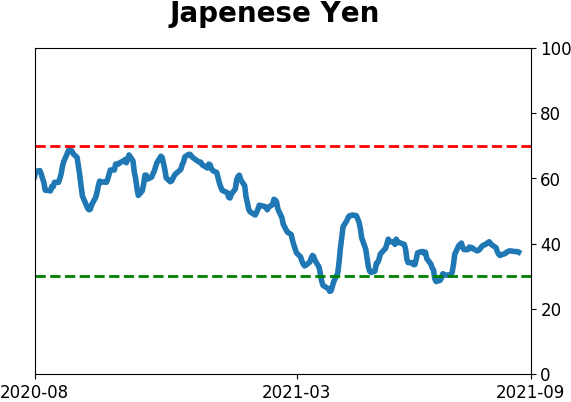
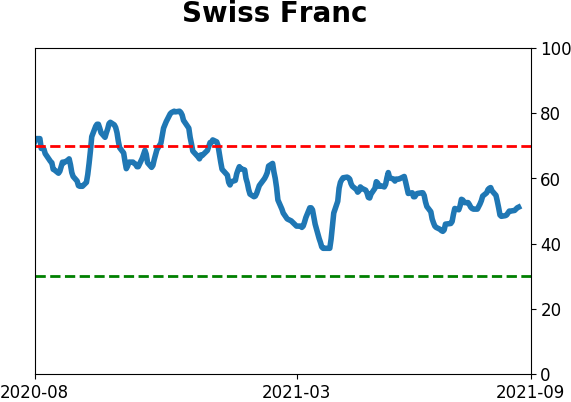
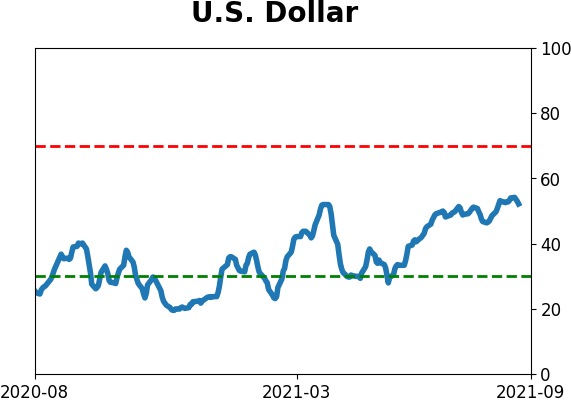
Currency ETF's - 5-Day Moving Average
|
|
|
Commodity ETF's - 5-Day Moving Average
|
|