Headlines
|
|
Buyers Make Another Save with Breadth Thrust:
For the past 3 sessions, more than 75% of volume on the NYSE flowed into advancing securities. With the S&P 500 sitting at a 52-week high, its the first time we've seen a thrust like this since 1991.
Bottom Line:
STOCKS: Hold
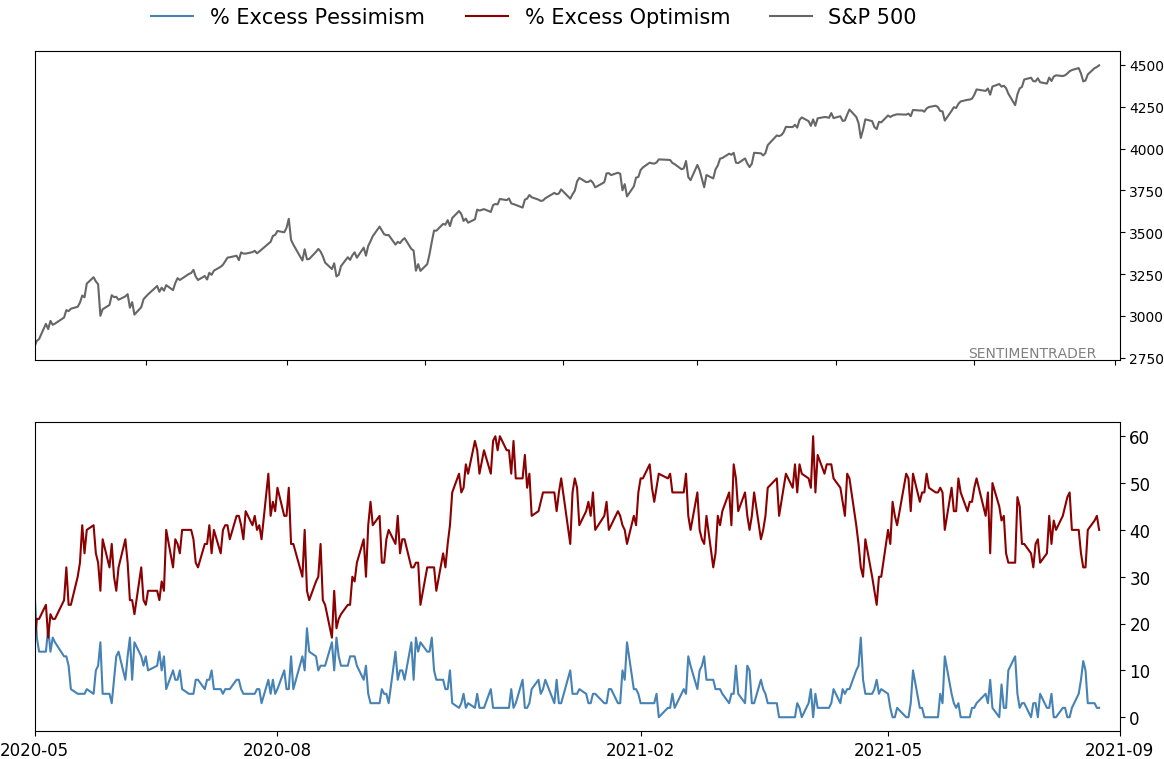
Sentiment continues to decline from the speculative February peak. With deteriorating breadth, this raises the risk of poor short- to medium-term returns until optimism and better breadth returns. See the Outlook & Allocations page for more. BONDS: Hold
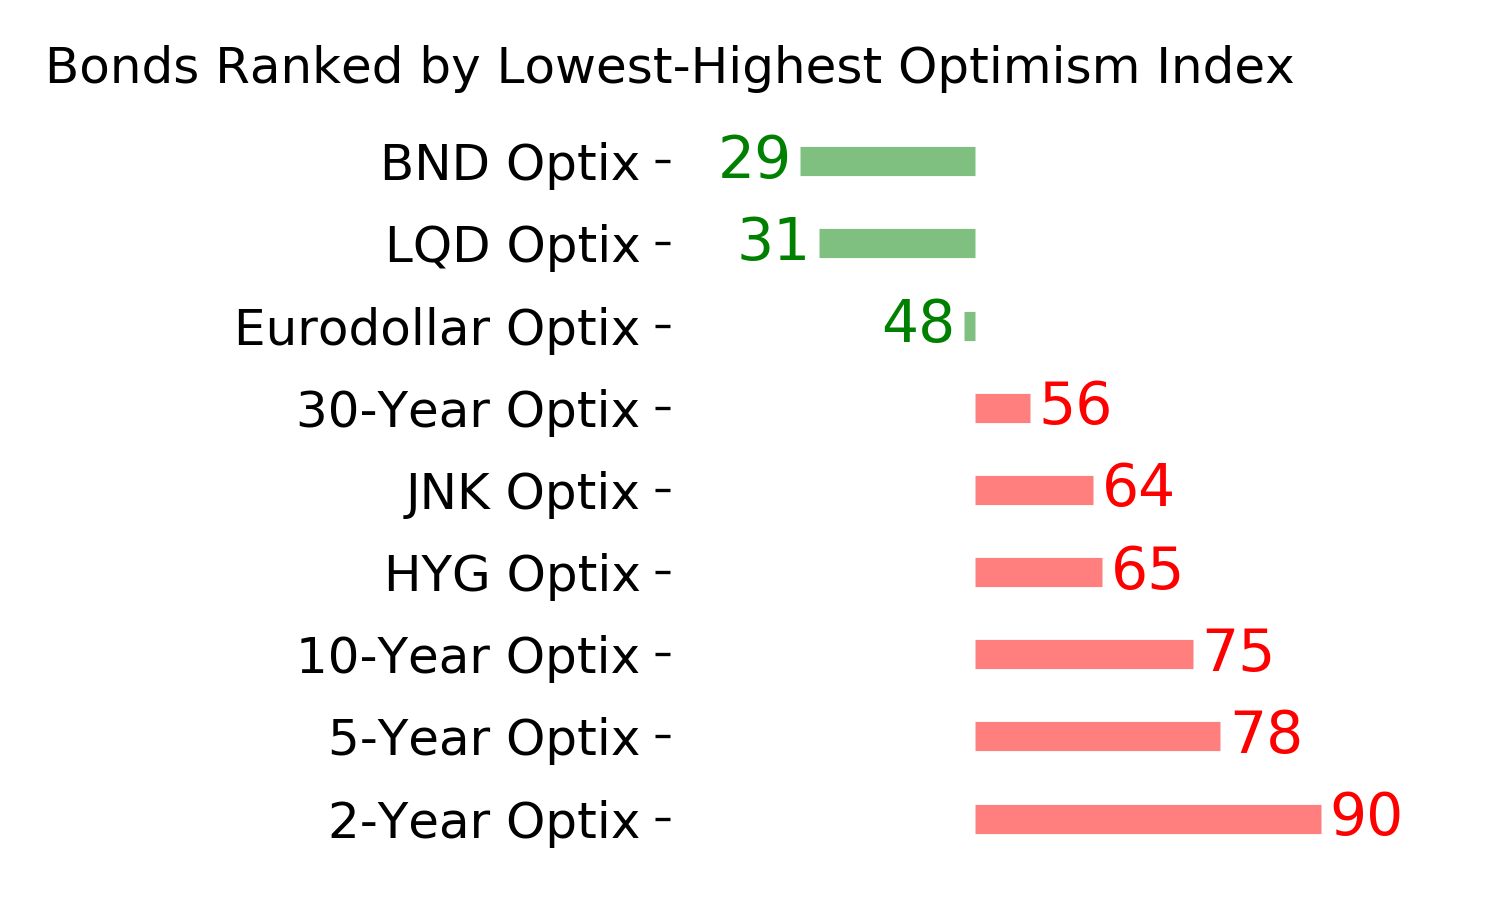
Various parts of the market got hit in March, with the lowest Bond Optimism Index we usually see during healthy environments. Bond prices have modest recovered and there is no edge among the data we follow. GOLD: Hold
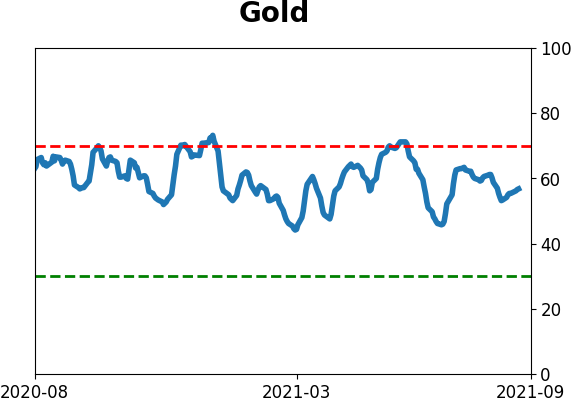
Gold and miners were rejected after trying to recover above their 200-day averages in May. Lately, some medium-term (not long-term) oversold extremes in breadth measures among miners have triggered.
|
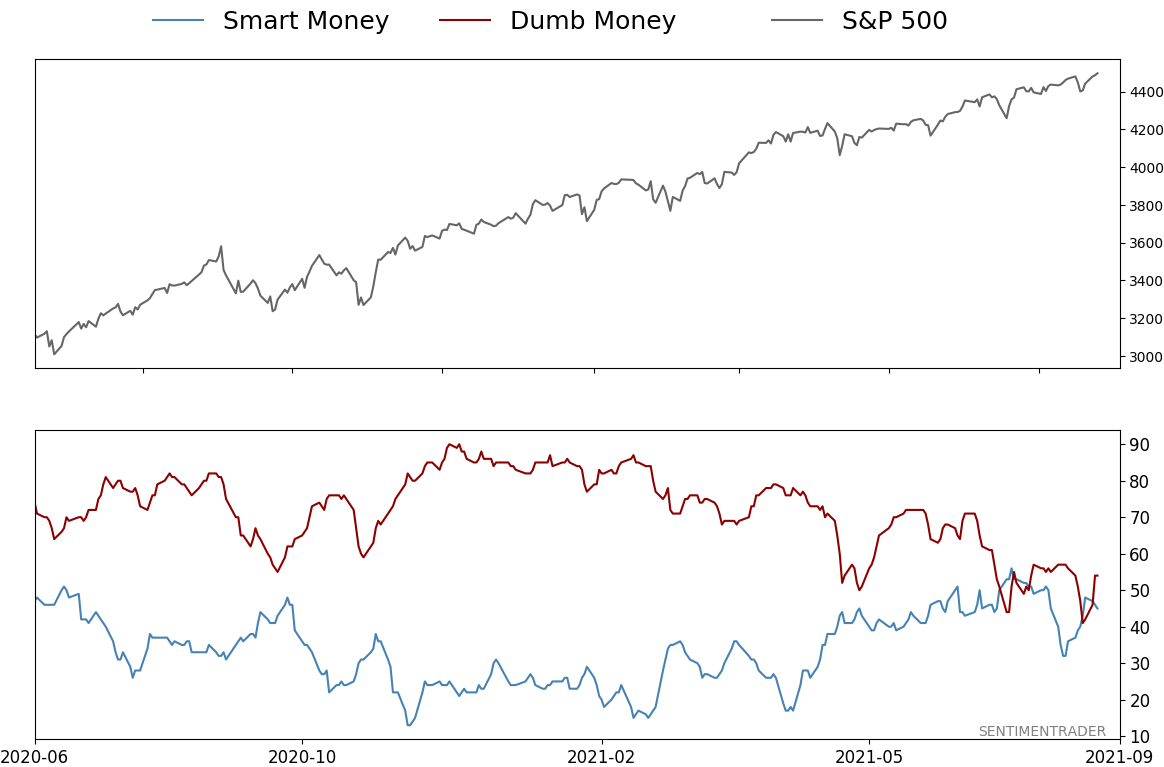
Smart / Dumb Money Confidence
|
Smart Money Confidence: 45%
Dumb Money Confidence: 54%
|
|
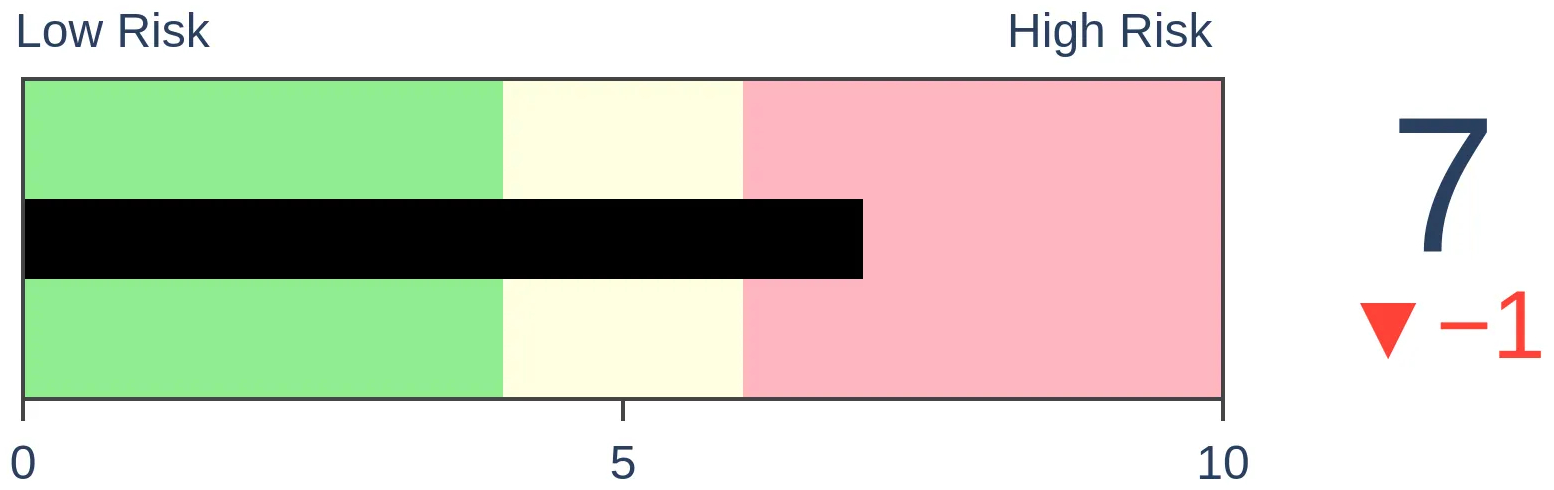
Risk Levels
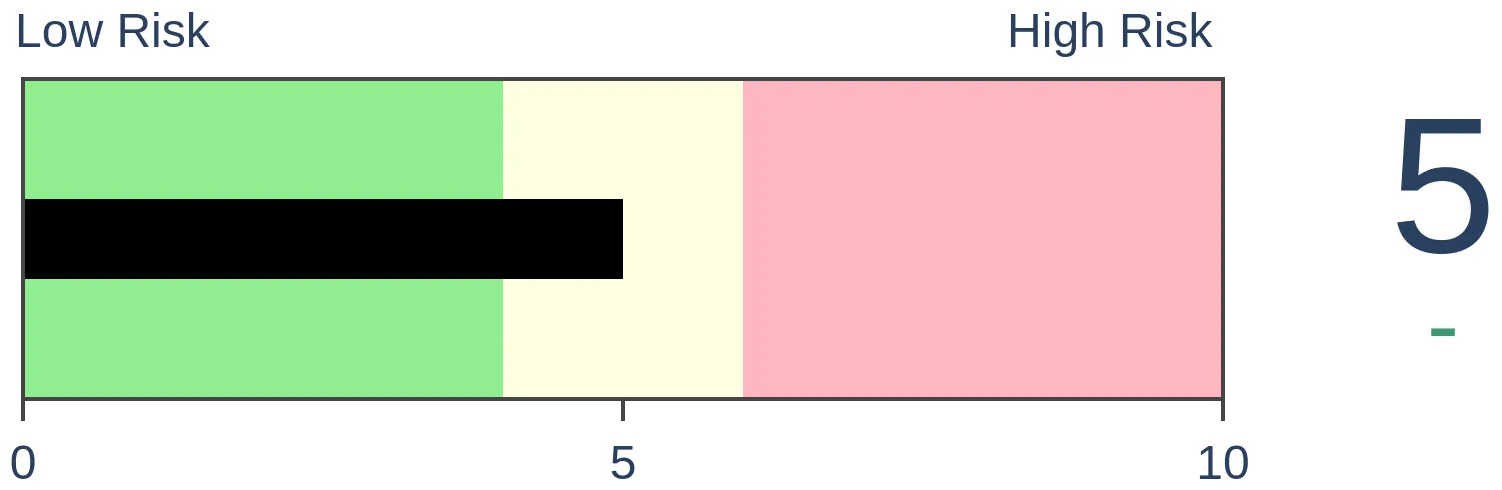
Stocks Short-Term
|
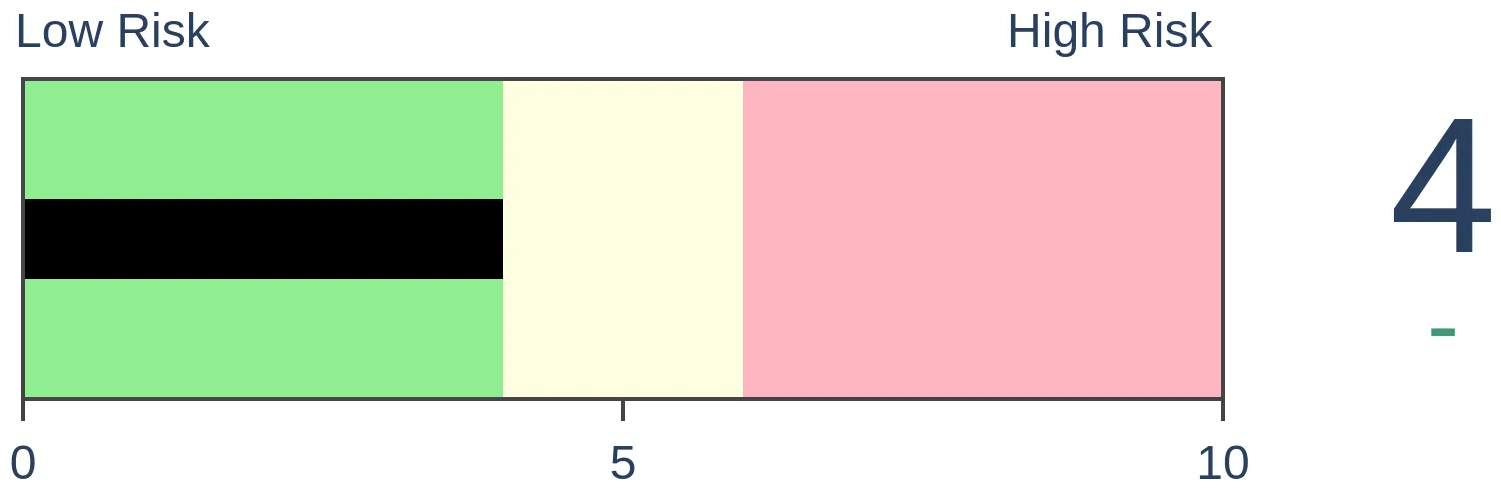
Stocks Medium-Term
|
|
Bonds

|
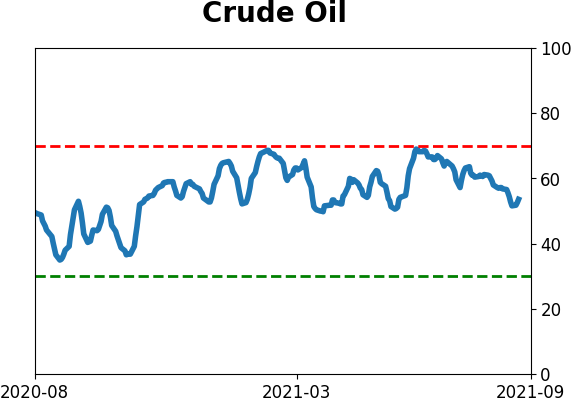
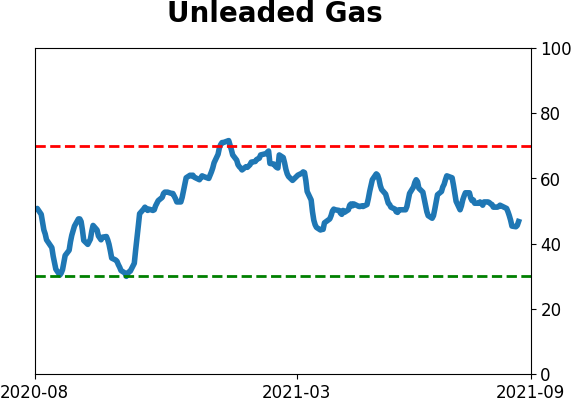
Crude Oil
|
|
Gold

|
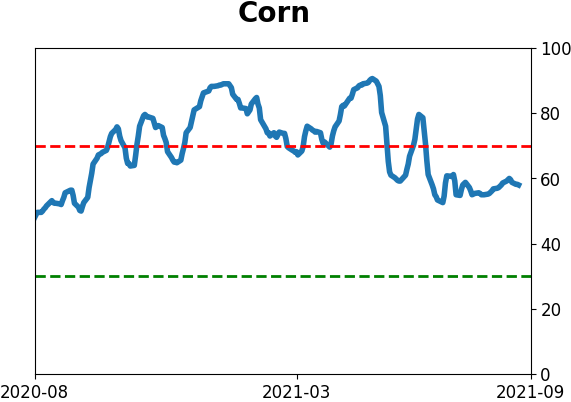
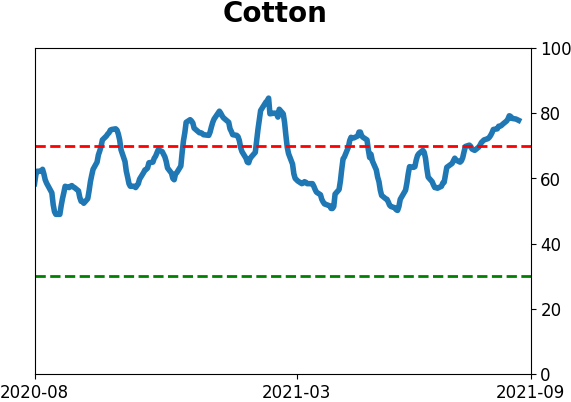
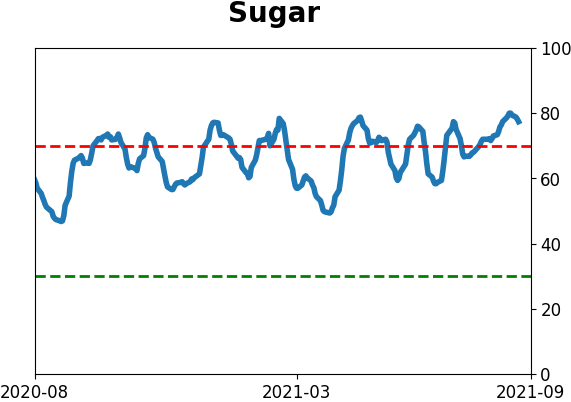
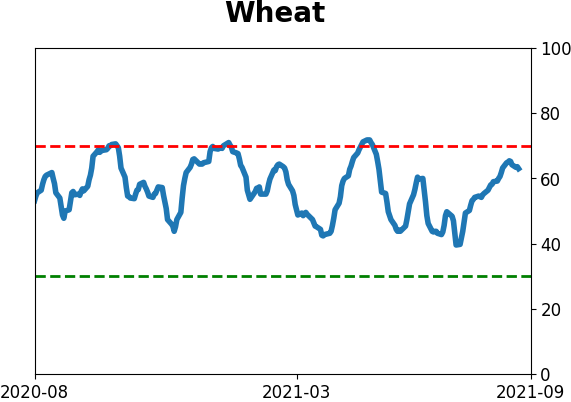
Agriculture

|
|
Research
By Jason Goepfert
BOTTOM LINE
For the past 3 sessions, more than 75% of volume on the NYSE flowed into advancing securities. With the S&P 500 sitting at a 52-week high, its the first time we've seen a thrust like this since 1991.
FORECAST / TIMEFRAME
SPY -- Up, Long-Term
|
Just leave it to this market. Unbelievable.
Seemingly whenever something negative triggers, buyers show up immediately. We saw on Monday that the S&P 500's approach to its former high was accompanied by a negative McClellan Summation Index and more 52-week lows than highs on the NYSE.
No matter, stocks continued to rise, and breadth turned around. The switch was dramatic enough that more than 75% of volume on the NYSE flowed into advancing securities. It happened on Monday, too. And Friday.
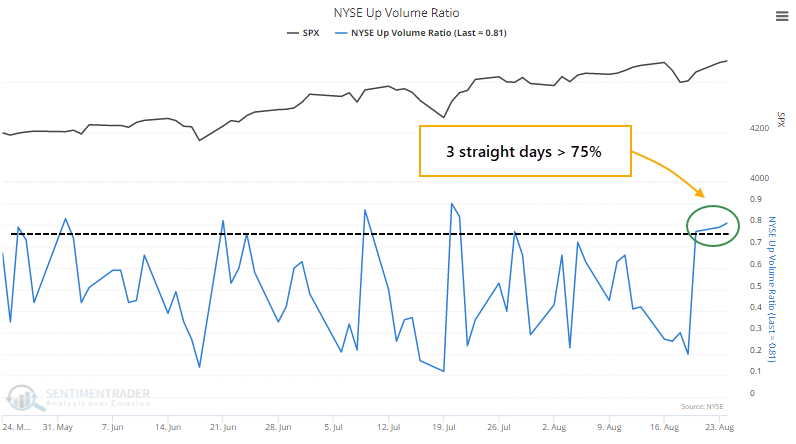
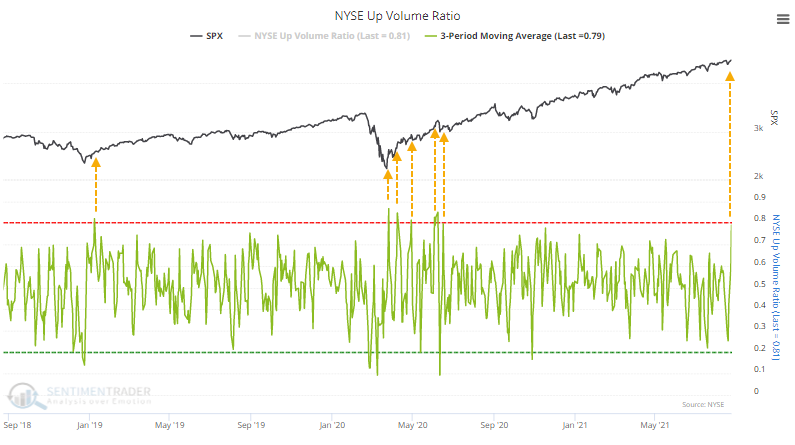
Over the past three years, this is only the 3rd distinct time that the 3-day average of NYSE Up Volume has neared 80% (lumping together the handful of post-pandemic thrusts as one).
THRUSTS ARE ALMOST ALWAYS A GOOD SIGN
Since 1928, there have been 86 non-overlapping periods with 3 consecutive days of 75% or greater Up Volume. Like we've seen so often, the primary highlight of thrusts like this is a remarkably positive risk versus reward ratio over the medium- to long-term.
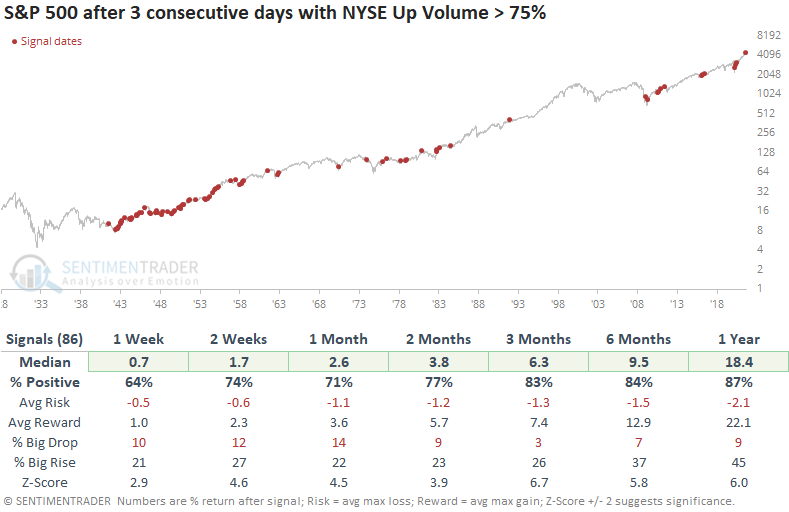
Across all time frames, the S&P 500's average return was well above random, the average drawdown (risk) was a small fraction of drawup (reward), and there was a much higher probability of a big rise than a big drop.
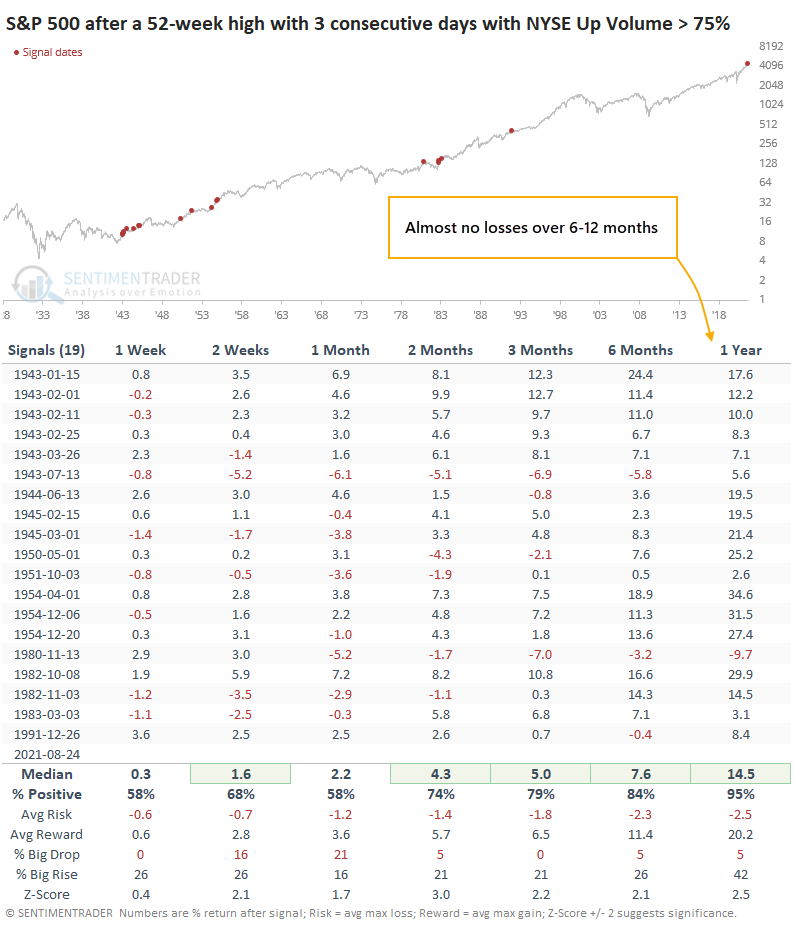
Often, we see thrusts like this when coming out of oversold conditions. The last time there were 3 consecutive days with at least 75% Up Volume with the S&P closing at a 52-week high was more than 30 years ago. While it can signal some short-term buying exhaustion (8 of the last 14 signals showed a negative 1-month return), the risk/reward ratio was impressive over the longer-term.
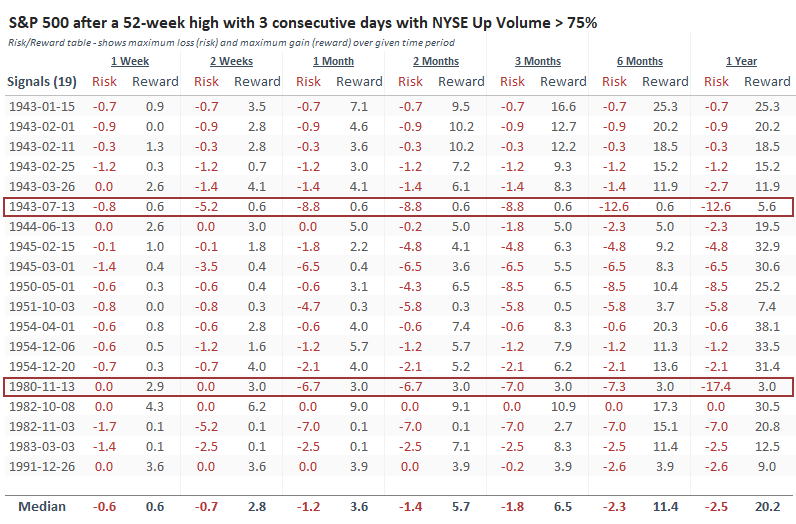
LOW RISK AND HIGH REWARD
One of the primary reasons to be constructive last March (and May and June) was the incessantly positive breadth thrusts that showed consistently positive forward returns.
The Risk/Reward Table of the signals shown in the table above shows just how skewed most of the signals tended to be. There were only two of them that showed consistently more downside than upside in the months ahead.
Once again, buyers have stepped in almost to the day following a dip in some breadth measures like the net percentage of NYSE issues at 52-week highs minus lows. That shows that there is still no change in the character of this market and its participants, and we might as well throw our hands up when trying to determine when any of the negatives might finally matter.
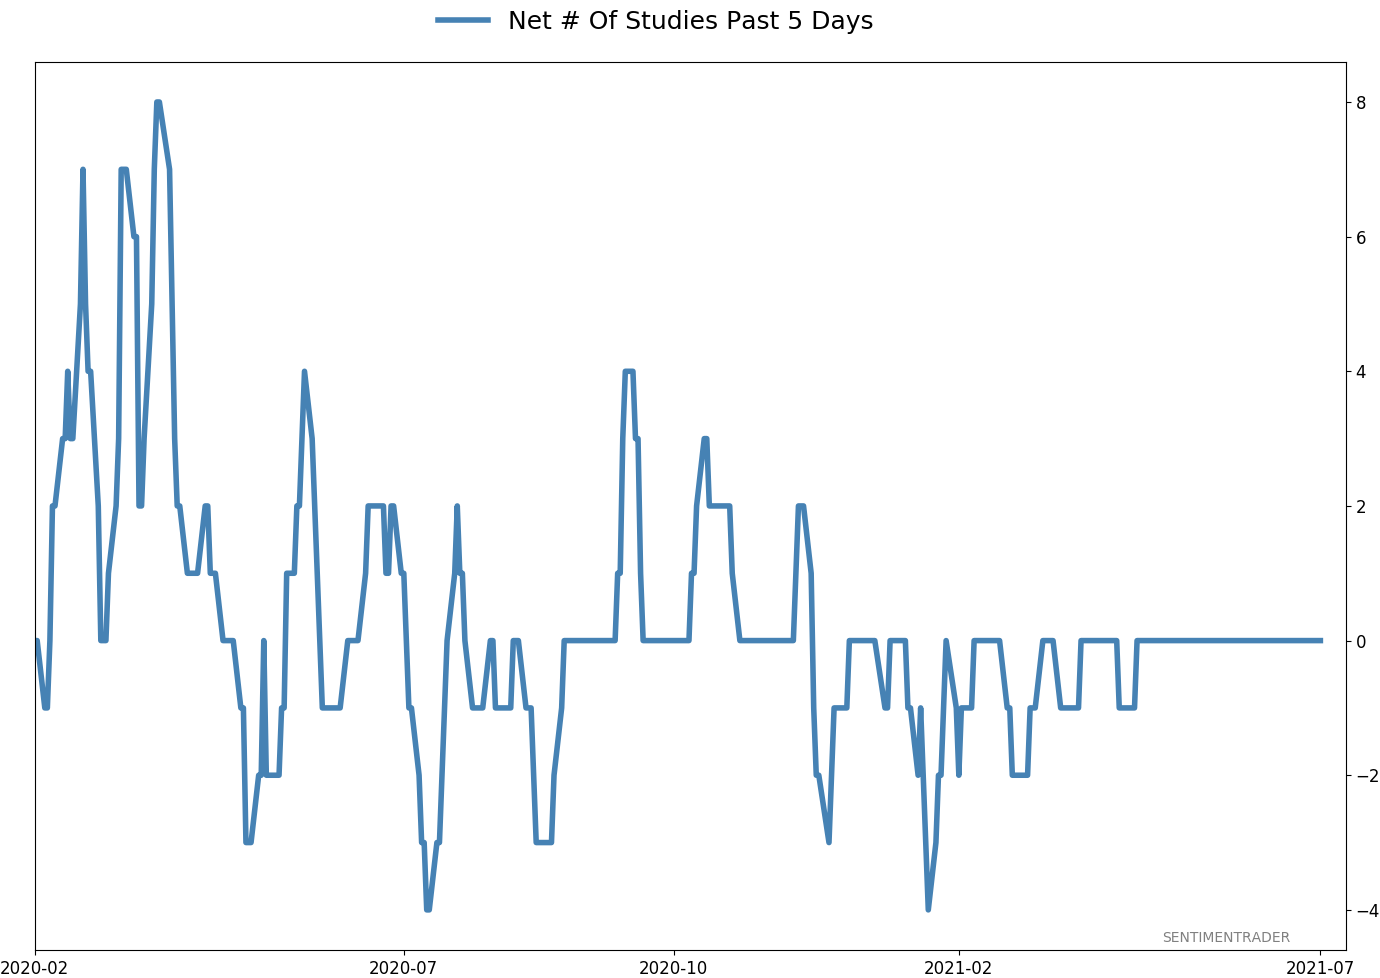
Active Studies
| Time Frame | Bullish | Bearish | | Short-Term | 0 | 5 | | Medium-Term | 4 | 3 | | Long-Term | 11 | 5 |
|
Indicators at Extremes
Portfolio
| Position | Description | Weight % | Added / Reduced | Date | | Stocks | RSP | 4.1 | Added 4.1% | 2021-05-19 | | Bonds | 23.9% BND, 6.9% SCHP | 30.7 | Reduced 7.1% | 2021-05-19 | | Commodities | GCC | 2.6 | Reduced 2.1%
| 2020-09-04 | | Precious Metals | GDX | 5.6 | Reduced 4.2% | 2021-05-19 | | Special Situations | 4.3% XLE, 2.2% PSCE | 7.6 | Reduced 5.6% | 2021-04-22 | | Cash | | 49.4 | | |
|
Updates (Changes made today are underlined)
Much of our momentum and trend work has remained positive for several months, with some scattered exceptions. Almost all sentiment-related work has shown a poor risk/reward ratio for stocks, especially as speculation drove to record highs in exuberance in February. Much of that has worn off, and most of our models are back toward neutral levels. There isn't much to be excited about here. The same goes for bonds and even gold. Gold has been performing well lately and is back above long-term trend lines. The issue is that it has a poor record of holding onto gains when attempting a long-term trend change like this, so we'll take a wait-and-see approach. RETURN YTD: 8.2% 2020: 8.1%, 2019: 12.6%, 2018: 0.6%, 2017: 3.8%, 2016: 17.1%, 2015: 9.2%, 2014: 14.5%, 2013: 2.2%, 2012: 10.8%, 2011: 16.5%, 2010: 15.3%, 2009: 23.9%, 2008: 16.2%, 2007: 7.8%
|
|
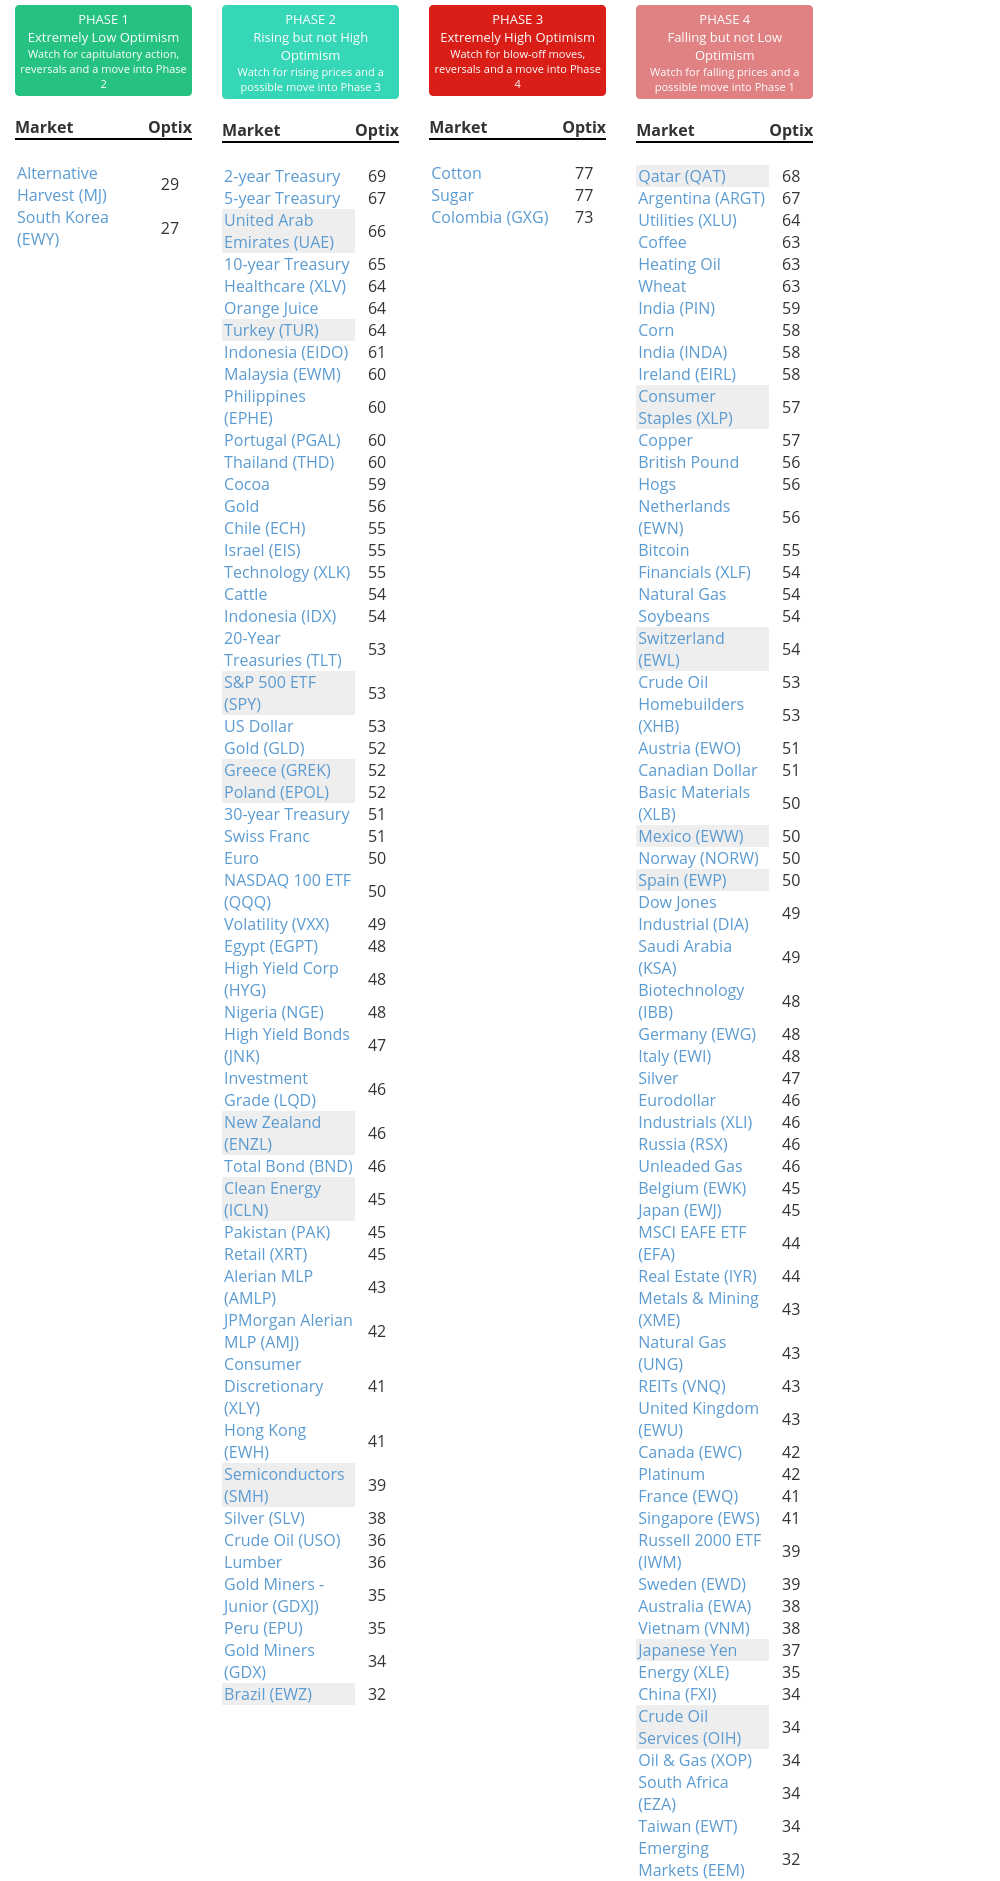
Phase Table
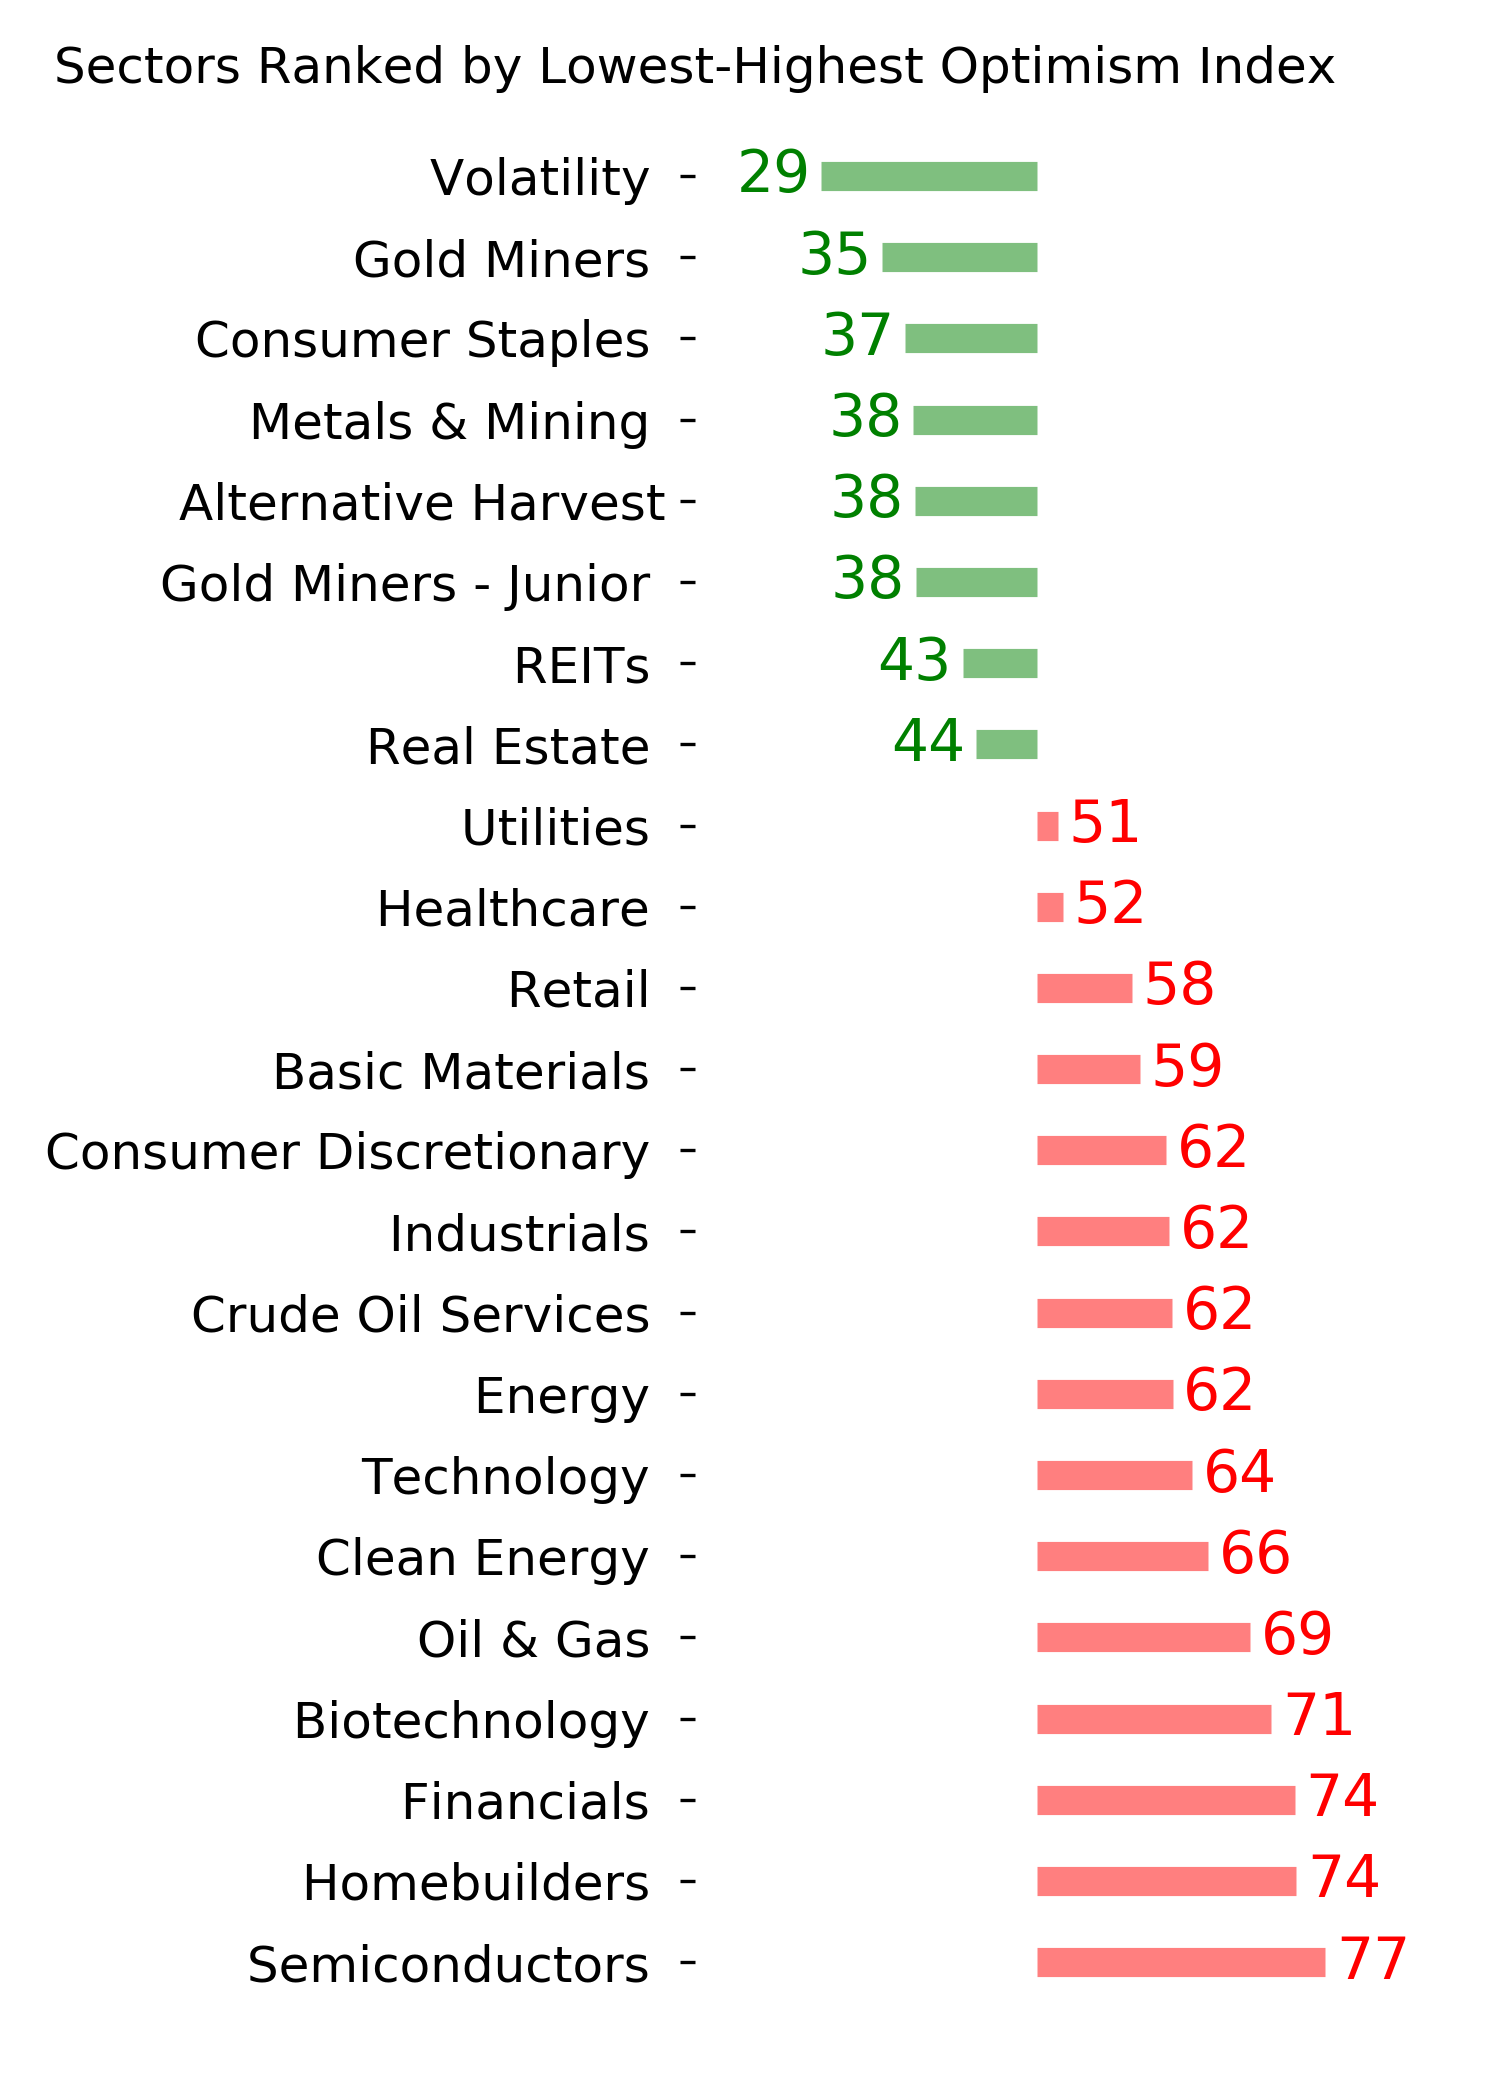
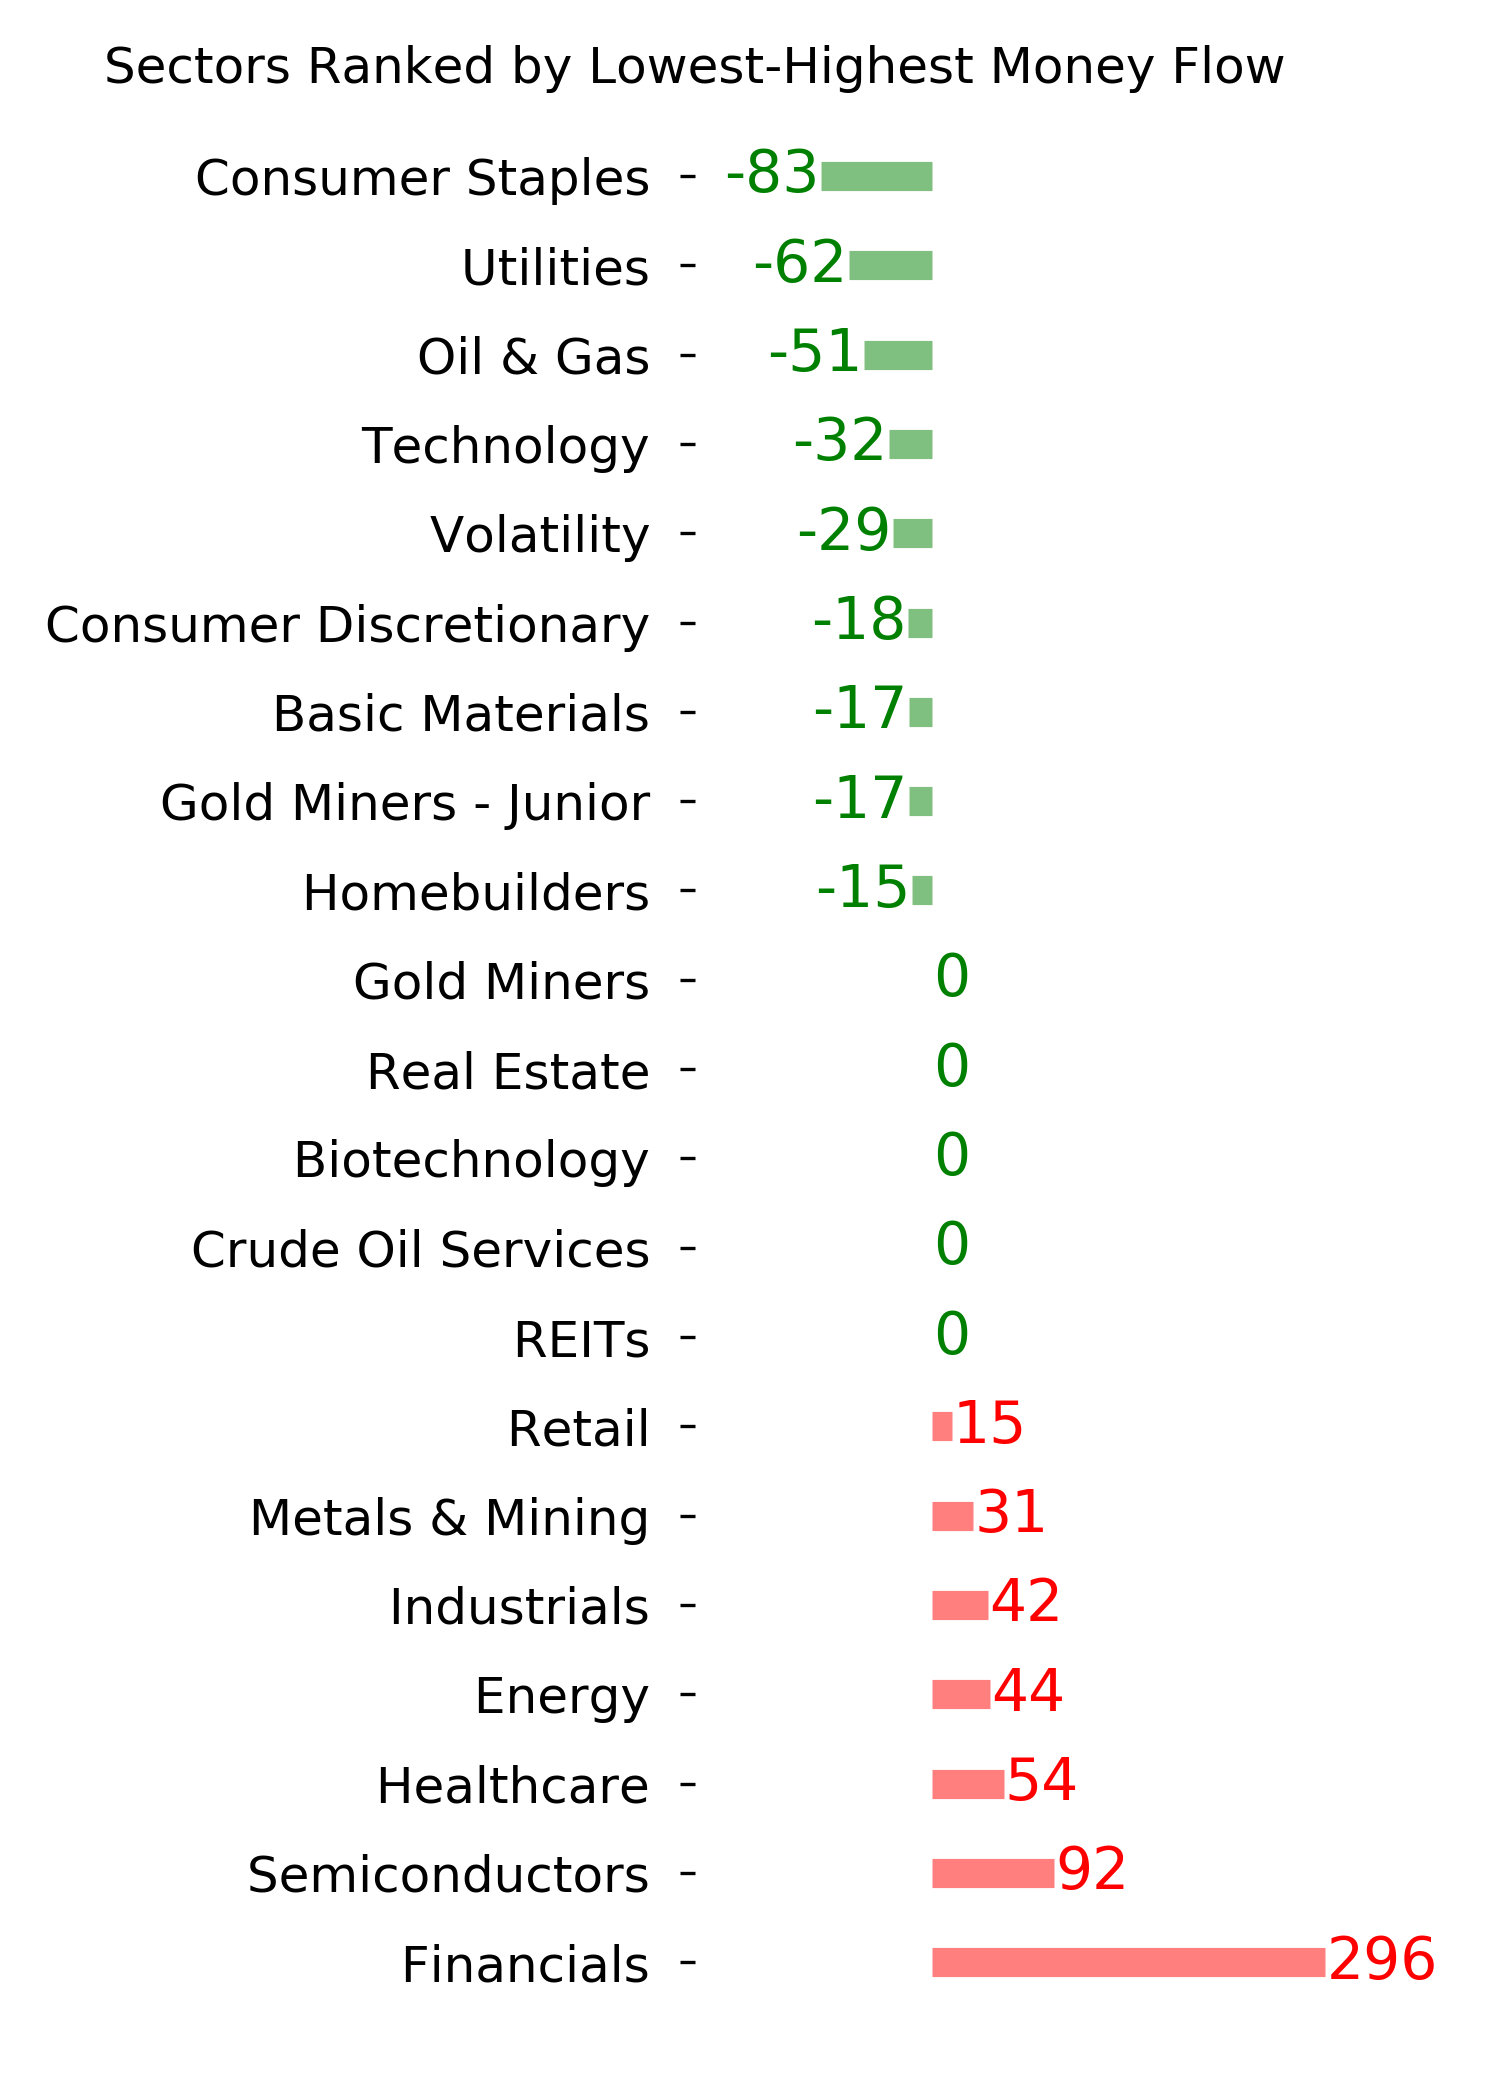
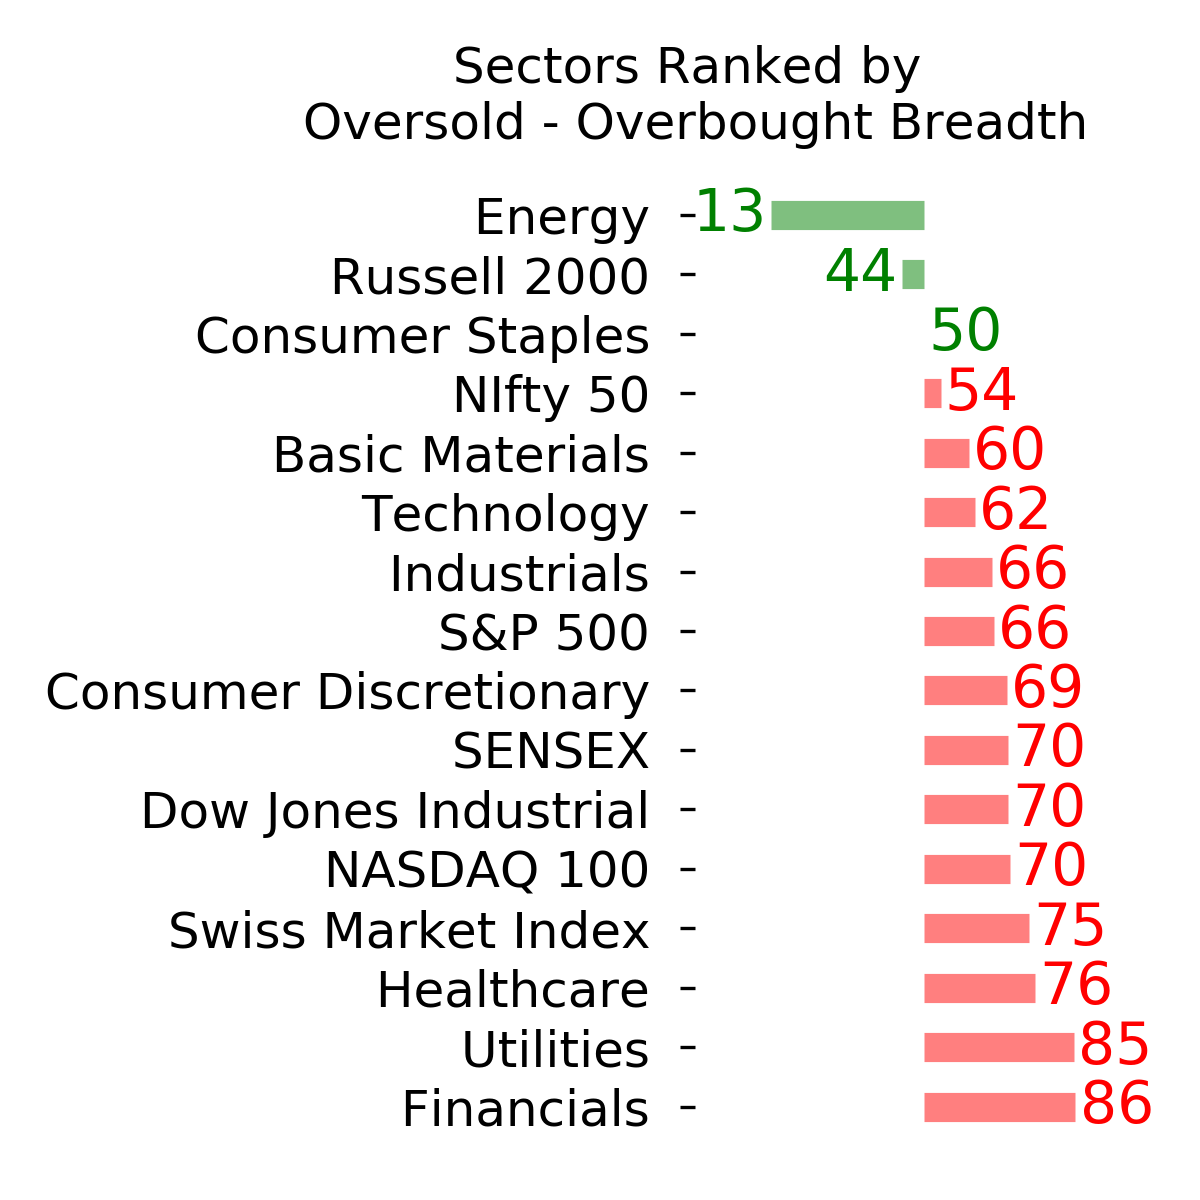
Ranks
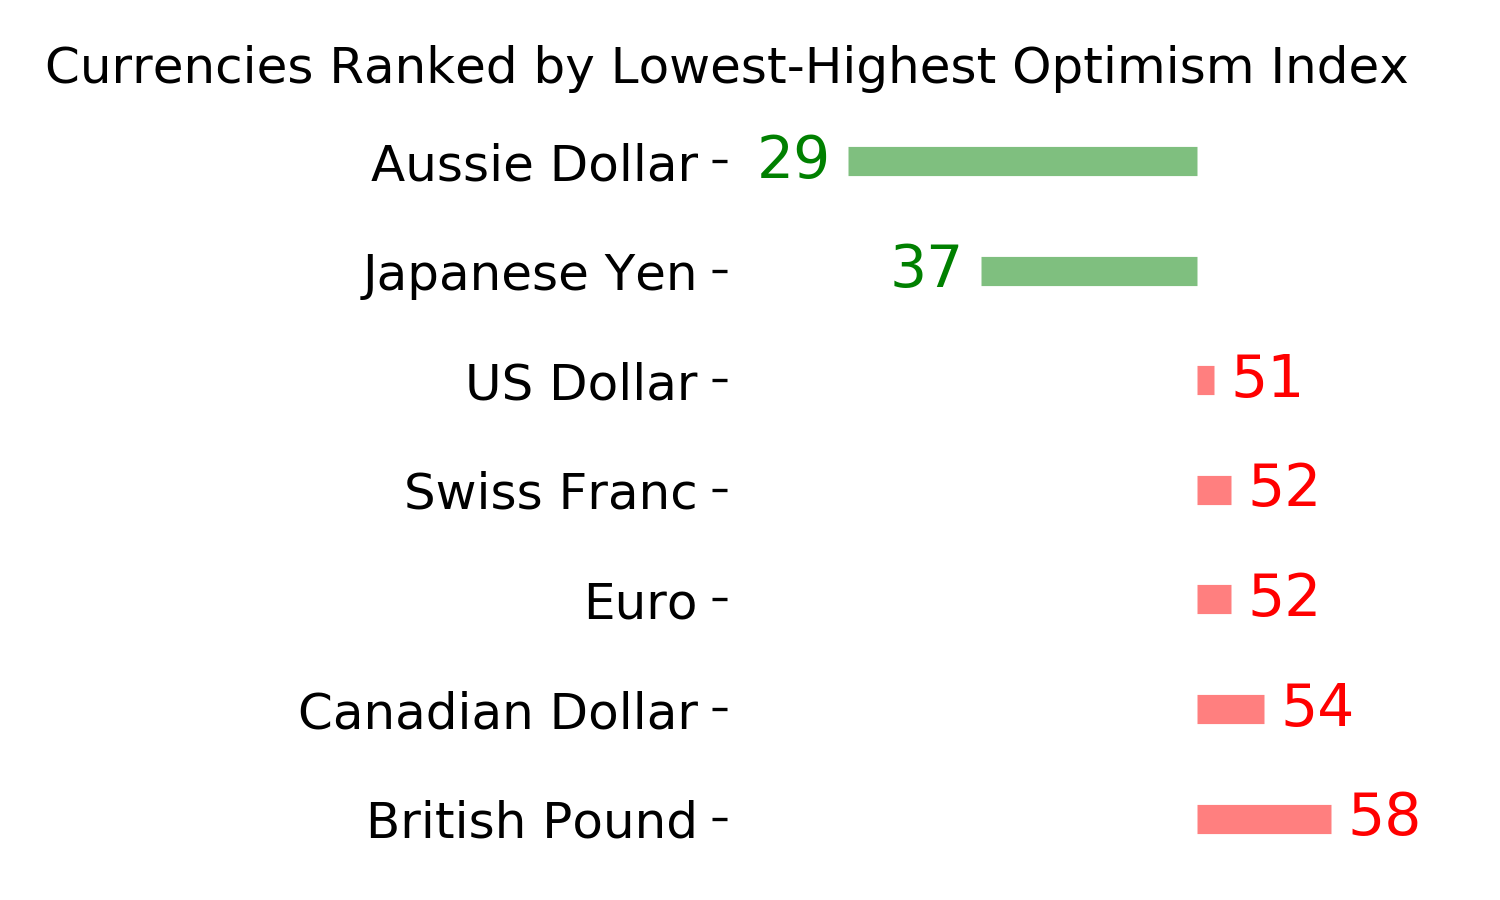
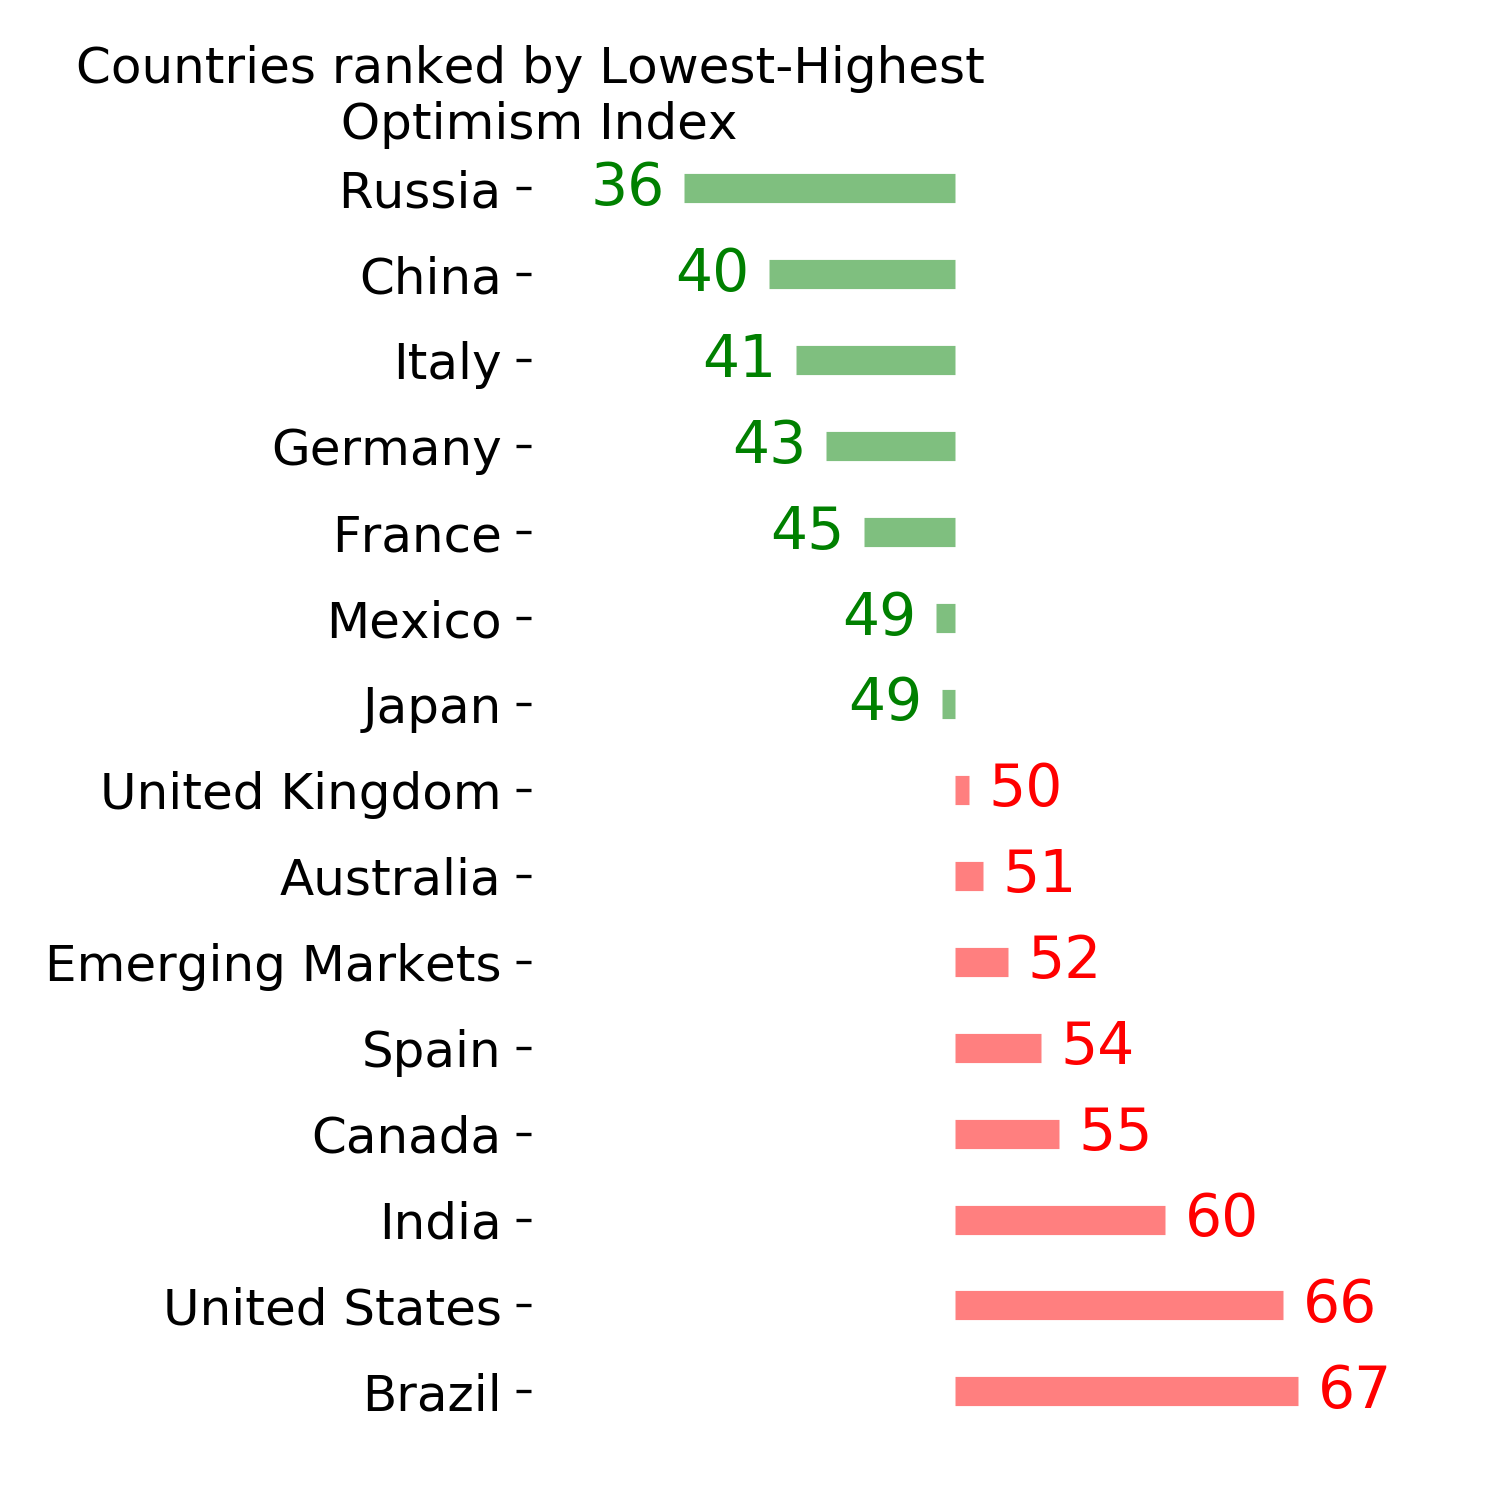
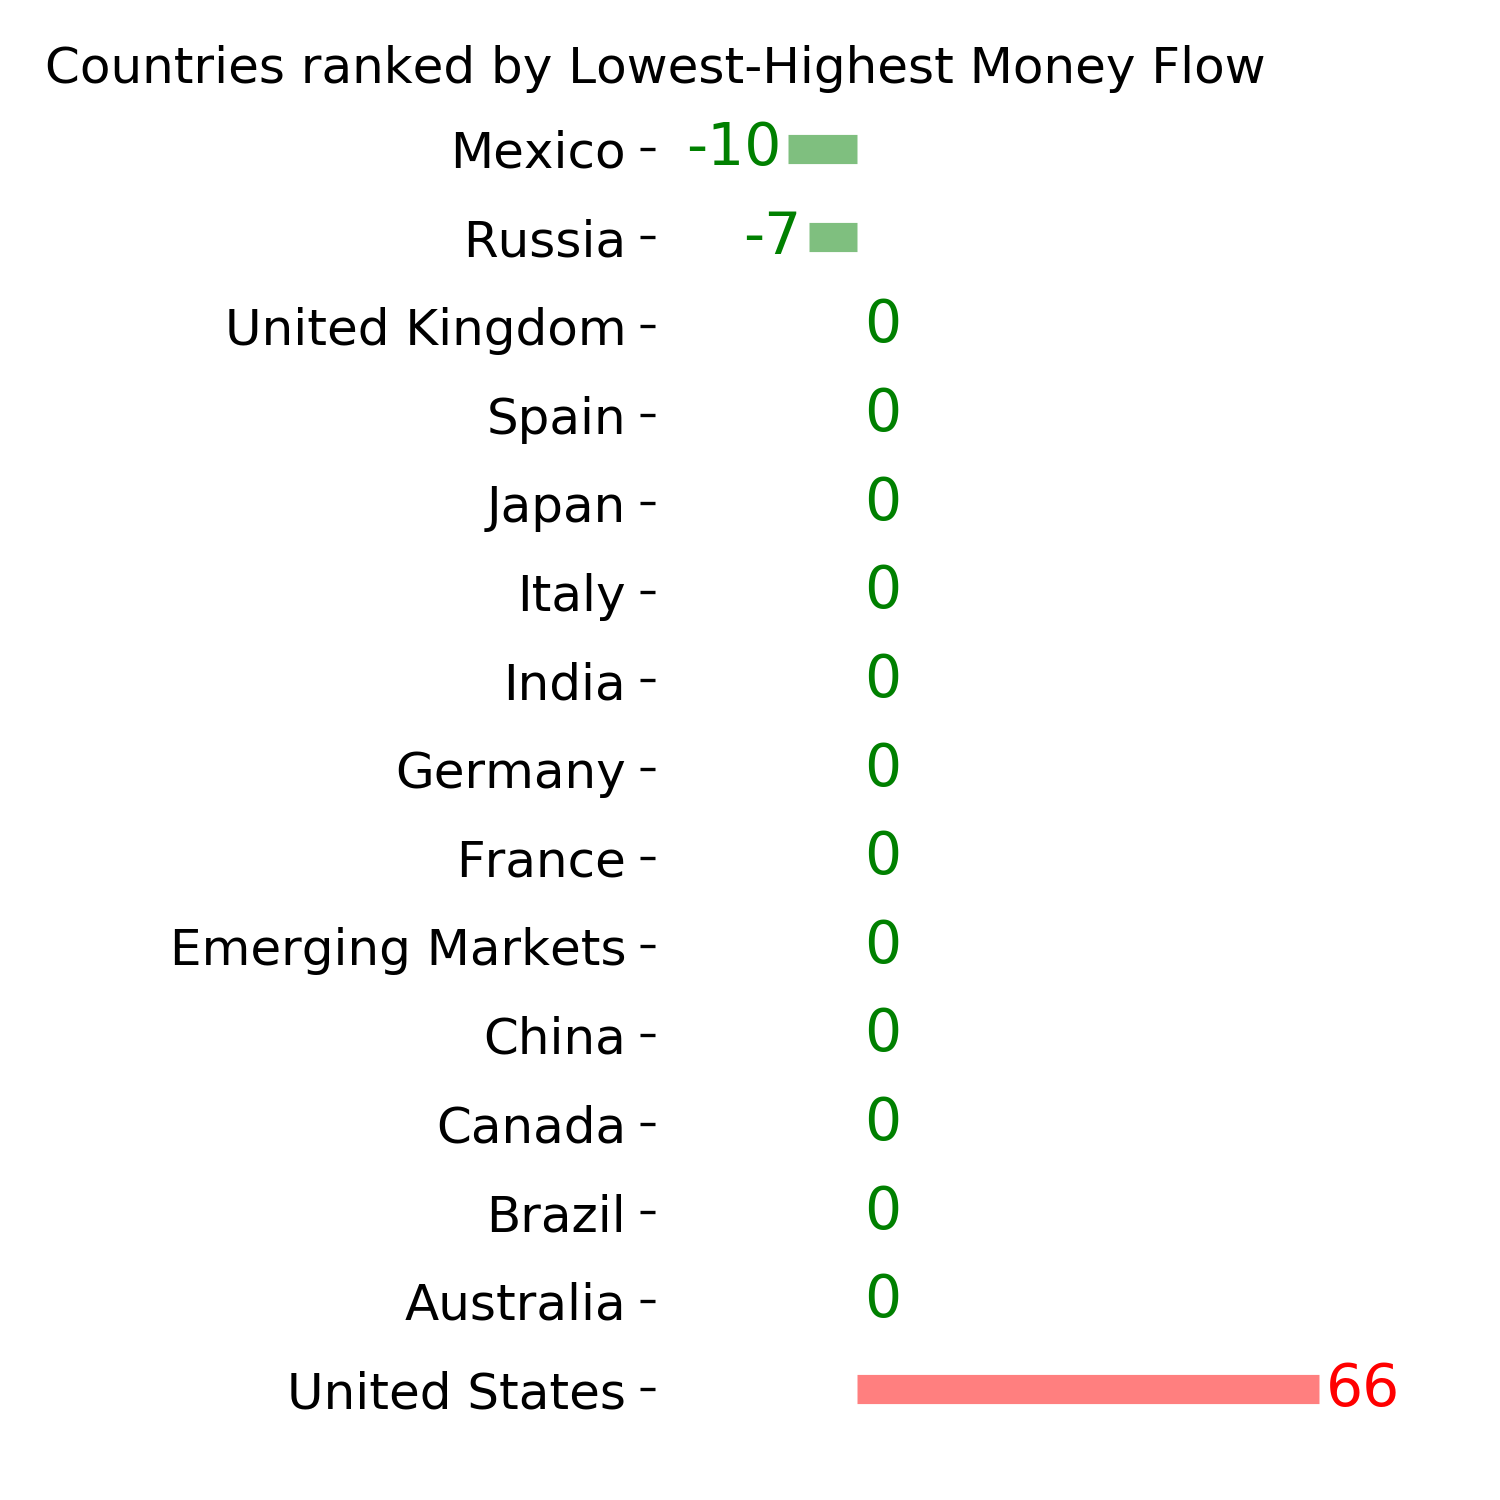
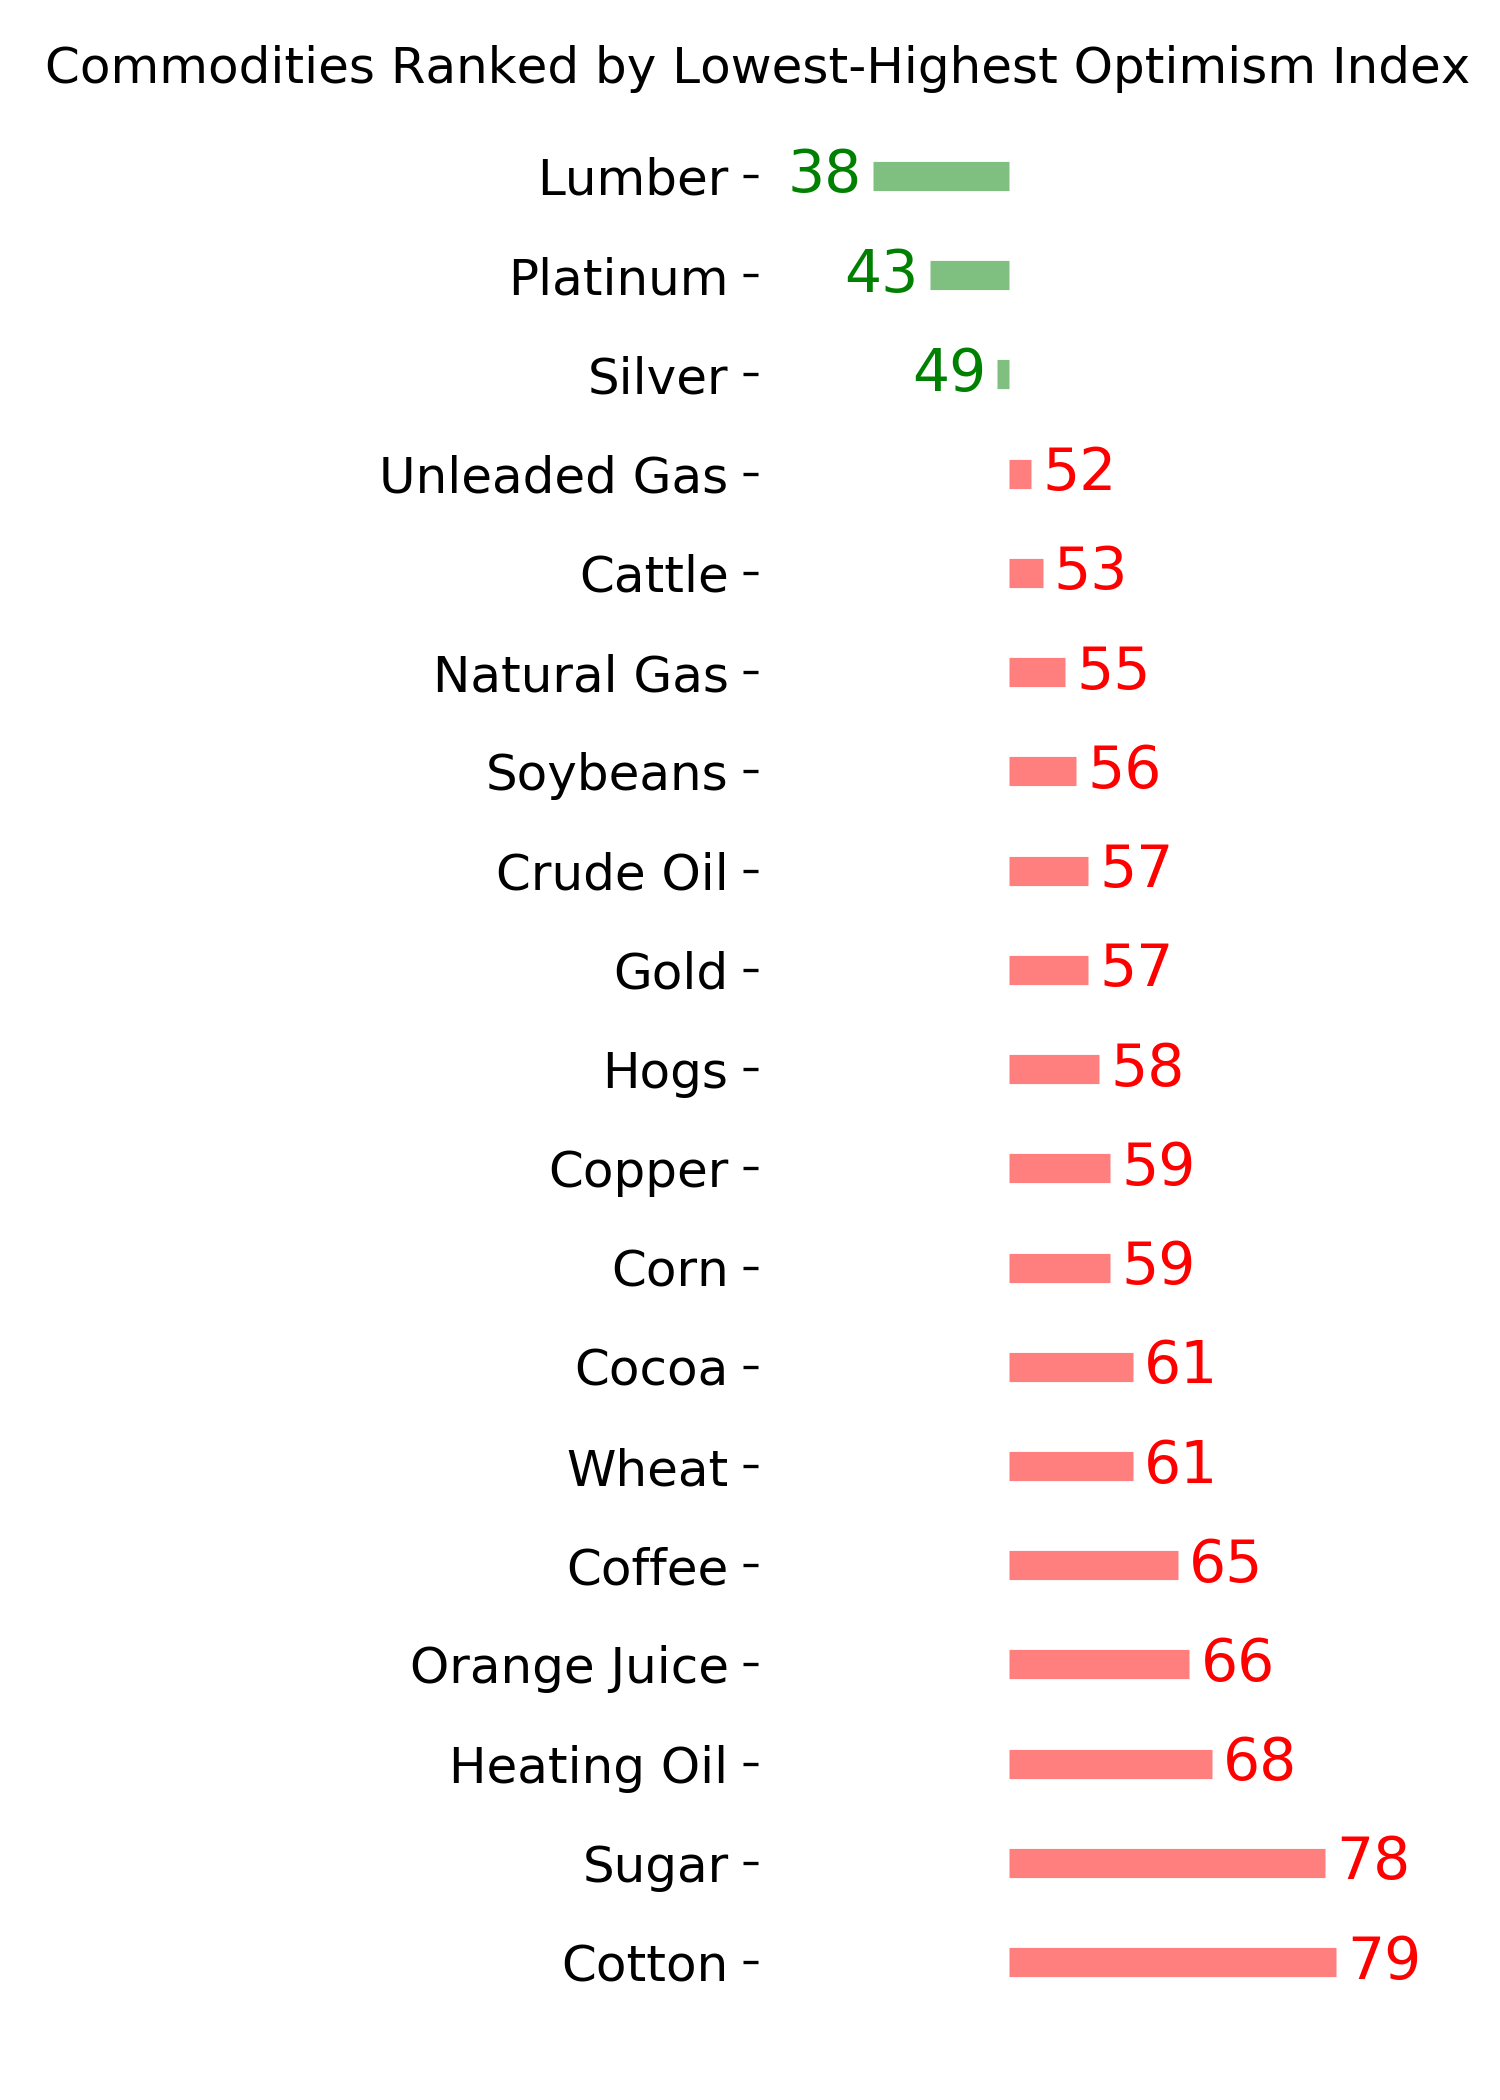
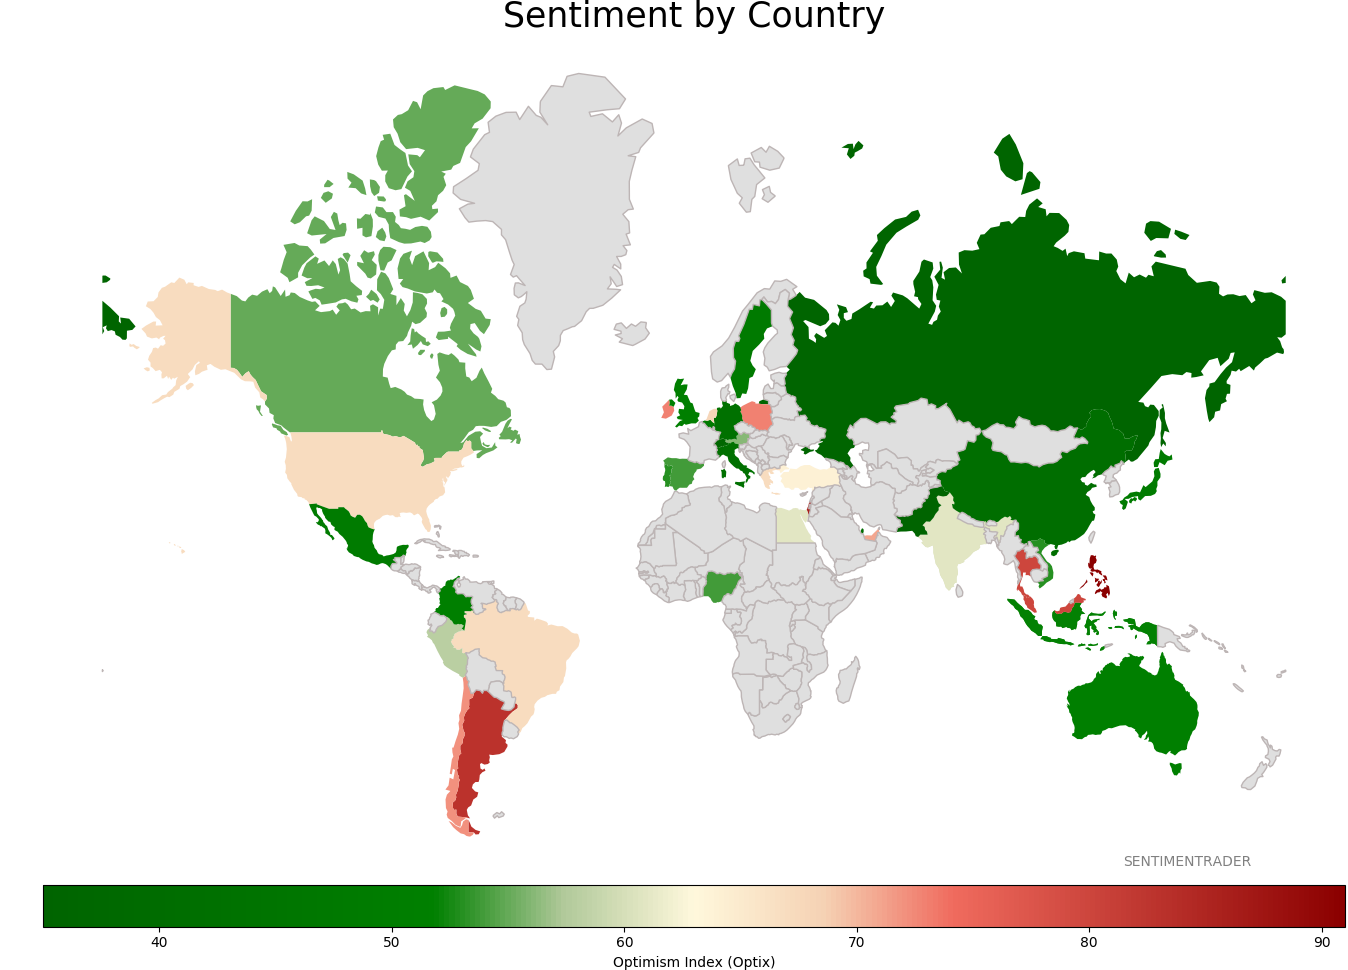
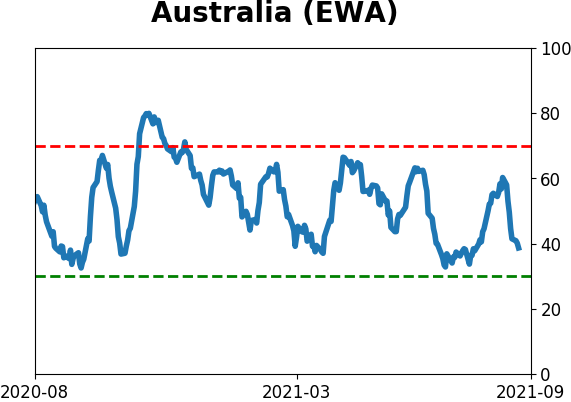
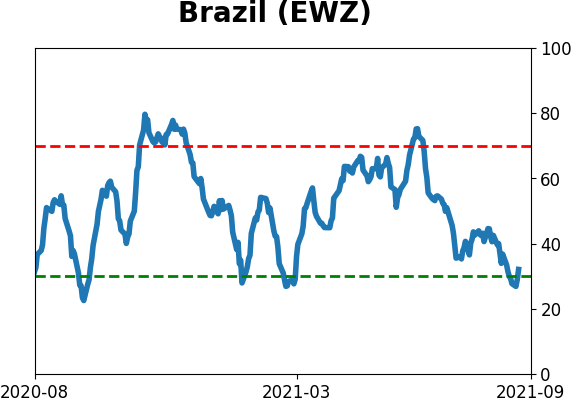
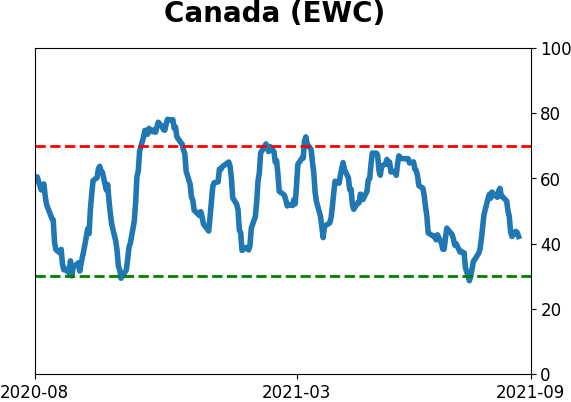
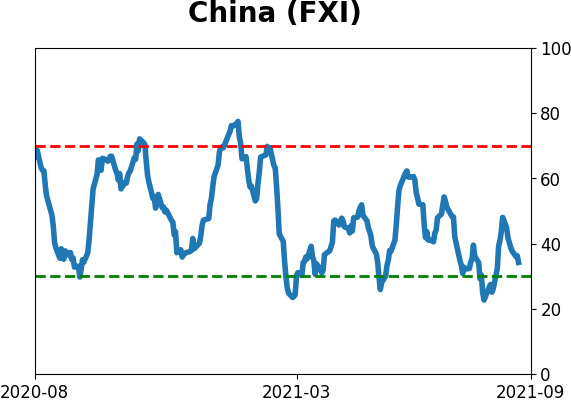
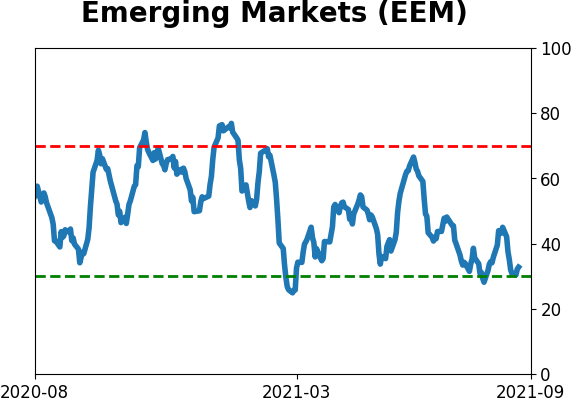
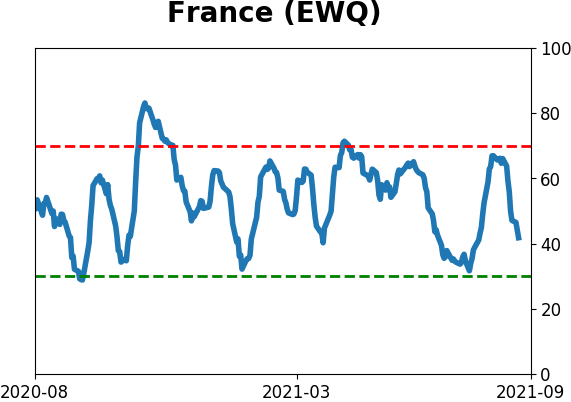
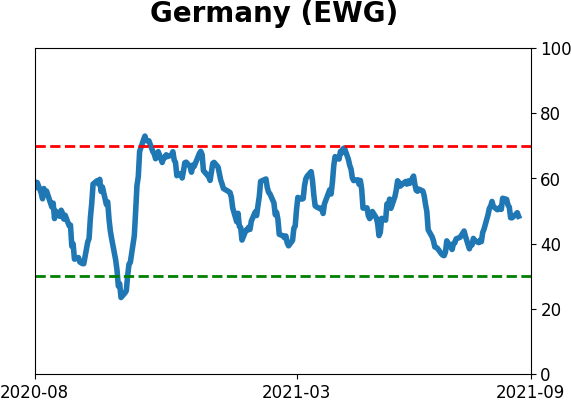
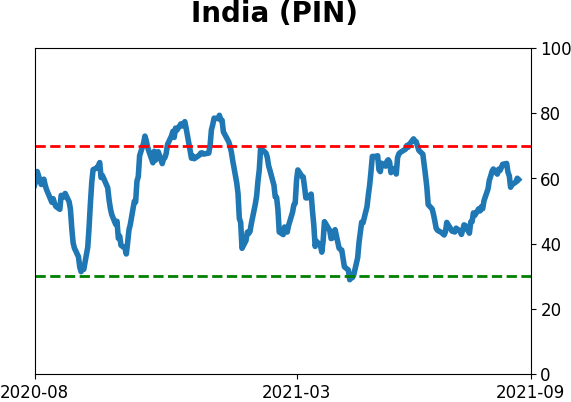
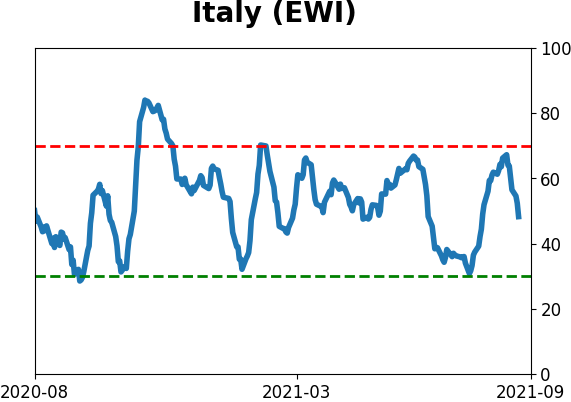
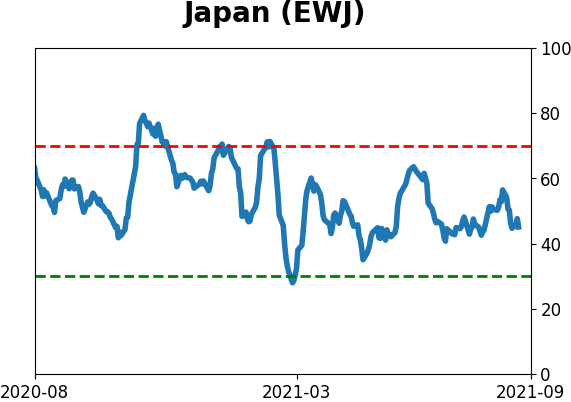
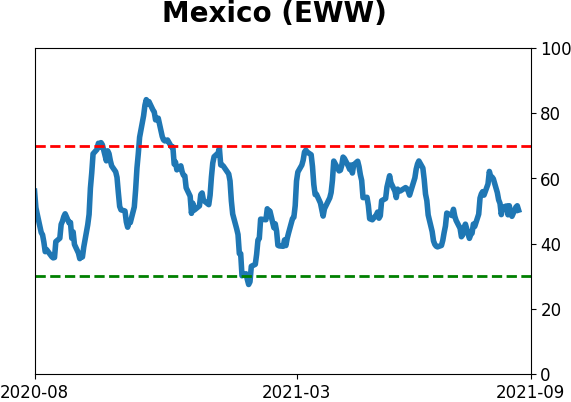
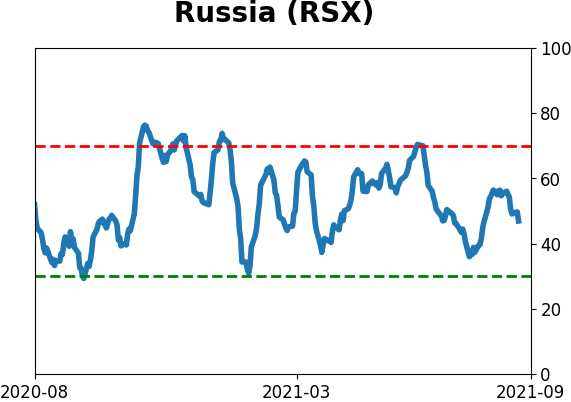
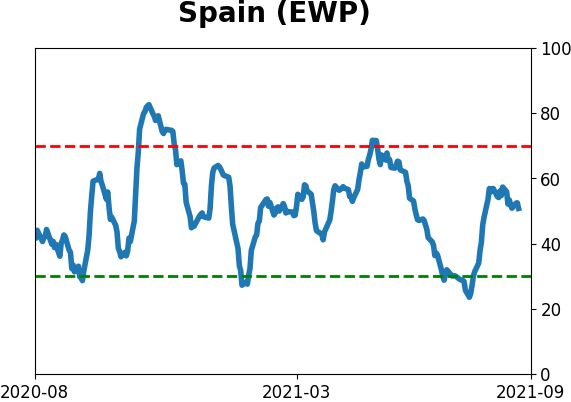
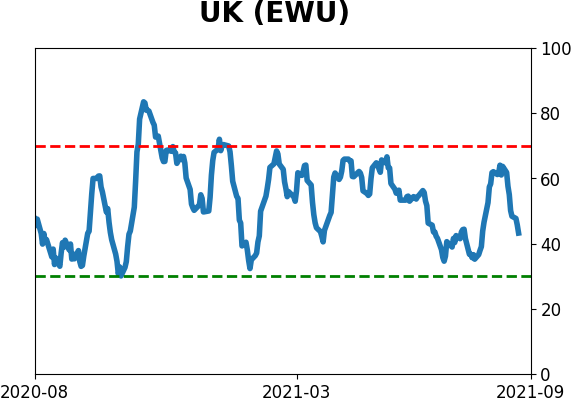
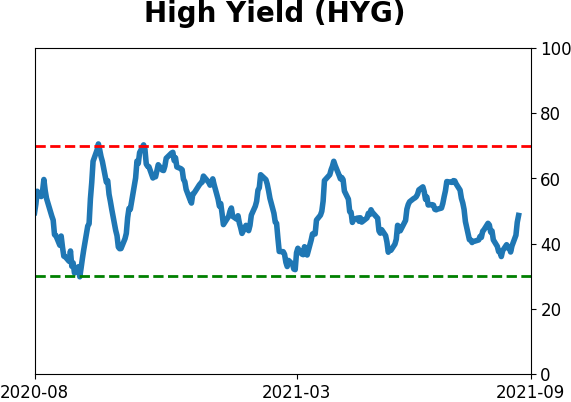
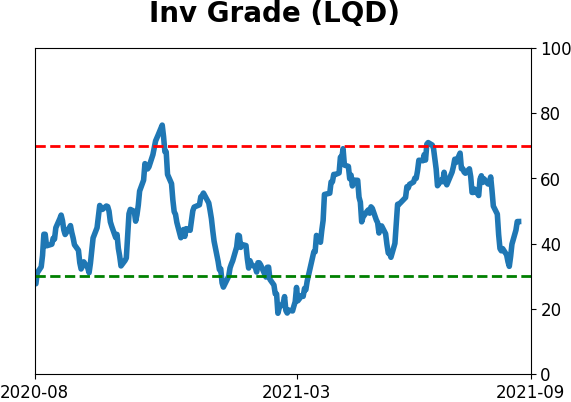
Sentiment Around The World
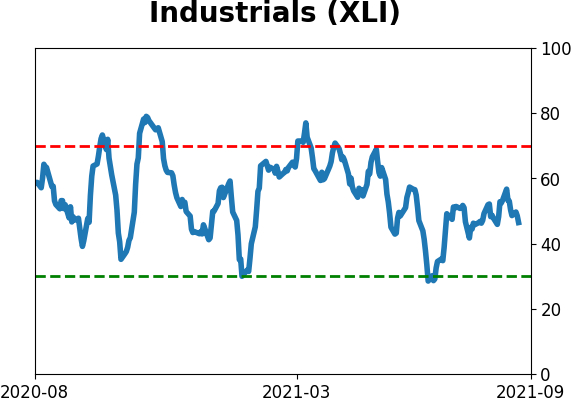
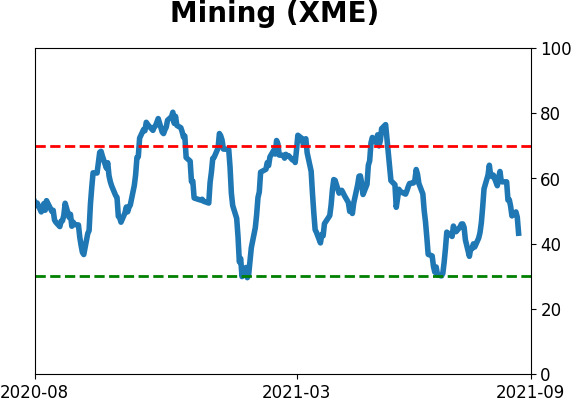
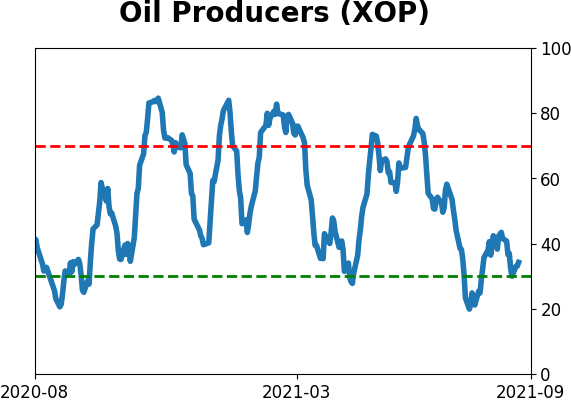
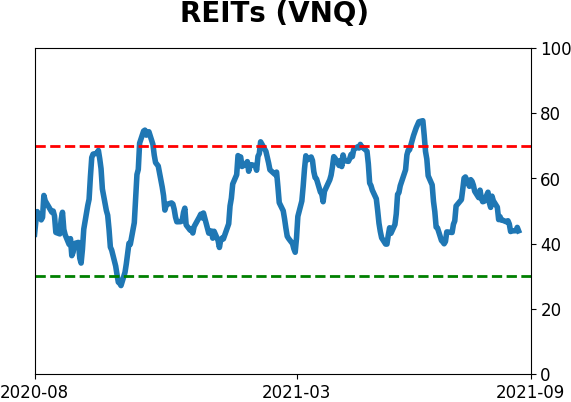
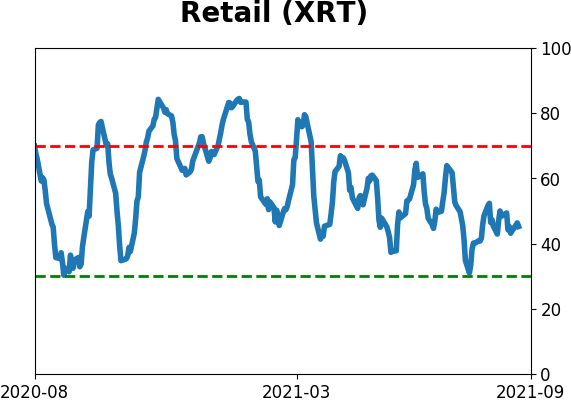
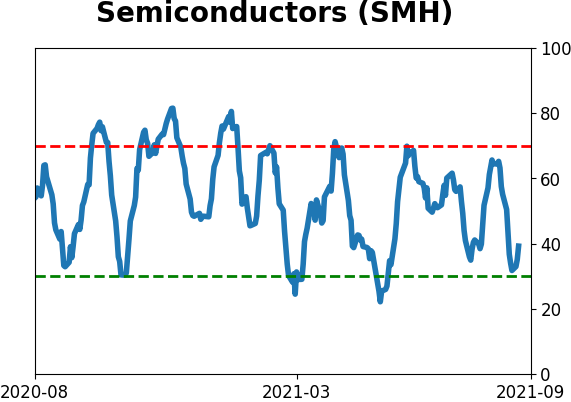
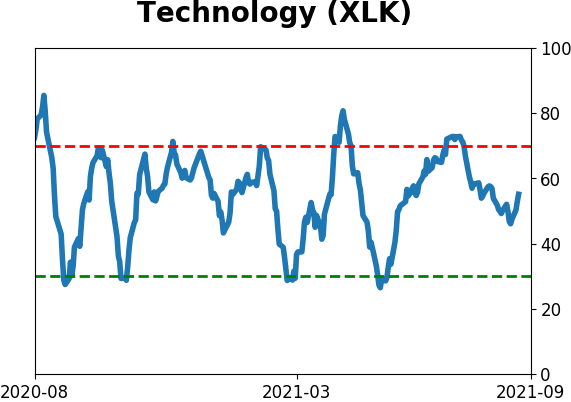
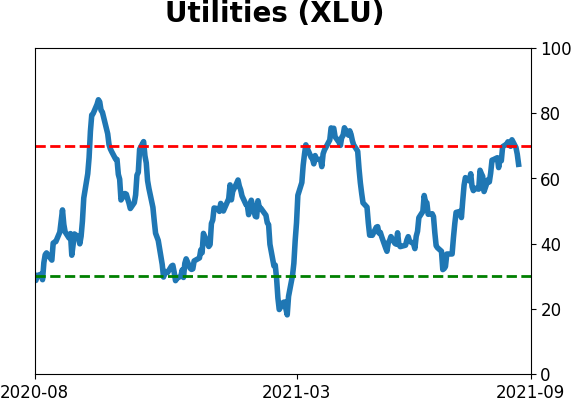
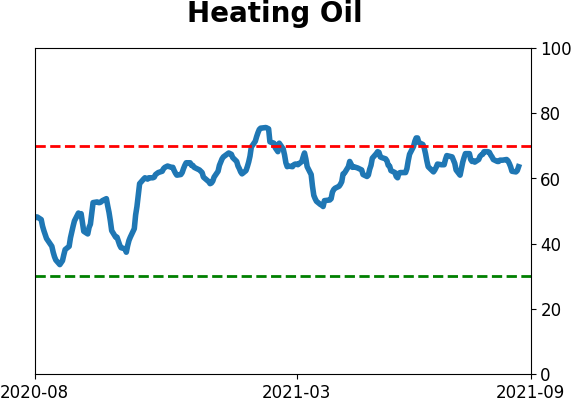
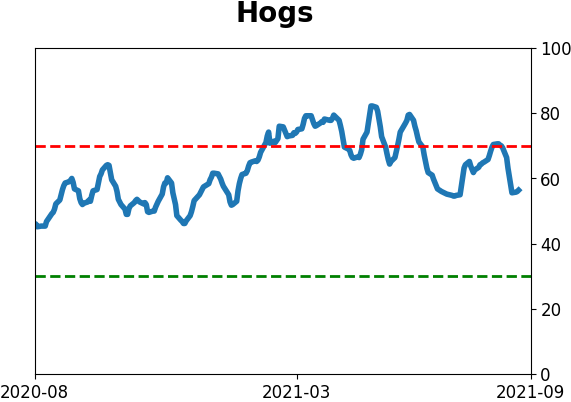
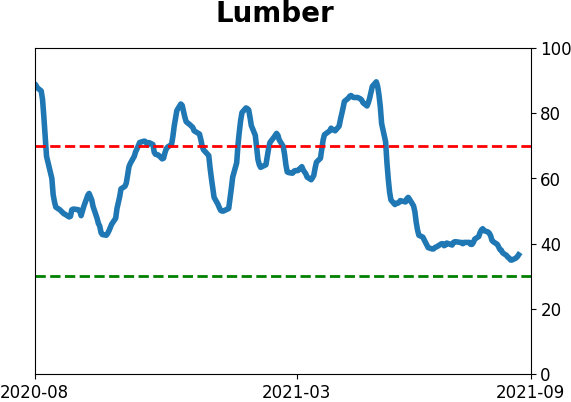
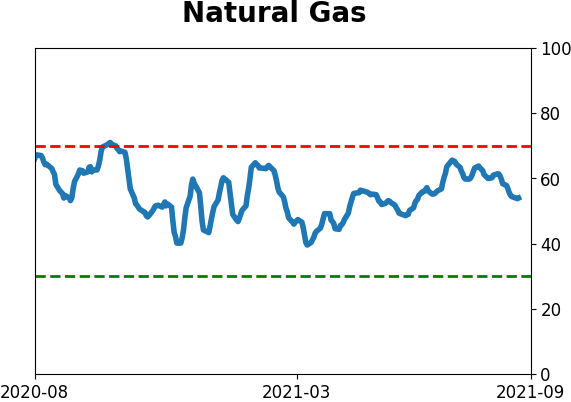
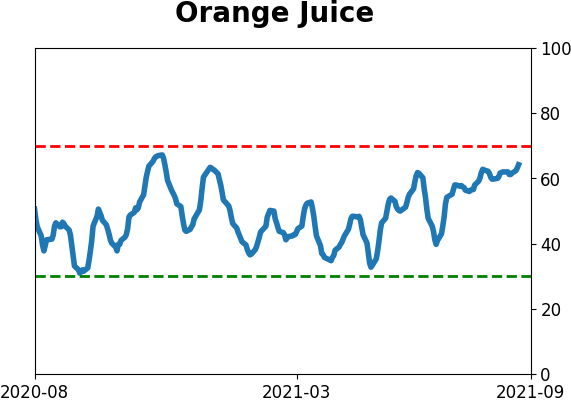
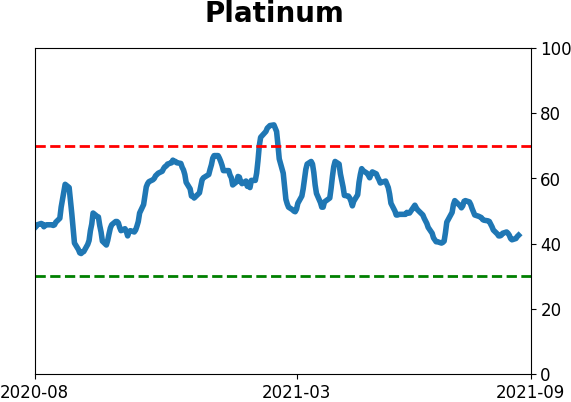
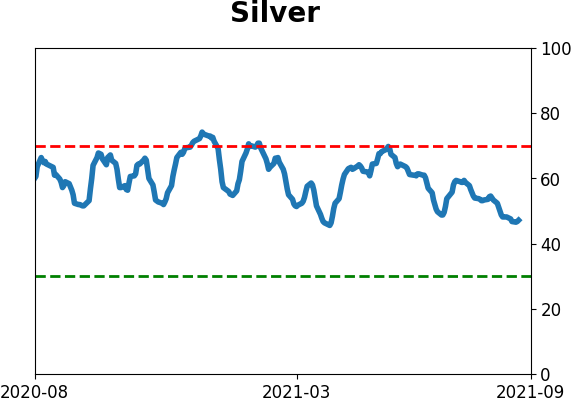
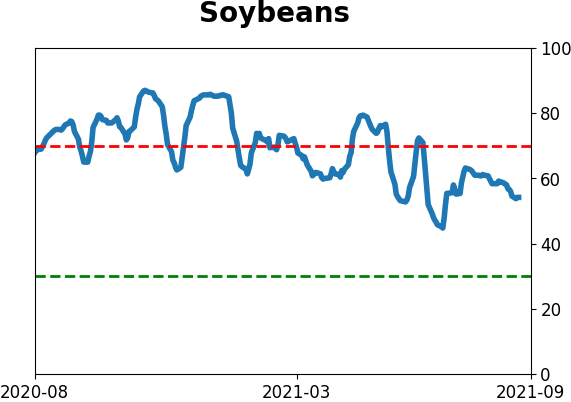
Optimism Index Thumbnails
|
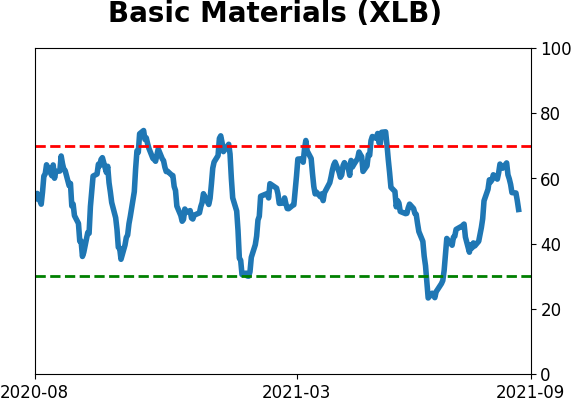
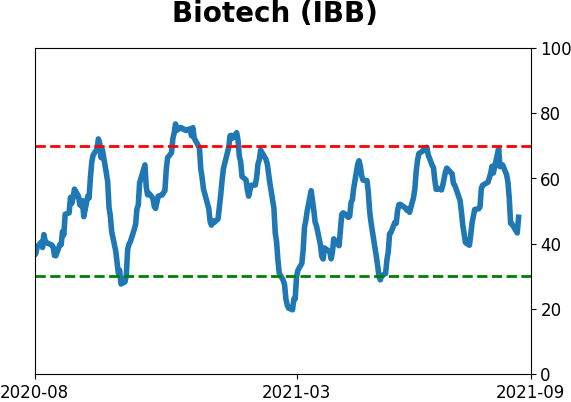
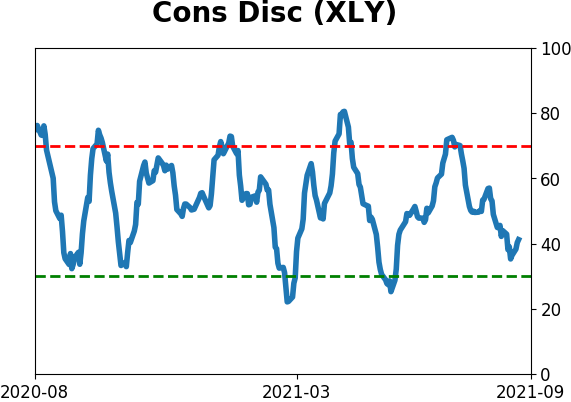
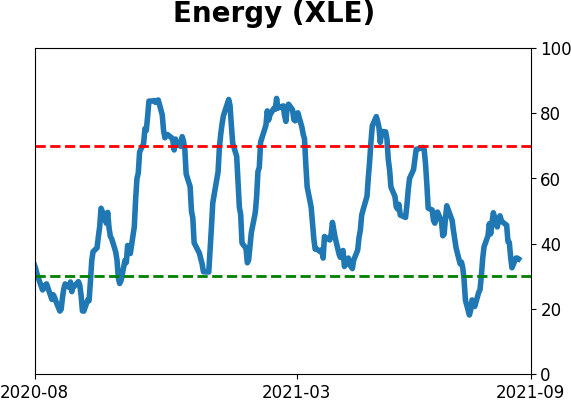
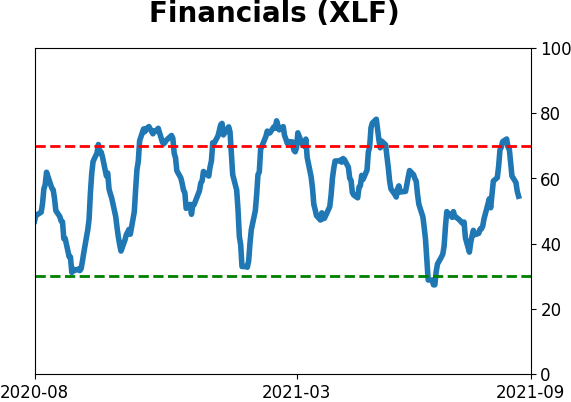
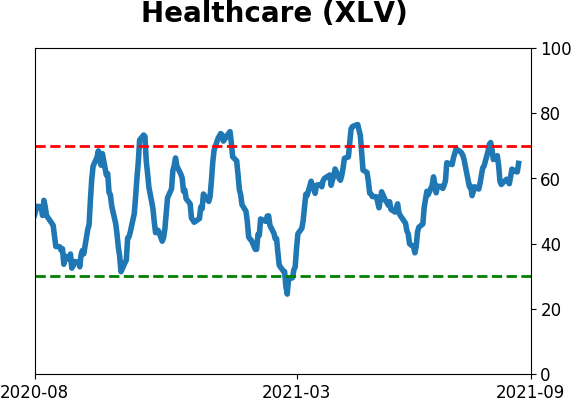
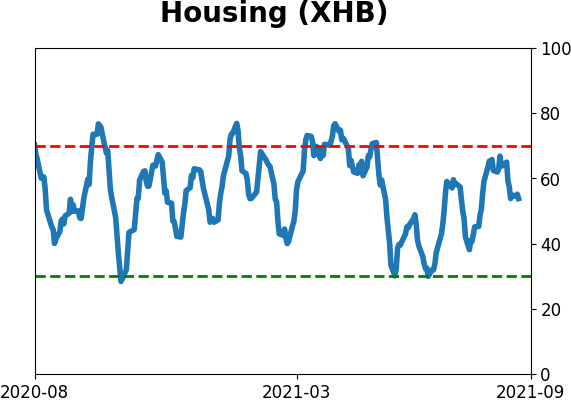
Sector ETF's - 10-Day Moving Average
|
|
|
Country ETF's - 10-Day Moving Average
|
|
|
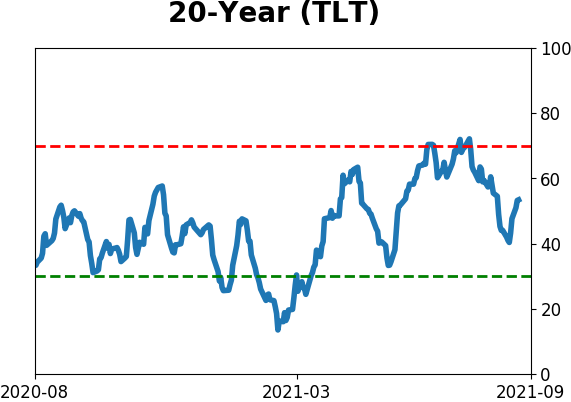
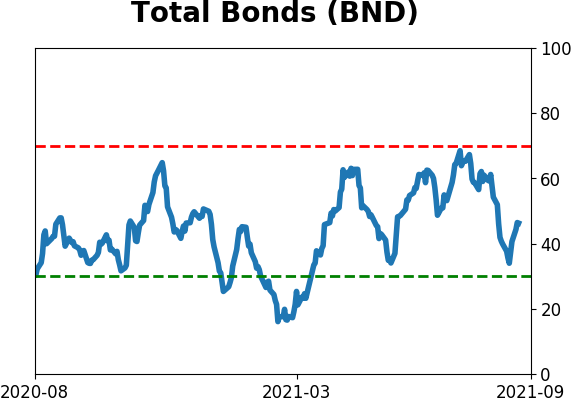
Bond ETF's - 10-Day Moving Average
|
|
|
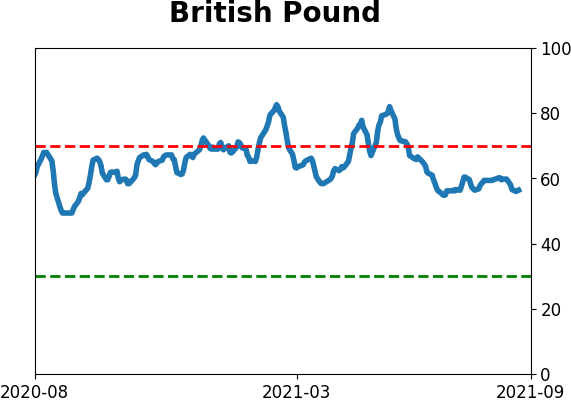
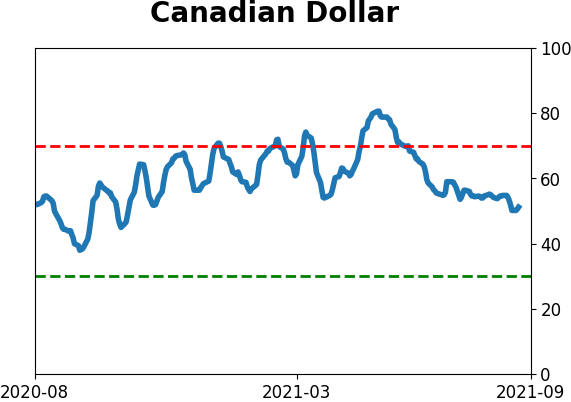
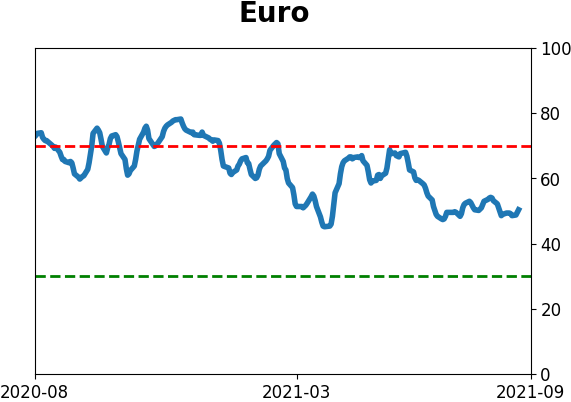
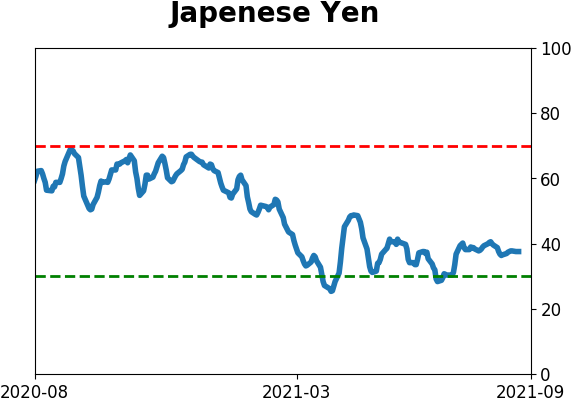
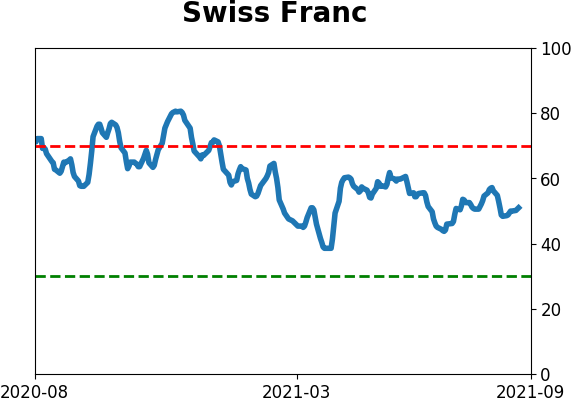
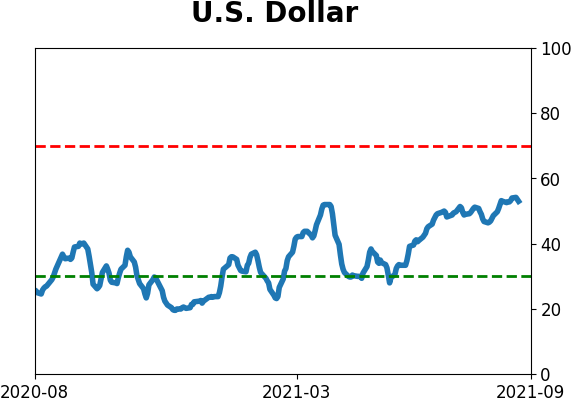
Currency ETF's - 5-Day Moving Average
|
|
|
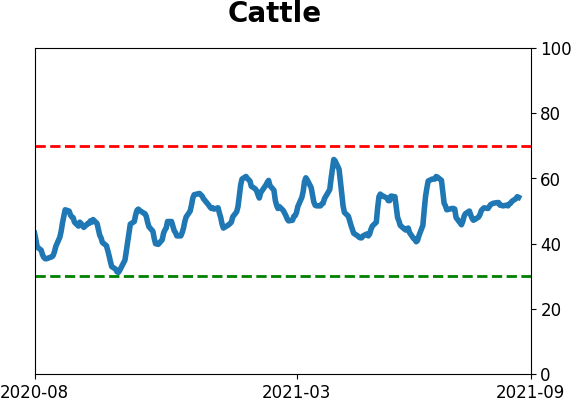
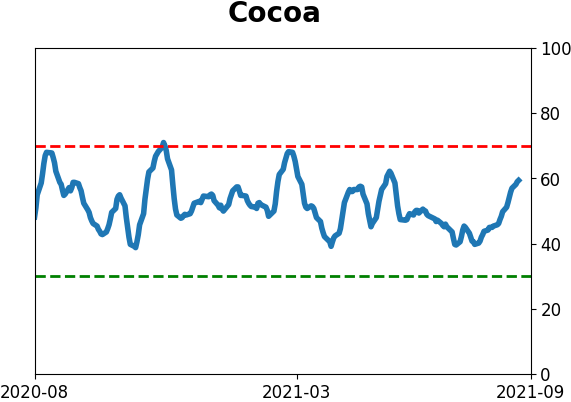
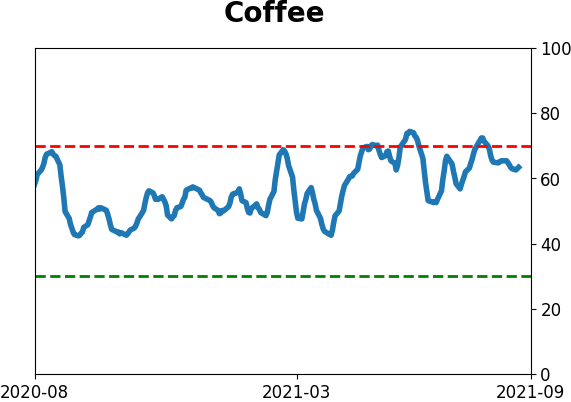
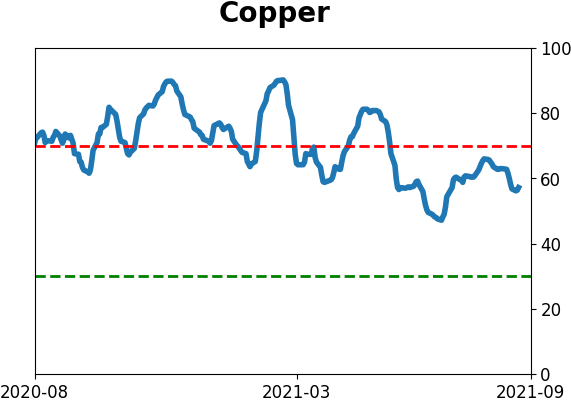
Commodity ETF's - 5-Day Moving Average
|
|