Headlines
|
|
Recoveries in Summation Indexes ended other bear markets:
The McClellan Summation Indexes for both the NYSE and Nasdaq exchanges cycled from deep oversold levels to overbought ones. Over the past 36 years, when they've done so in tandem, it has indicated new bull market conditions. The only failure was in 2001, when sellers returned immediately.
|
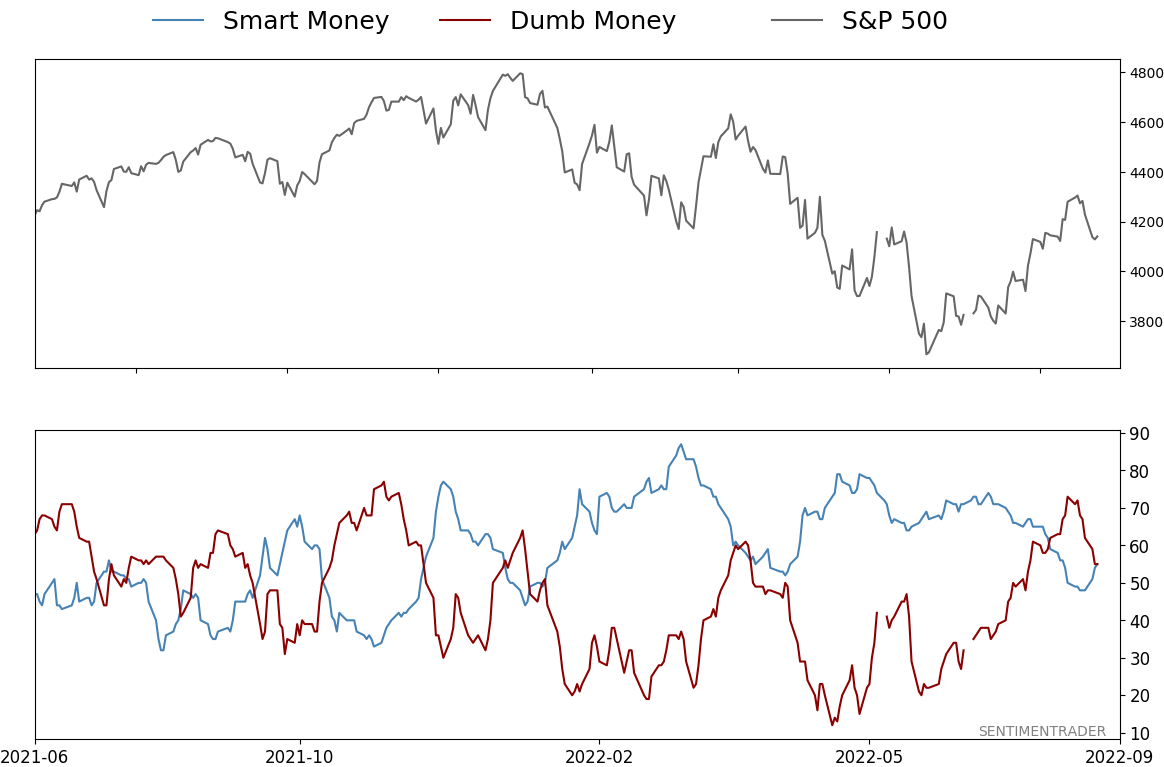
Smart / Dumb Money Confidence
|
Smart Money Confidence: 55%
Dumb Money Confidence: 55%
|
|
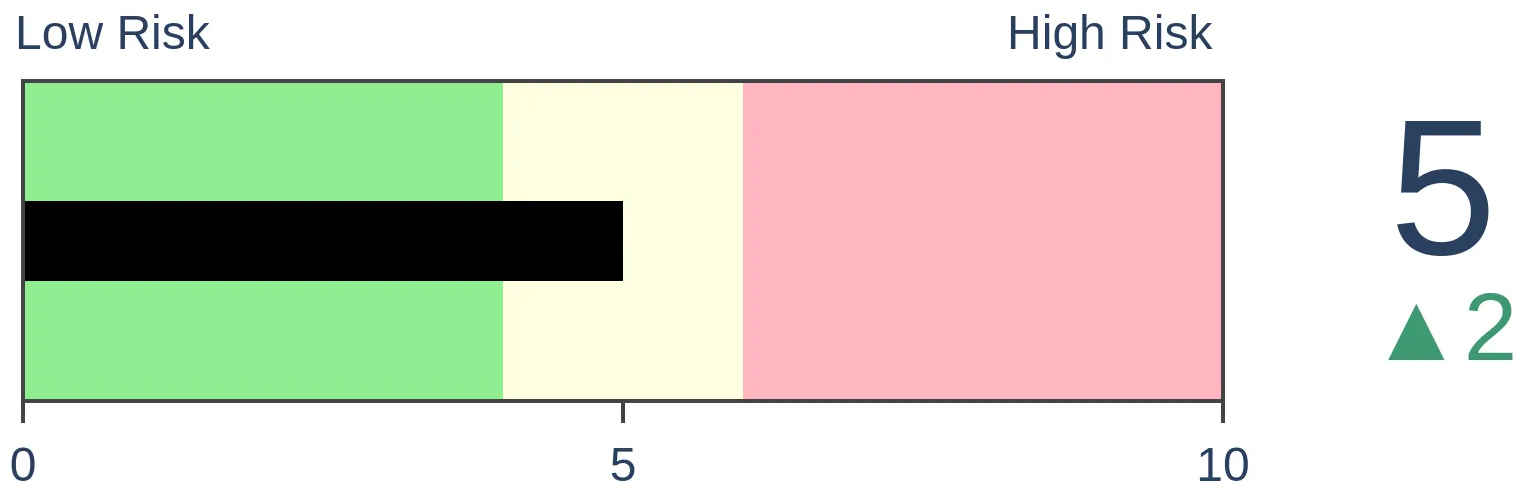
Risk Levels
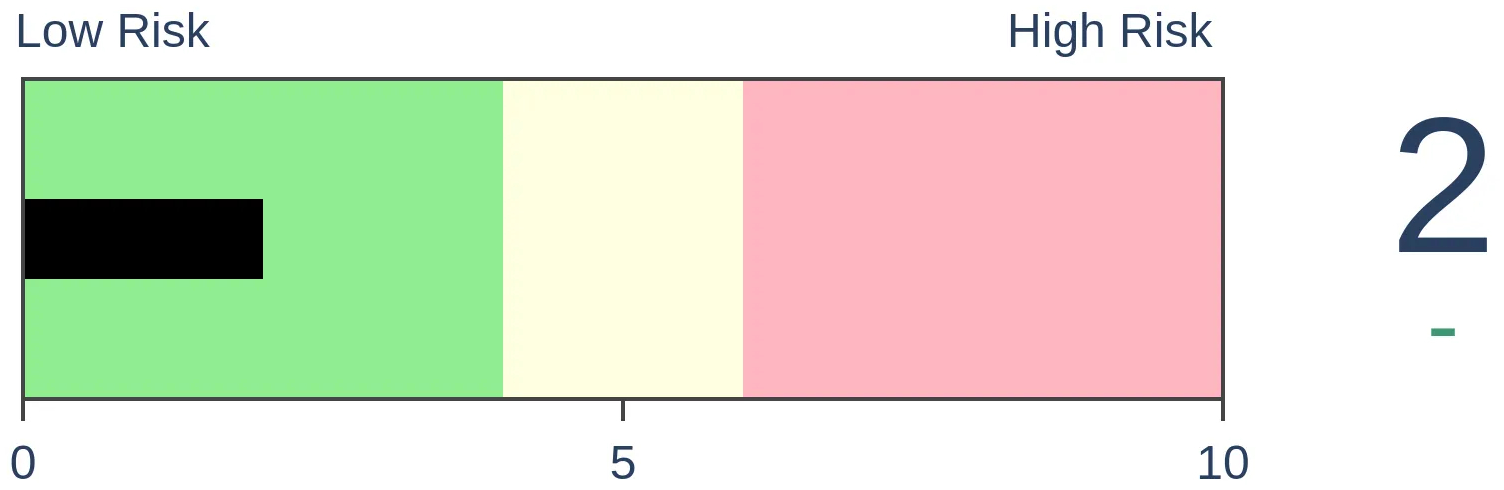
Stocks Short-Term
|
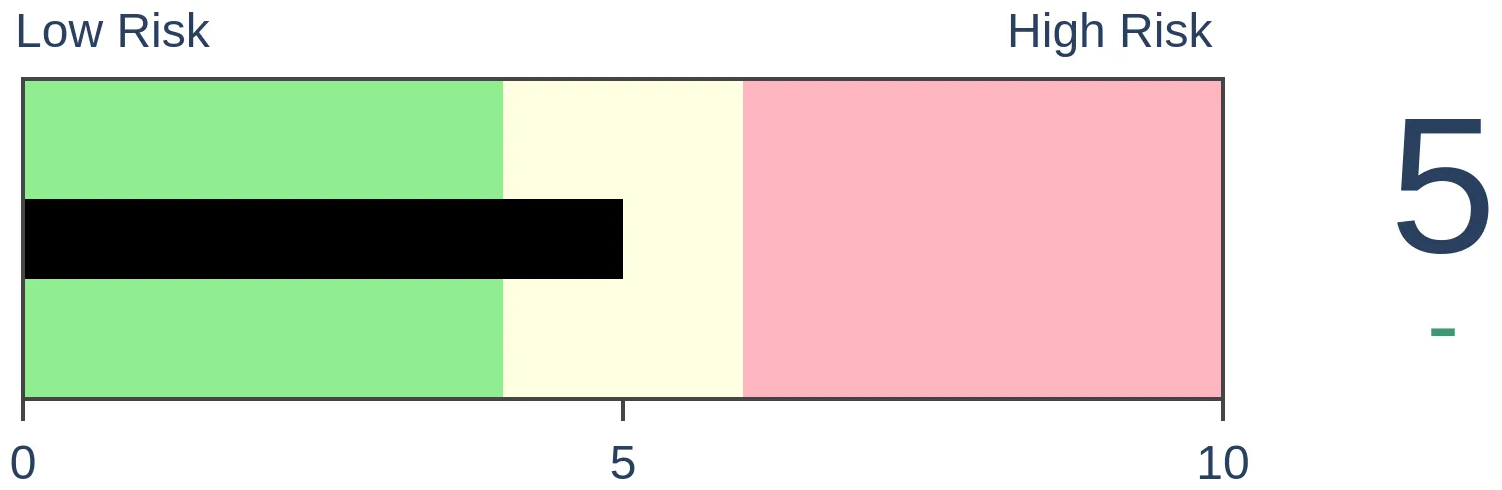
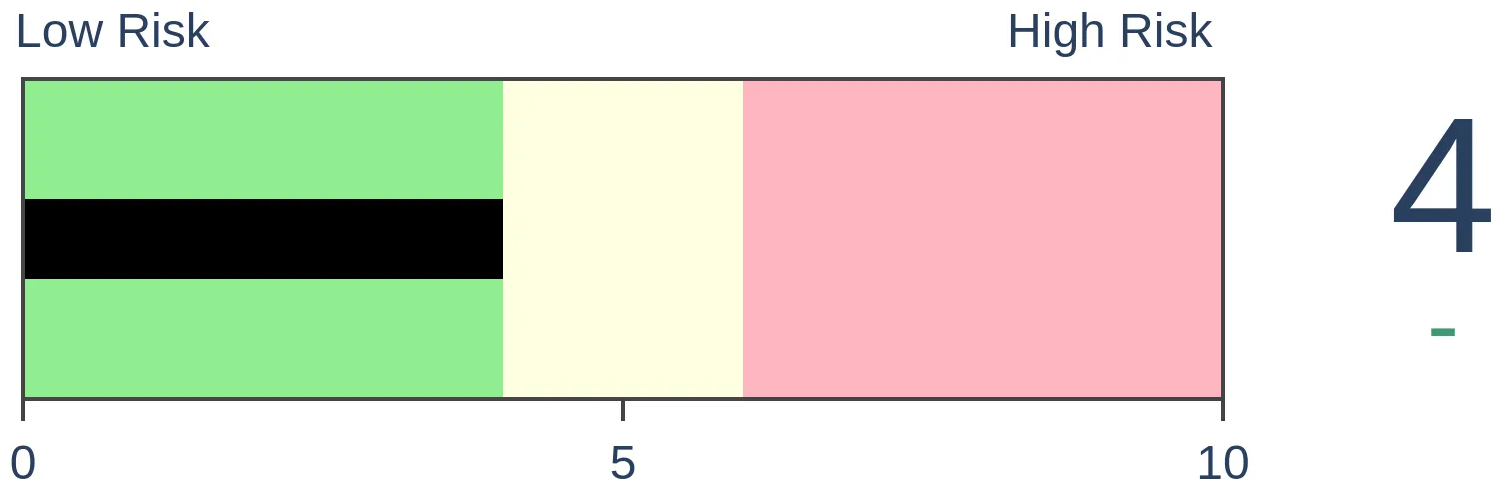
Stocks Medium-Term
|
|
Bonds
|
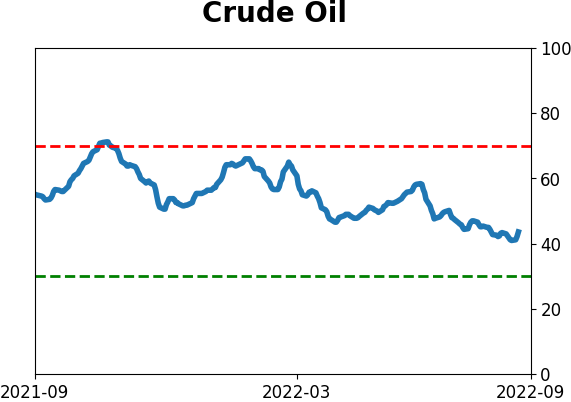
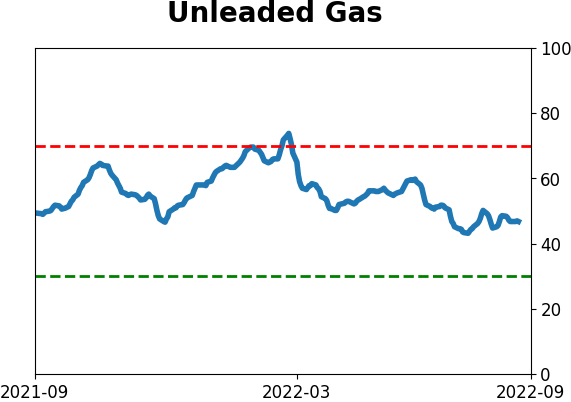
Crude Oil
|
|
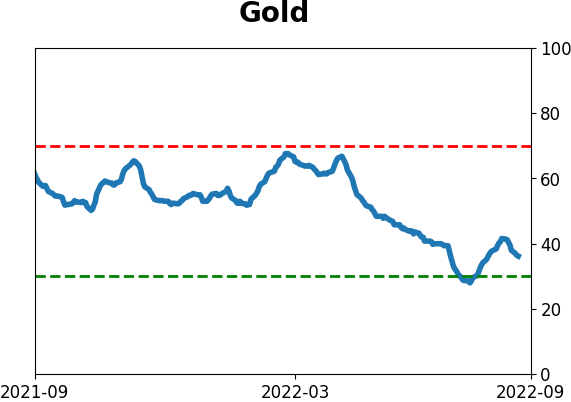
Gold

|
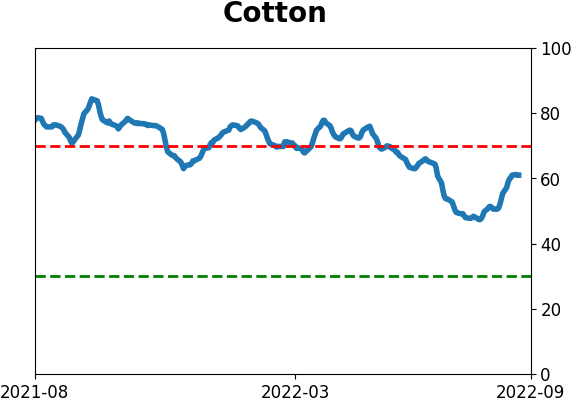
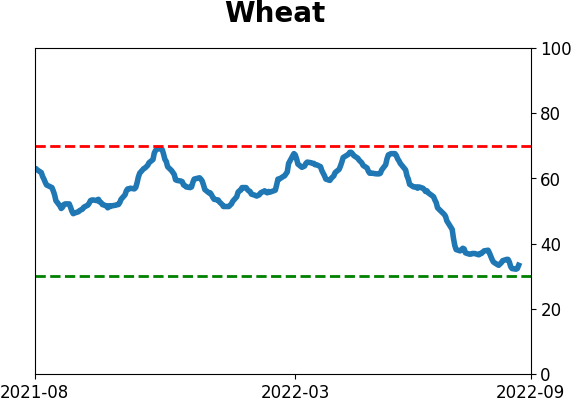
Agriculture

|
|
Research
By Jason Goepfert
BOTTOM LINE
The McClellan Summation Indexes for both the NYSE and Nasdaq exchanges cycled from deep oversold levels to overbought ones. Over the past 36 years, when they've done so in tandem, it has indicated new bull market conditions. The only failure was in 2001, when sellers returned immediately.
FORECAST / TIMEFRAME
None
|
Key points:
- The McClellan Summation Indexes for the NYSE and Nasdaq have cycled from oversold to overbought
- When both indicators do so in tandem, it tends to indicate new bull market conditions
- Over almost 40 years of history, 2001 marked the only failure
The Summation Indexes suggest new bull market conditions
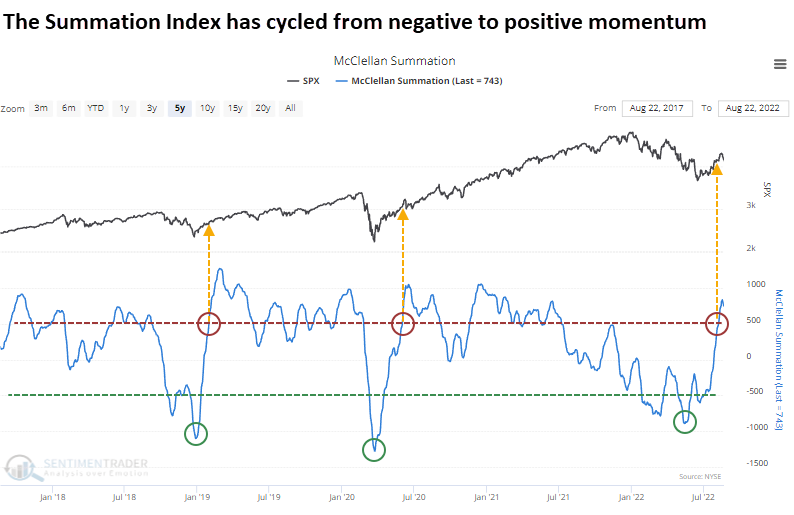
A few weeks ago, we saw that a key to a healthy market environment had turned positive. It continued to improve until the last week.
Once the NYSE McClellan Summation Index crossed the zero line at the end of July, it kept going, exceeding +800 before starting to roll over in recent days. The only other times in the past five years it went through similar cycles were the starts of persistent uptrends.
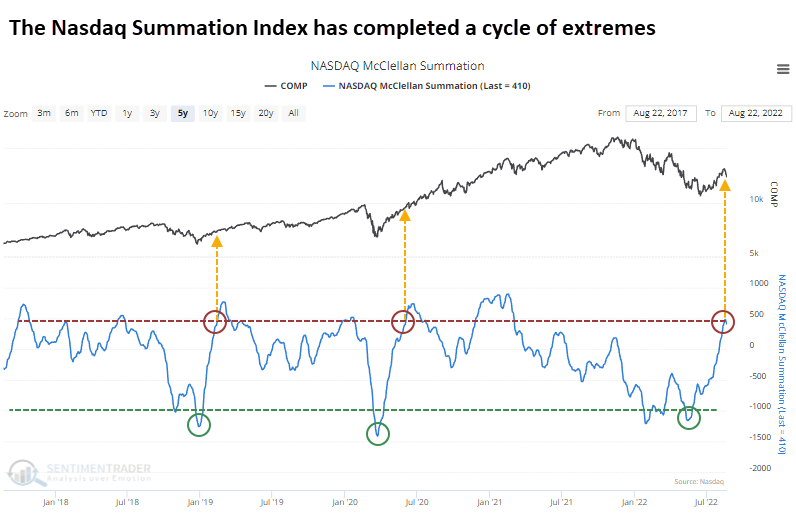
The same thing happened with the Nasdaq McClellan Summation Index. It dropped even further during the decline and didn't rally quite as much, but still built significantly on its positive trend.
Big swings in the broad Summation Indexes ended other bear markets
If we average the two indexes, they cycled from below -1000 to above +650. Since our Nasdaq data began in 1986, this has happened seven other times, shown in the table below.
All but one were the beginning of new bull markets. That sole exception, in 2001, is a bugger since it's a time period that has many similarities to our current environment.
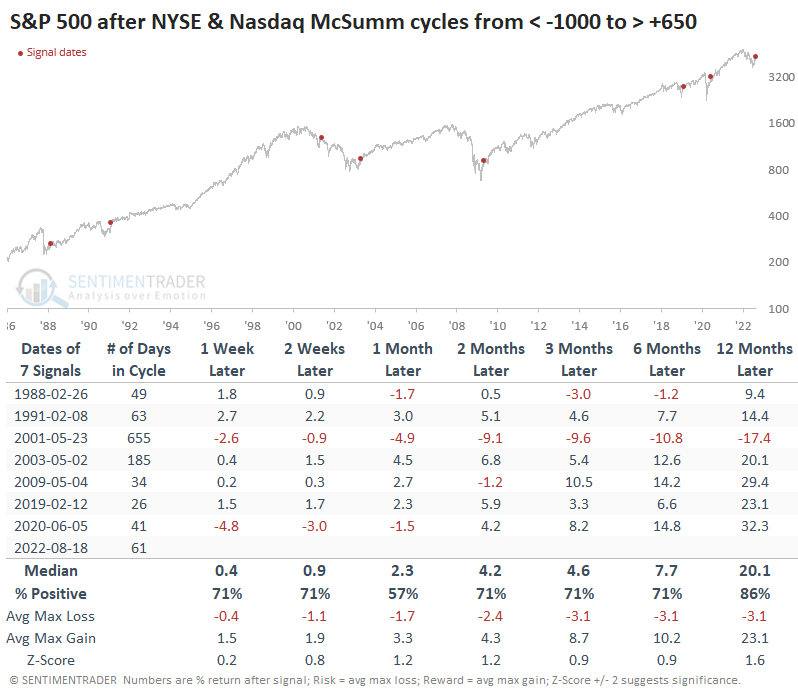
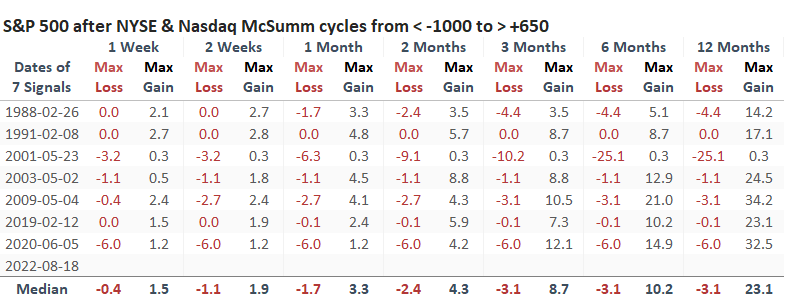
If we look at the maximum losses and maximum gains across time frames after these signals, 2001 is one of the few that saw eager selling pressure immediately afterward. That happened after the rally in 2020, too, and that one went on to spectacular gains. So, it wasn't a perfect indicator, but it jibes with some other studies we've looked at in recent weeks.
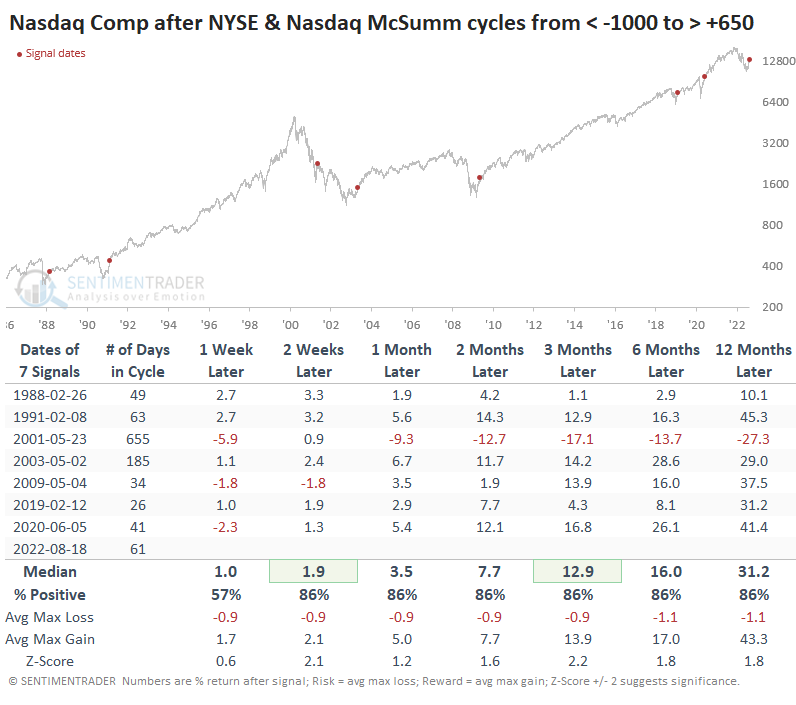
Returns in the Nasdaq Composite after these signals were even more impressive. On average, the Nasdaq enjoyed more significant average gains, lesser losses, and bigger maximum gains across every time frame.
What the research tells us...
If buyers have no interest in pursuing overbought conditions, it's more likely we're still stuck in a bear market. So far, the evidence is mixed because several indicators reached overbought weeks ago, and stocks still managed to rise. Some backing-and-filling after four weeks of gains is not unusual, so bears seem premature in declaring victory because there have been a few days of selling pressure.
Indicators at Extremes
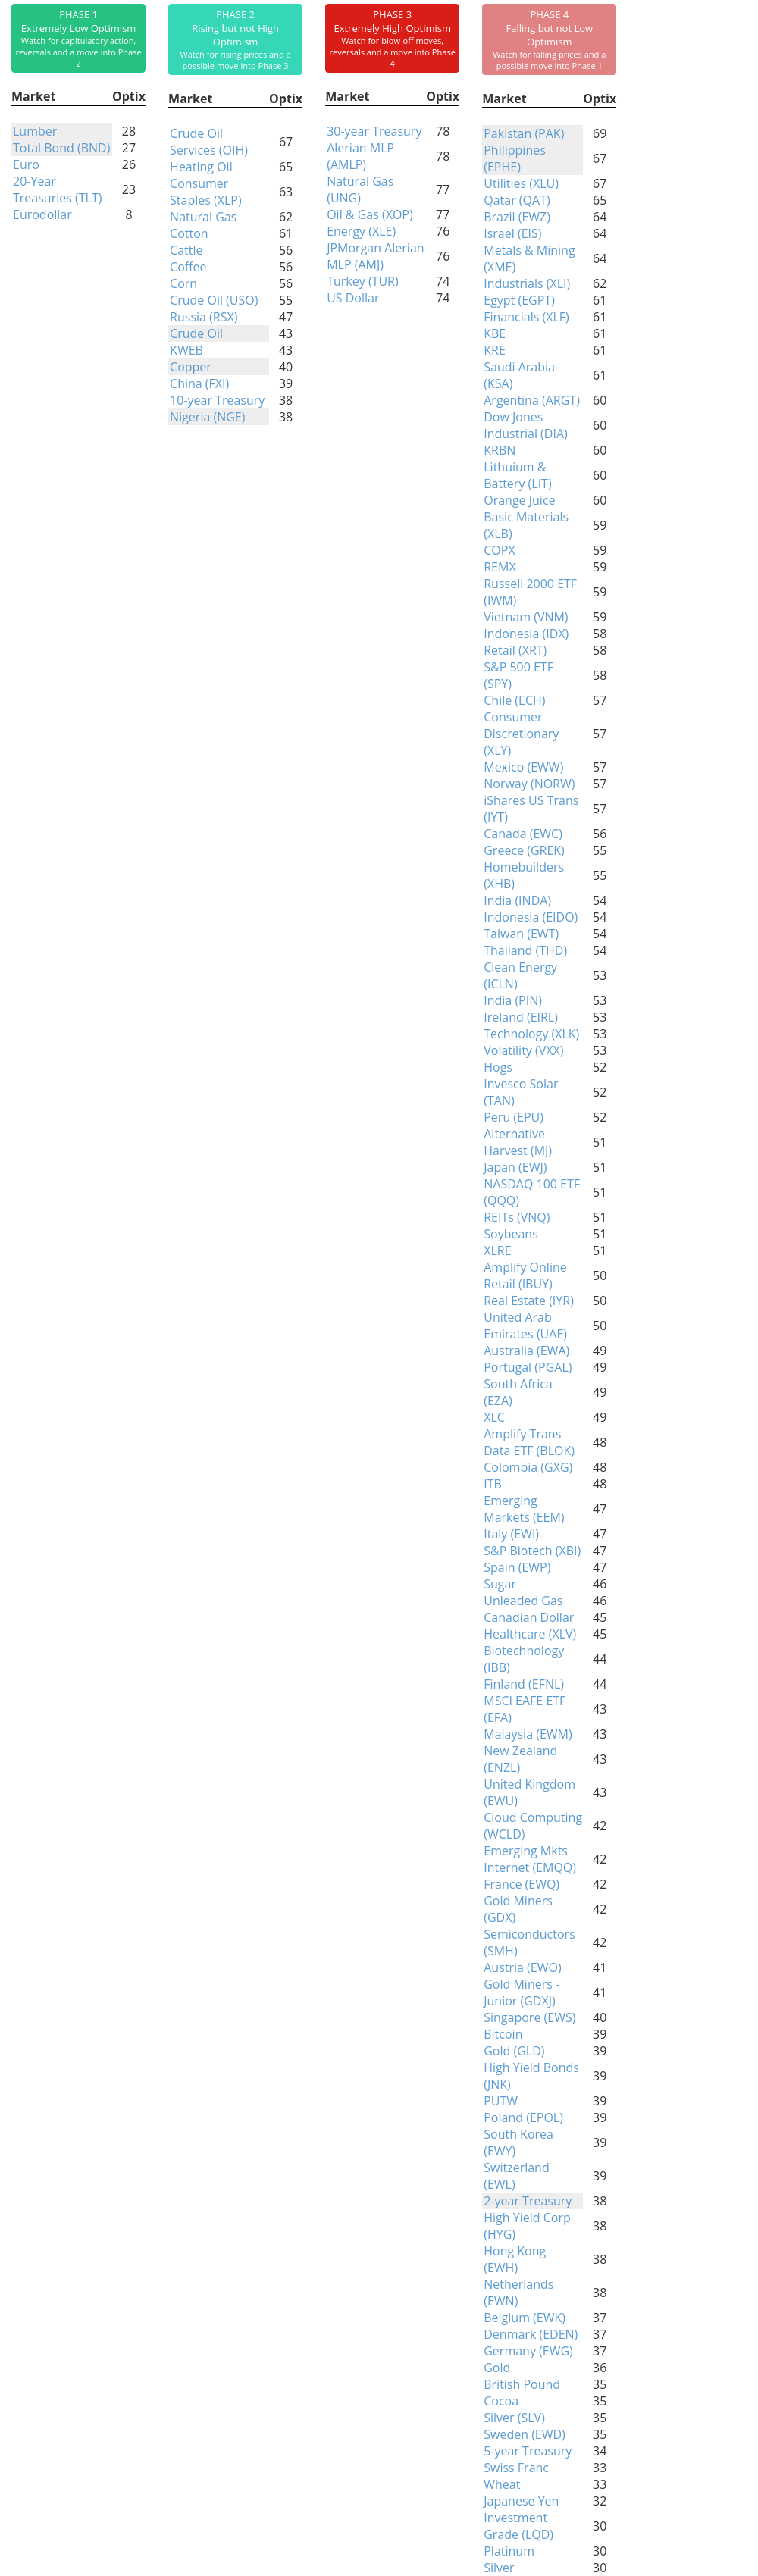
Phase Table
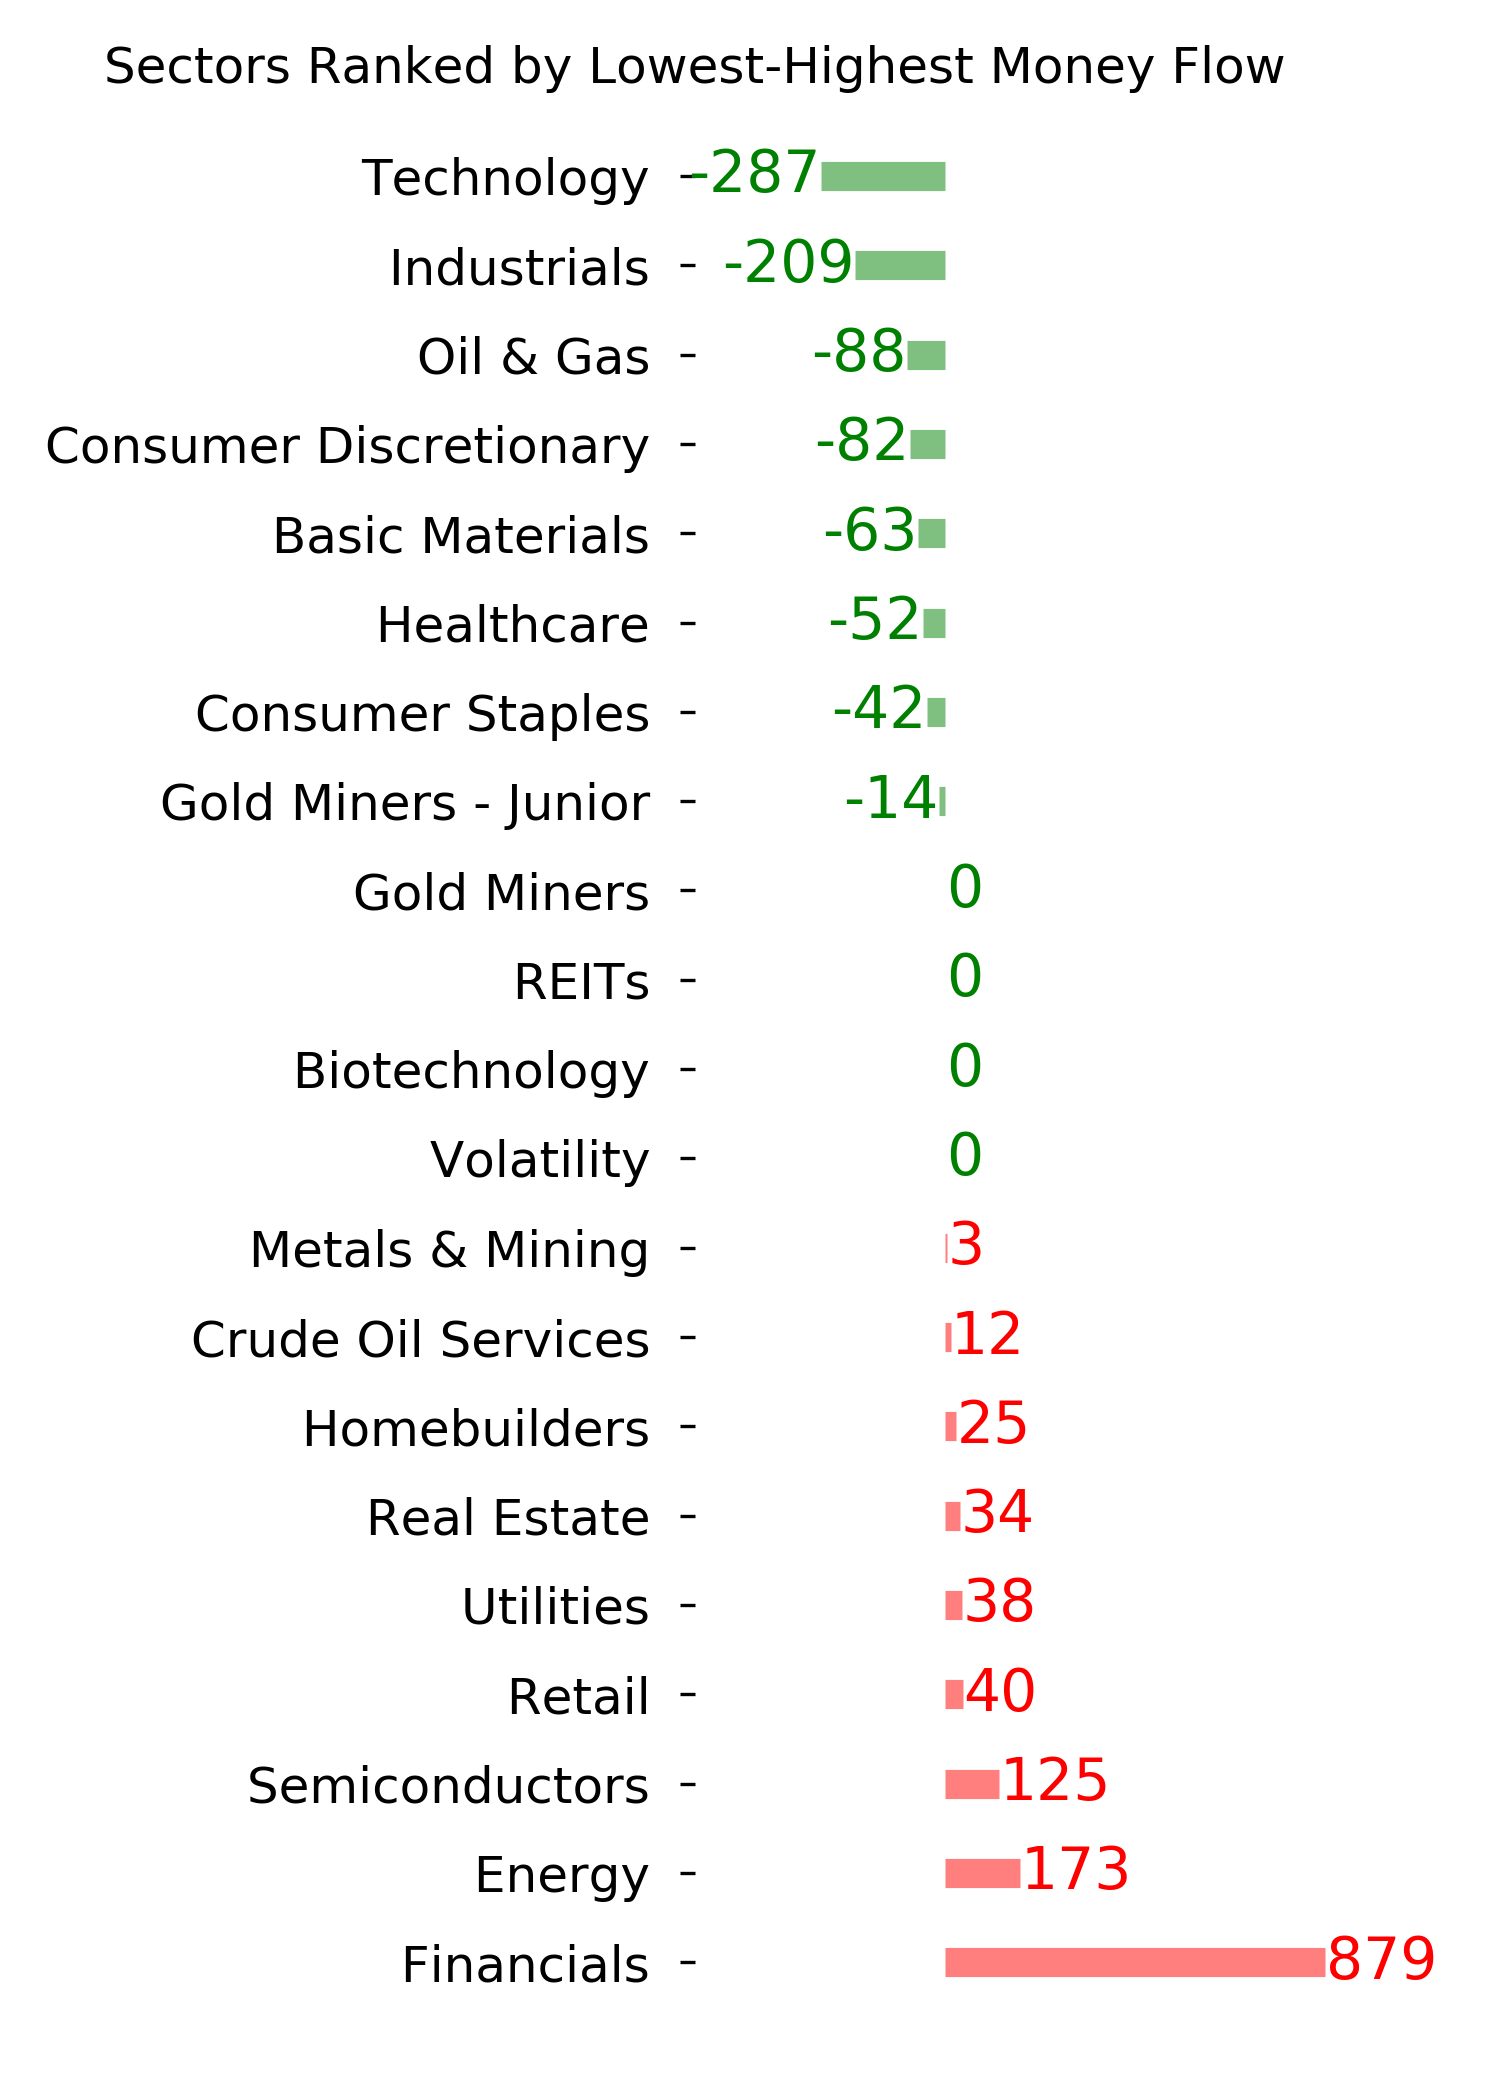
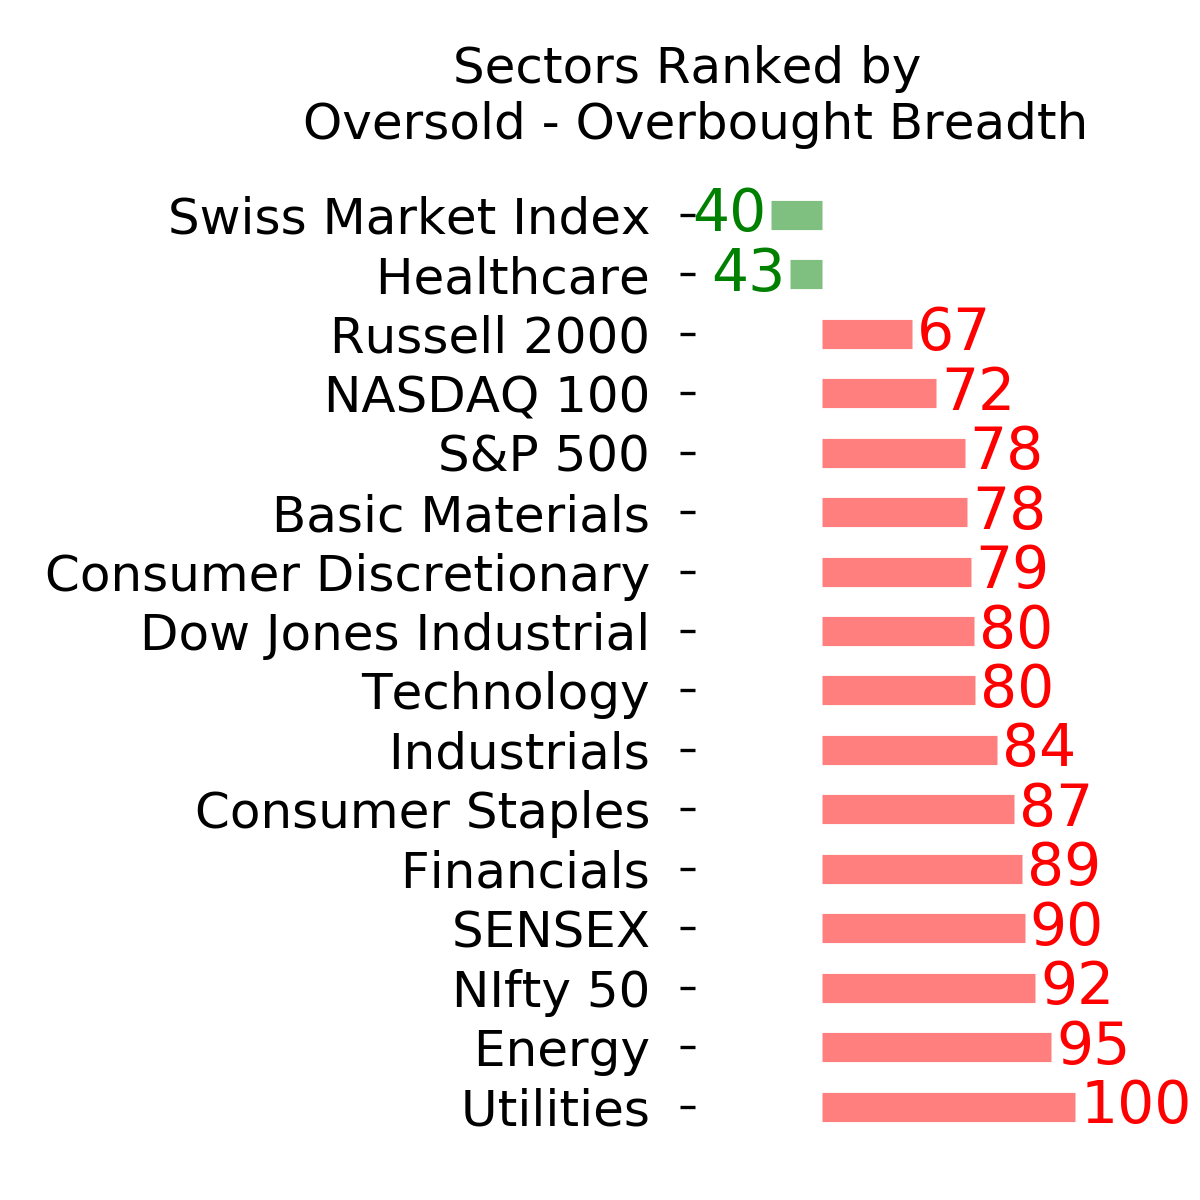
Ranks
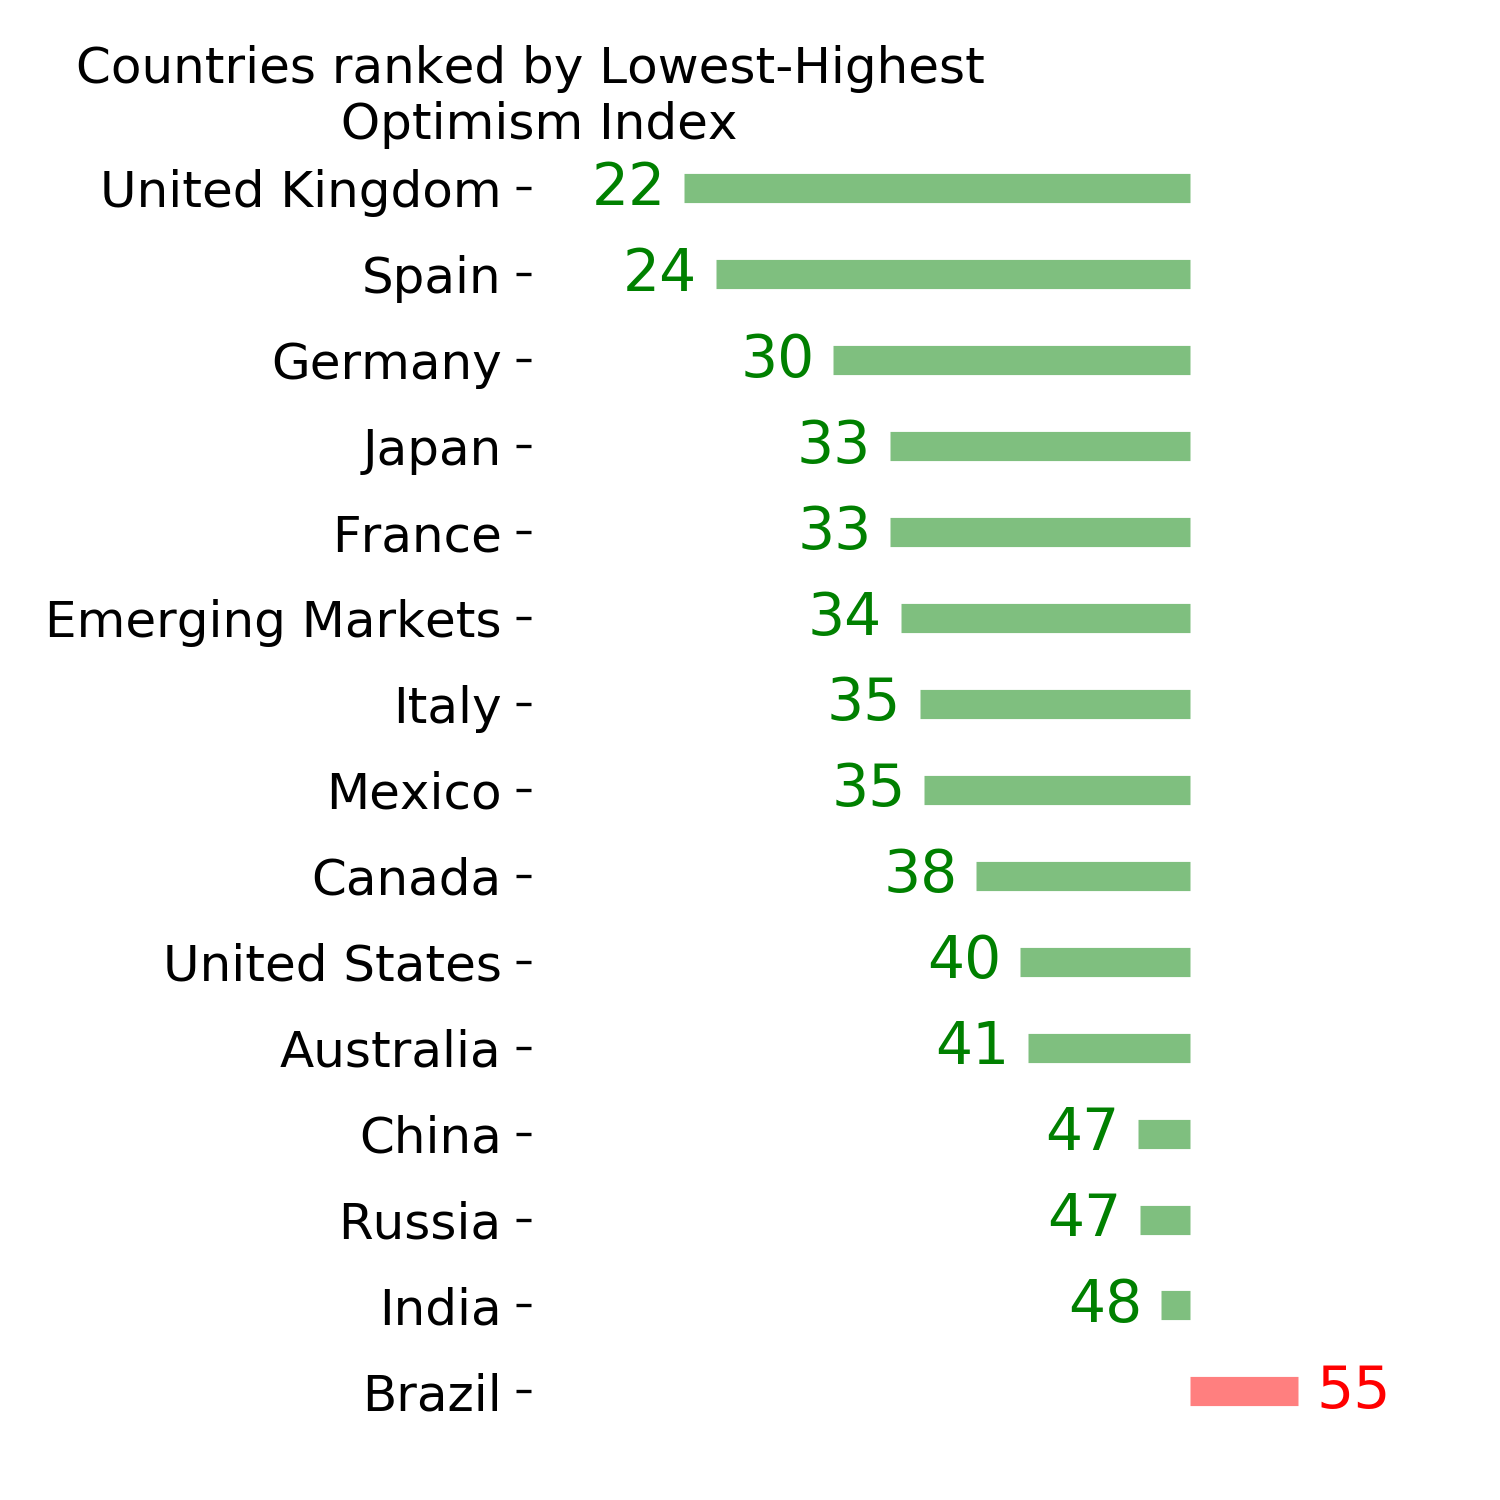
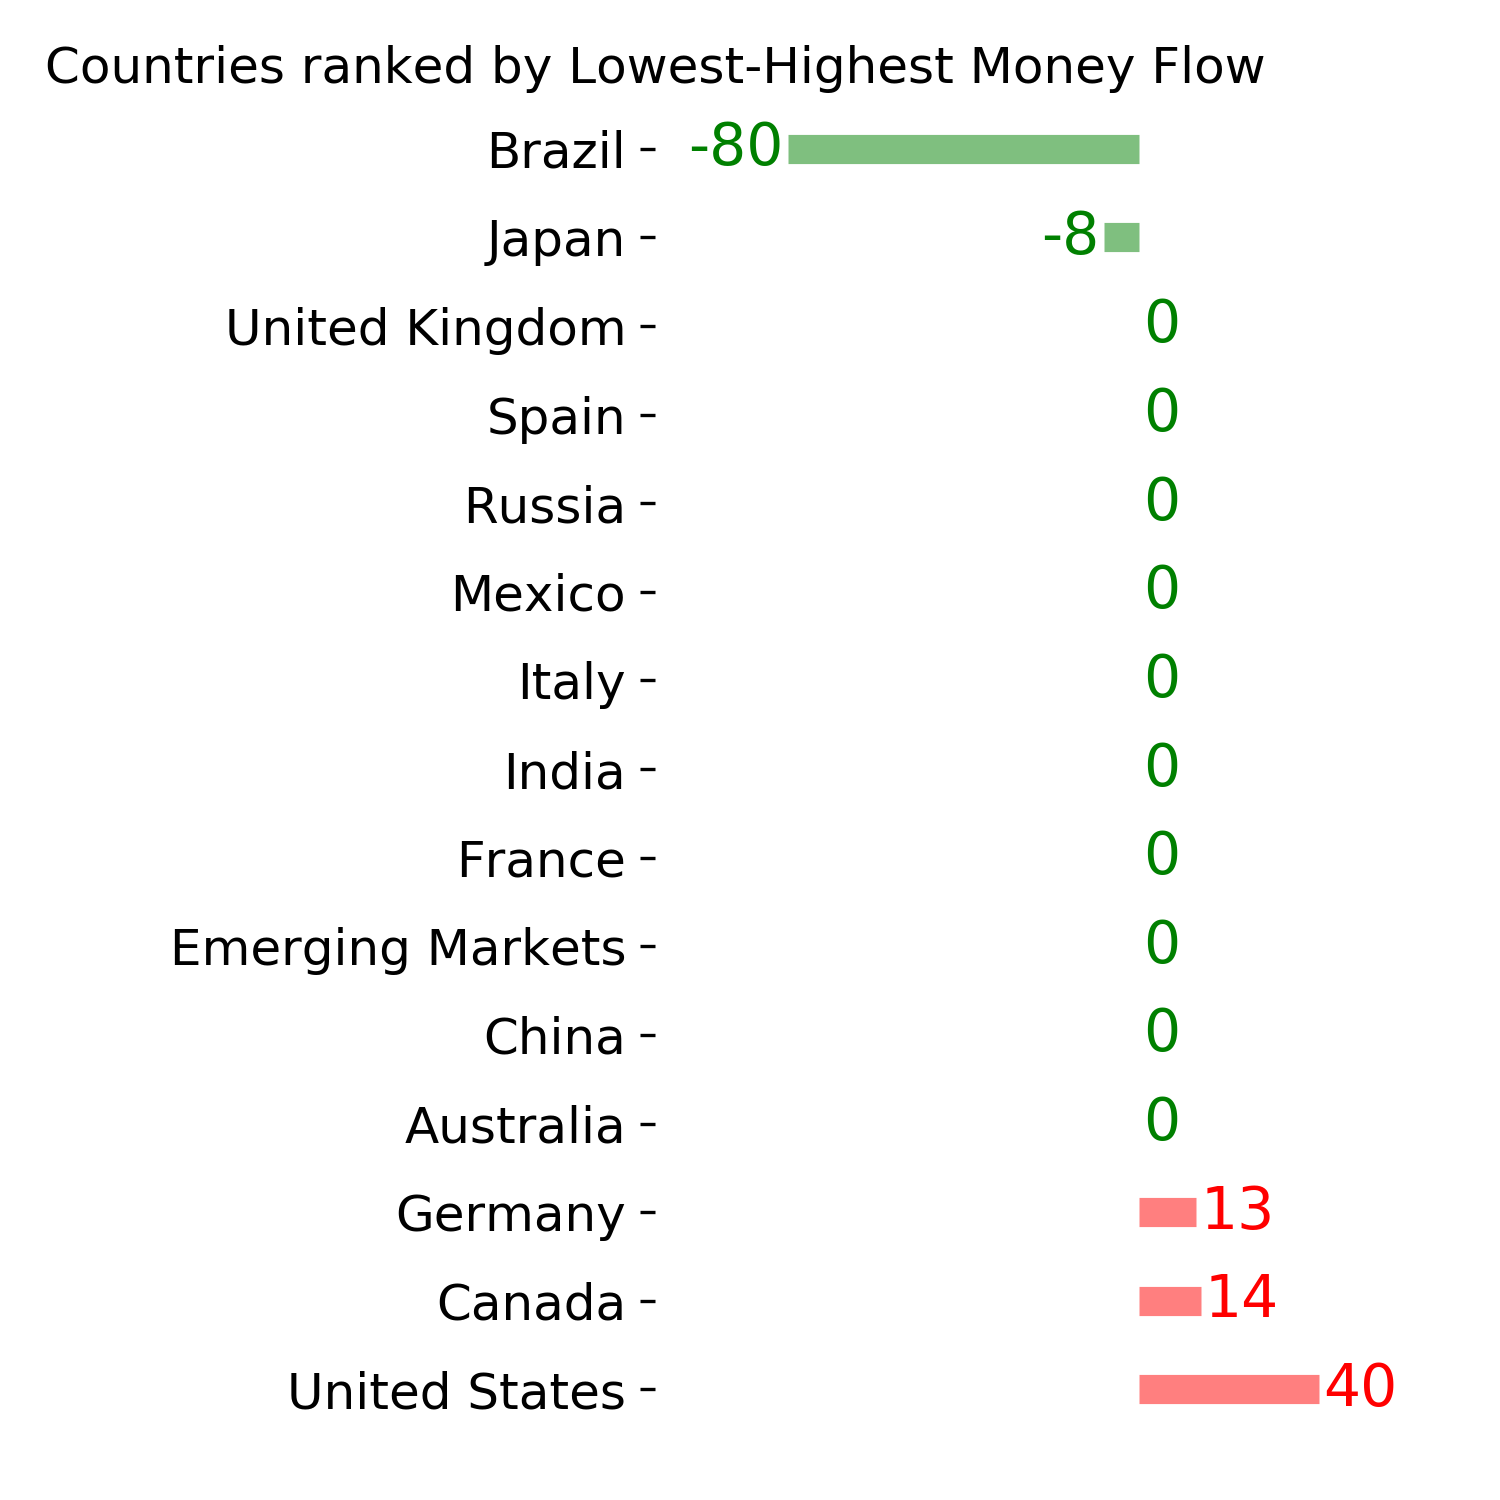
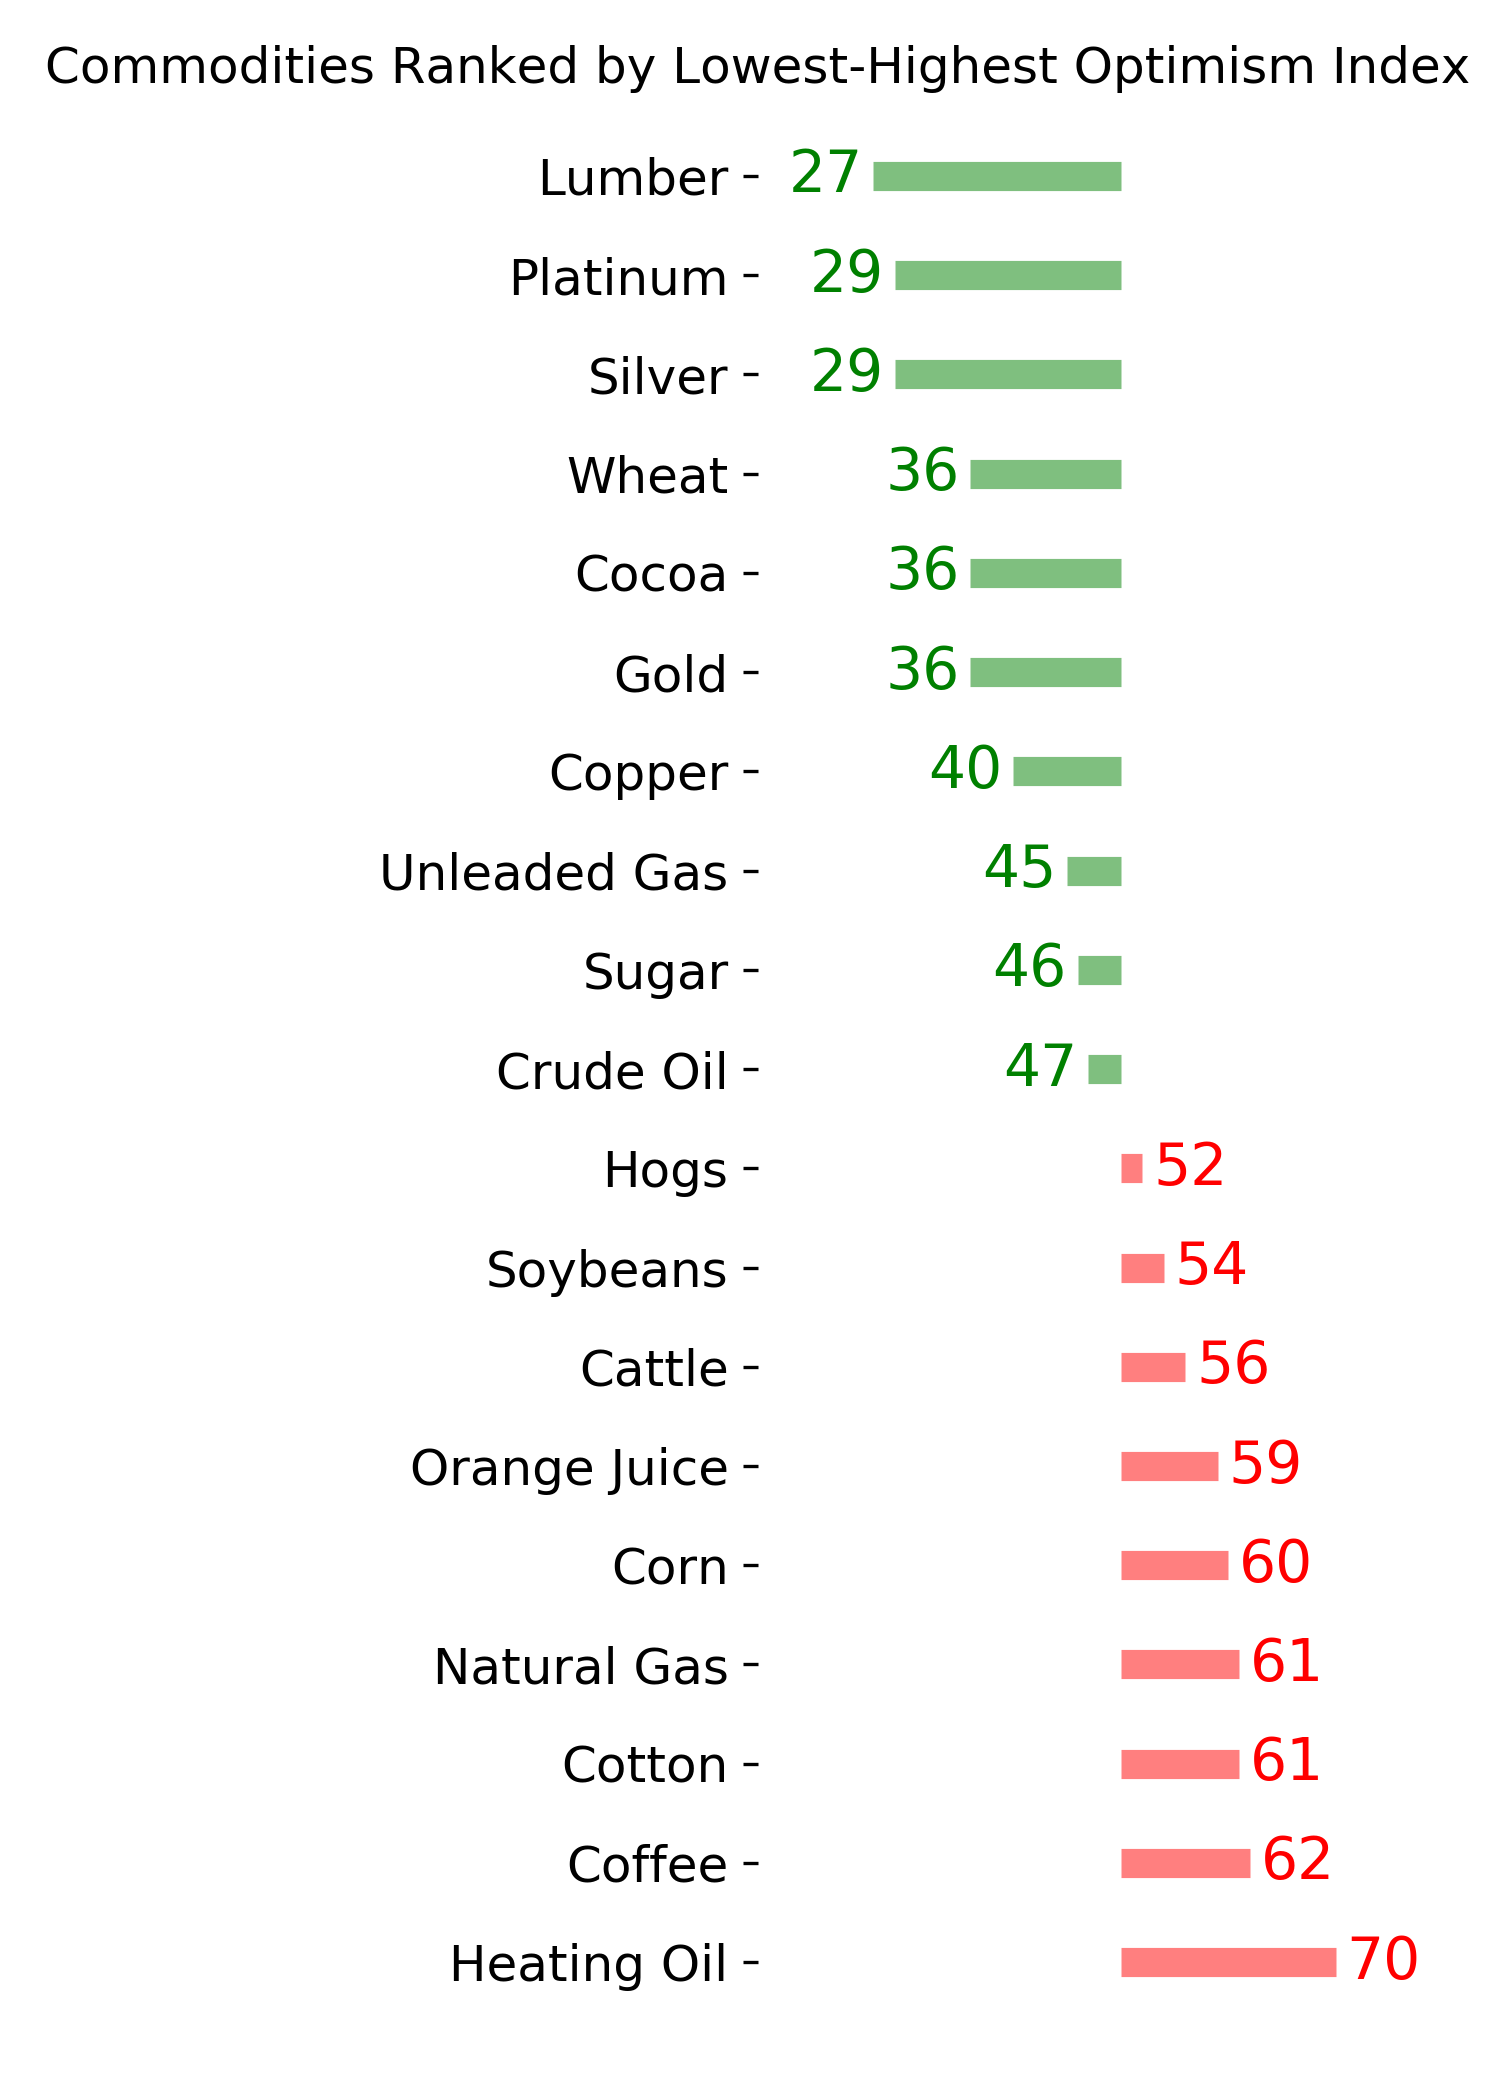
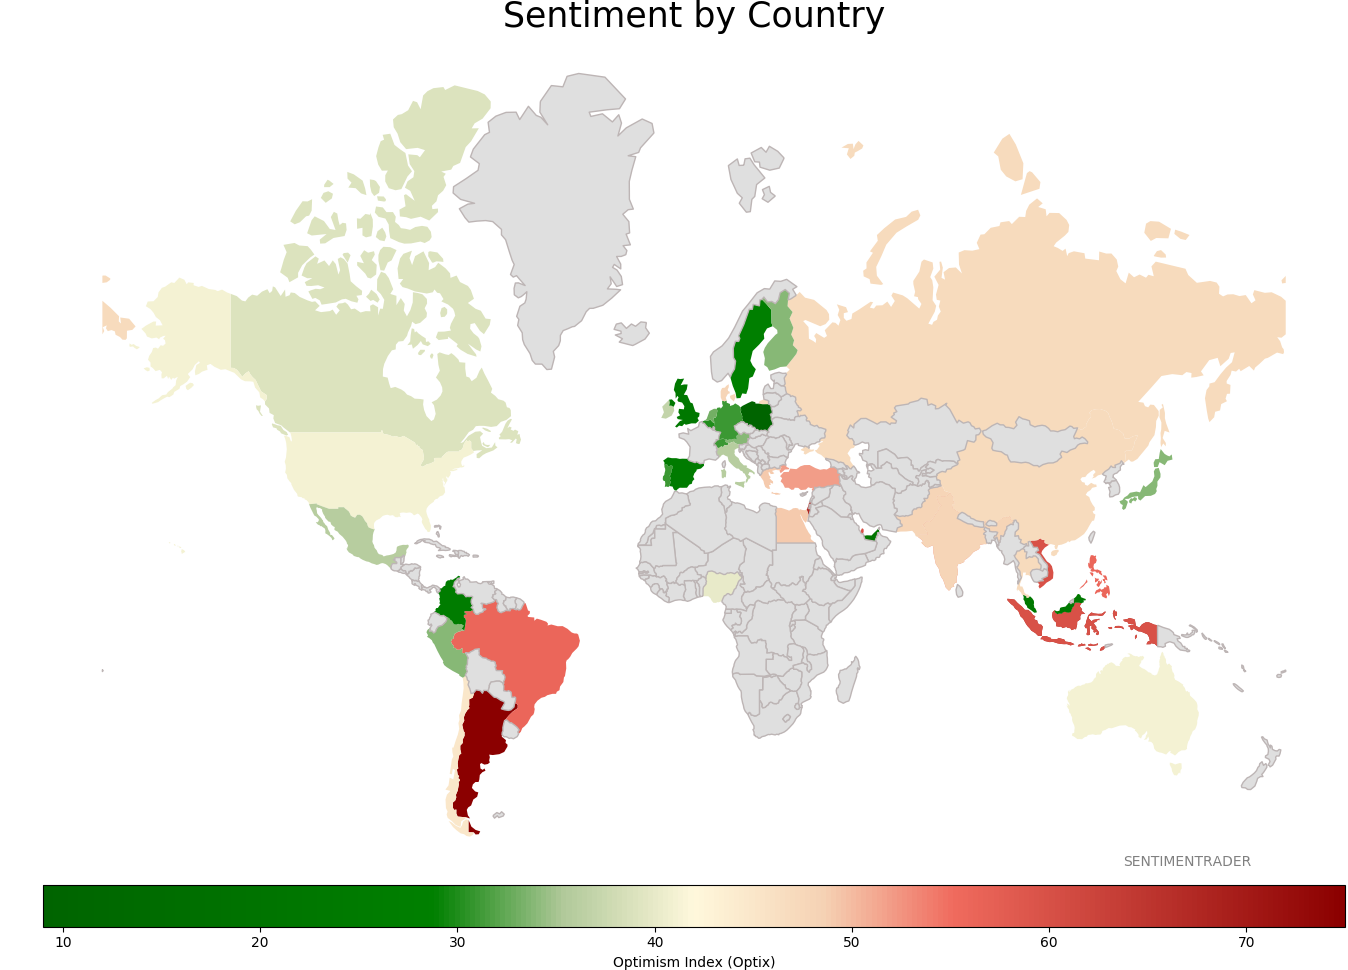
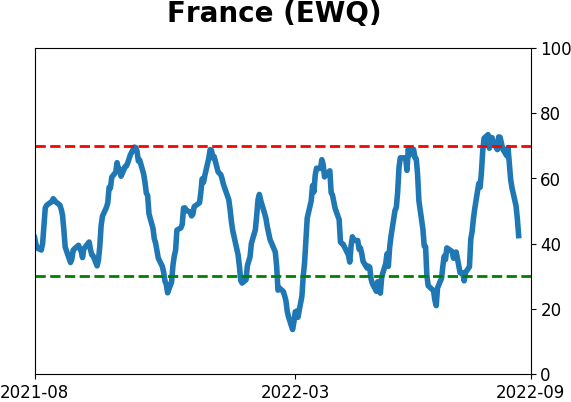
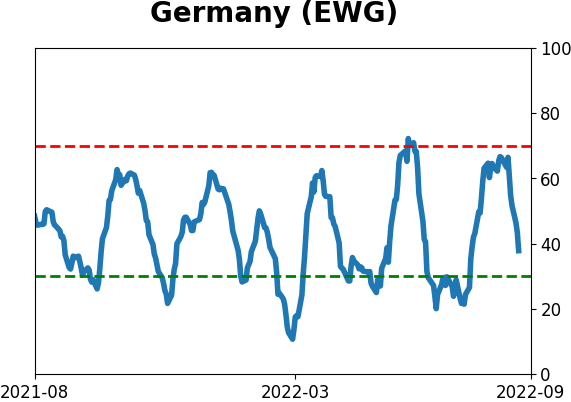
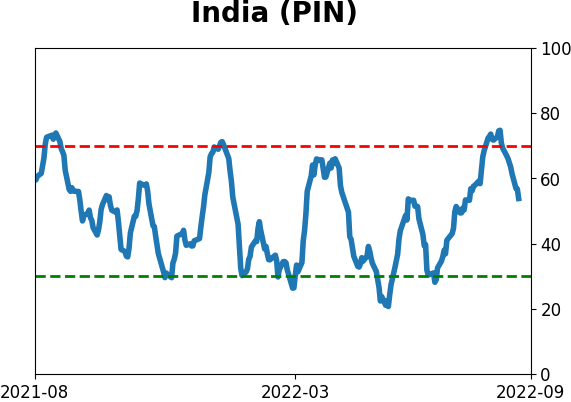
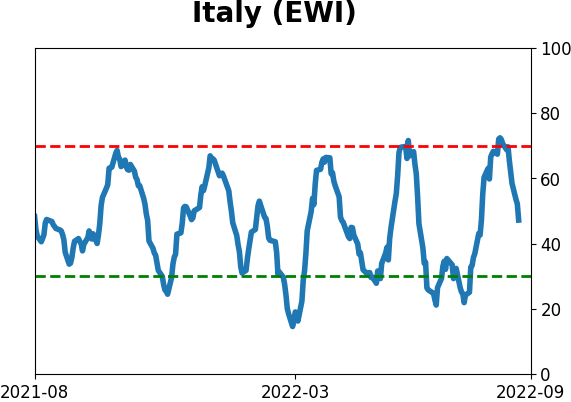
Sentiment Around The World
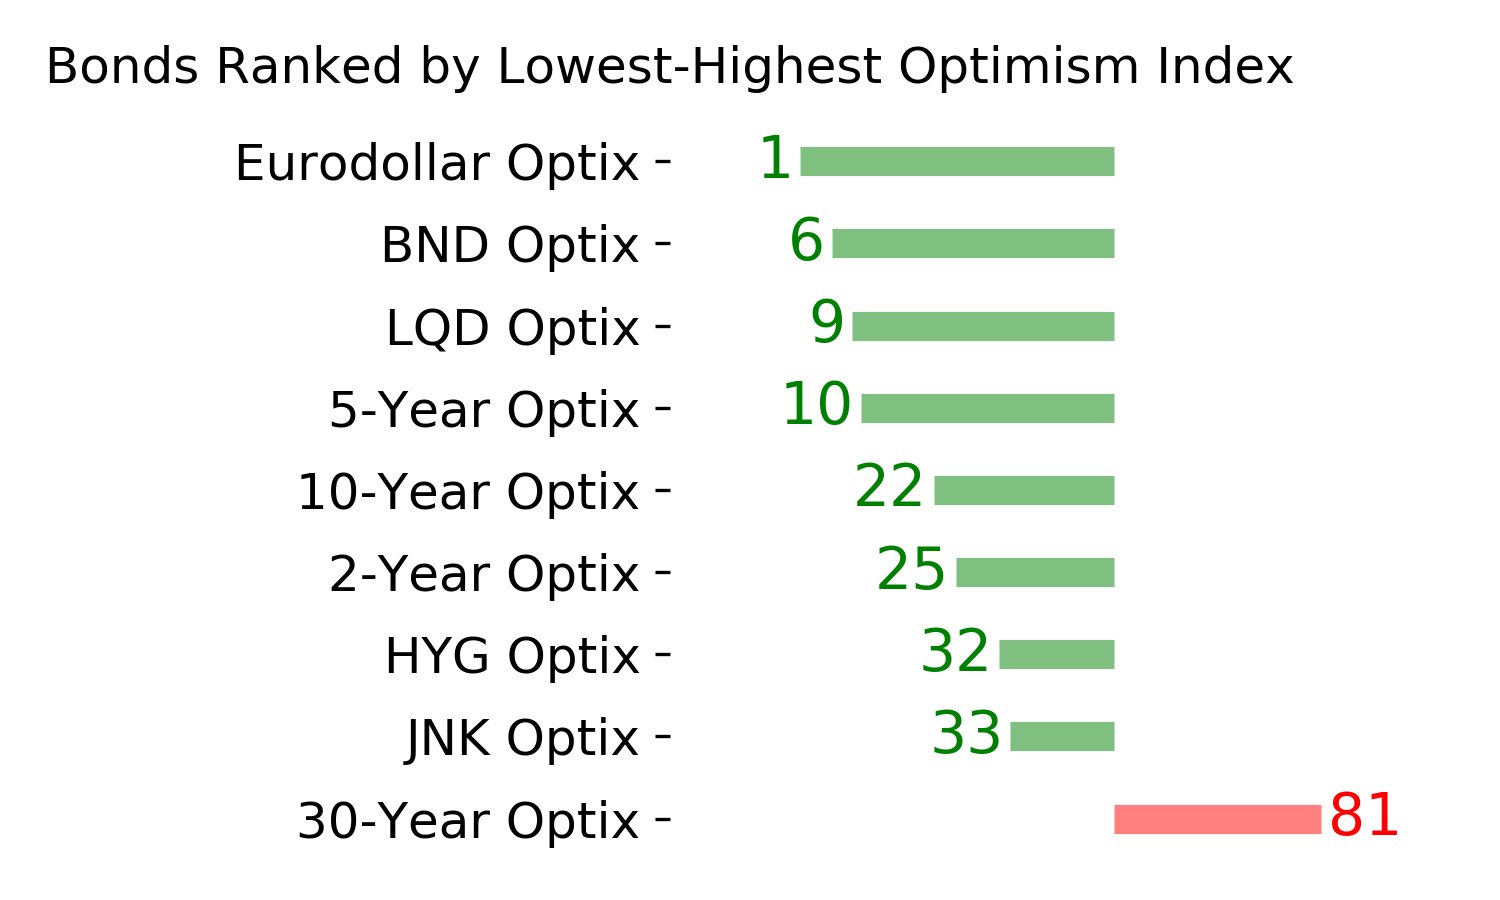
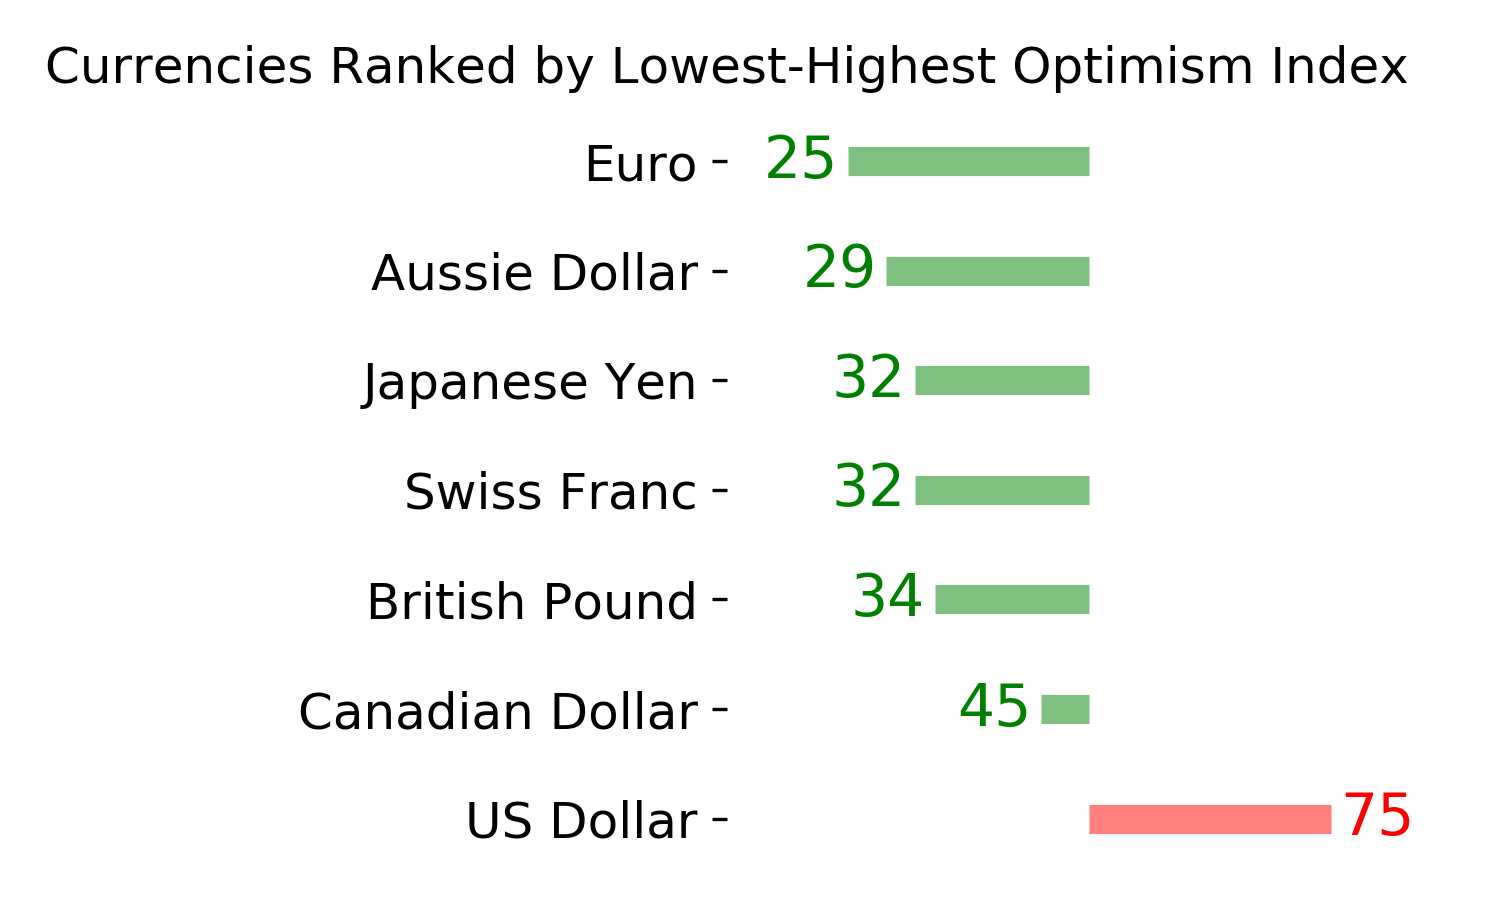
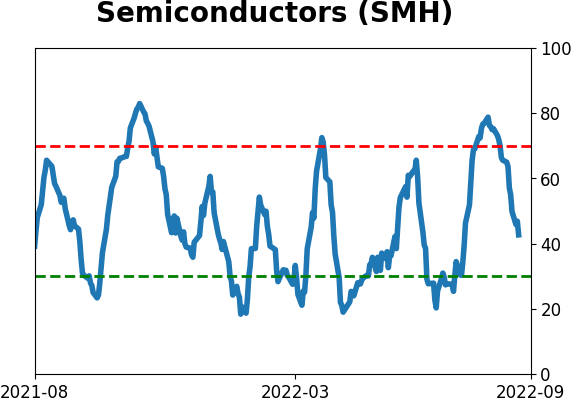
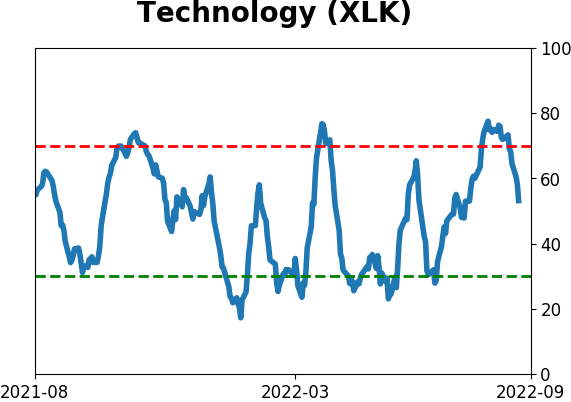
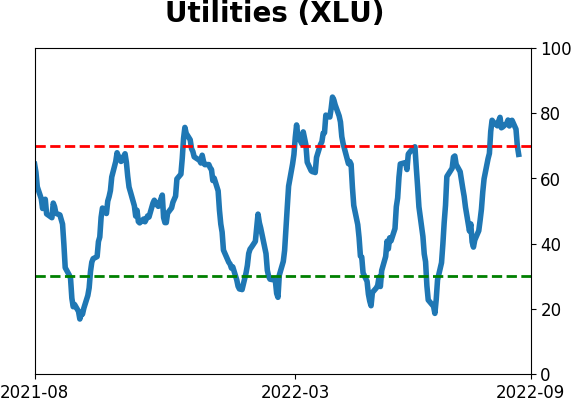
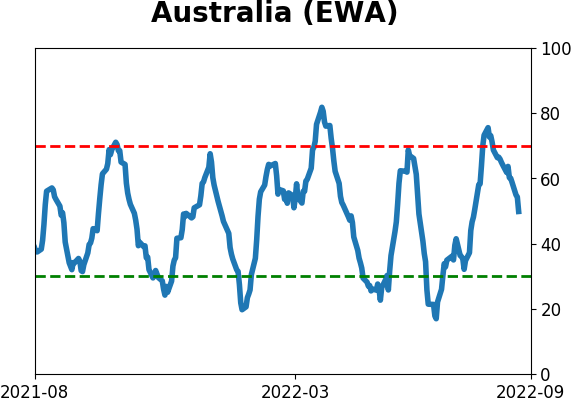
Optimism Index Thumbnails
|
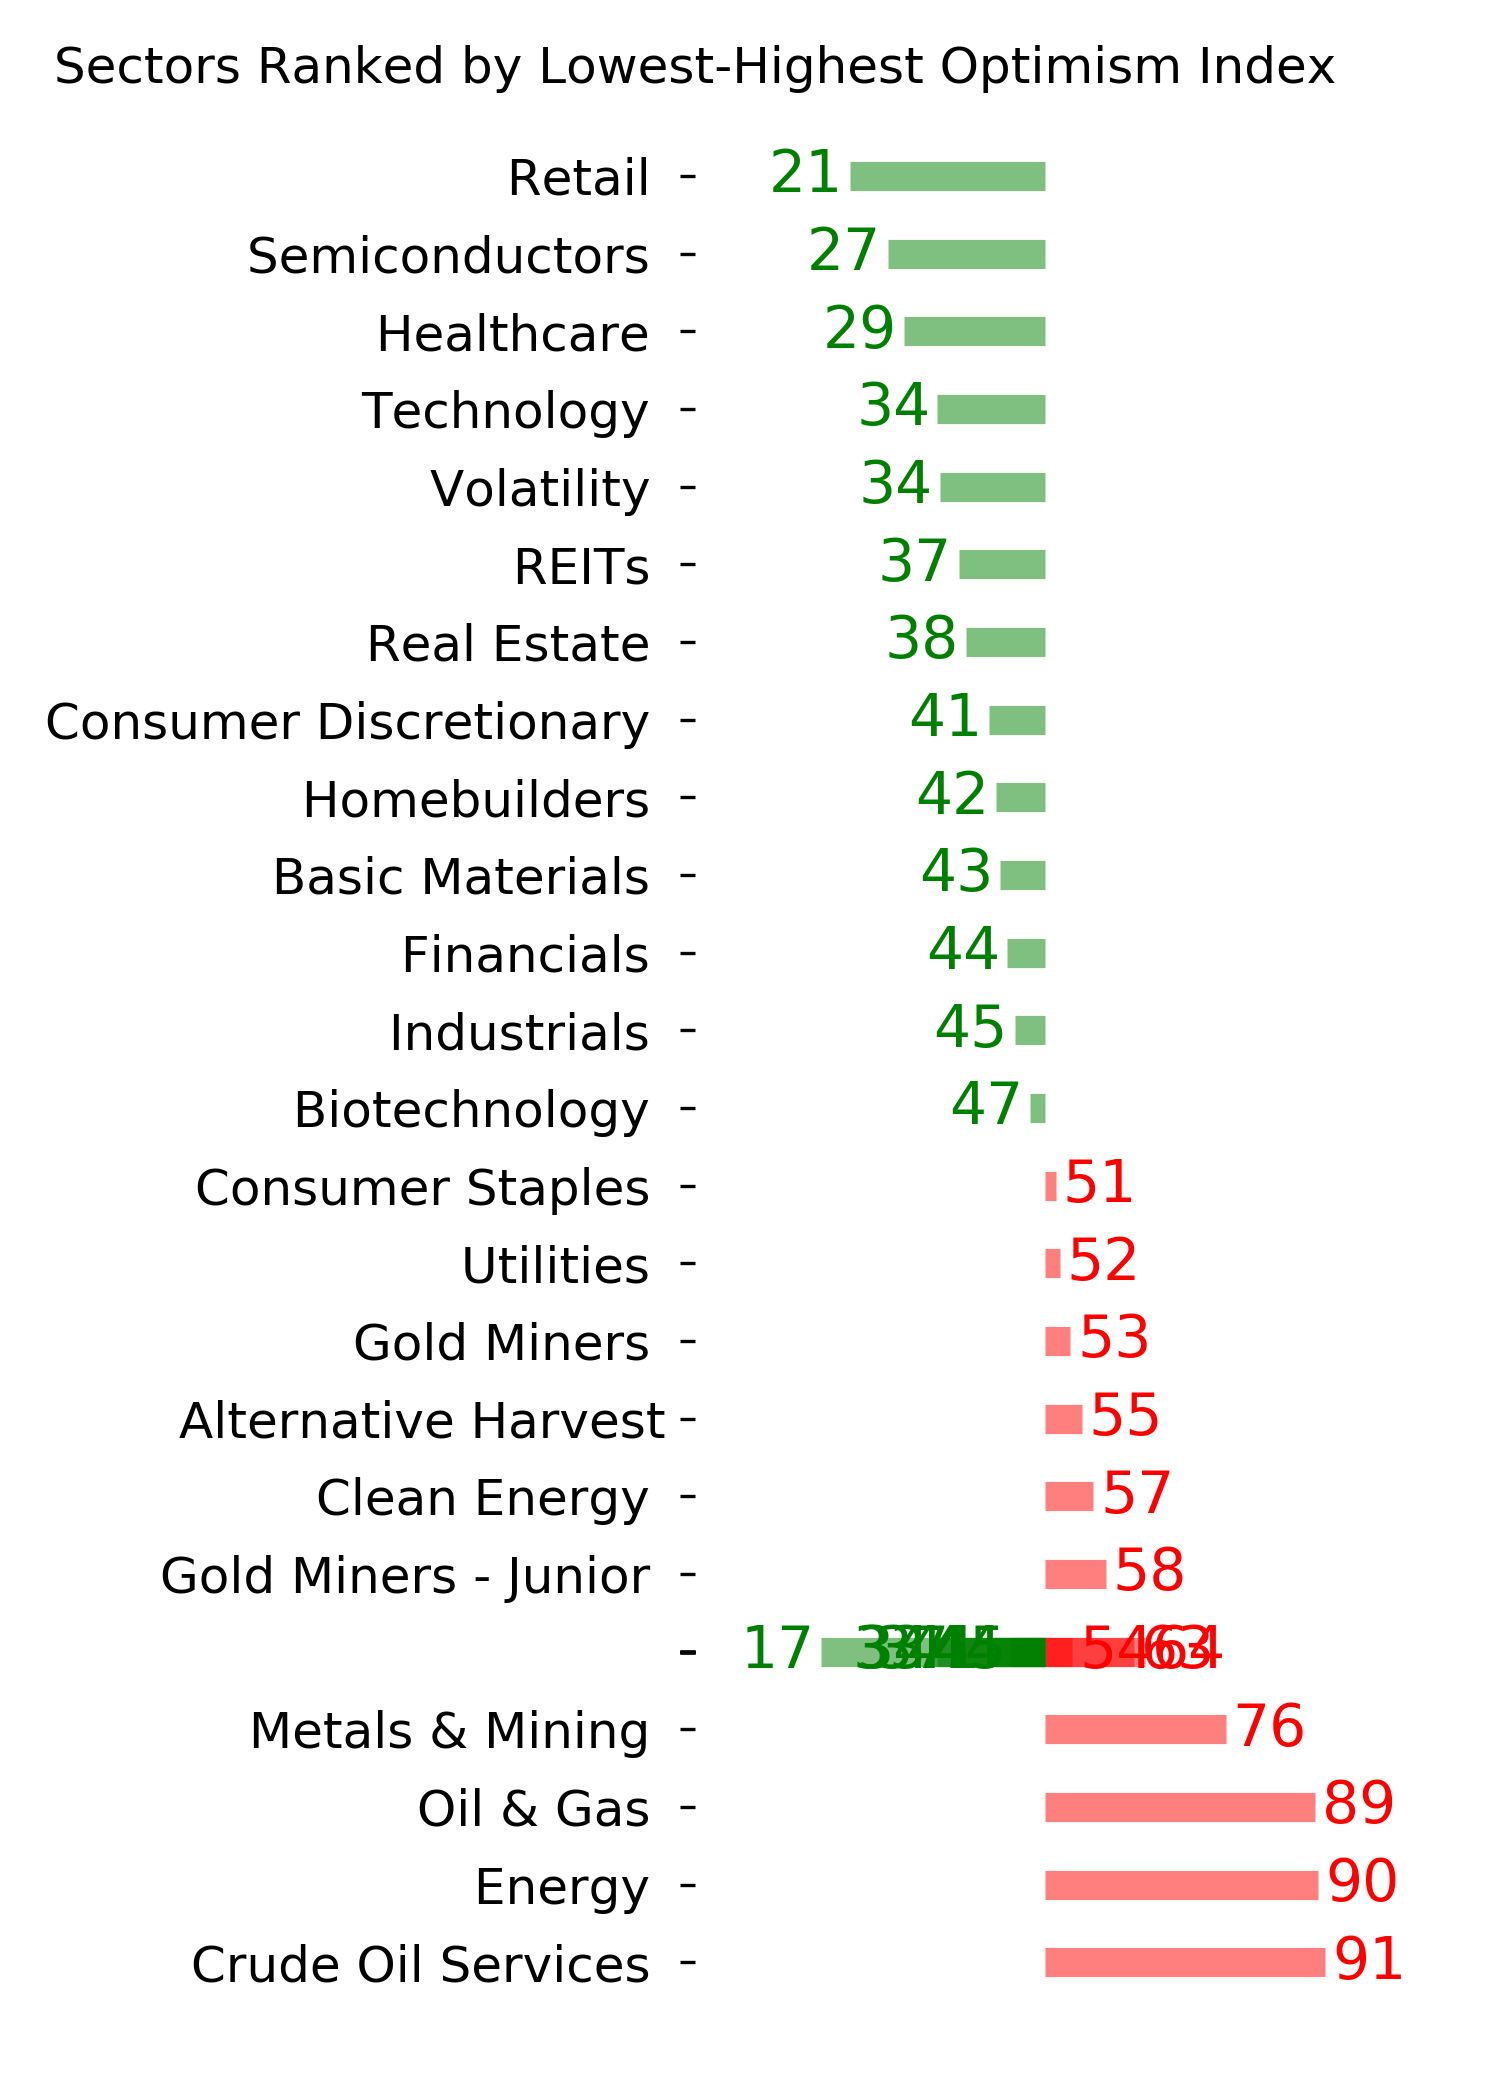
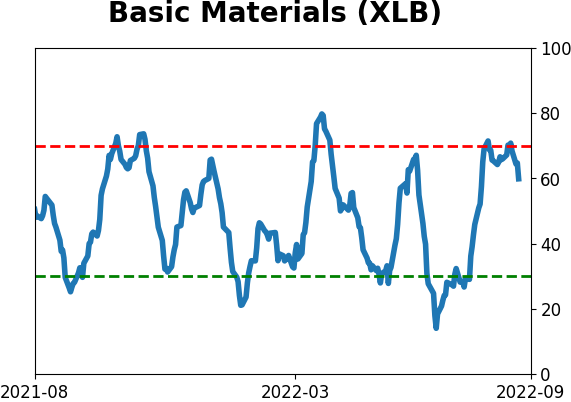
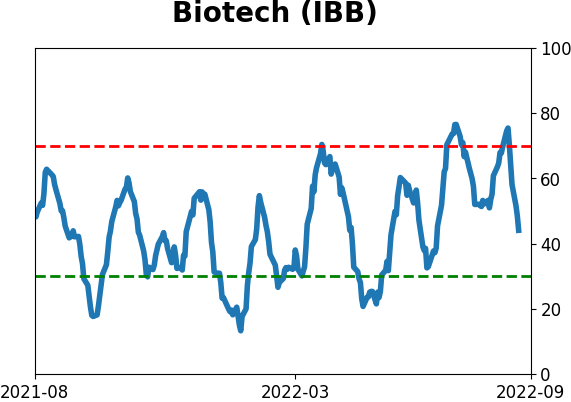
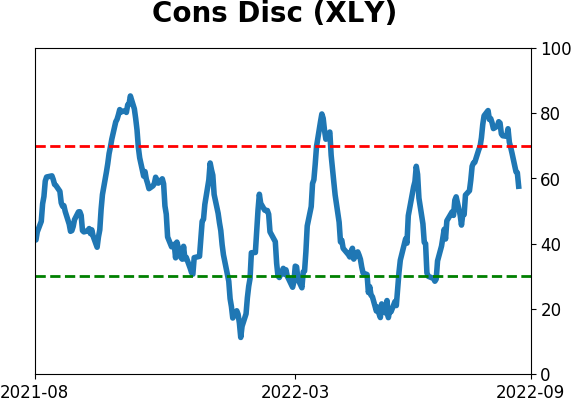
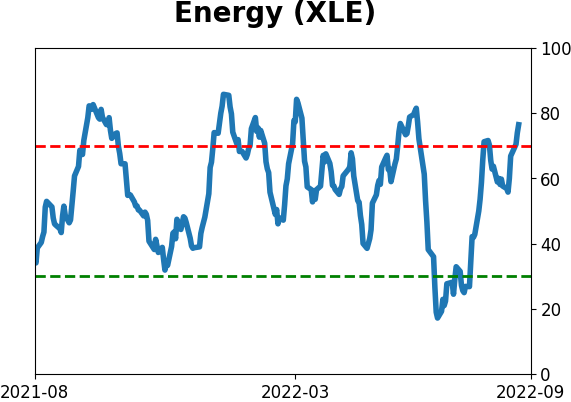
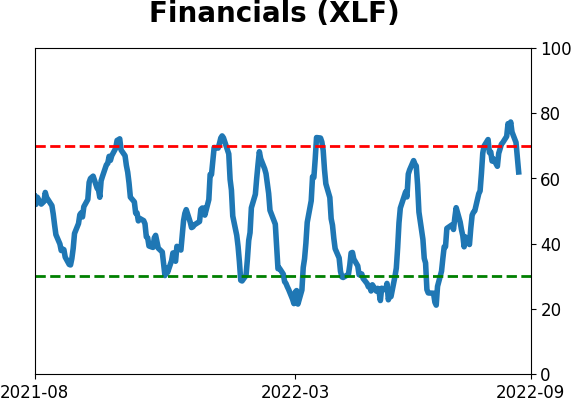
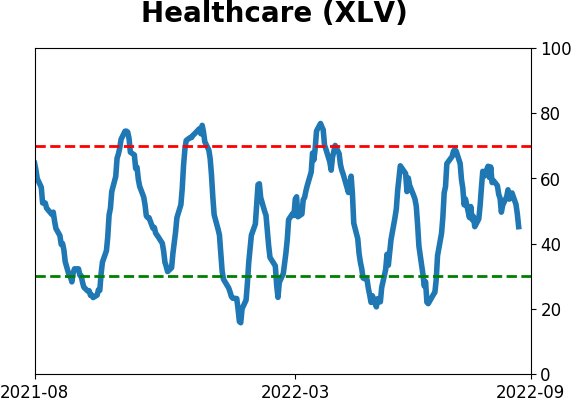
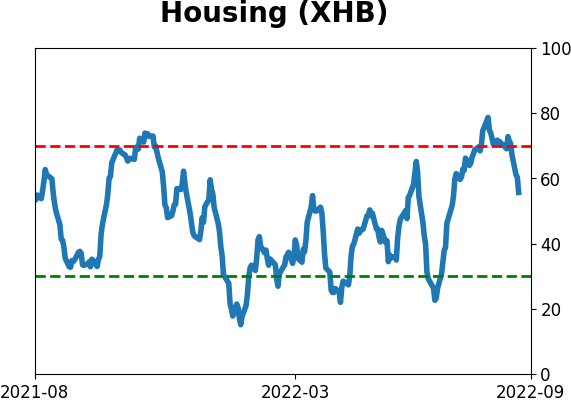
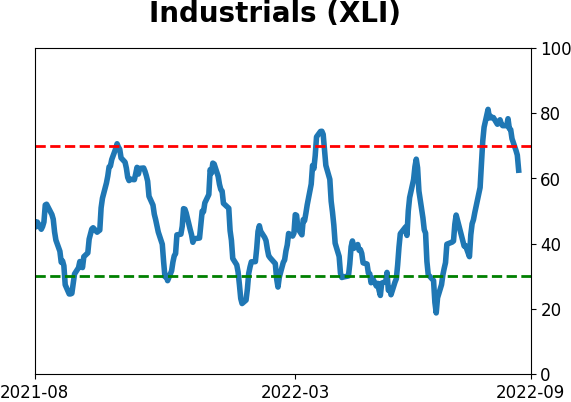
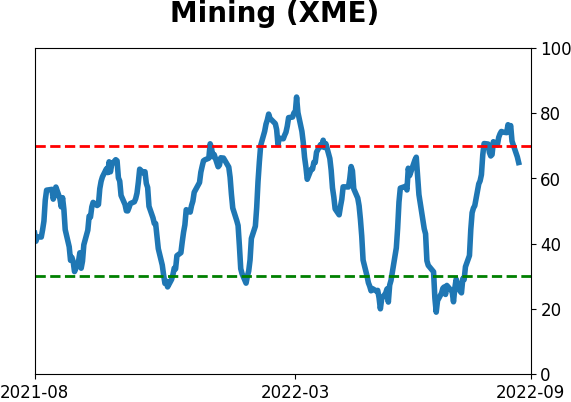
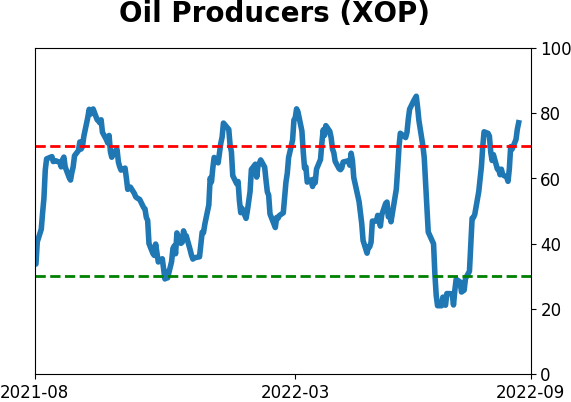
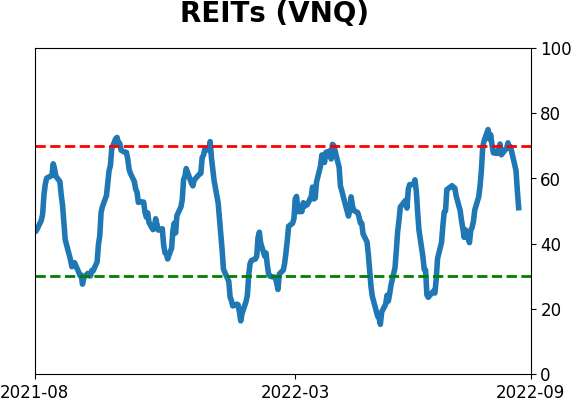
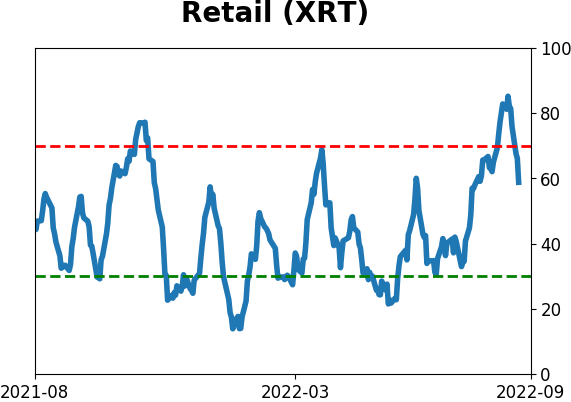
Sector ETF's - 10-Day Moving Average
|
|
|
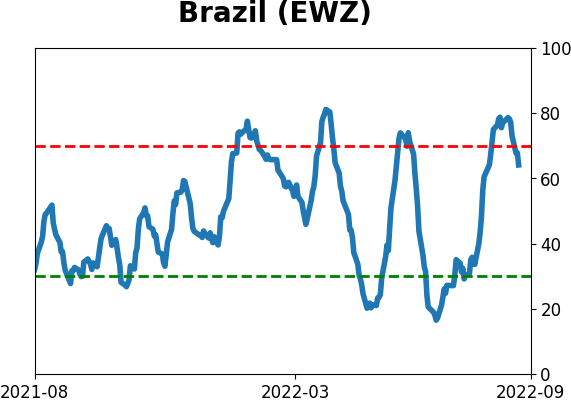
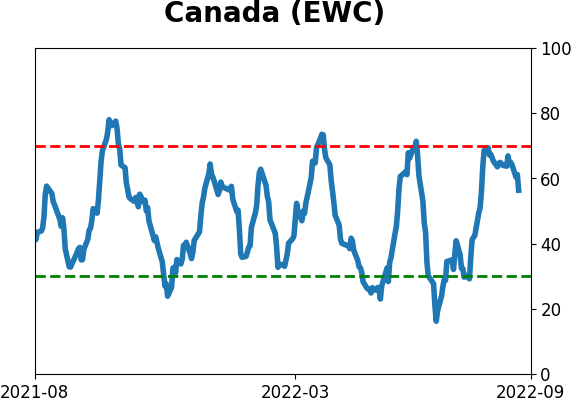
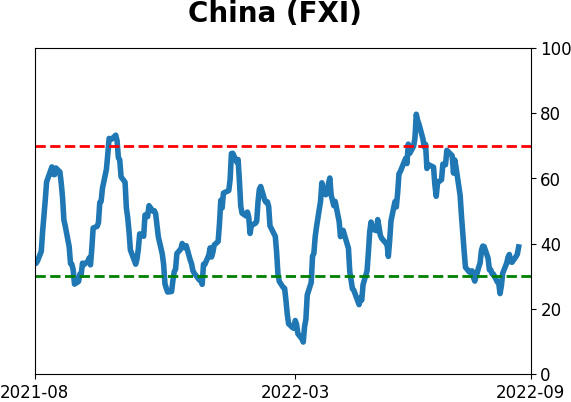
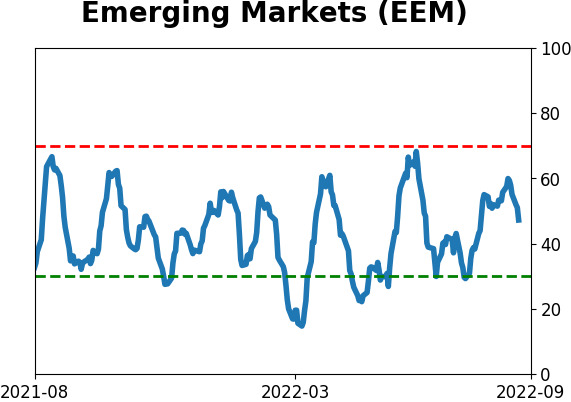
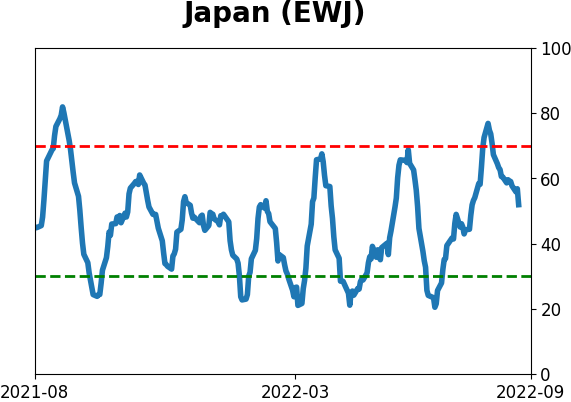
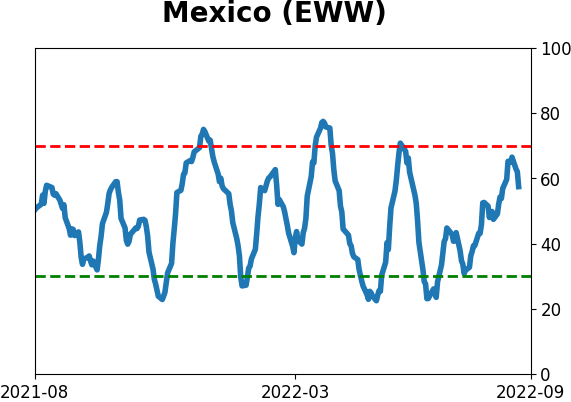
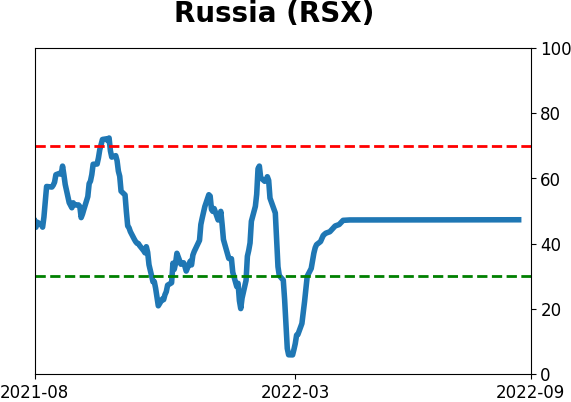
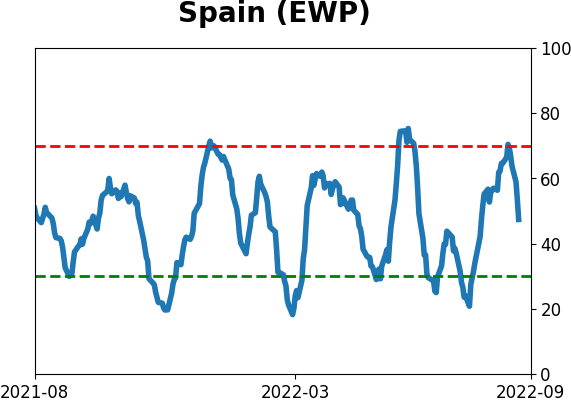
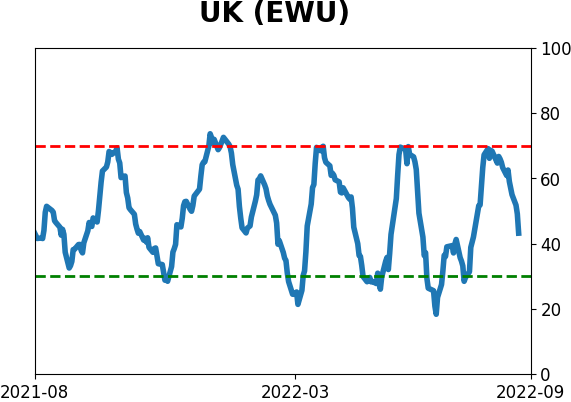
Country ETF's - 10-Day Moving Average
|
|
|
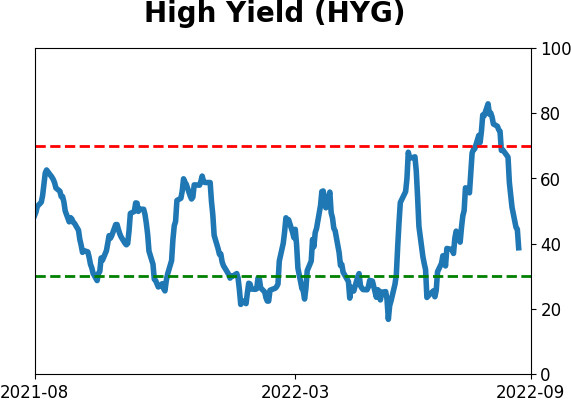
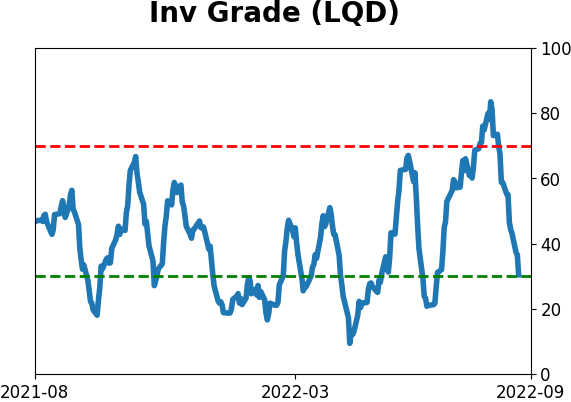
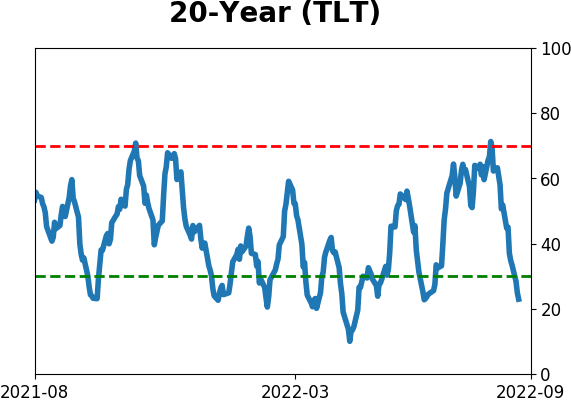
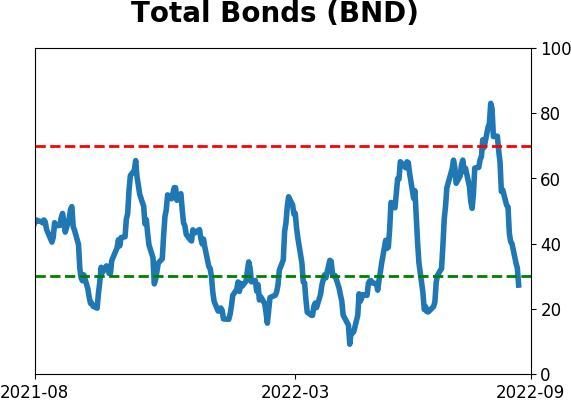
Bond ETF's - 10-Day Moving Average
|
|
|
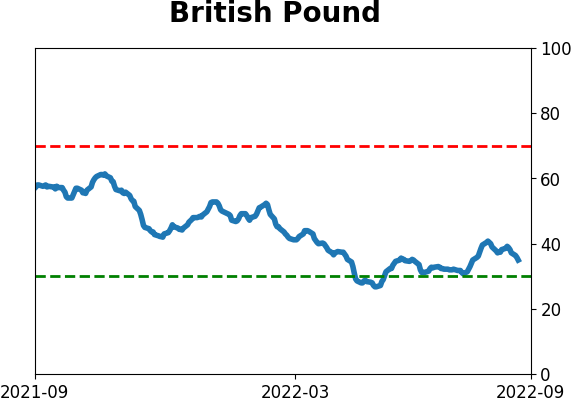
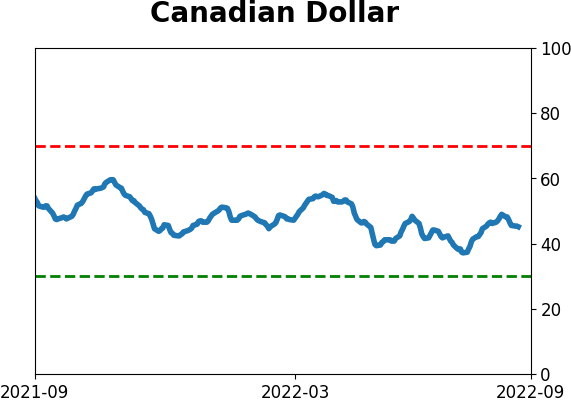
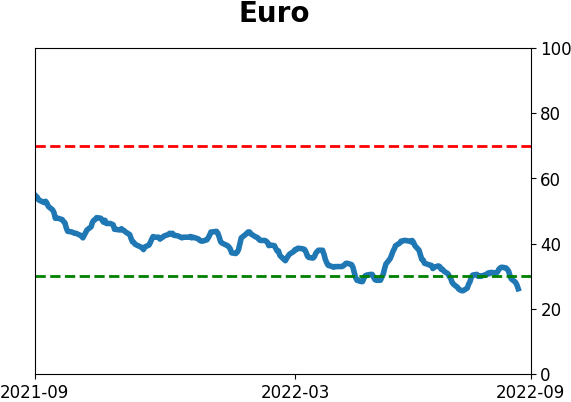
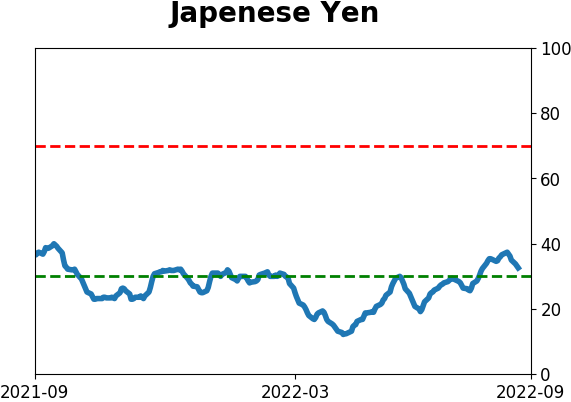
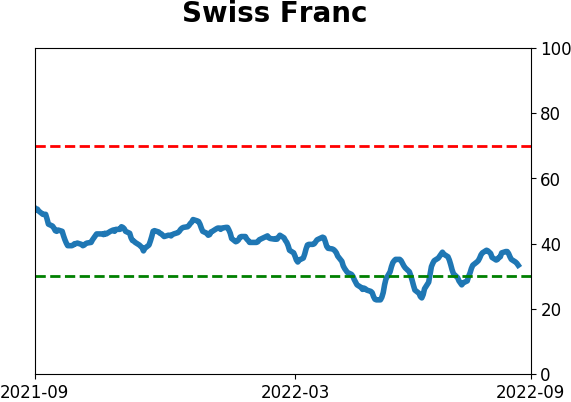
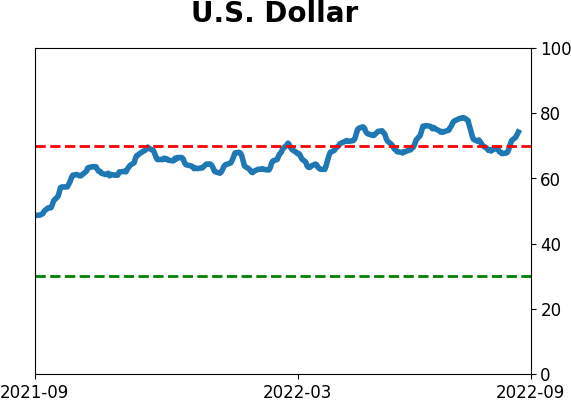
Currency ETF's - 5-Day Moving Average
|
|
|
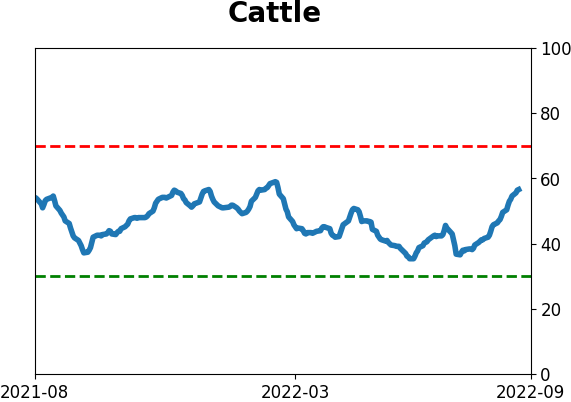
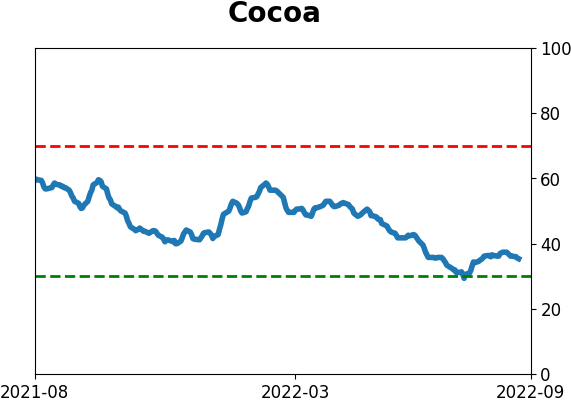
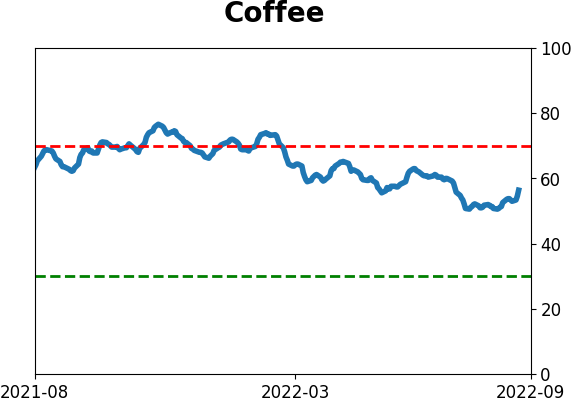
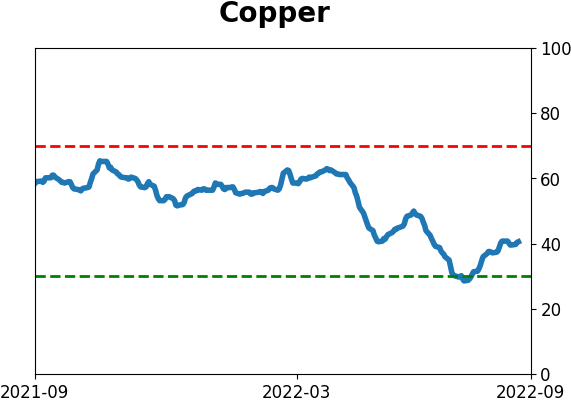
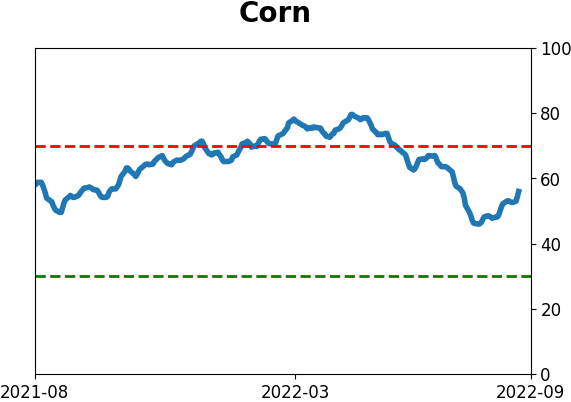
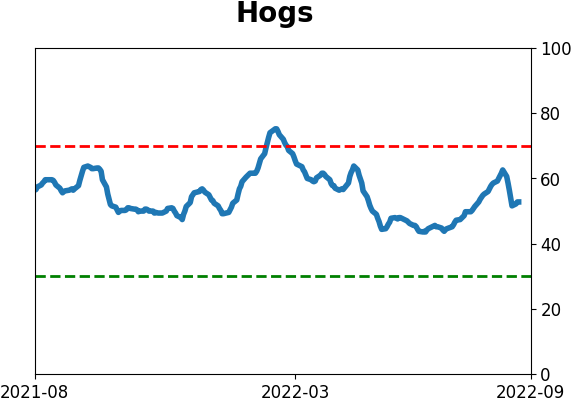
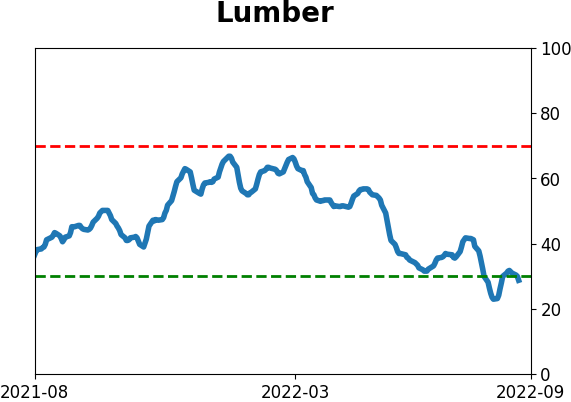
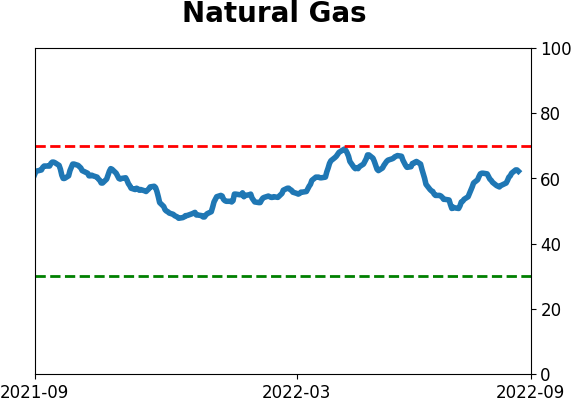
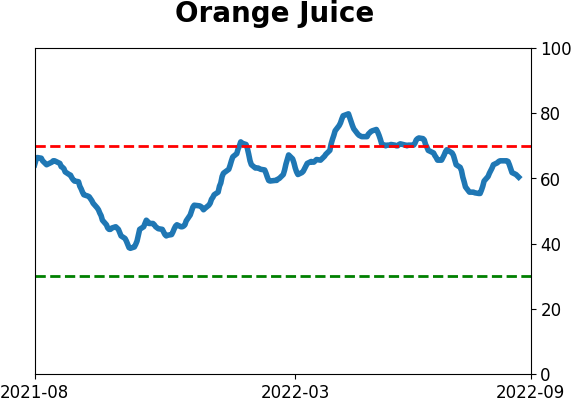
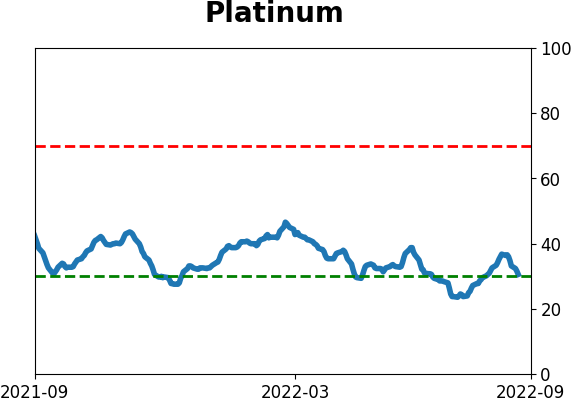
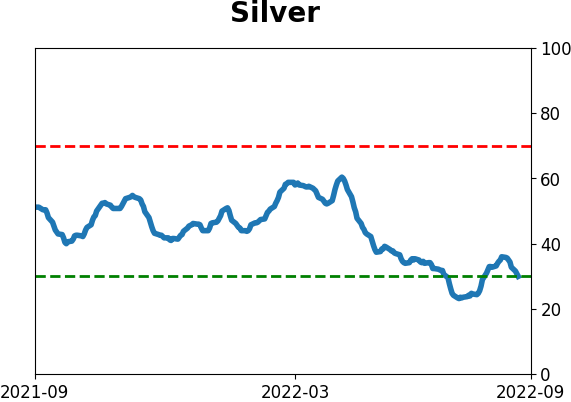
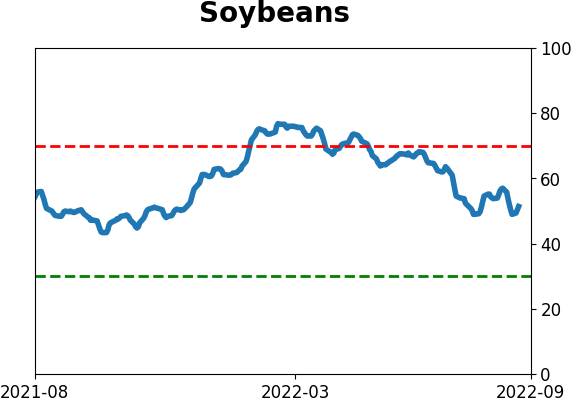
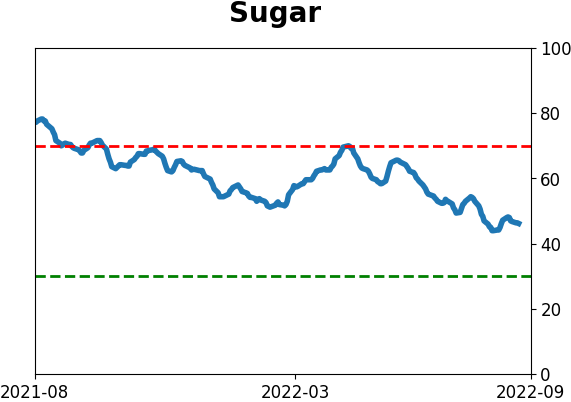
Commodity ETF's - 5-Day Moving Average
|
|