Headlines
|
|
Approaching New Highs on Negative Breadth:
The S&P 500 rallied to within 1% of its high last week, but the McClellan Summation Index and Net % of New Highs - New Lows have both moved into negative territory. This has been a poor combination for stocks since 1928.
Bottom Line:
STOCKS: Hold
Sentiment continues to decline from the speculative February peak. With deteriorating breadth, this raises the risk of poor short- to medium-term returns until optimism and better breadth returns. See the Outlook & Allocations page for more. BONDS: Hold
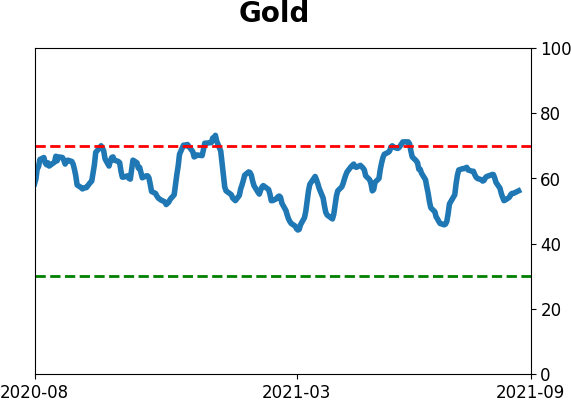
Various parts of the market got hit in March, with the lowest Bond Optimism Index we usually see during healthy environments. Bond prices have modest recovered and there is no edge among the data we follow. GOLD: Hold
Gold and miners were rejected after trying to recover above their 200-day averages in May. Lately, some medium-term (not long-term) oversold extremes in breadth measures among miners have triggered.
|
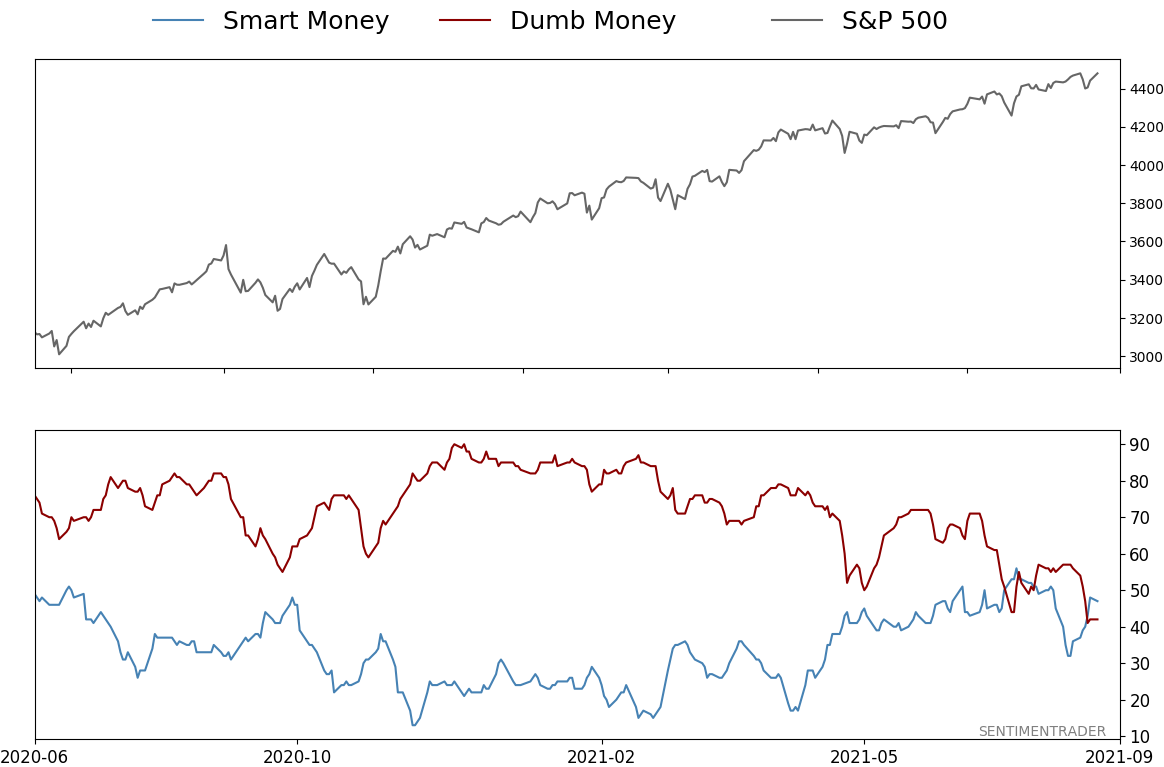
Smart / Dumb Money Confidence
|
Smart Money Confidence: 47%
Dumb Money Confidence: 42%
|
|
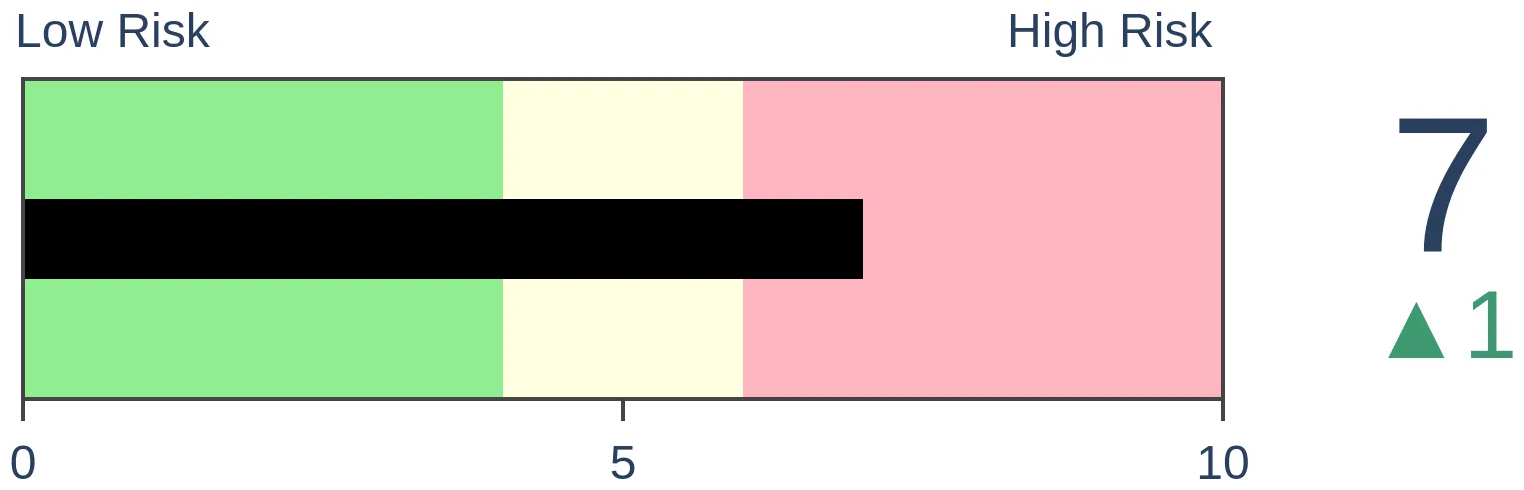
Risk Levels
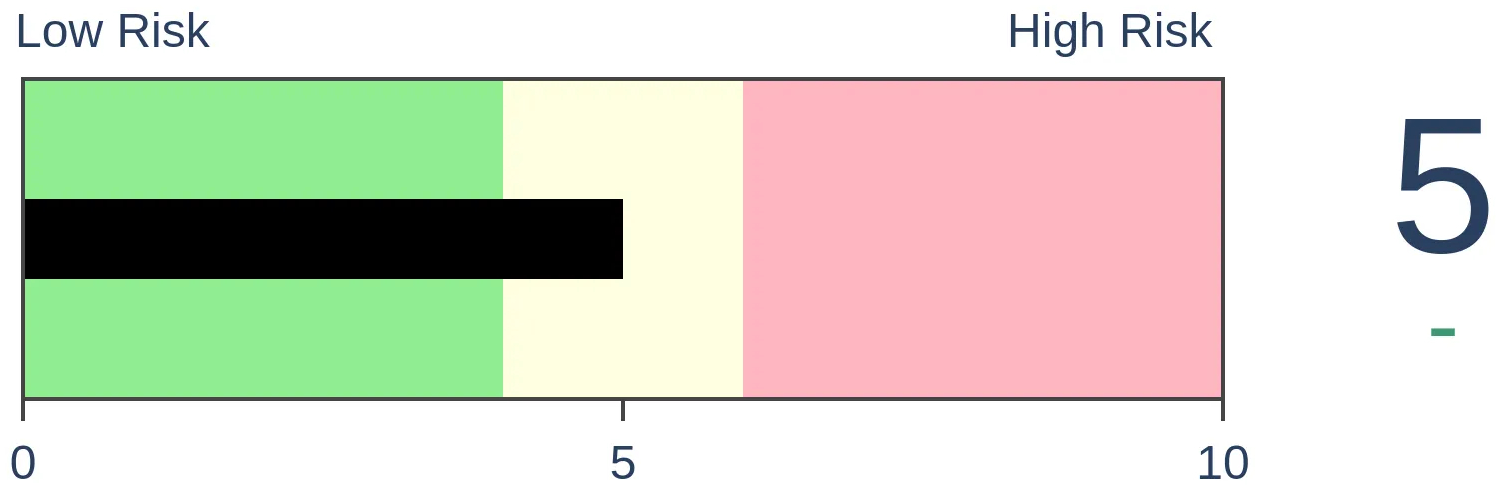
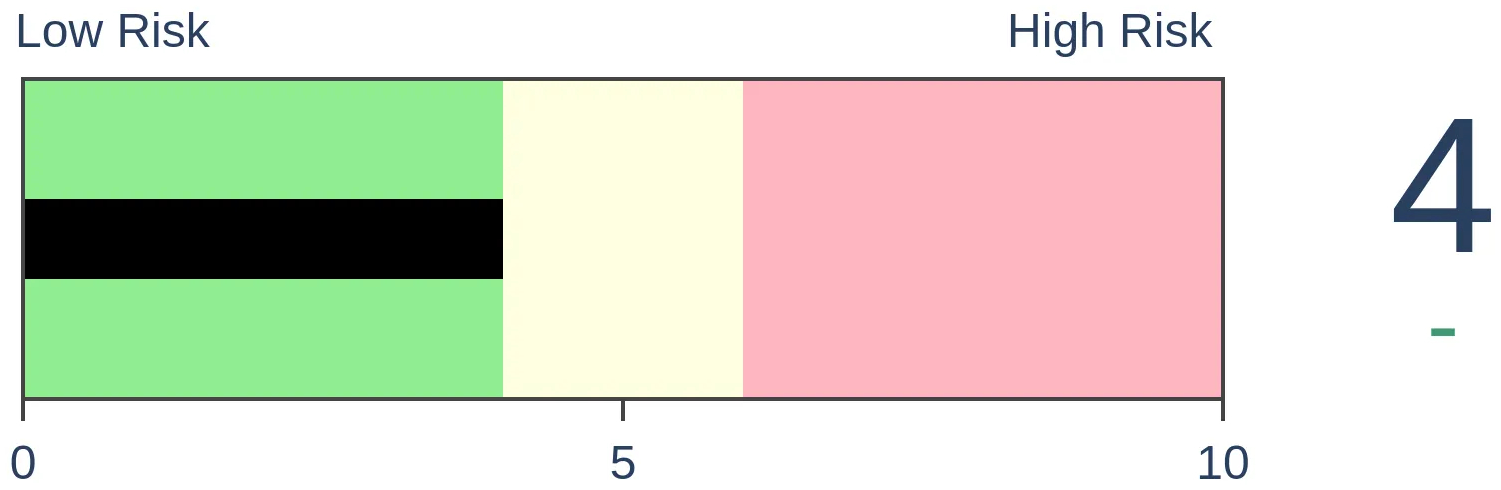
Stocks Short-Term
|
Stocks Medium-Term

|
|
Bonds

|
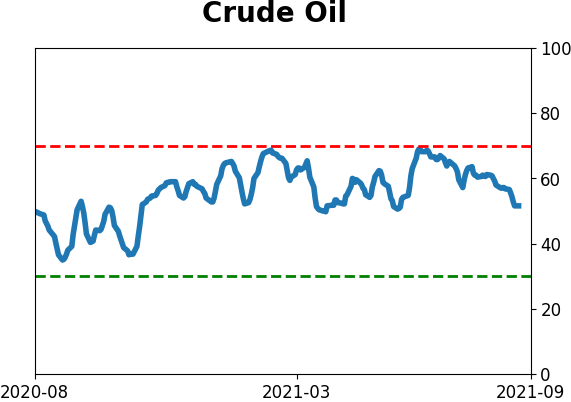
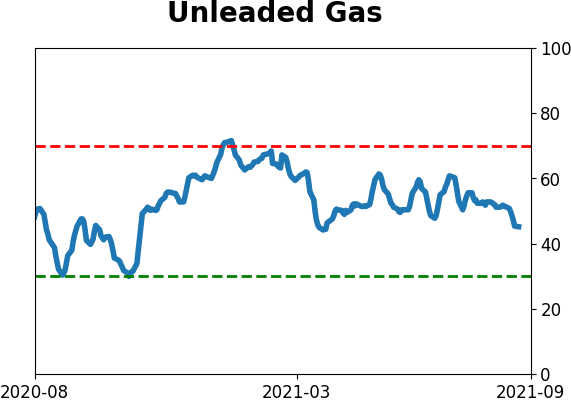
Crude Oil

|
|
Gold
|
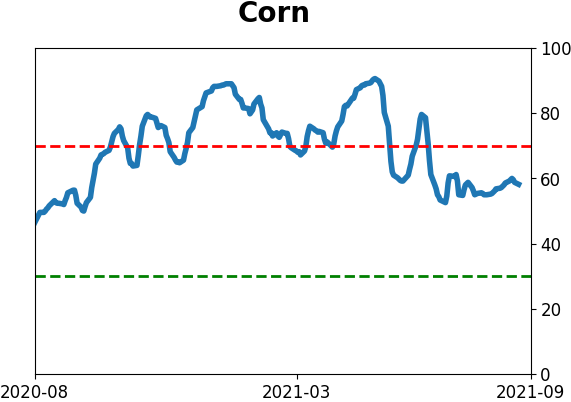
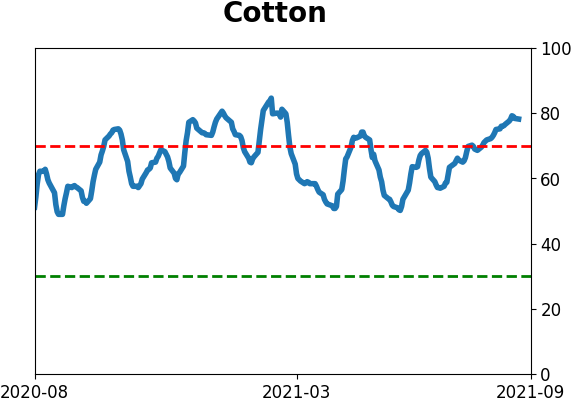
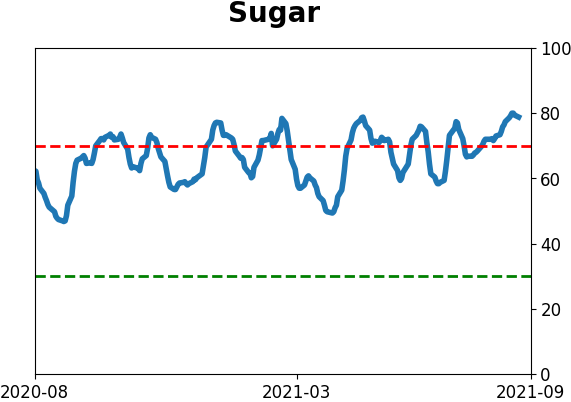
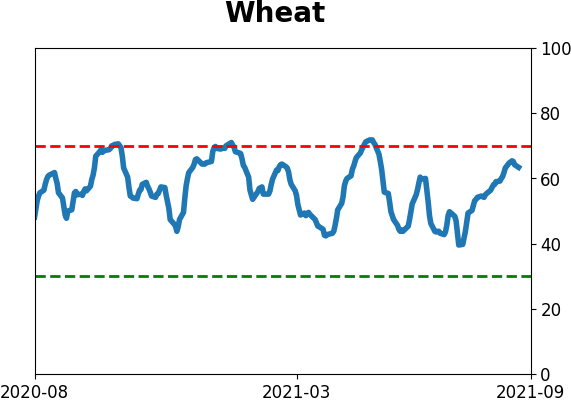
Agriculture
|
|
Research
By Jason Goepfert
BOTTOM LINE
The S&P 500 rallied to within 1% of its high last week, but the McClellan Summation Index and Net % of New Highs - New Lows have both moved into negative territory. This has been a poor combination for stocks since 1928.
FORECAST / TIMEFRAME
SPY -- Down, Short-Term
|
Since the peak of the speculative orgy in February, we've been watching for major internal deterioration in the indexes. There were short bursts of unusual behavior in the months following that peak, but stocks immediately recovered.
There were more pronounced divergences during June and July, such as with the percentage of stocks holding above their 50-day moving averages. And with subsequent push to new highs, sentiment was becoming less and less enthused. Knee-jerk contrarians may take that as a positive thing, but stocks need buyers to be ever more optimistic to sustain an advance.
Looking at an aggregate model like Fear & Greed, this is an almost exact repeat of 2015. A February/March peak in sentiment followed by a choppy move higher in the S&P 500 as sentiment ebbed more and more into July and August.
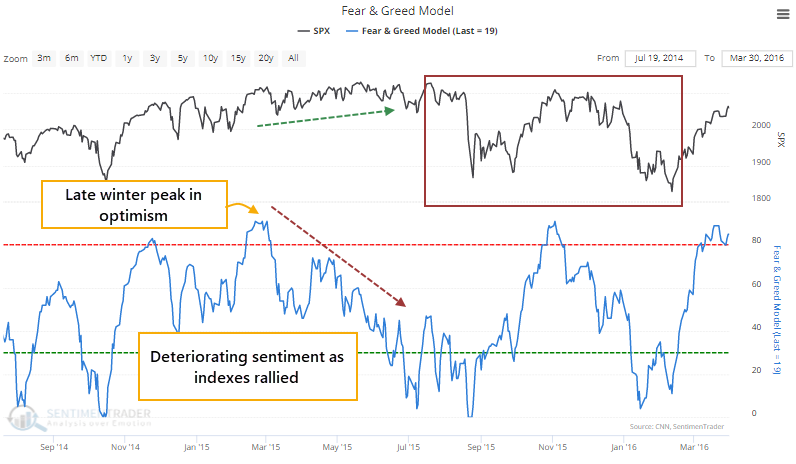
Investor confidence isn't necessarily the most influenced by movements in the S&P or Dow Industrials. While they get the headlines, investors are more concerned with broader movements in stocks. So it's no surprise that internal breadth metrics were deteriorating during that drop in sentiment in 2015.
Just like now.
LONG-TERM BREADTH IS NEGATIVE
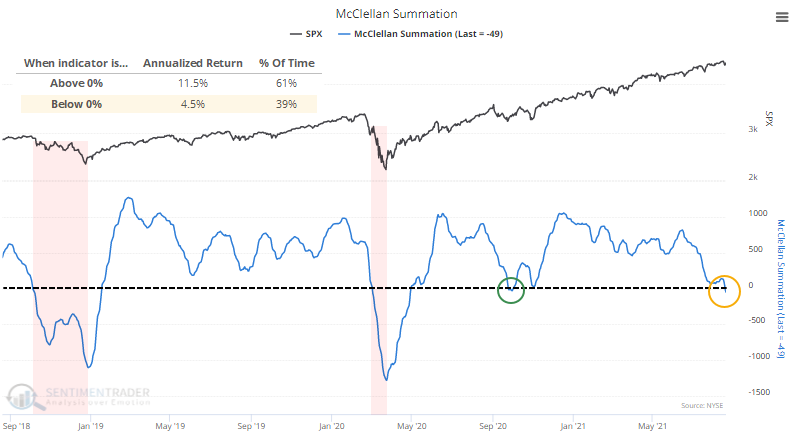
Two of our core measures for a long-term, broad look at how healthy stocks are is the NYSE McClellan Summation Index and the Net % of New Highs - New Lows. And right now, they're signaling caution.
Despite the S&P rallying on Friday to close within 1% of its prior high, and another push on Monday, the Summation Index is negative. The worst possible combination for this indicator is when it is below zero and declining. That's when the worst selloffs happen. There was a brief fakeout last September-October, but the current reading is already below that one.
On the NYSE, there are also now more securities falling to 52-week lows than rising to 52-week highs. When this is below zero, the S&P's annualized return is only about a third of what it is when it's above zero.
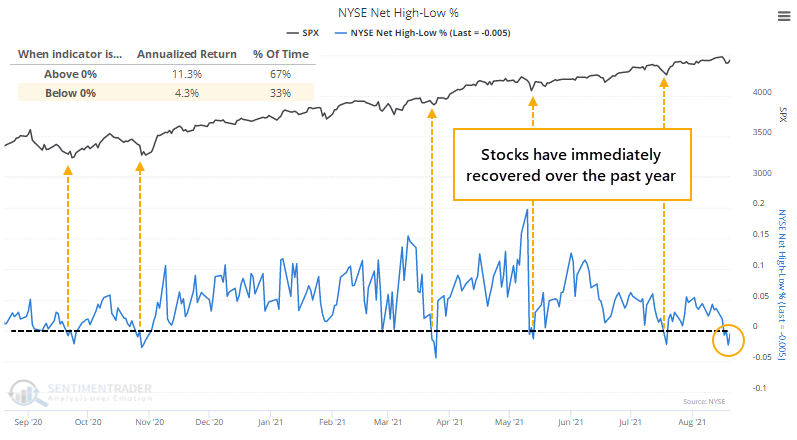
Bulls could justifiably argue that every time this has happened in the past year, the S&P 500 almost immediately turned around and resumed its advance. Fair point. So, we should watch to see if this time will be any different, which would suggest that the environment has changed.
RARE TO SEE SUSTAINED UPSIDE
The table below shows every time since the late 1920s when the S&P was within spitting distance of a 52-week high and both the Summation Index and Net NH - NL were negative.
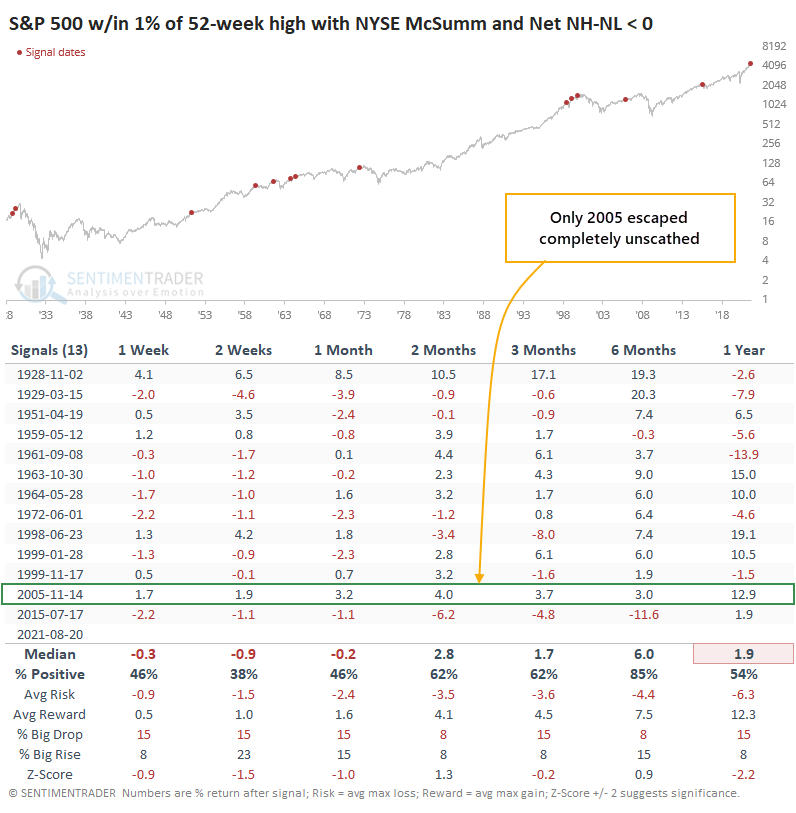
The only instance when stocks escaped unscathed was 2005. All the others saw weakness in the S&P at some point in the weeks or months ahead. Sometimes it took a long while (1928), but most saw losses or limited gains across most time frames.
There is a bit of boy-who-cried-wolf with this type of analysis because it hasn't worked at all in 2021. This time, the potential difference is that it's really the first time such broad and long-term metrics were so poor despite the major indexes holding near their highs. This has been a dangerous combo in the past.
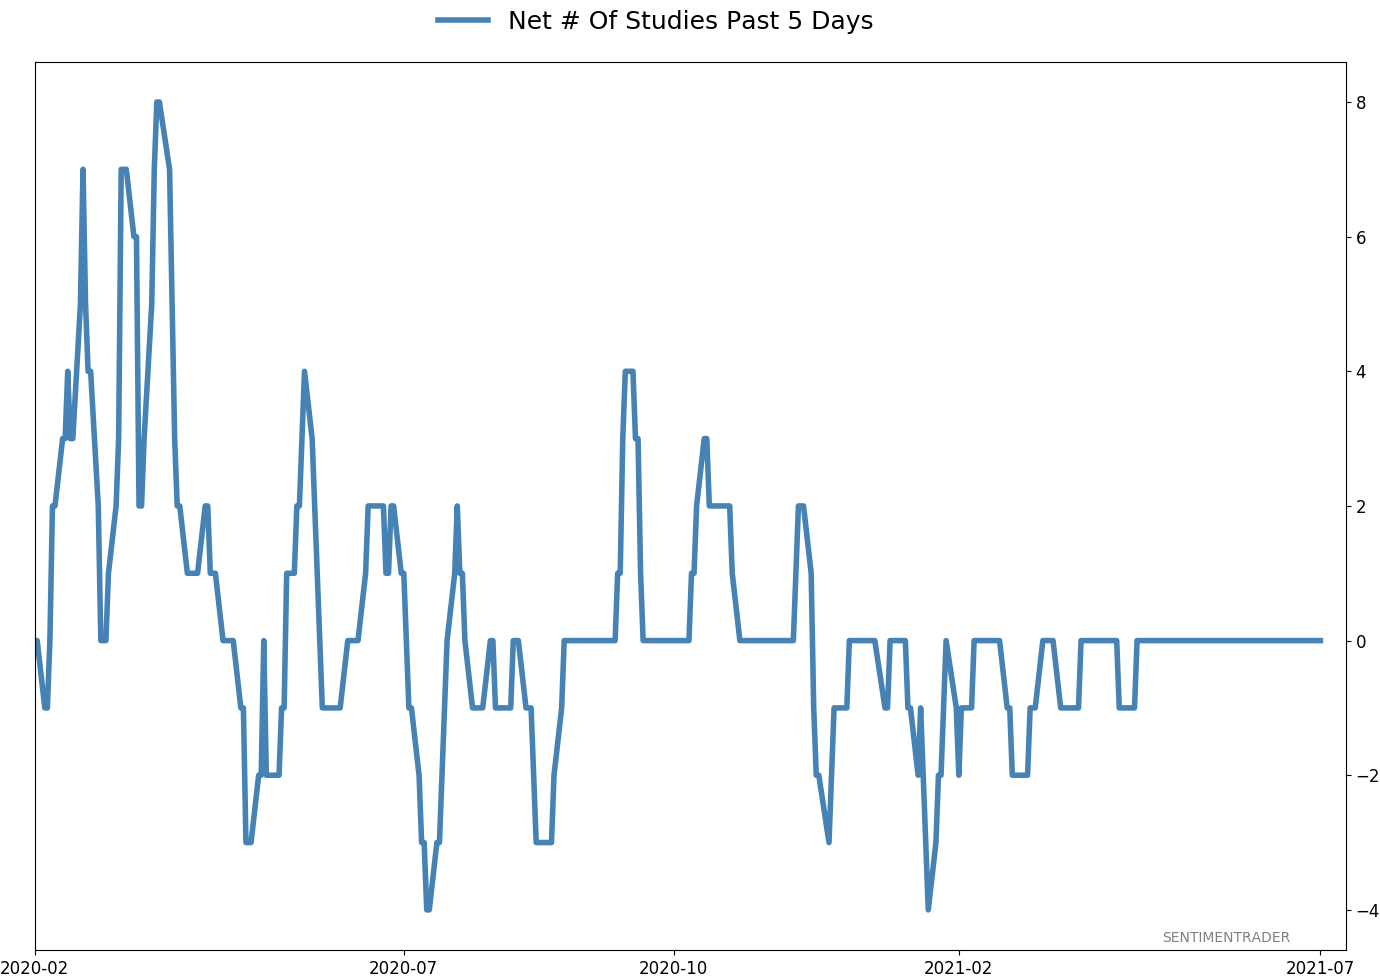
Active Studies
| Time Frame | Bullish | Bearish | | Short-Term | 0 | 5 | | Medium-Term | 4 | 3 | | Long-Term | 10 | 5 |
|
Indicators at Extremes
Portfolio
| Position | Description | Weight % | Added / Reduced | Date | | Stocks | RSP | 4.1 | Added 4.1% | 2021-05-19 | | Bonds | 23.9% BND, 6.9% SCHP | 30.7 | Reduced 7.1% | 2021-05-19 | | Commodities | GCC | 2.6 | Reduced 2.1%
| 2020-09-04 | | Precious Metals | GDX | 5.6 | Reduced 4.2% | 2021-05-19 | | Special Situations | 4.3% XLE, 2.2% PSCE | 7.6 | Reduced 5.6% | 2021-04-22 | | Cash | | 49.4 | | |
|
Updates (Changes made today are underlined)
Much of our momentum and trend work has remained positive for several months, with some scattered exceptions. Almost all sentiment-related work has shown a poor risk/reward ratio for stocks, especially as speculation drove to record highs in exuberance in February. Much of that has worn off, and most of our models are back toward neutral levels. There isn't much to be excited about here. The same goes for bonds and even gold. Gold has been performing well lately and is back above long-term trend lines. The issue is that it has a poor record of holding onto gains when attempting a long-term trend change like this, so we'll take a wait-and-see approach. RETURN YTD: 8.2% 2020: 8.1%, 2019: 12.6%, 2018: 0.6%, 2017: 3.8%, 2016: 17.1%, 2015: 9.2%, 2014: 14.5%, 2013: 2.2%, 2012: 10.8%, 2011: 16.5%, 2010: 15.3%, 2009: 23.9%, 2008: 16.2%, 2007: 7.8%
|
|
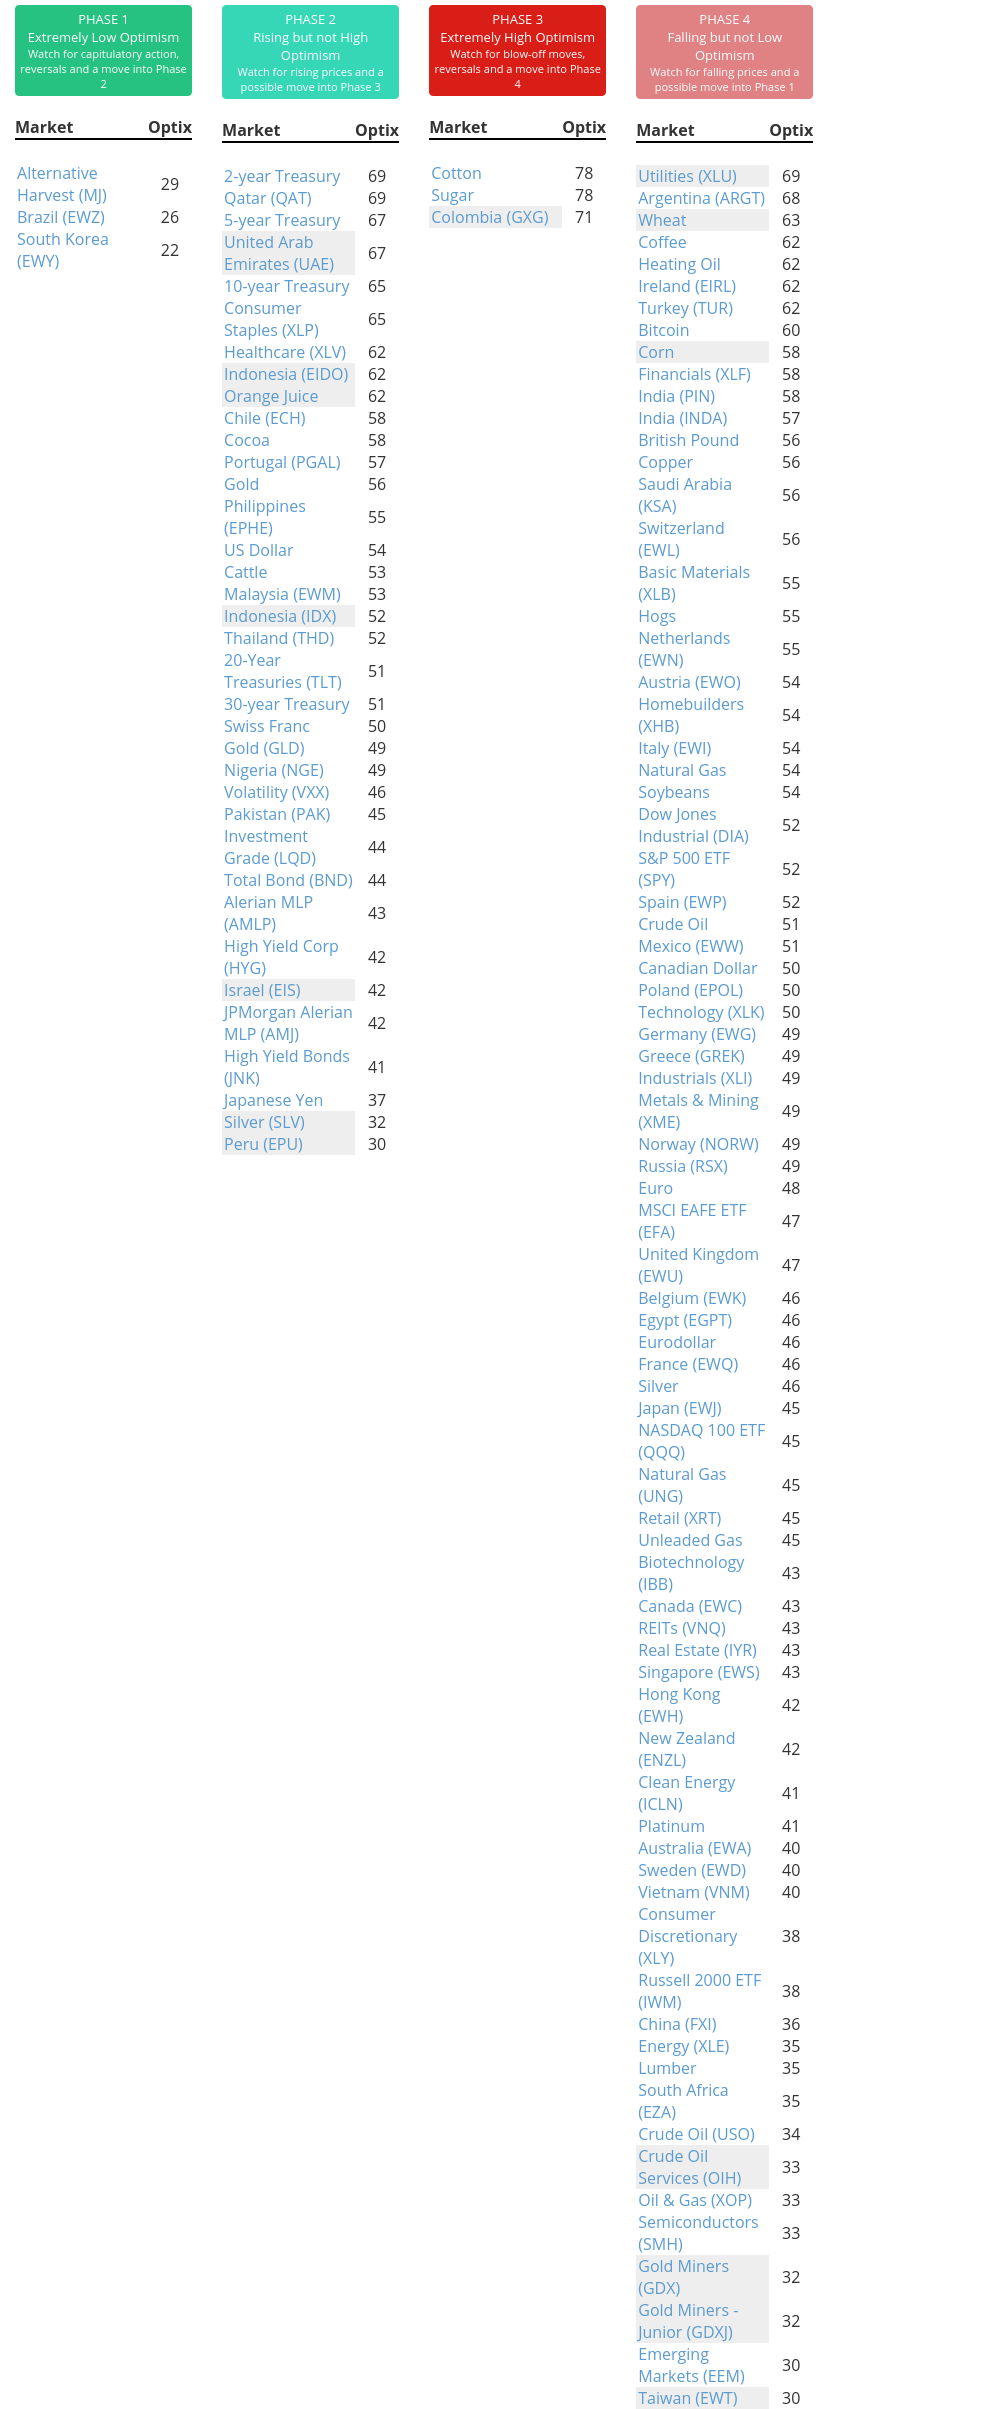
Phase Table
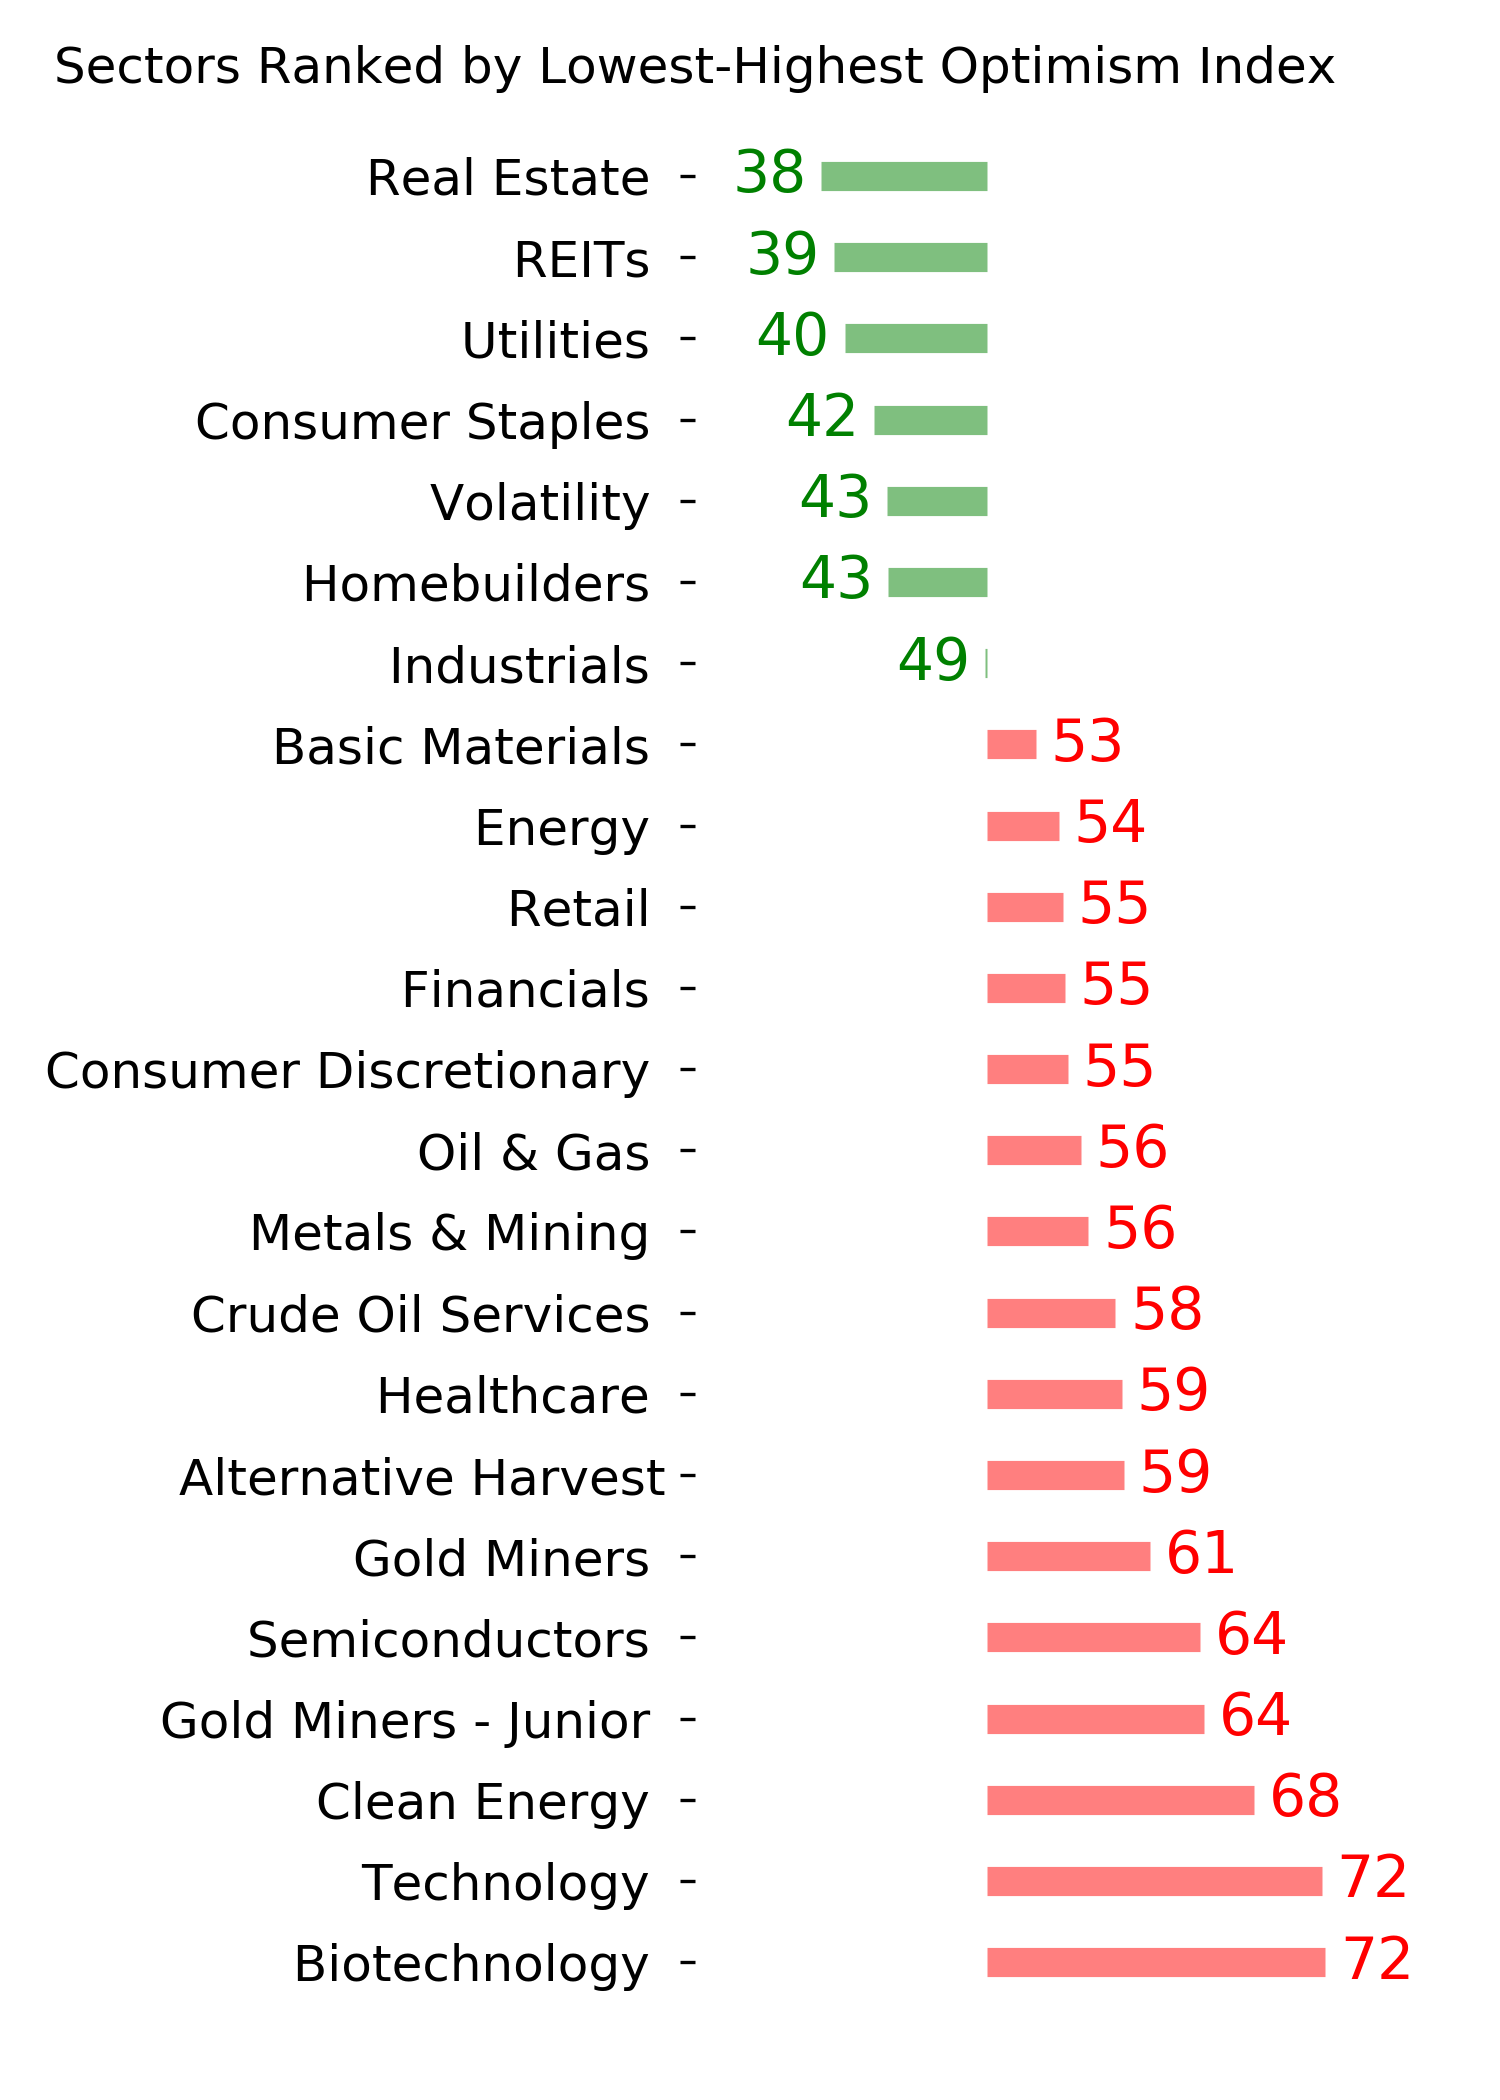
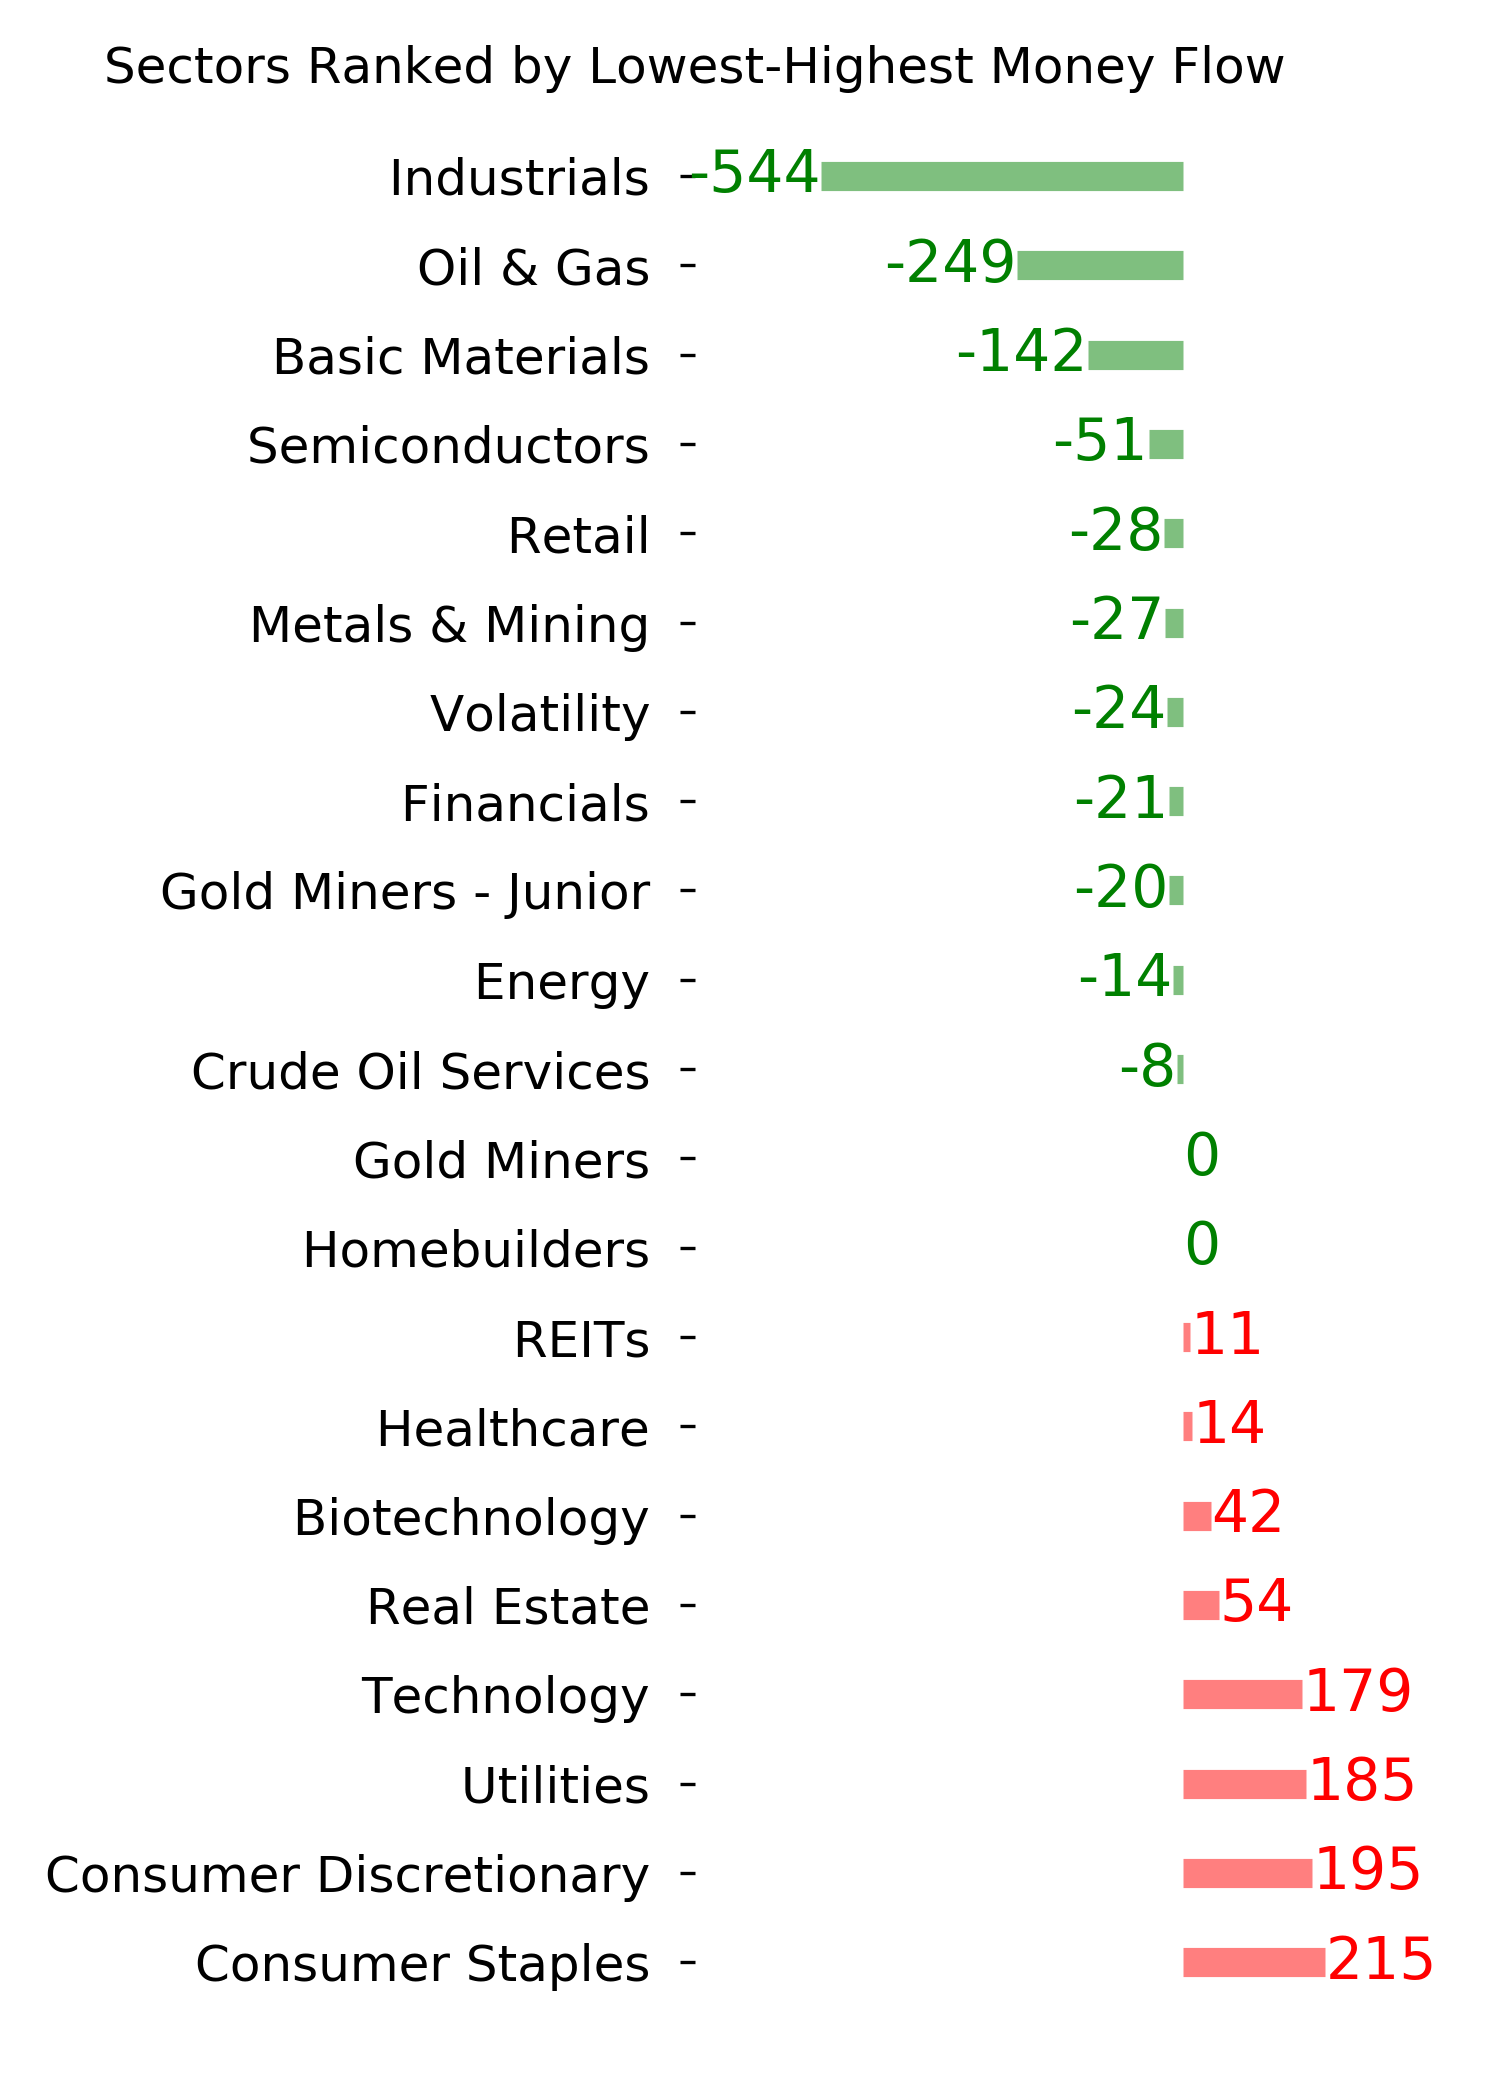
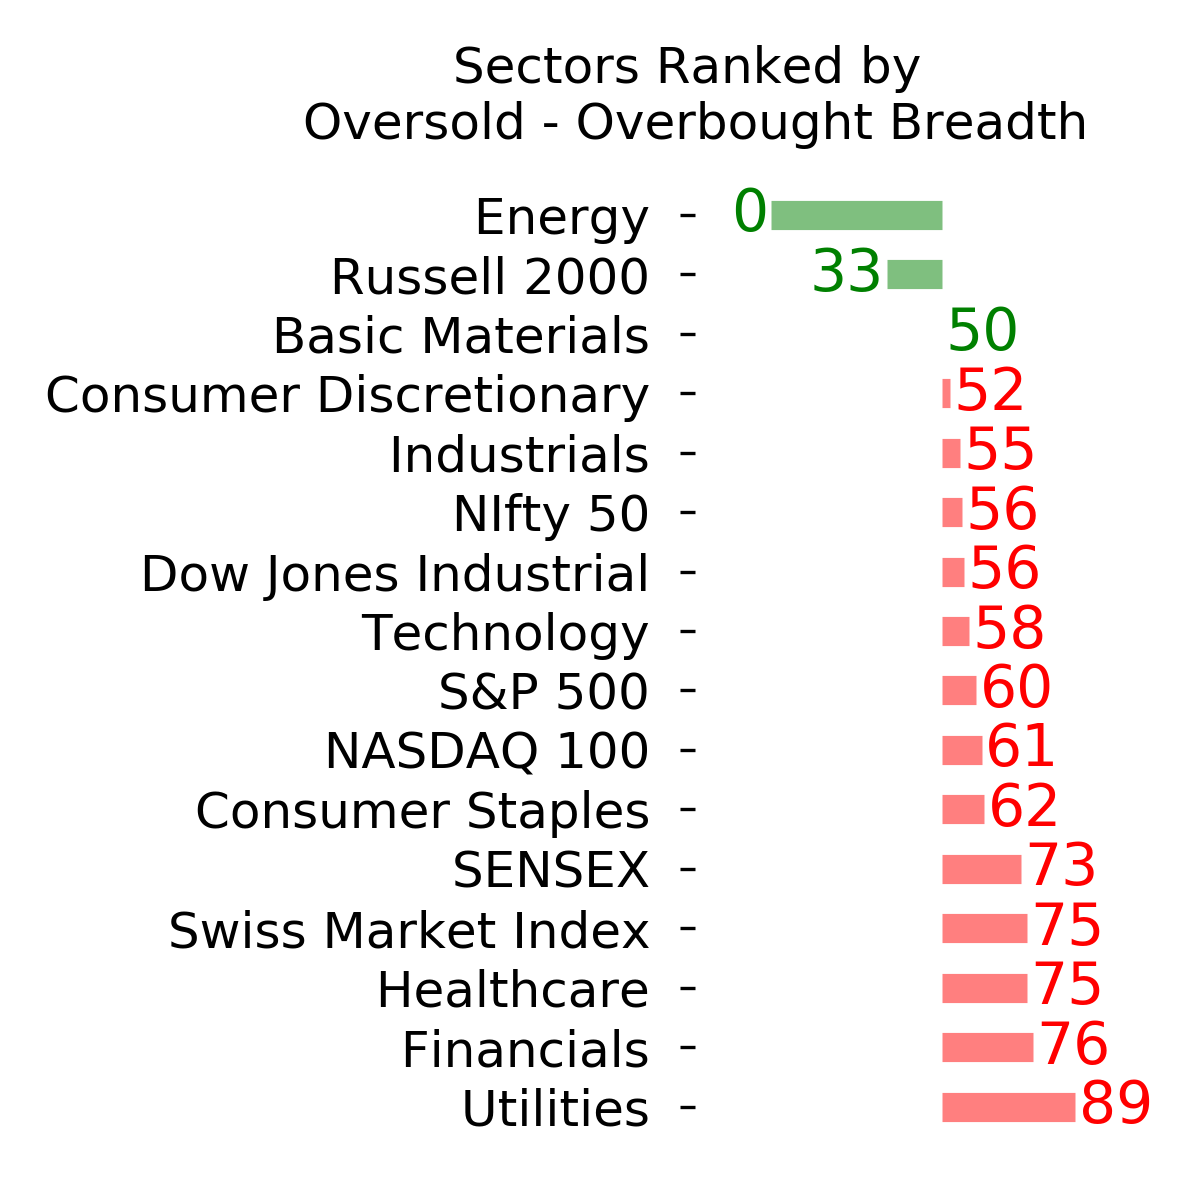
Ranks
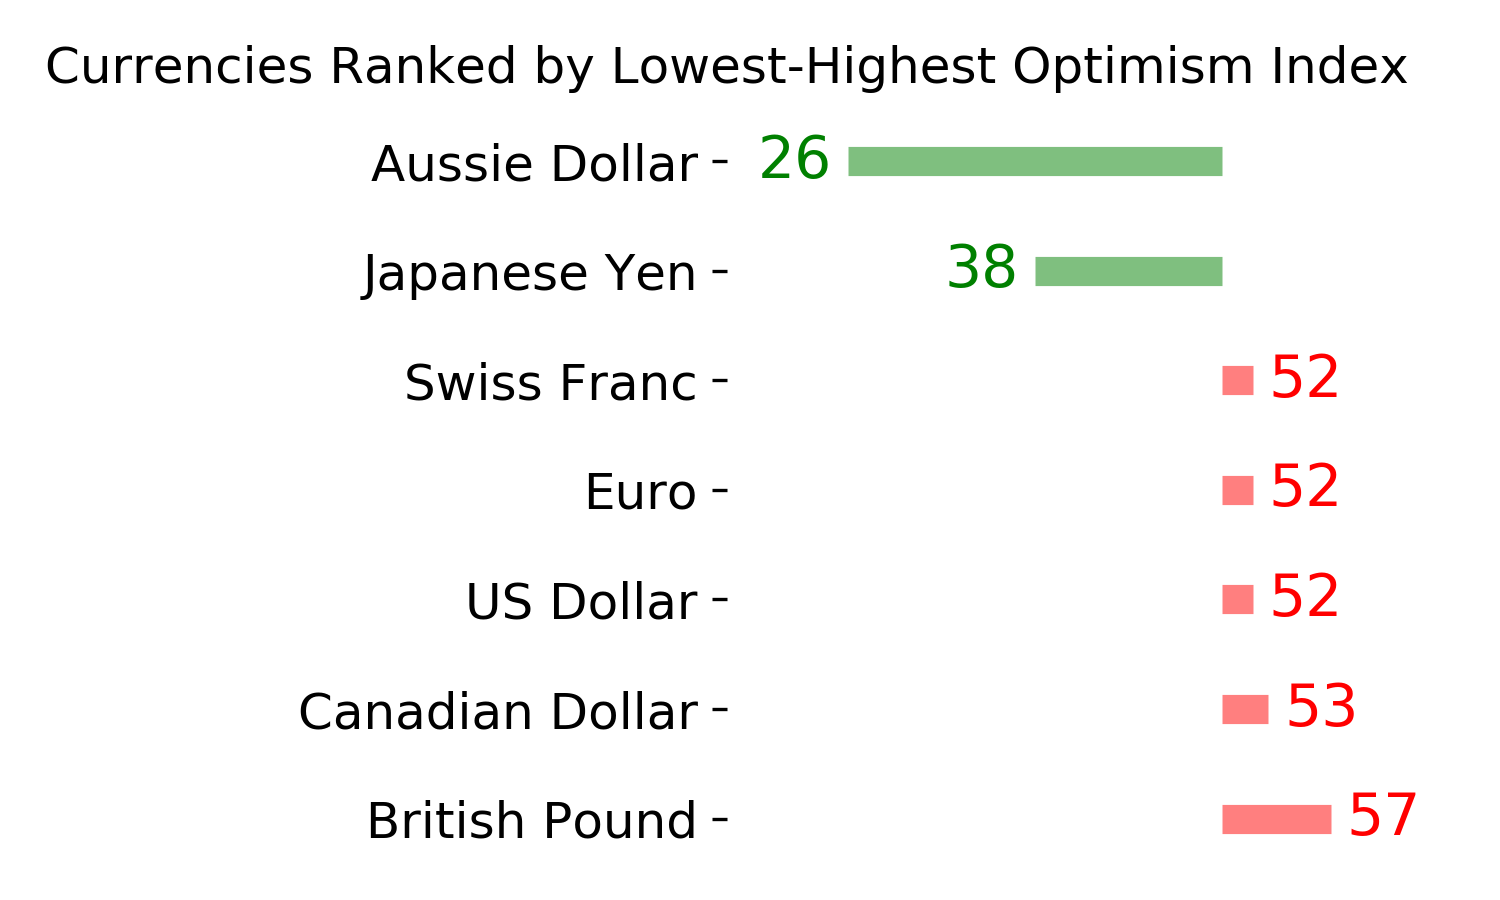
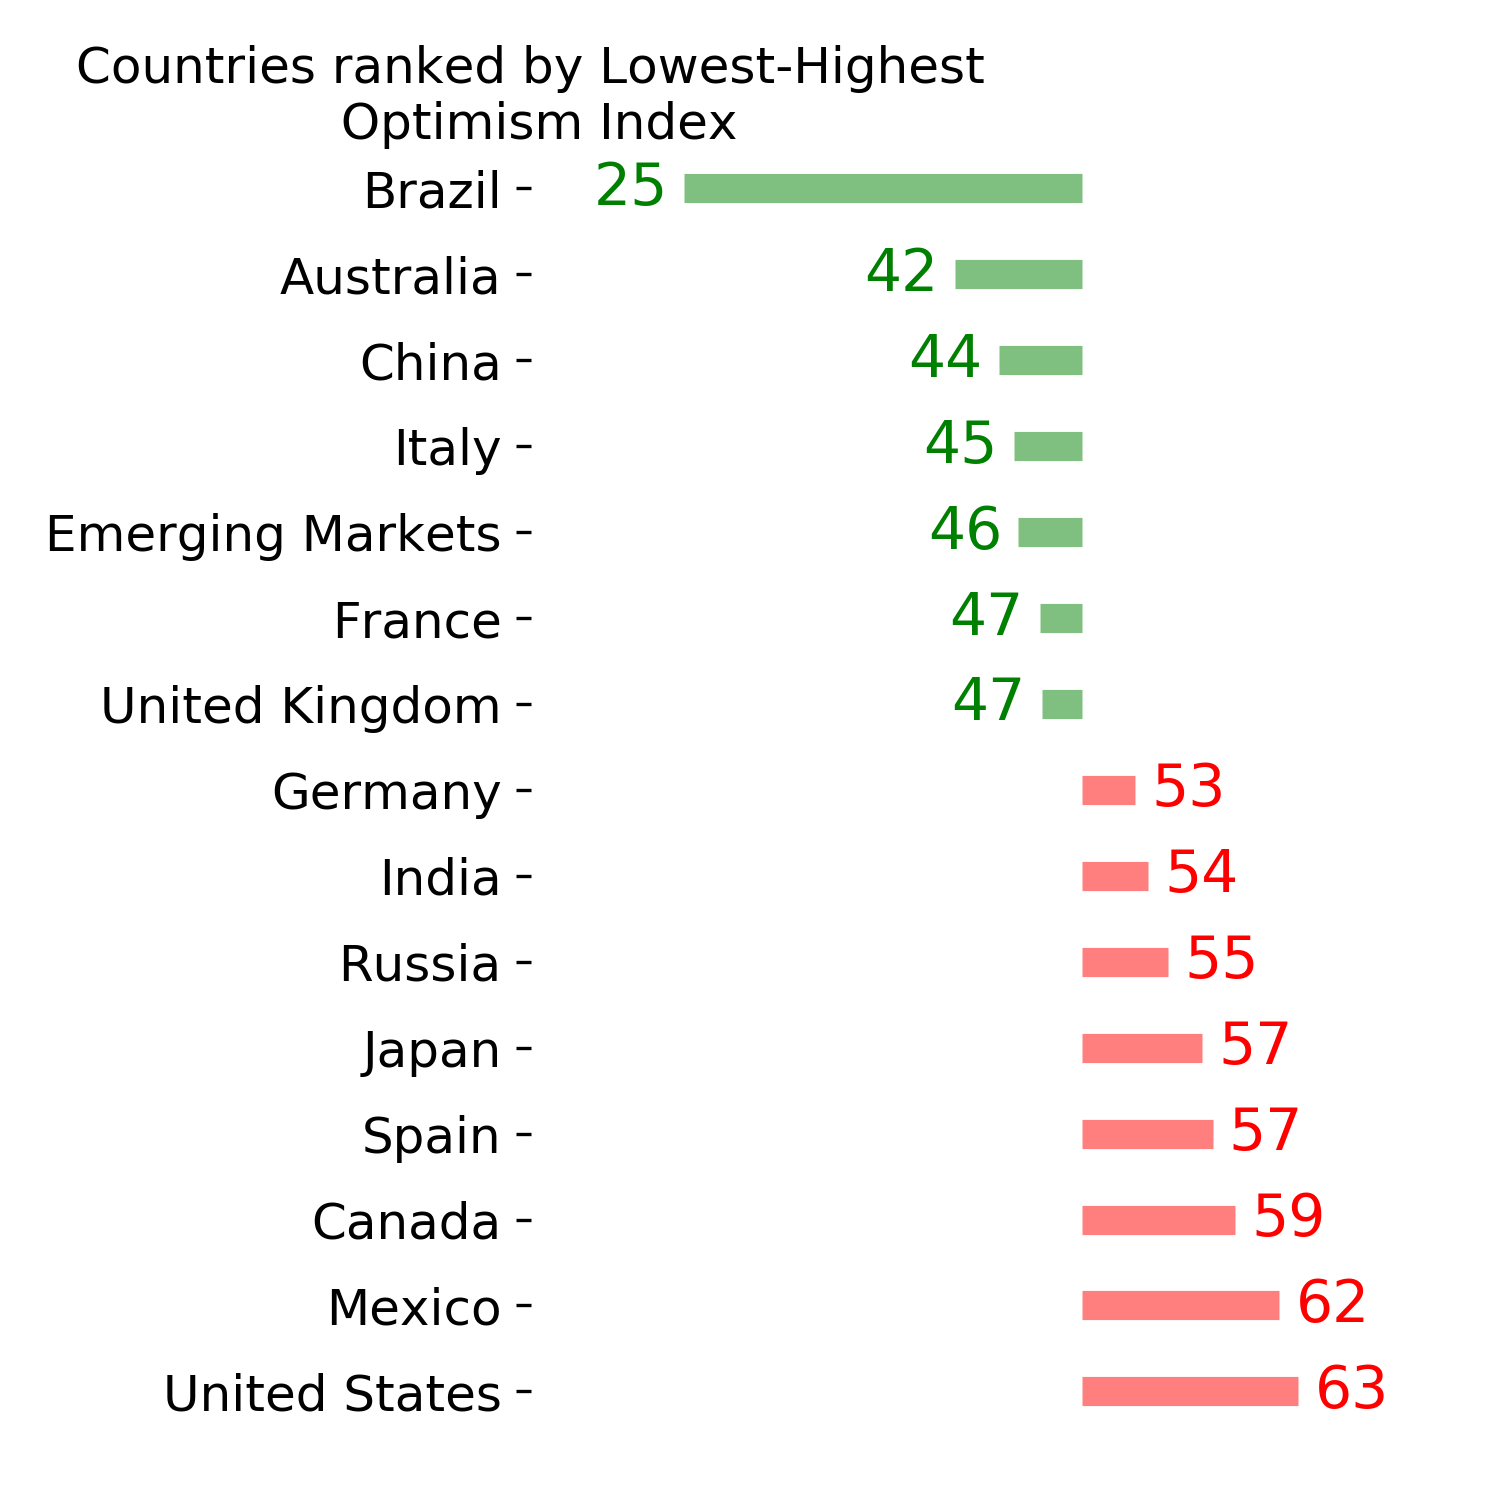
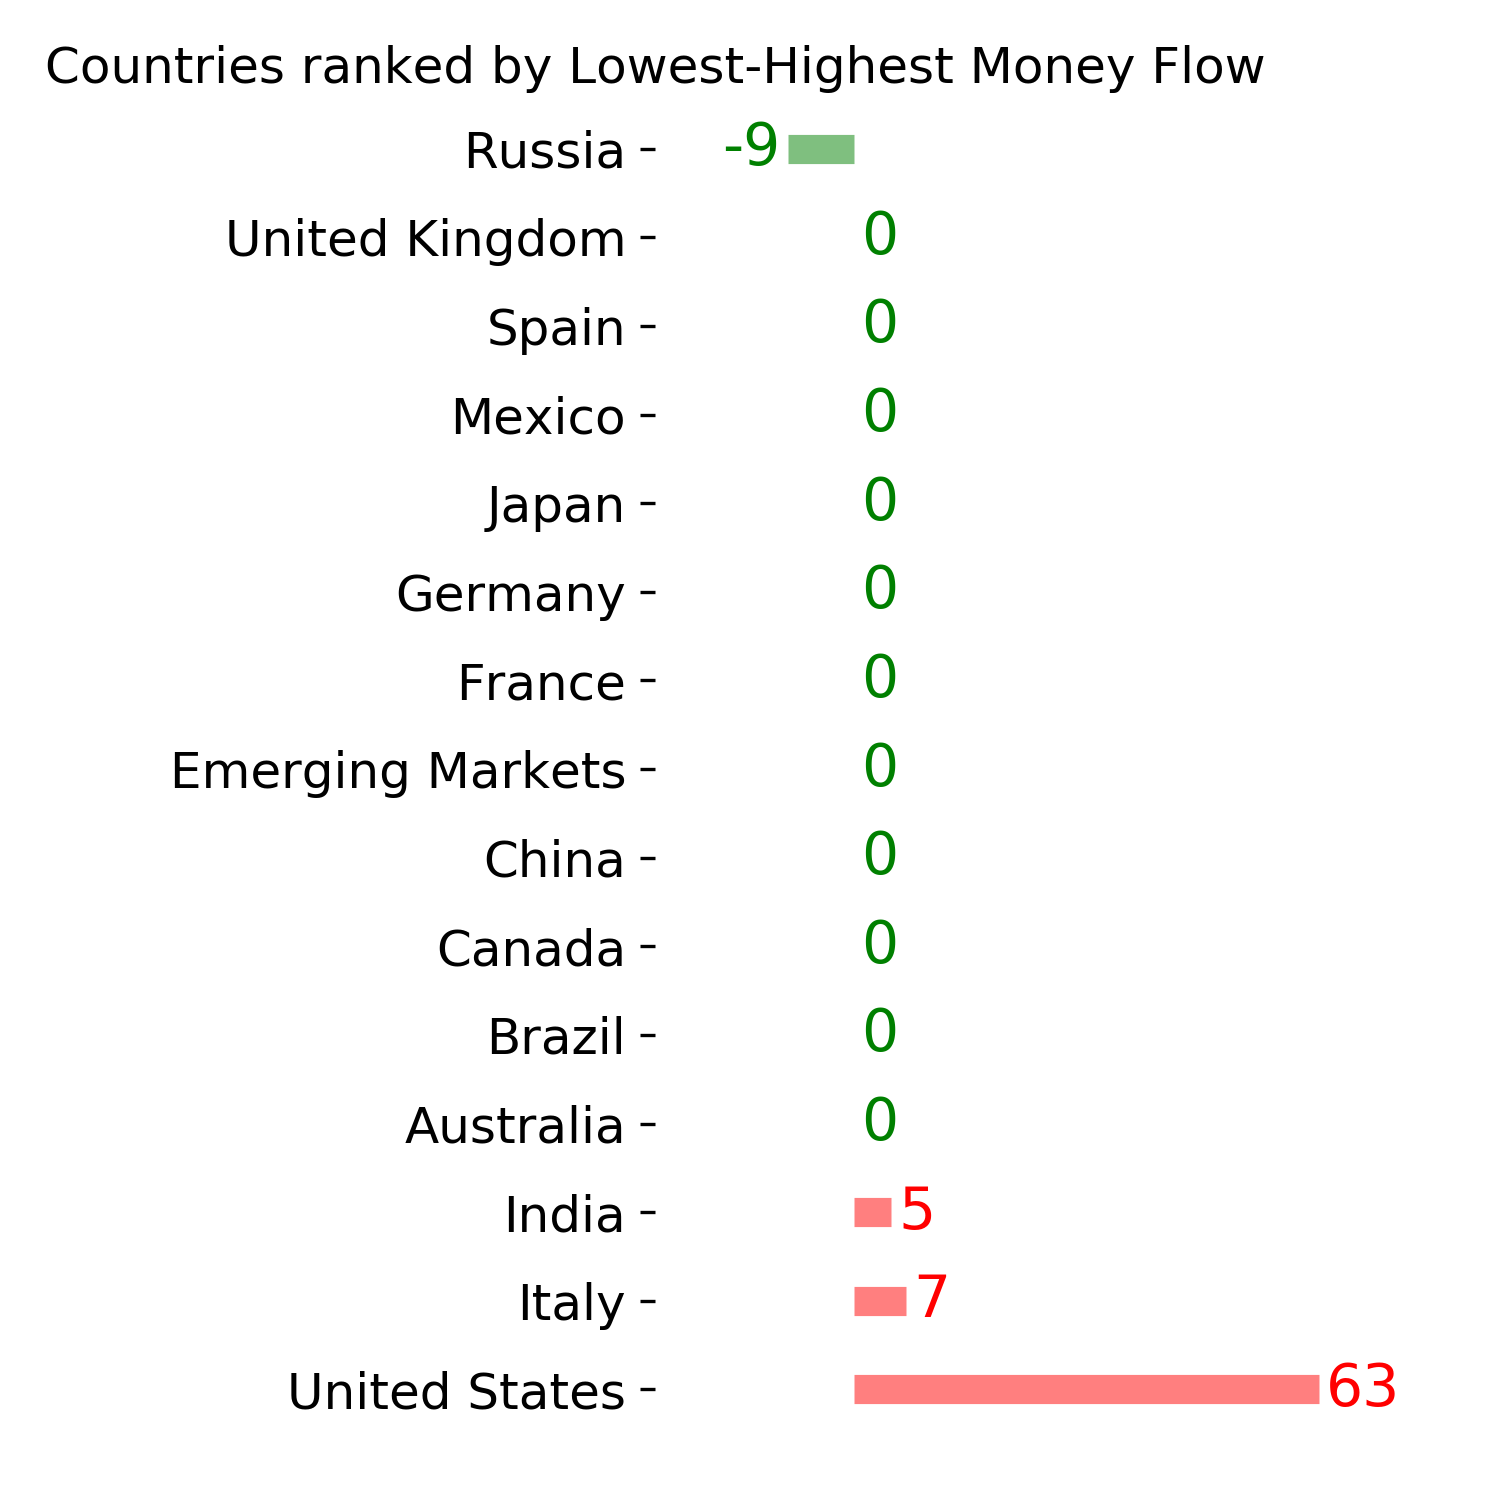
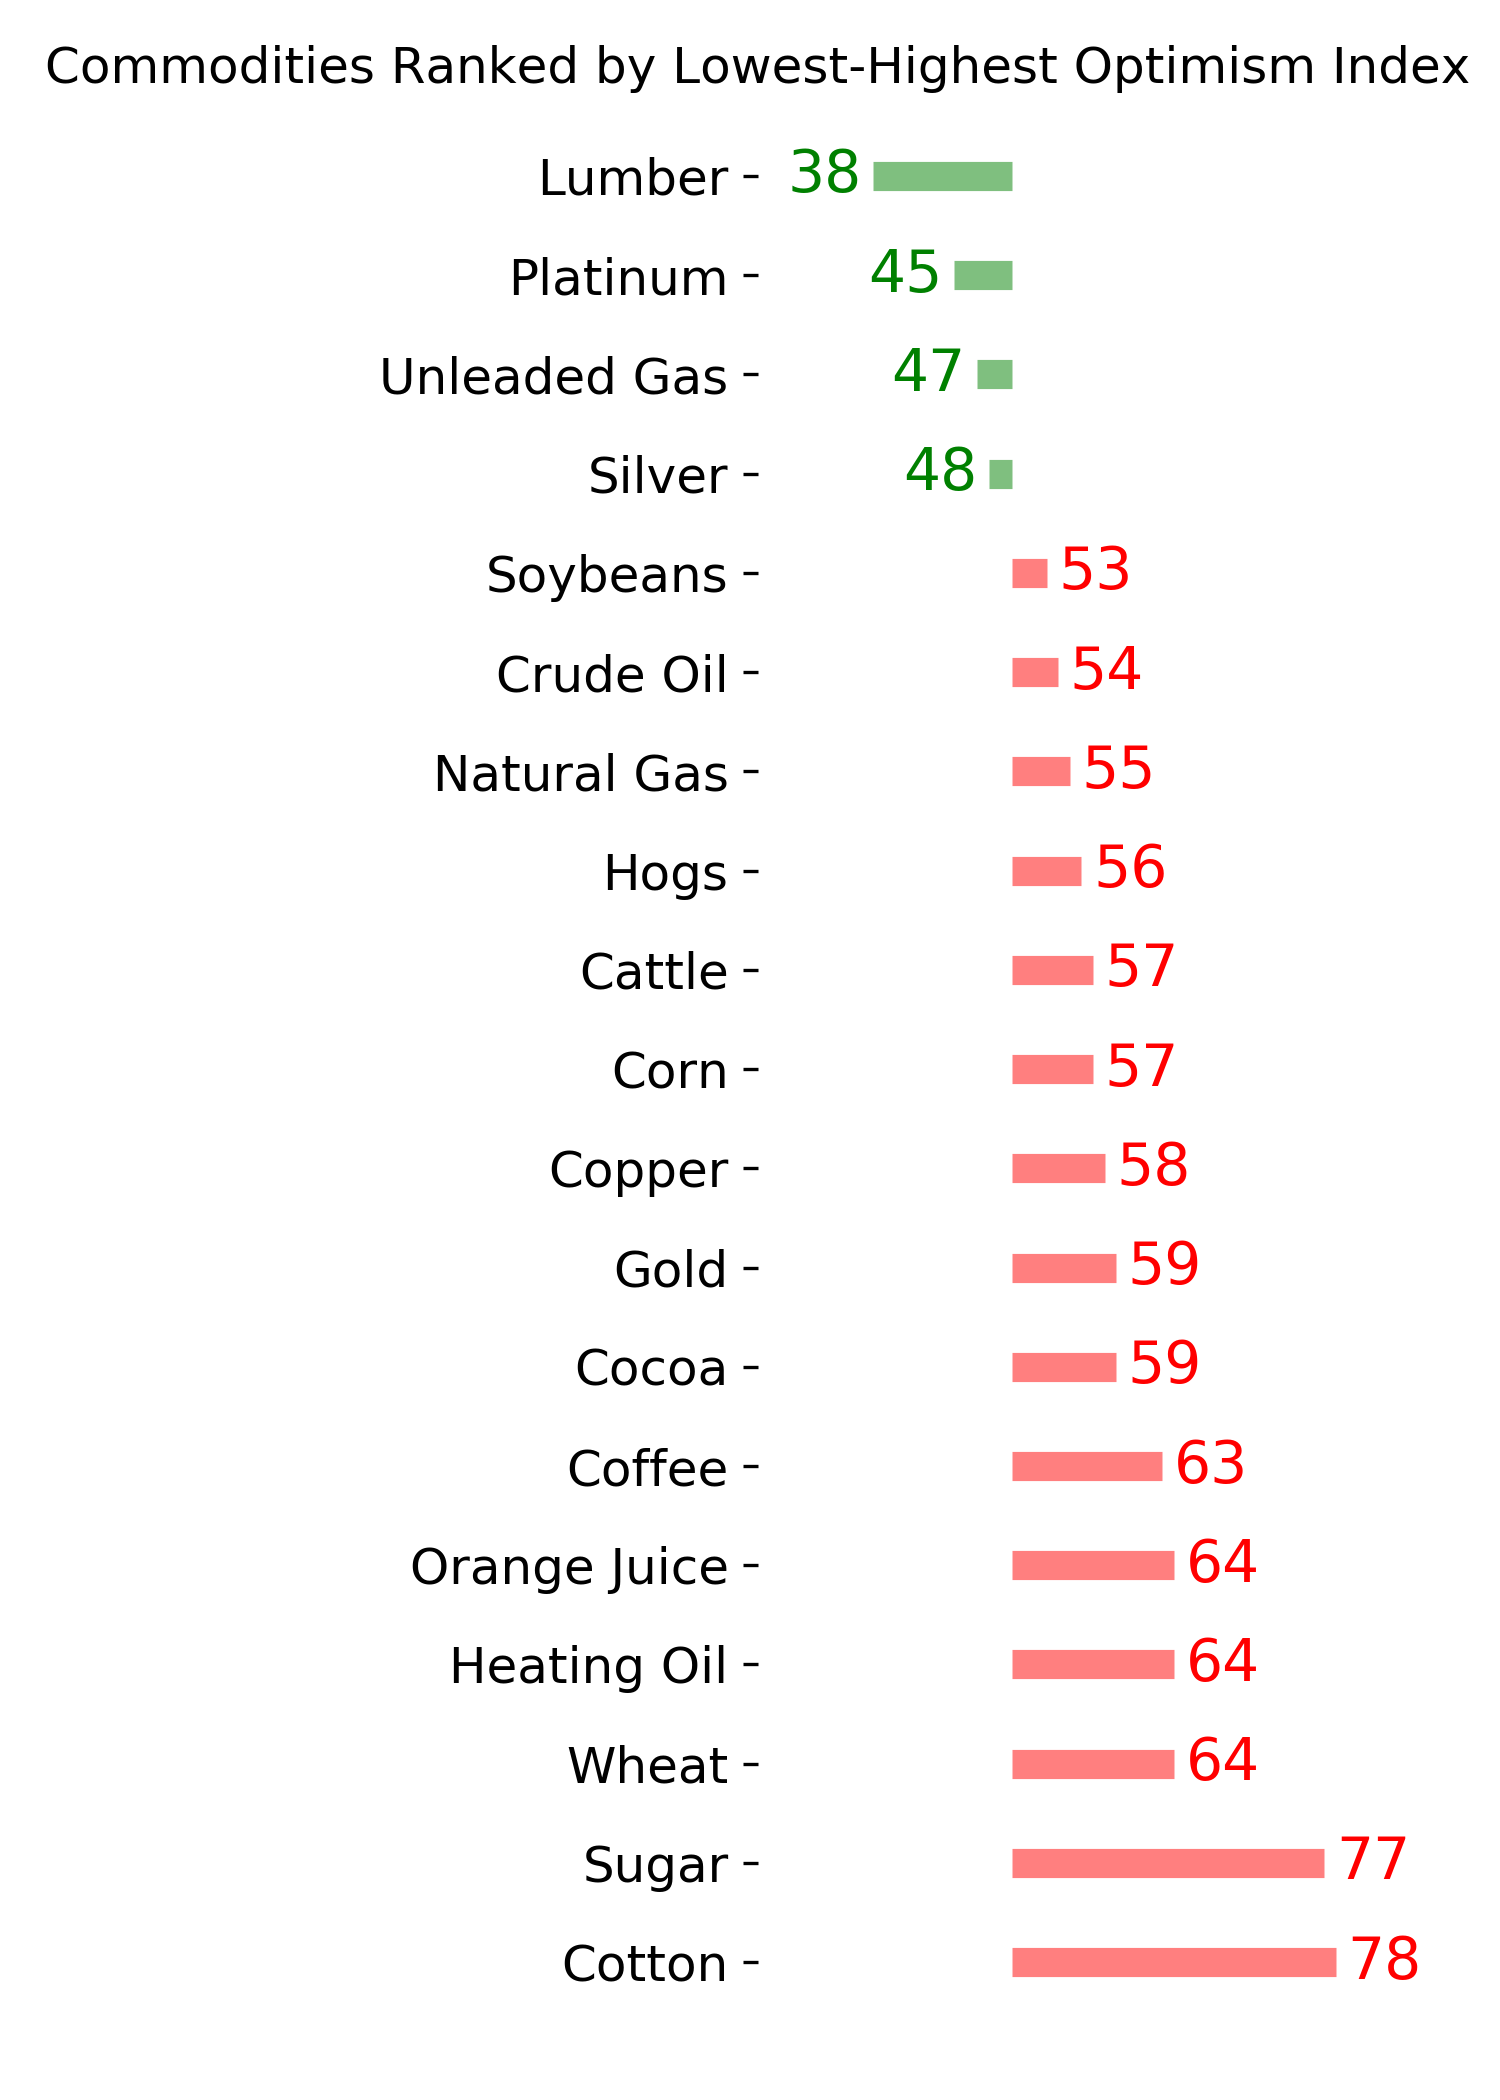
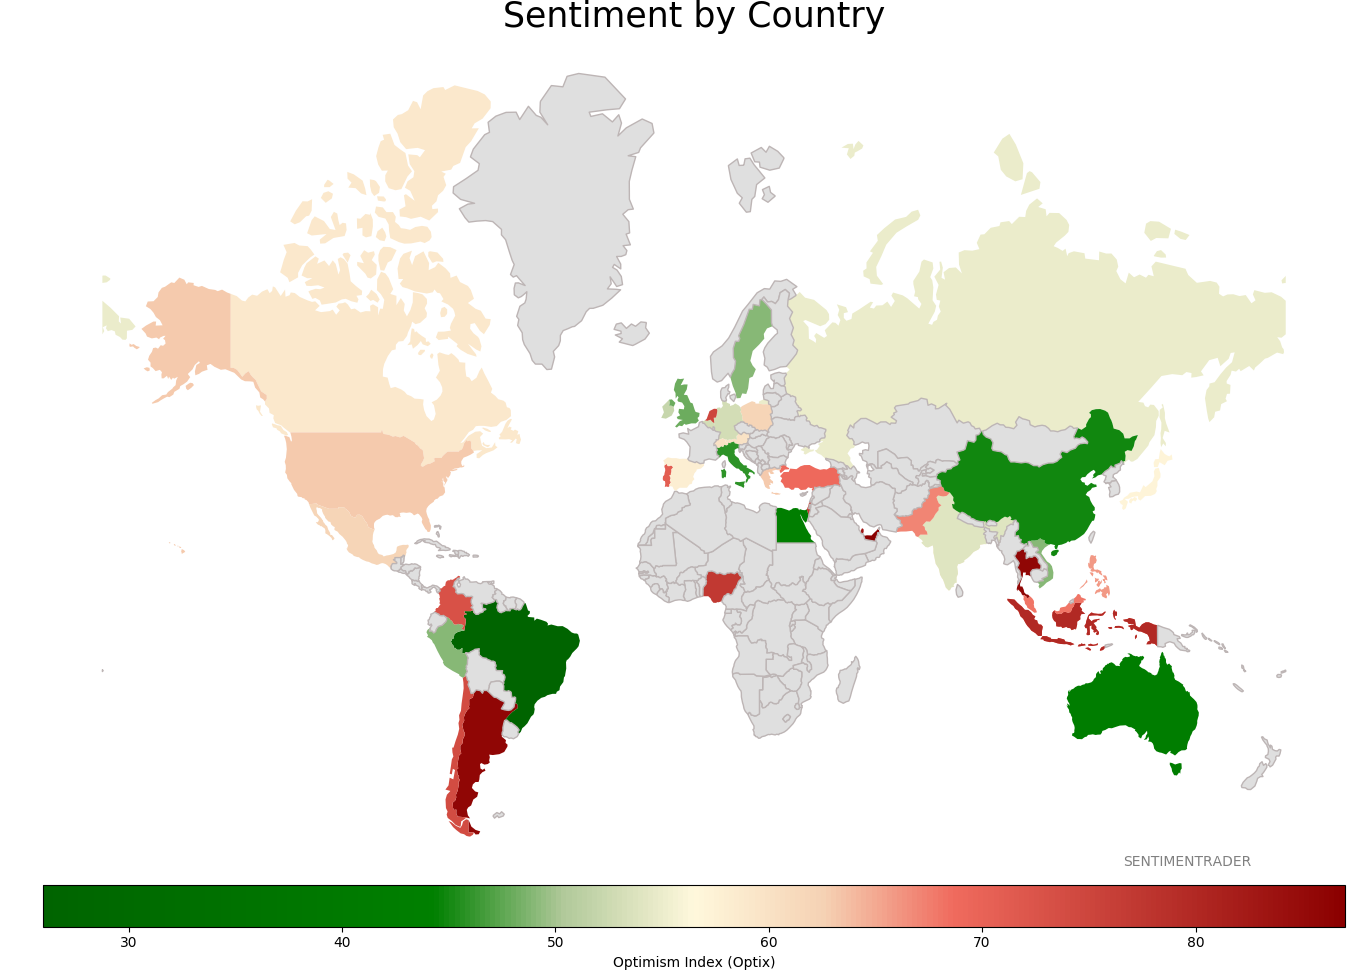
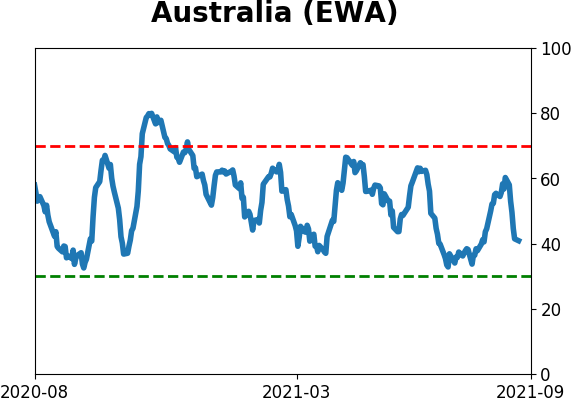
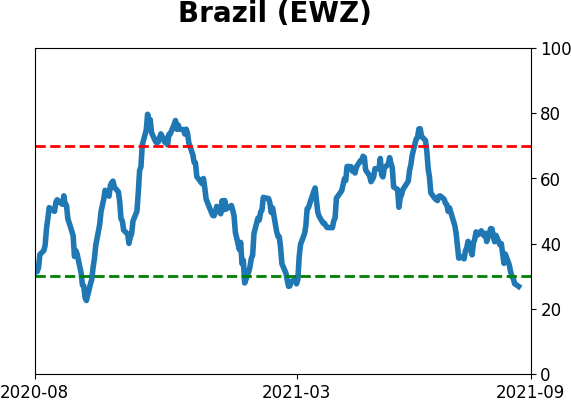
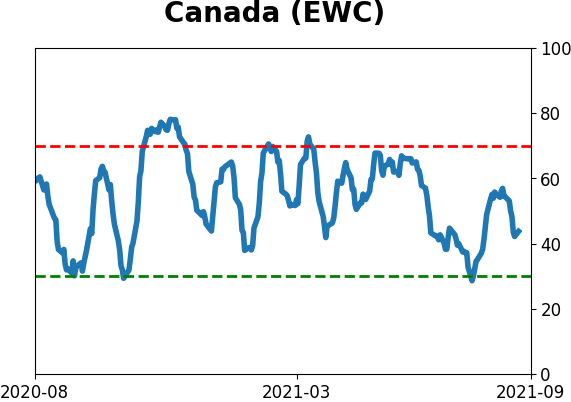
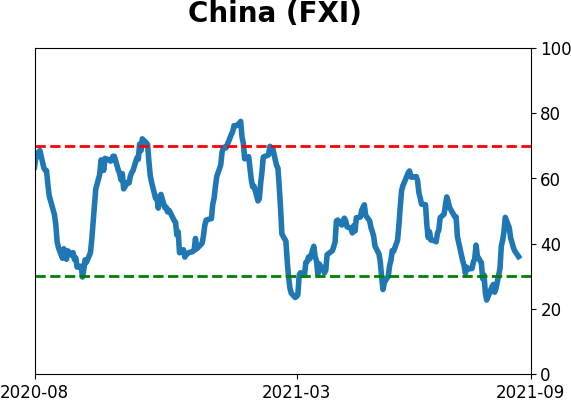
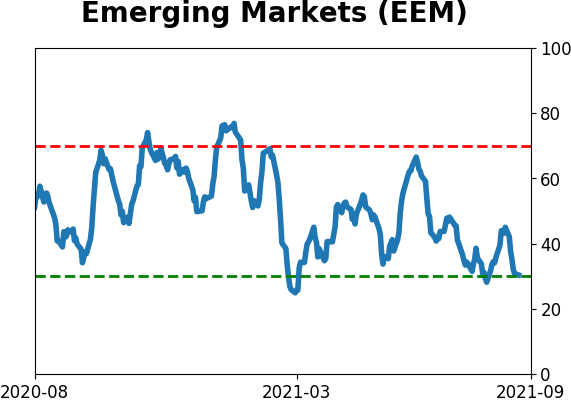
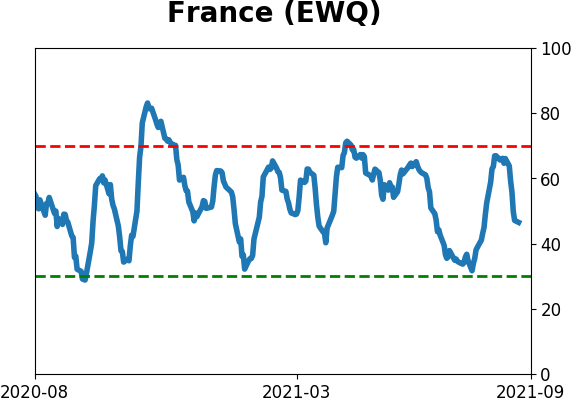
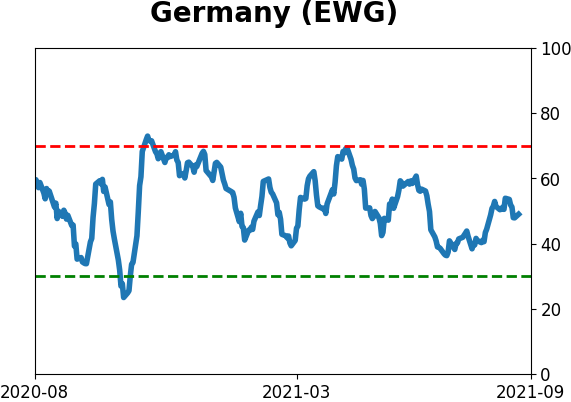
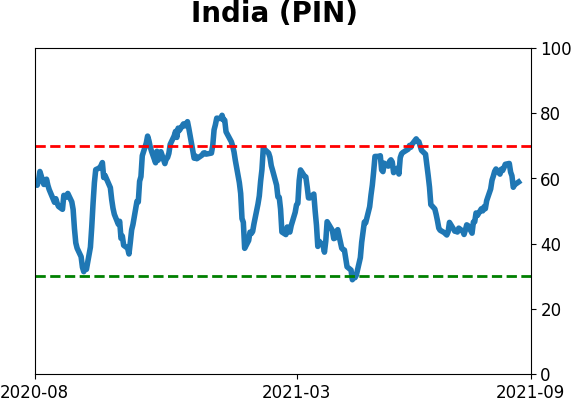
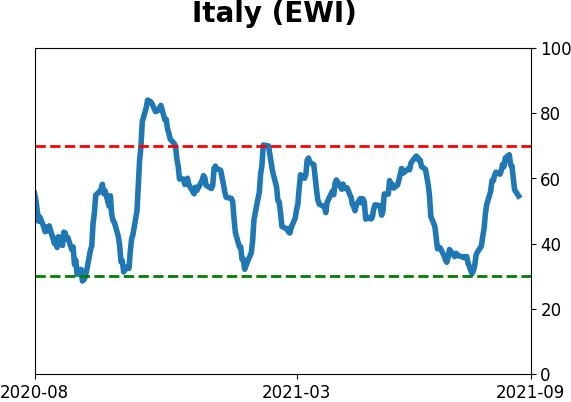
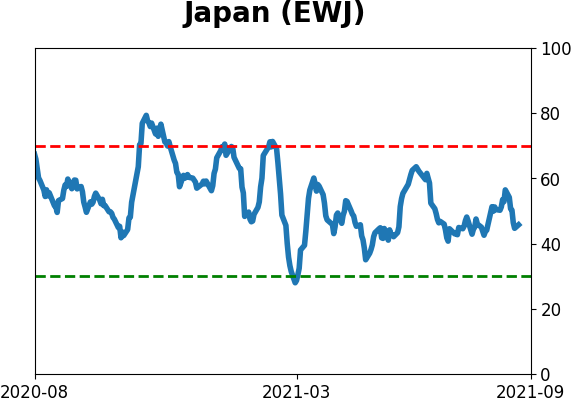
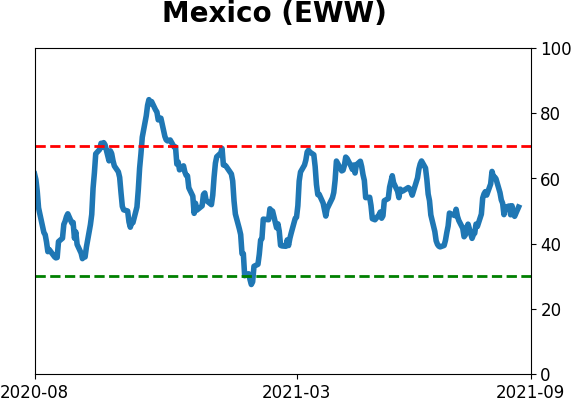
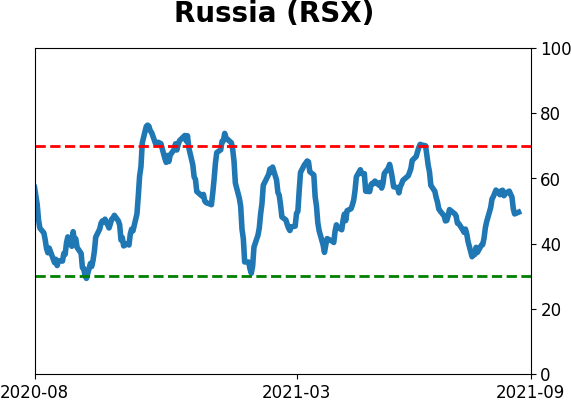
Sentiment Around The World
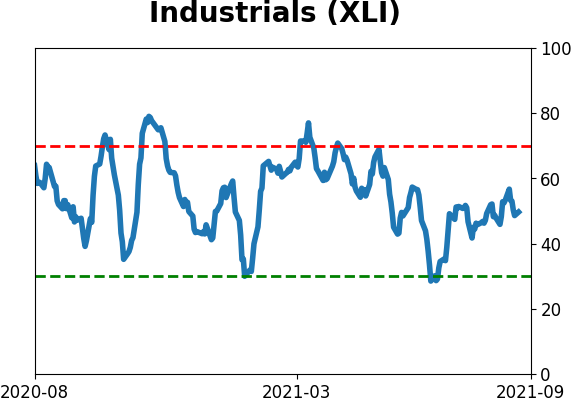
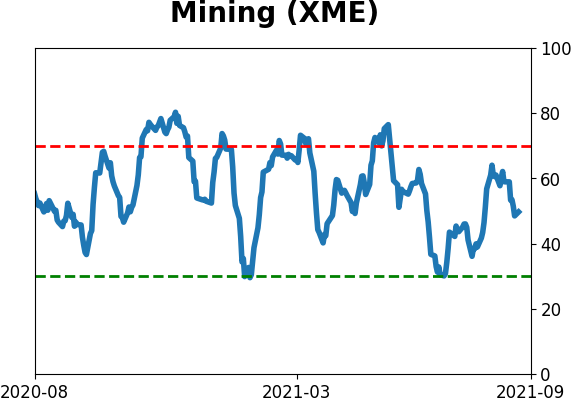
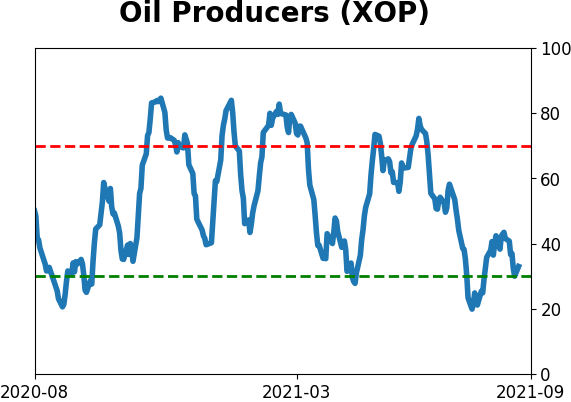
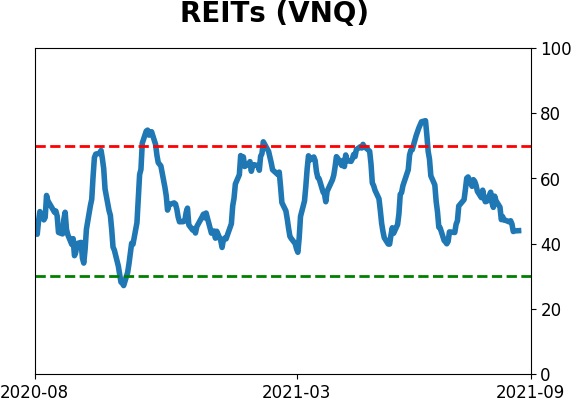
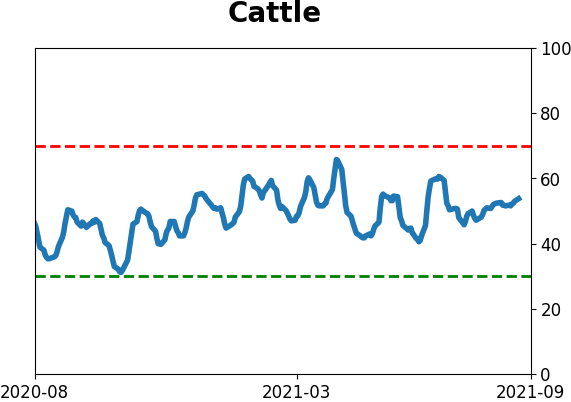
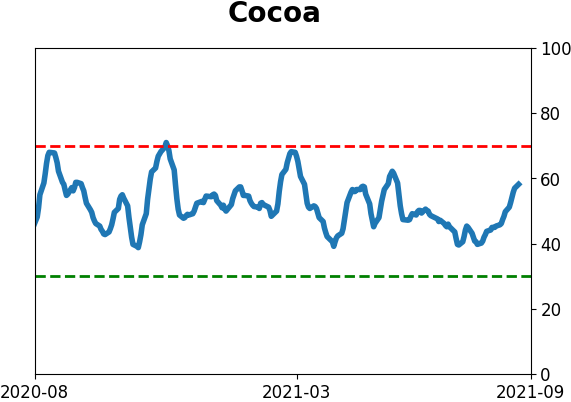
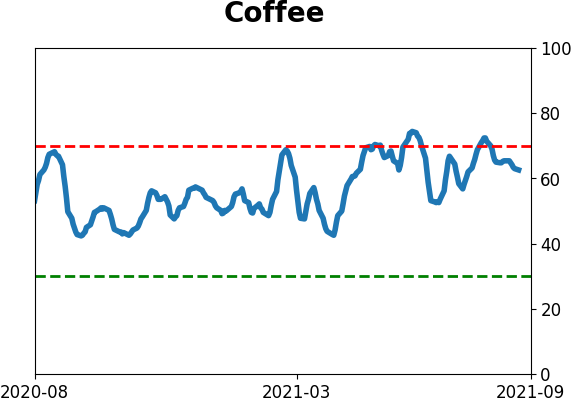
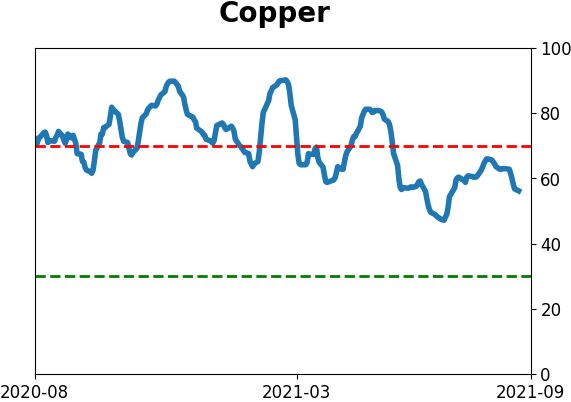
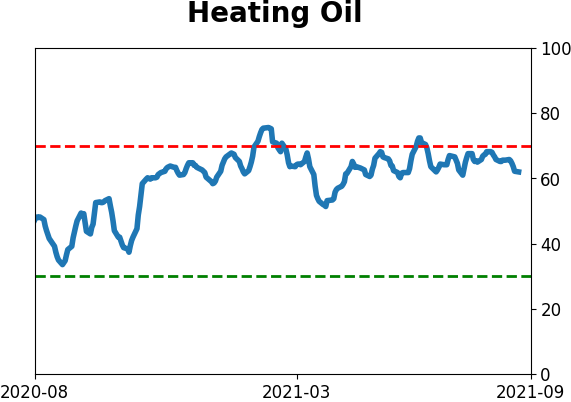
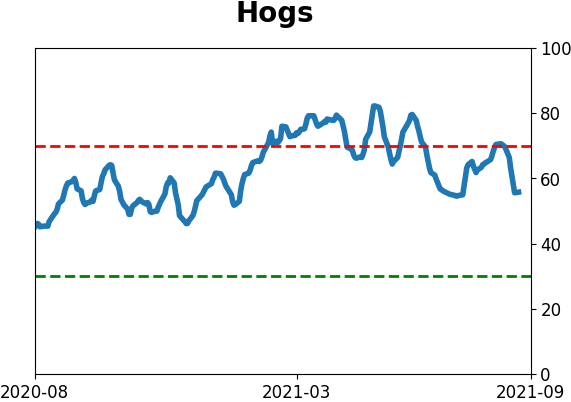
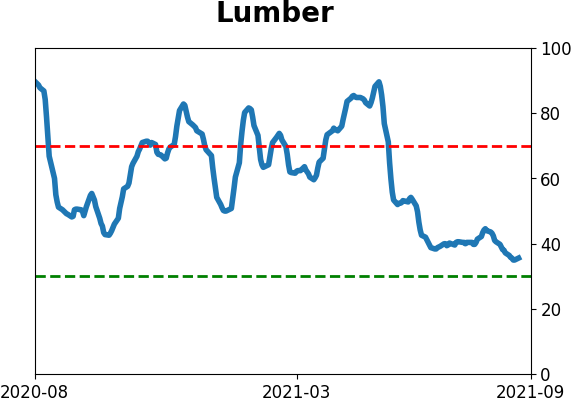
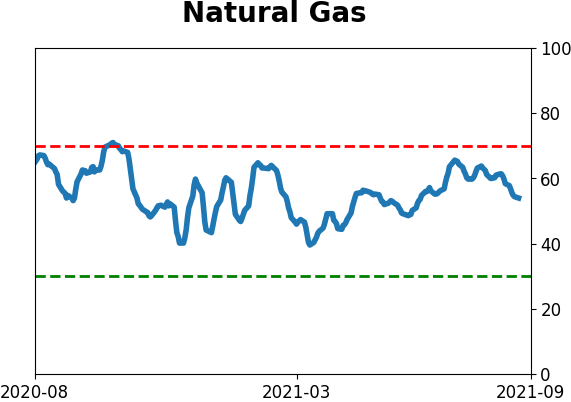
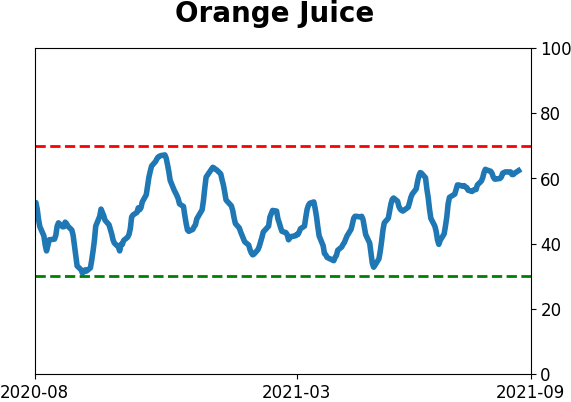
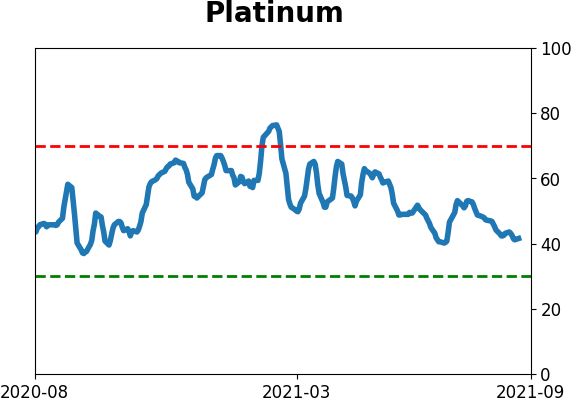
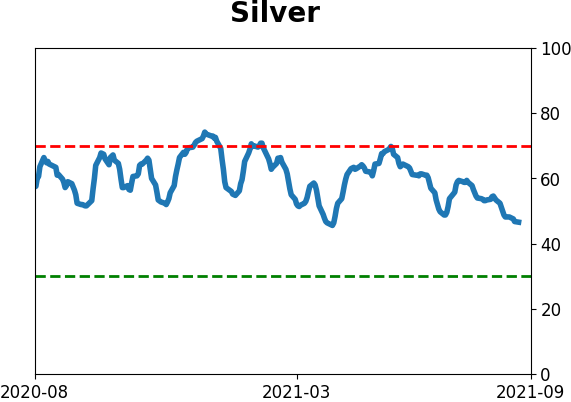
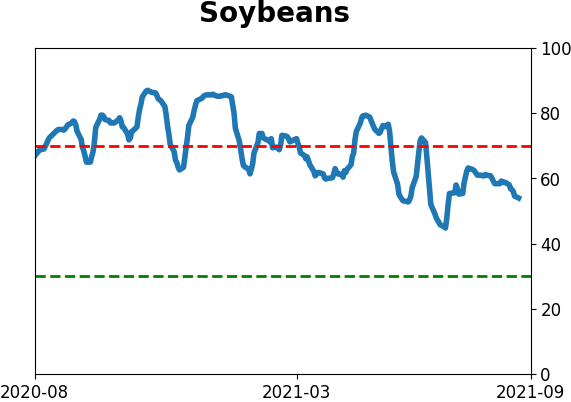
Optimism Index Thumbnails
|
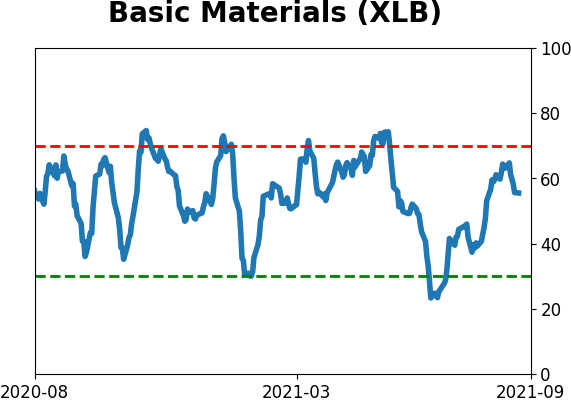
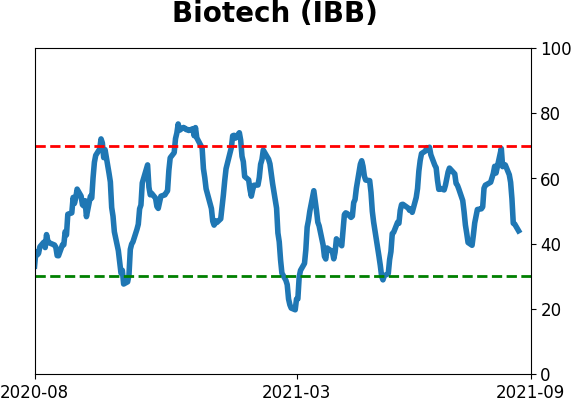
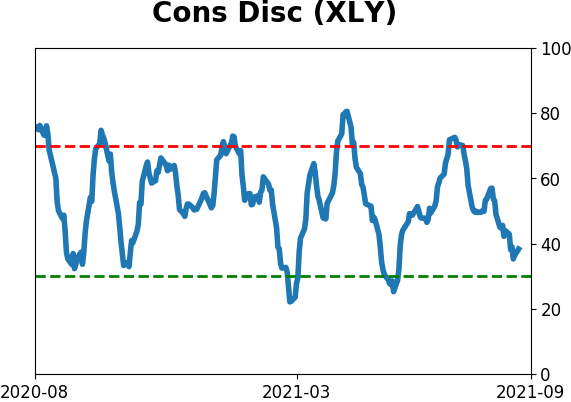
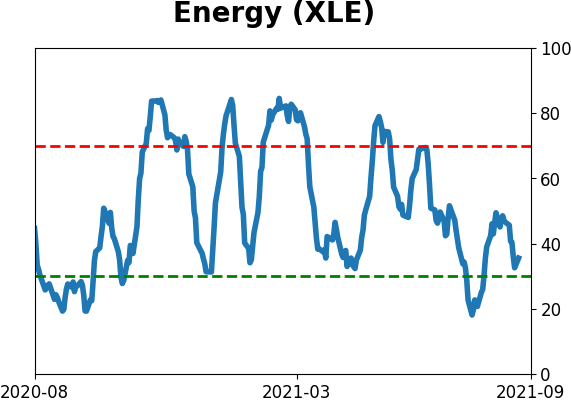
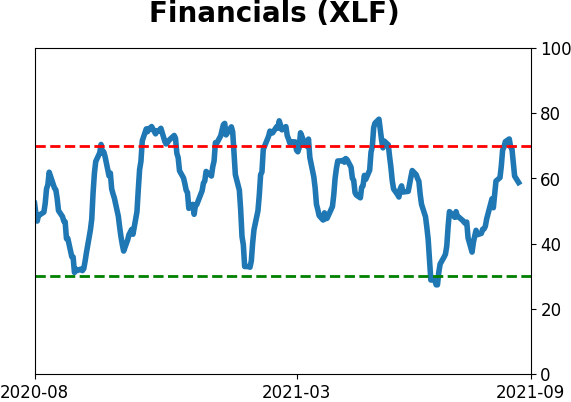
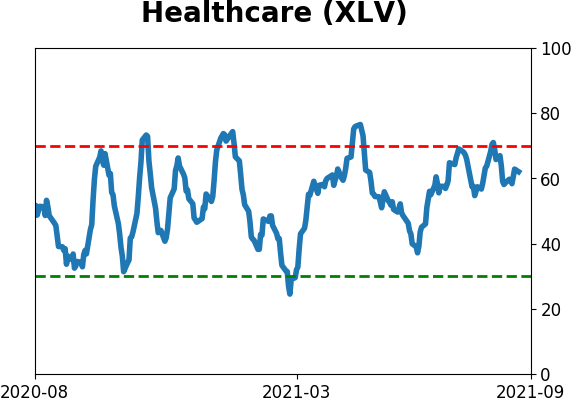
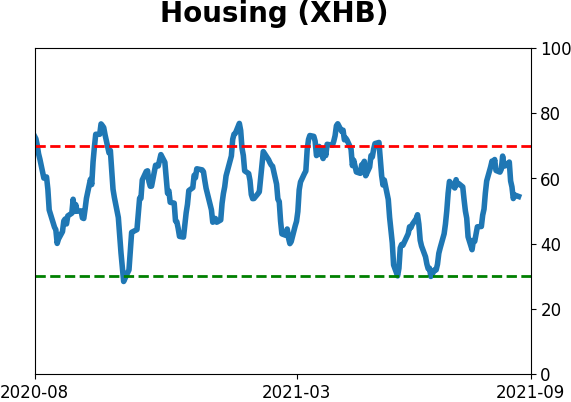
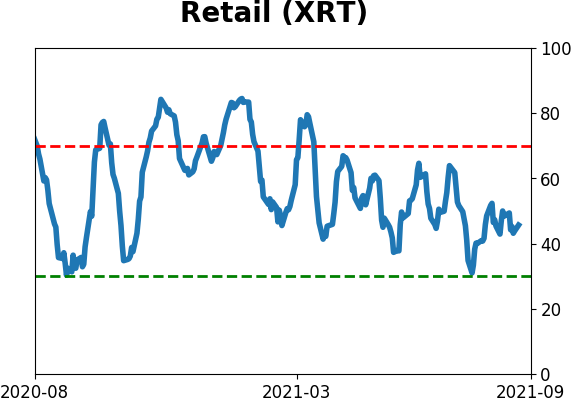
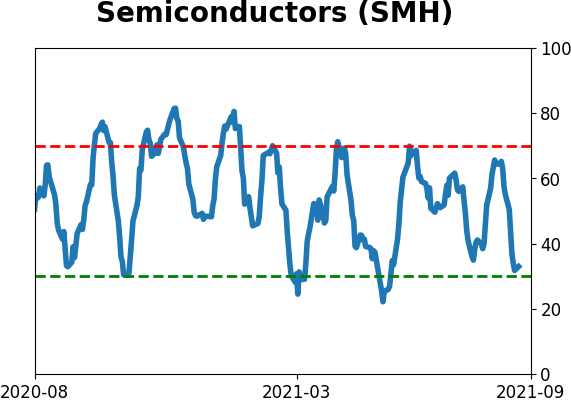
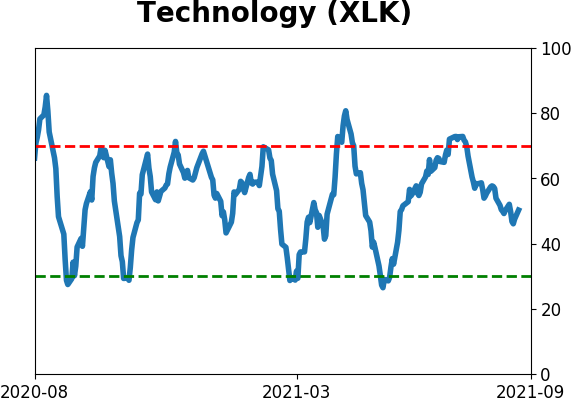
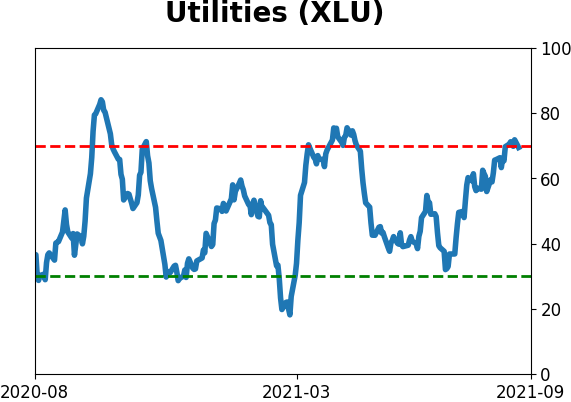
Sector ETF's - 10-Day Moving Average
|
|
|
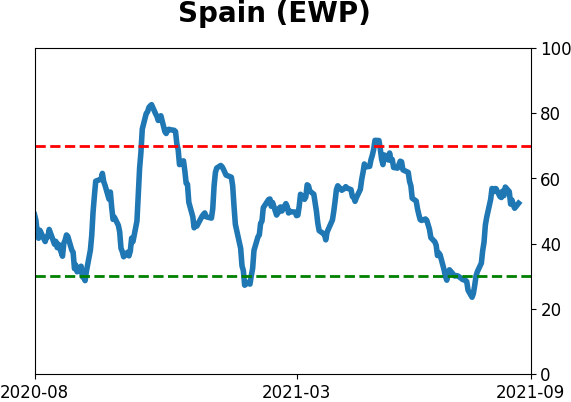
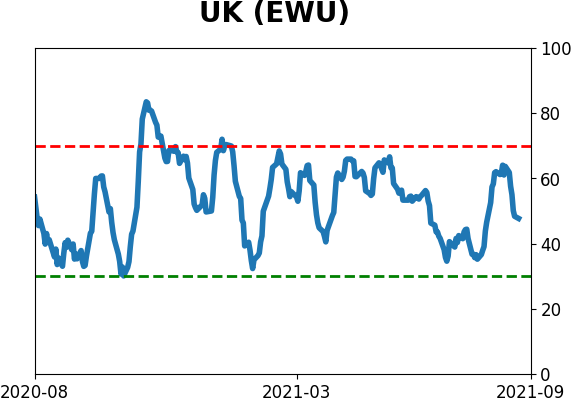
Country ETF's - 10-Day Moving Average
|
|
|
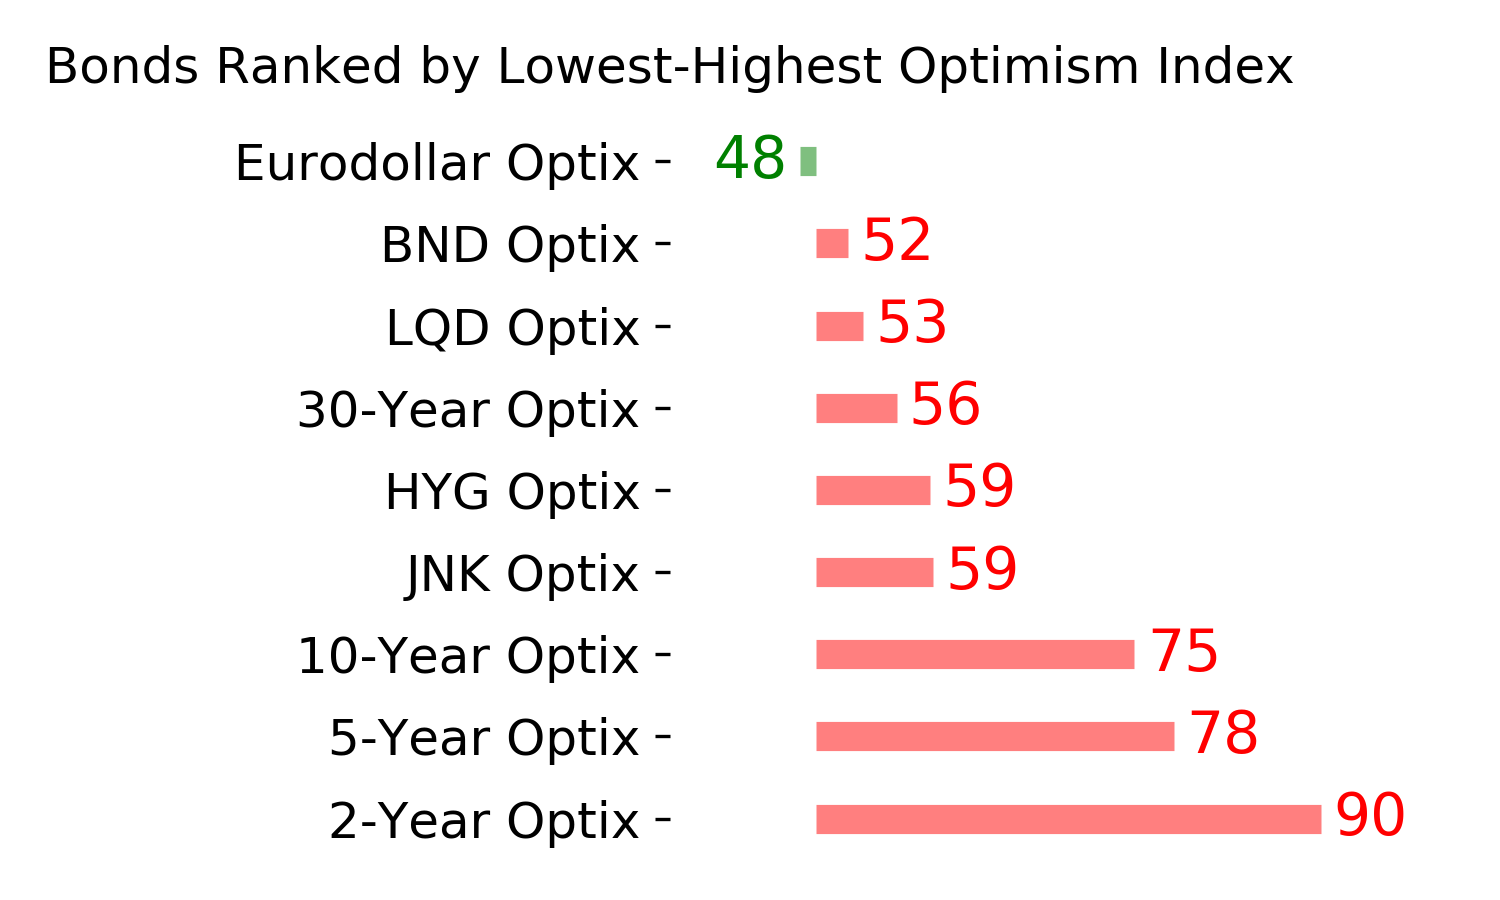
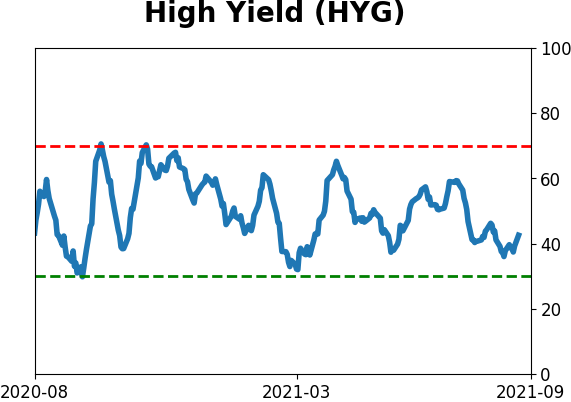
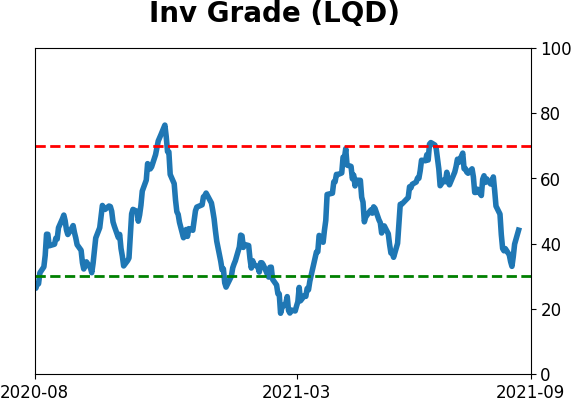
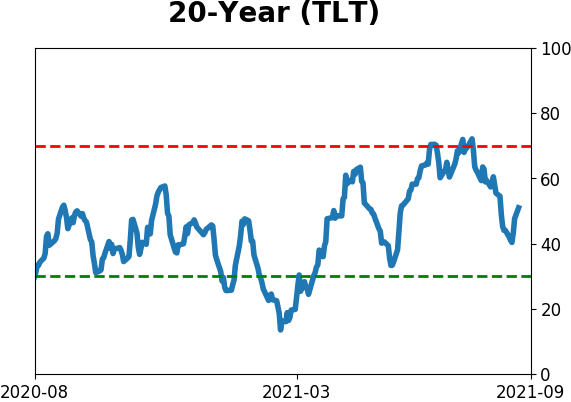
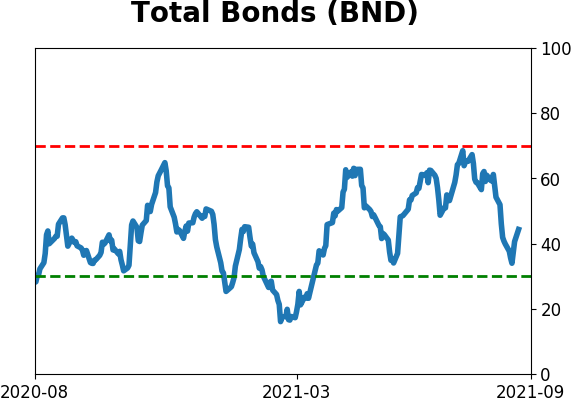
Bond ETF's - 10-Day Moving Average
|
|
|
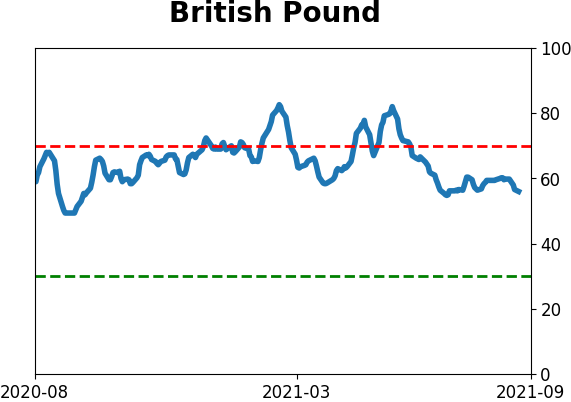
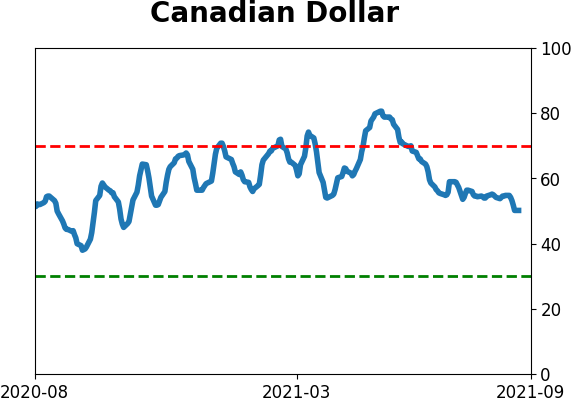
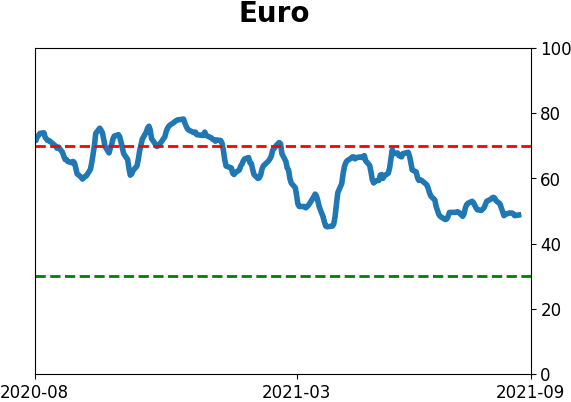
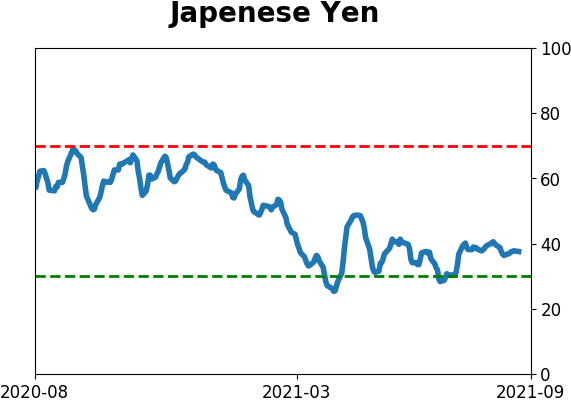
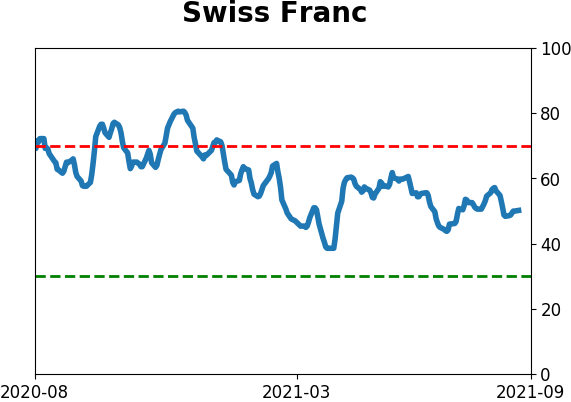
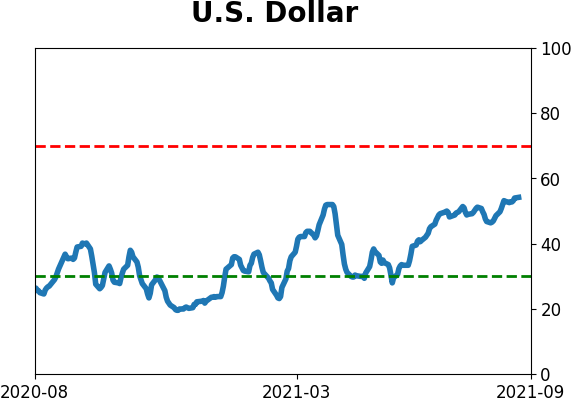
Currency ETF's - 5-Day Moving Average
|
|
|
Commodity ETF's - 5-Day Moving Average
|
|