Headlines
|
|
A Big Miss in a Strange Sentiment Situation:
The University of Michigan survey of Consumer Sentiment showed a stunning drop. Not only did it defy economists' expectations, it was abnormally low for a time when stocks have been doing so well.
Bottom Line:
See the Outlook & Allocations page for more details on these summaries STOCKS: Hold
The speculative frenzy in February is wrung out. Internal dynamics have mostly held up, with some exceptions. Many of our studies still show a mixed to poor short-term view, with medium- and long-term ones turning more positive. BONDS: Hold
Various parts of the market got hit in March, with the lowest Bond Optimism Index we usually see during healthy environments. After a shaky couple of weeks, the broad bond market has modestly recovered. Not a big edge here either way. GOLD: Hold
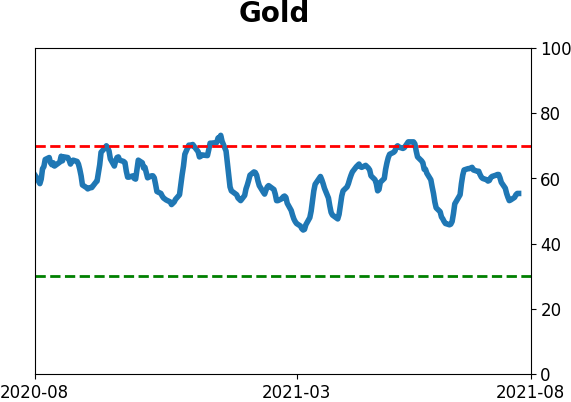
Gold and miners have done very well, recovering above long-term trend lines. The issue is that both have tended to perform poorly after similar situations - will have to wait and see how it plays out.
|
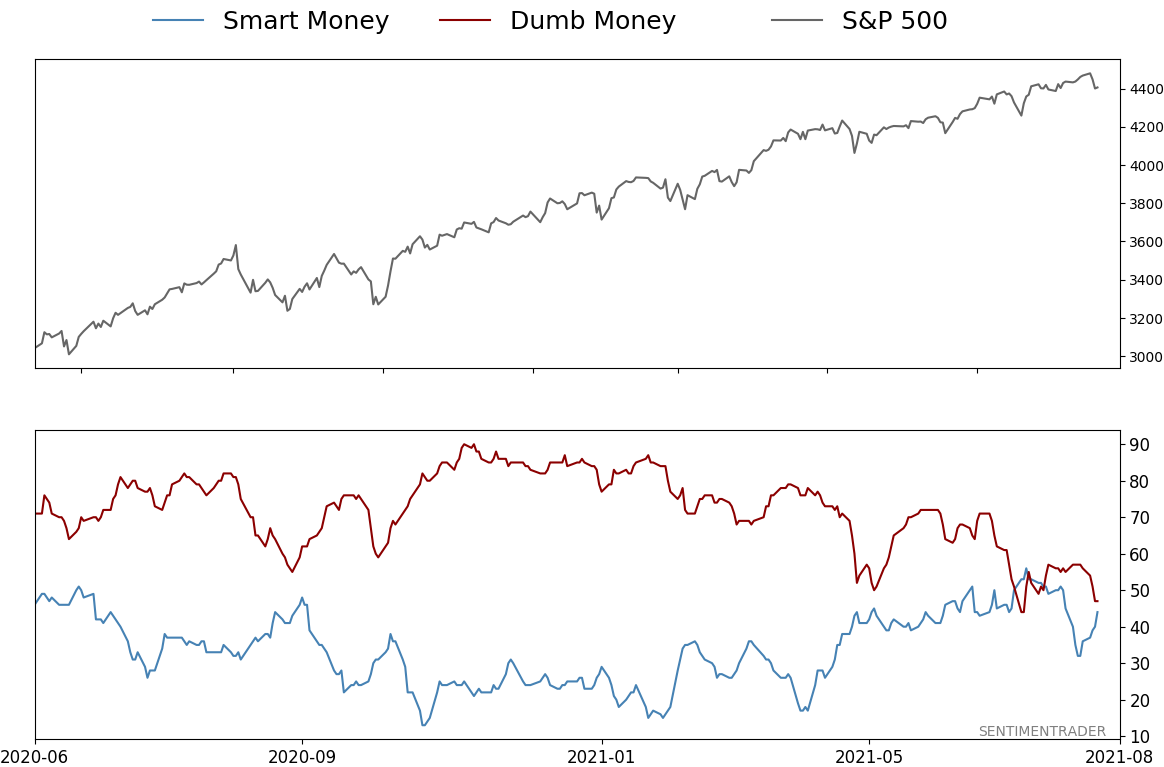
Smart / Dumb Money Confidence
|
Smart Money Confidence: 44%
Dumb Money Confidence: 47%
|
|
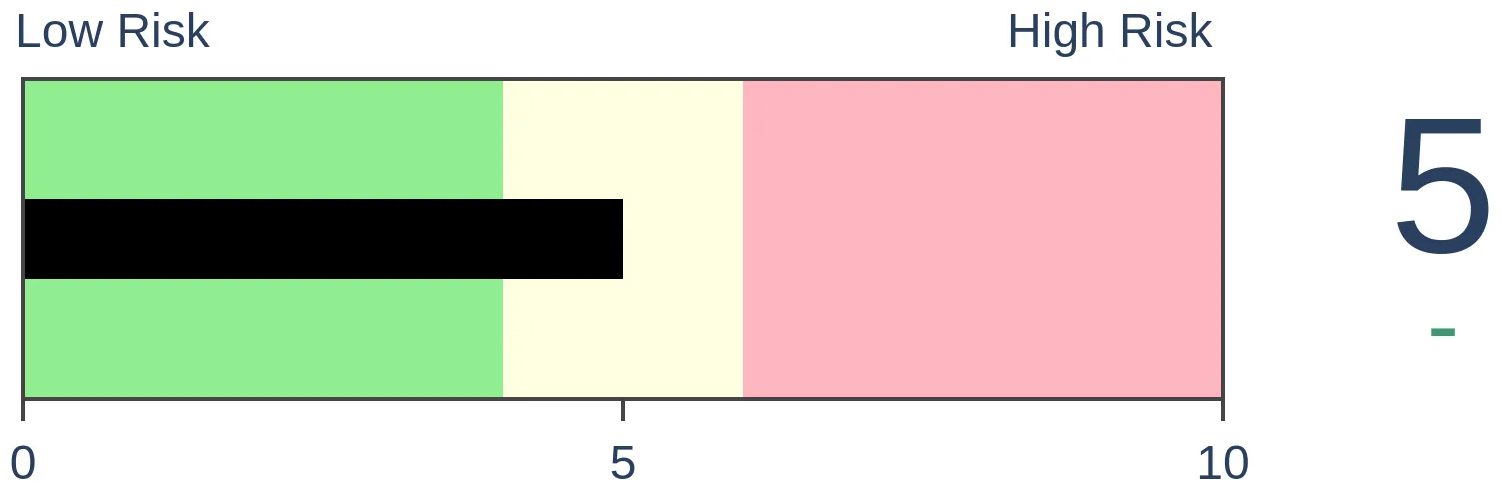
Risk Levels
Stocks Short-Term

|
Stocks Medium-Term

|
|
Bonds

|
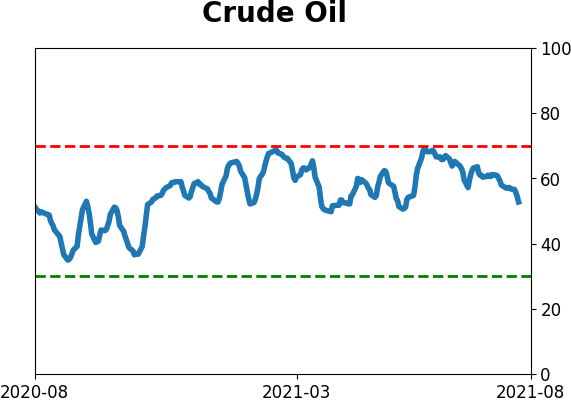
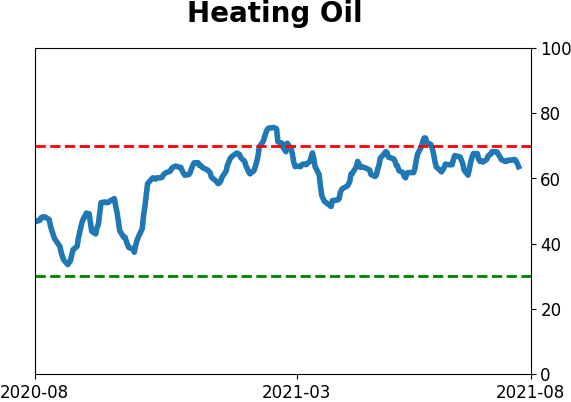
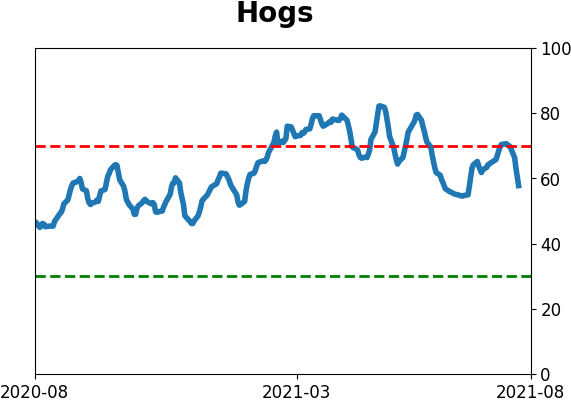
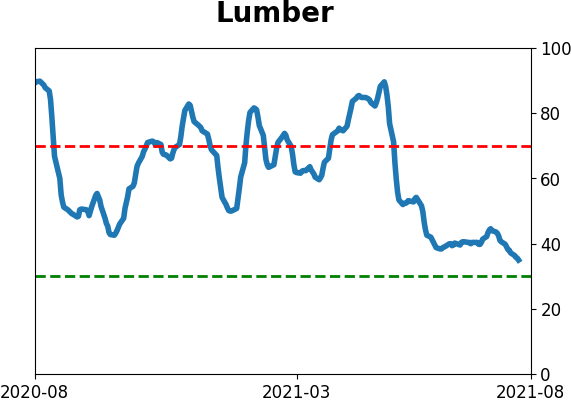
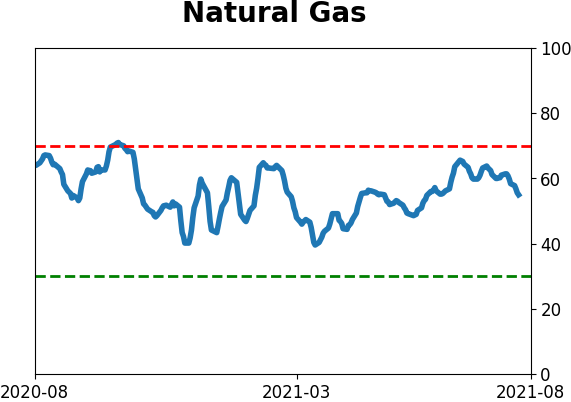
Crude Oil
|
|
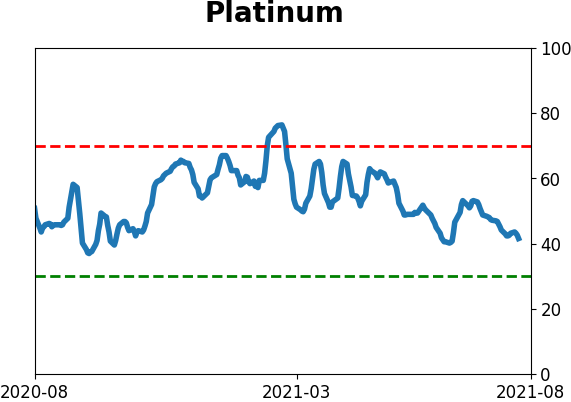
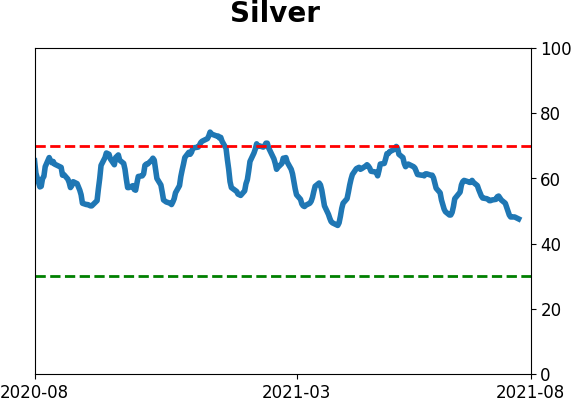
Gold
|
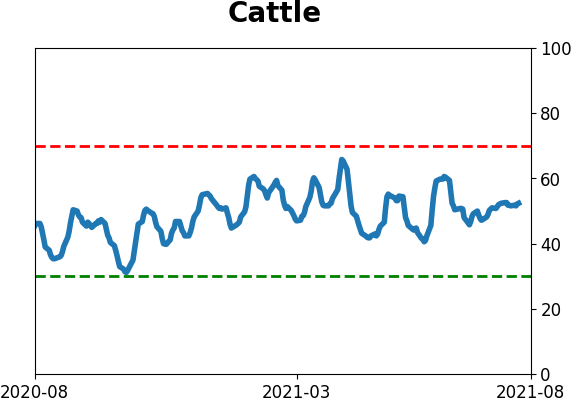
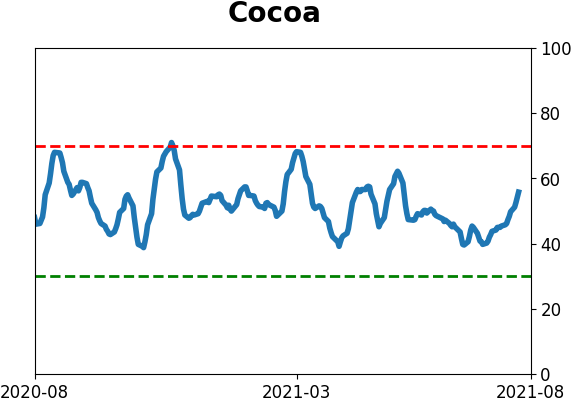
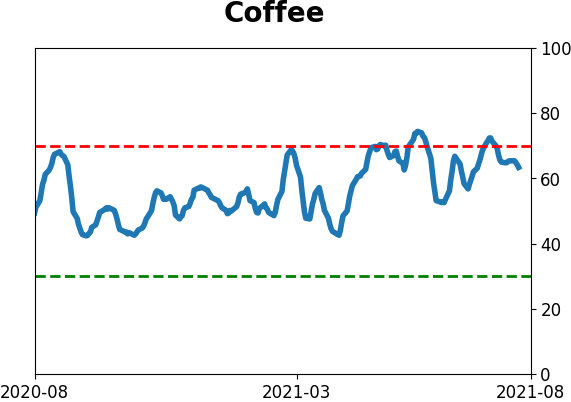
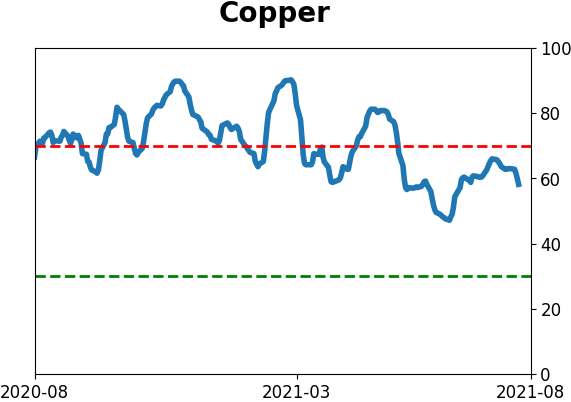
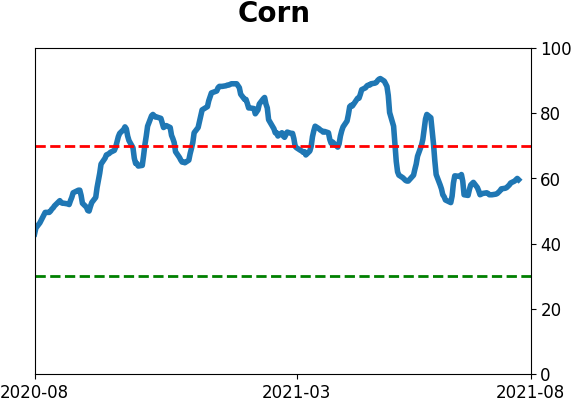
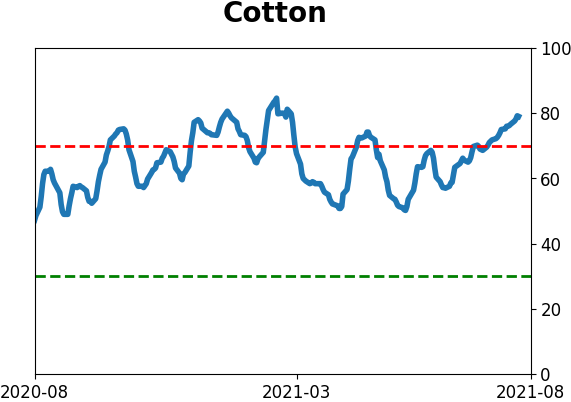
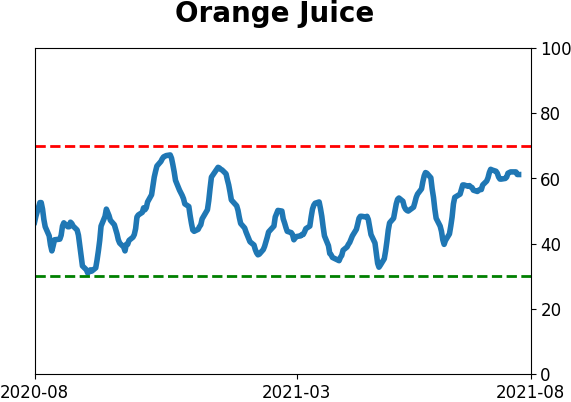
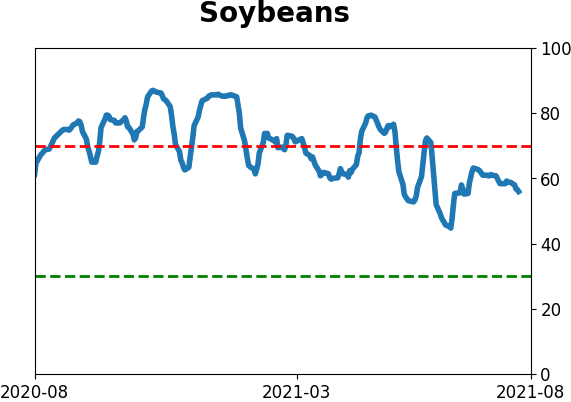
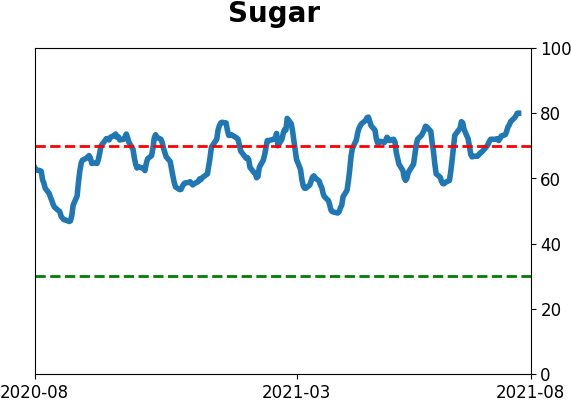
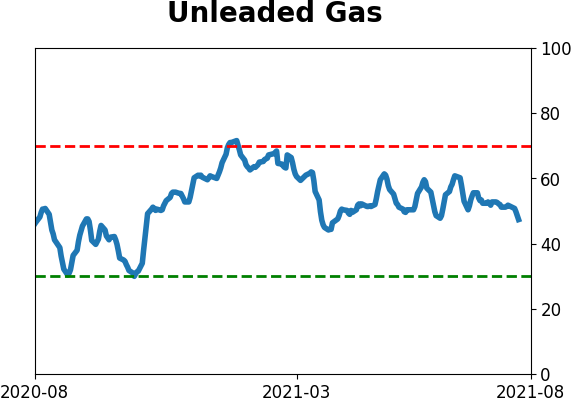
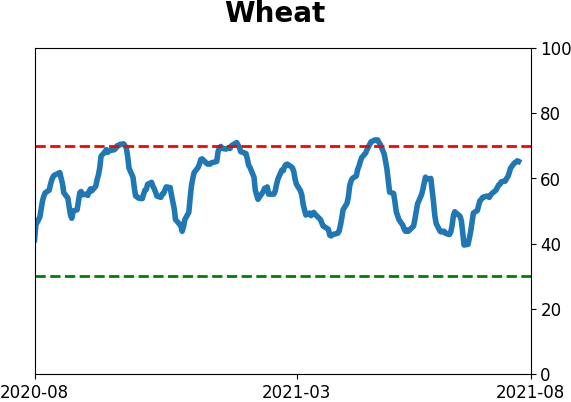
Agriculture

|
|
Research
By Jason Goepfert
BOTTOM LINE
The University of Michigan survey of Consumer Sentiment showed a stunning drop. Not only did it defy economists' expectations, it was abnormally low for a time when stocks have been doing so well.
FORECAST / TIMEFRAME
None
|
Politics is playing havoc with how people feel about everyday life, and it's even overriding how they usually feel about topics that aren't necessarily as influenced by our representatives.
The preliminary Consumer Sentiment survey for August by the University of Michigan showed a stunning drop. Not only is the survey relatively low, but it was also the biggest miss in 20 years relative to economists' expectations. Granted, this could change substantially when the official reading is released in a couple of weeks. We wouldn't normally even discuss it, but we've gotten quite a few questions about market performance after readings like this.
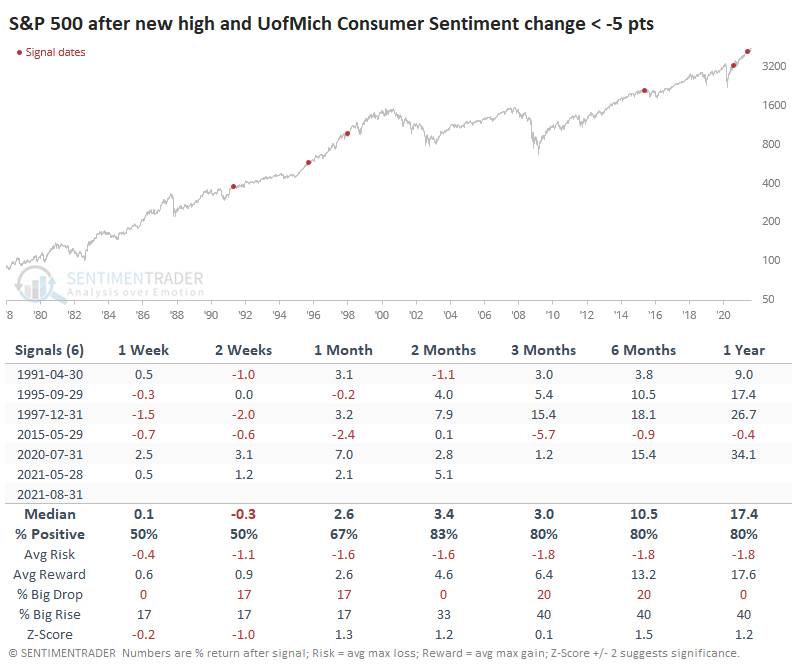
ONE OF THE ODDEST READINGS IN 40 YEARS
This is an abnormally low reading given how the S&P 500 has fared over the past year. There is a positive correlation between the 12-month rate of change in the S&P and the Consumer Sentiment readings, and this month really stands out as an outlier.
Assuming the S&P doesn't completely fall apart in the coming weeks, this month's reading would be the 2nd-lowest all-time for any month when stocks closed at a 12-month closing high. Only December 1991 would have a lower reading.
A low Consumer Sentiment reading during a month when the S&P closed at a new high tended to be a good sign. We DO NOT yet know if this will trigger this month. It's just a preliminary reading, and the S&P may not close at a record high if it stumbles in the next couple of weeks.
Across all time frames, the S&P's returns were above average, with a very good risk/reward ratio. Losses were minimal, and a year later, there were none of them. So, if the index holds up and if the final sentiment reading isn't adjusted too much, this should be a long-term positive.
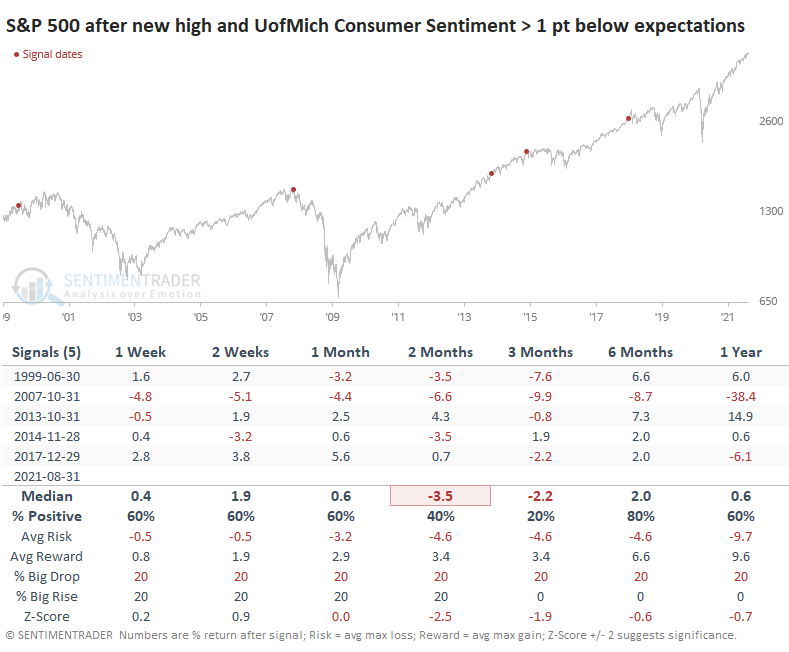
A BIG CHANGE, AND A BIG MISS
It was also a good sign when the survey showed a large drop from the prior month despite a new high in stocks.
Again, the S&P showed above-average returns across most time frames, with only minor risk, though the sample size is painfully small.
One caveat is that returns were poor when Sentiment dropped significantly below economists' expectations despite a market making new highs. We should read as much into this one as the figures may change substantially once the final results are released at the end of the month.
This is a messy, muddled market. Price trends in the major indexes show exemplary consistency, the kind of thing that tends to persist. But broader breadth measures haven't been able to keep up, and they're showing some strain. Buyers are showing less and less "oomph" with every push to new highs and counter to knee-jerk contrarian theory, this tends not to be a good thing.
We've highlighted clusters of negatives a handful of times since the start of the year, and all of them have failed, at least when using the S&P 500 index as a benchmark. That shouldn't be ignored - we've shown many times in the past that when a market doesn't do what it "should" do, often there is a structural reason that will keep it going. So we're left with a hodgepodge of semi-compelling signs in both directions, which doesn't exactly inspire confidence for bulls or bears. Typically, this kind of condition would lead to a short- to medium-term drop with a longer-term recovery, but confidence is low right now to expect anything typical in 2021.
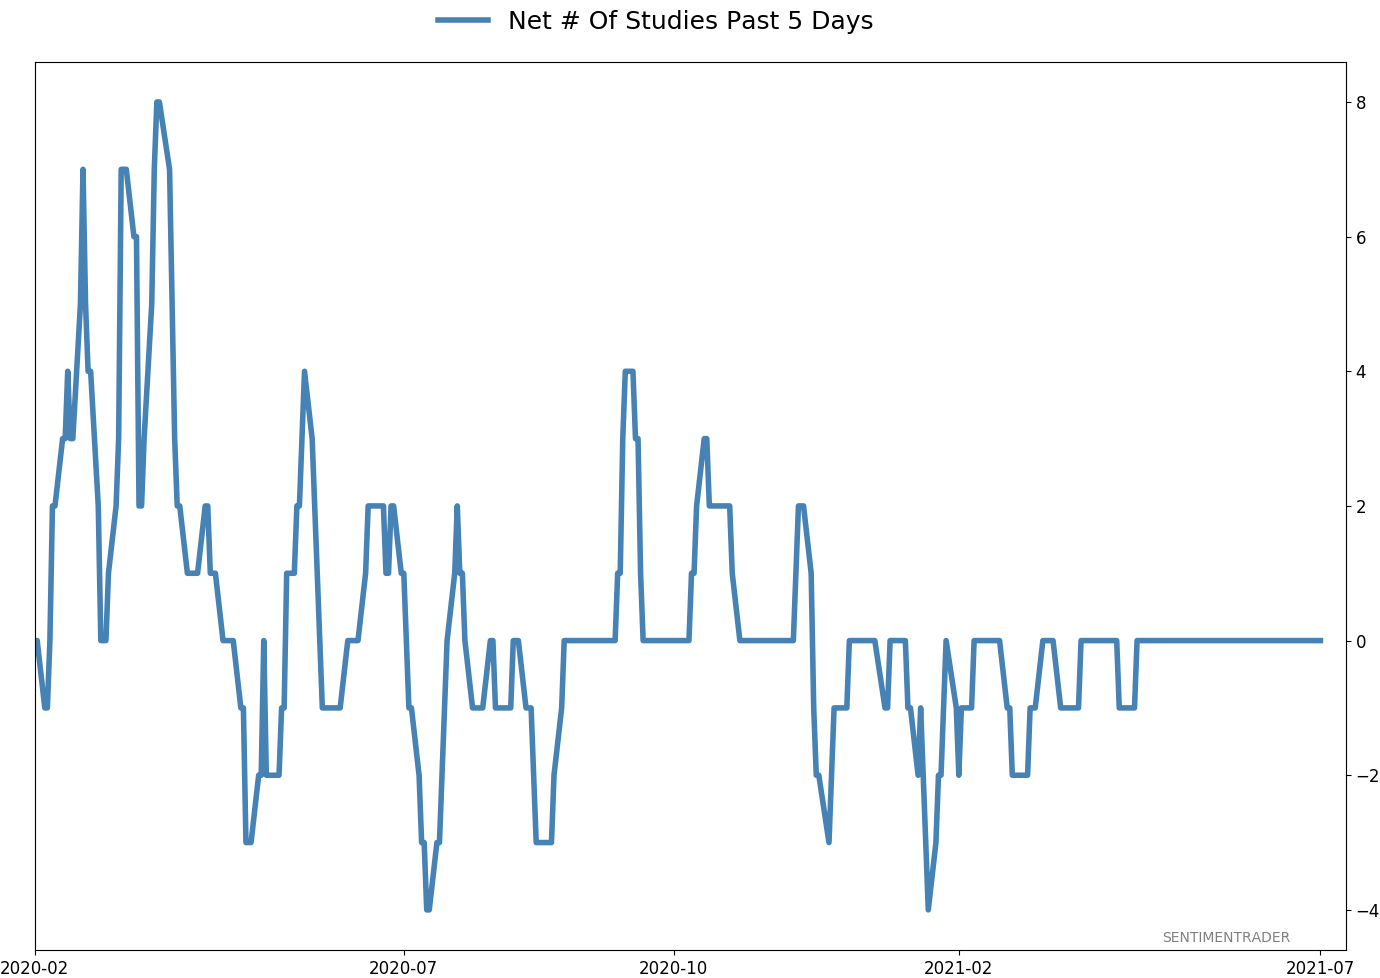
Active Studies
| Time Frame | Bullish | Bearish | | Short-Term | 0 | 4 | | Medium-Term | 4 | 3 | | Long-Term | 10 | 5 |
|
Indicators at Extremes
Portfolio
| Position | Description | Weight % | Added / Reduced | Date | | Stocks | RSP | 4.1 | Added 4.1% | 2021-05-19 | | Bonds | 23.9% BND, 6.9% SCHP | 30.7 | Reduced 7.1% | 2021-05-19 | | Commodities | GCC | 2.6 | Reduced 2.1%
| 2020-09-04 | | Precious Metals | GDX | 5.6 | Reduced 4.2% | 2021-05-19 | | Special Situations | 4.3% XLE, 2.2% PSCE | 7.6 | Reduced 5.6% | 2021-04-22 | | Cash | | 49.4 | | |
|
Updates (Changes made today are underlined)
Much of our momentum and trend work has remained positive for several months, with some scattered exceptions. Almost all sentiment-related work has shown a poor risk/reward ratio for stocks, especially as speculation drove to record highs in exuberance in February. Much of that has worn off, and most of our models are back toward neutral levels. There isn't much to be excited about here. The same goes for bonds and even gold. Gold has been performing well lately and is back above long-term trend lines. The issue is that it has a poor record of holding onto gains when attempting a long-term trend change like this, so we'll take a wait-and-see approach. RETURN YTD: 7.7% 2020: 8.1%, 2019: 12.6%, 2018: 0.6%, 2017: 3.8%, 2016: 17.1%, 2015: 9.2%, 2014: 14.5%, 2013: 2.2%, 2012: 10.8%, 2011: 16.5%, 2010: 15.3%, 2009: 23.9%, 2008: 16.2%, 2007: 7.8%
|
|
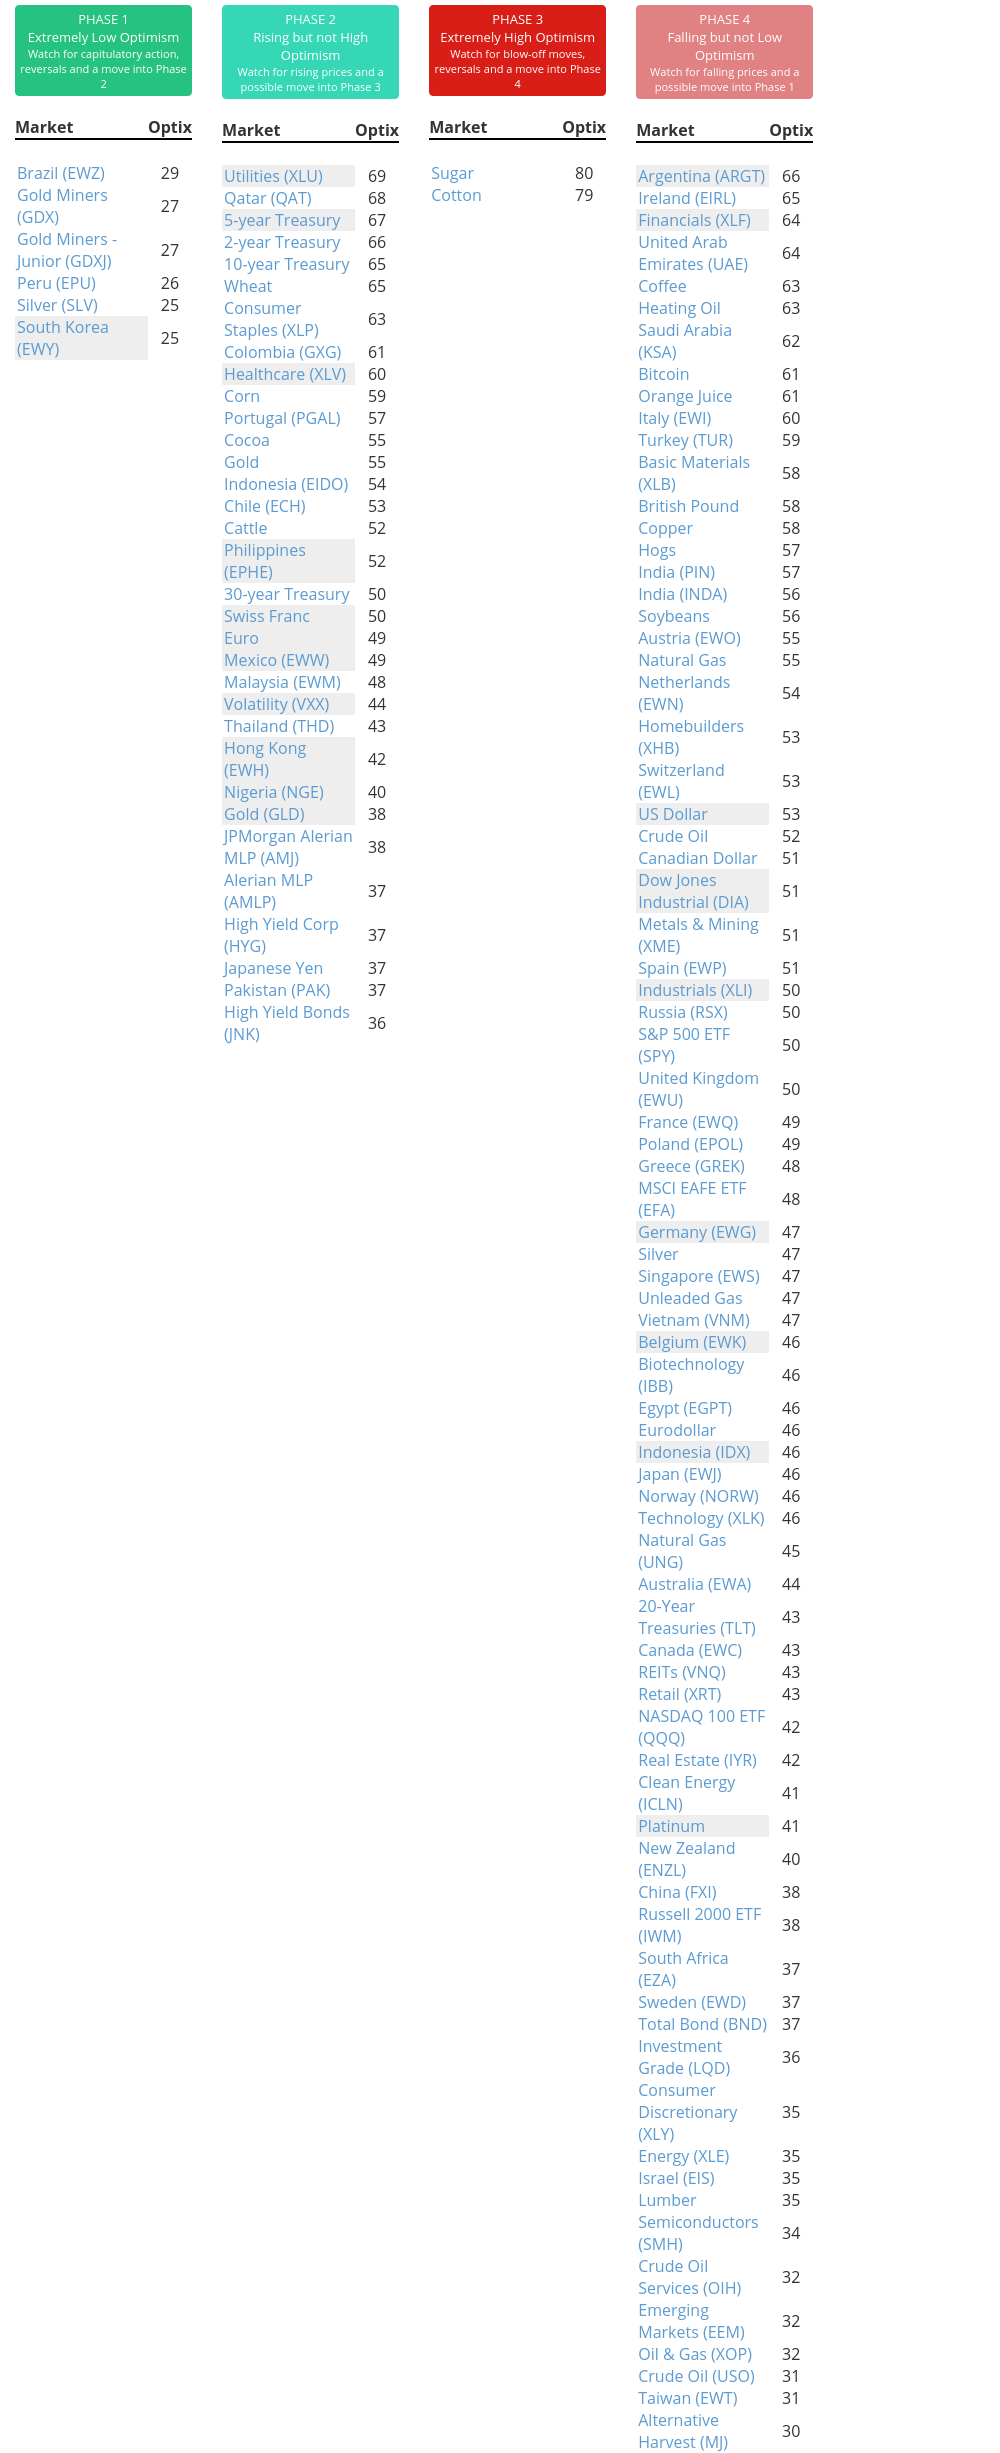
Phase Table
Ranks
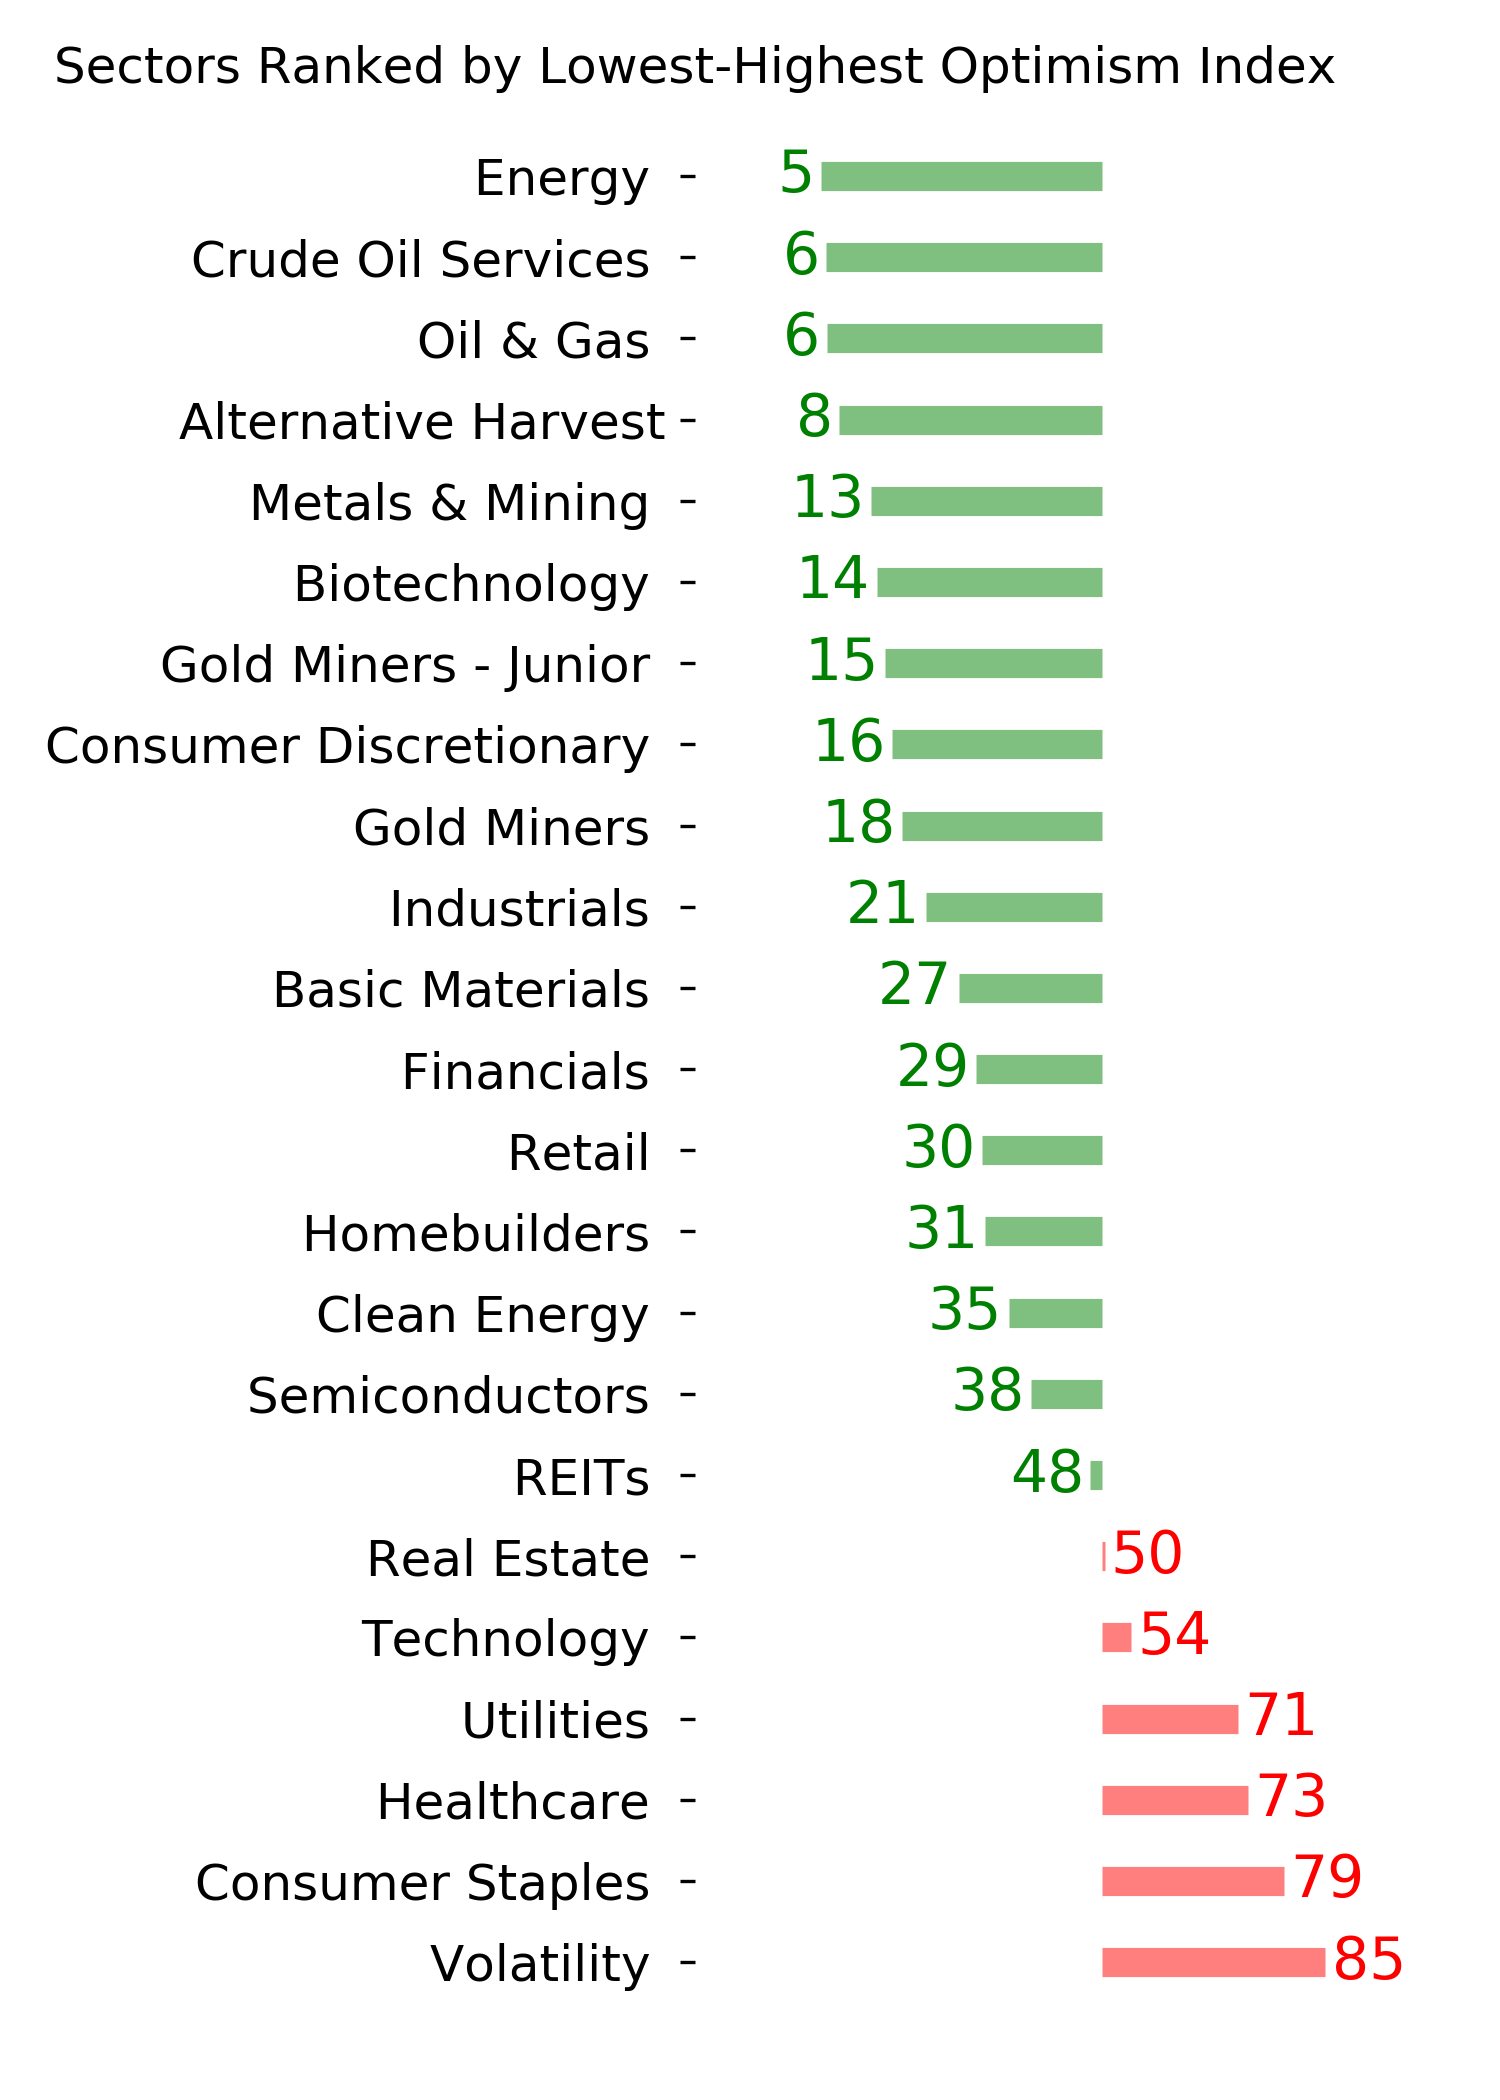
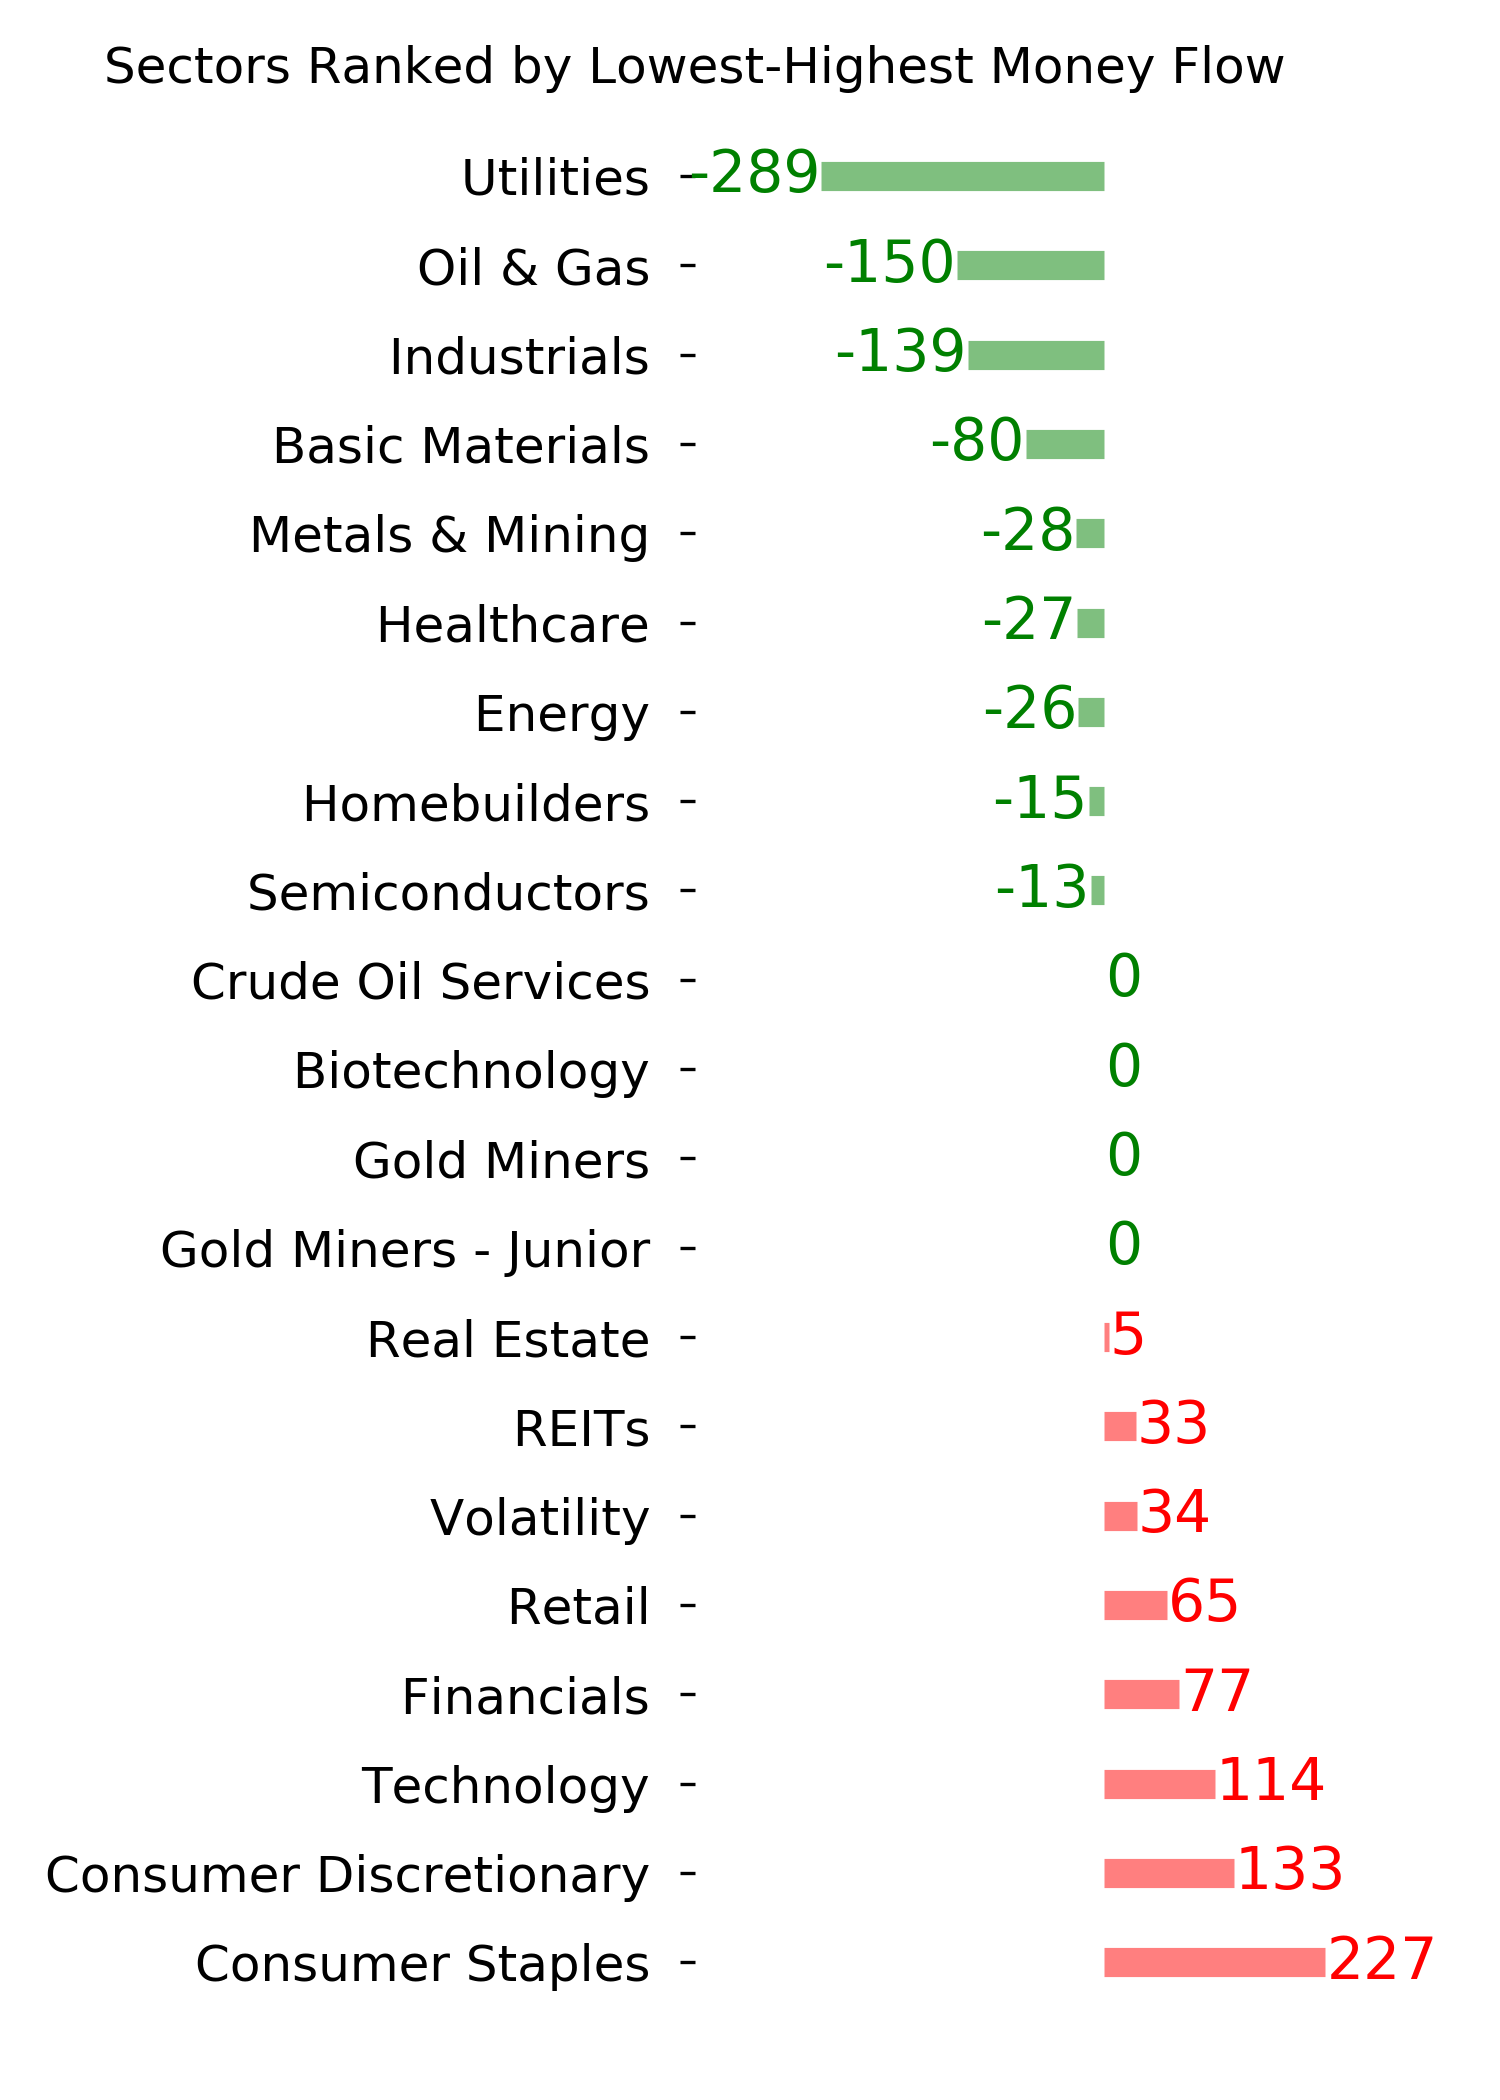
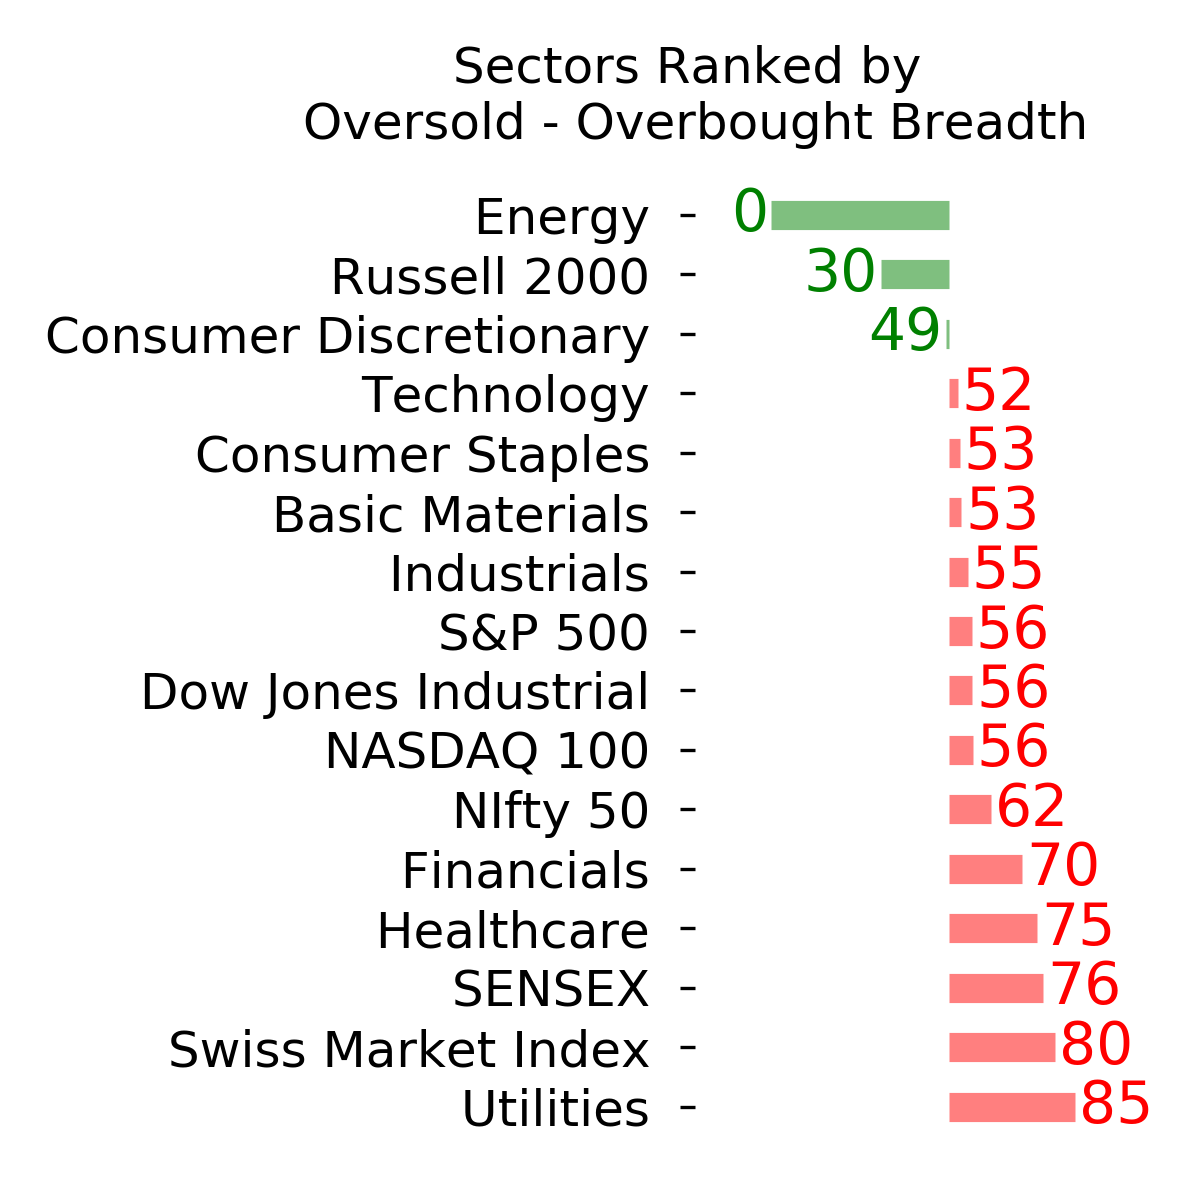
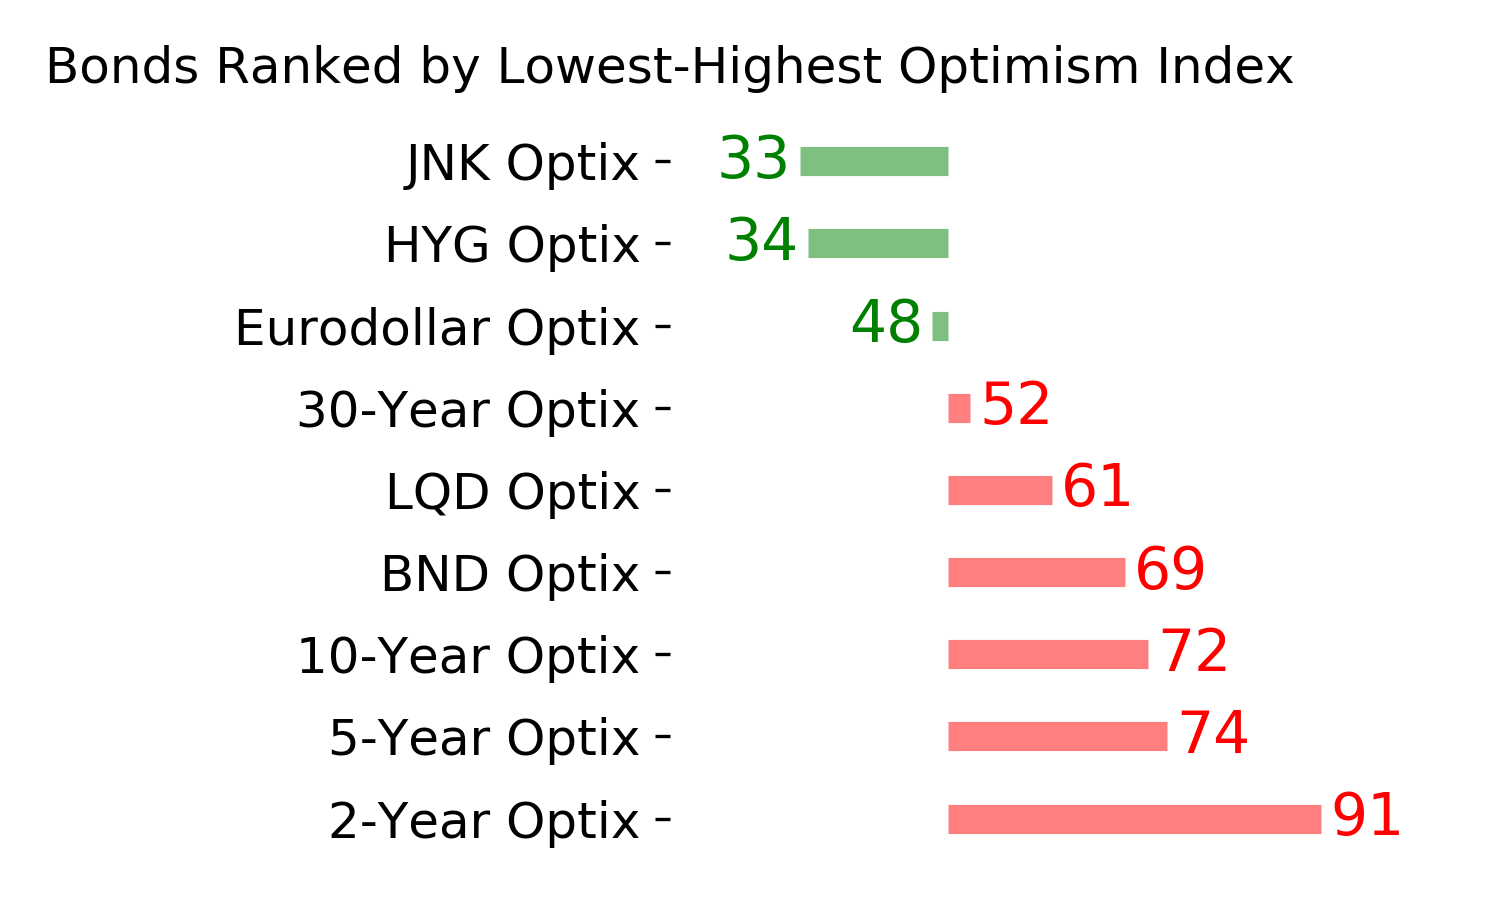
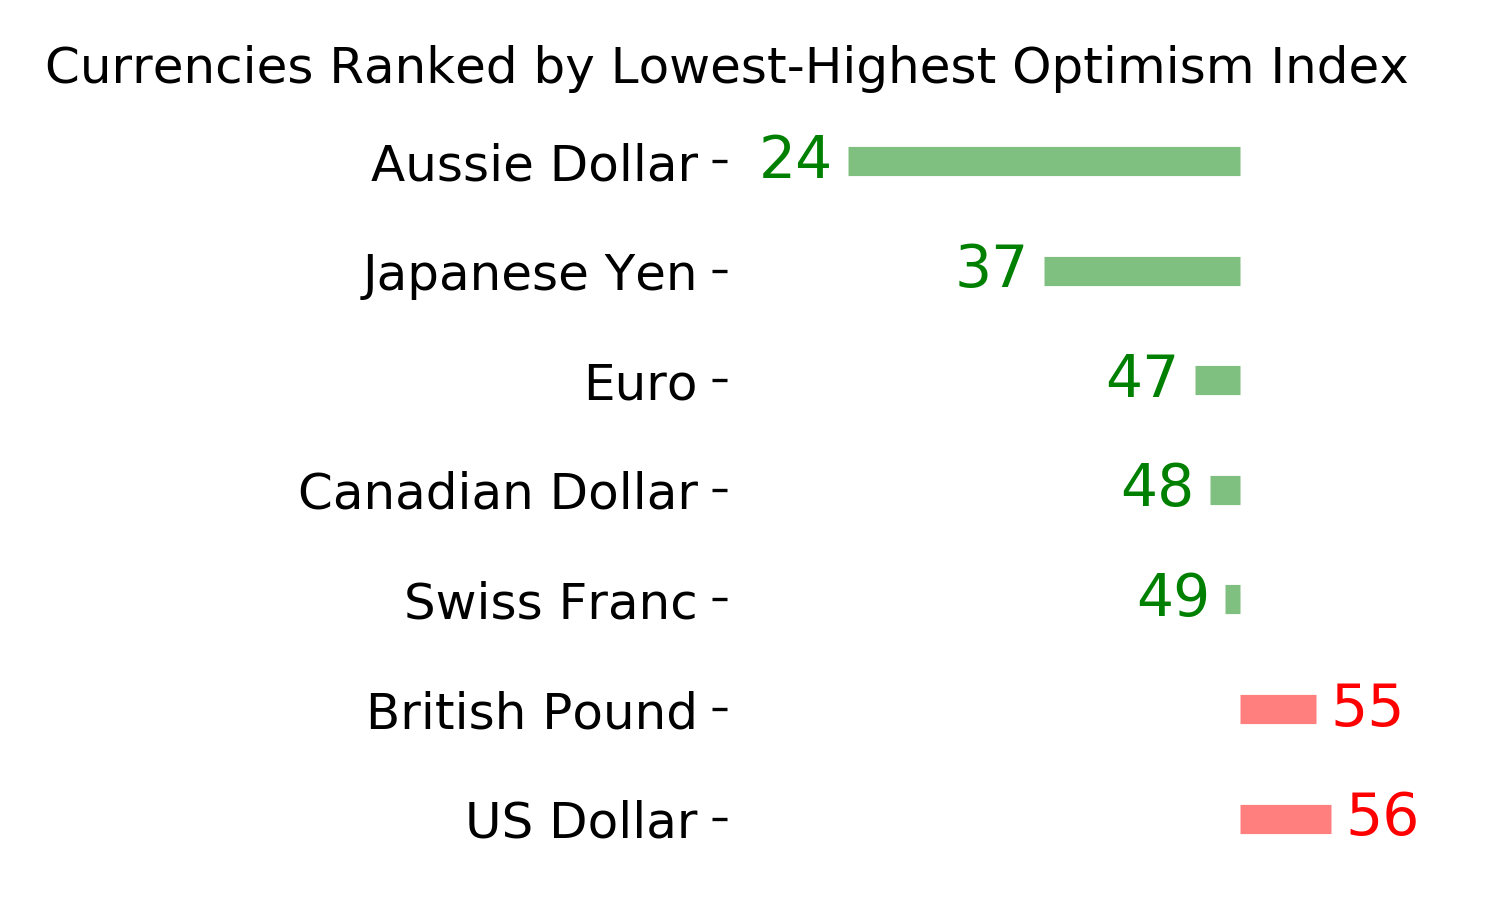
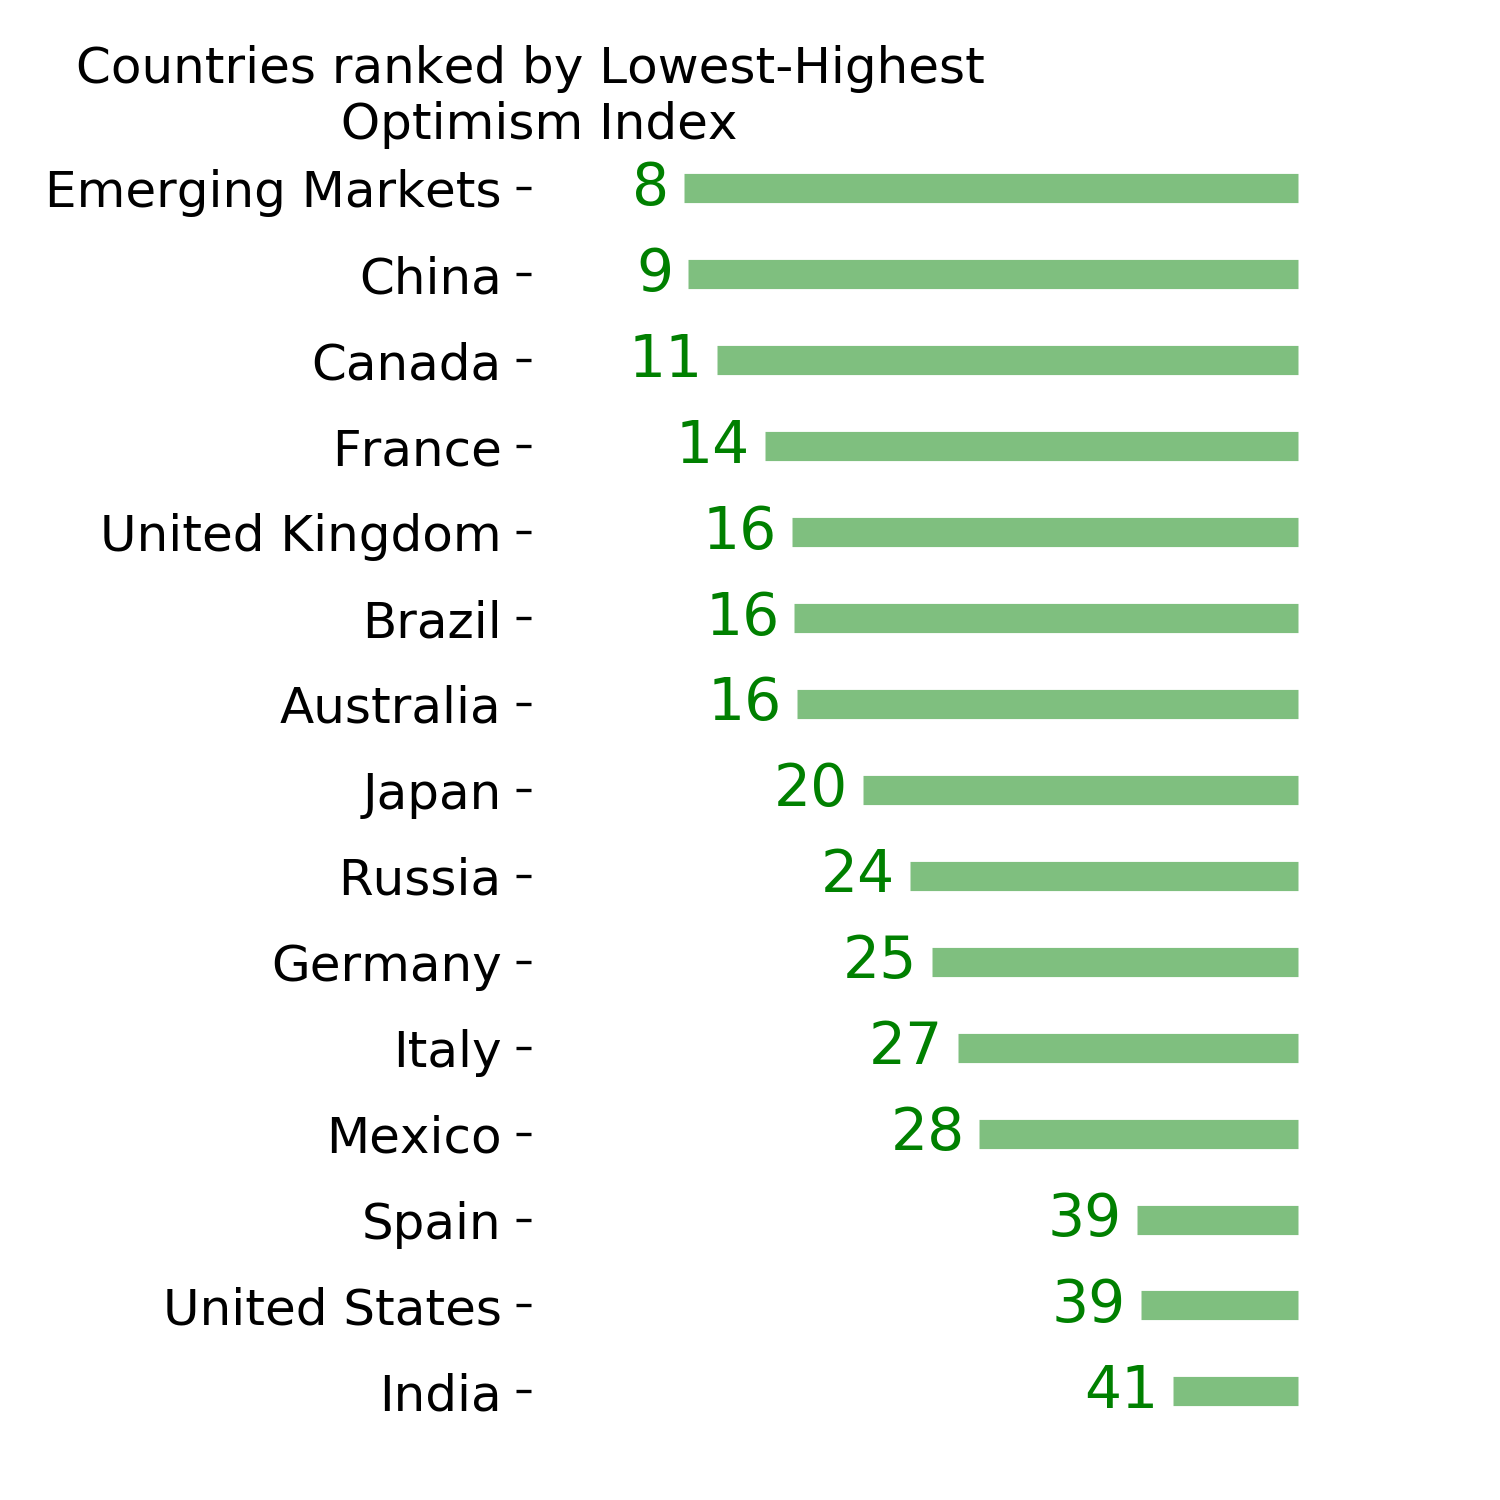
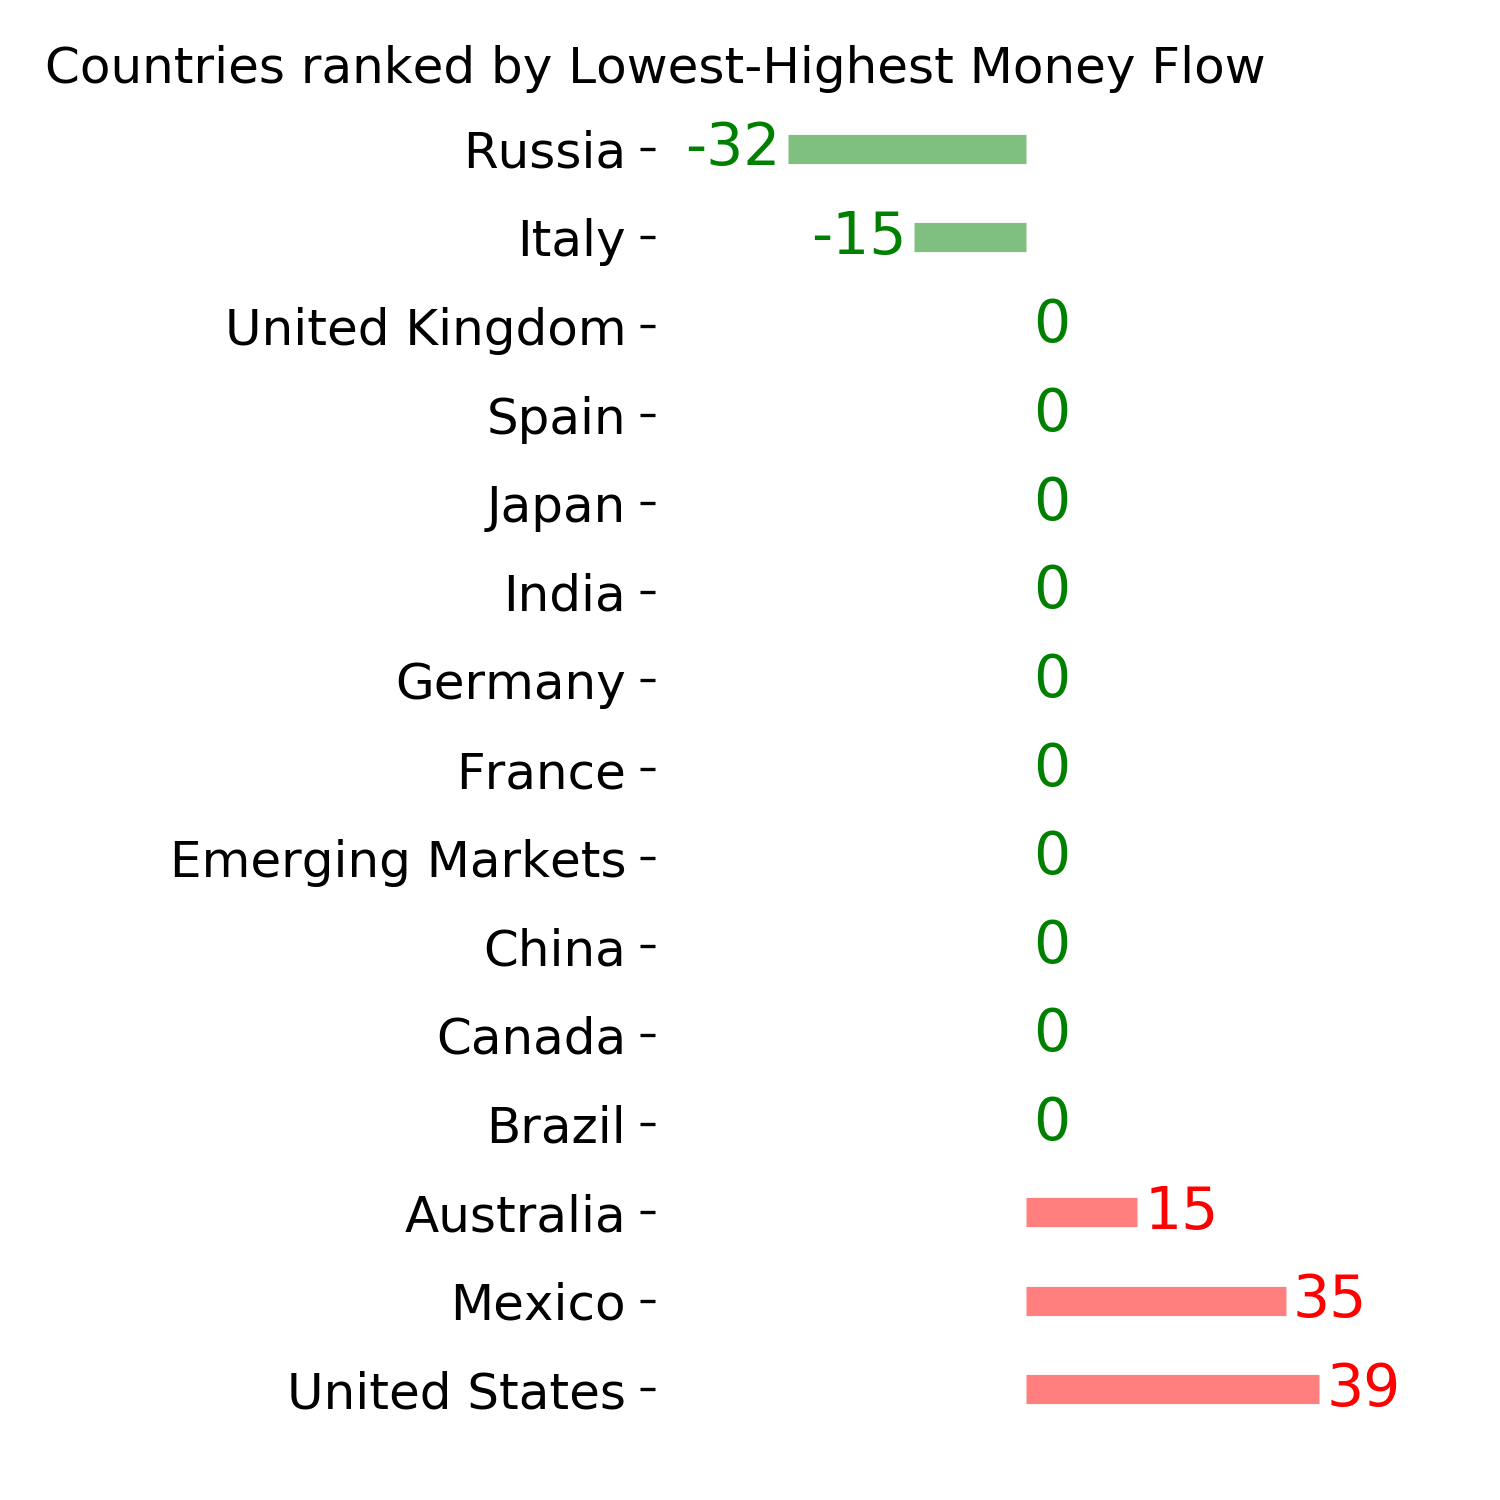
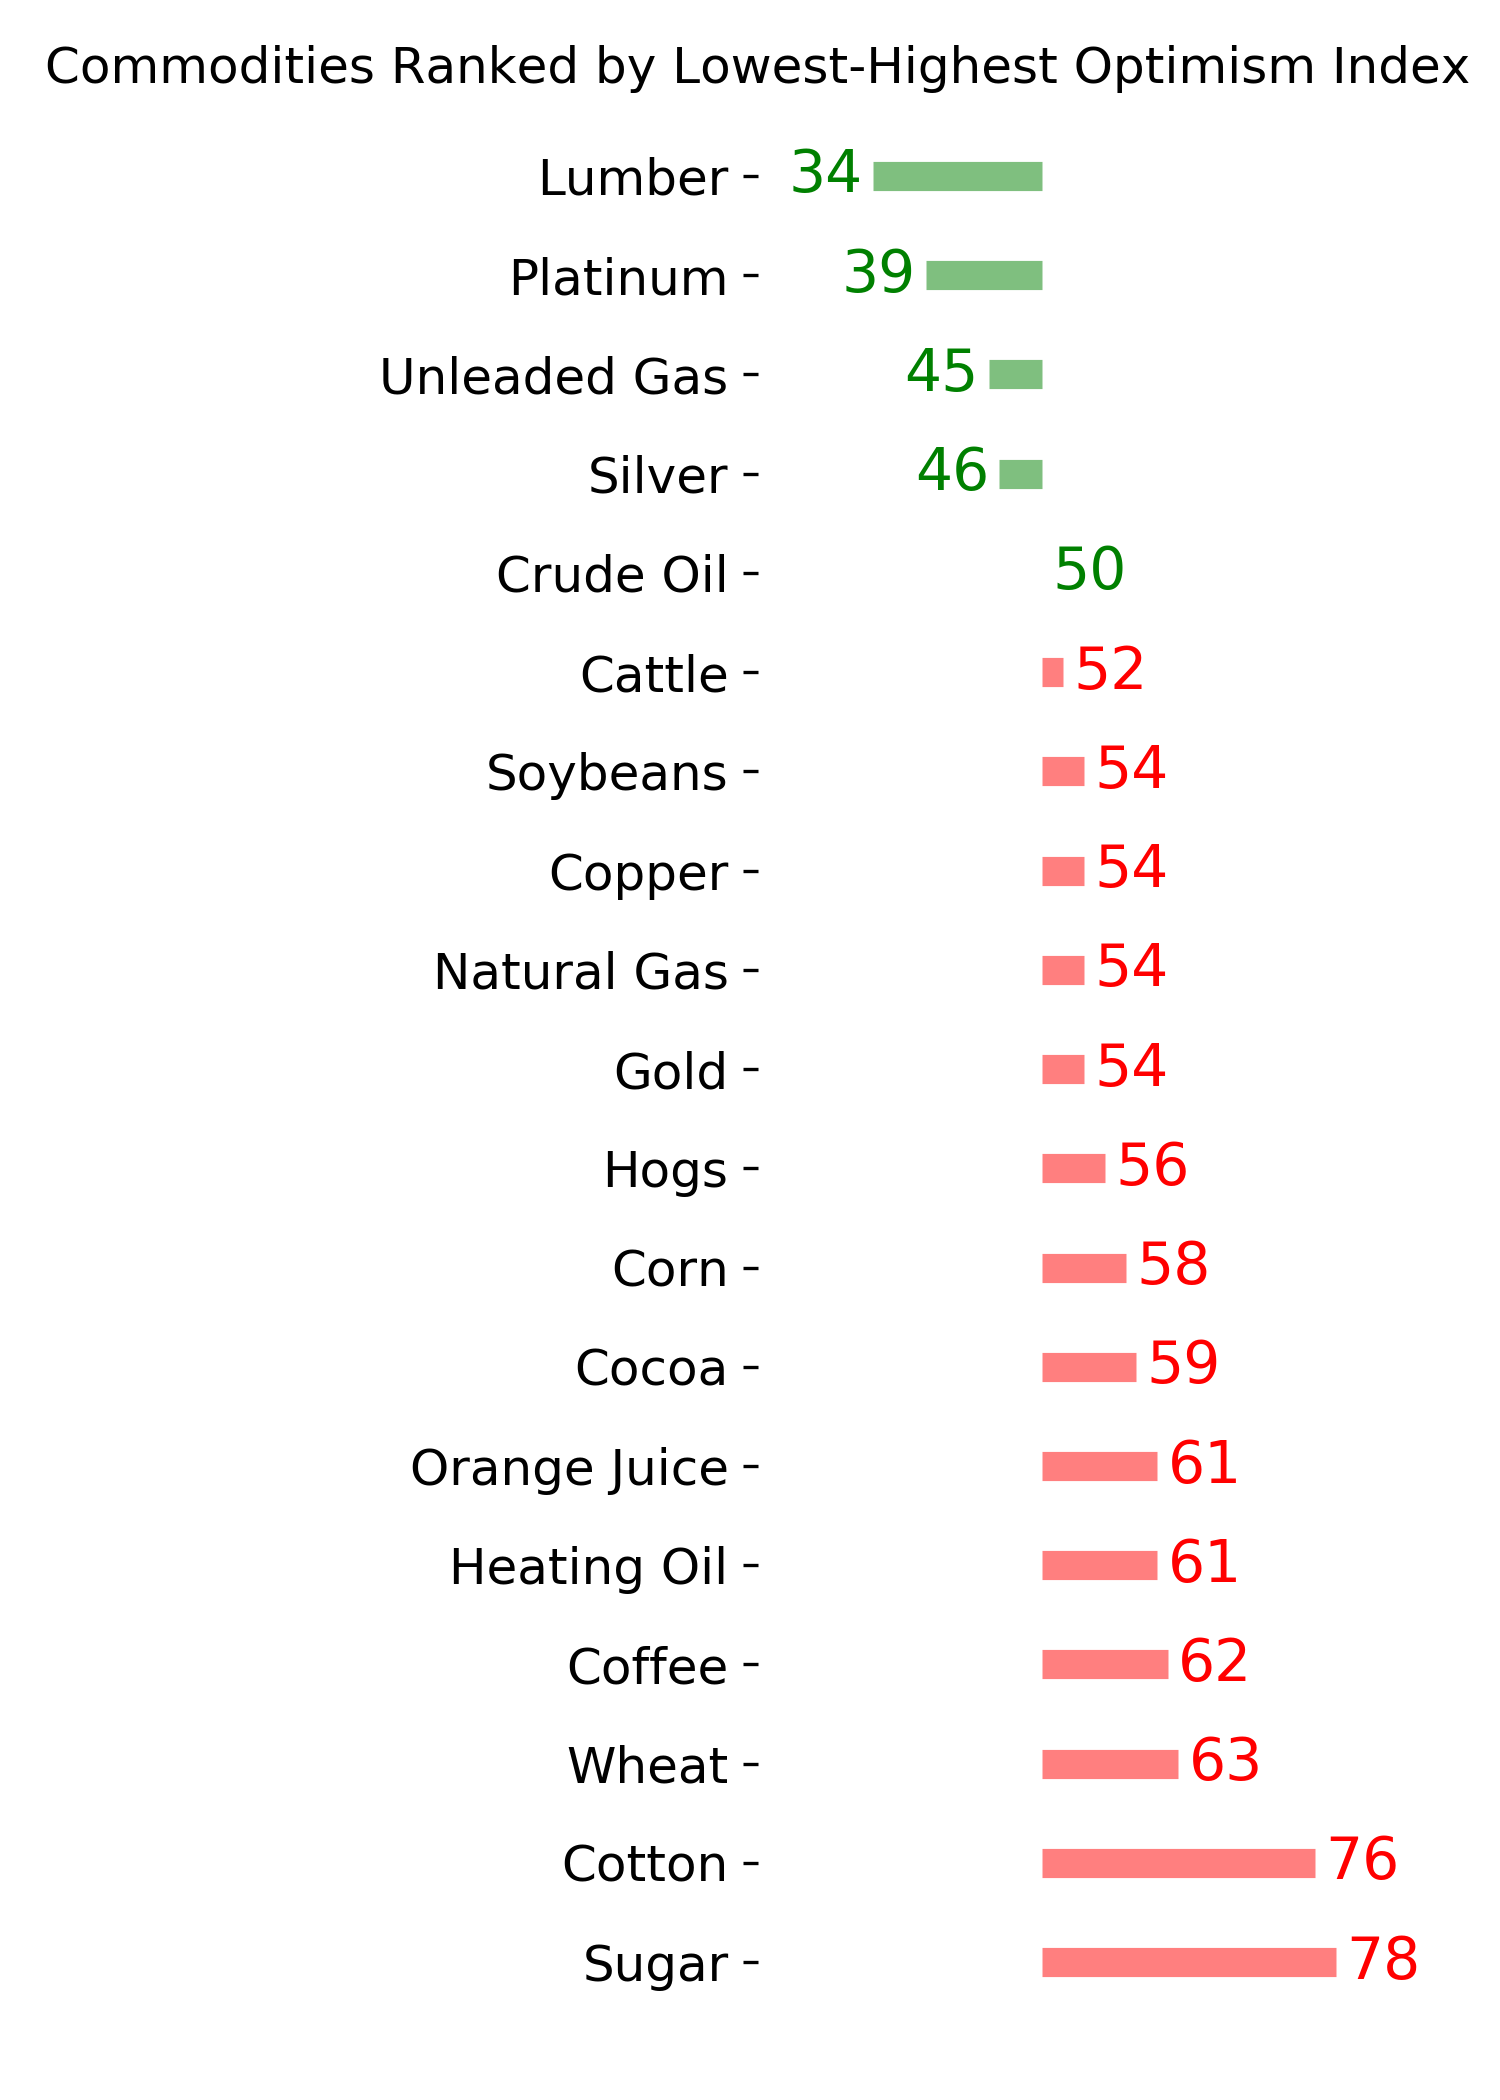
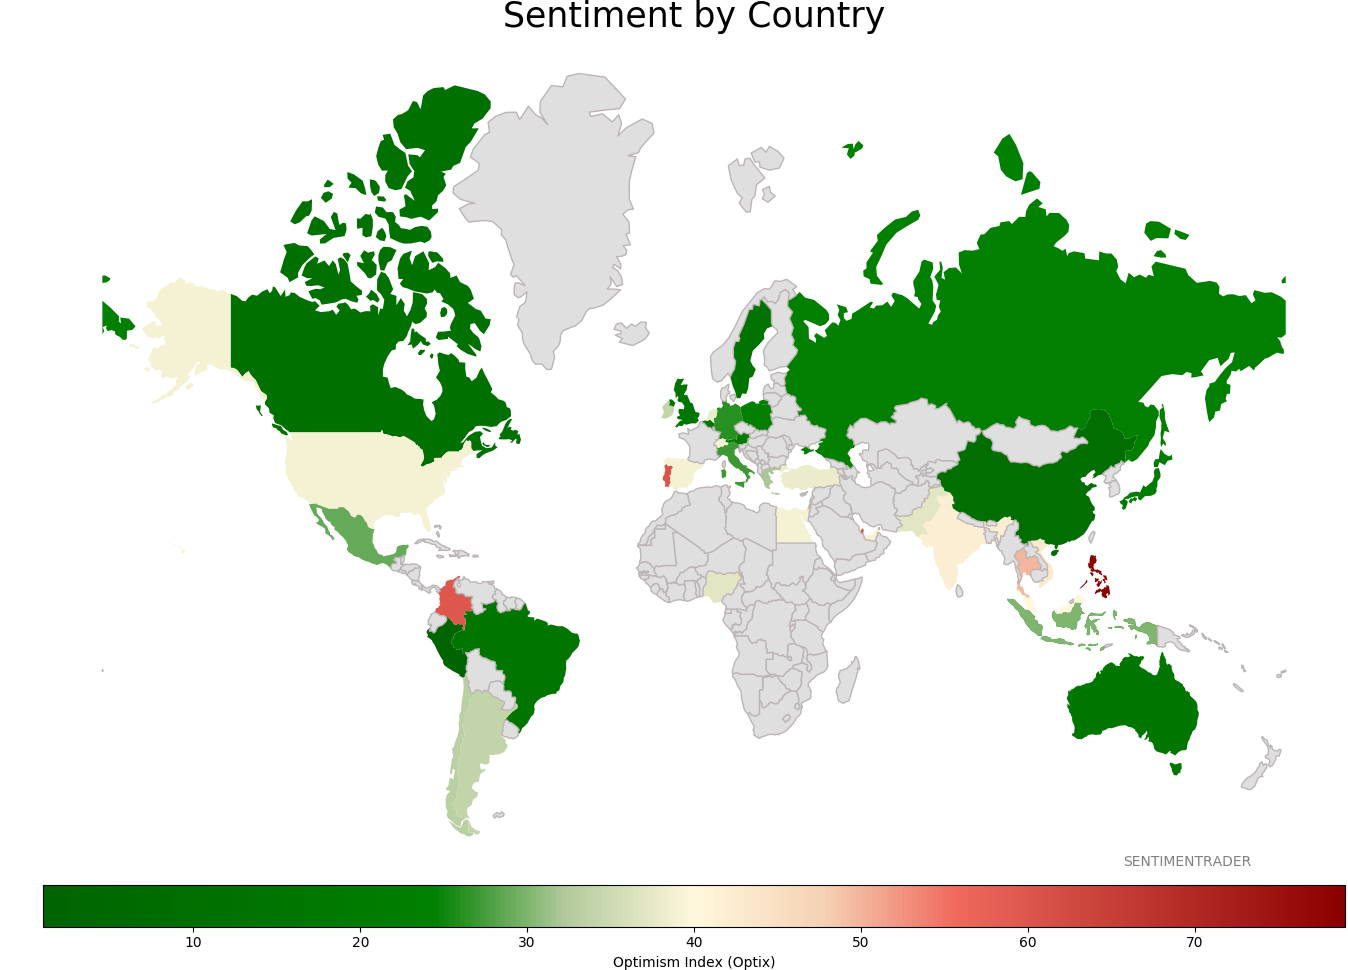
Sentiment Around The World
Optimism Index Thumbnails
|
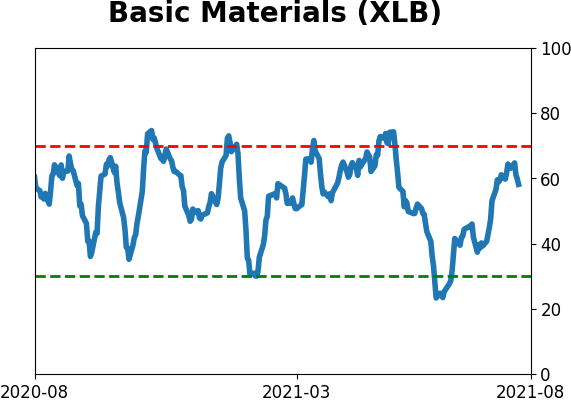
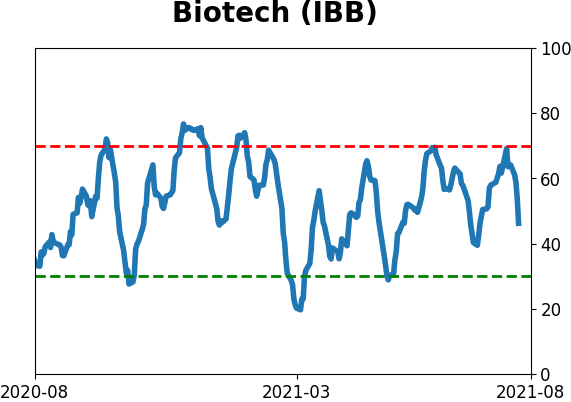
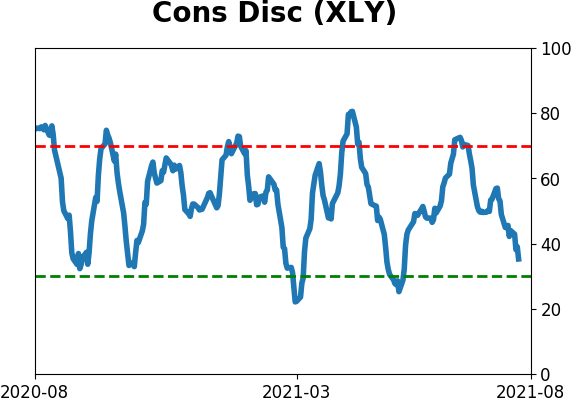
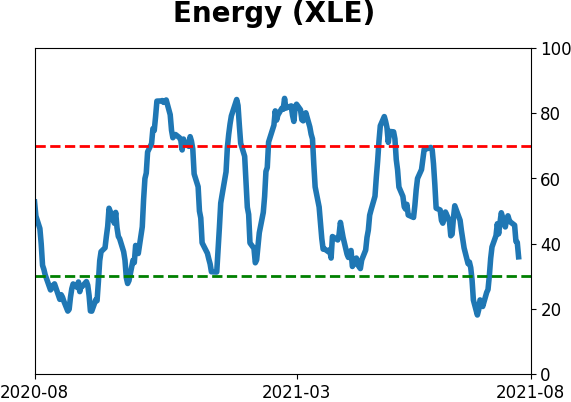
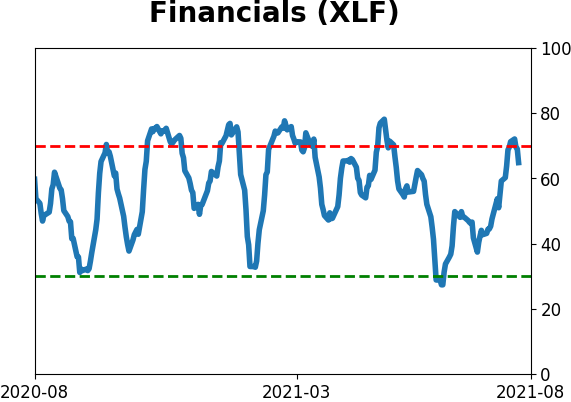
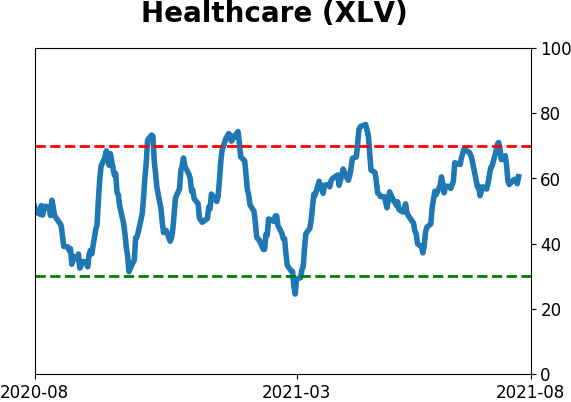
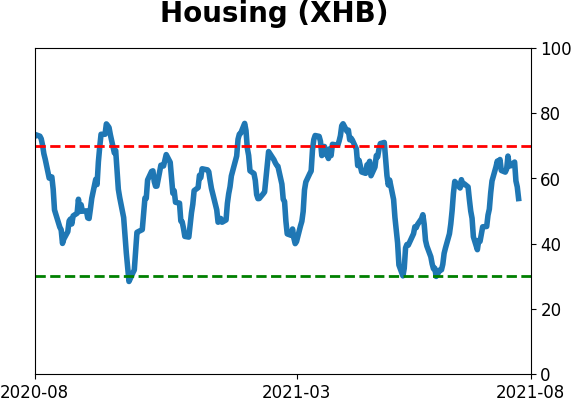
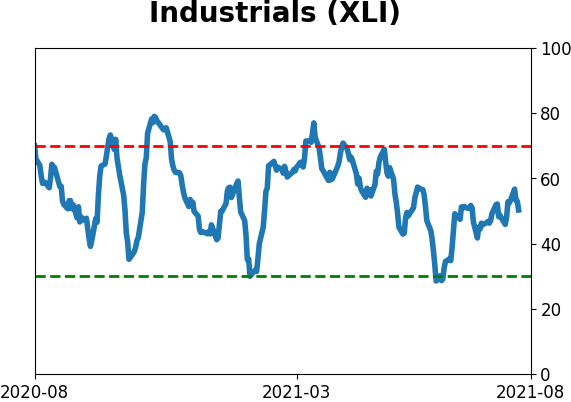
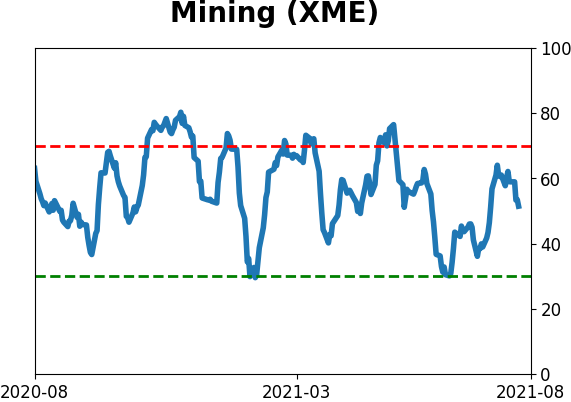
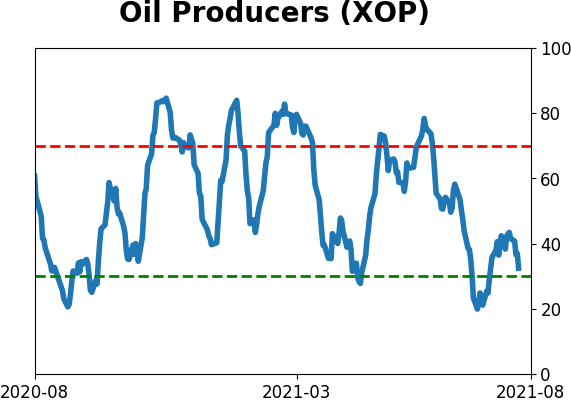
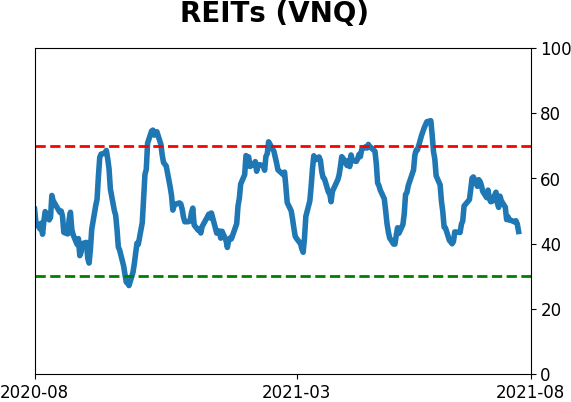
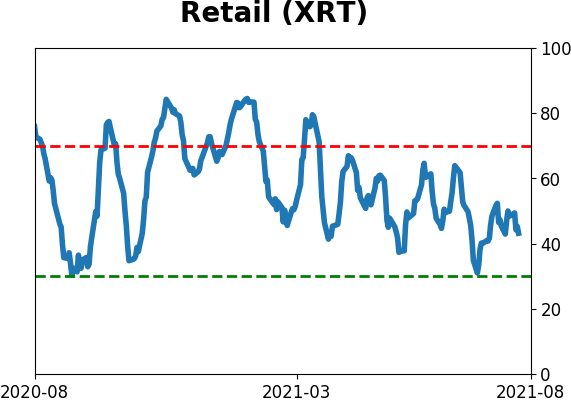
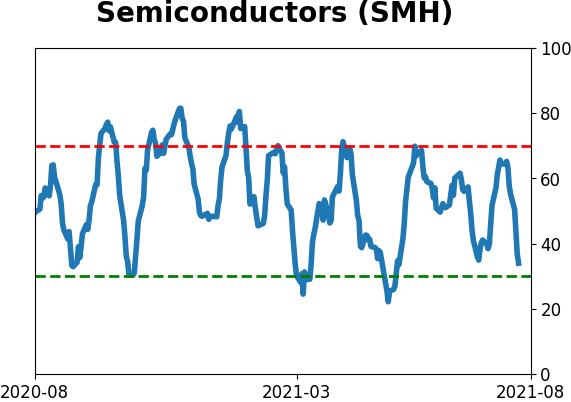
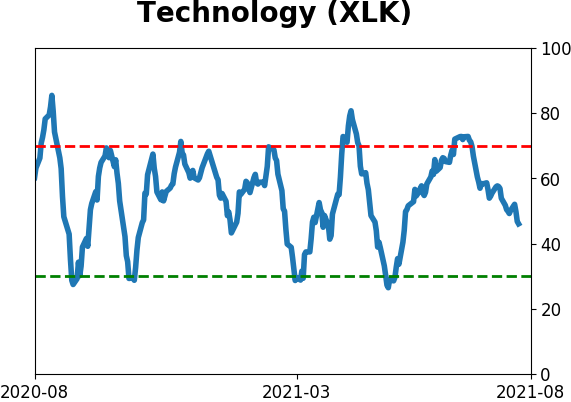
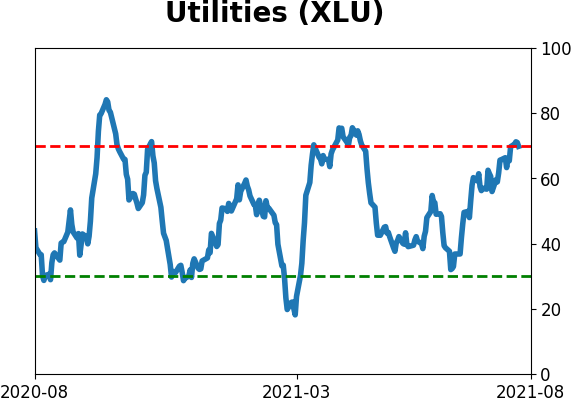
Sector ETF's - 10-Day Moving Average
|
|
|
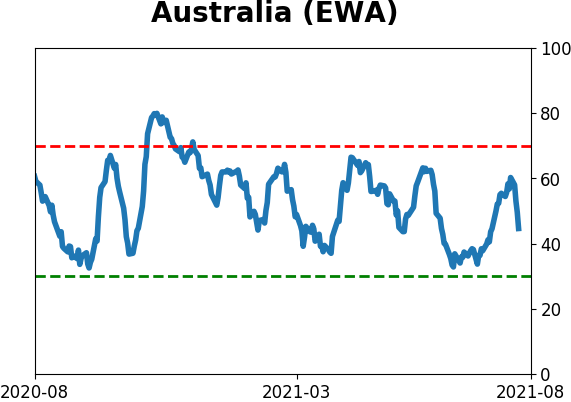
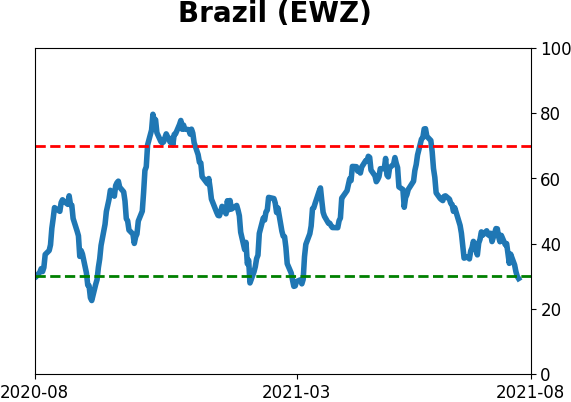
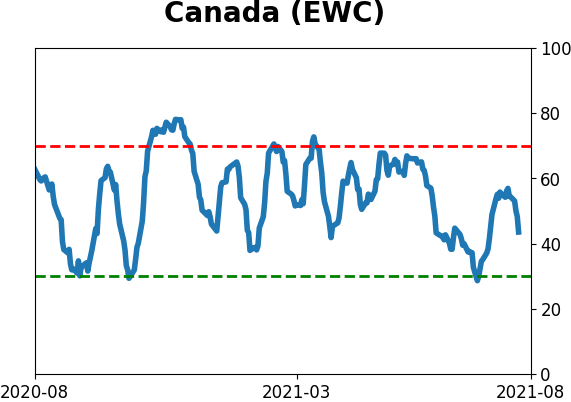
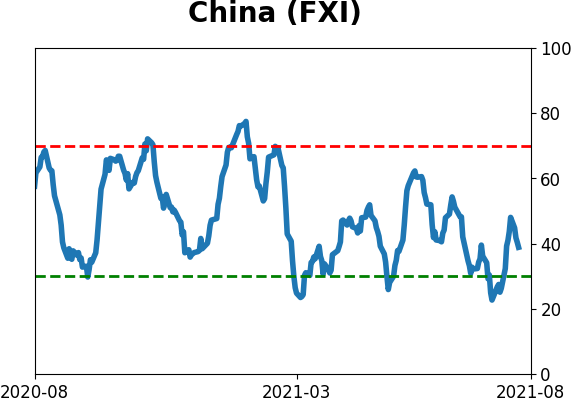
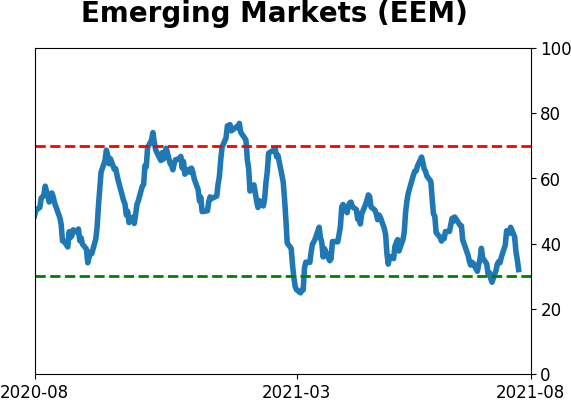
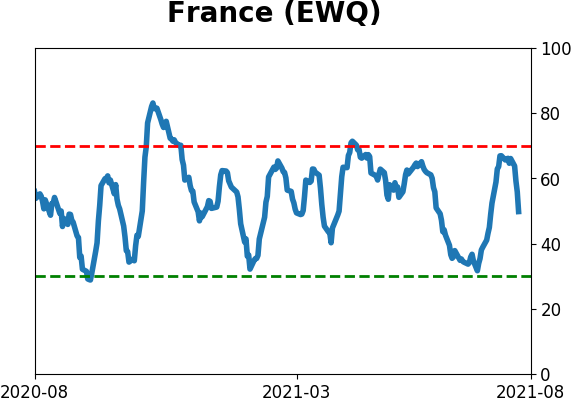
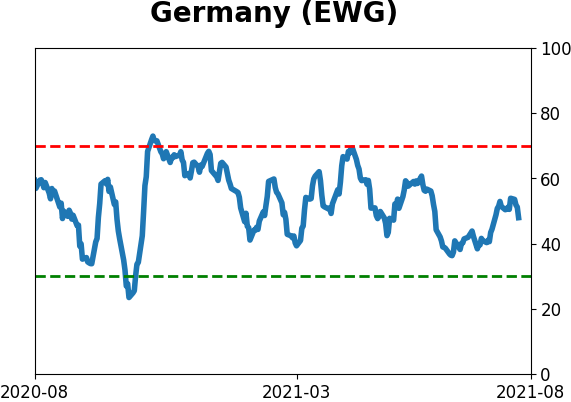
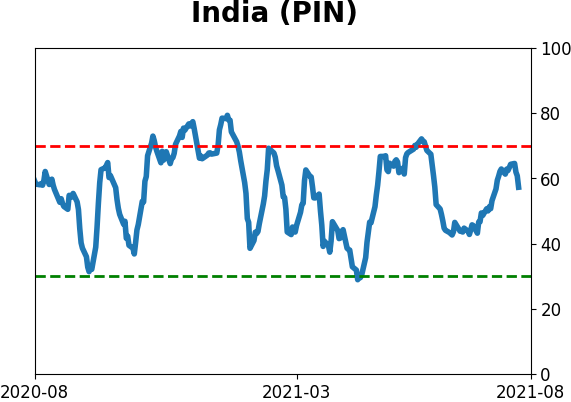
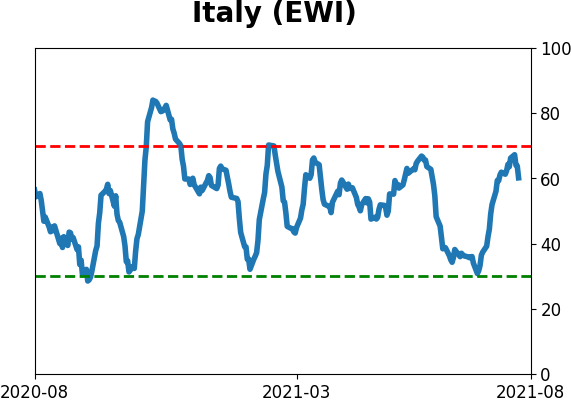
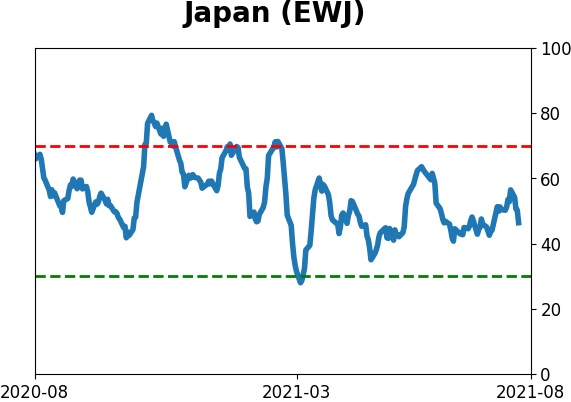
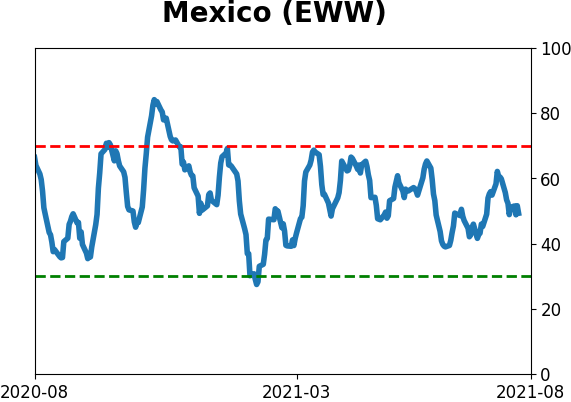
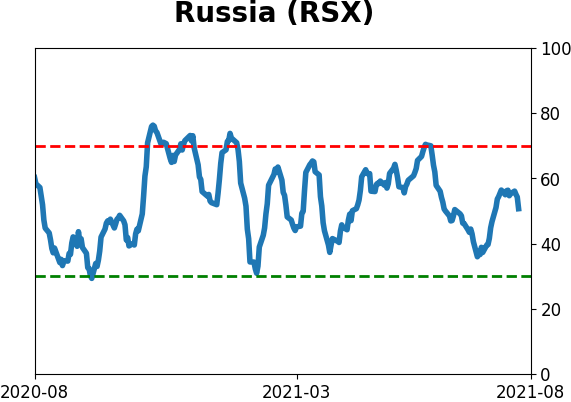
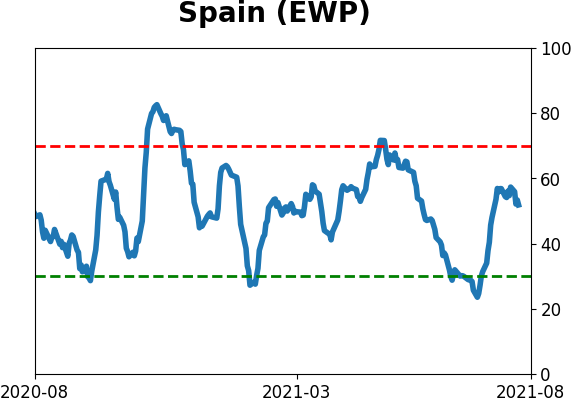
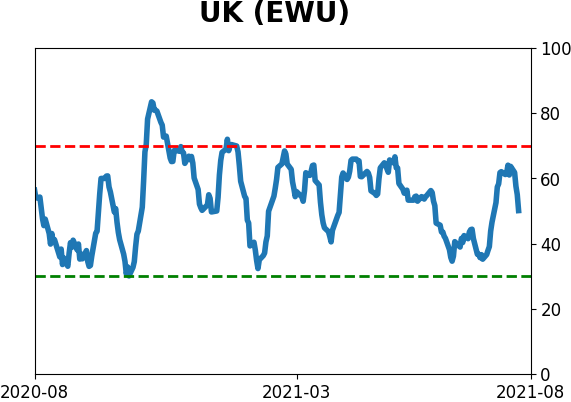
Country ETF's - 10-Day Moving Average
|
|
|
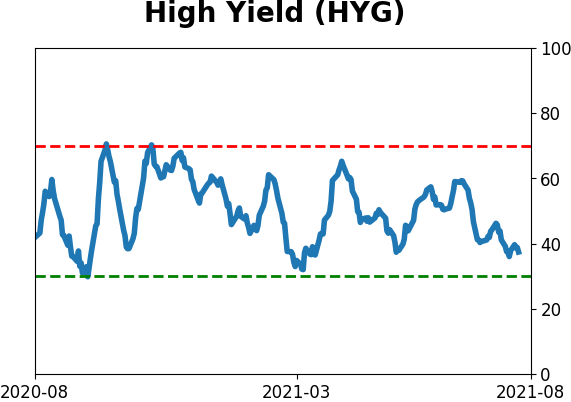
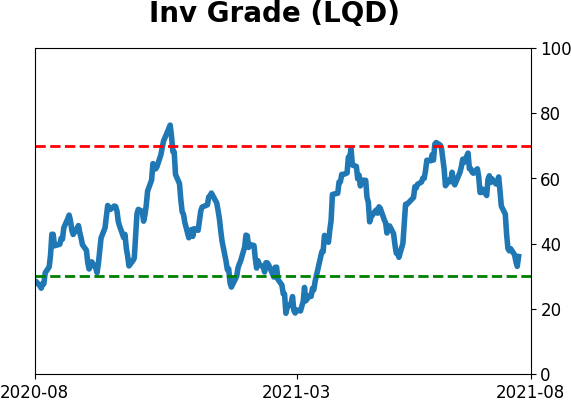
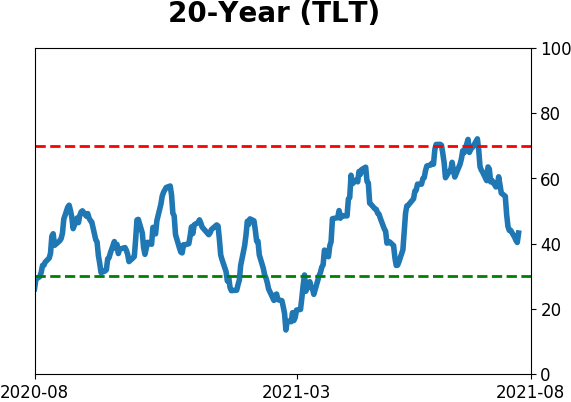
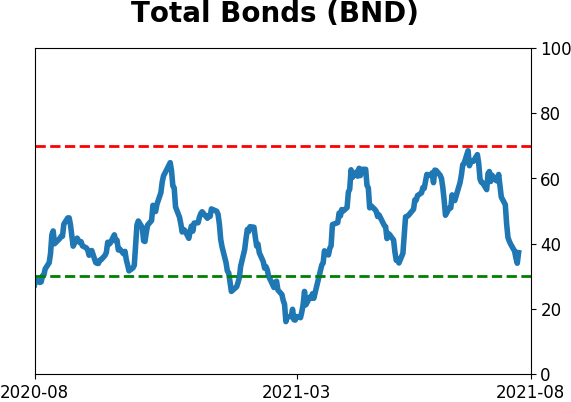
Bond ETF's - 10-Day Moving Average
|
|
|
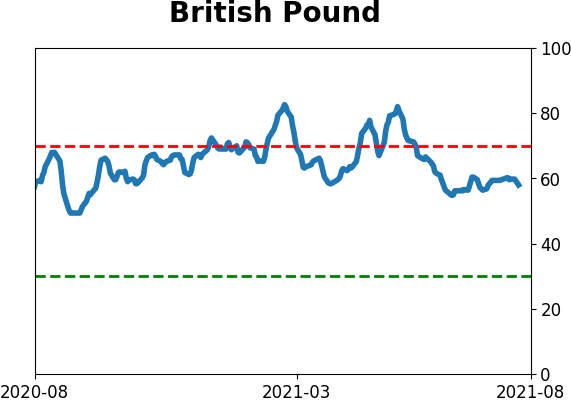
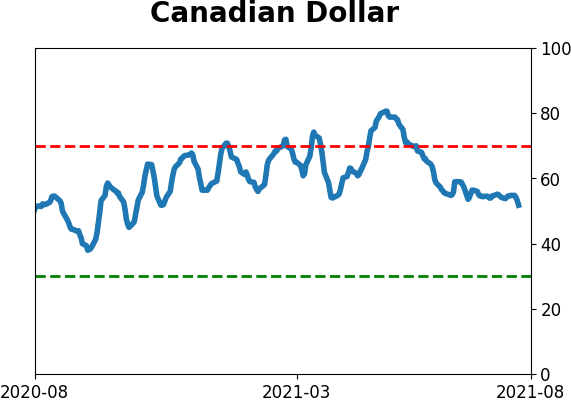
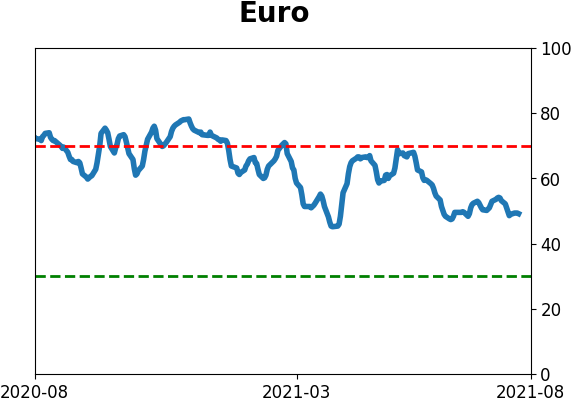
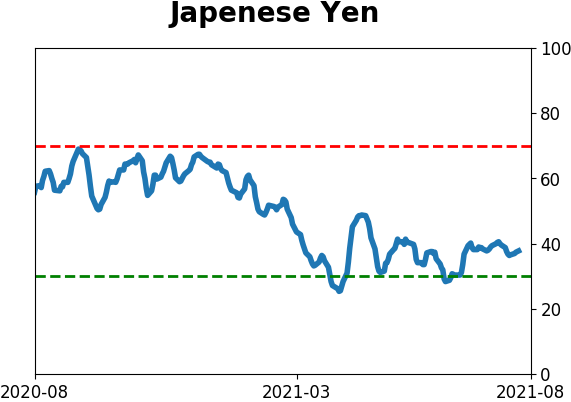
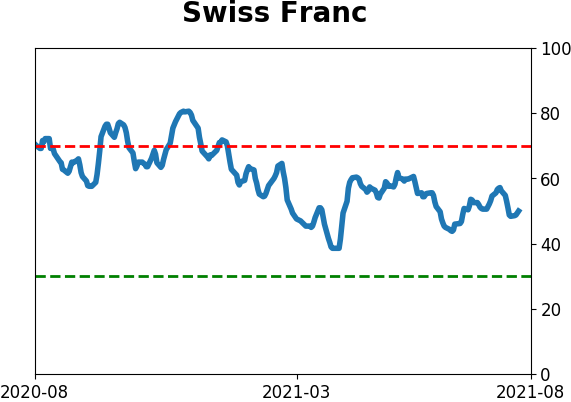
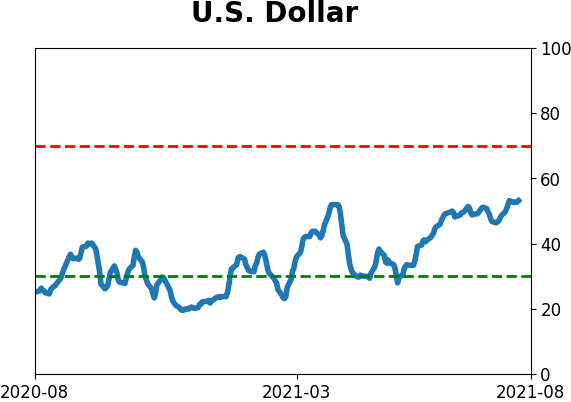
Currency ETF's - 5-Day Moving Average
|
|
|
Commodity ETF's - 5-Day Moving Average
|
|