Headlines
|
|
Nearing Records for Super Strong Trends:
The Dow Industrials and S&P 500 have been so far above their 200-day moving averages, for so long, that both indexes are nearing historic levels of such a sustained trend. Their few precedents often preceded medium-term weakness.
Bottom Line:
See the Outlook & Allocations page for more details on these summaries STOCKS: Hold
The speculative frenzy in February is wrung out. Internal dynamics have mostly held up, with some exceptions. Many of our studies still show a mixed to poor short-term view, with medium- and long-term ones turning more positive. BONDS: Hold
Various parts of the market got hit in March, with the lowest Bond Optimism Index we usually see during healthy environments. After a shaky couple of weeks, the broad bond market has modestly recovered. Not a big edge here either way. GOLD: Hold
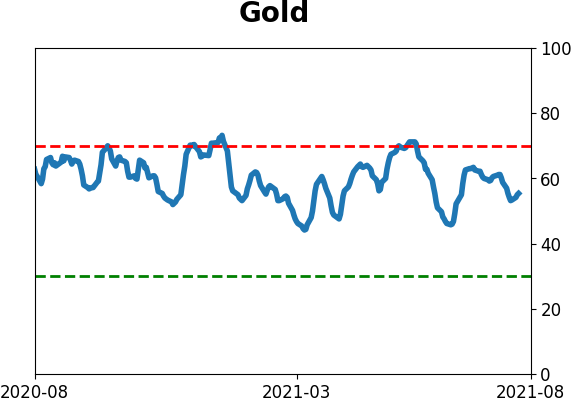
Gold and miners have done very well, recovering above long-term trend lines. The issue is that both have tended to perform poorly after similar situations - will have to wait and see how it plays out.
|
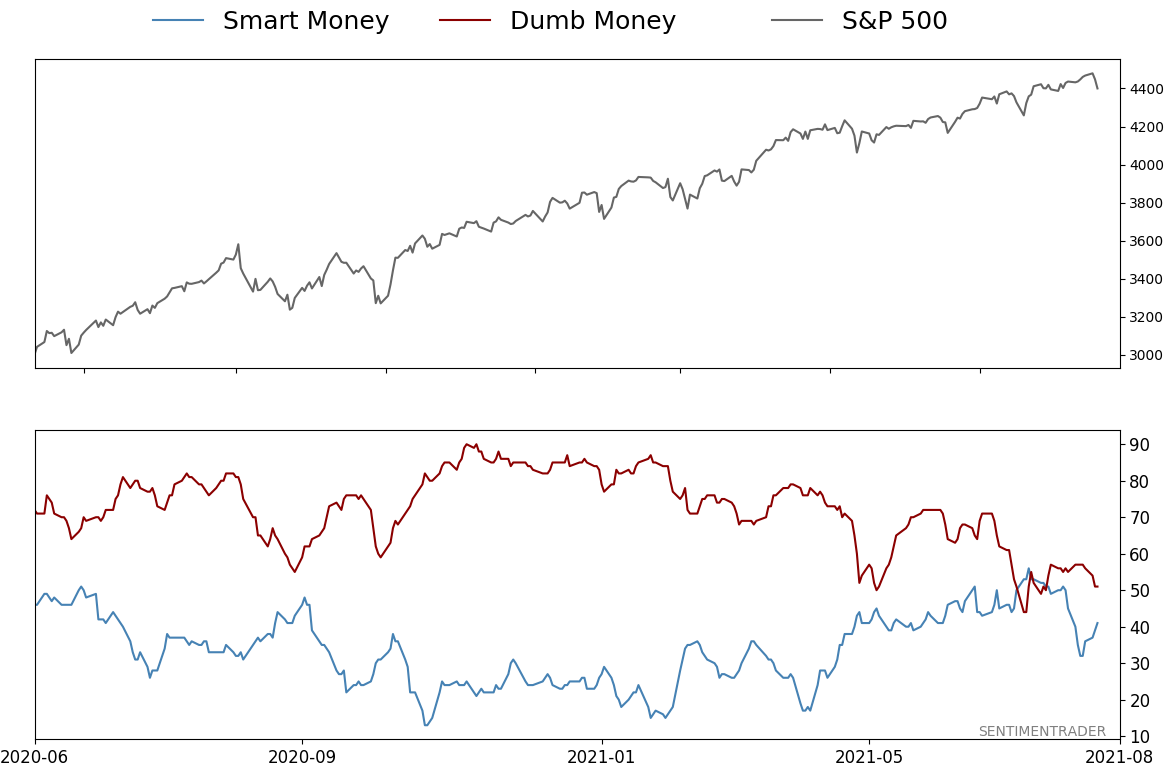
Smart / Dumb Money Confidence
|
Smart Money Confidence: 41%
Dumb Money Confidence: 51%
|
|
Risk Levels
Stocks Short-Term

|
Stocks Medium-Term
|
|
Bonds

|
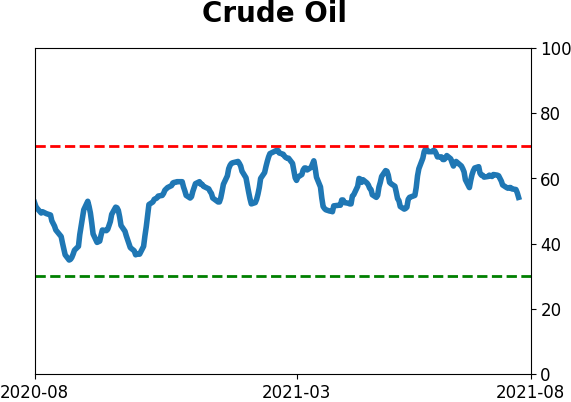
Crude Oil
|
|
Gold

|
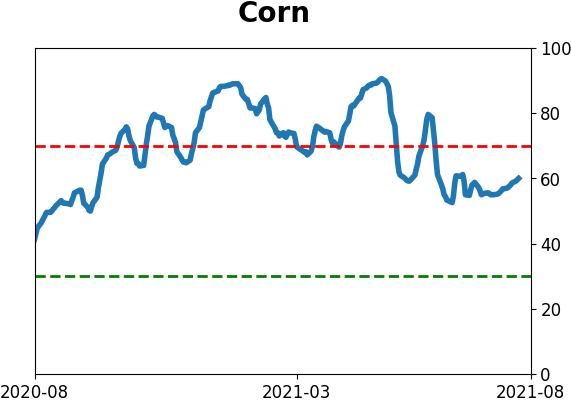
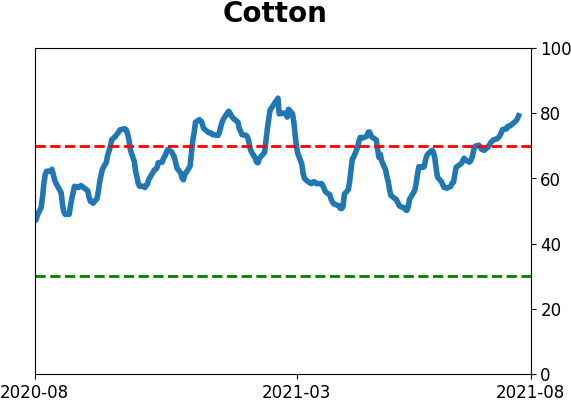
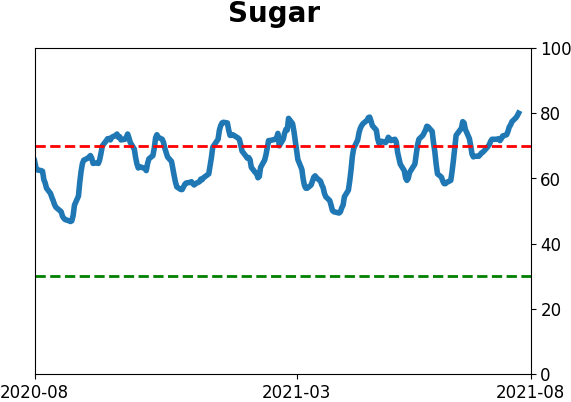
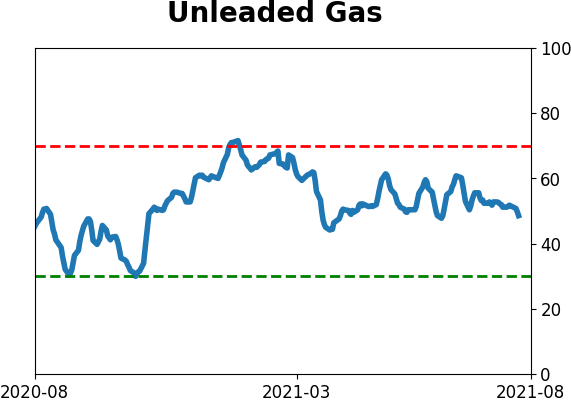
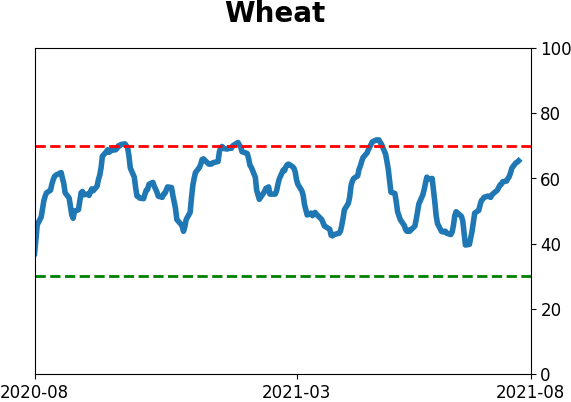
Agriculture

|
|
Research
By Jason Goepfert
BOTTOM LINE
The Dow Industrials and S&P 500 have been so far above their 200-day moving averages, for so long, that both indexes are nearing historic levels of such a sustained trend. Their few precedents often preceded medium-term weakness.
FORECAST / TIMEFRAME
None
|
This has been a year for the record books, as we've seen from several different perspectives lately. We can add to that the length of super-strong trends in both the S&P 500 and Dow Industrials.
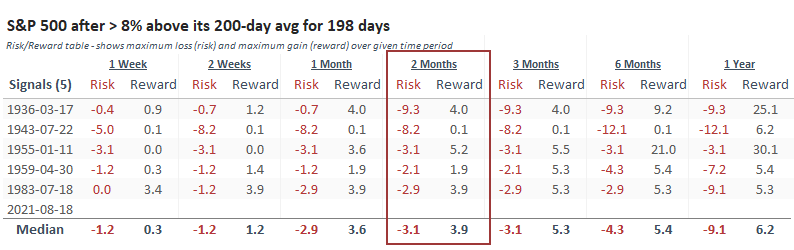
The S&P has been more than 8% above its 200-day moving average since last fall.
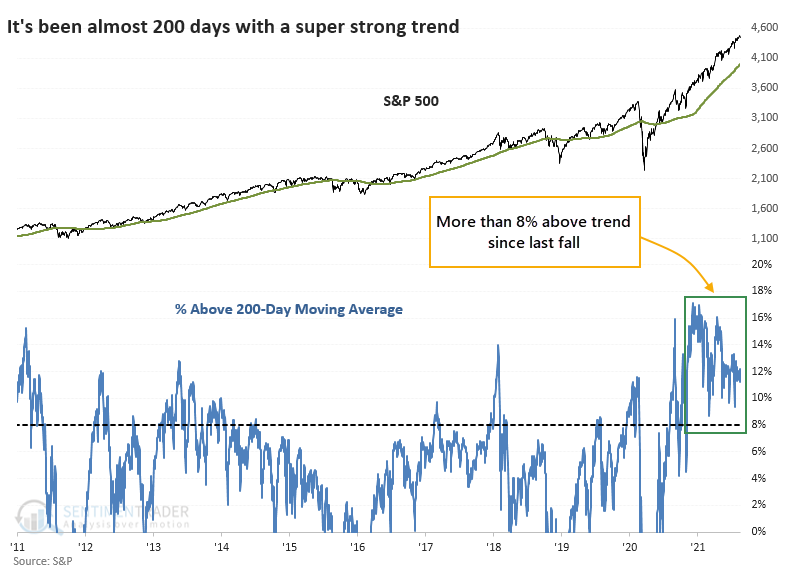
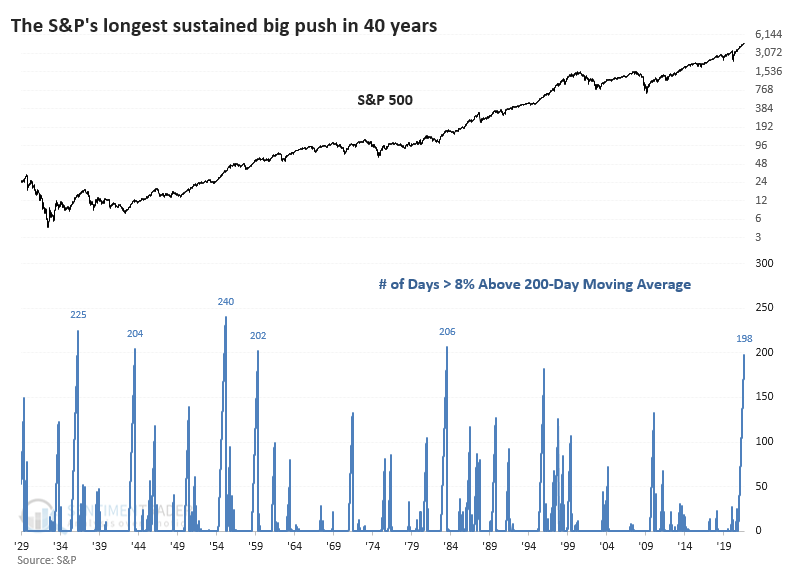
At nearly 200 consecutive trading days this far above trend, the current streak ranks among the best in the S&P's history and the longest in 40 years.
By the time it reached the current length, other super-strong trends saw buyers take a break.
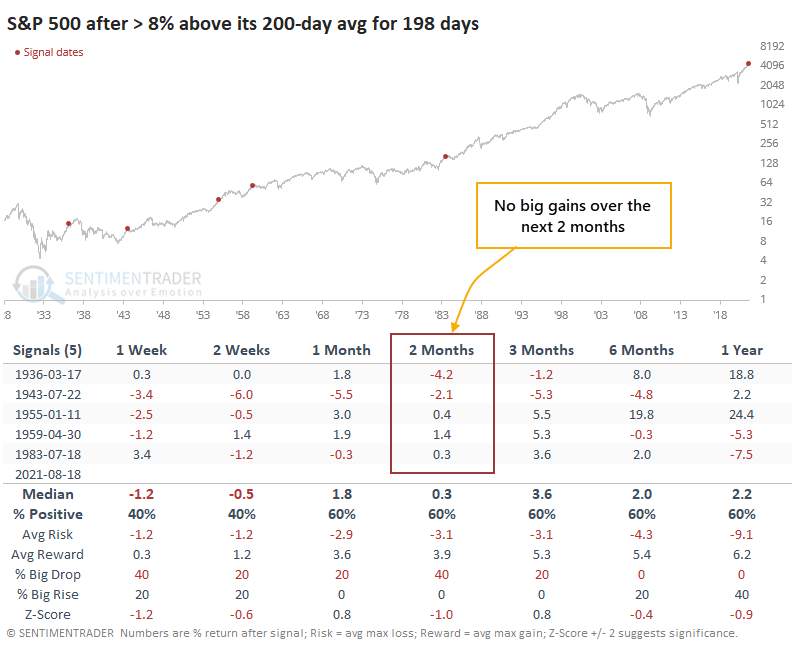
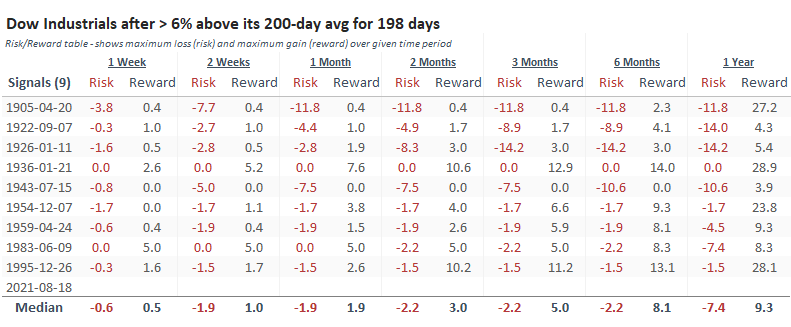
Looking at the Risk/Reward Table, the 2-month time frame was uninspiring. Three of the five signals had a higher risk than reward, and the other two weren't much better.
The Dow hasn't been quite as strong, holding "only" 6% above its long-term moving average. Even the momentum market of 2017 couldn't match this.
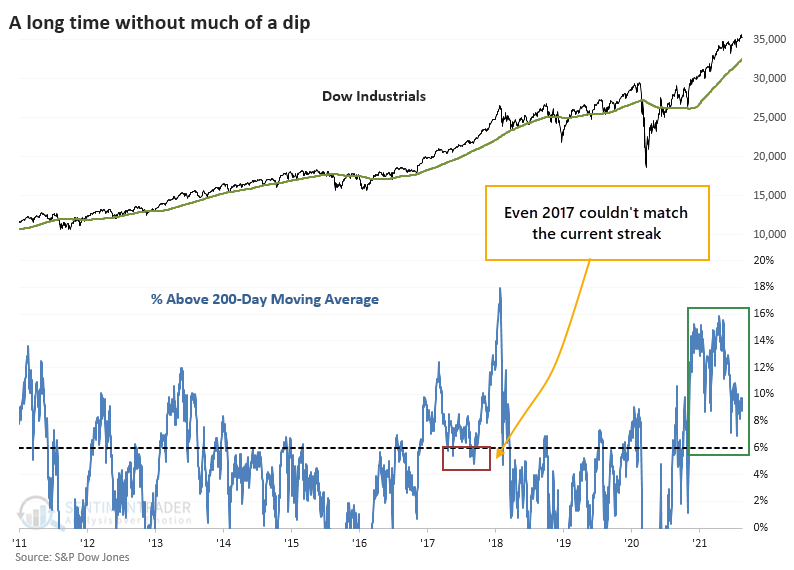
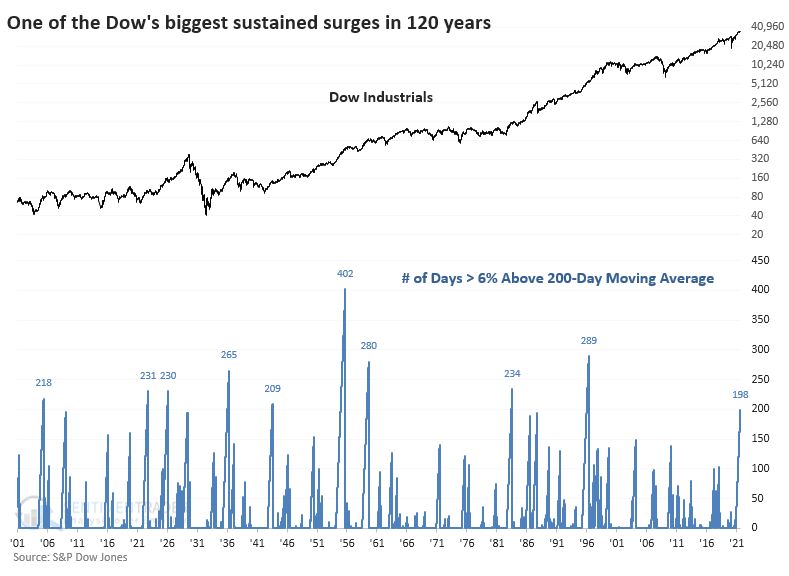
For the Dow, this ranks among the longest super-strong trends in 120 years.
The Dow also tended to struggle with inconsistent returns after such a massive run. Only 3 of the 9 signals ended up leading to runaway bull markets, with the others preceding negative or tepid short- to medium-term returns.
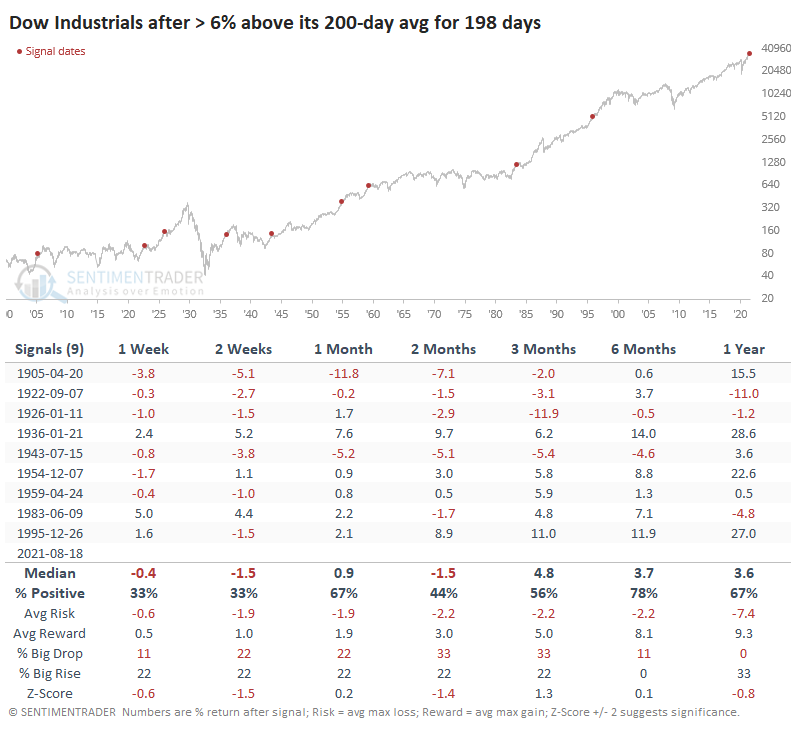
The Risk/Reward Table for the Dow shows that the index had more risk than reward over the next month after 5 of the 9 signals. It is worth noting that since 1950, the Dow's four precedents led to shallow risk up to six months later and at least +8% of upside.
There is no question that momentum in 2021 has been impressive and on the cusp of record-breaking in some respects. Looking for comparisons brings up only small sample sizes, making it tough to rely on for guidance.
Still, the momentum streaks that we've looked at from different perspectives have been somewhat consistent in their message - by the time buyers have persisted to the degree they have now, for as long as they have now, future returns over the coming months were mediocre at best, and often negative. But whatever pullbacks or corrections they preceded tended to be limited, with almost none of them leading to sustained bear markets.
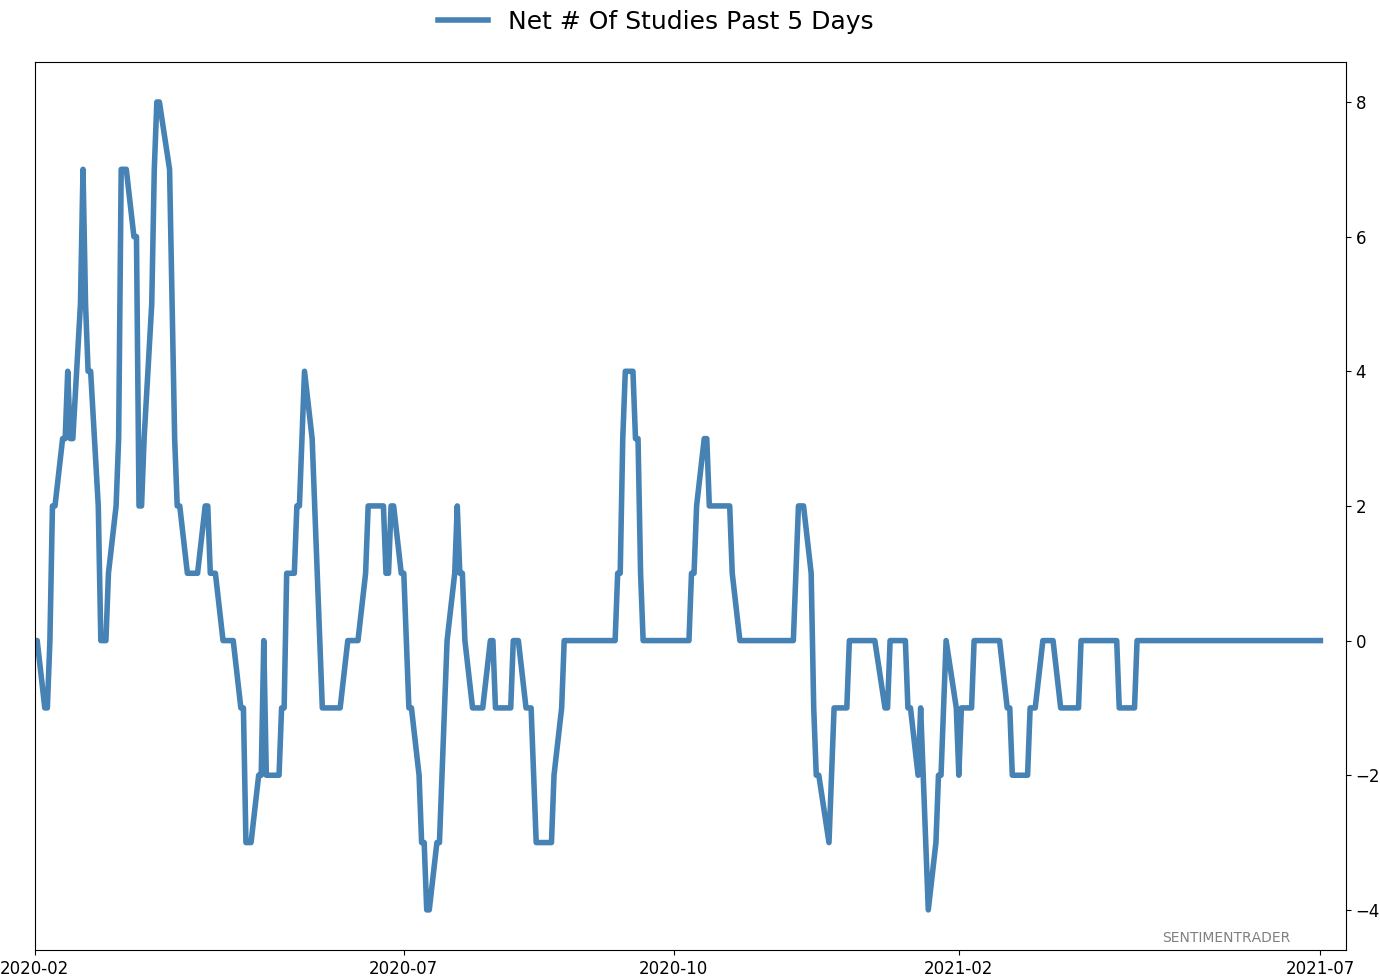
Active Studies
| Time Frame | Bullish | Bearish | | Short-Term | 0 | 4 | | Medium-Term | 4 | 3 | | Long-Term | 10 | 5 |
|
Indicators at Extremes
Portfolio
| Position | Description | Weight % | Added / Reduced | Date | | Stocks | RSP | 4.1 | Added 4.1% | 2021-05-19 | | Bonds | 23.9% BND, 6.9% SCHP | 30.7 | Reduced 7.1% | 2021-05-19 | | Commodities | GCC | 2.6 | Reduced 2.1%
| 2020-09-04 | | Precious Metals | GDX | 5.6 | Reduced 4.2% | 2021-05-19 | | Special Situations | 4.3% XLE, 2.2% PSCE | 7.6 | Reduced 5.6% | 2021-04-22 | | Cash | | 49.4 | | |
|
Updates (Changes made today are underlined)
Much of our momentum and trend work has remained positive for several months, with some scattered exceptions. Almost all sentiment-related work has shown a poor risk/reward ratio for stocks, especially as speculation drove to record highs in exuberance in February. Much of that has worn off, and most of our models are back toward neutral levels. There isn't much to be excited about here. The same goes for bonds and even gold. Gold has been performing well lately and is back above long-term trend lines. The issue is that it has a poor record of holding onto gains when attempting a long-term trend change like this, so we'll take a wait-and-see approach. RETURN YTD: 7.8% 2020: 8.1%, 2019: 12.6%, 2018: 0.6%, 2017: 3.8%, 2016: 17.1%, 2015: 9.2%, 2014: 14.5%, 2013: 2.2%, 2012: 10.8%, 2011: 16.5%, 2010: 15.3%, 2009: 23.9%, 2008: 16.2%, 2007: 7.8%
|
|
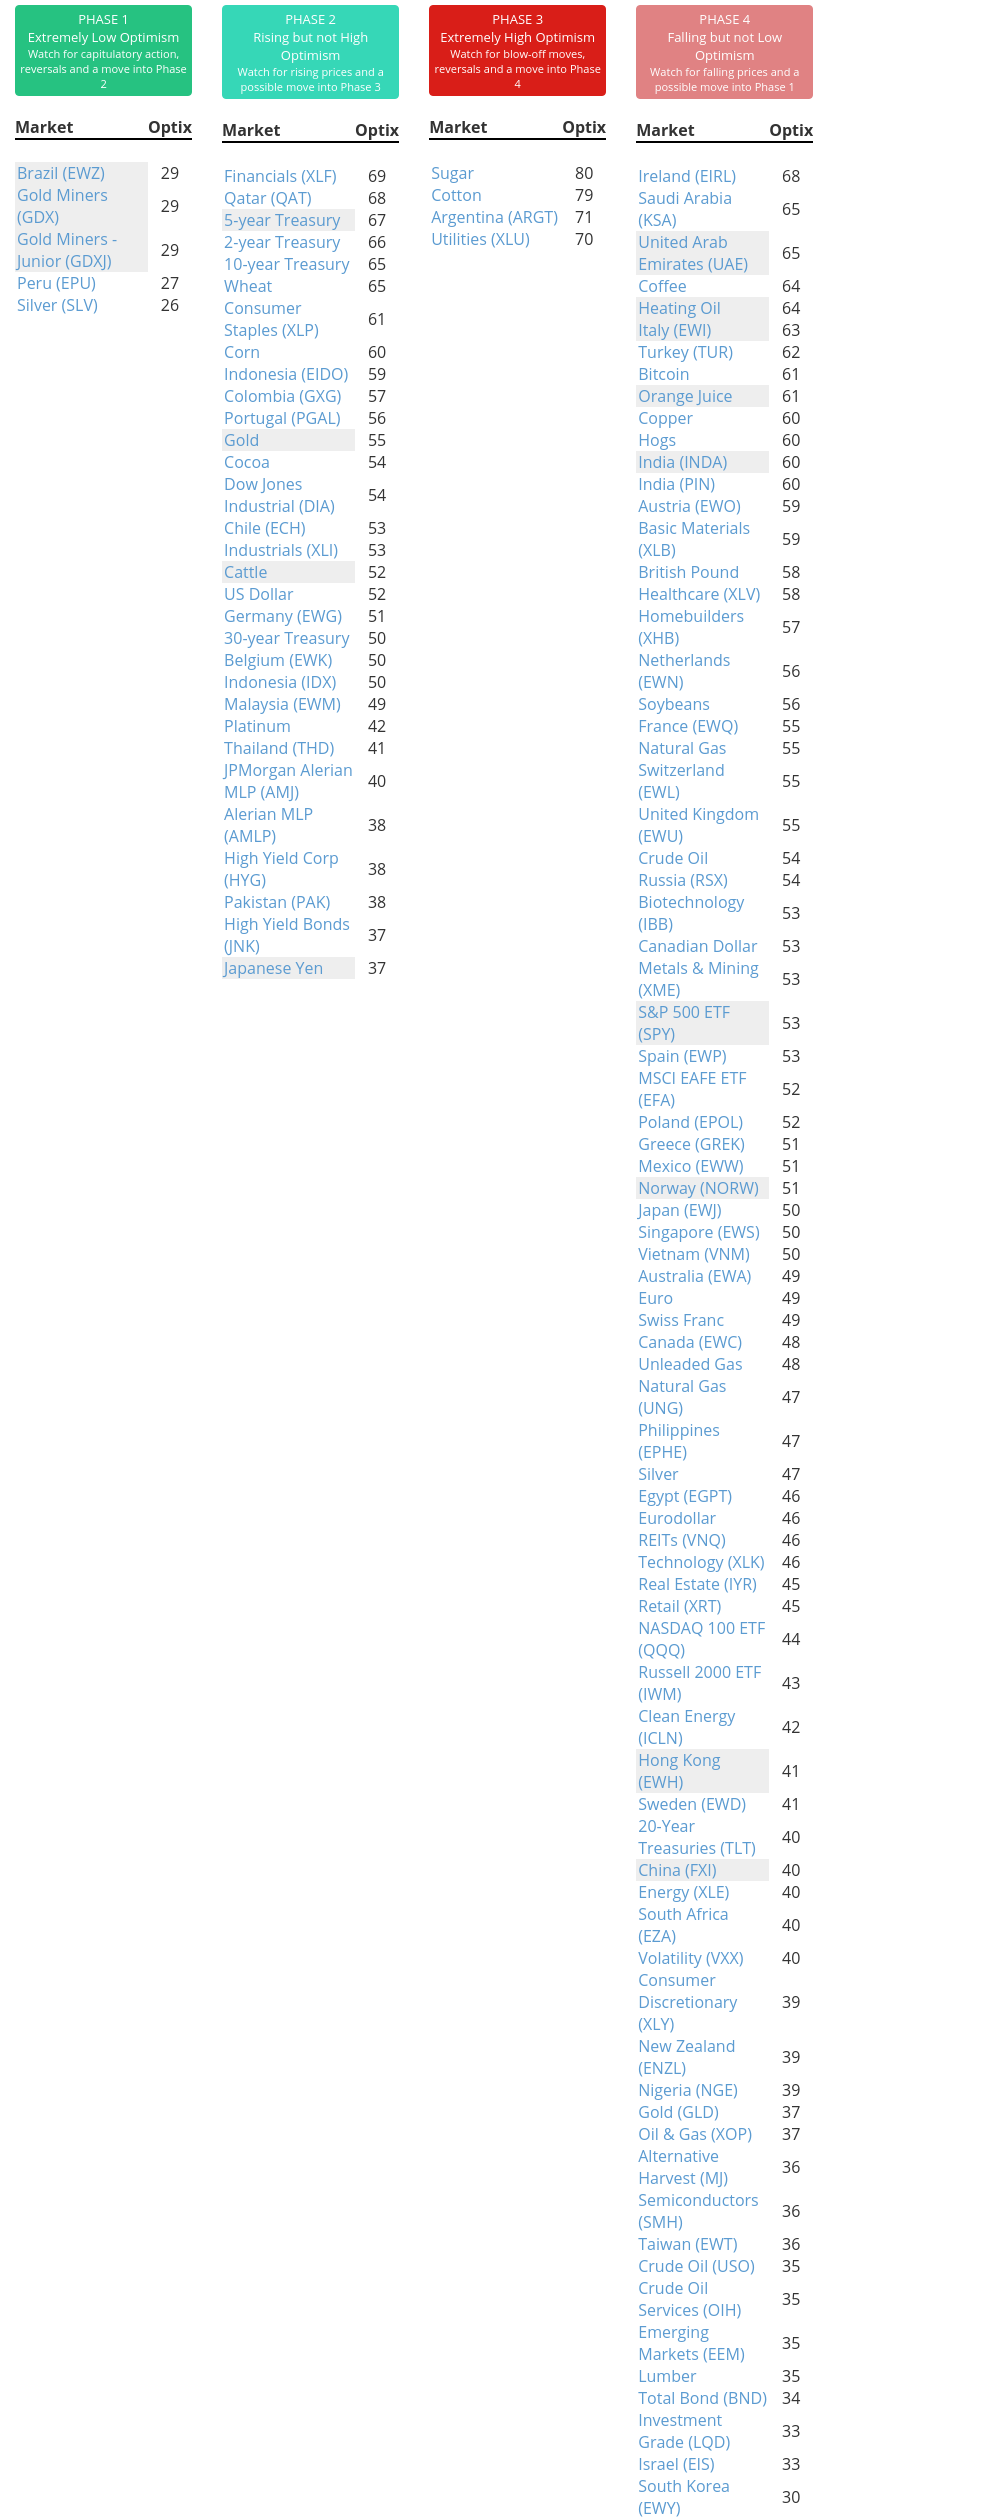
Phase Table
Ranks
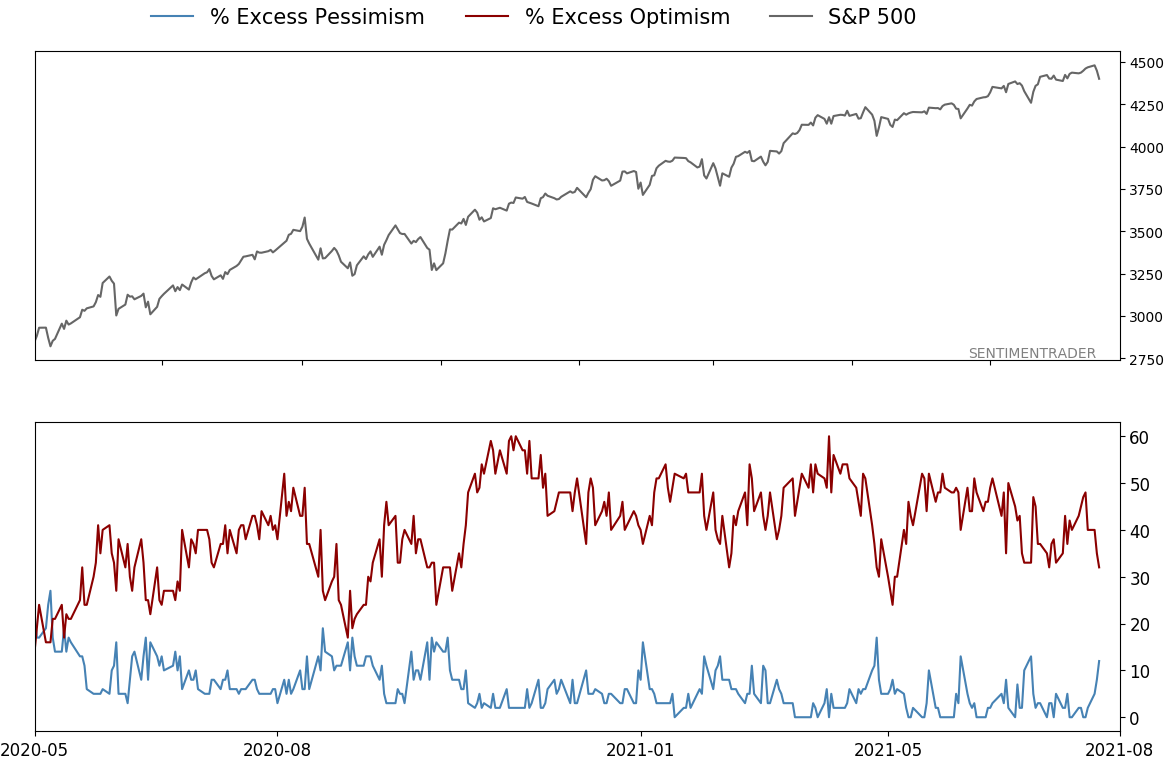
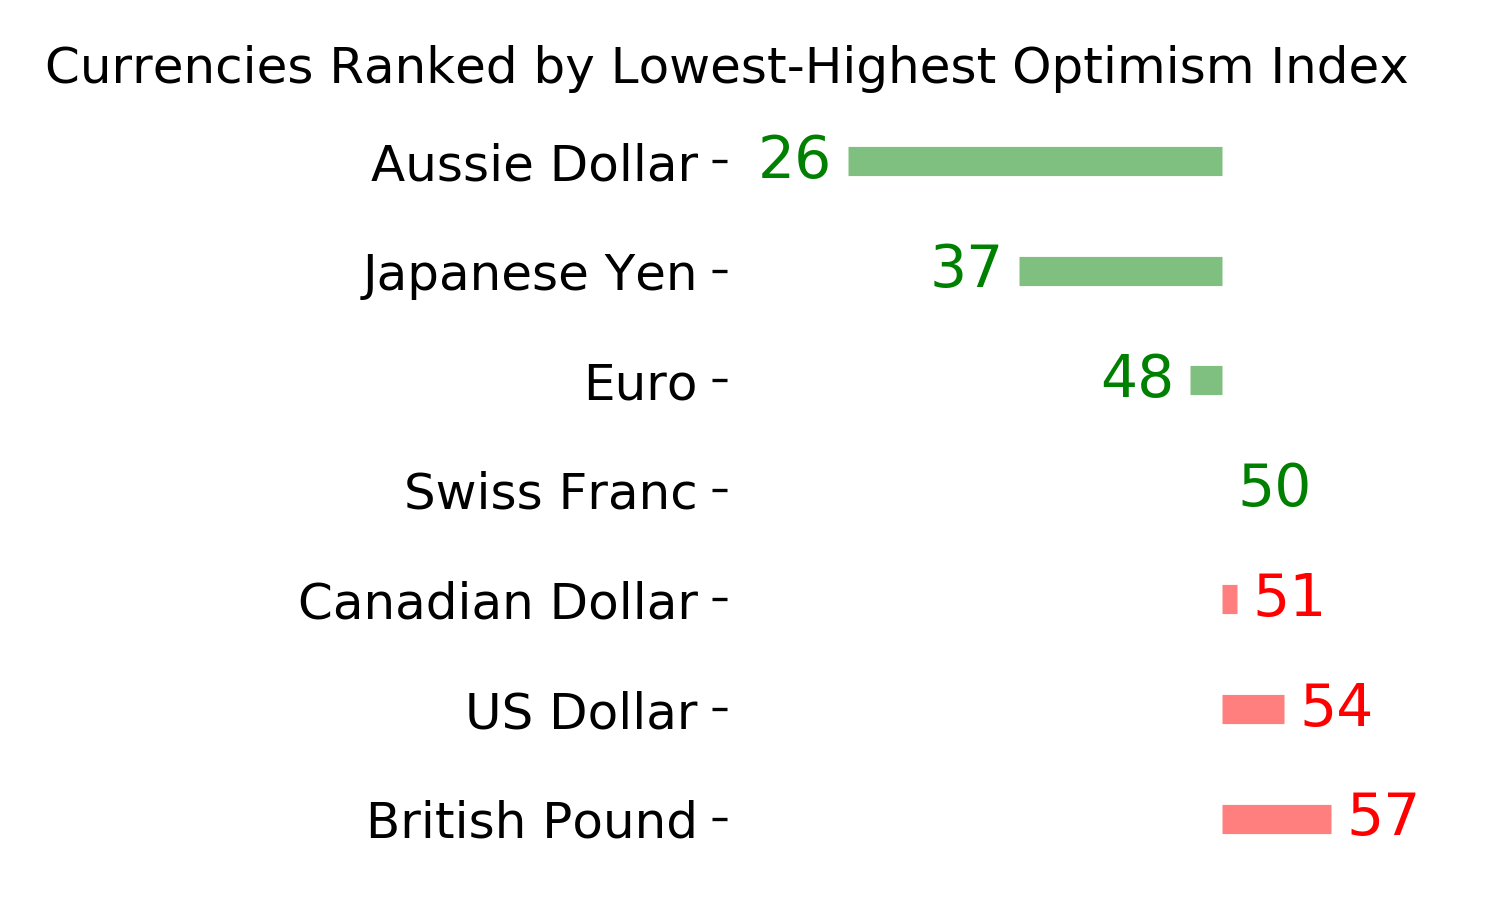
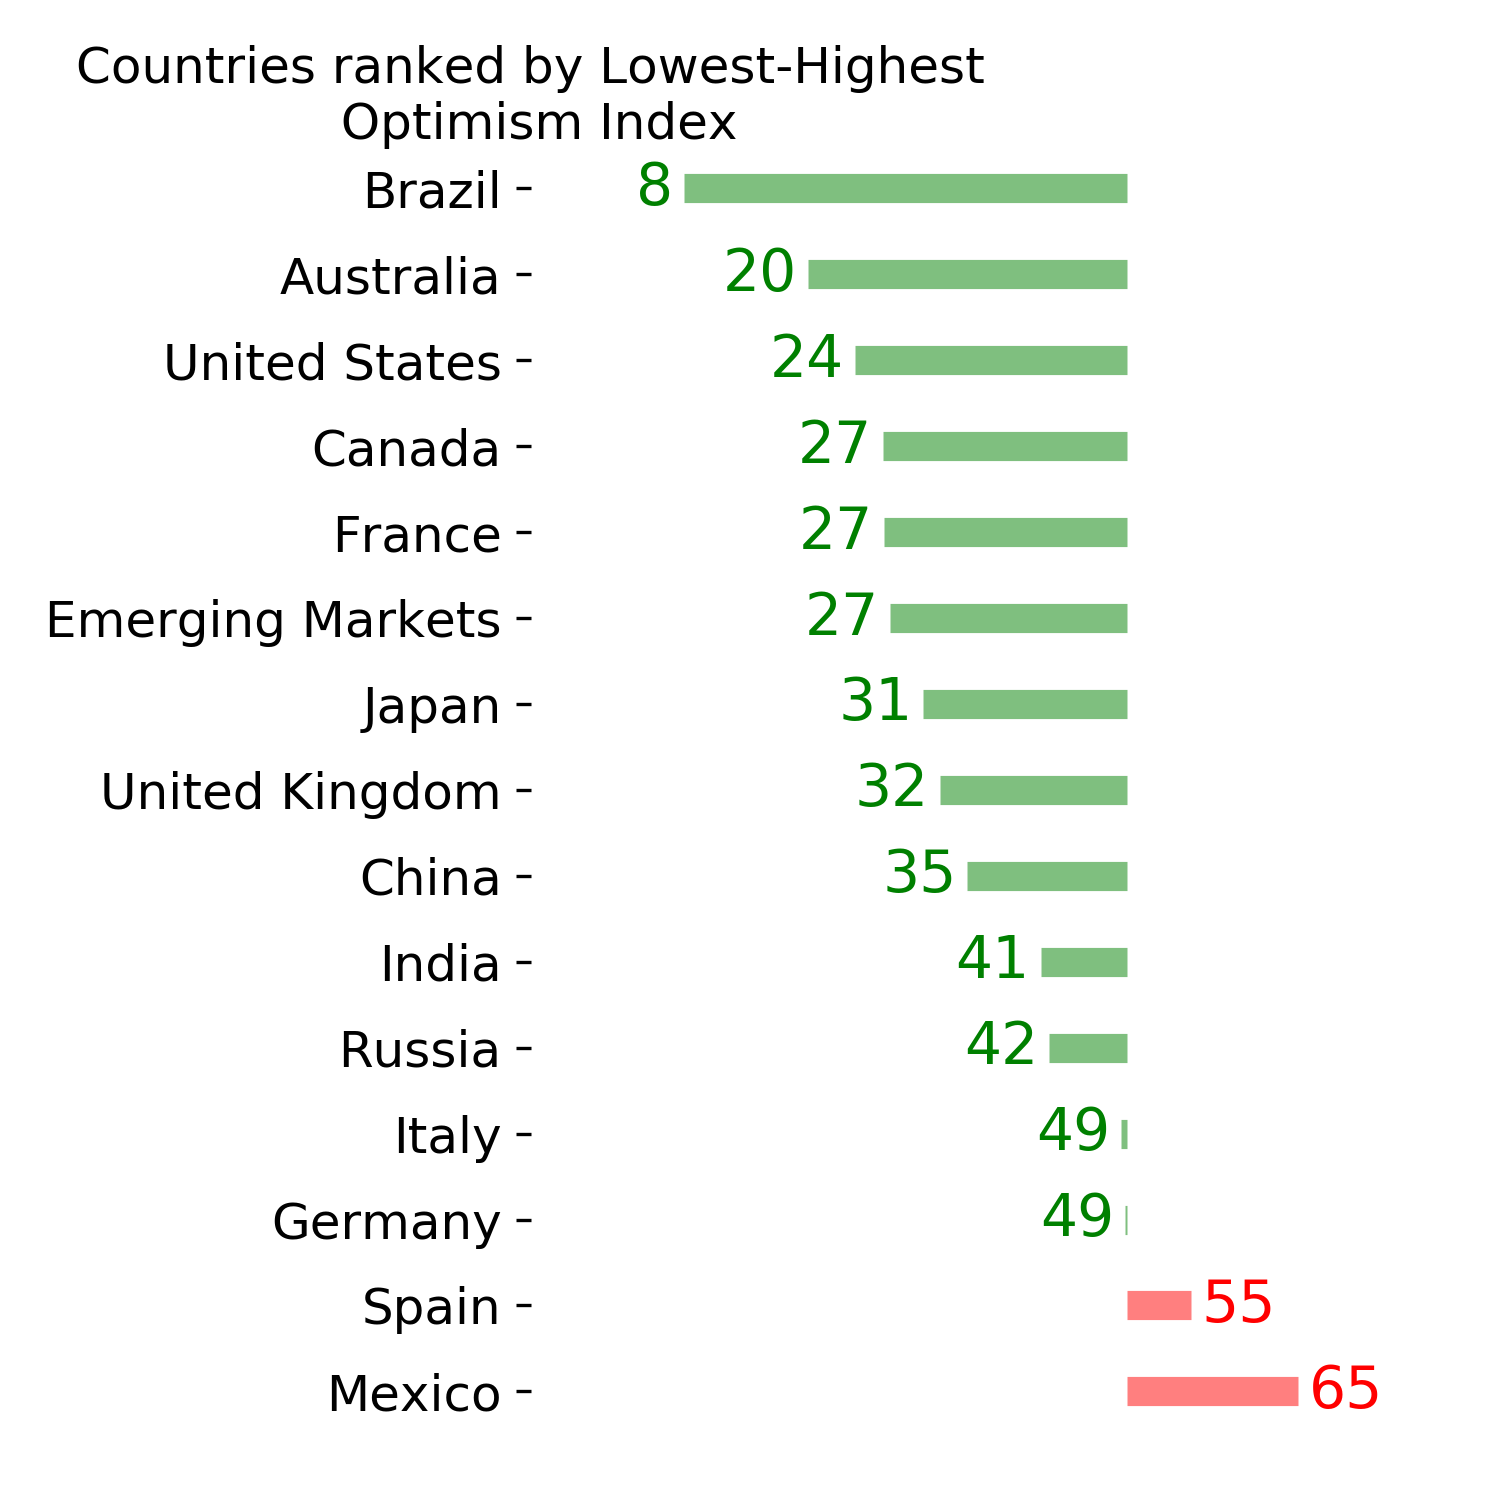
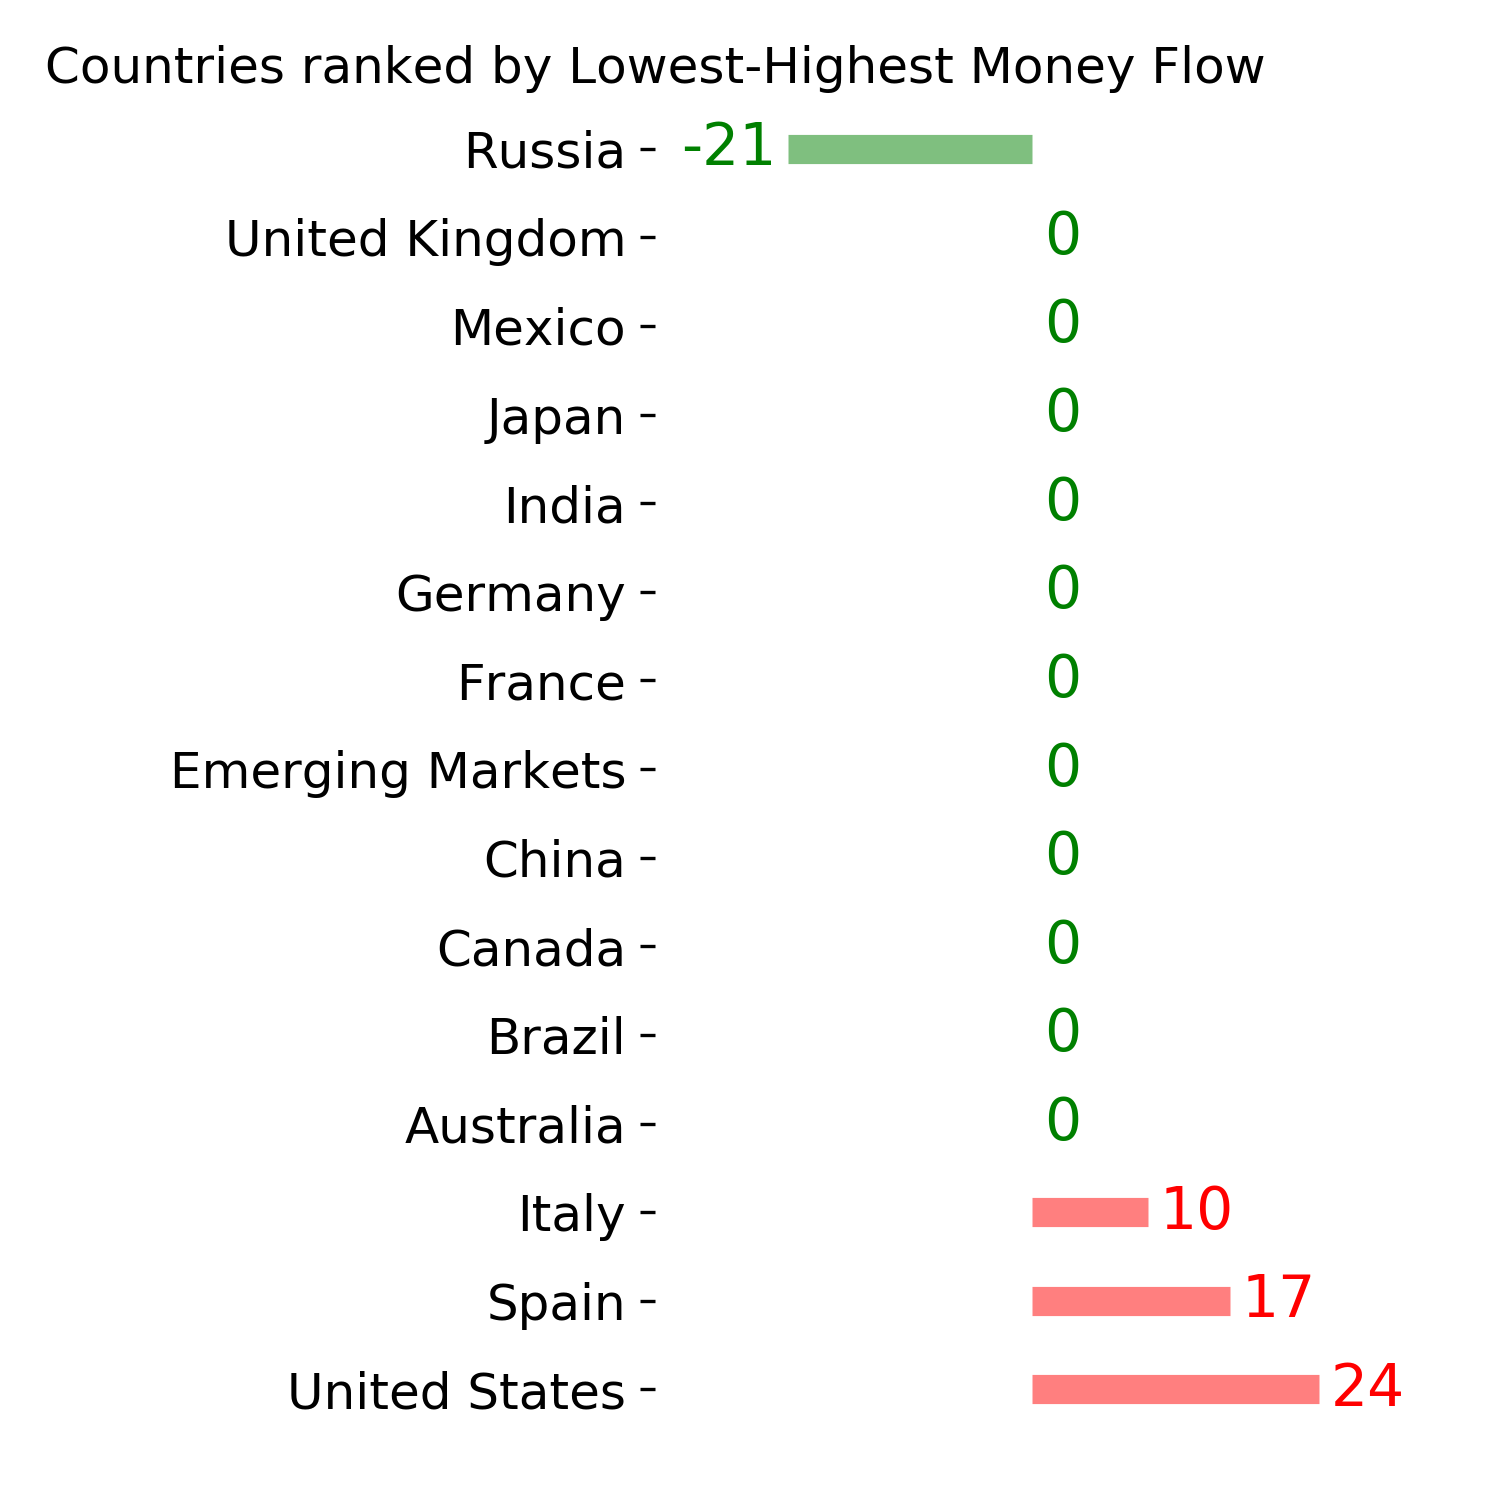
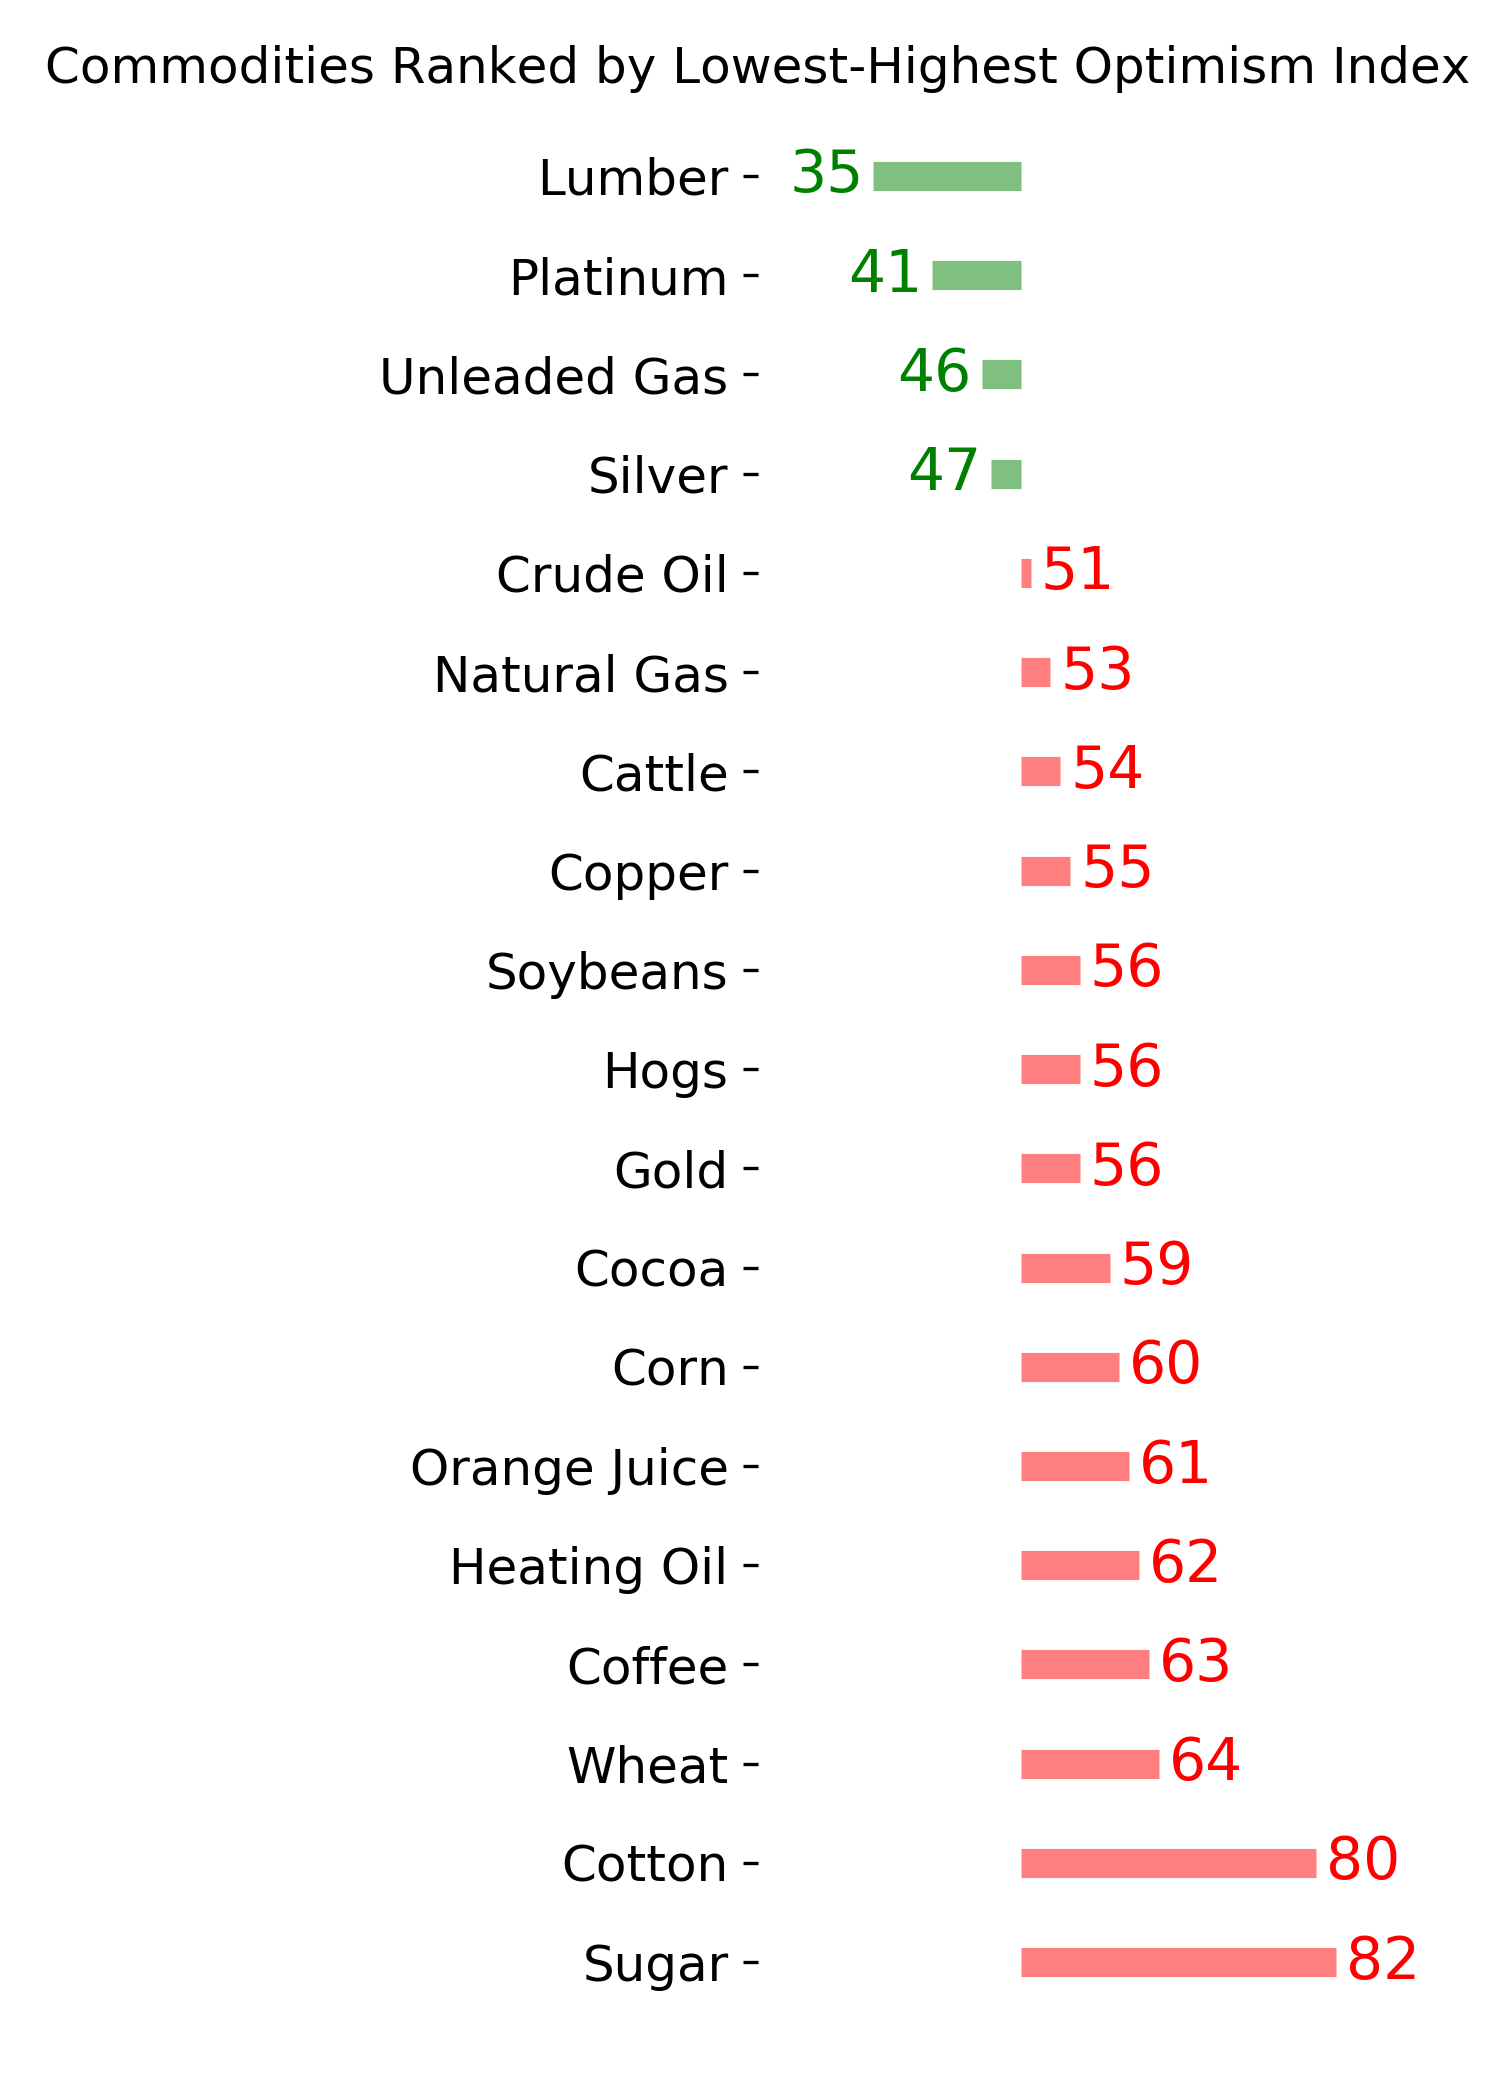
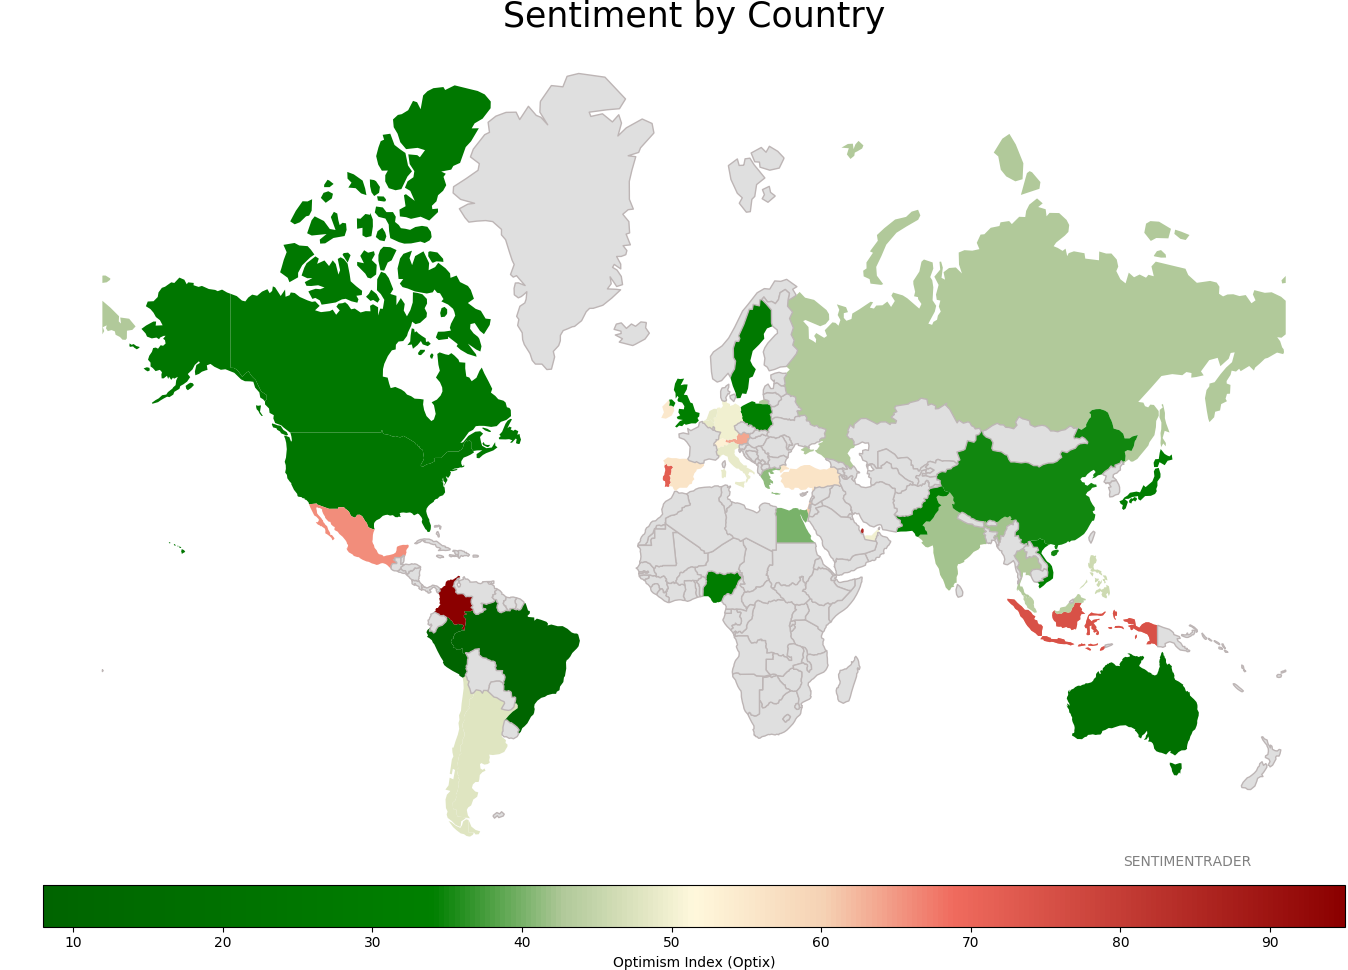
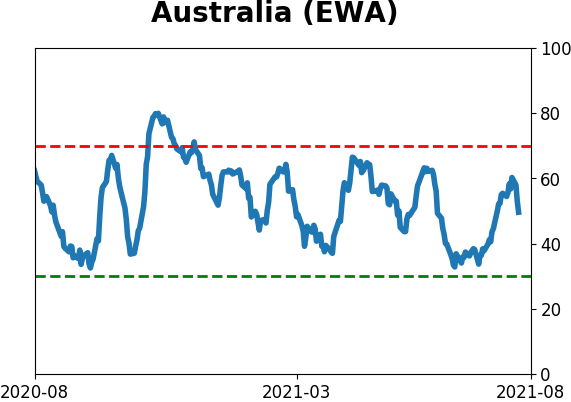
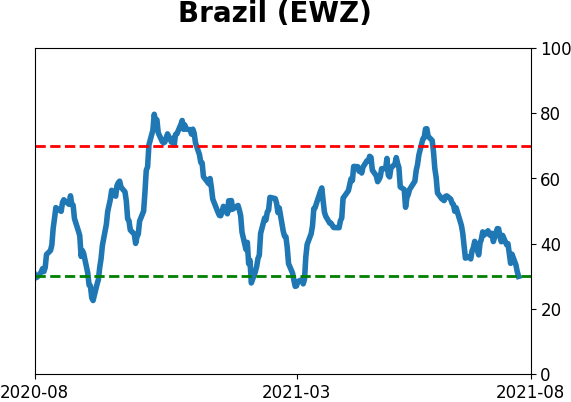
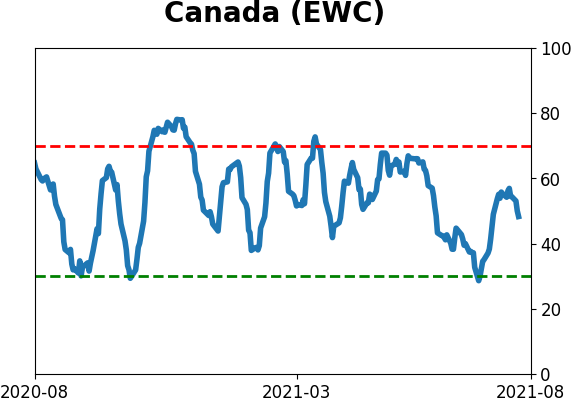
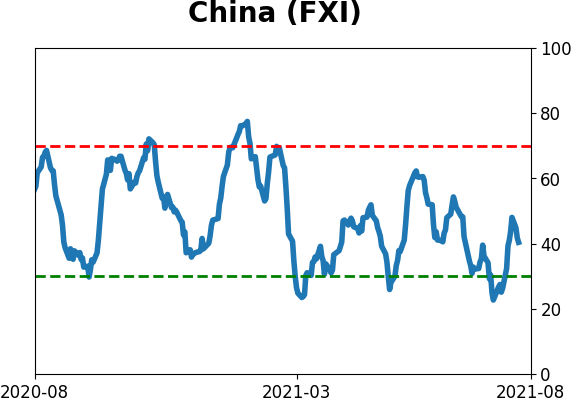
Sentiment Around The World
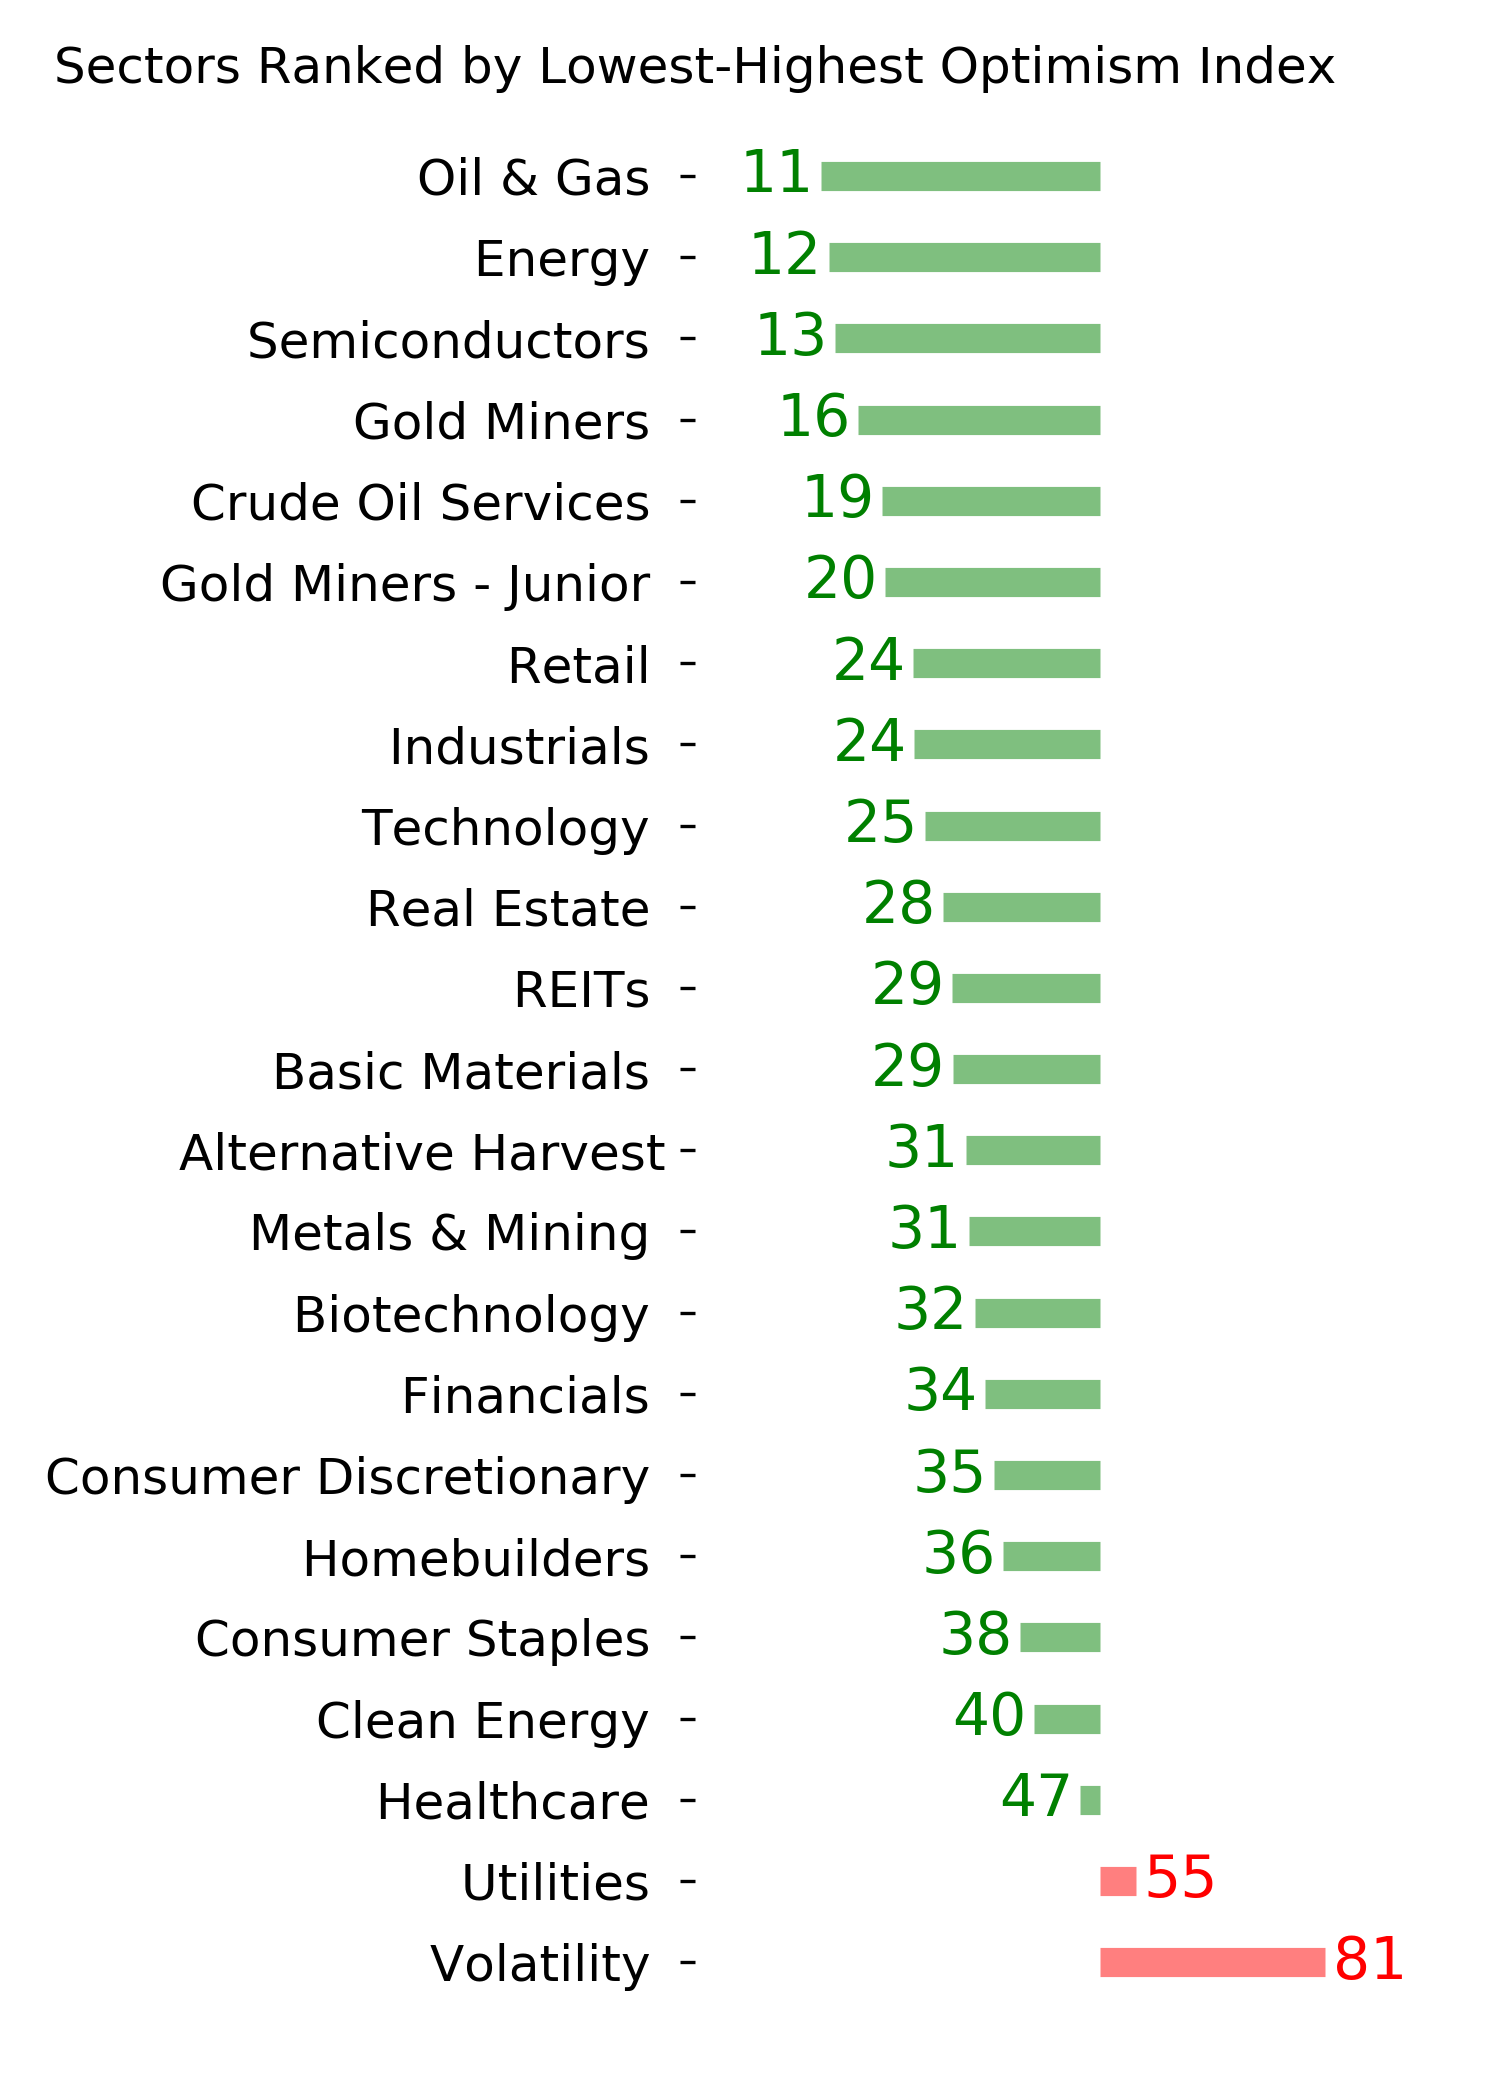
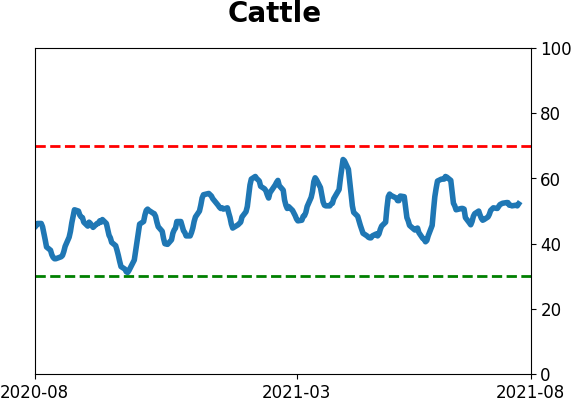
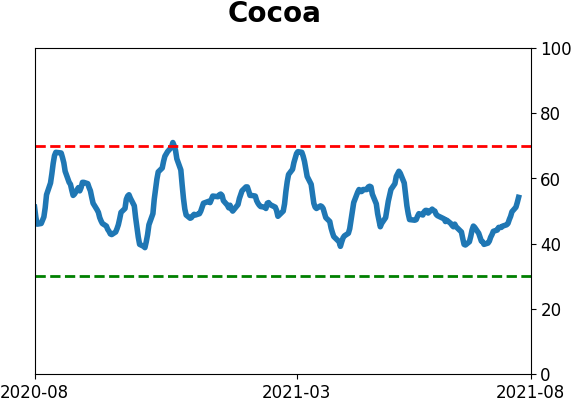
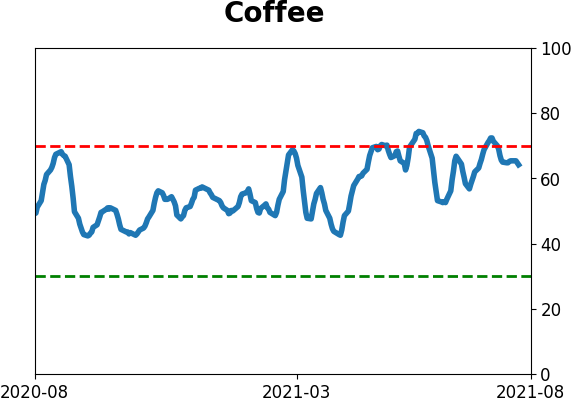
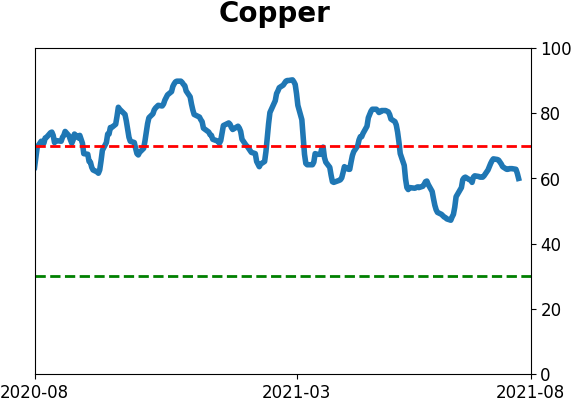
Optimism Index Thumbnails
|
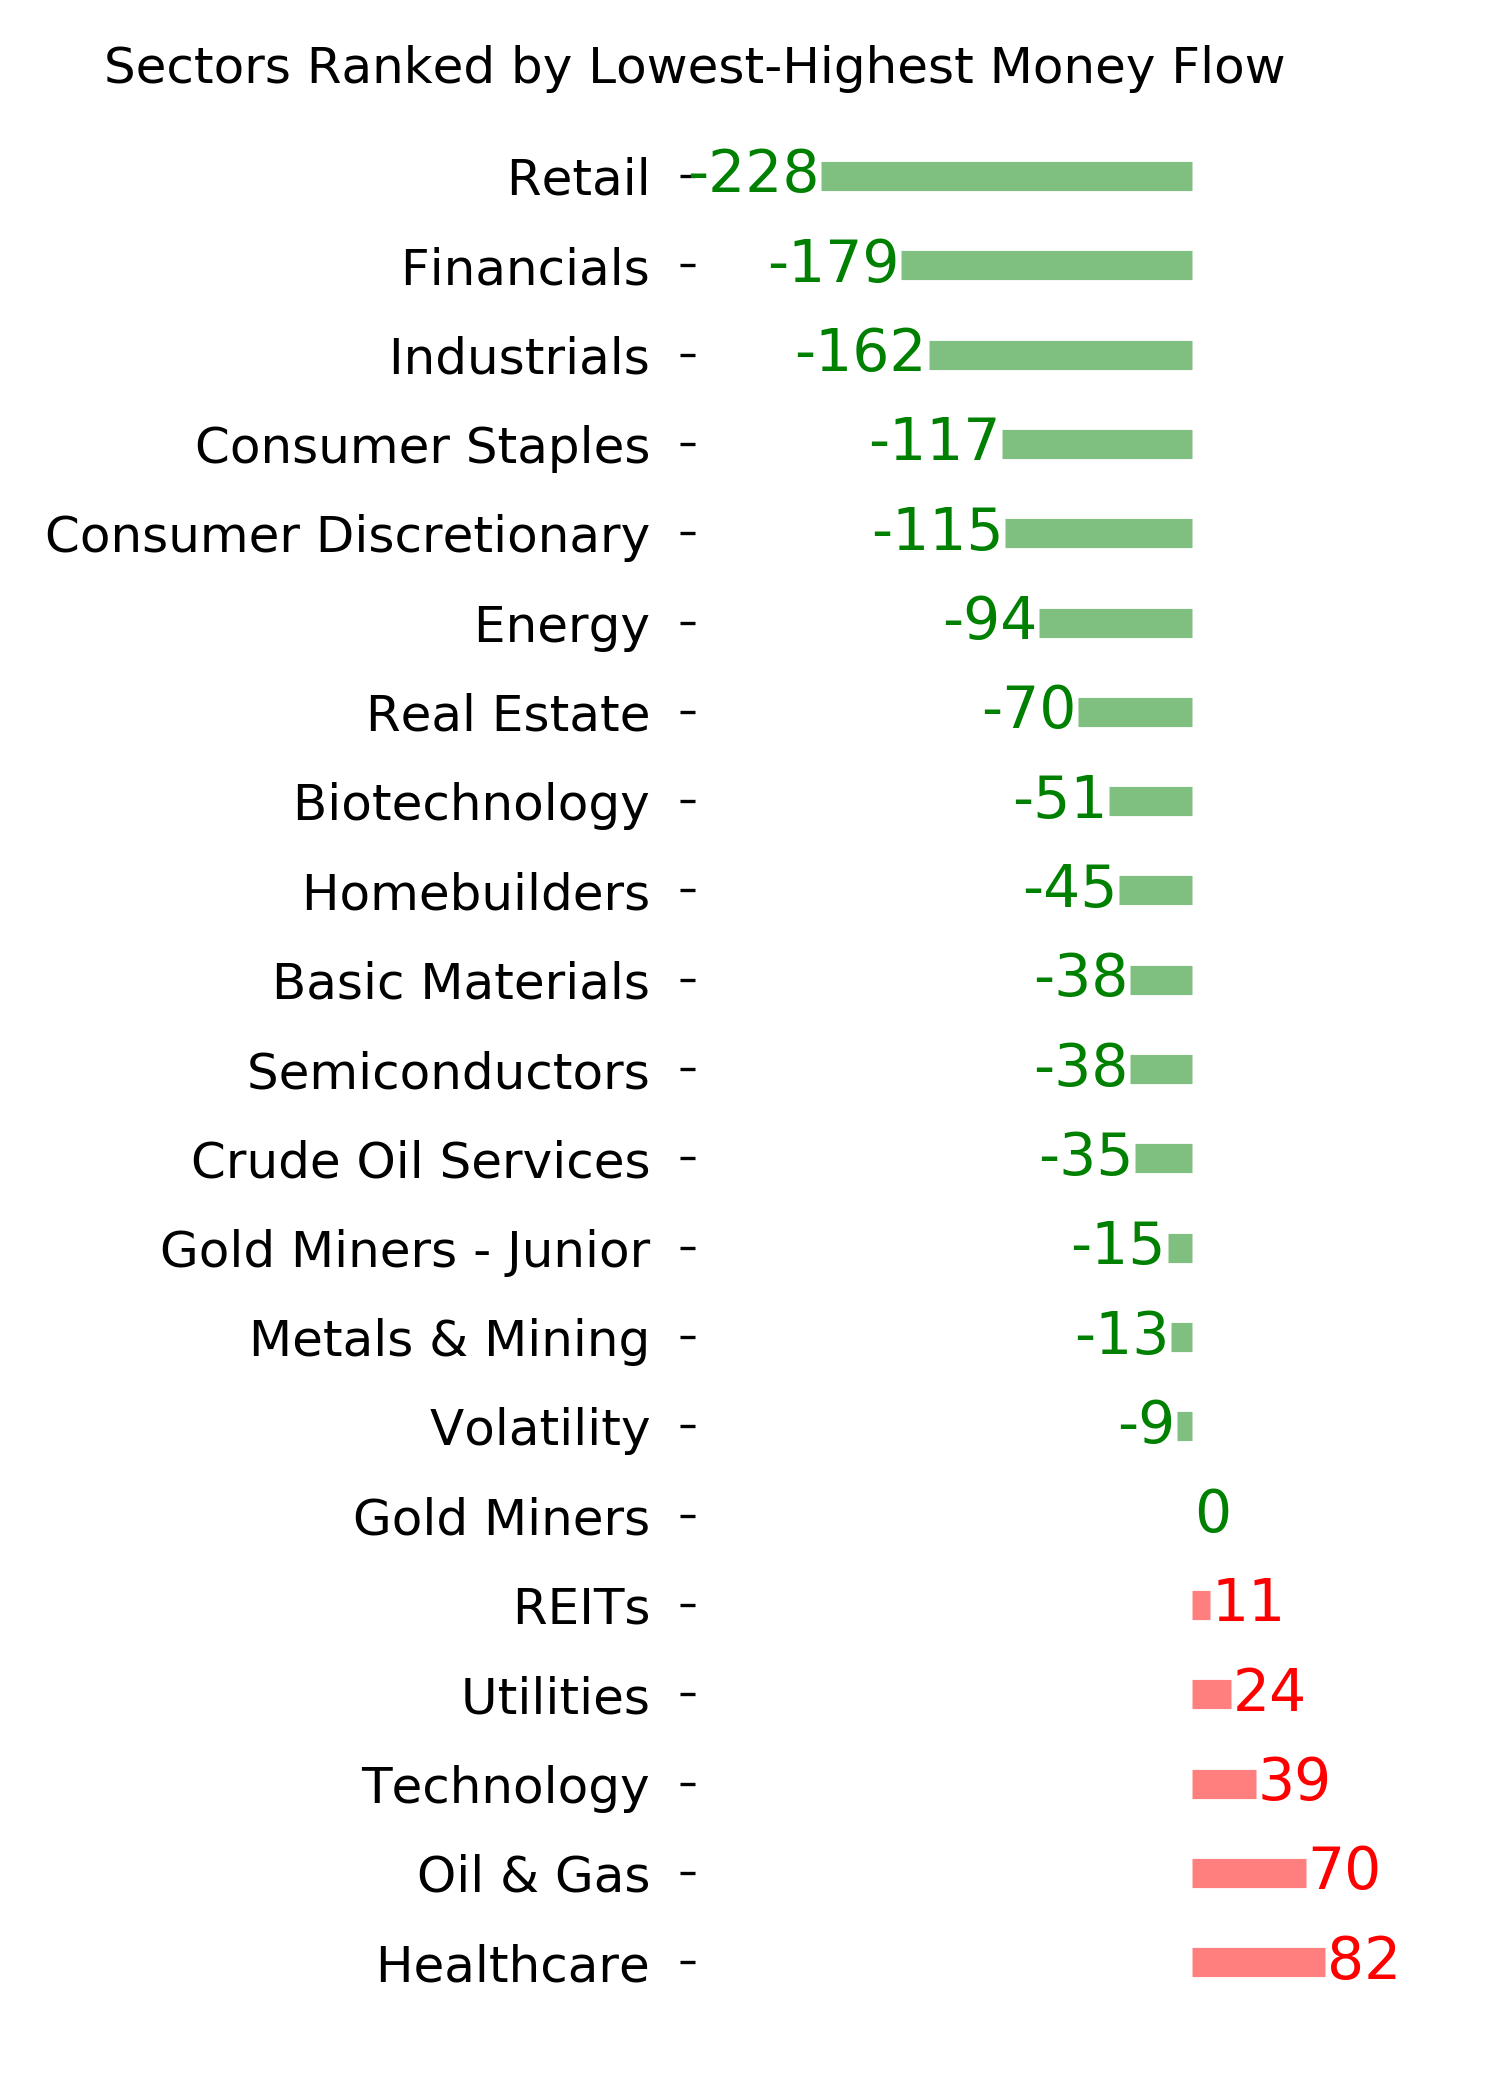
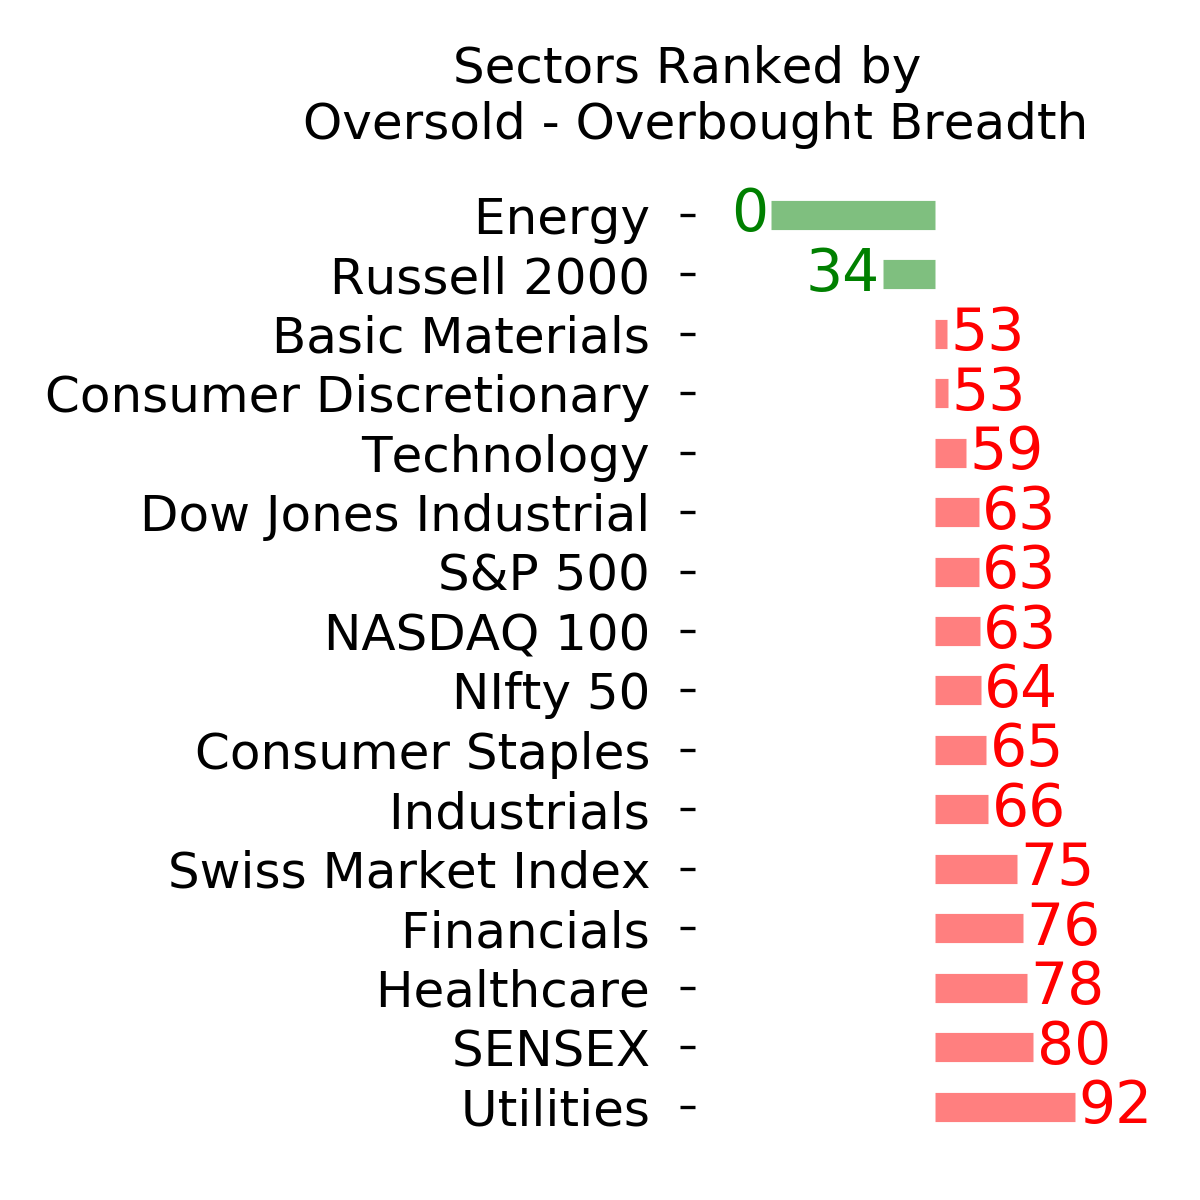
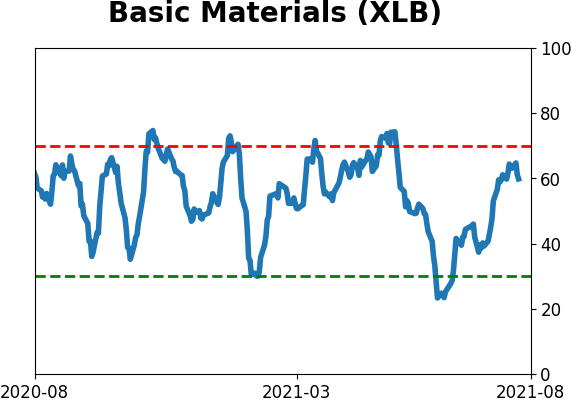
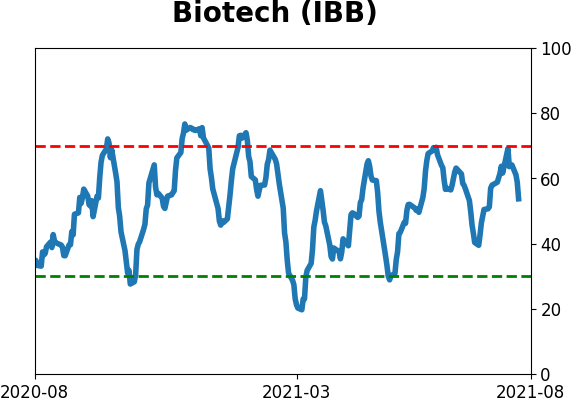
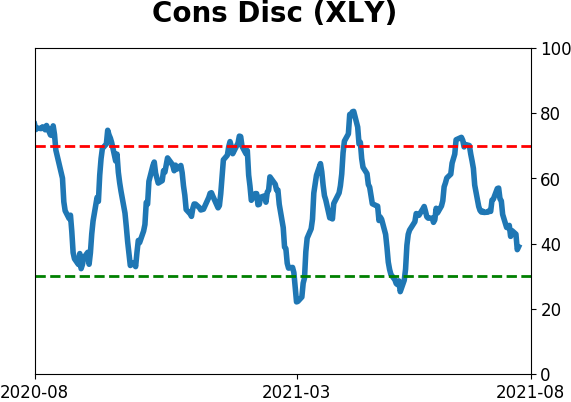
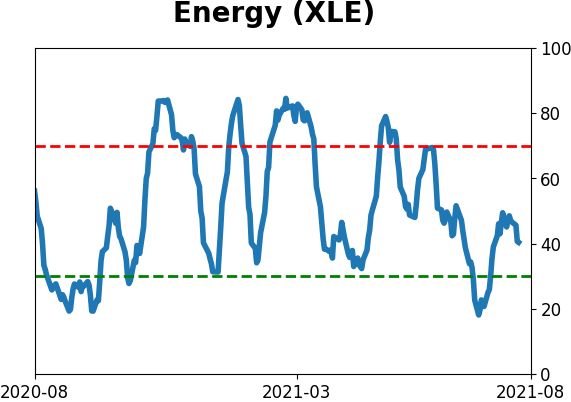
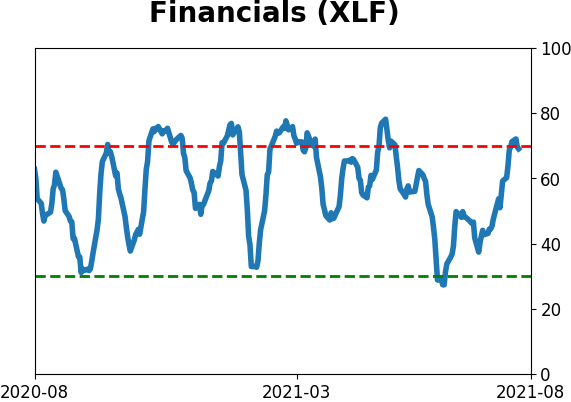
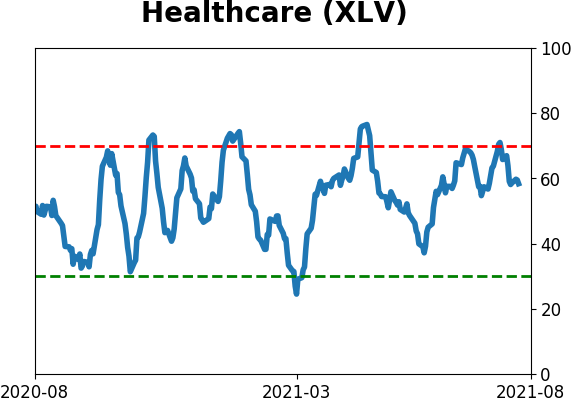
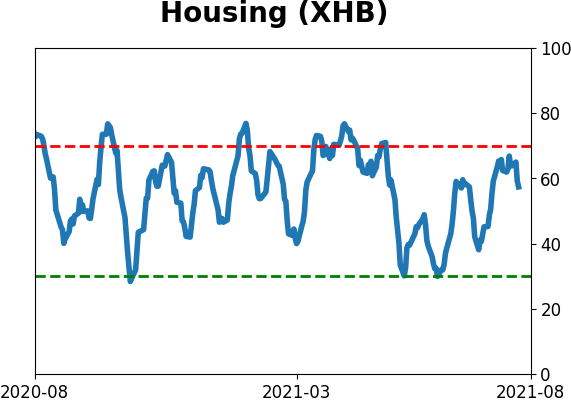
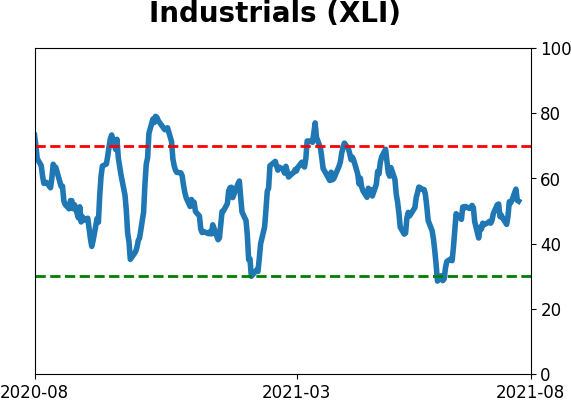
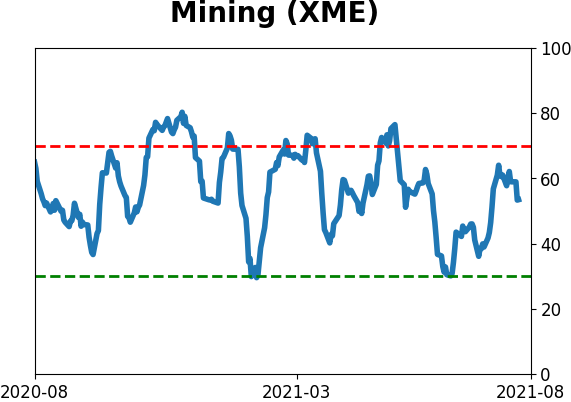
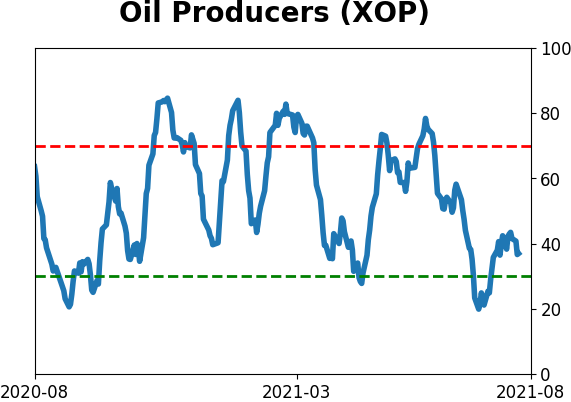
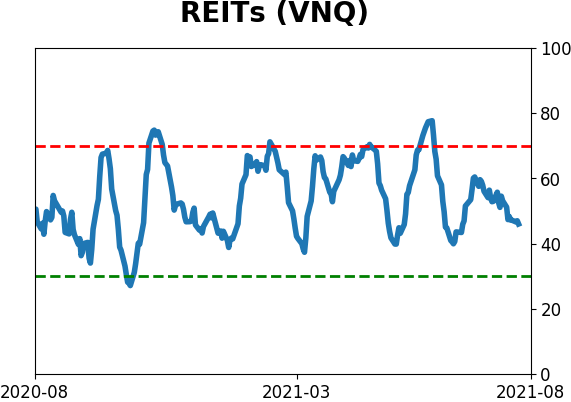
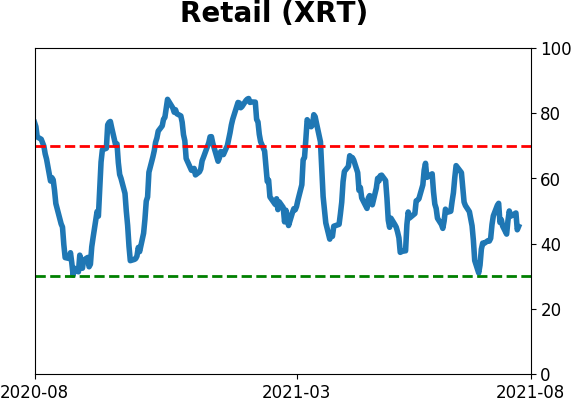
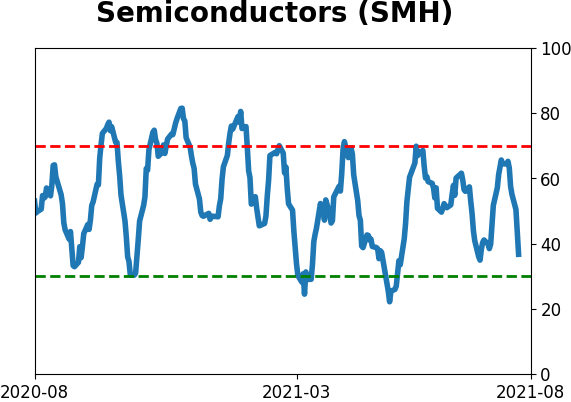
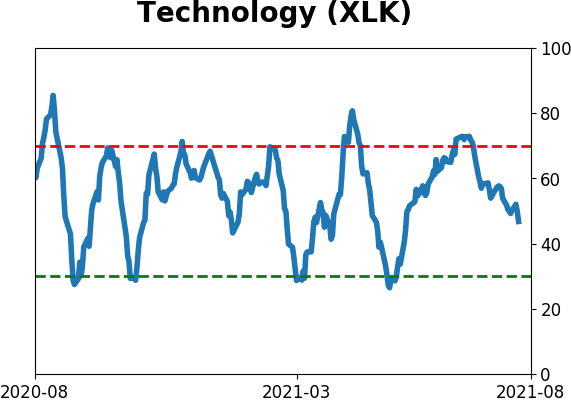
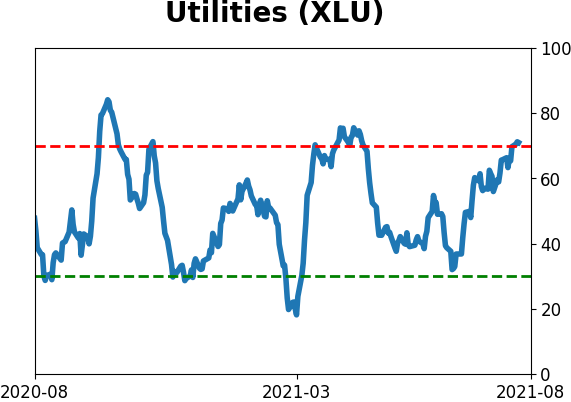
Sector ETF's - 10-Day Moving Average
|
|
|
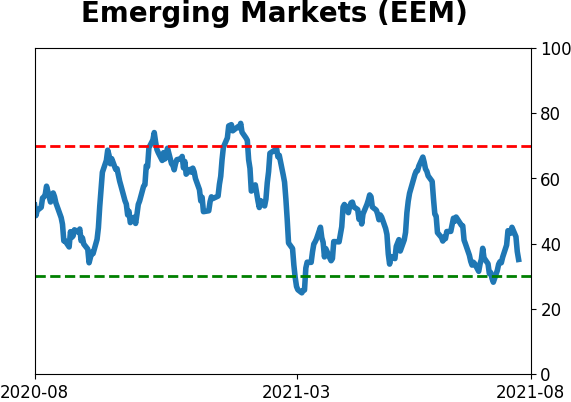
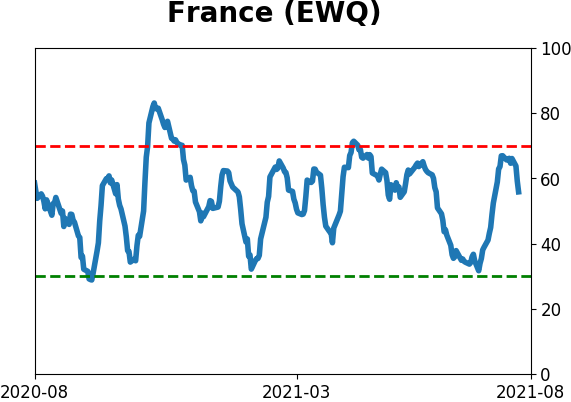
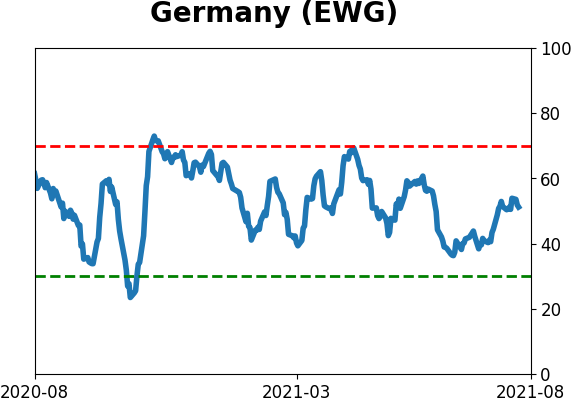
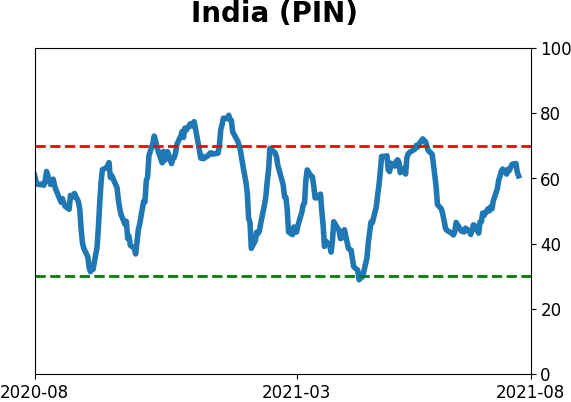
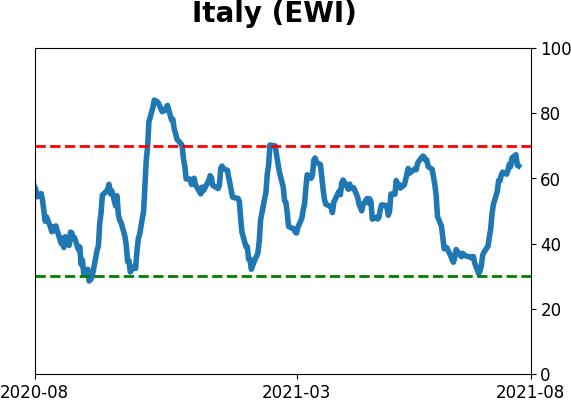
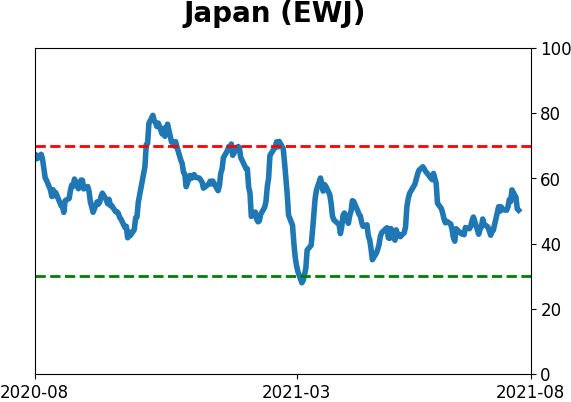
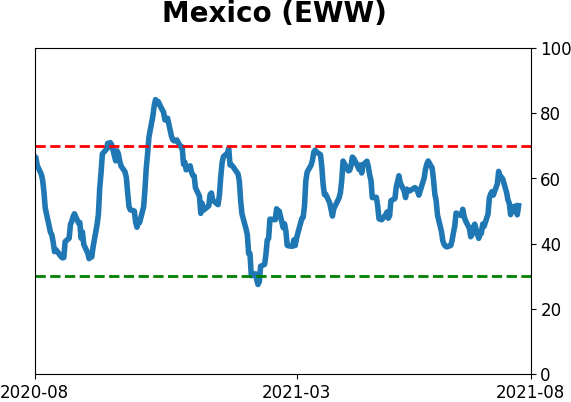
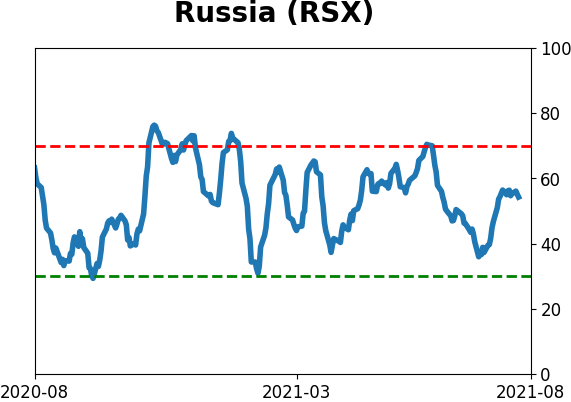
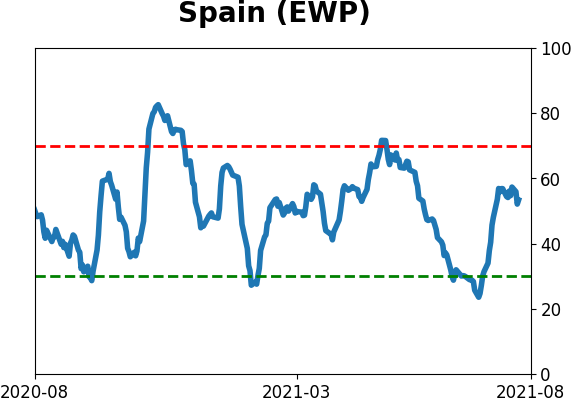
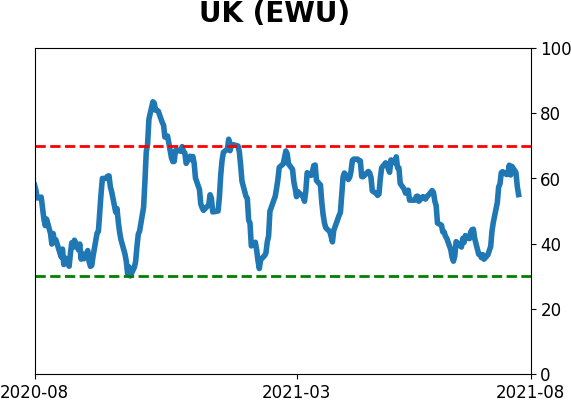
Country ETF's - 10-Day Moving Average
|
|
|
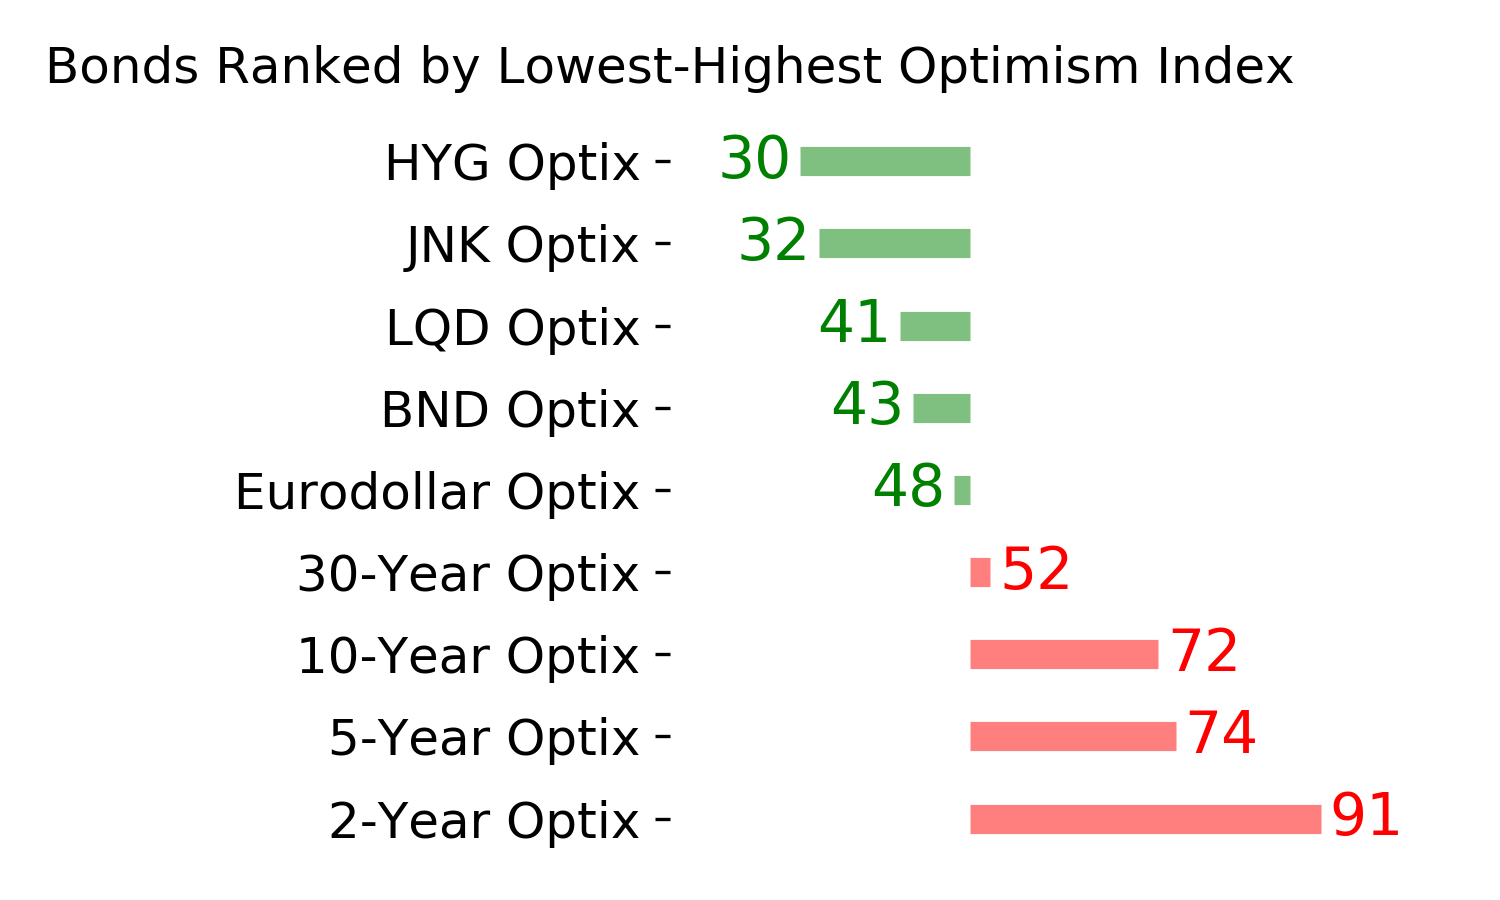
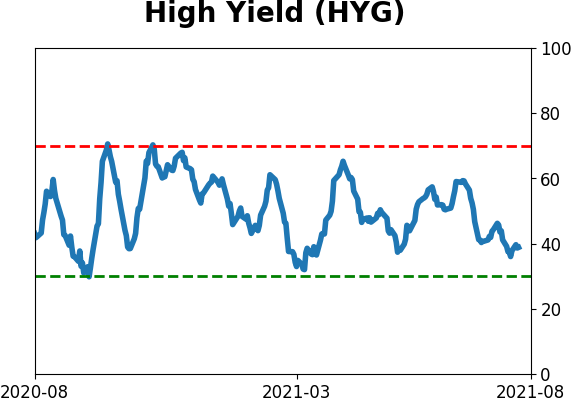
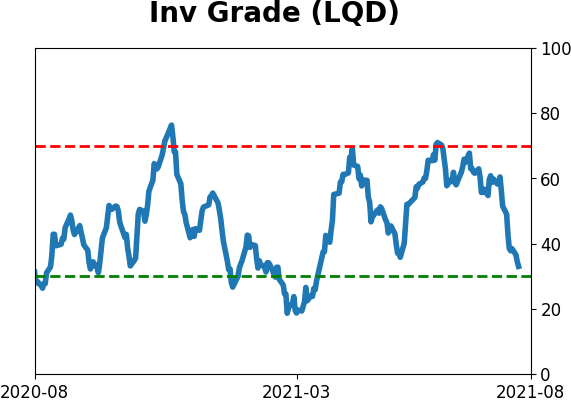
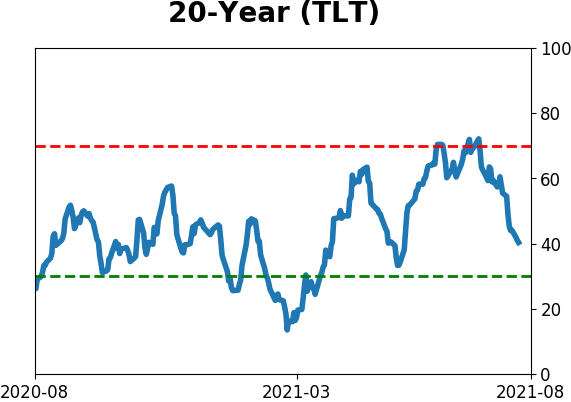
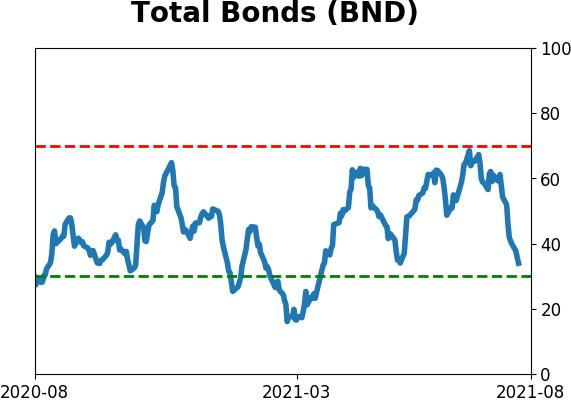
Bond ETF's - 10-Day Moving Average
|
|
|
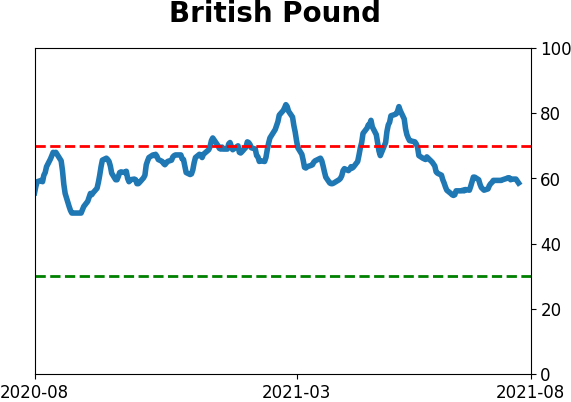
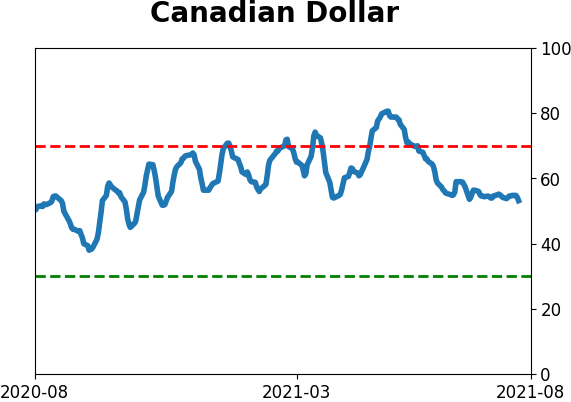
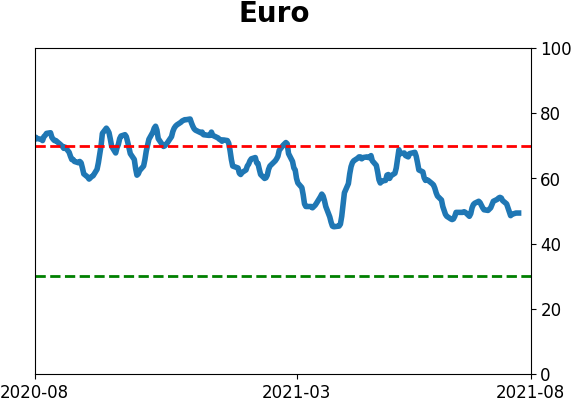
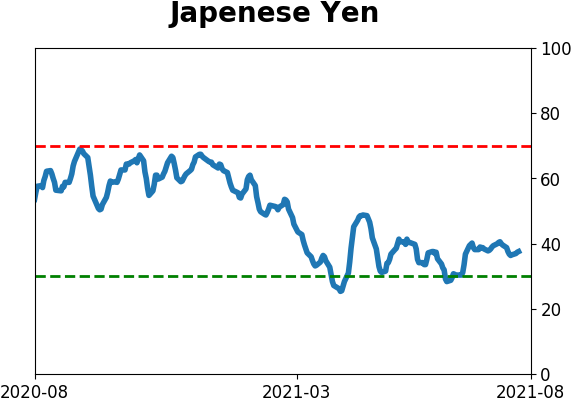
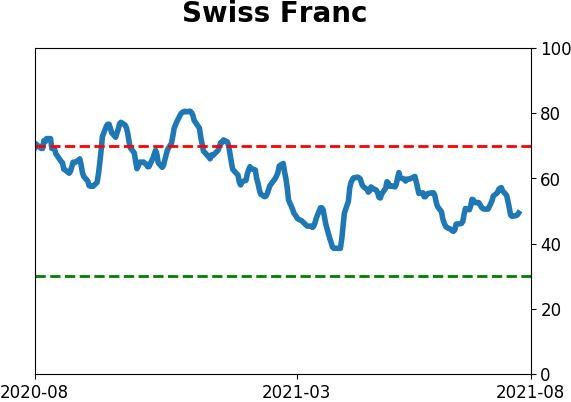
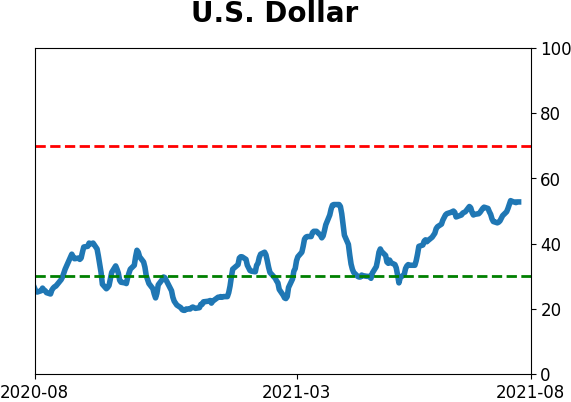
Currency ETF's - 5-Day Moving Average
|
|
|
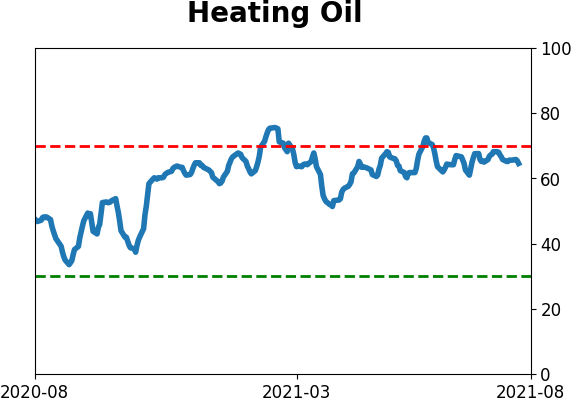
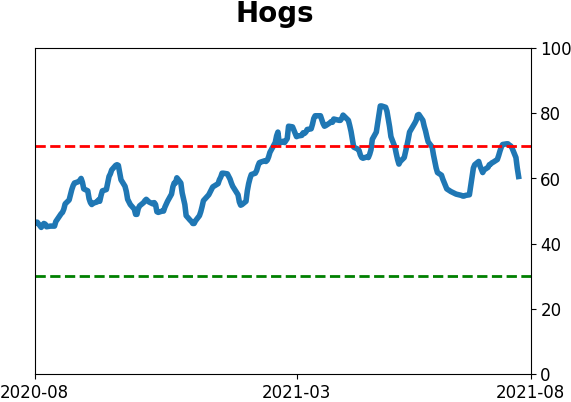
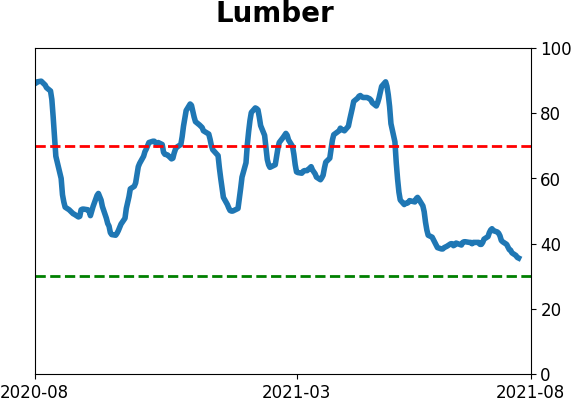
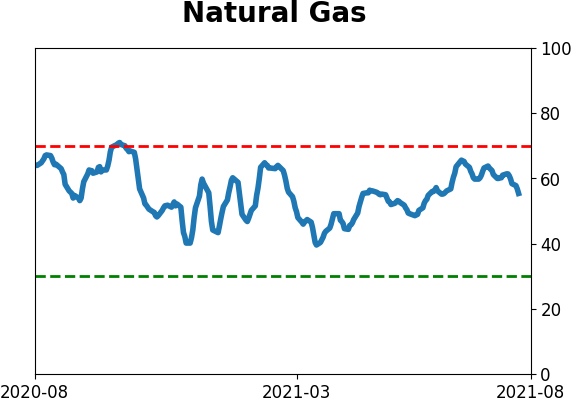
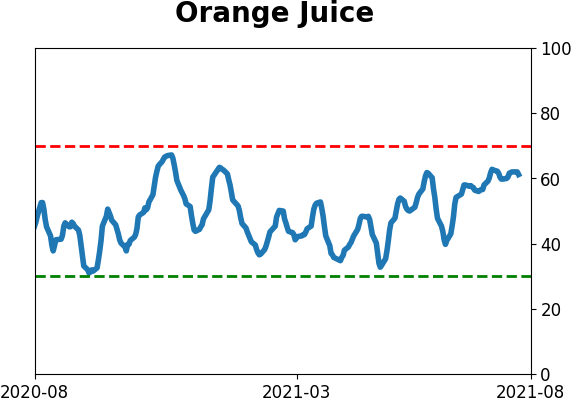
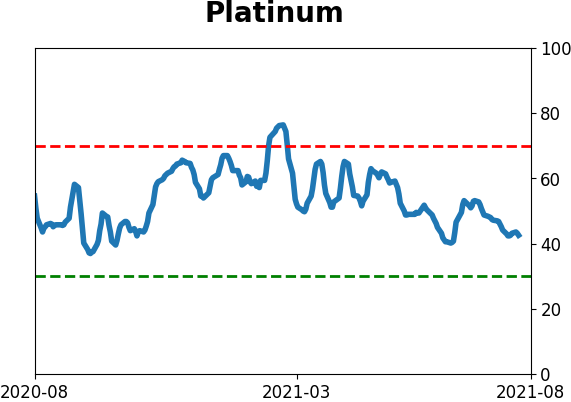
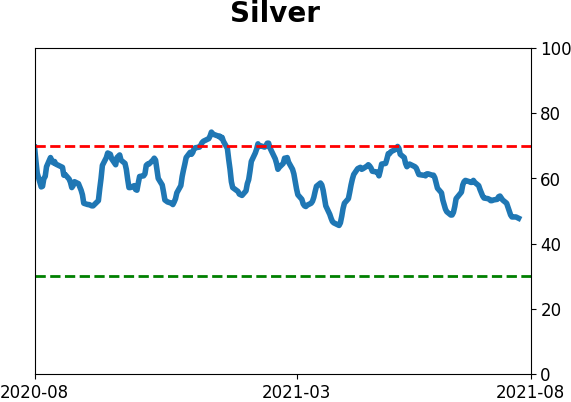
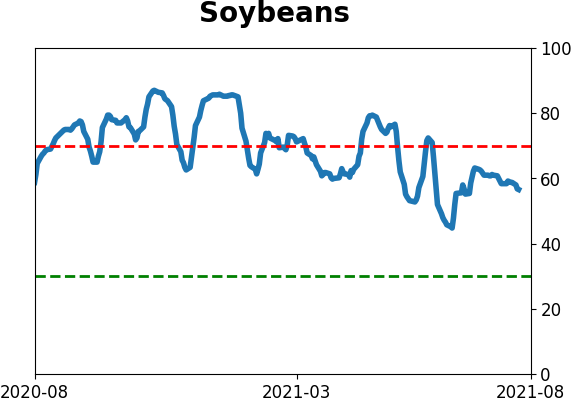
Commodity ETF's - 5-Day Moving Average
|
|