Headlines
|
|
The smart money keeps buying:
The Smart Money Flow Index tries to measure "smart money" investors by subtracting early-morning stock returns from closing prices. When well-informed investors are more willing to buy than emotional early-morning traders, it tends to be a good sign for stocks. The indicator recently broke out to a new high.
|
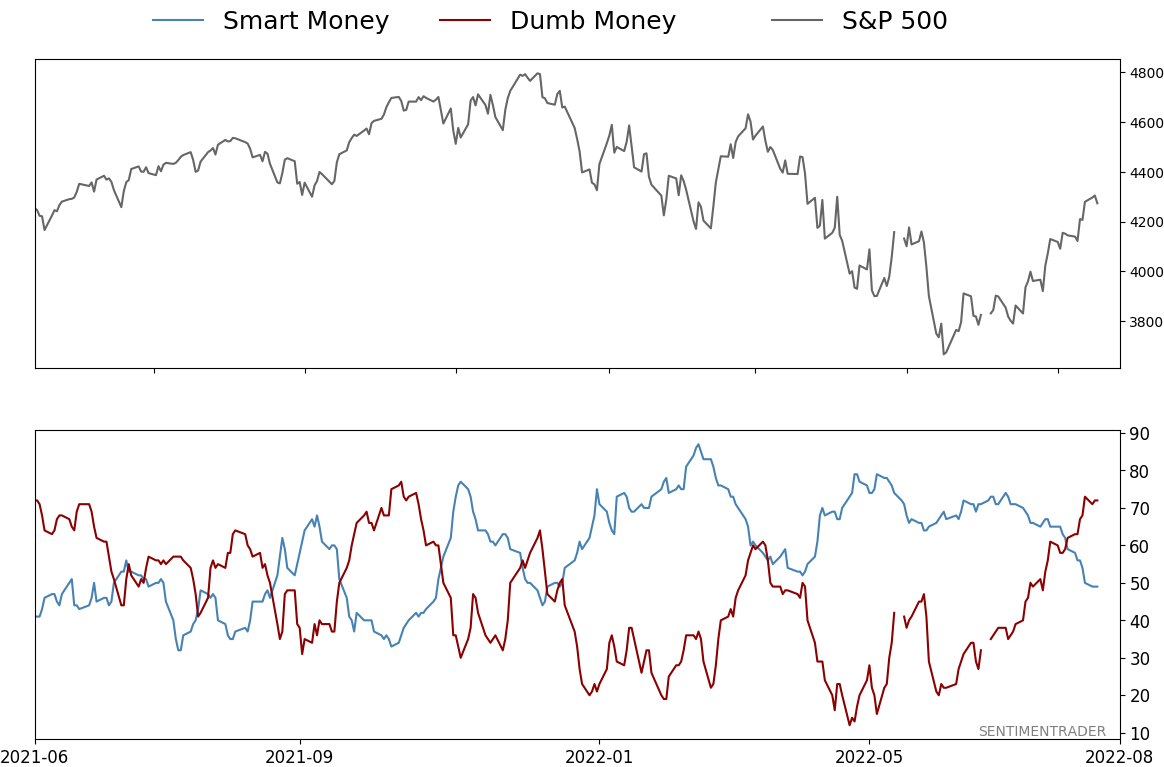
Smart / Dumb Money Confidence
|
Smart Money Confidence: 49%
Dumb Money Confidence: 72%
|
|
Risk Levels
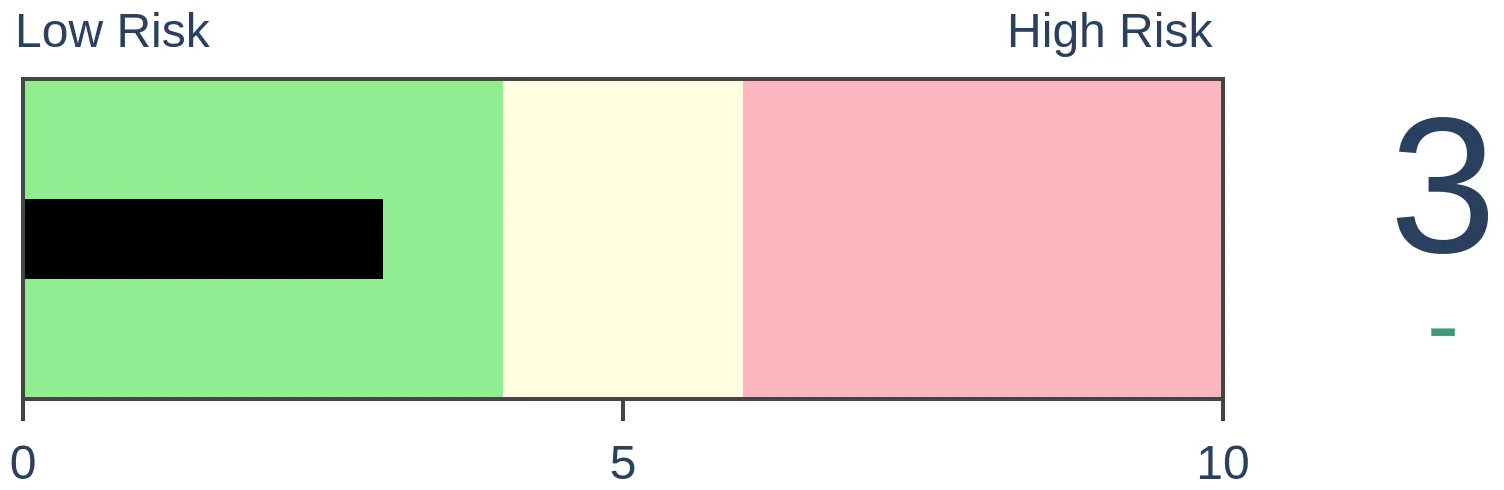
Stocks Short-Term
|
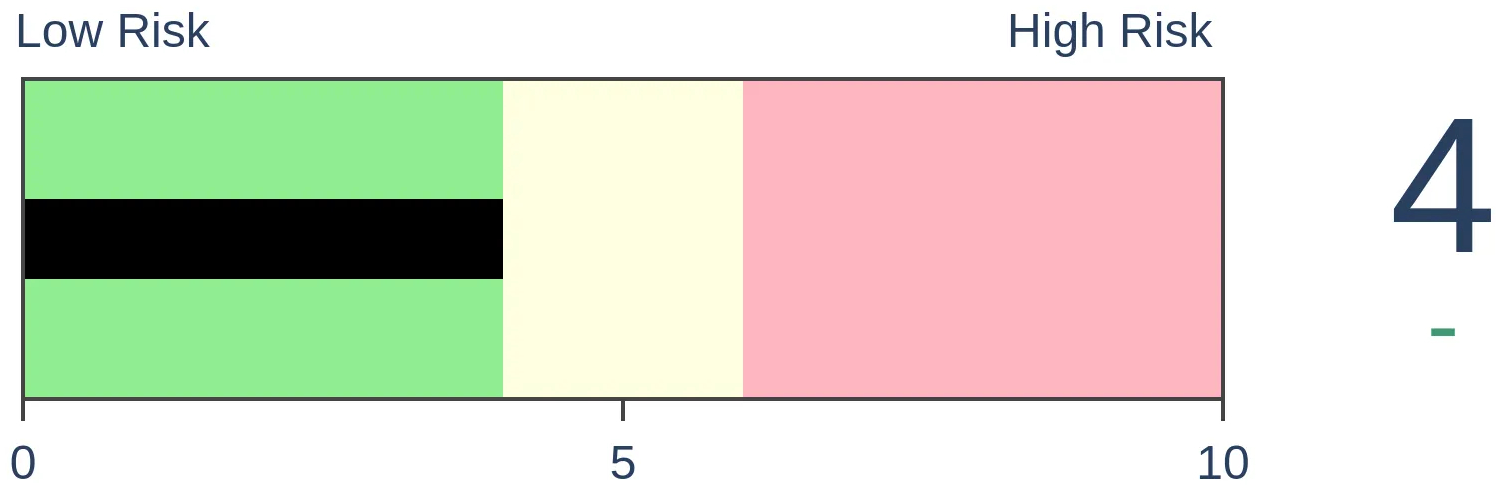
Stocks Medium-Term
|
|
Bonds
|
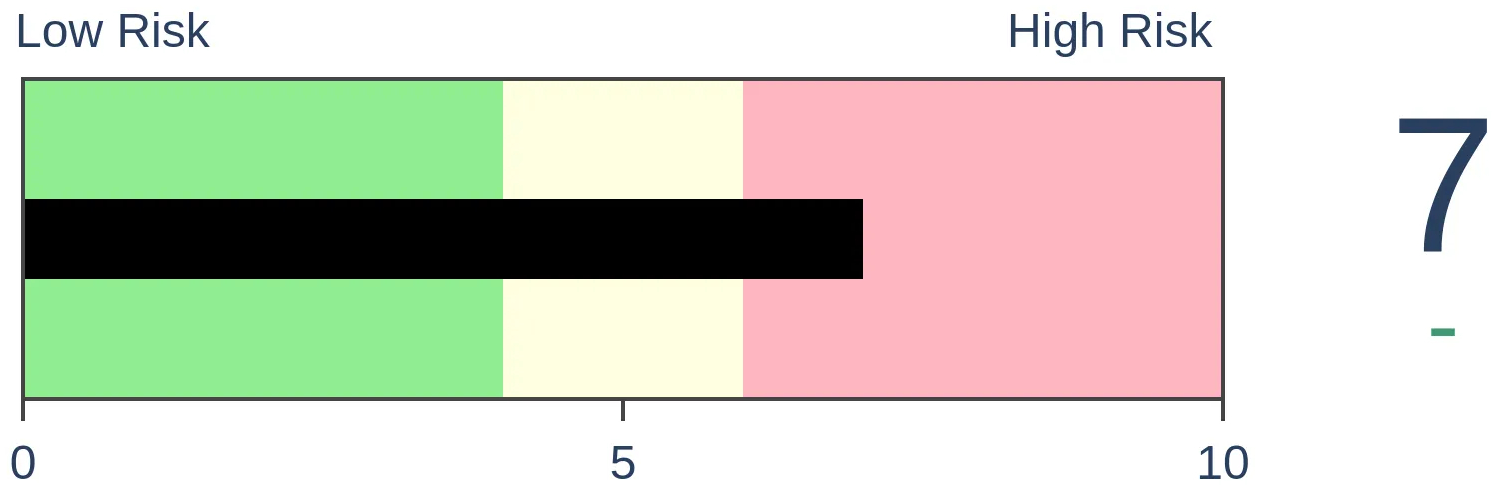
Crude Oil
|
|
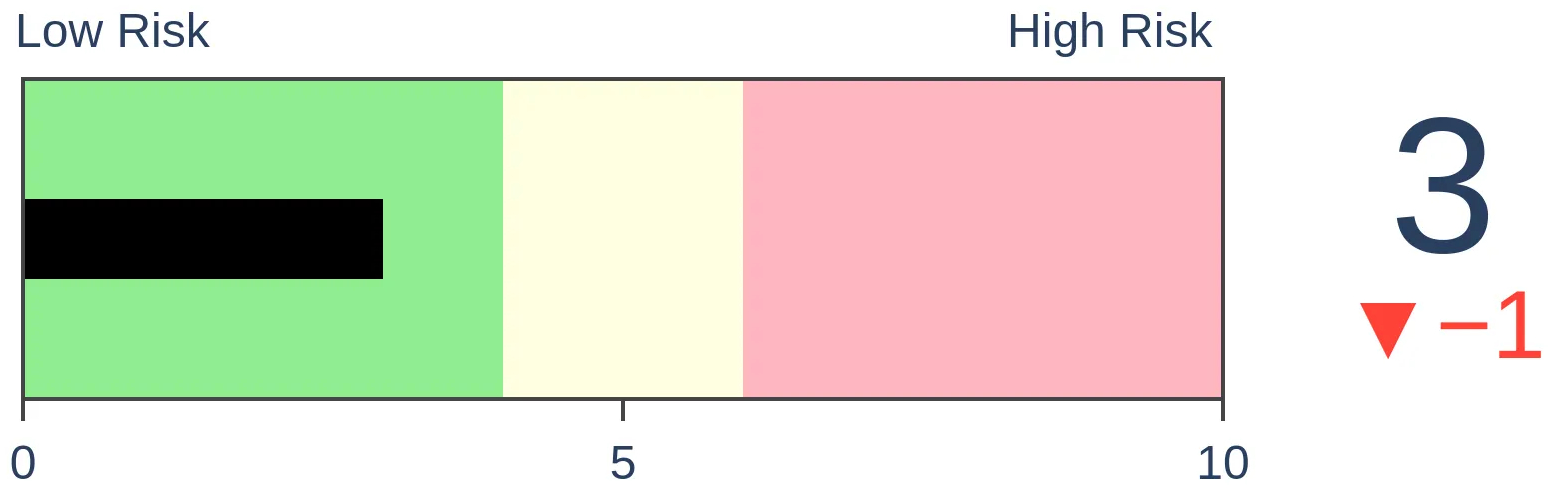
Gold

|
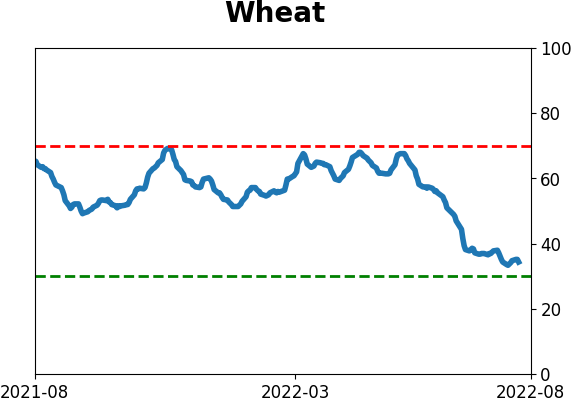
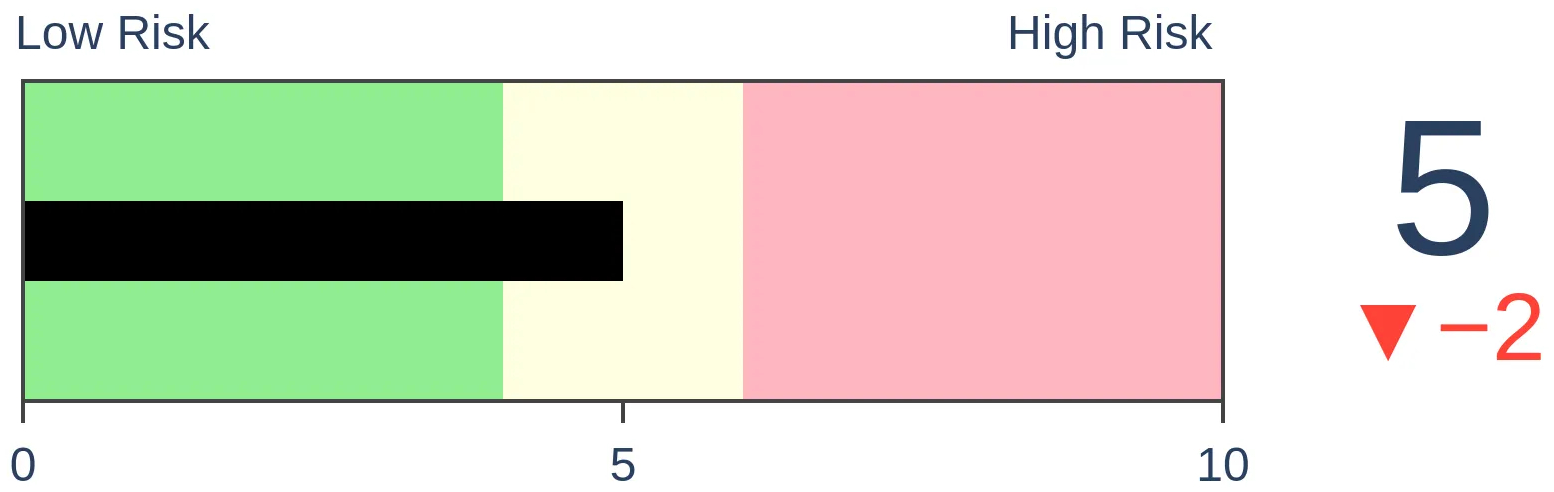
Agriculture
|
|
Research
By Jason Goepfert
BOTTOM LINE
The Smart Money Flow Index tries to measure "smart money" investors by subtracting early-morning stock returns from closing prices. When well-informed investors are more willing to buy than emotional early-morning traders, it tends to be a good sign for stocks. The indicator recently broke out to a new high.
FORECAST / TIMEFRAME
None
|
Key points:
- The Smart Money Flow Index monitors trading in stocks at the open versus the close
- The index recently broke out to a new high and has kept increasing, suggesting more "smart money" buying
- Similar behavior preceded gains in the S&P 500 over the next year, with an excellent risk/reward ratio
The "smart money" seems interested in buying
In February 2021, there was compelling evidence that dumb money traders were in a state of speculative euphoria while smart money investors were busy selling.
As judged by an index like the S&P 500, stocks kept climbing for months afterward. But to be fair, that was also when some of the most speculative parts of the market started to crack, ultimately erasing 30% - 70% (or more) of their value.
An argument can be made that we're seeing the opposite scenario now. Sentiment in June reached one of the most egregious extremes of pessimism we'd seen in decades, and smart money has been buying. It broke out to a new 52-week high a couple of weeks ago and hasn't fallen apart.
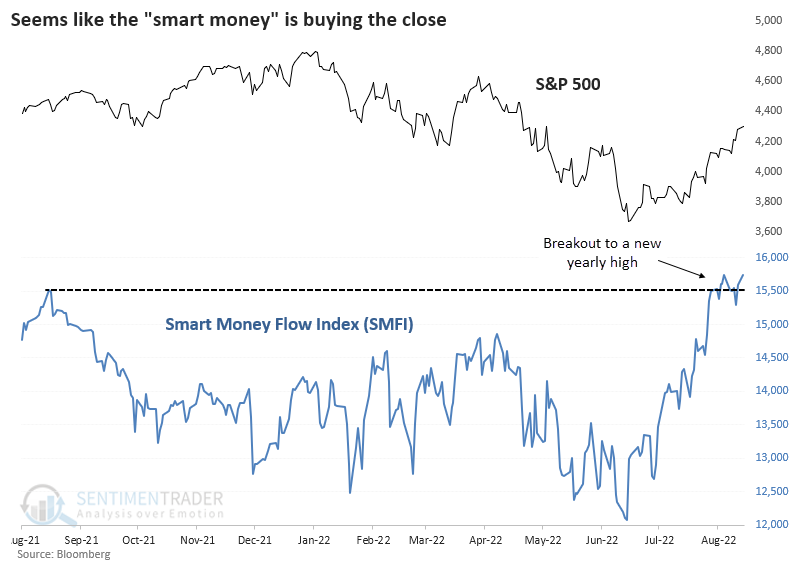
Here, "smart money" refers to the Smart Money Flow Index (SMFI) calculated by Bloomberg. It subtracts the price of the Dow Industrials at 10 am from the previous day's close and then adds today's closing price.
The idea is that the first 30 minutes represent emotional buying, driven by greed and fear of the crowd based on good and bad news. Smart money waits until the end. These heavy hitters also have the best possible information available to them. It's an interesting theory that has been around for decades and is helpful to watch. Don't expect it to be perfect or responsive enough to be used for day trading.
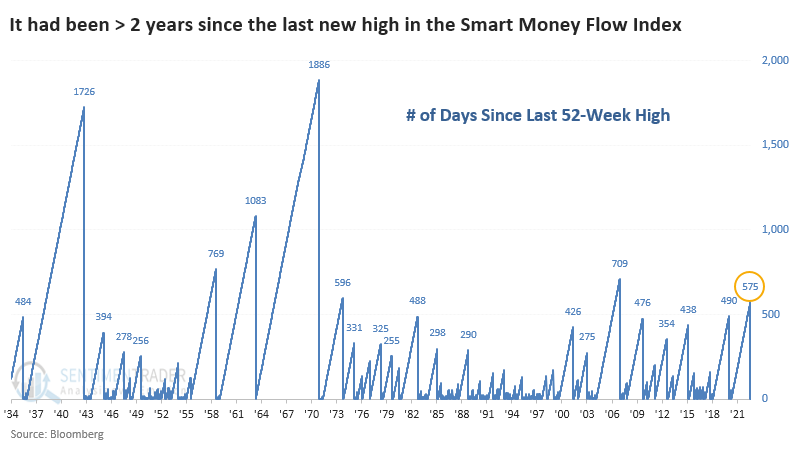
The latest surge in the SMFI culminated in the first 52-week high in more than two years. That ended one of the longest streaks without one in the indicator's history and the 2nd-longest in the past 40 years.
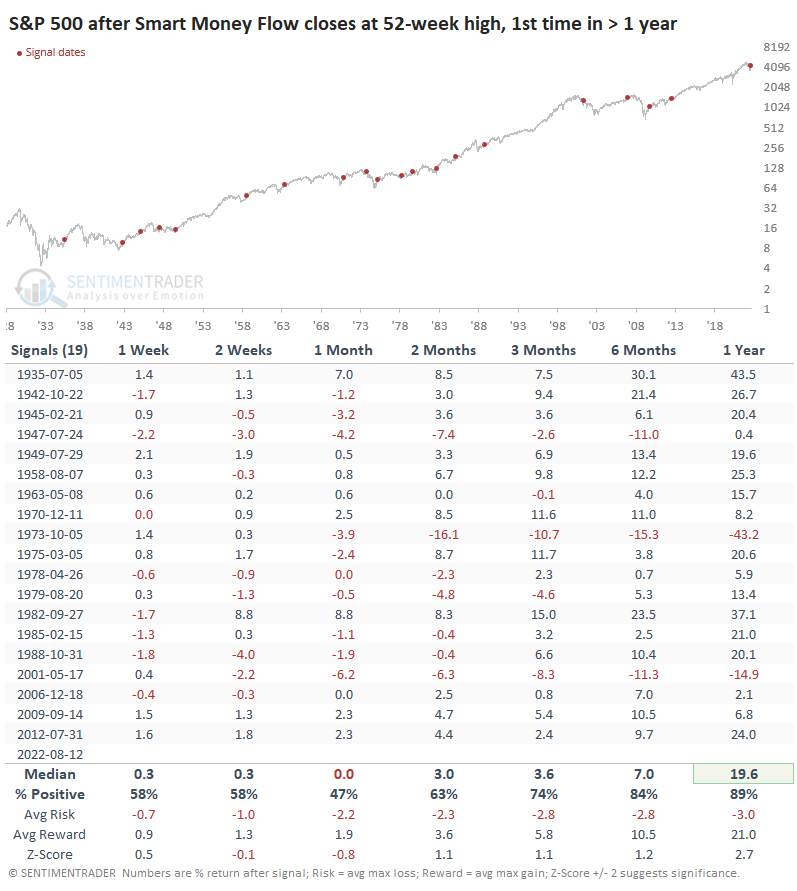
New highs in Smart Money have preceded good returns
Below, we can see the S&P 500's return after the first new high in the SMFI in at least a year. Short-term returns were meh, but after the first couple of months, returns improved significantly. Over the next year, the S&P averaged a gain of nearly 20%, with an impressively skewed risk/reward ratio.
Out of the 19 signals, there were two big failures, and both are troubling because they showed up in other studies - the fall of 1973 and spring/summer of 2001. Note that the table only includes signals when the SMFI hung within 1% of its high over the next two weeks following a breakout to new highs. This leaves us with instances when the smart money kept buying.
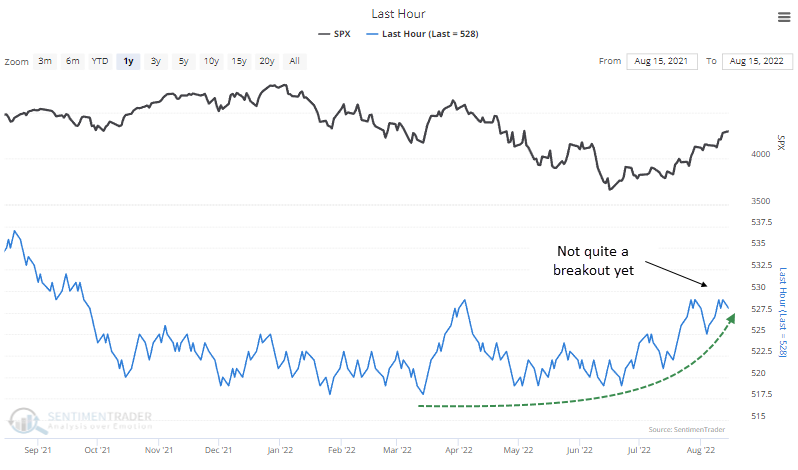
Another indicator showing similar behavior is also behaving well. The Last Hour indicator is a cumulative advance-decline line for the last hour of trading of the SPY ETF. If the last hour of trading is up, a value of 1 is added to the count; if down, 1 is subtracted.
This one hasn't made a new high, but it's close to its highest level since October. It has been trending higher for months even as stocks declined, suggesting accumulation by larger investors.
What the research tells us...
The signs have been compelling for a sustained rise in stocks. Historic breadth thrusts followed a bout of extreme pessimism, and buyers have continued to show up. Just as importantly, there are signs that some of those buyers are the patient, long-term, smart-money type. That's always an iffy suggestion, but some indicators like the Smart Money Flow Index support the idea, and when indicators like this lead the index and break out to new highs, it has been a good sign for long-term returns.
Indicators at Extremes
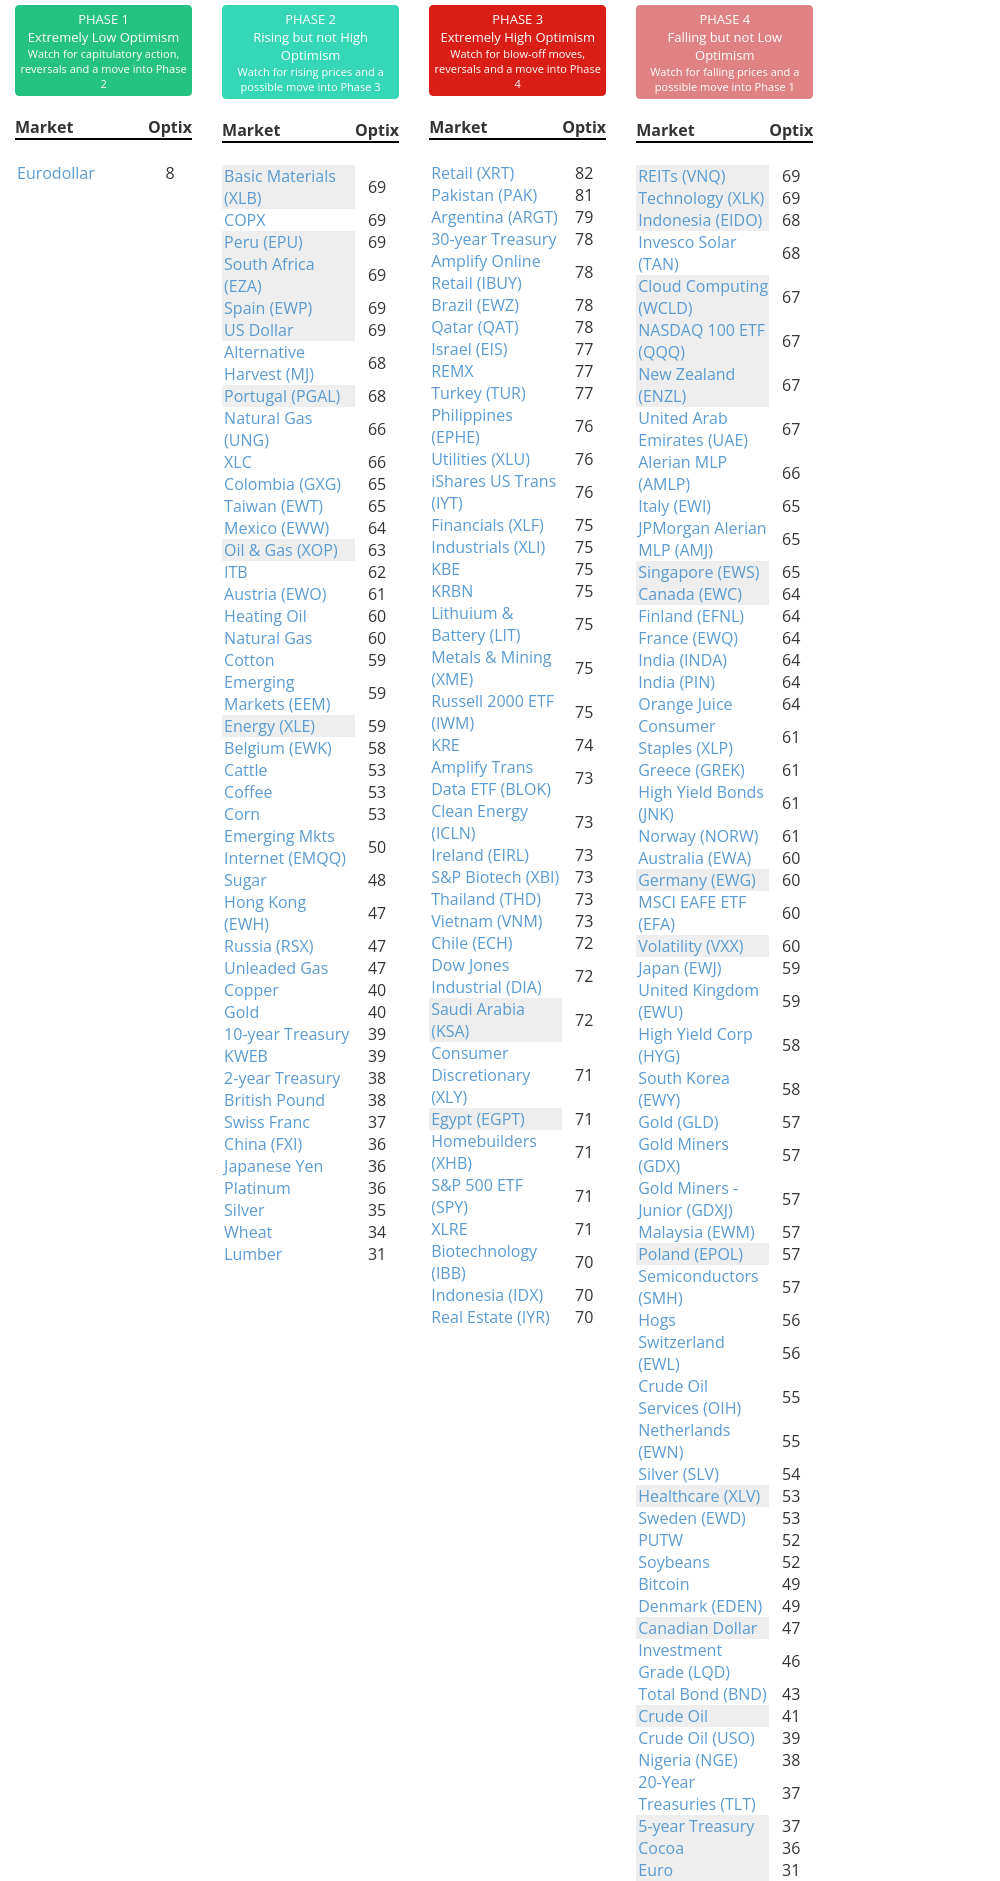
Phase Table
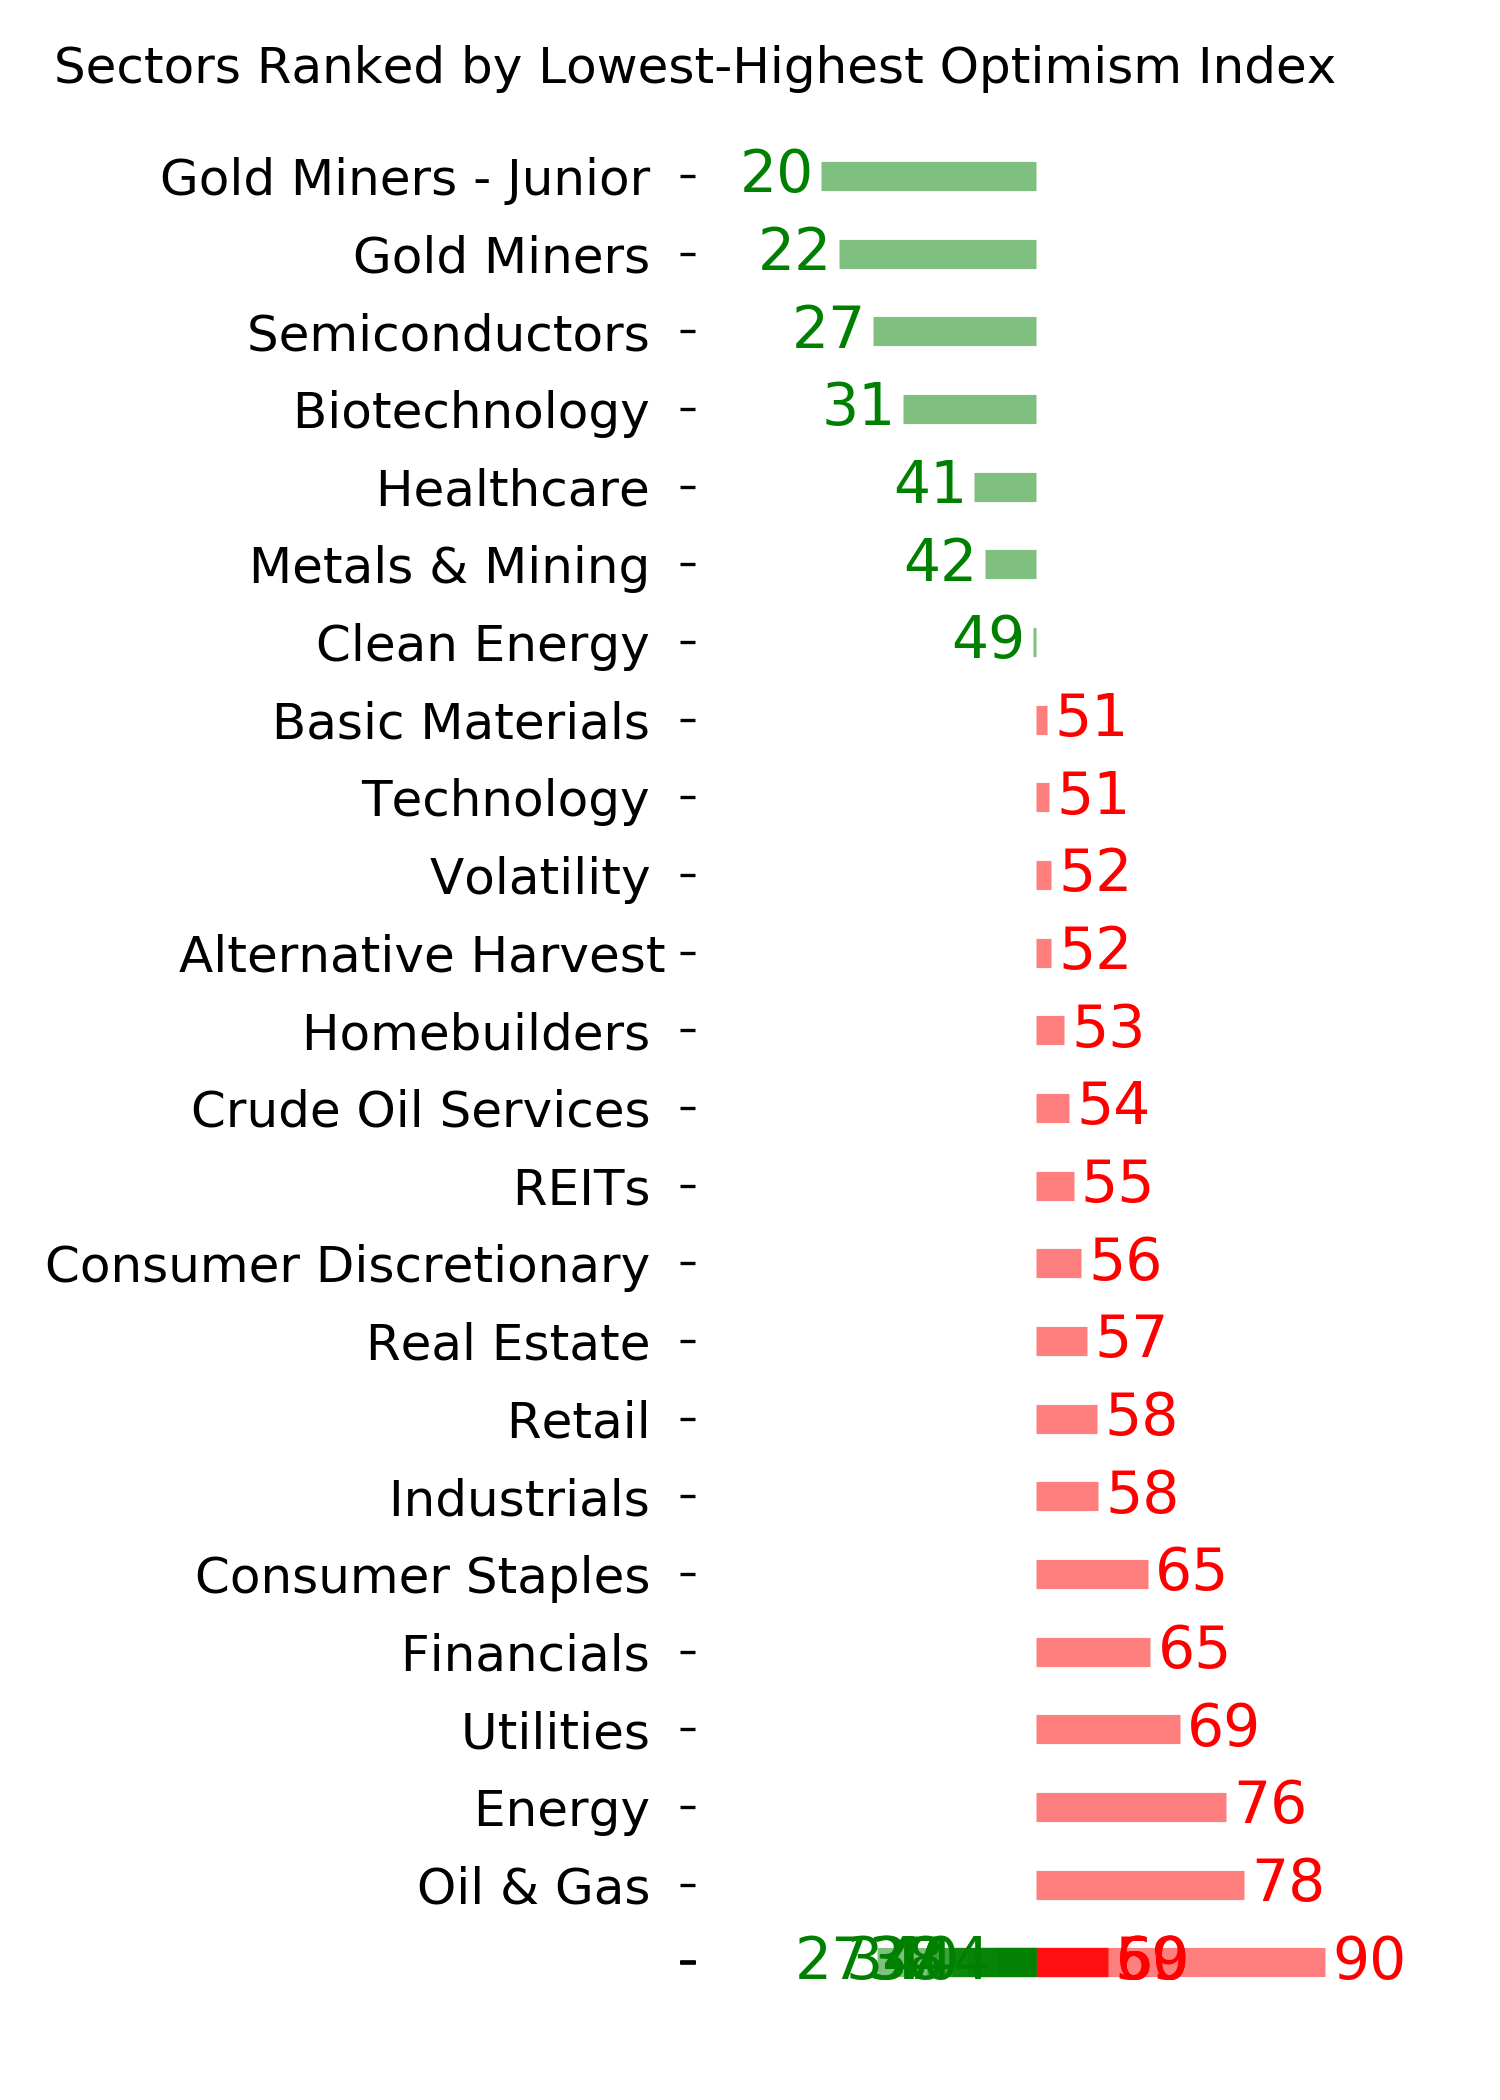
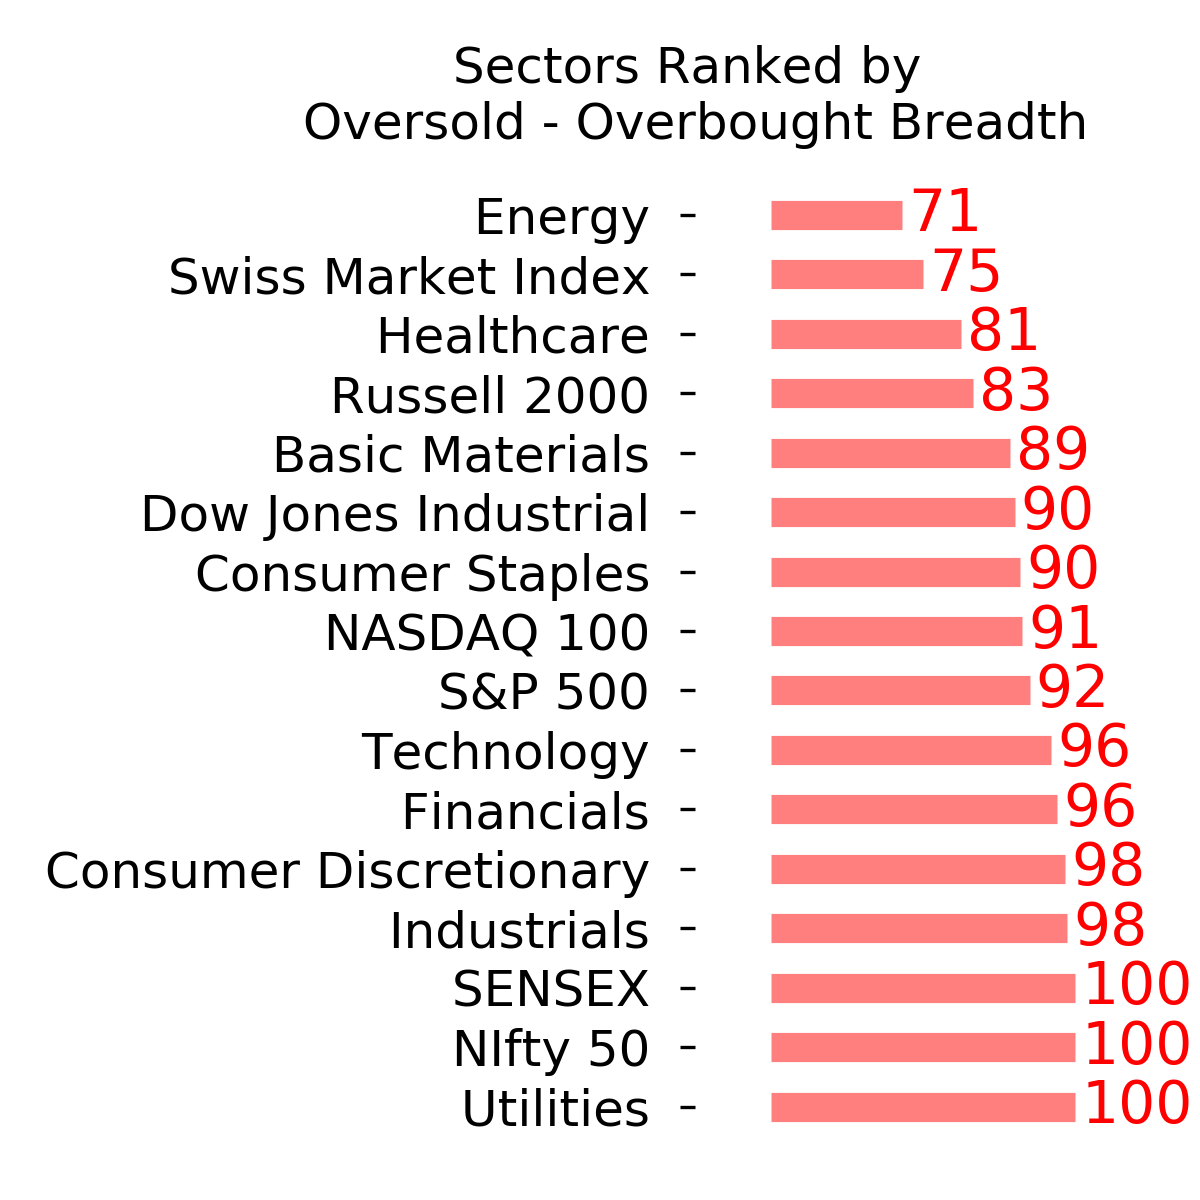
Ranks
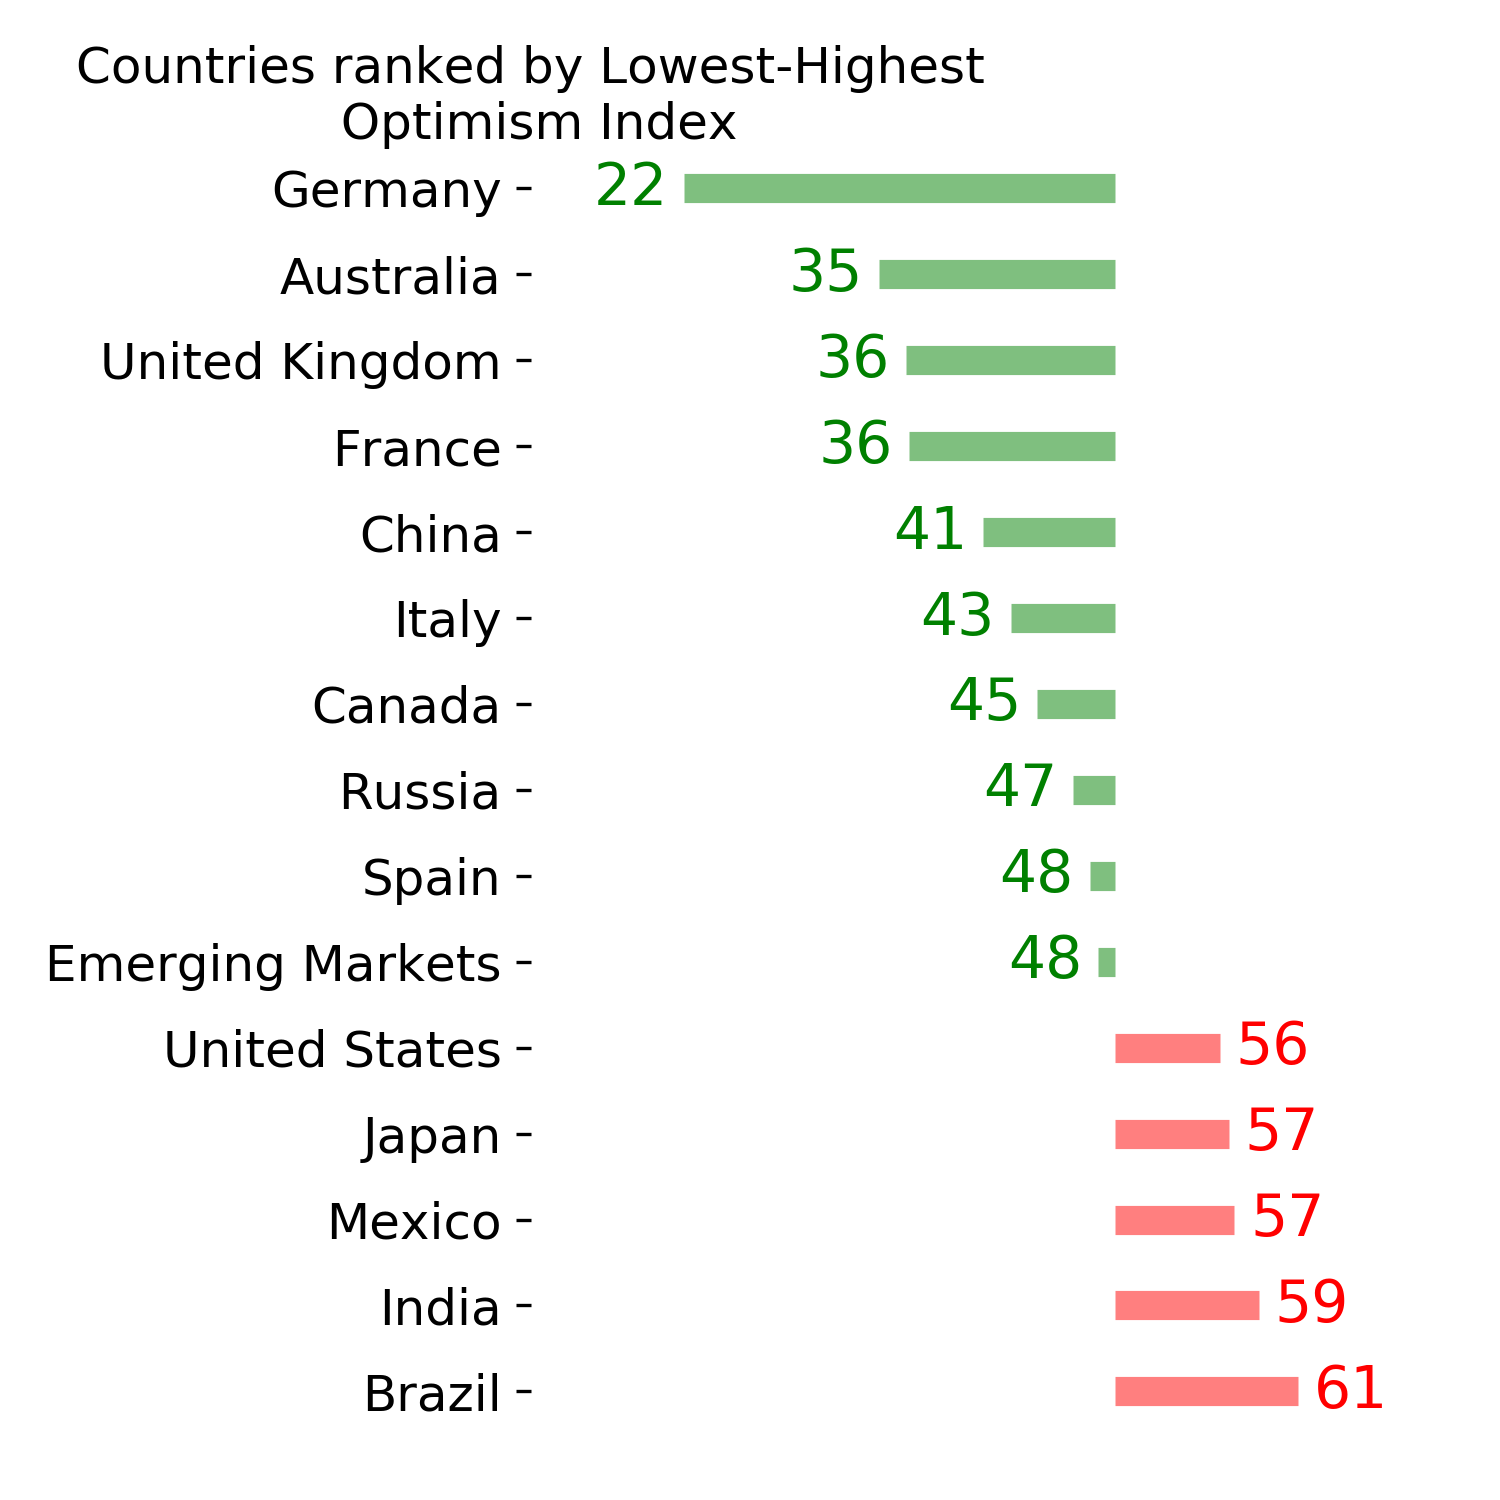
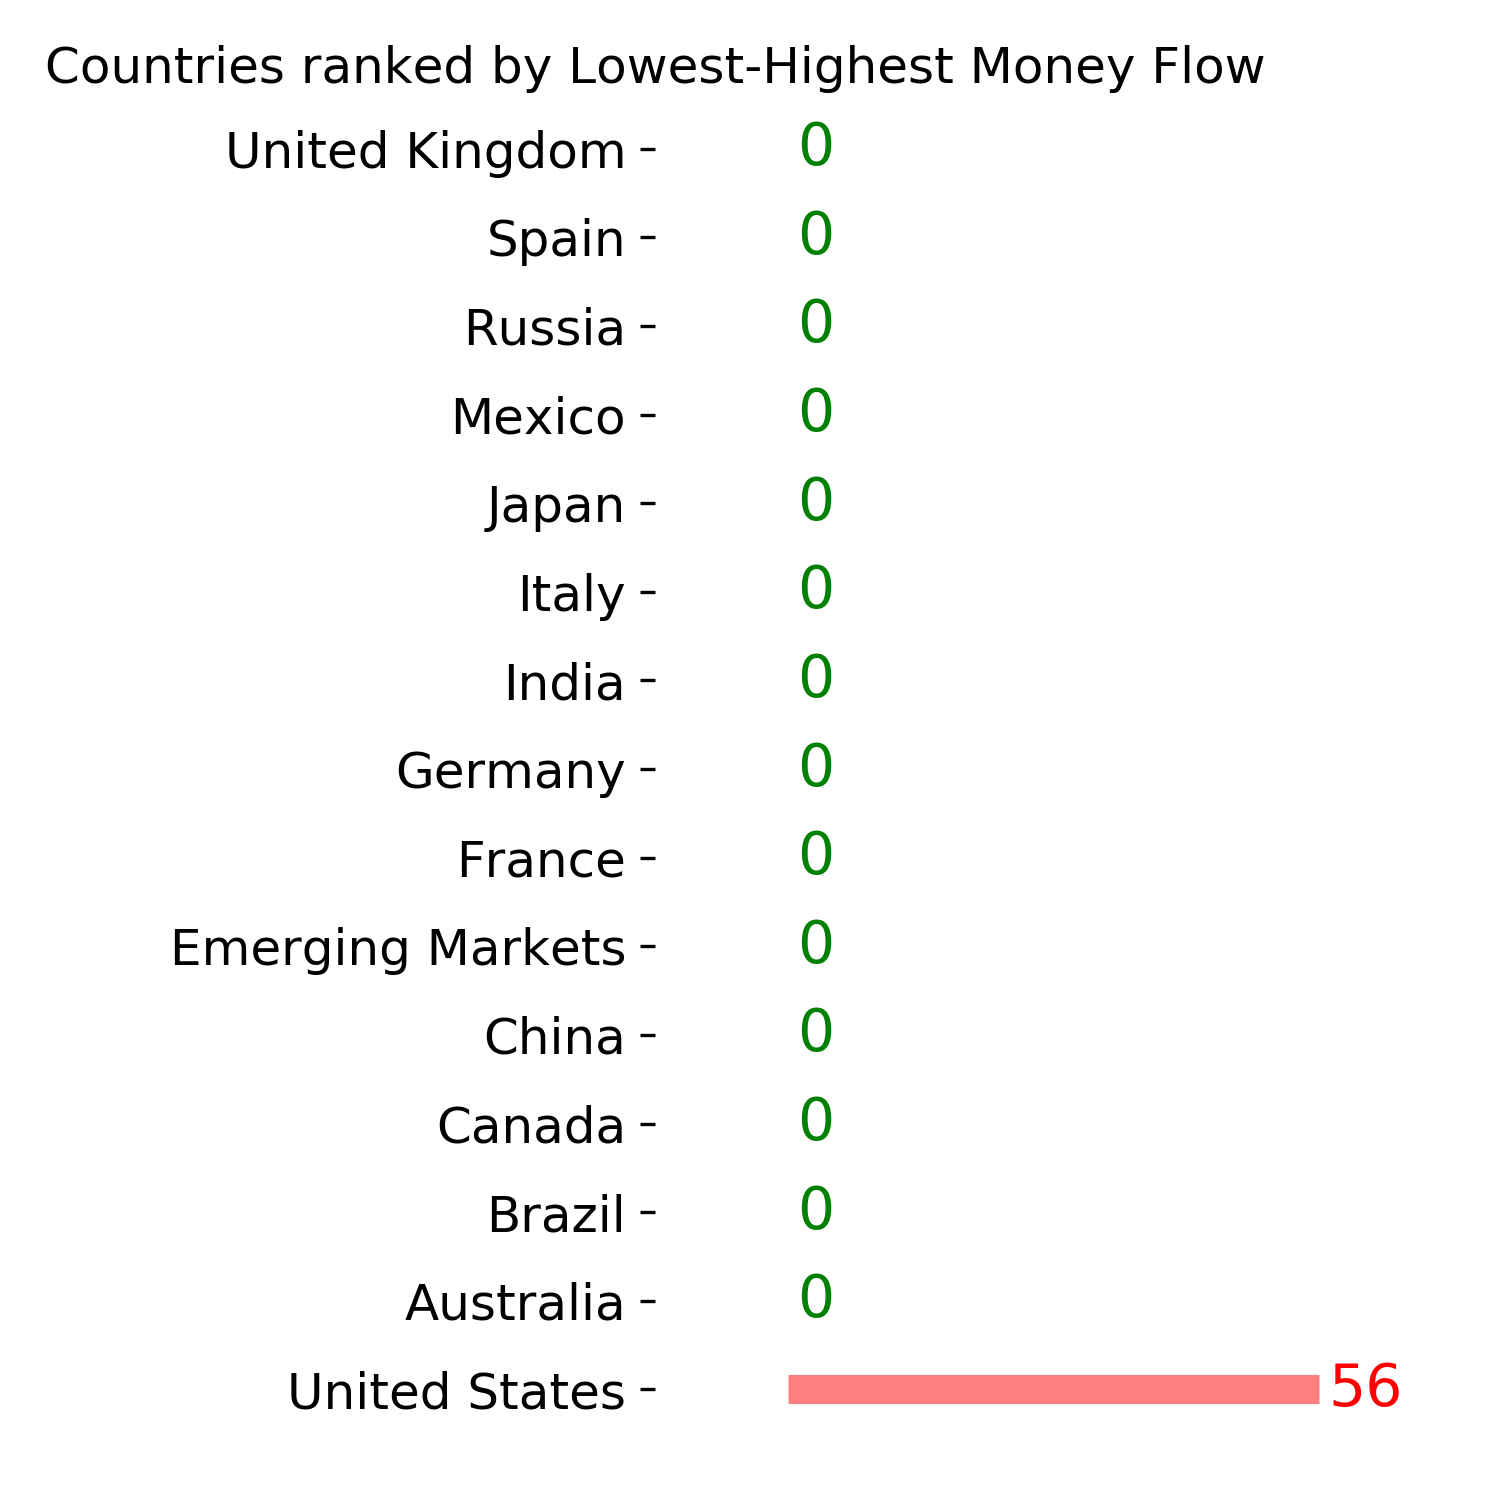
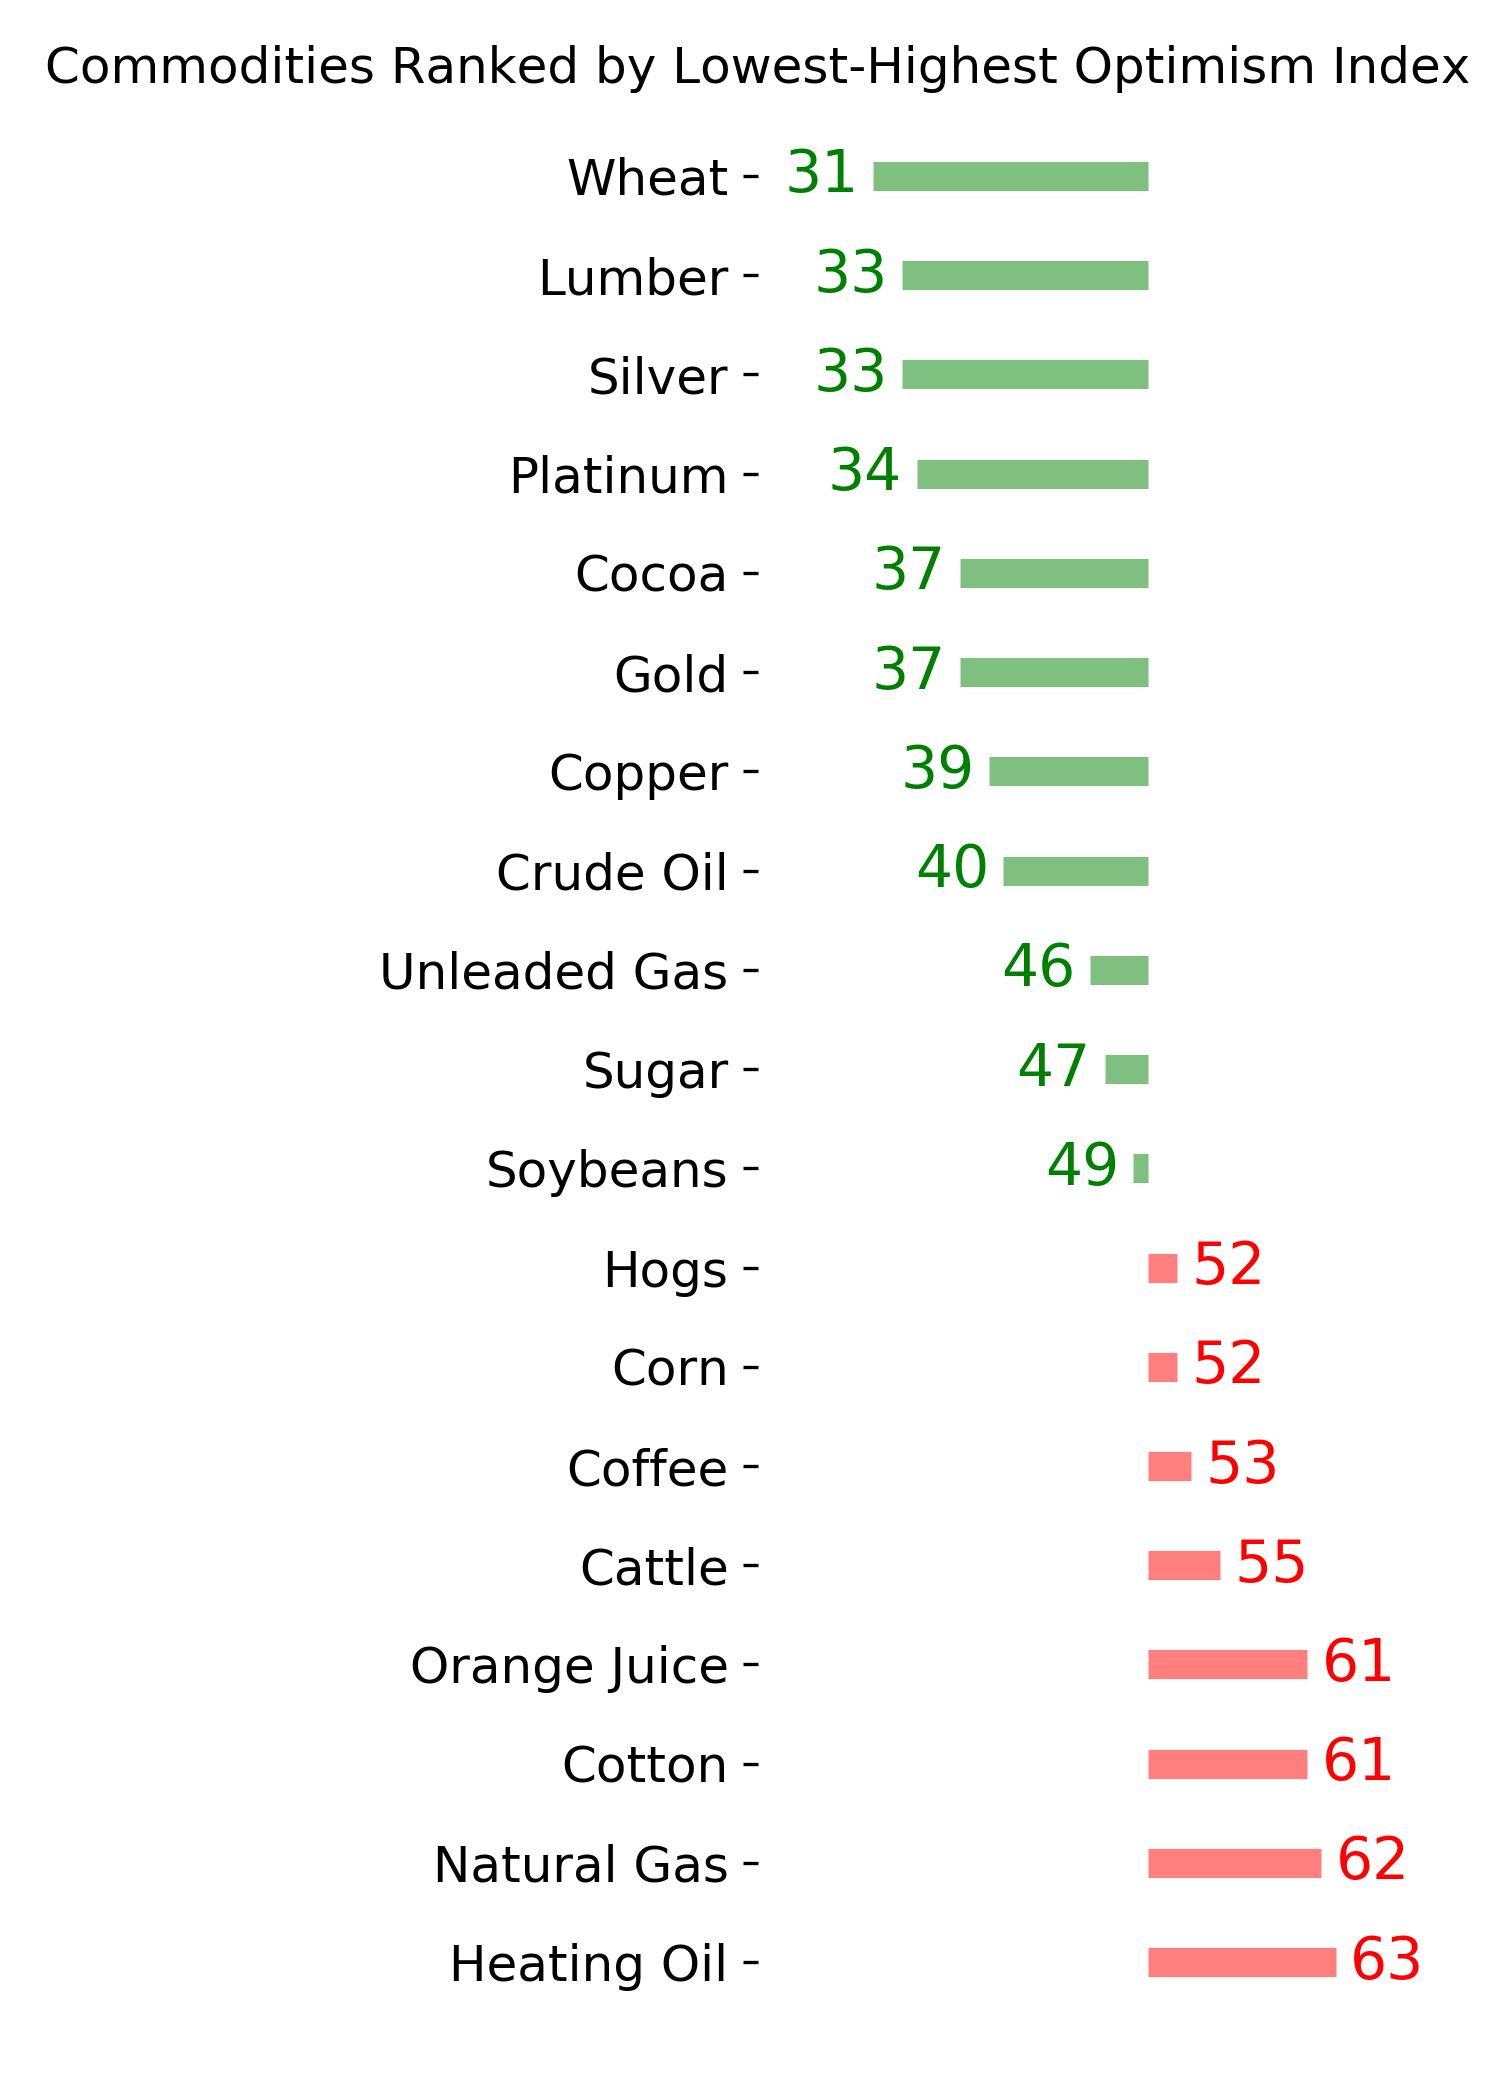
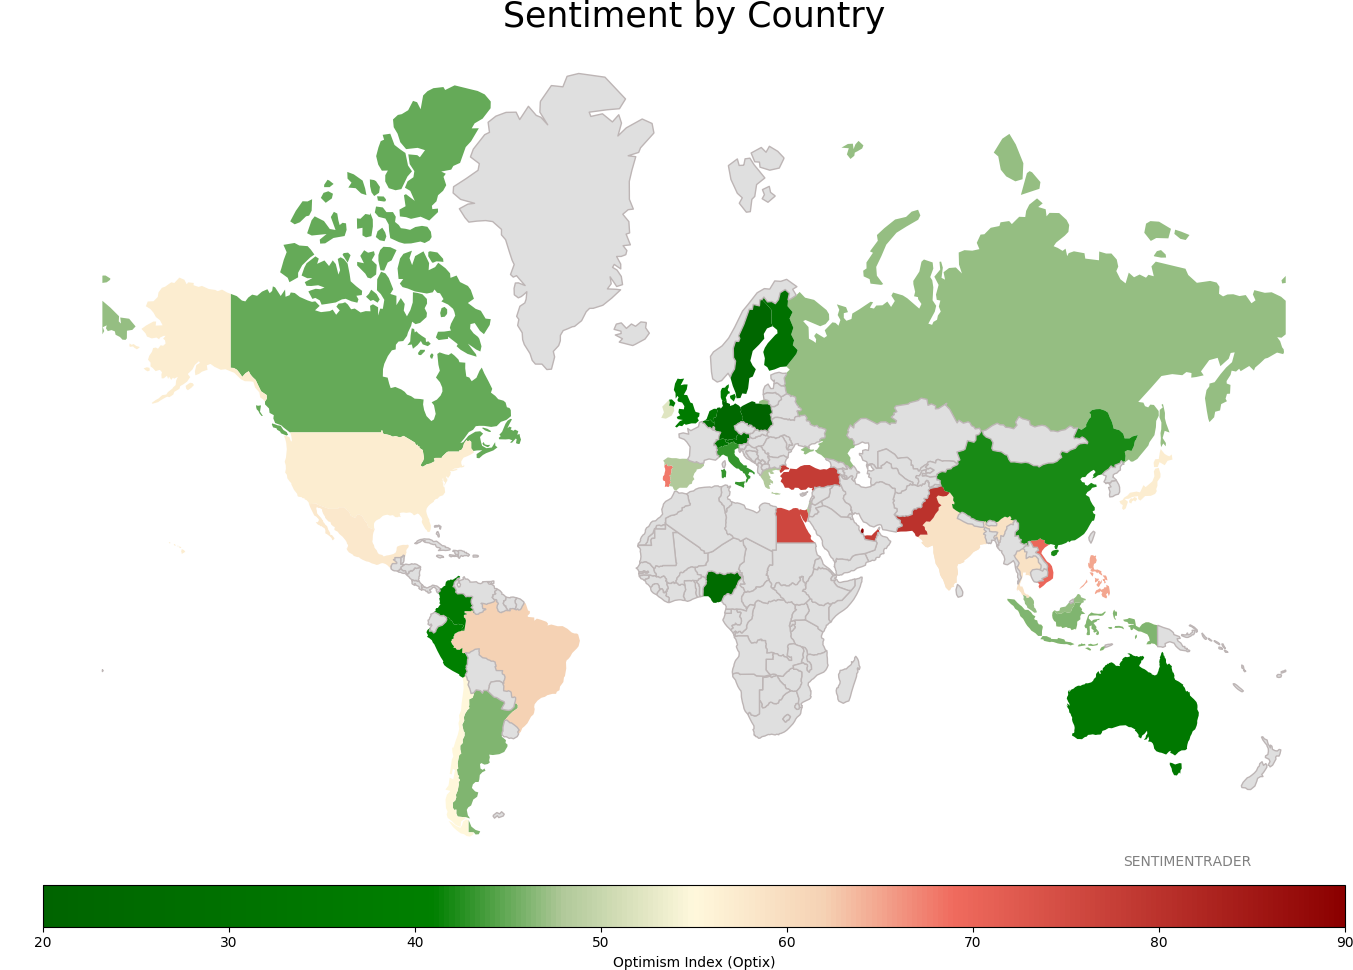
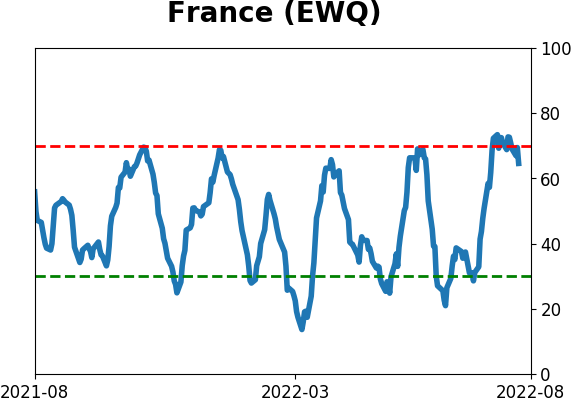
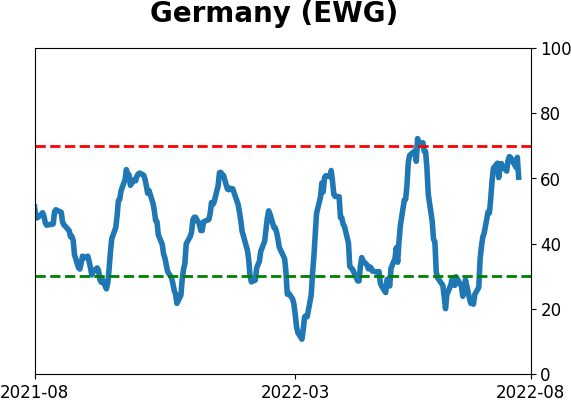
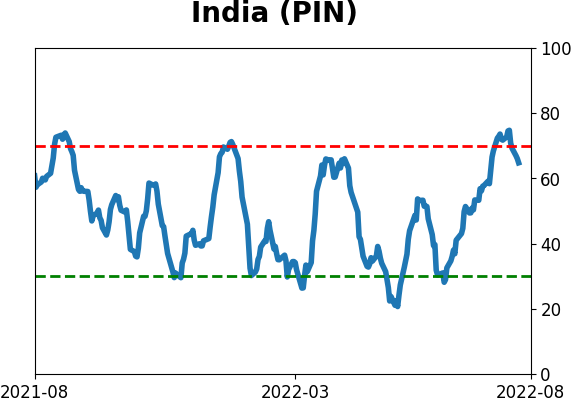
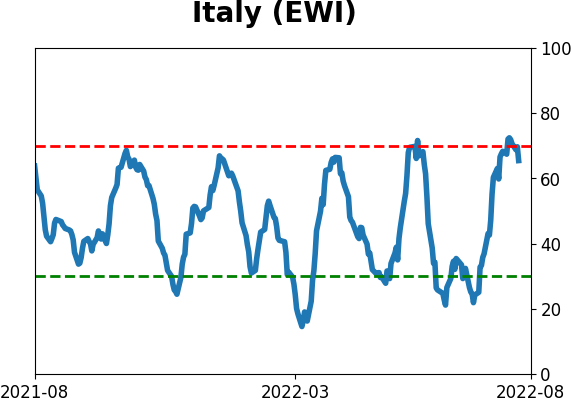
Sentiment Around The World
Optimism Index Thumbnails
|
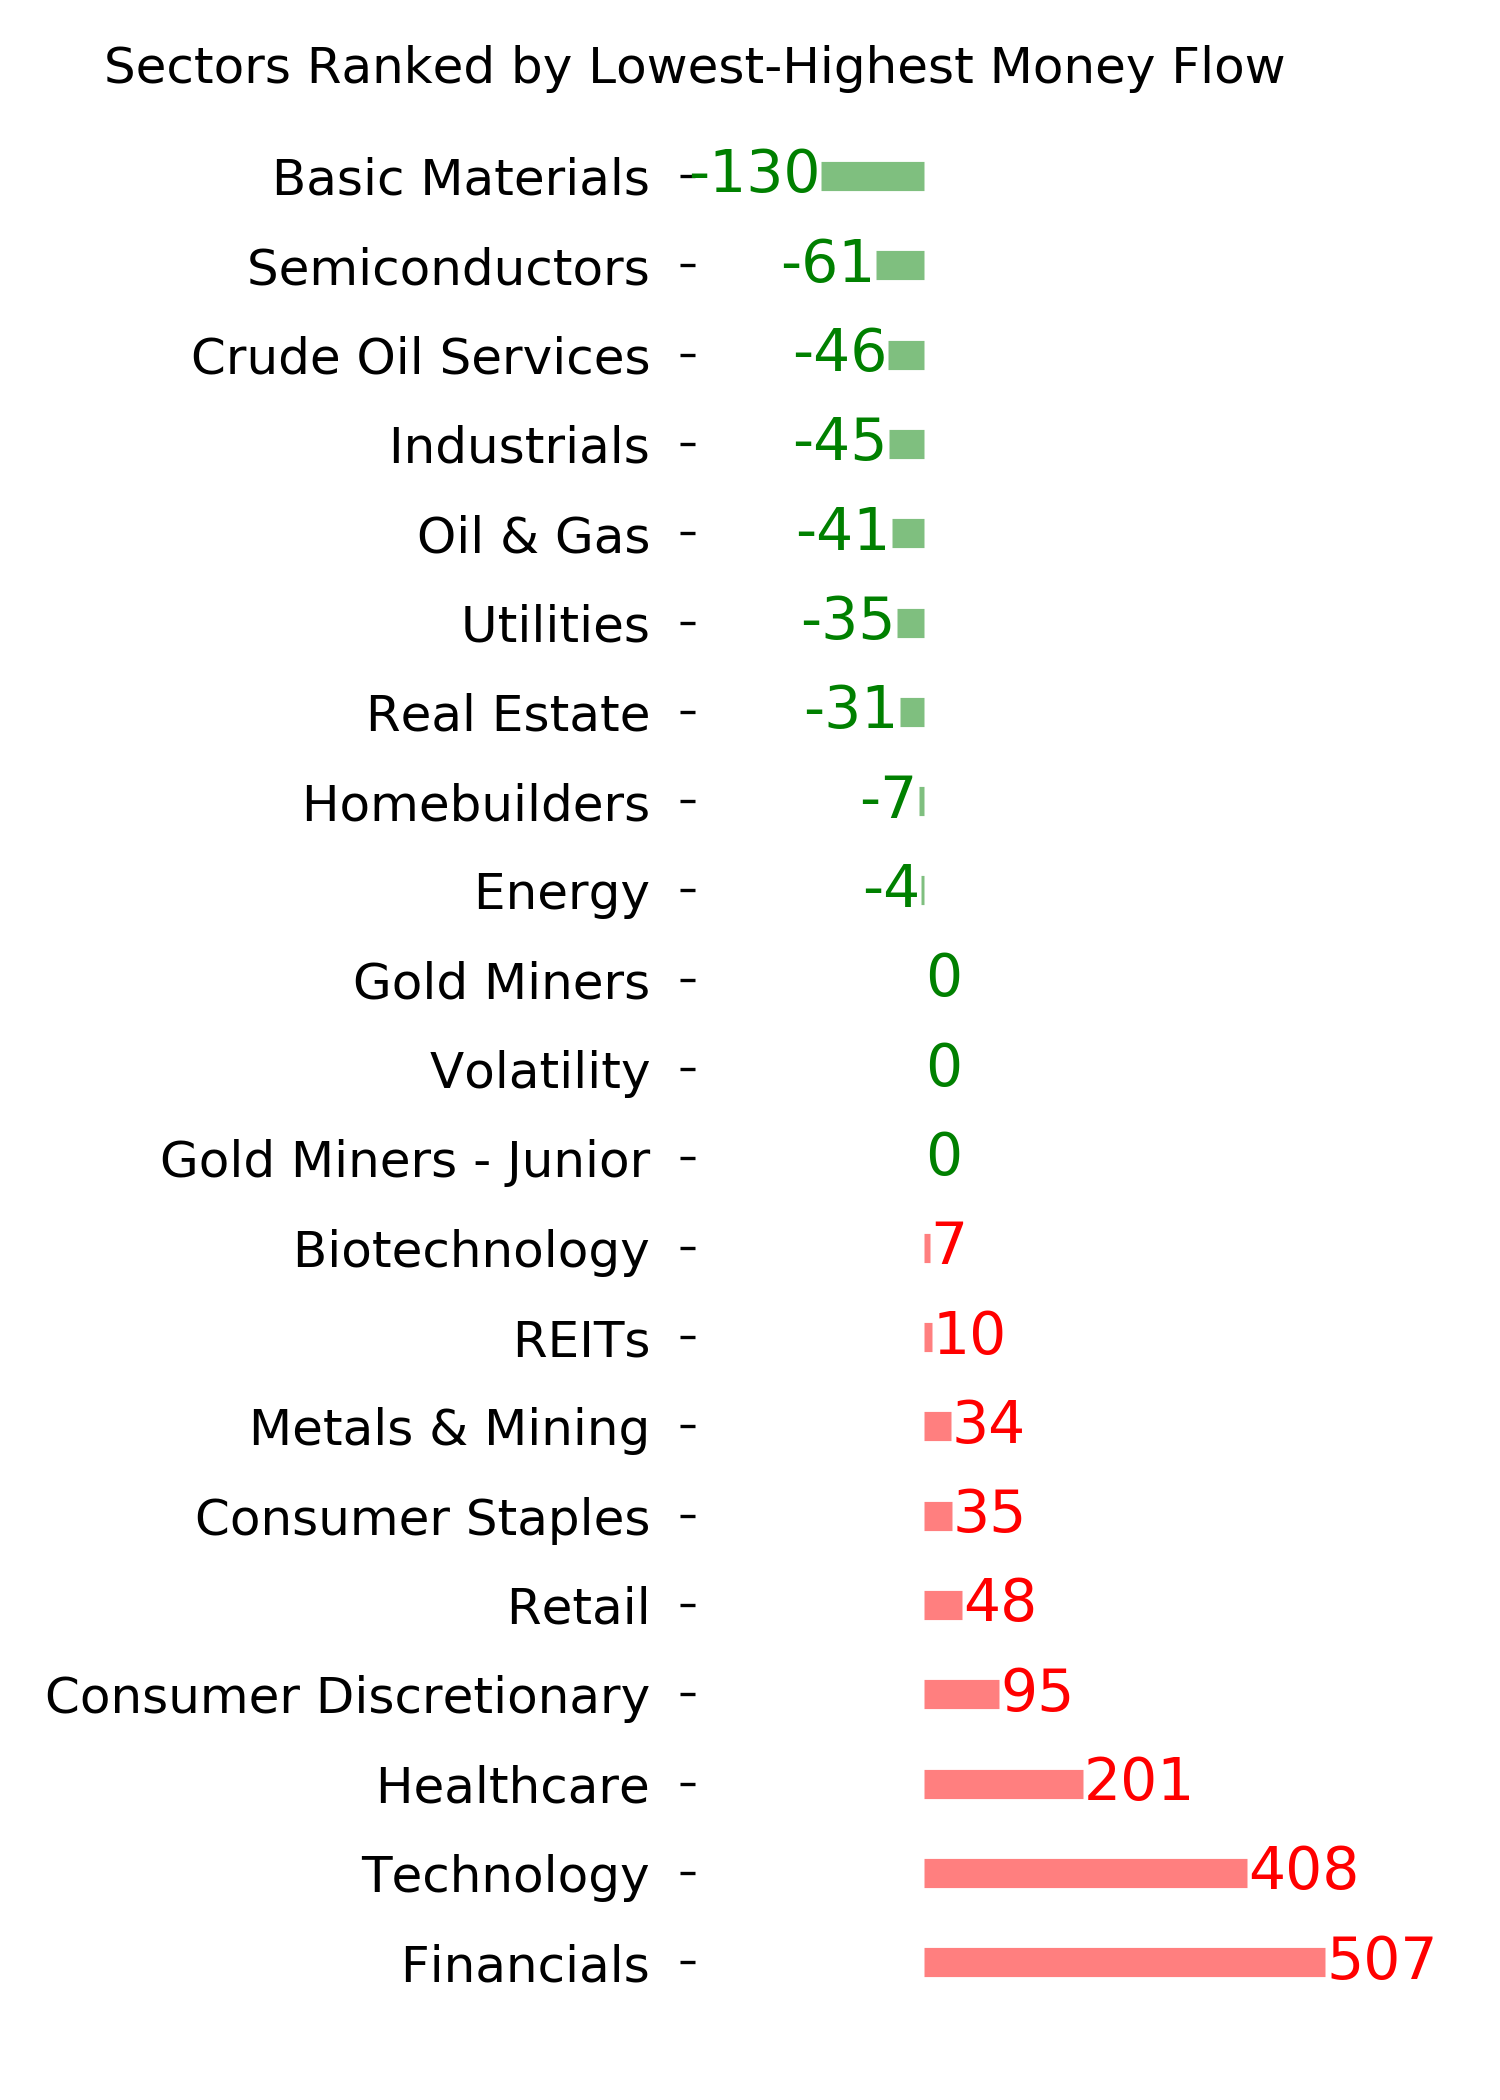
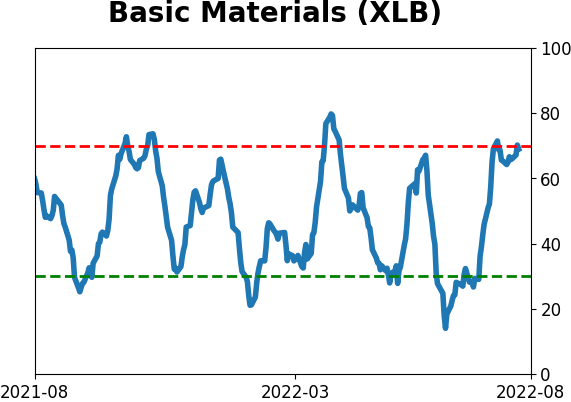
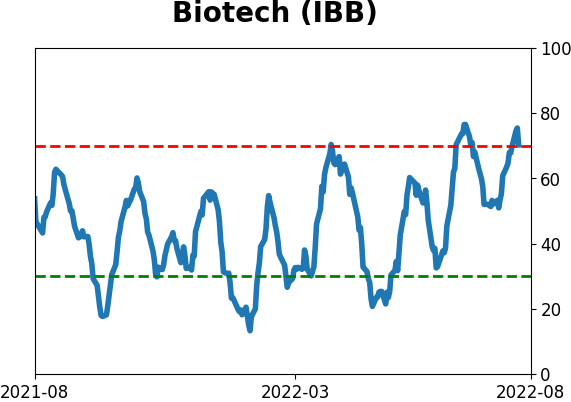
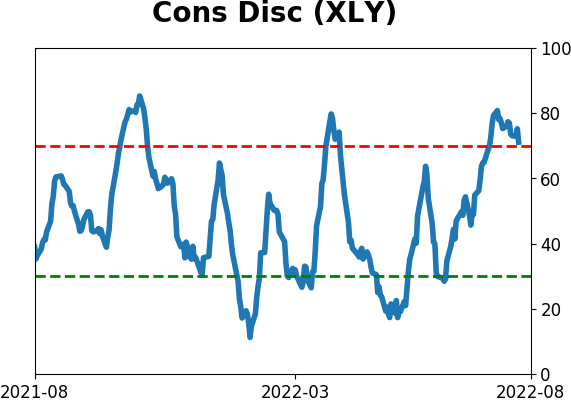
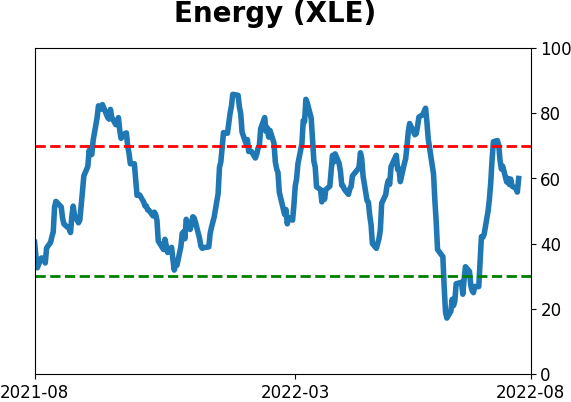
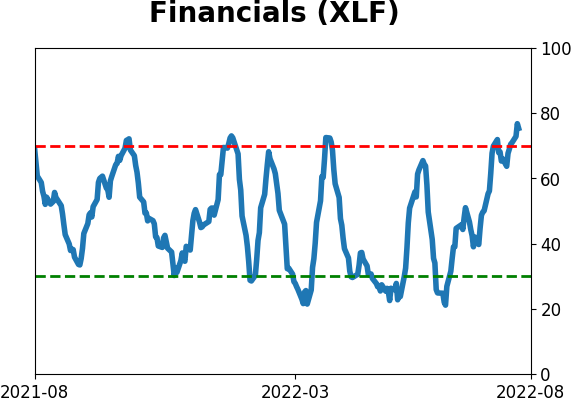
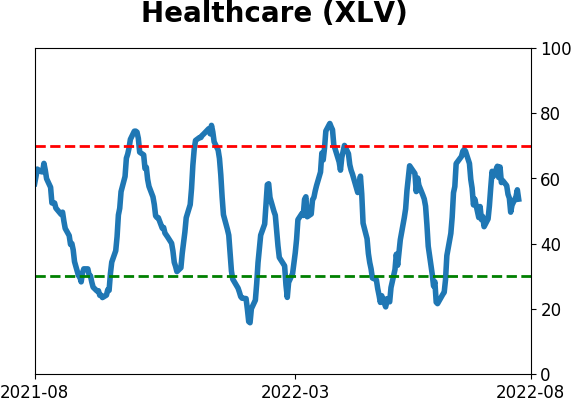
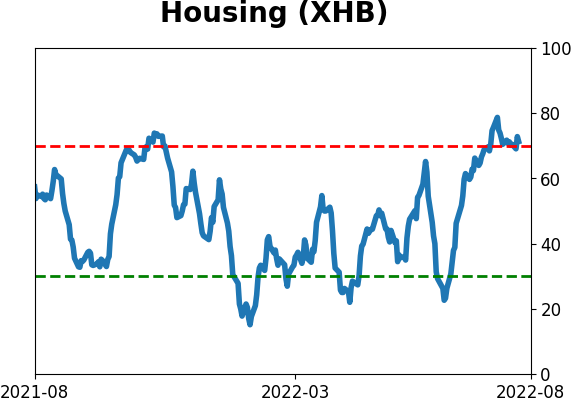
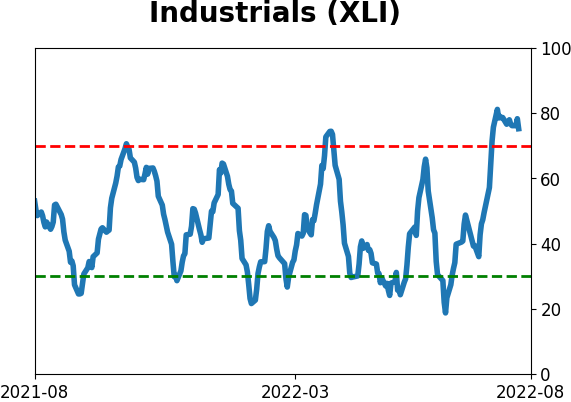
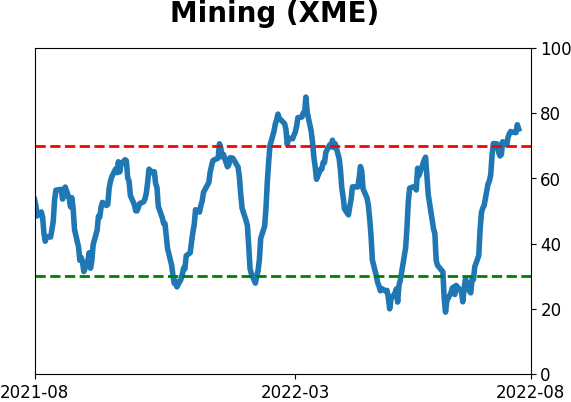
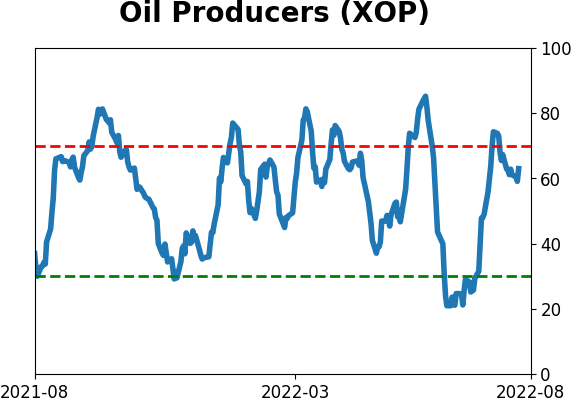
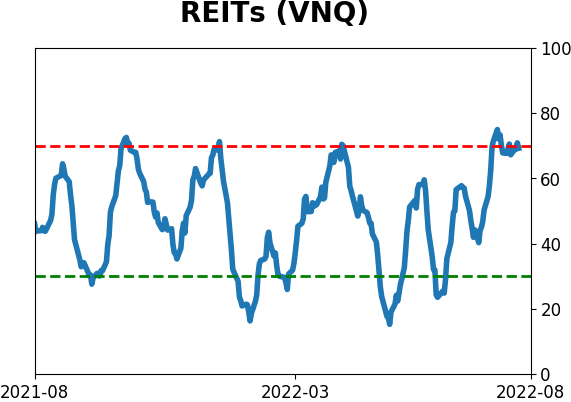
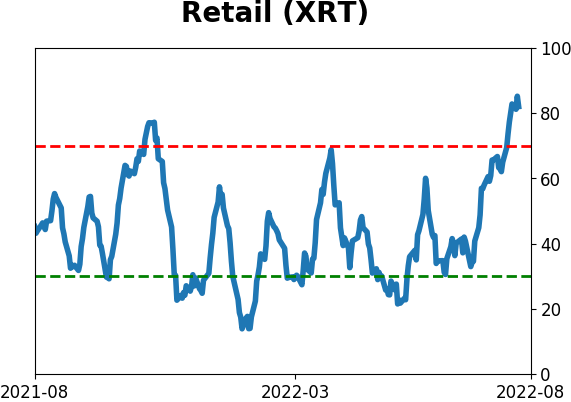
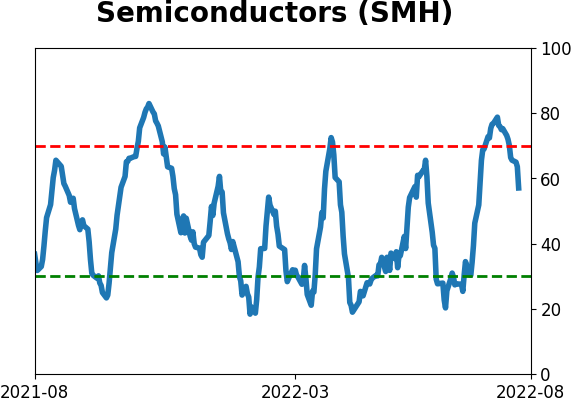
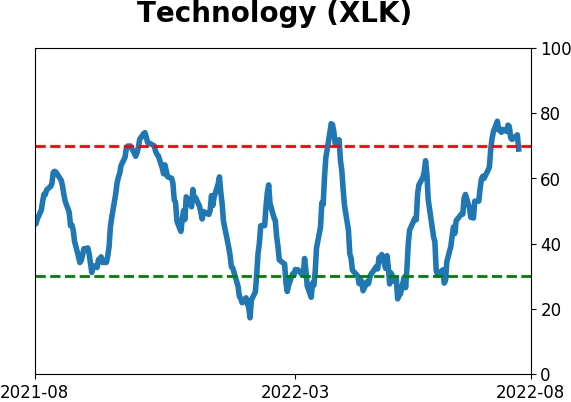
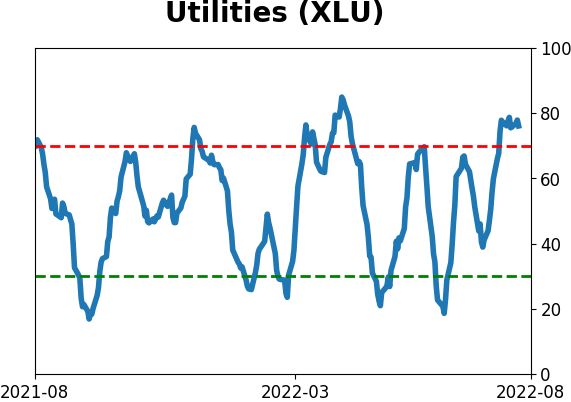
Sector ETF's - 10-Day Moving Average
|
|
|
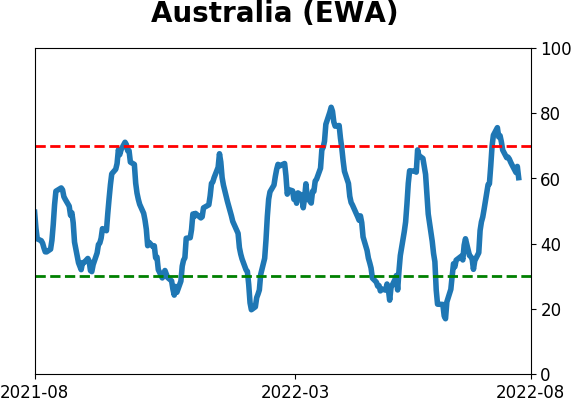
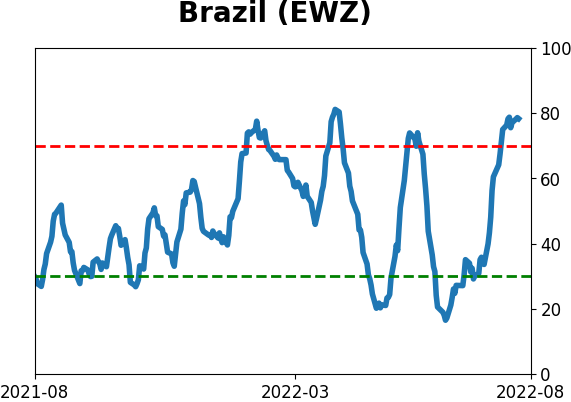
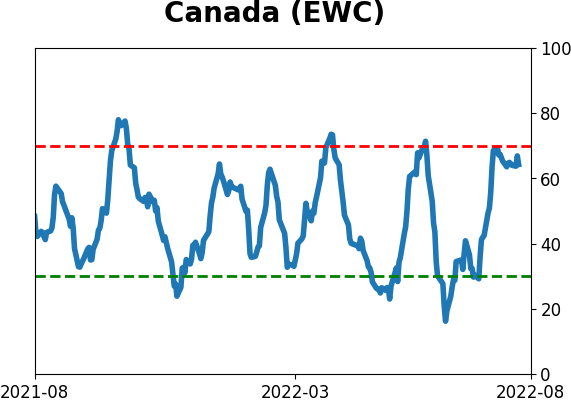
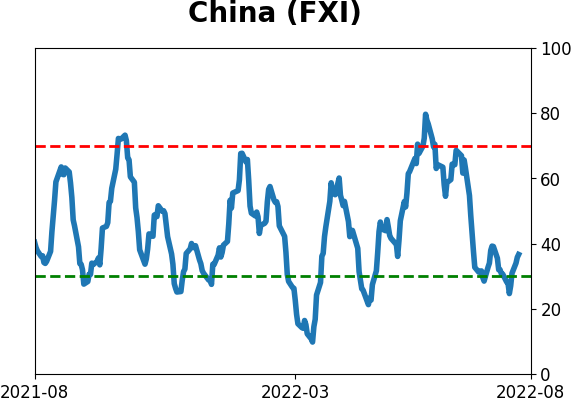
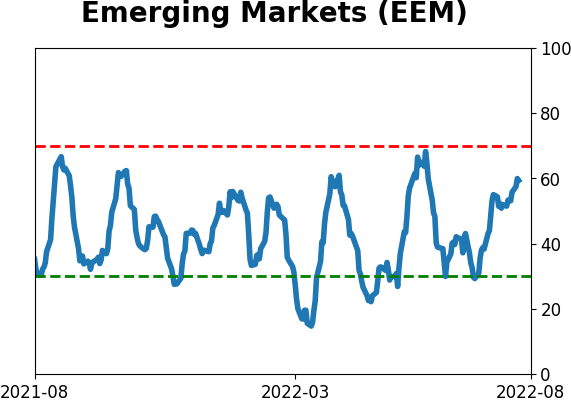
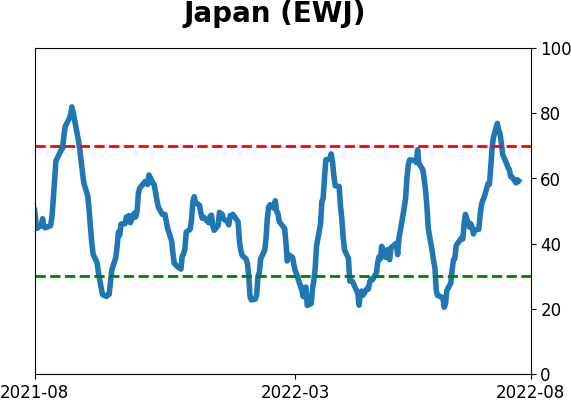
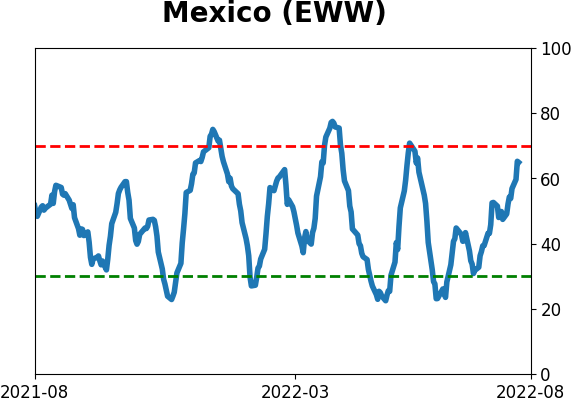
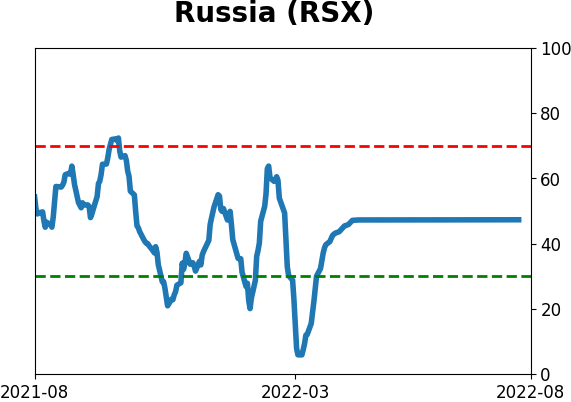
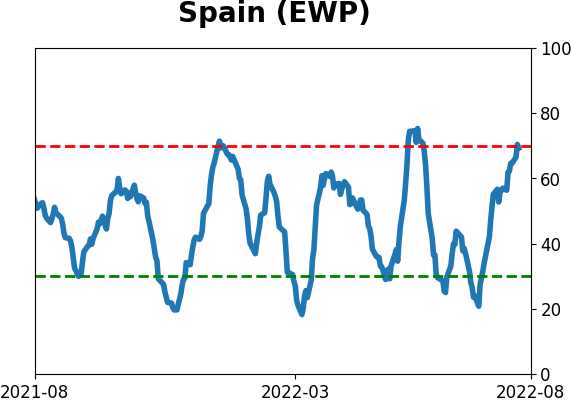
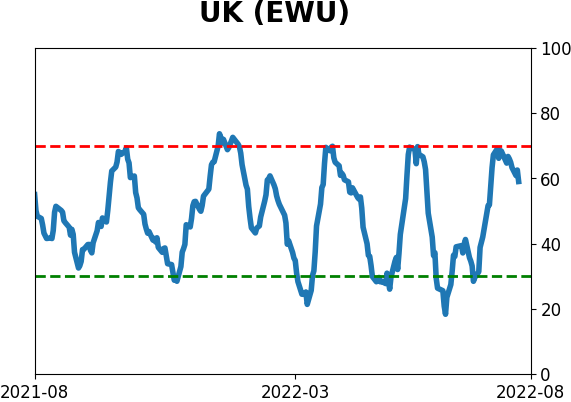
Country ETF's - 10-Day Moving Average
|
|
|
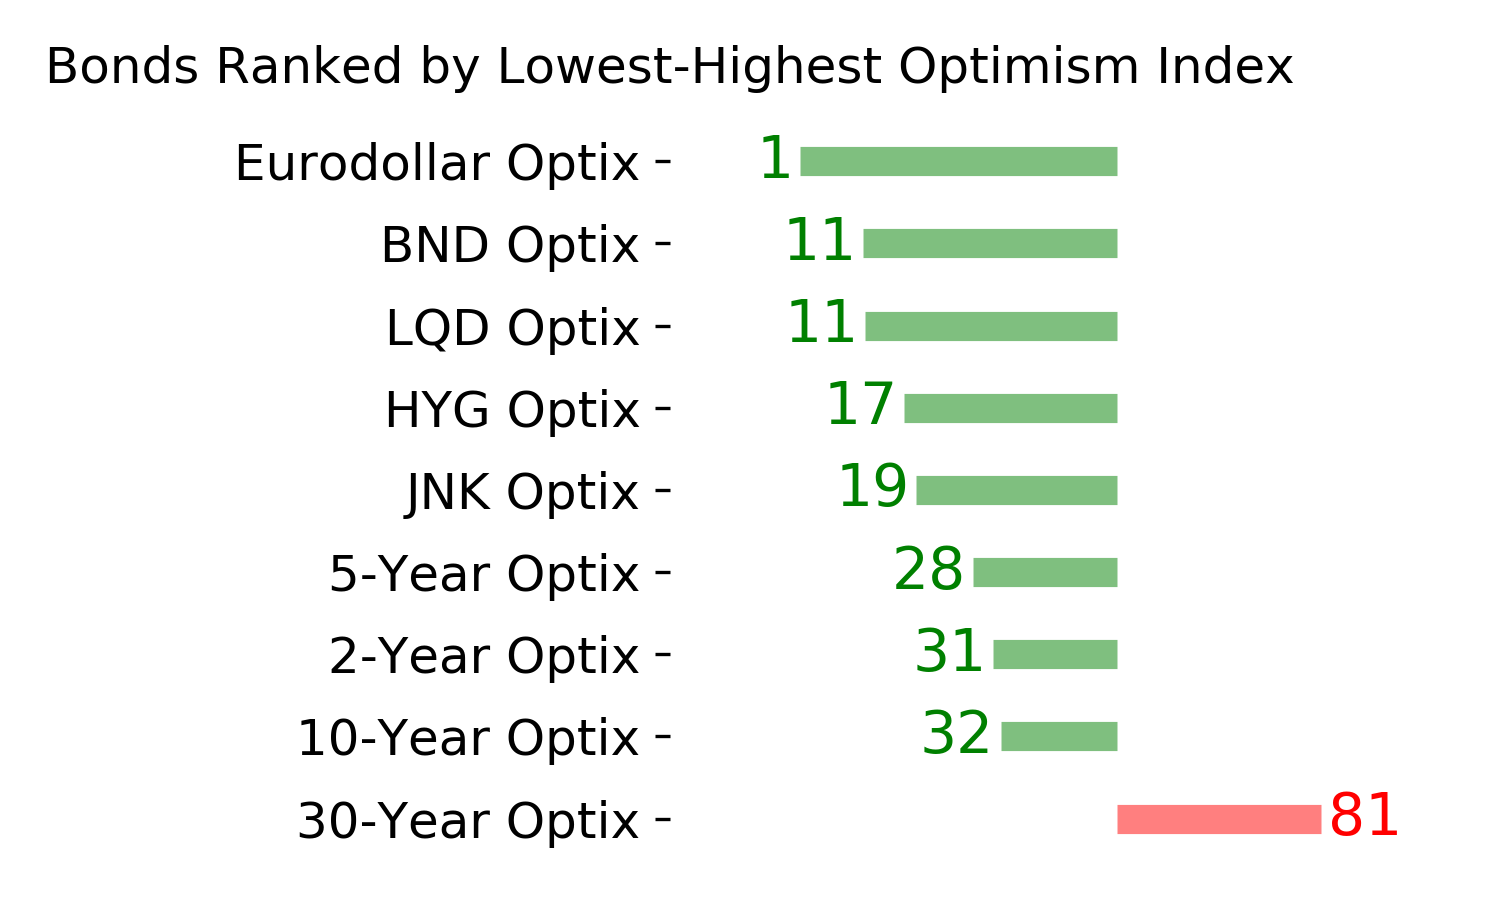
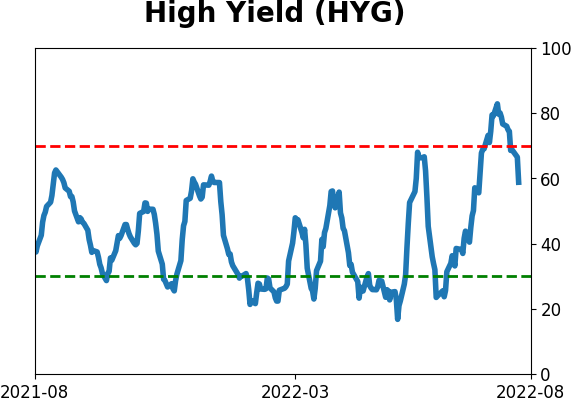
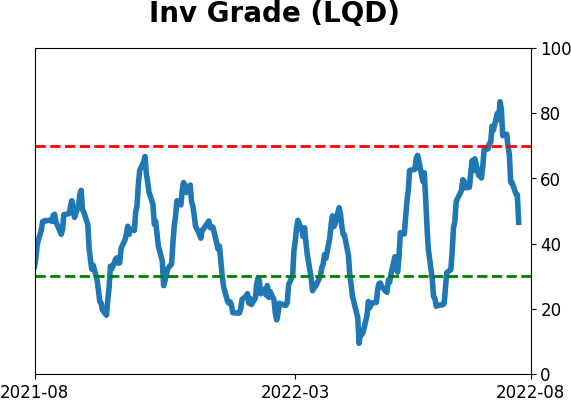
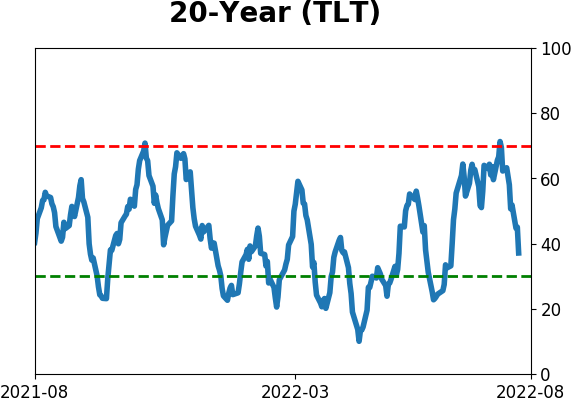
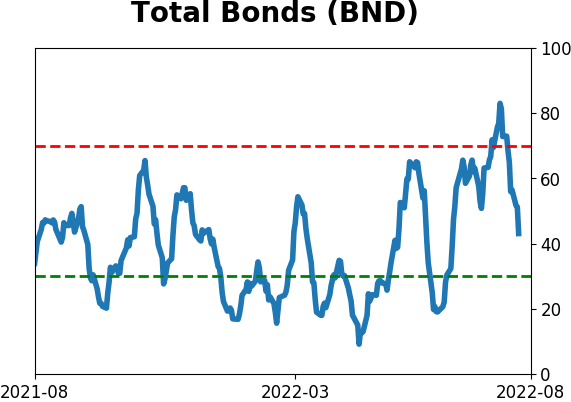
Bond ETF's - 10-Day Moving Average
|
|
|
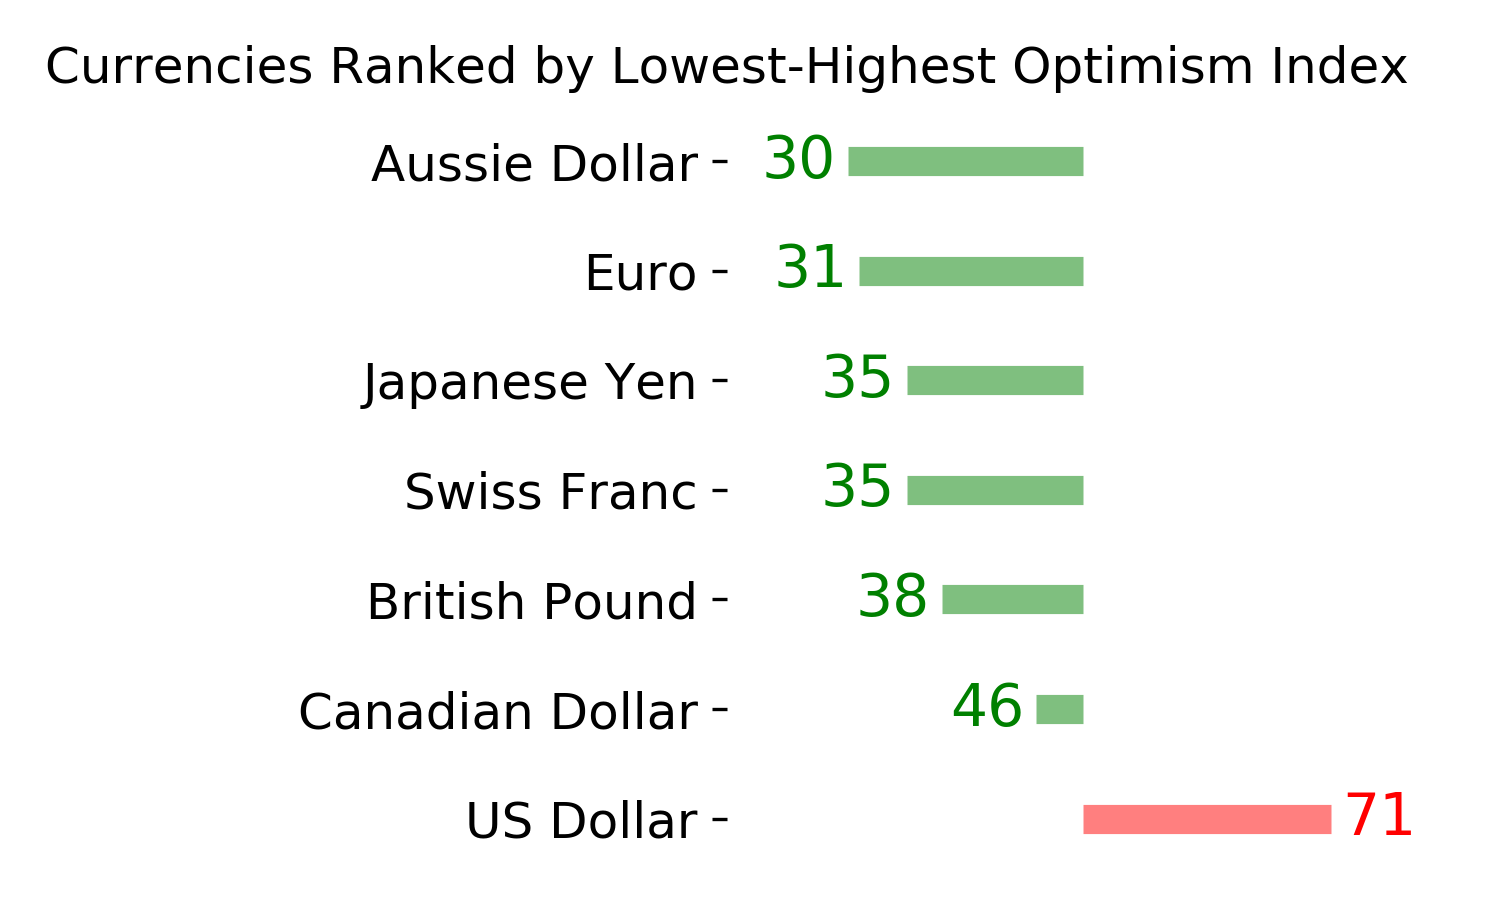
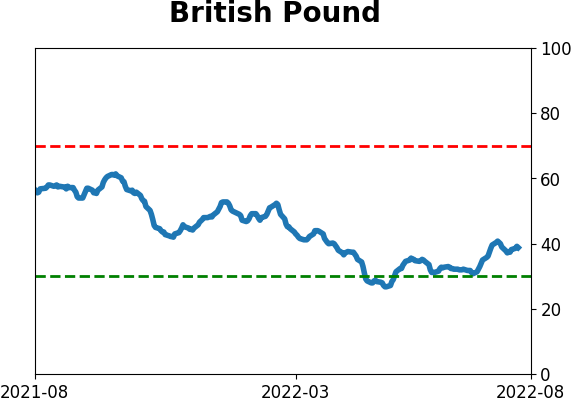
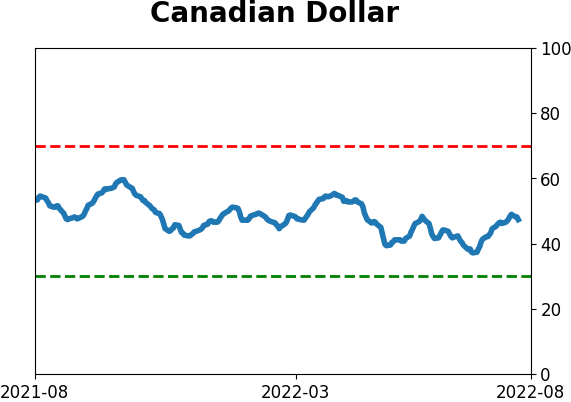
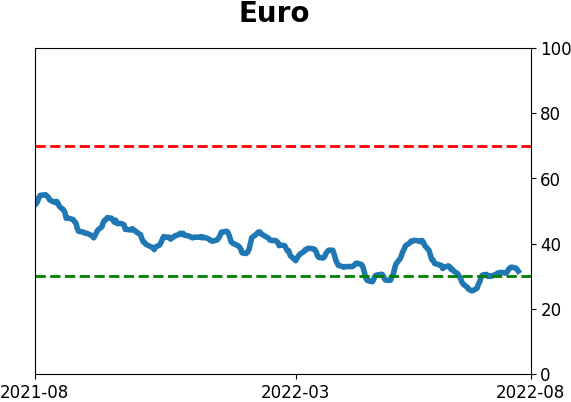
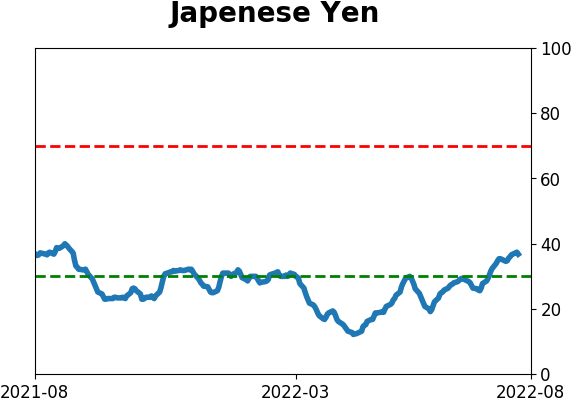
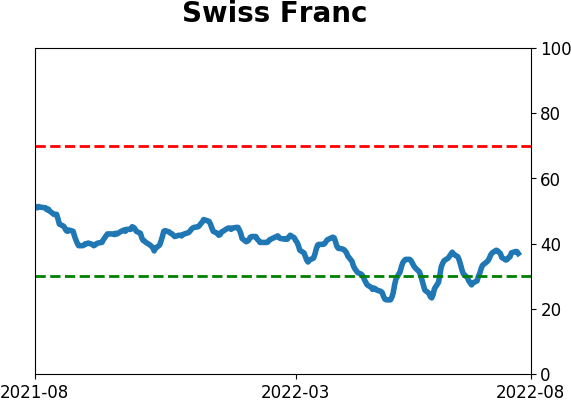
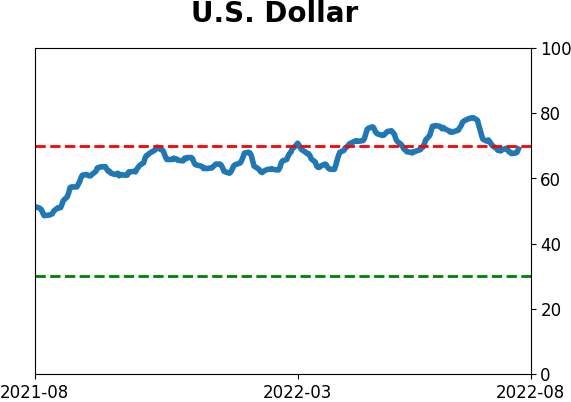
Currency ETF's - 5-Day Moving Average
|
|
|
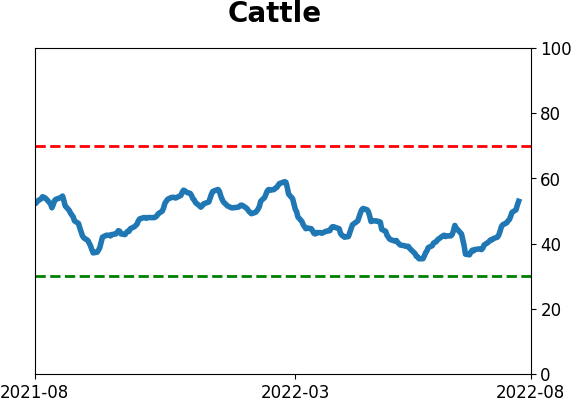
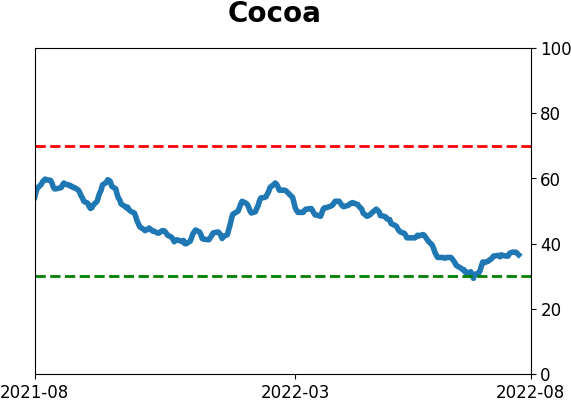
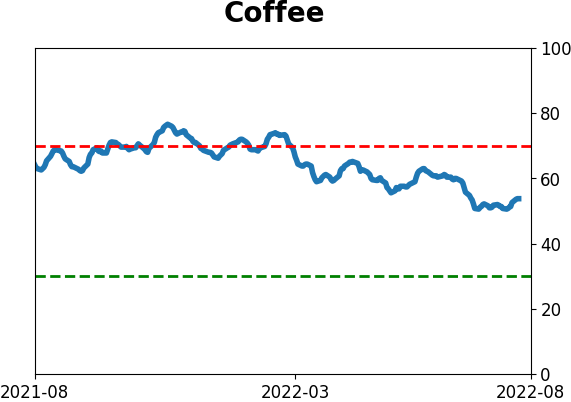
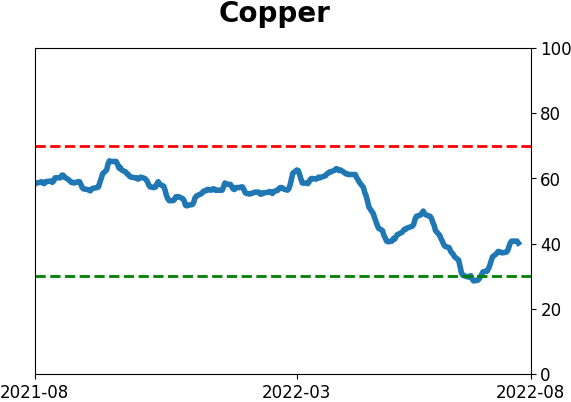
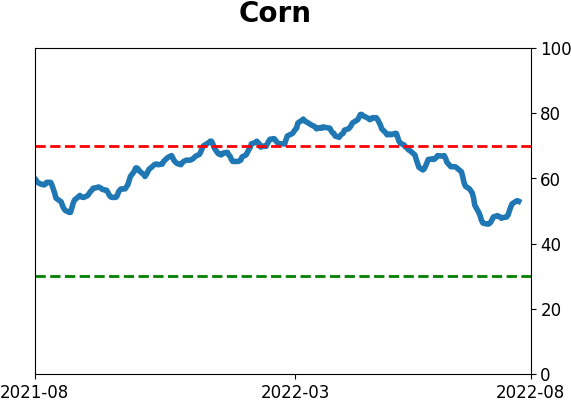
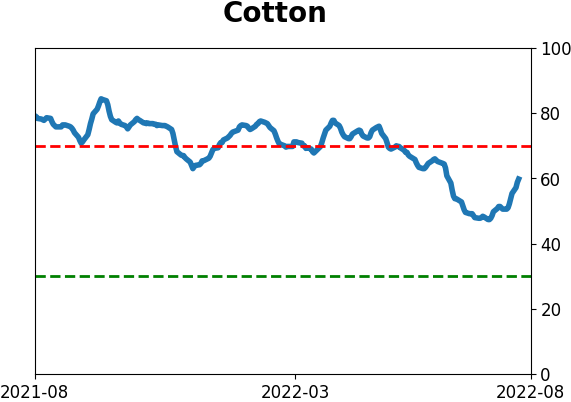
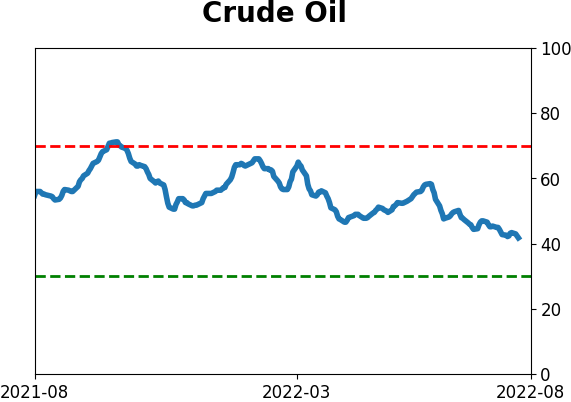
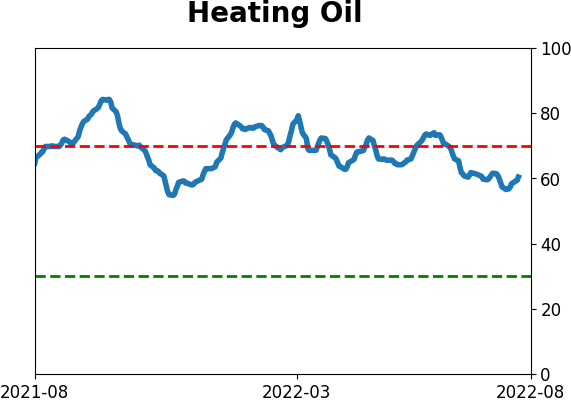
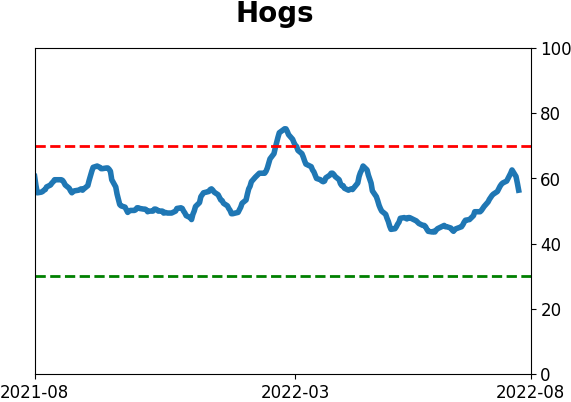
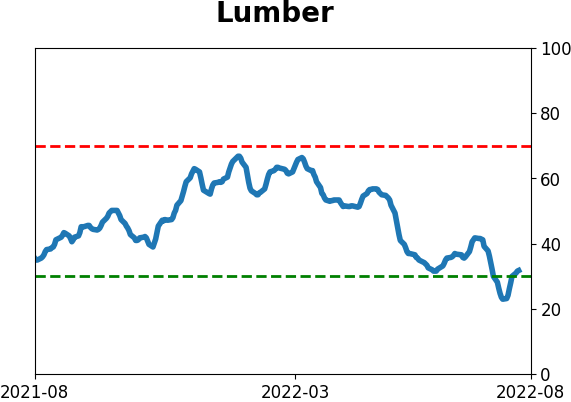
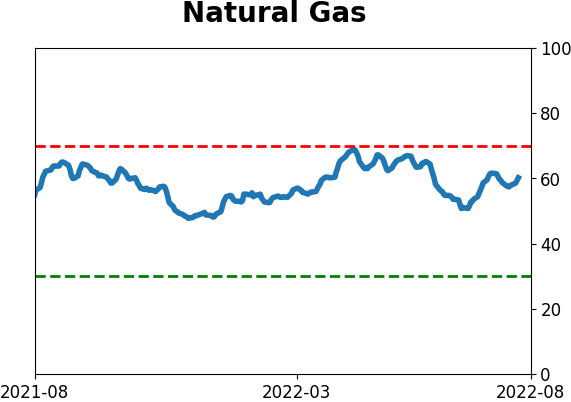
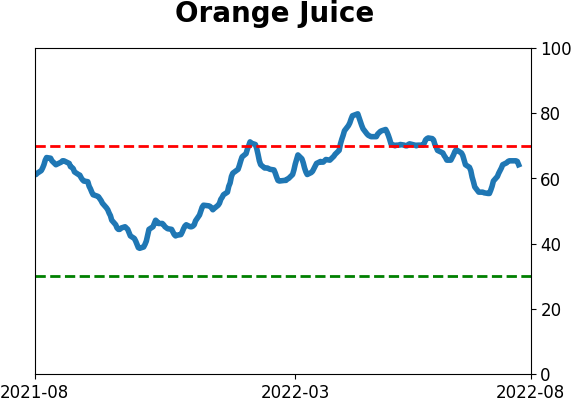
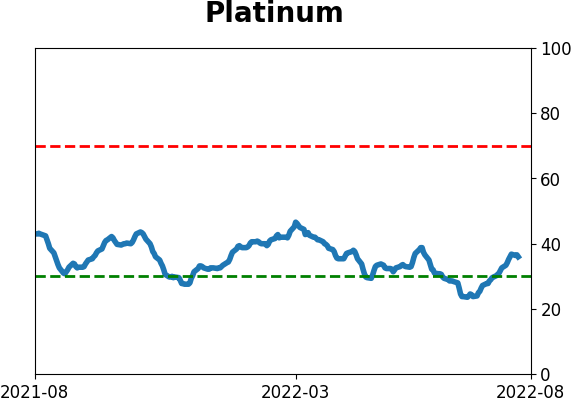
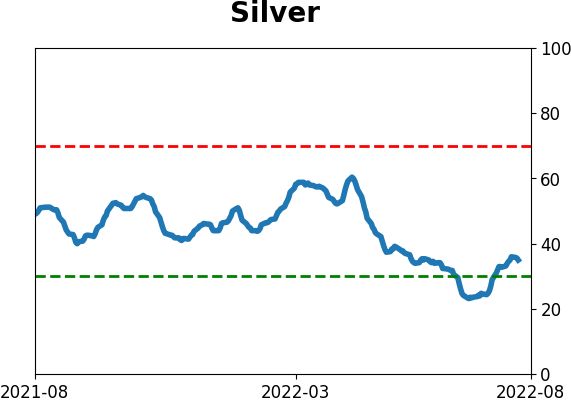
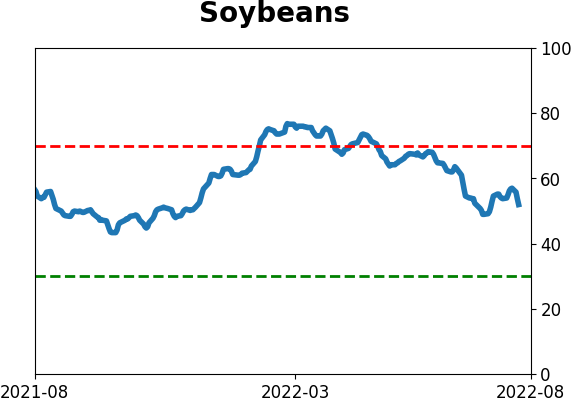
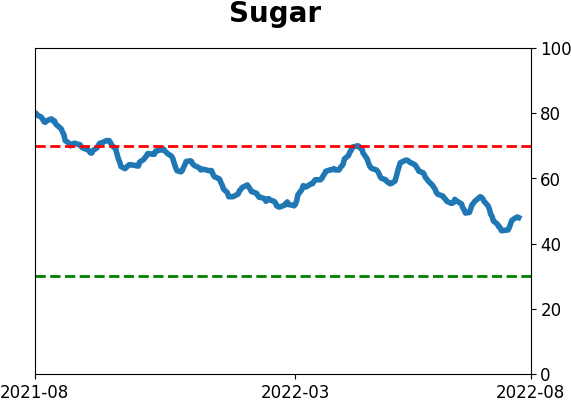
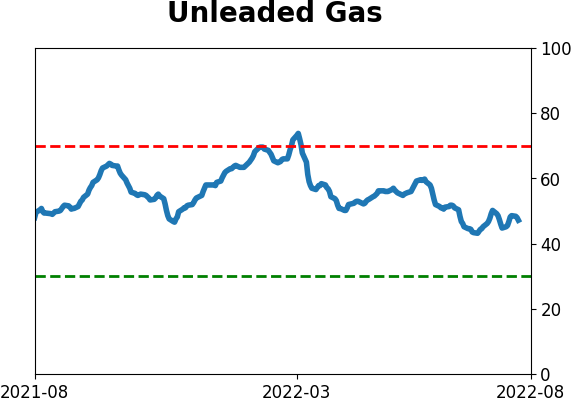
Commodity ETF's - 5-Day Moving Average
|
|