Headlines
|
|
9 Months Without a Big Dip in Positive Trends:
For the past 9 months, more than 65% of securities on the NYSE have held above their 200-day moving averages. That makes this the 3rd-strongest uptrend in the past 50 years.
Bottom Line:
See the Outlook & Allocations page for more details on these summaries STOCKS: Hold
The speculative frenzy in February is wrung out. Internal dynamics have mostly held up, with some exceptions. Many of our studies still show a mixed to poor short-term view, with medium- and long-term ones turning more positive. BONDS: Hold
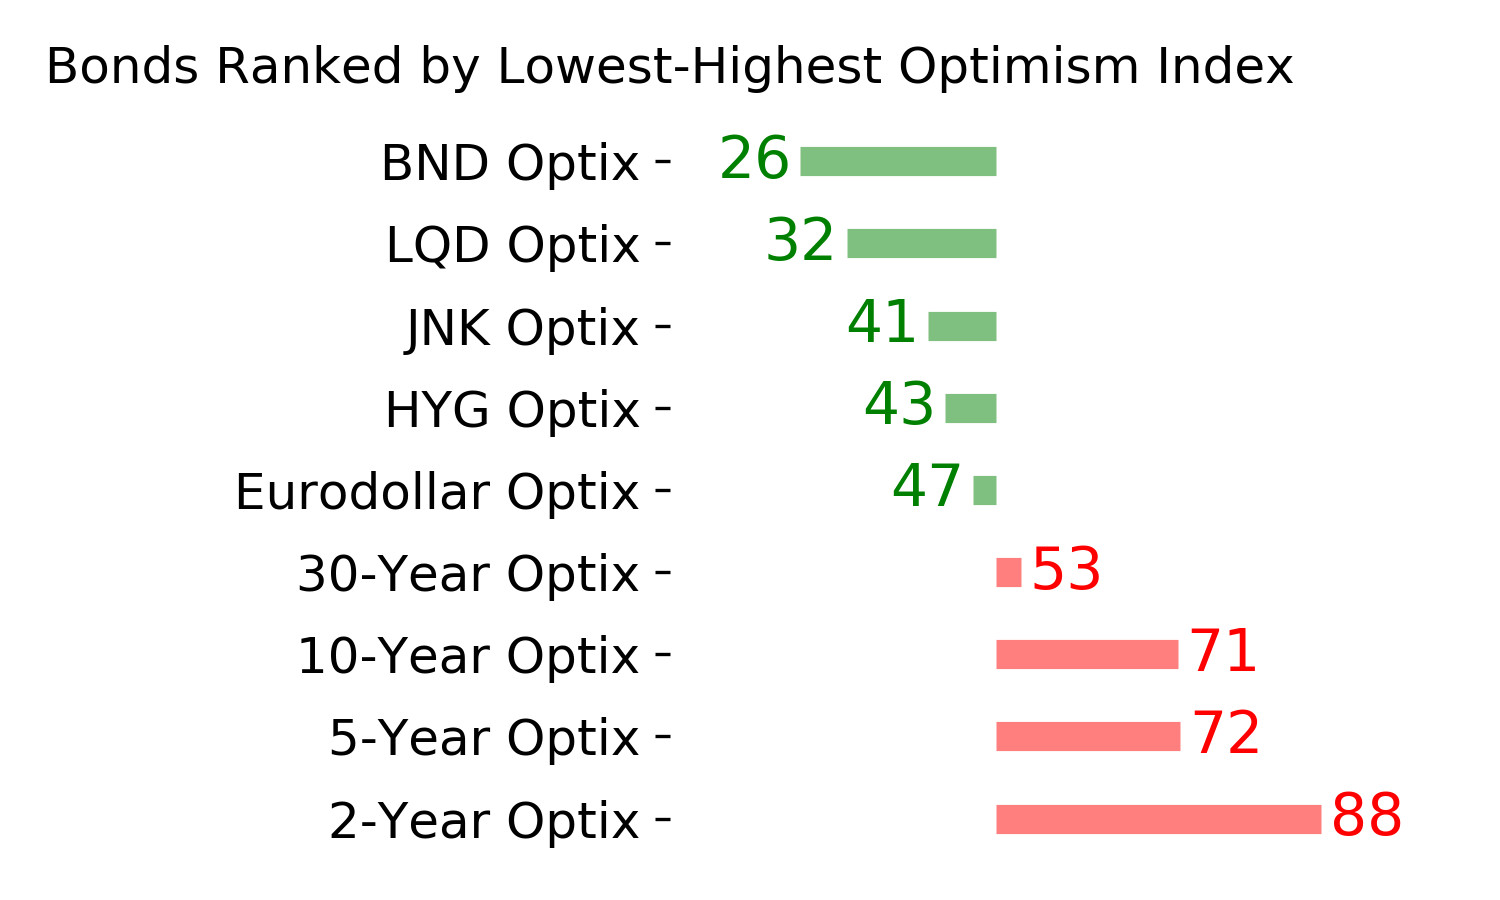
Various parts of the market got hit in March, with the lowest Bond Optimism Index we usually see during healthy environments. After a shaky couple of weeks, the broad bond market has modestly recovered. Not a big edge here either way. GOLD: Hold
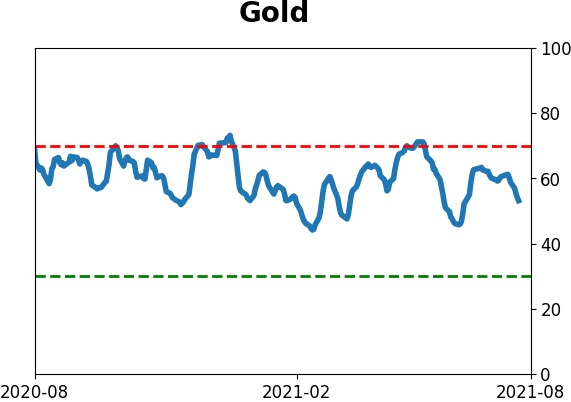
Gold and miners have done very well, recovering above long-term trend lines. The issue is that both have tended to perform poorly after similar situations - will have to wait and see how it plays out.
|
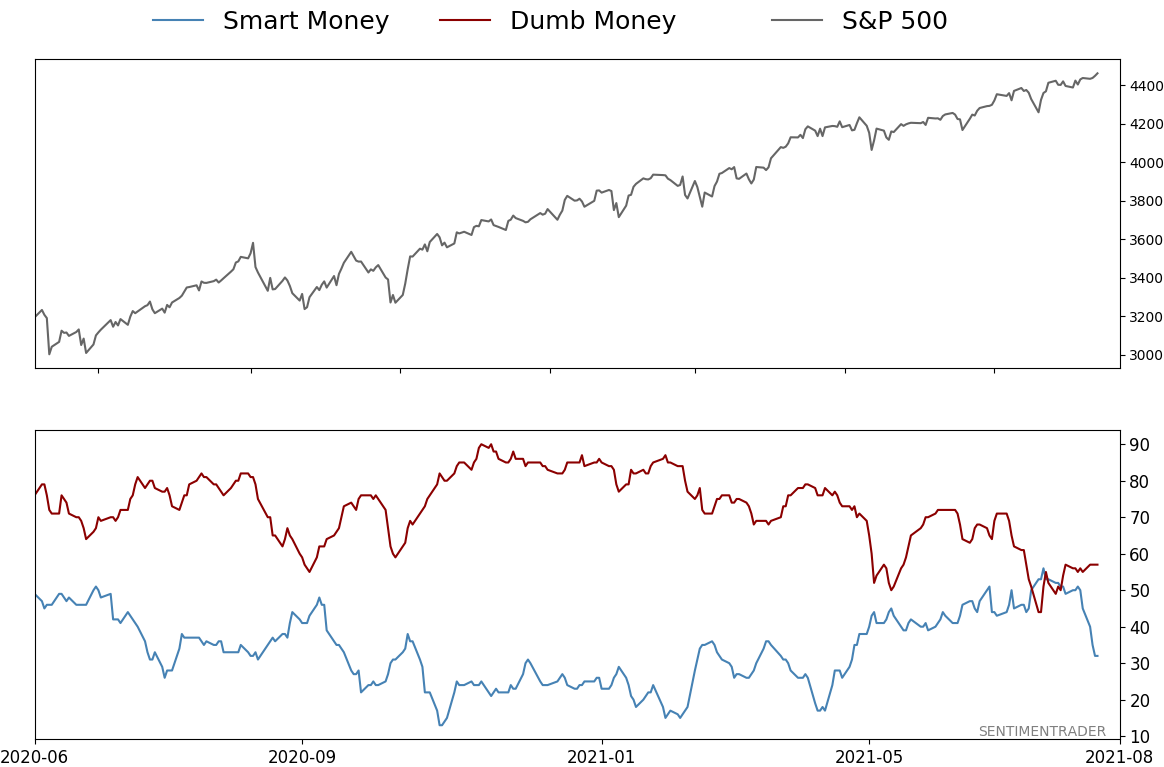
Smart / Dumb Money Confidence
|
Smart Money Confidence: 32%
Dumb Money Confidence: 57%
|
|
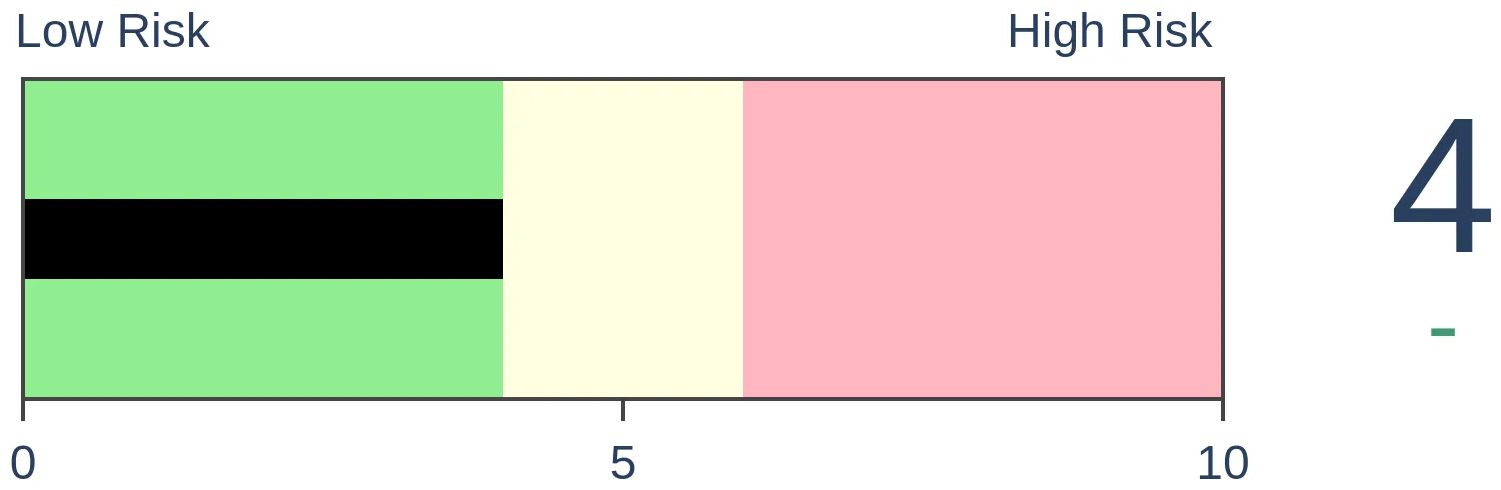
Risk Levels
Stocks Short-Term
|
Stocks Medium-Term
|
|
Bonds

|
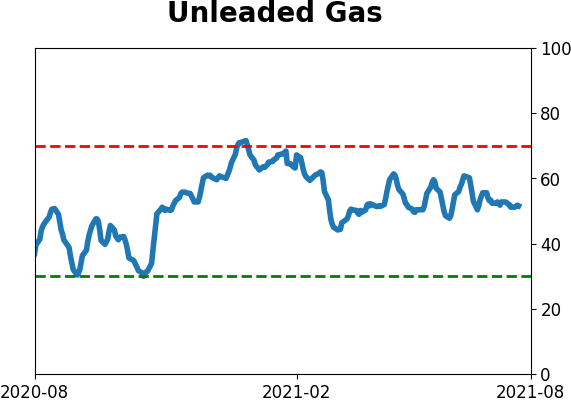
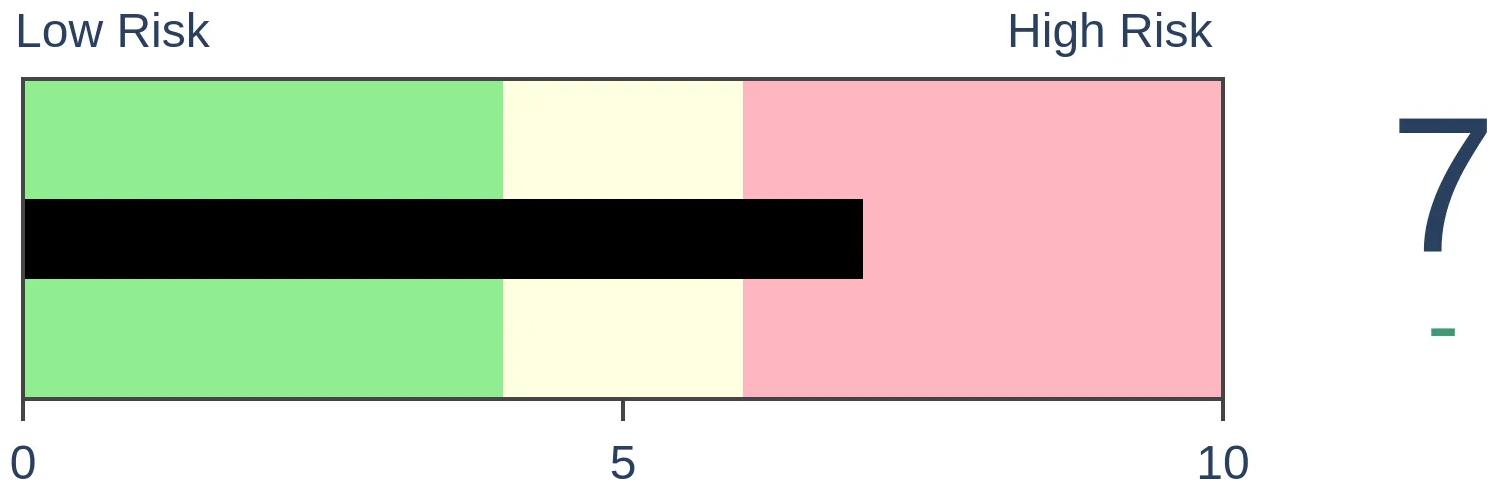
Crude Oil

|
|
Gold

|
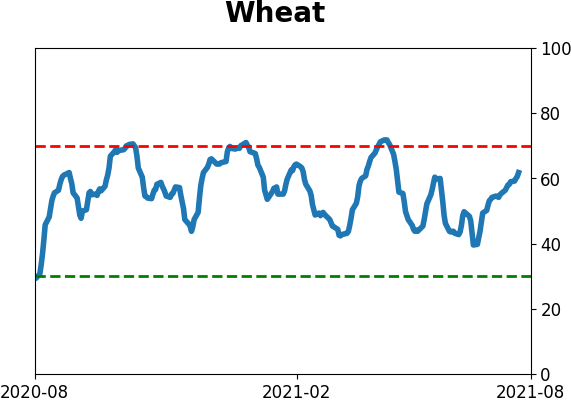
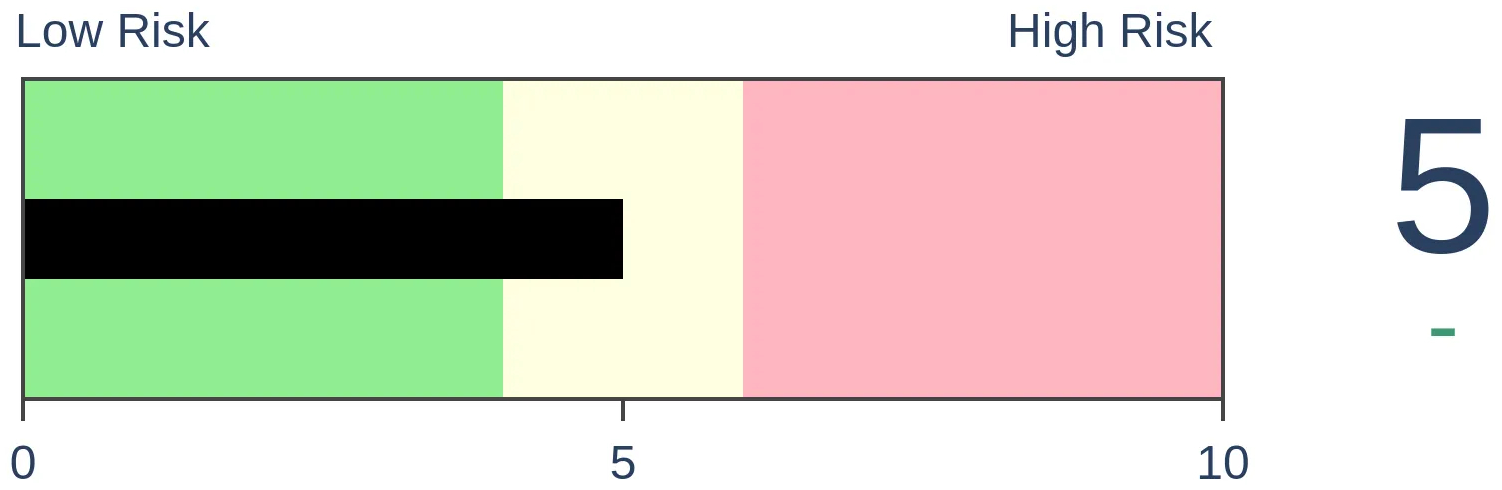
Agriculture
|
|
Research
By Jason Goepfert
BOTTOM LINE
For the past 9 months, more than 65% of securities on the NYSE have held above their 200-day moving averages. That makes this the 3rd-strongest uptrend in the past 50 years.
FORECAST / TIMEFRAME
None
|
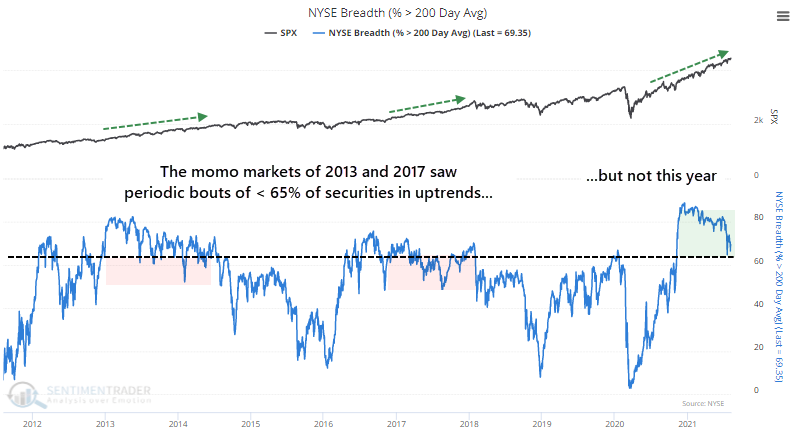
Trends in 2021 have overpowered every other factor we typically consider when it comes to stocks. Sentiment hasn't mattered. Seasonality hasn't mattered. Divergences haven't mattered.
We saw earlier this week how this year has been among the best in history. It's even been remarkable for world markets. Within the universe of securities traded on the NYSE, this is the best market in over a decade and among the best in 60 years.
For nine months - 189 consecutive trading days - more than 65% of securities trading on that exchange have held above their 200-day moving averages. Even the remarkable momentum markets in 2013 and 2017 couldn't match this streak.
Dating back to 1927, this long of a streak has been rarely exceeded. The current one is now the 3rd-longest in five decades.
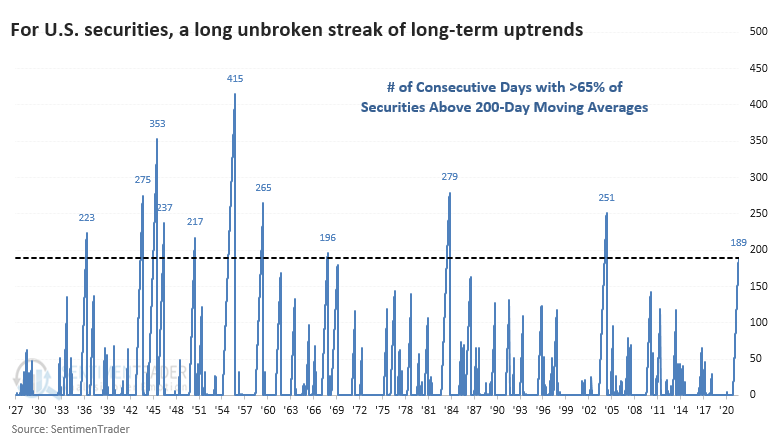
Over the past 50 years, the only times the S&P 500 enjoyed a longer streak was when stocks began recovering following the 1970s malaise and the post-bubble bust in the early 2000s.
SOME HISTORICAL PERSPECTIVE
If we go back to 1928 and look at forward returns once we reached 189 days with more than 65% of securities above their long-term trendlines, it proved to be mostly a good sign.
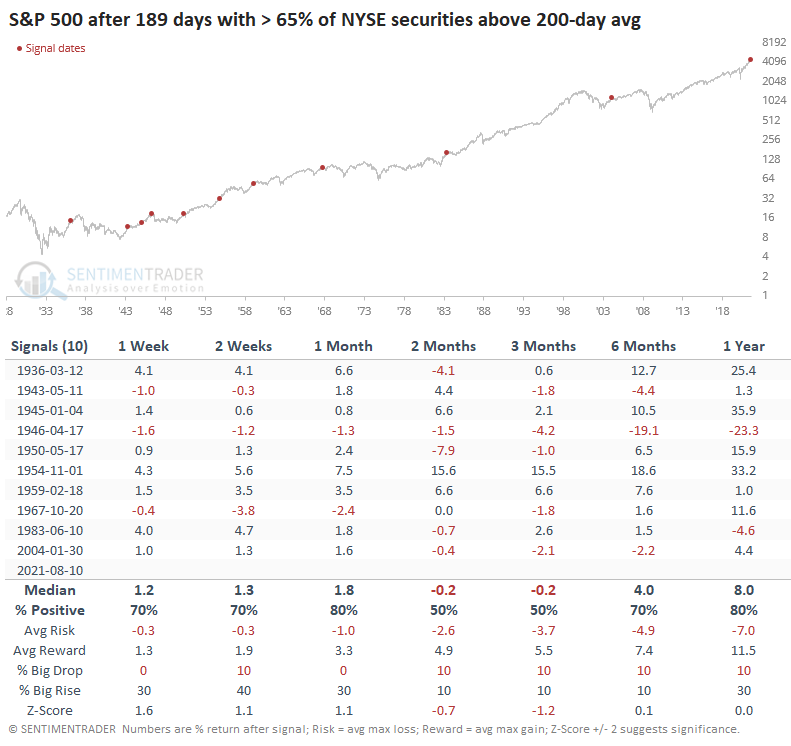
The medium-term of 2-3 months showed some sketchy returns. The S&P showed a negative median return and uninspiring risk/reward ratio. Only 3 out of the 10 signals showed a positive return across both of those time frames, and one of those gave up most of its gains soon after.
But over the next 6-12 months, it was harder to find a negative return. The momentum in 1946 coincided with a major market peak, and the S&P 500 lost more than 20% over the next year. That was also the only real exception, with the others showing at least modest gains or a minor loss.
TECH TROUBLES
The biggest issue for extreme momentum like this is that sometimes it can indicate excessive risk-taking. When we look at forward returns in sectors and factors, we can see some evidence of that.
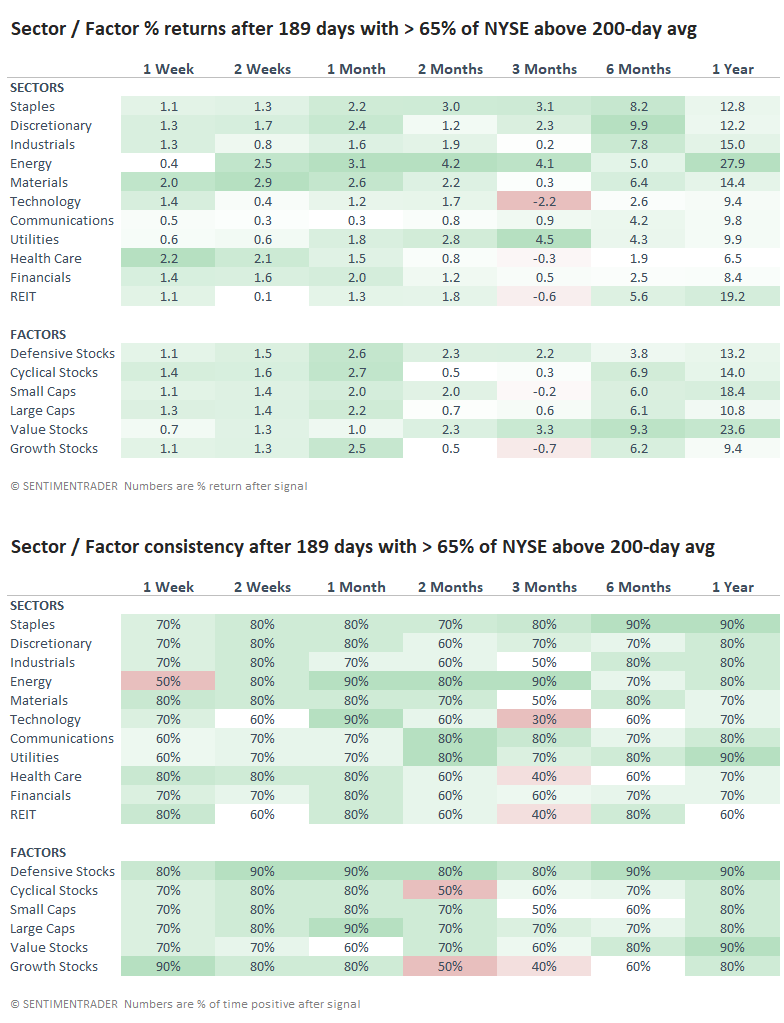
Over the next few months, Technology and Growth stocks tended to suffer the most, while Value and Defensive stocks showed among the best returns. That makes some sense if we think about investors not willing to sell out of the market entirely but shift their portfolios to "safer" parts of the market.
This year has been among the most unusual in history, from a variety of perspectives. That always makes it challenging to rely on historical precedents because the sample size is getting smaller and smaller. From the few examples we can find, this type of momentum has preceded weak or in-line short- to medium-term returns but consistently strong returns over the next 6-12 months.
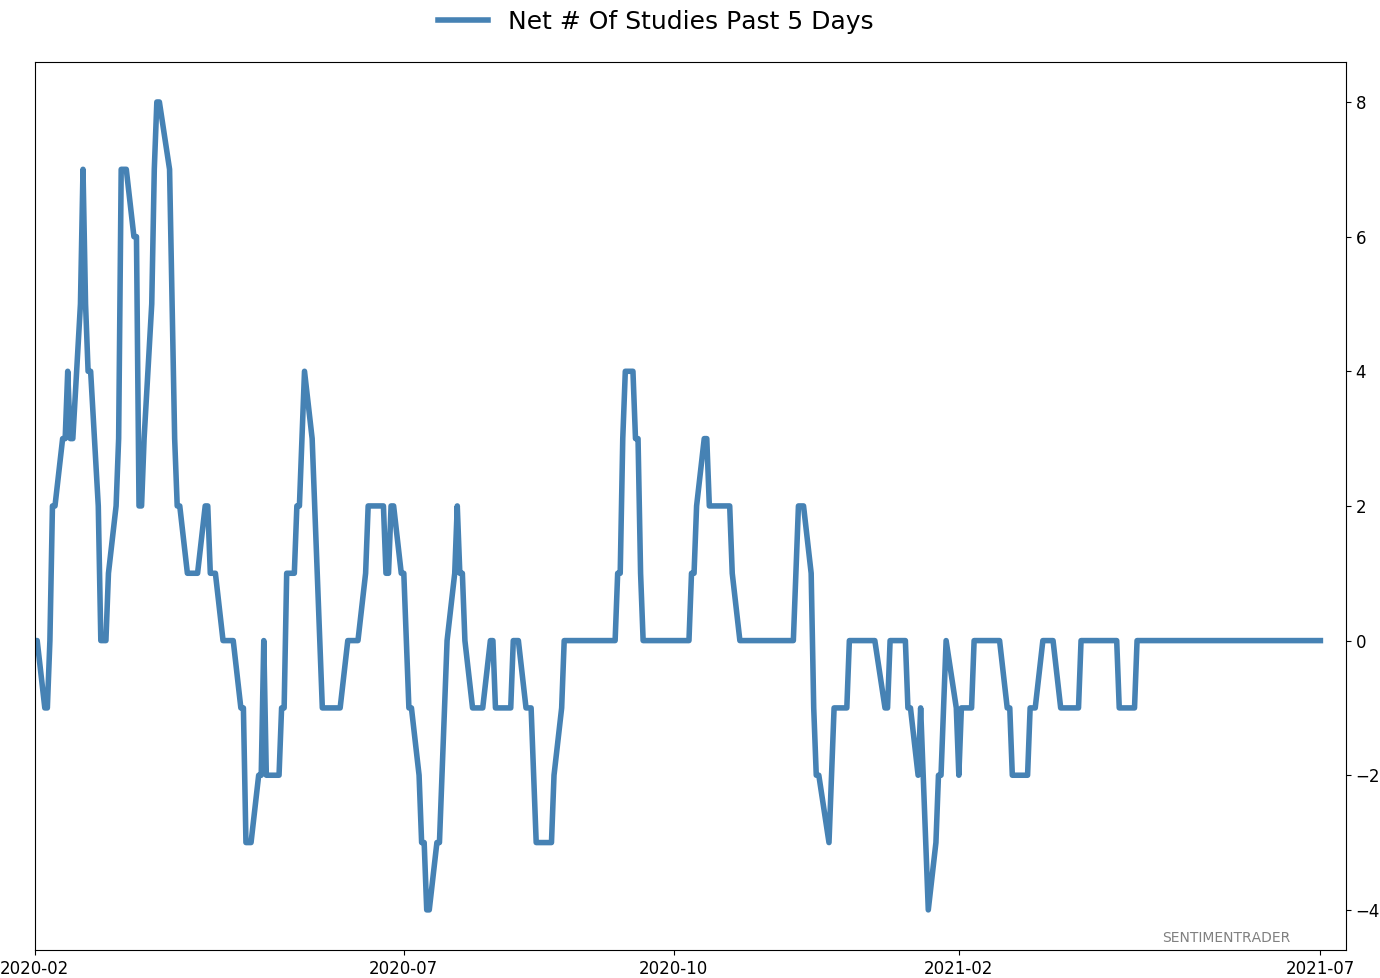
Active Studies
| Time Frame | Bullish | Bearish | | Short-Term | 0 | 4 | | Medium-Term | 4 | 3 | | Long-Term | 10 | 5 |
|
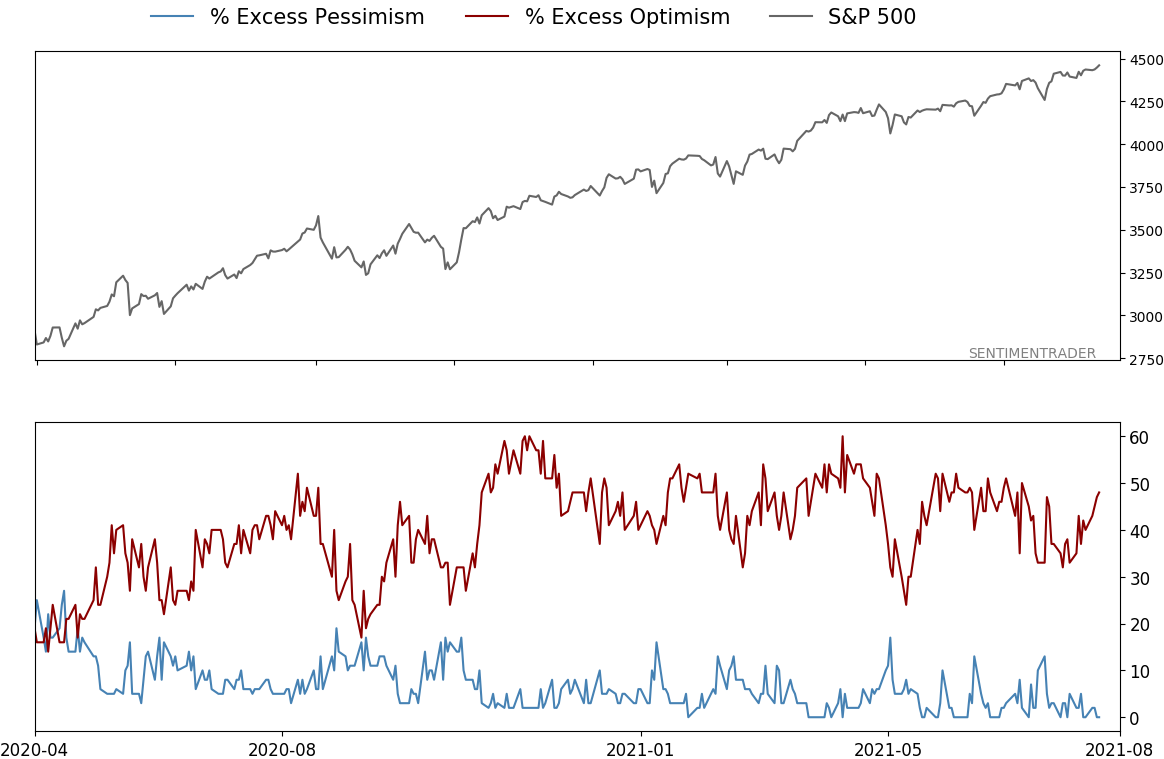
Indicators at Extremes
|
% Showing Pessimism: 0%
Bullish for Stocks
|
|
Portfolio
| Position | Description | Weight % | Added / Reduced | Date | | Stocks | RSP | 4.1 | Added 4.1% | 2021-05-19 | | Bonds | 23.9% BND, 6.9% SCHP | 30.7 | Reduced 7.1% | 2021-05-19 | | Commodities | GCC | 2.6 | Reduced 2.1%
| 2020-09-04 | | Precious Metals | GDX | 5.6 | Reduced 4.2% | 2021-05-19 | | Special Situations | 4.3% XLE, 2.2% PSCE | 7.6 | Reduced 5.6% | 2021-04-22 | | Cash | | 49.4 | | |
|
Updates (Changes made today are underlined)
Much of our momentum and trend work has remained positive for several months, with some scattered exceptions. Almost all sentiment-related work has shown a poor risk/reward ratio for stocks, especially as speculation drove to record highs in exuberance in February. Much of that has worn off, and most of our models are back toward neutral levels. There isn't much to be excited about here. The same goes for bonds and even gold. Gold has been performing well lately and is back above long-term trend lines. The issue is that it has a poor record of holding onto gains when attempting a long-term trend change like this, so we'll take a wait-and-see approach. RETURN YTD: 8.4% 2020: 8.1%, 2019: 12.6%, 2018: 0.6%, 2017: 3.8%, 2016: 17.1%, 2015: 9.2%, 2014: 14.5%, 2013: 2.2%, 2012: 10.8%, 2011: 16.5%, 2010: 15.3%, 2009: 23.9%, 2008: 16.2%, 2007: 7.8%
|
|
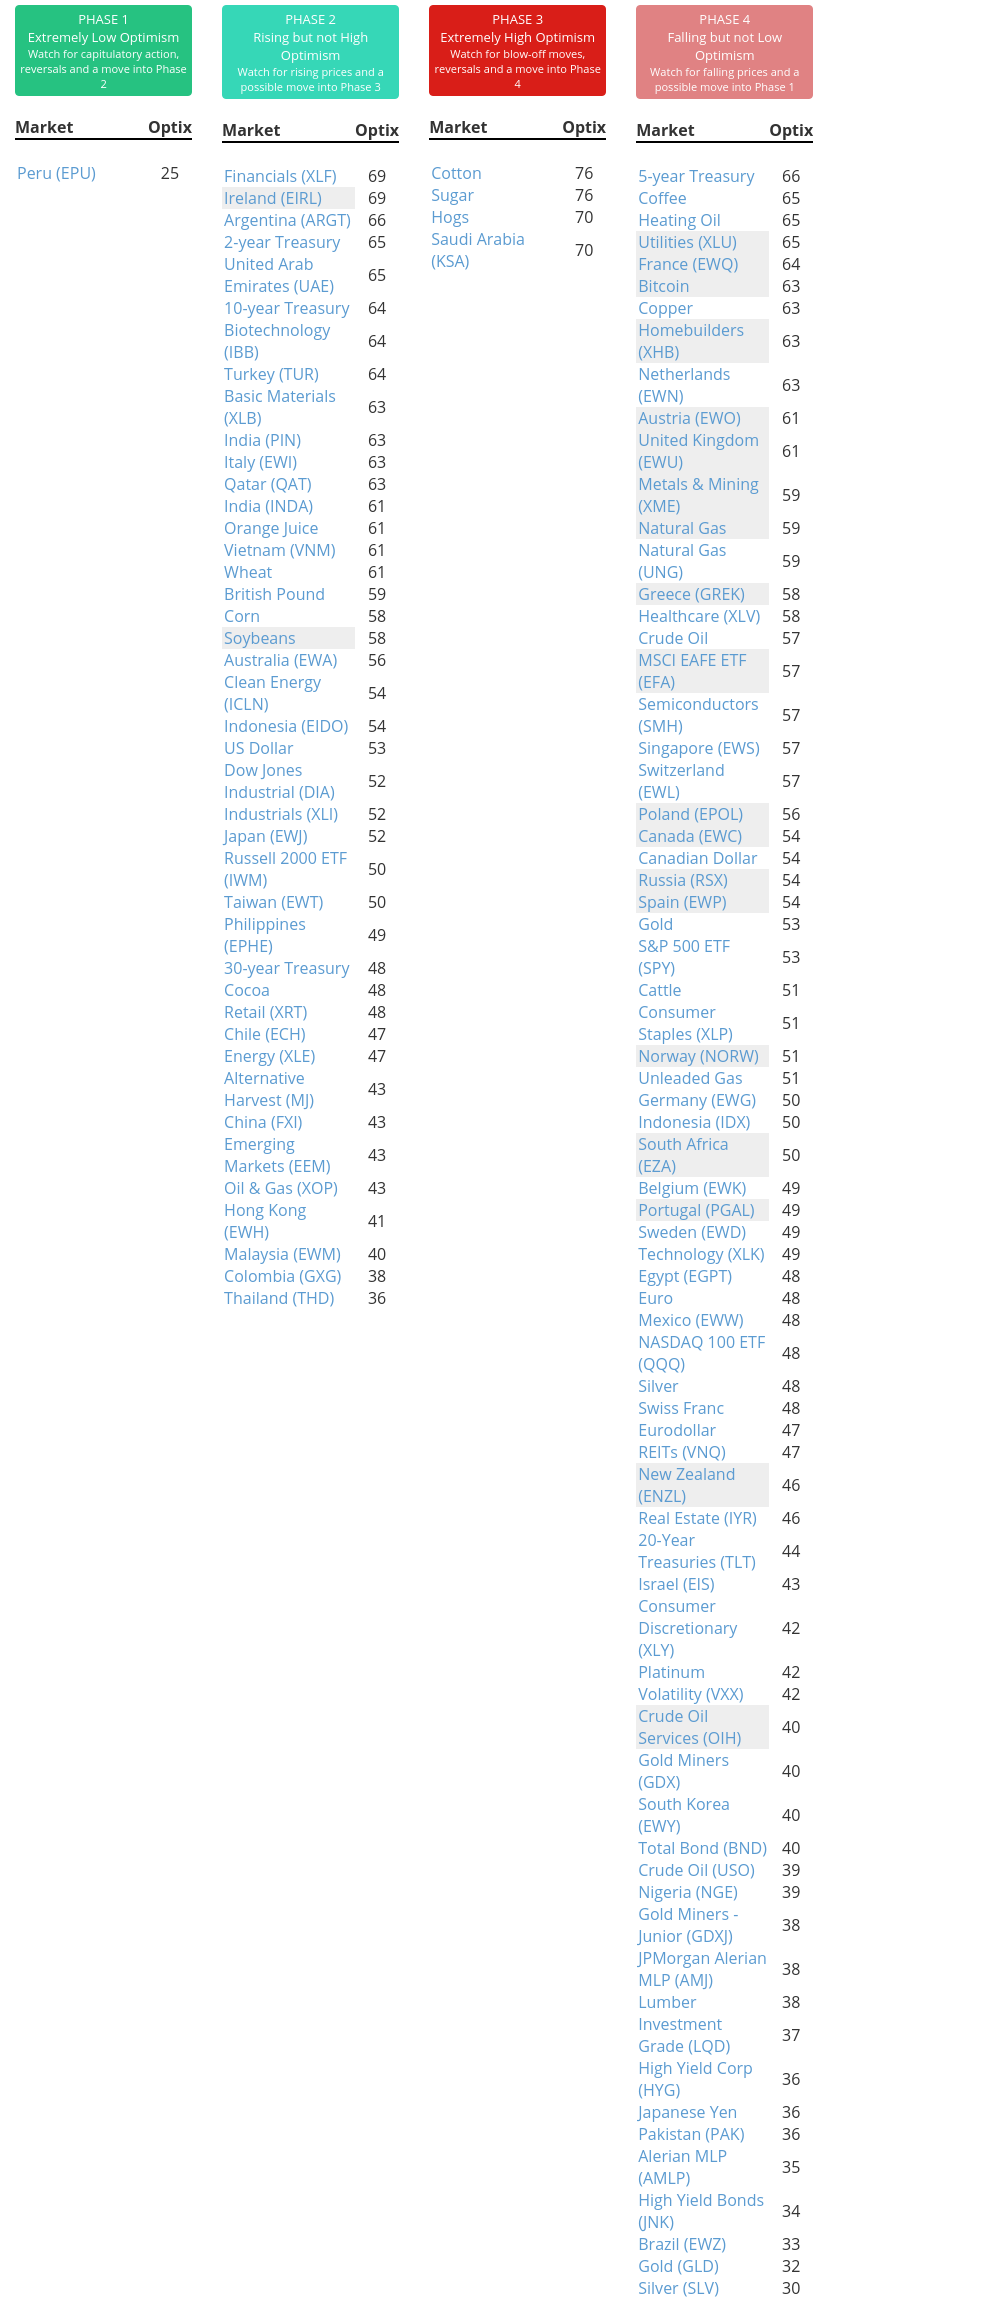
Phase Table
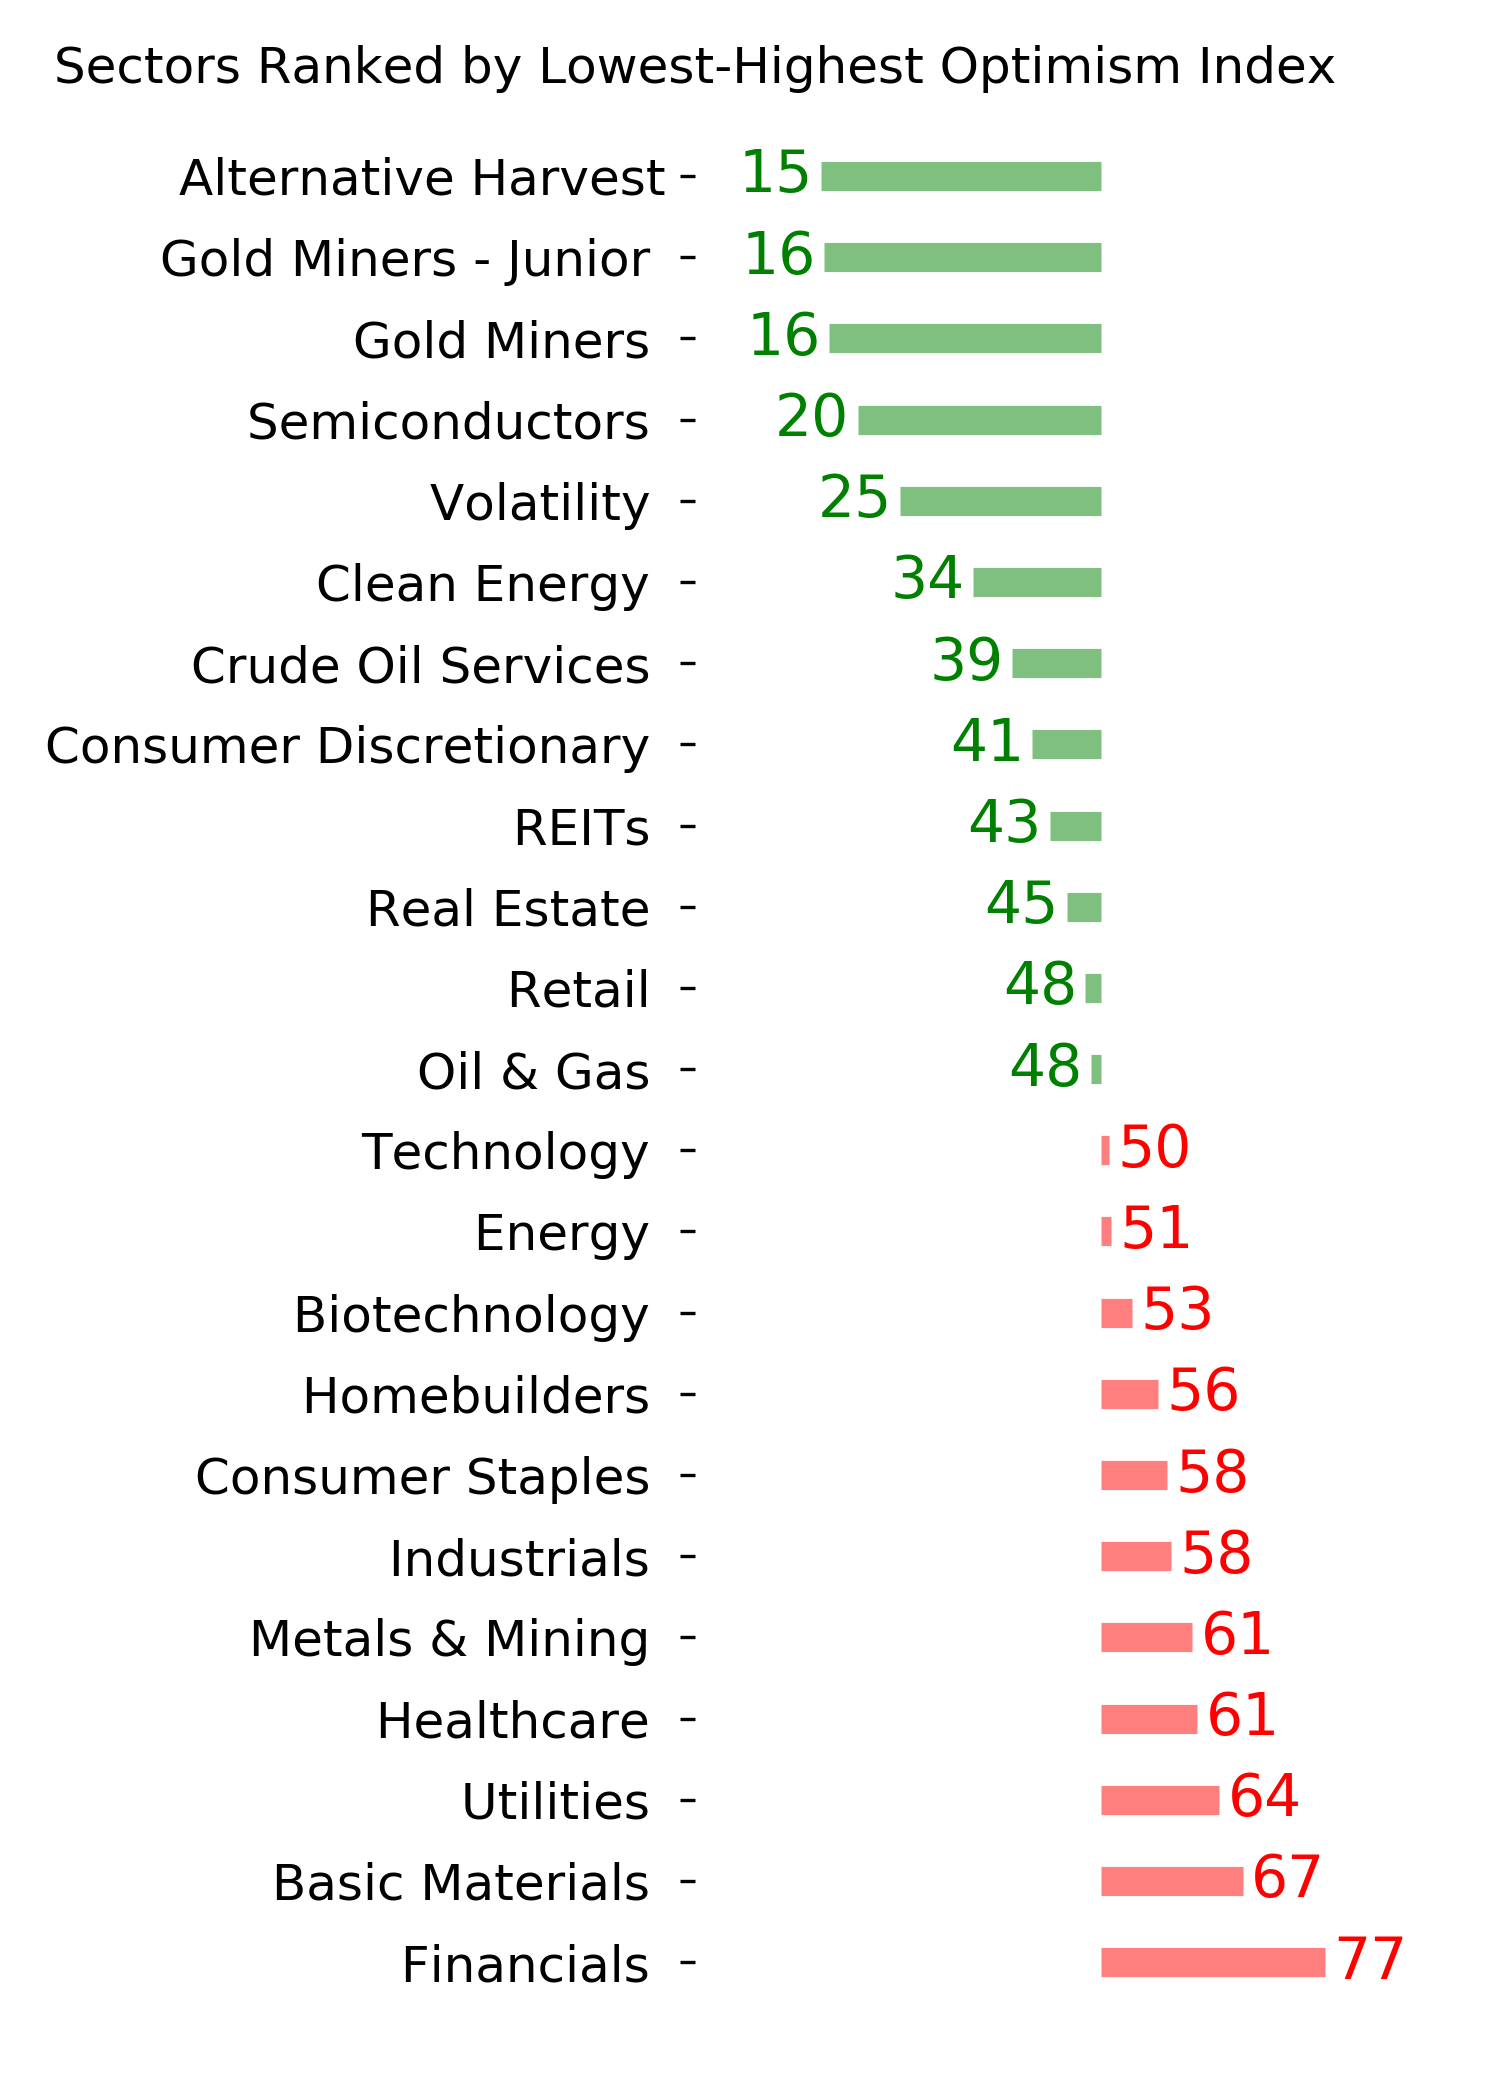
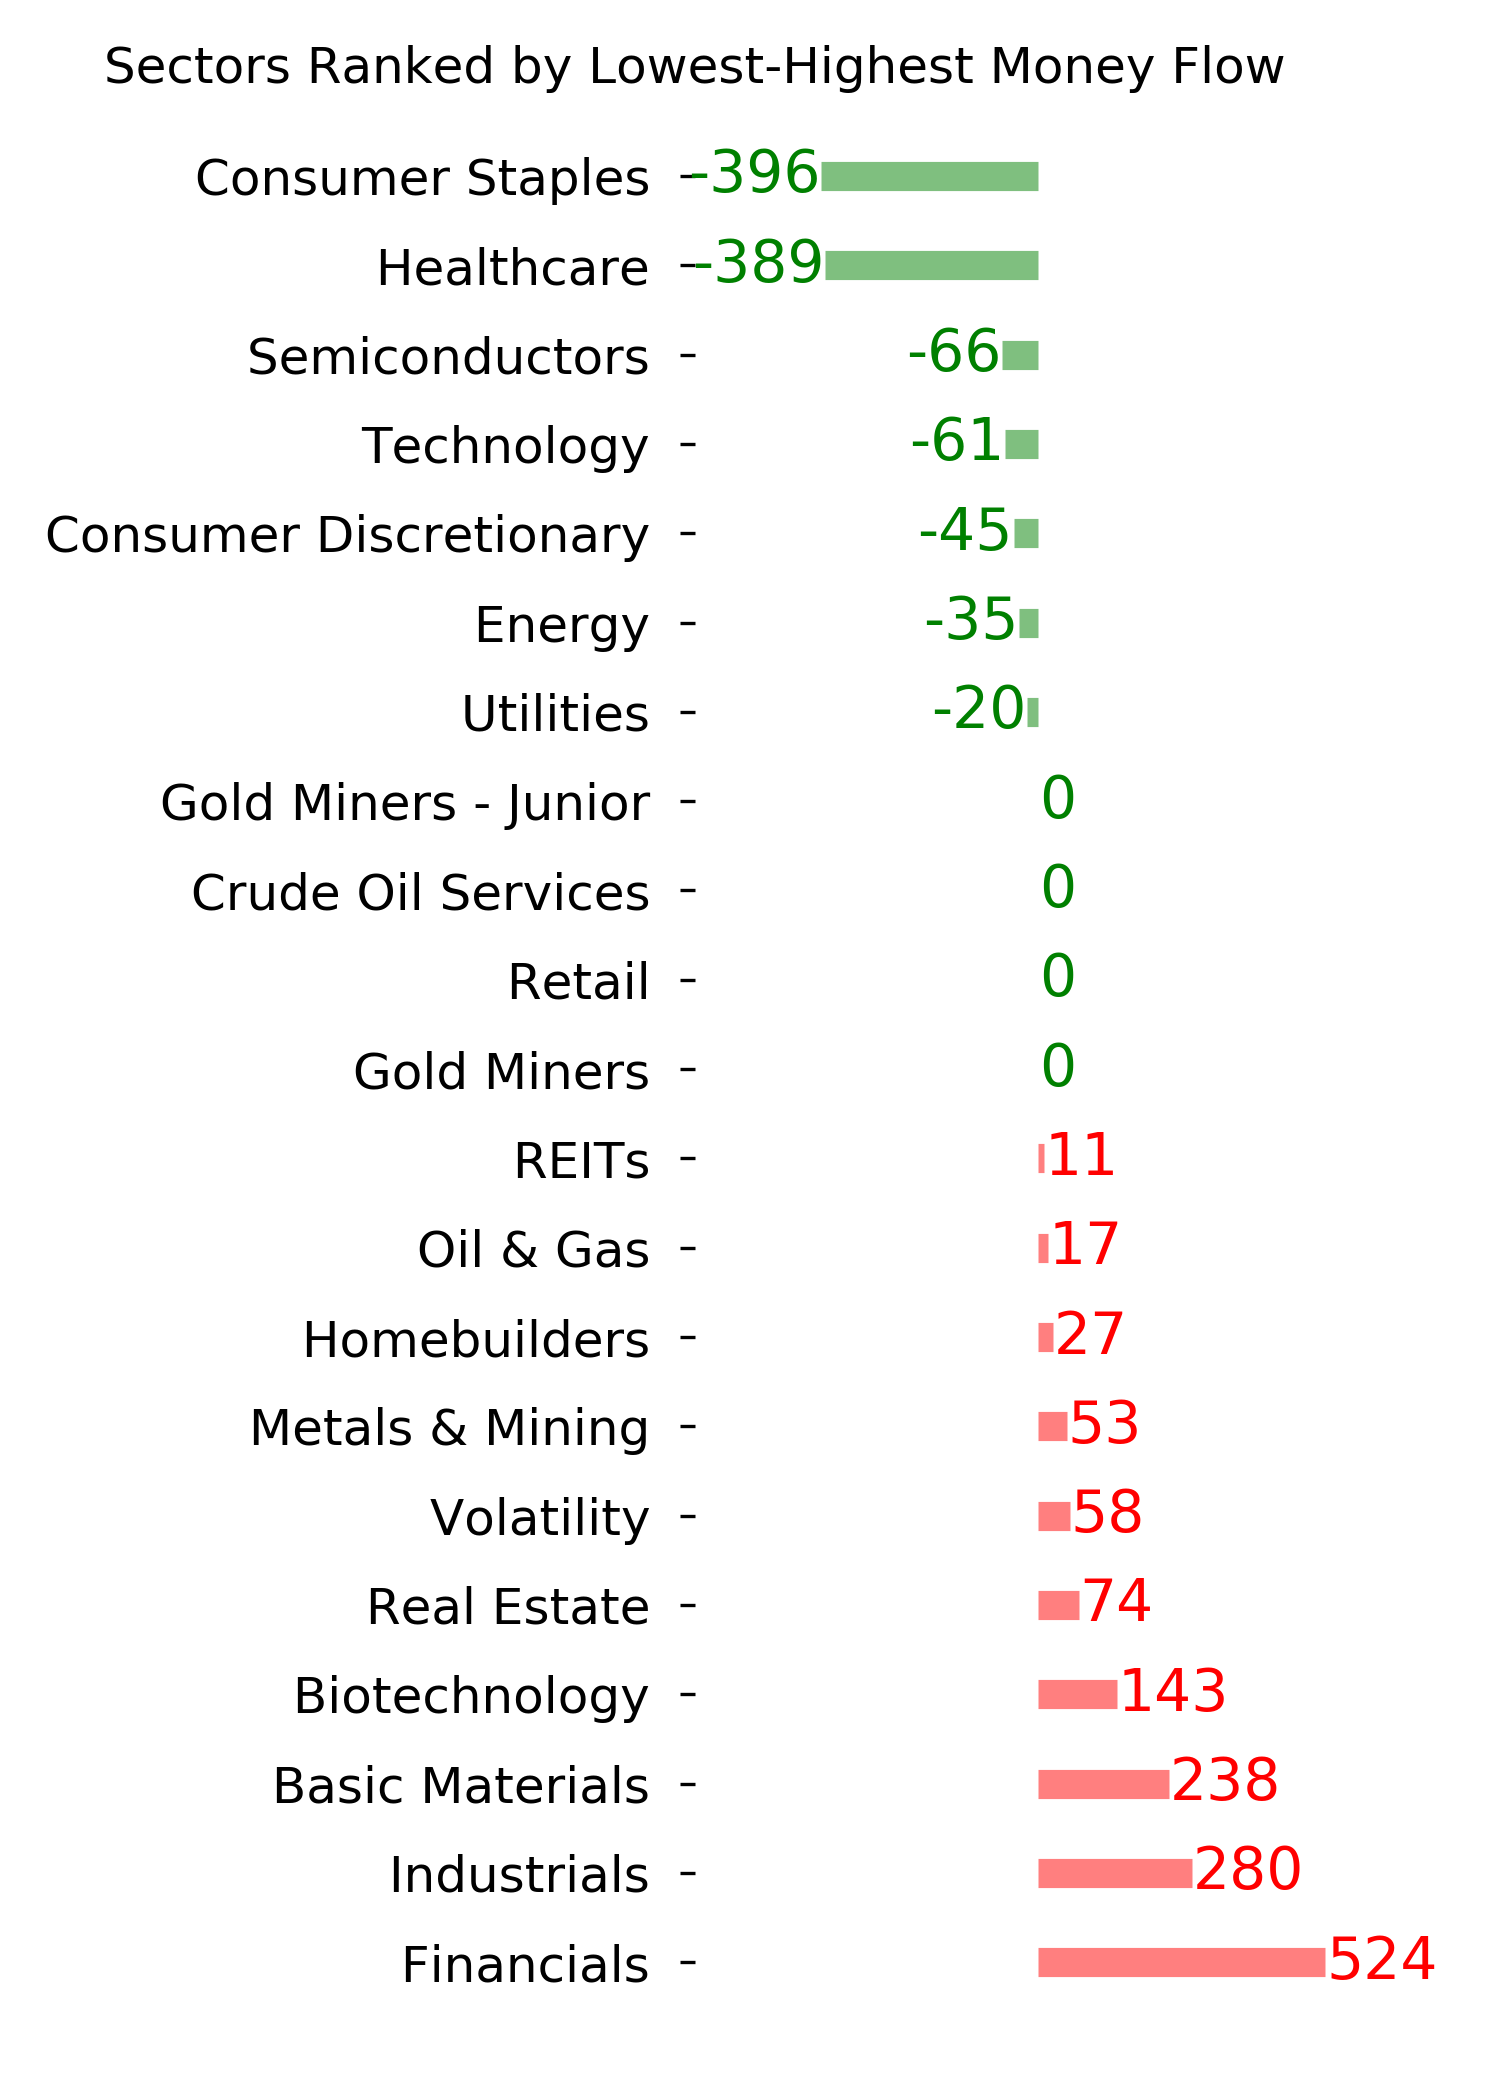
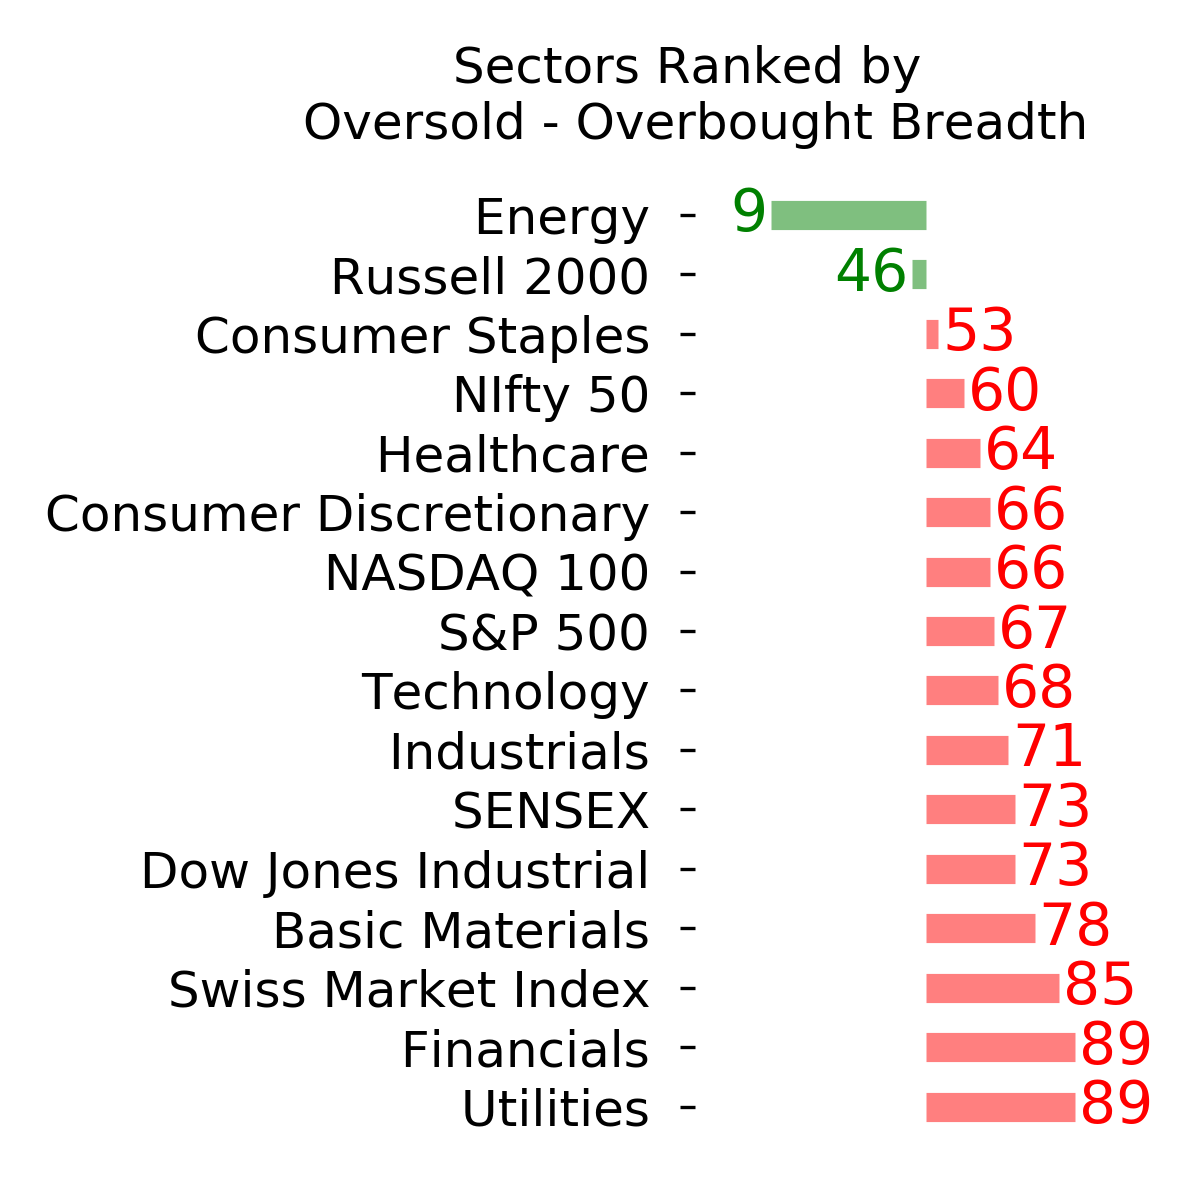
Ranks
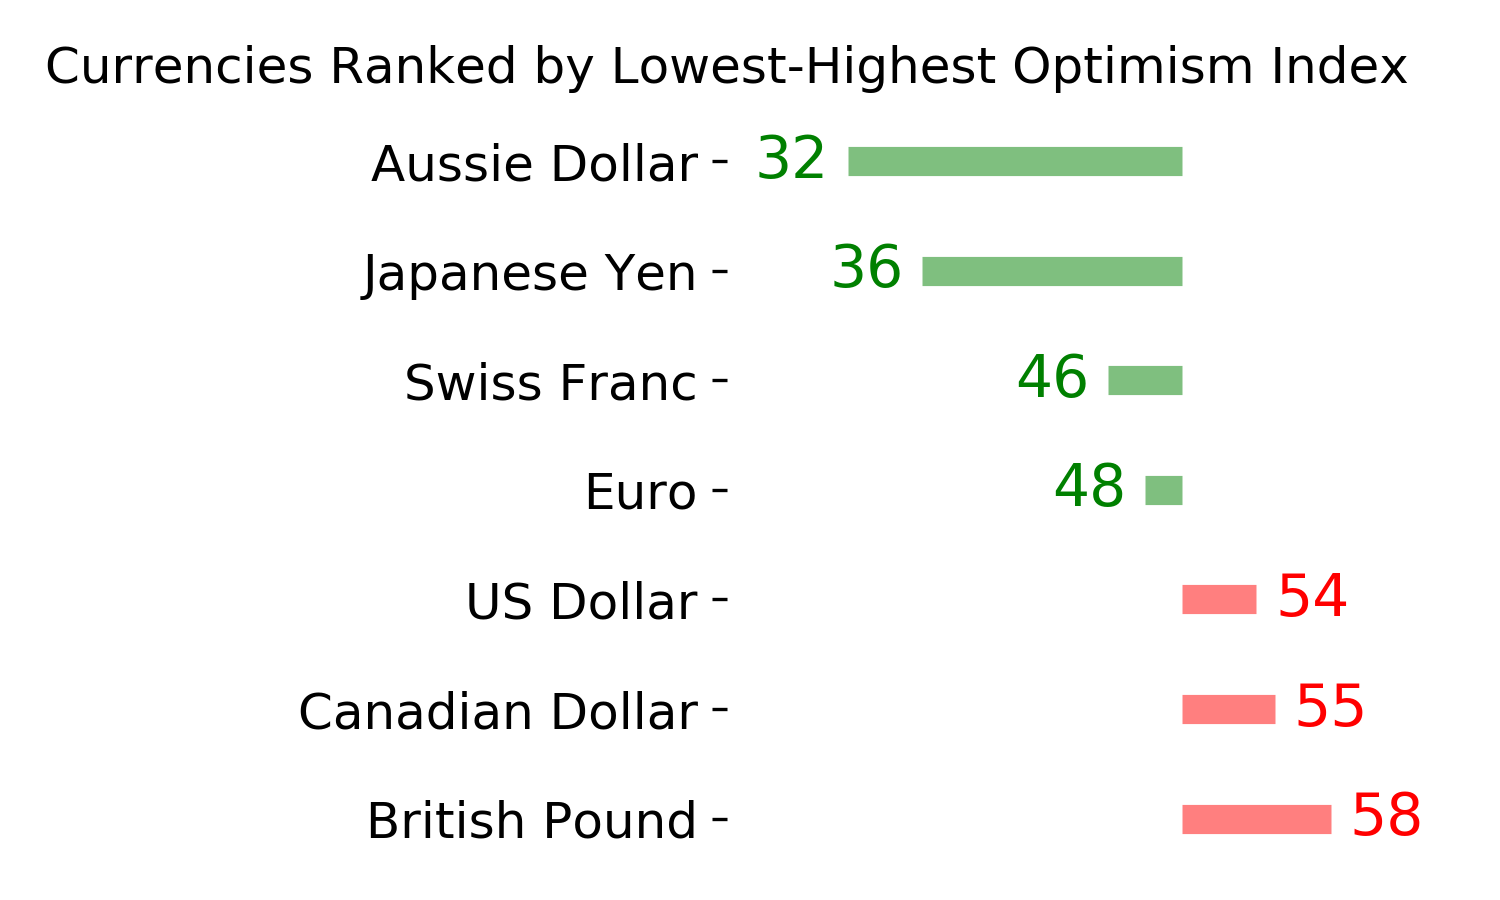
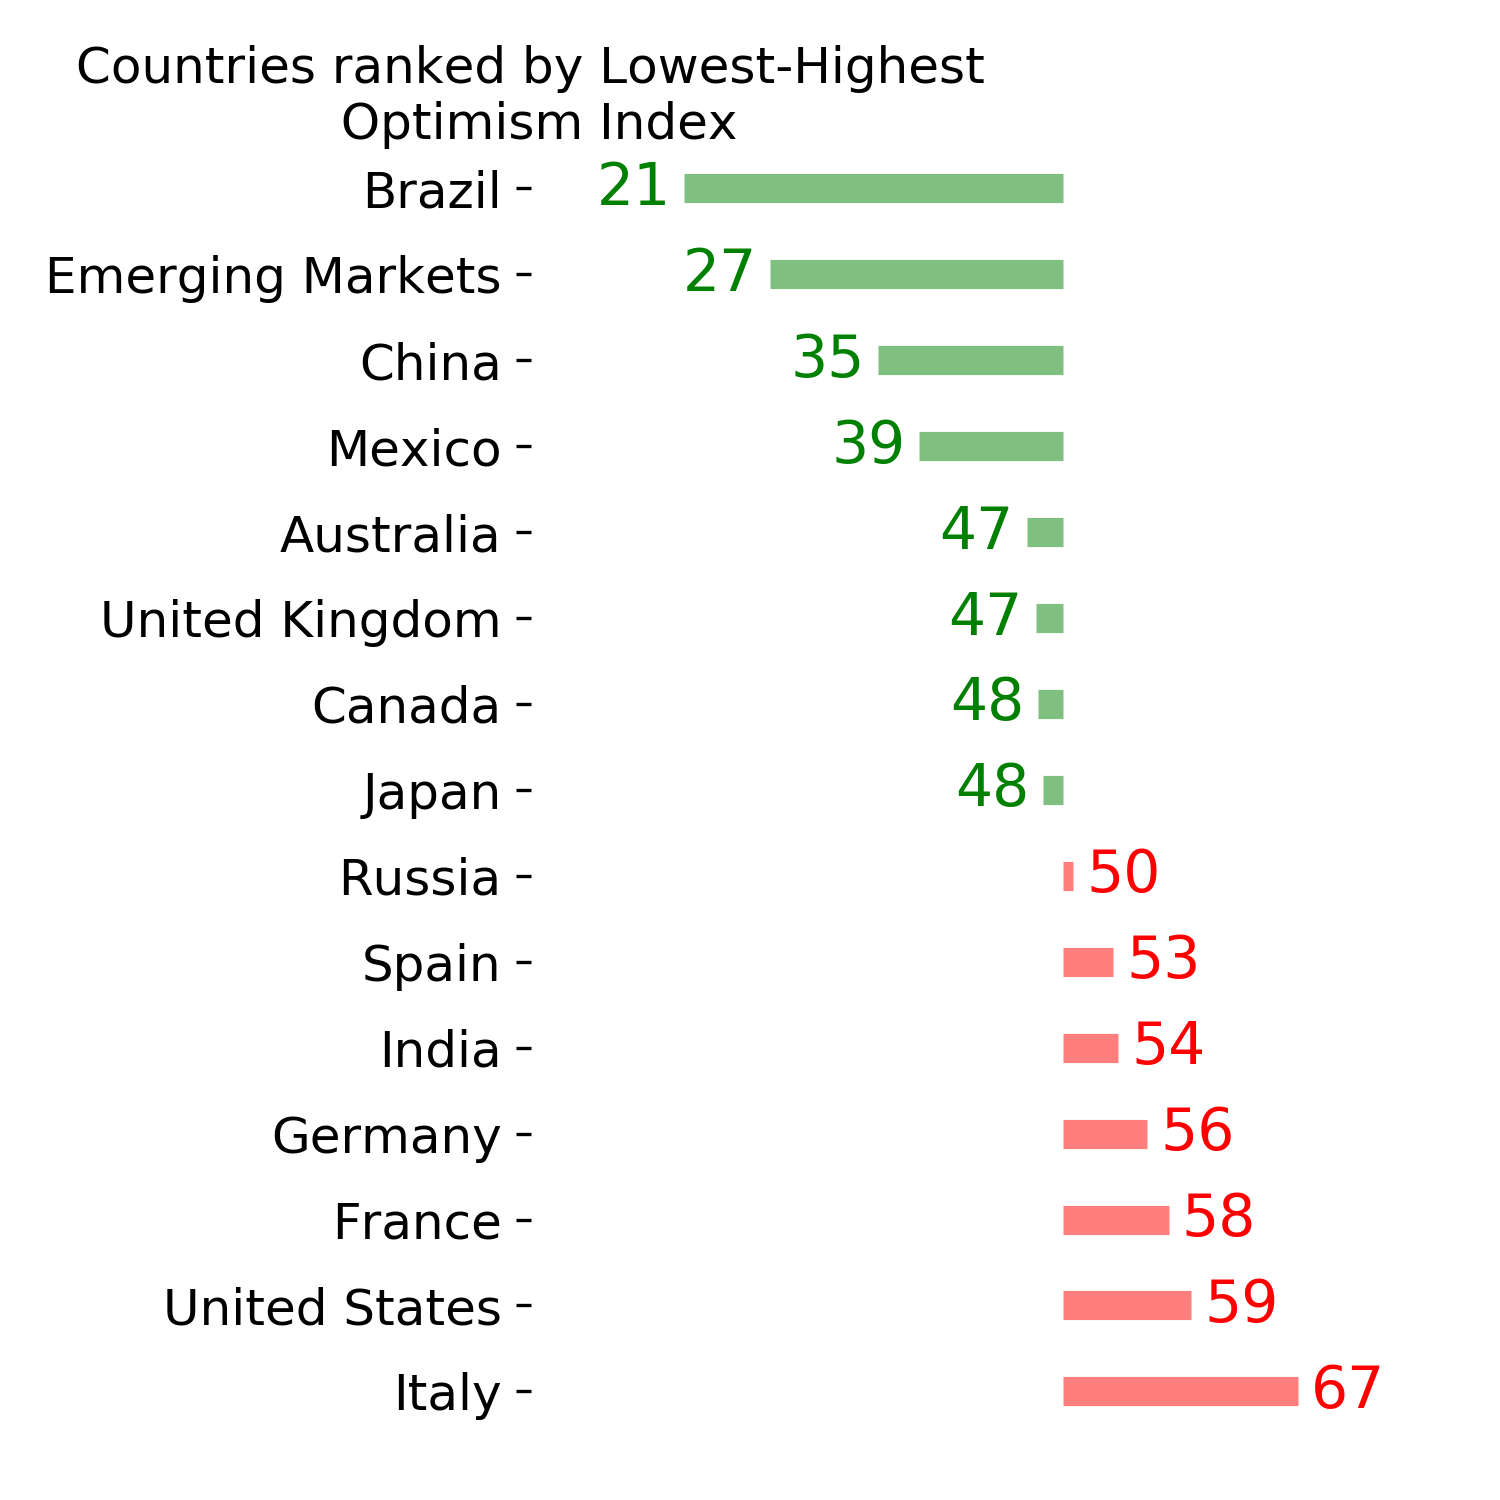
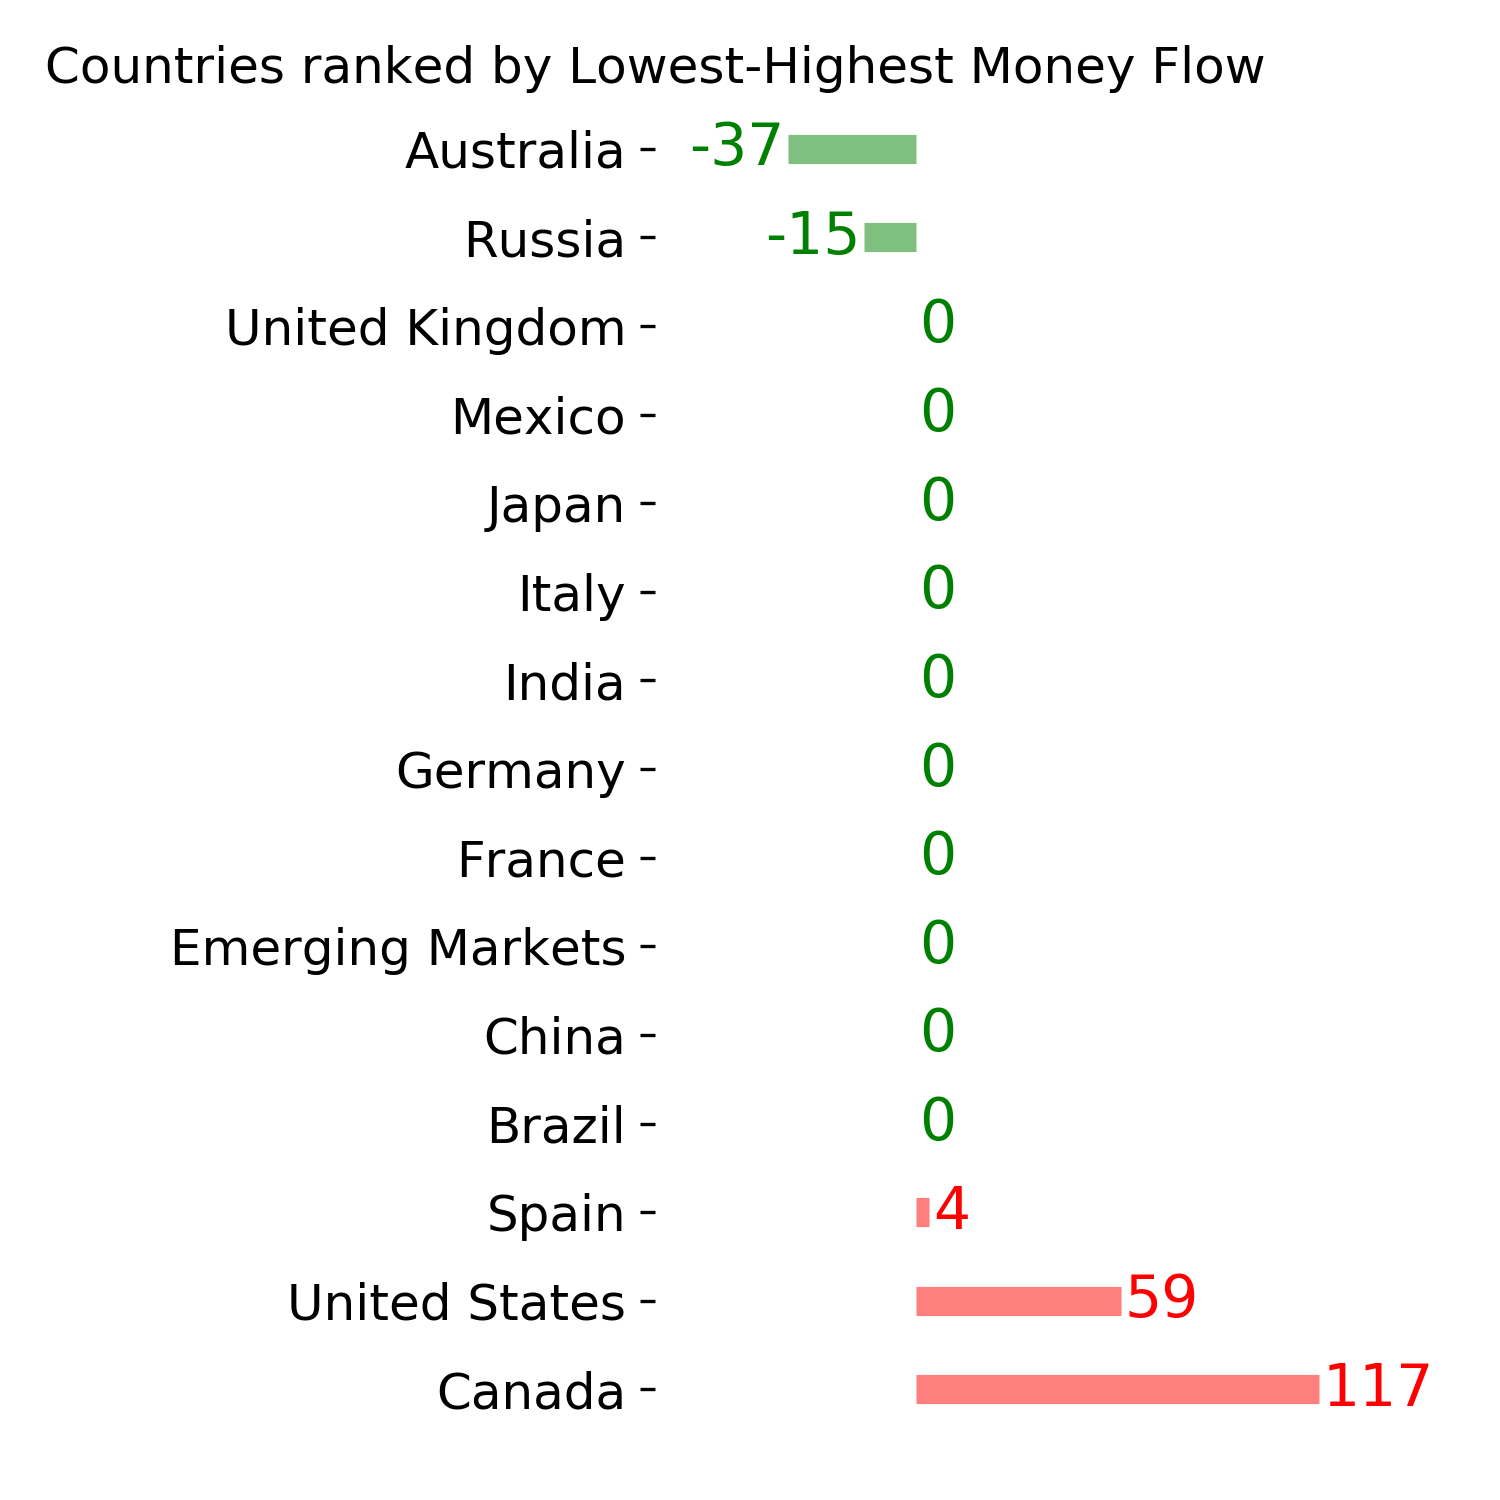
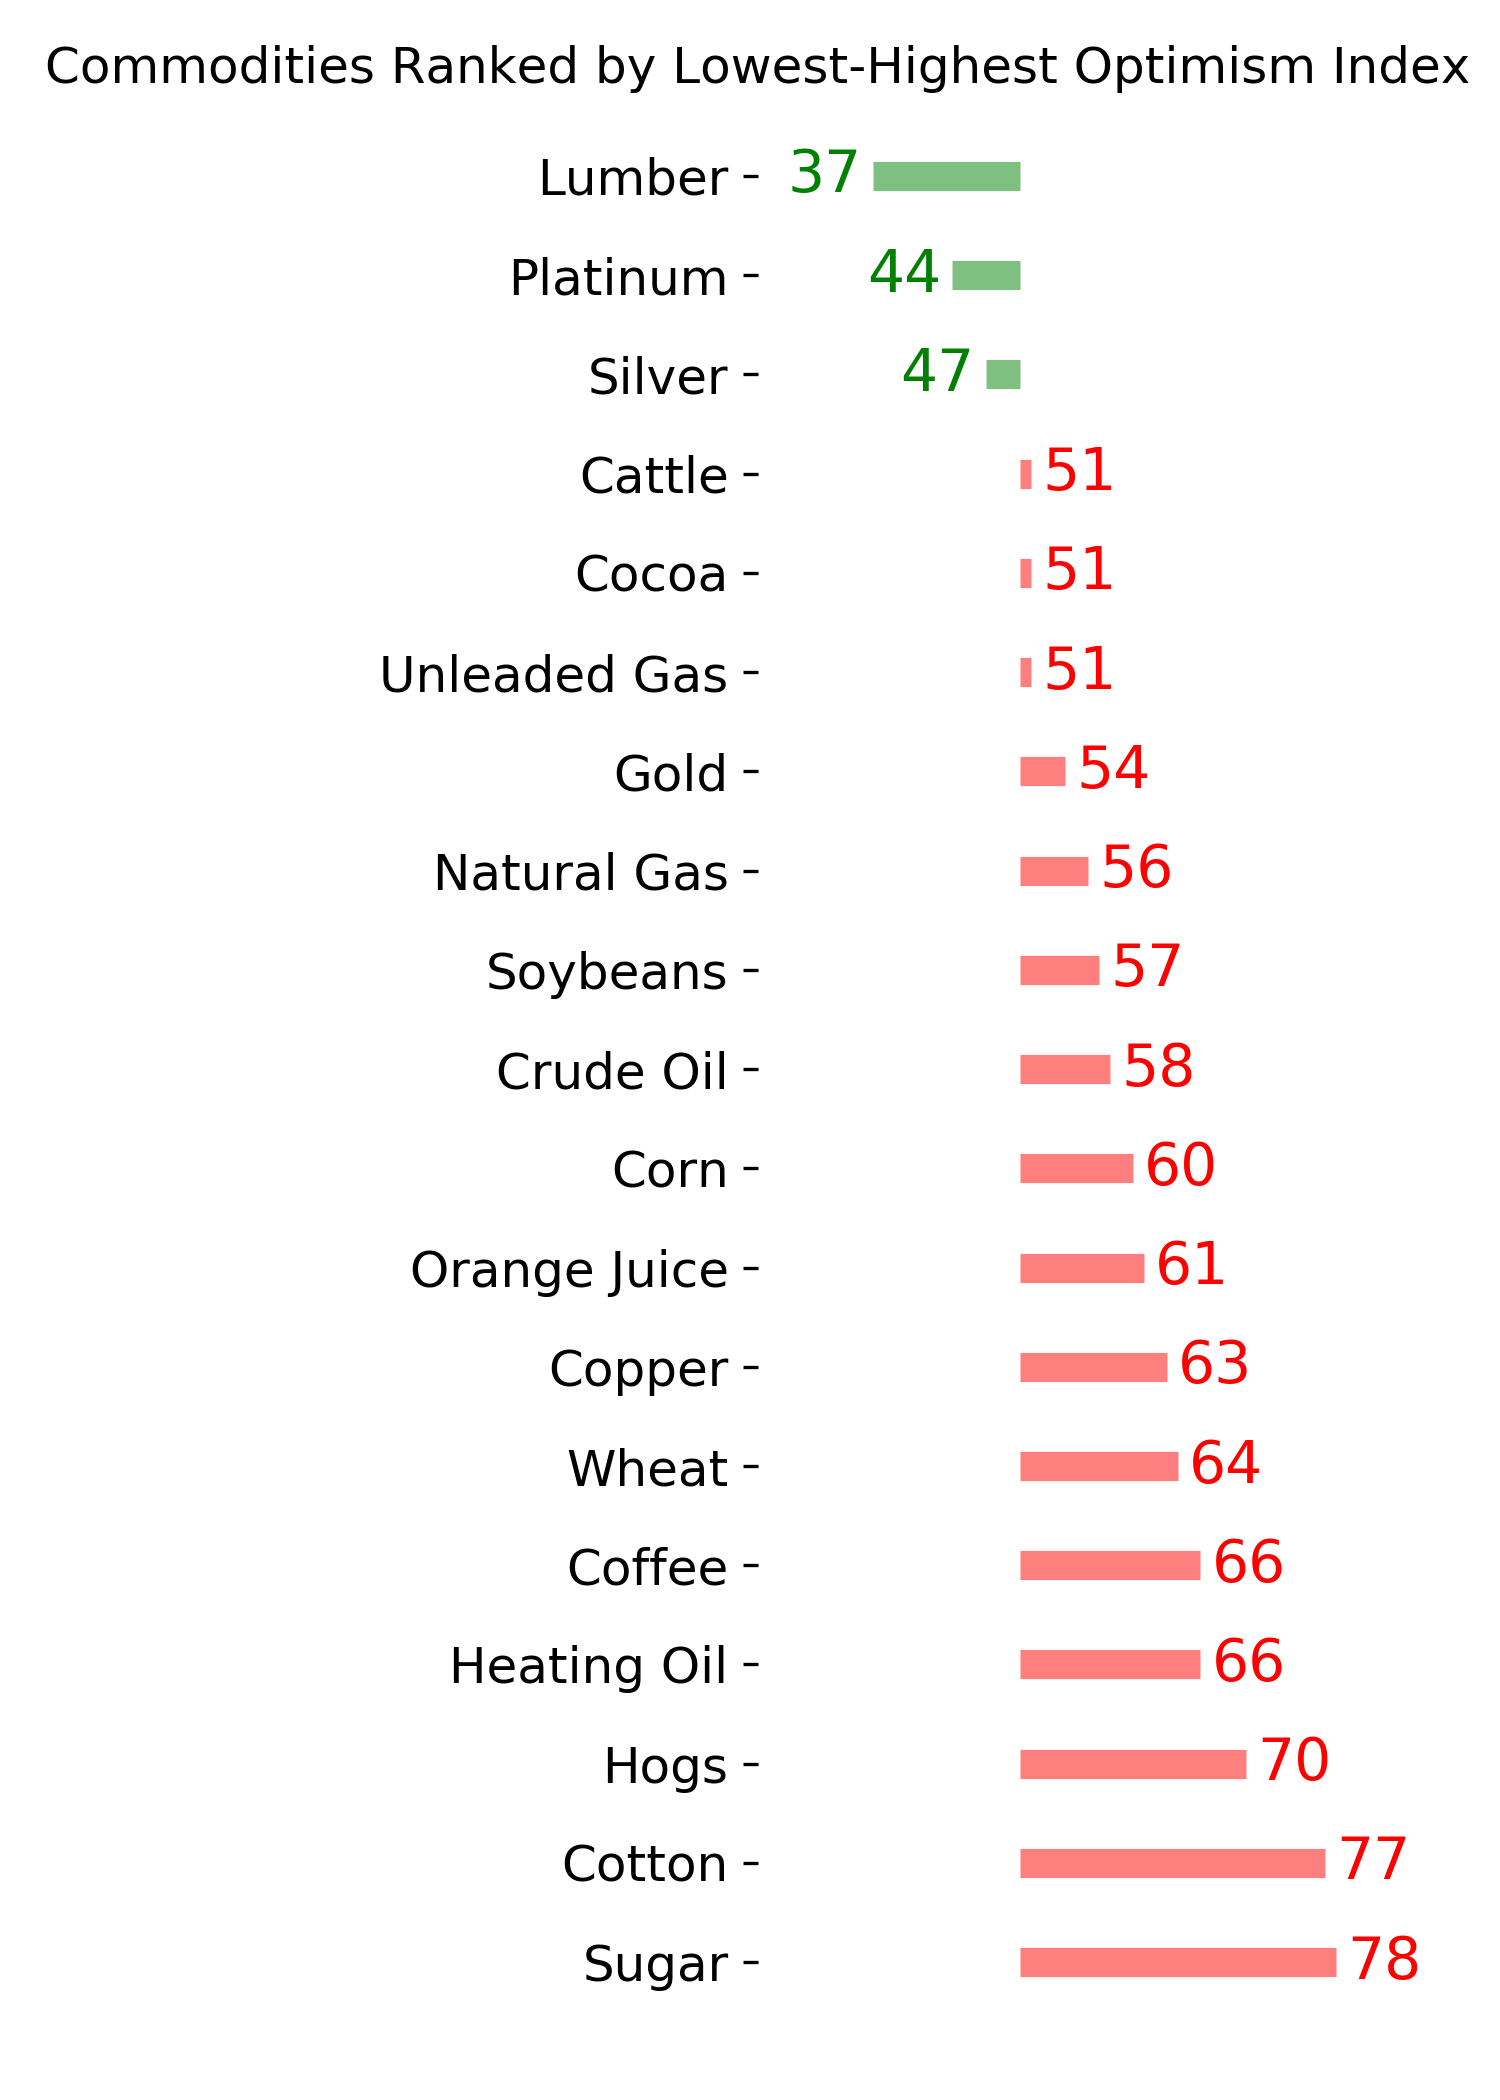
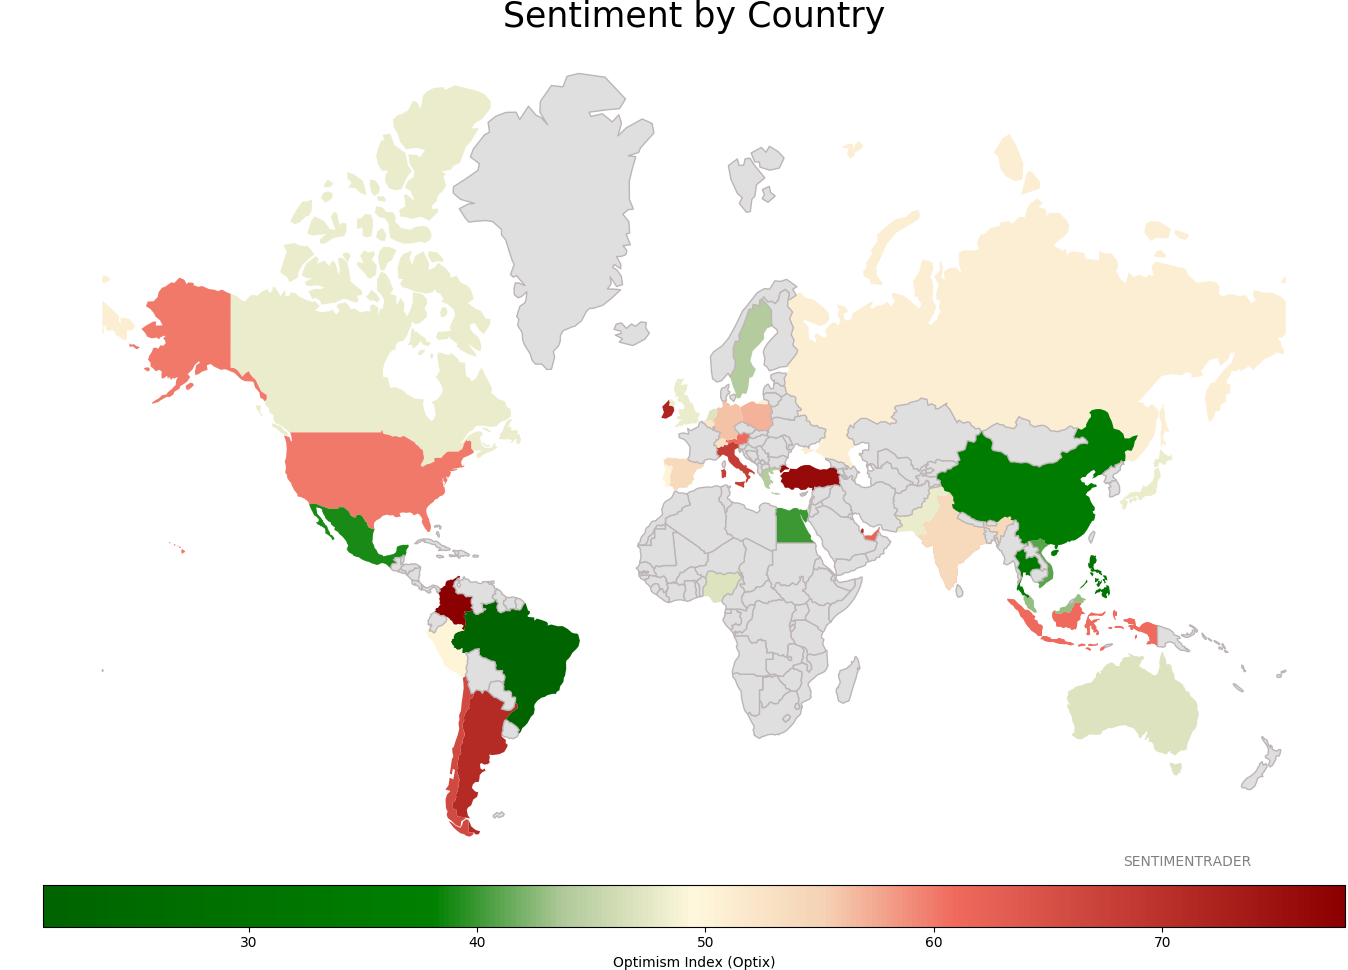
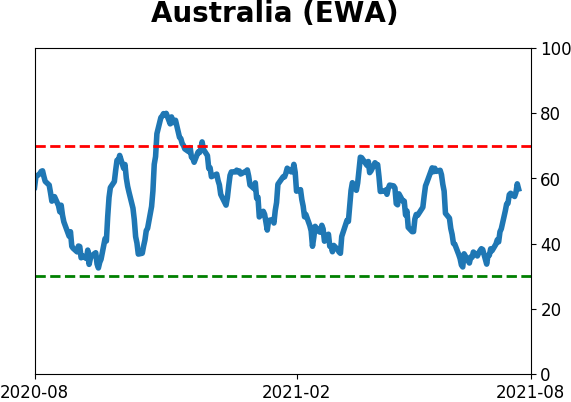
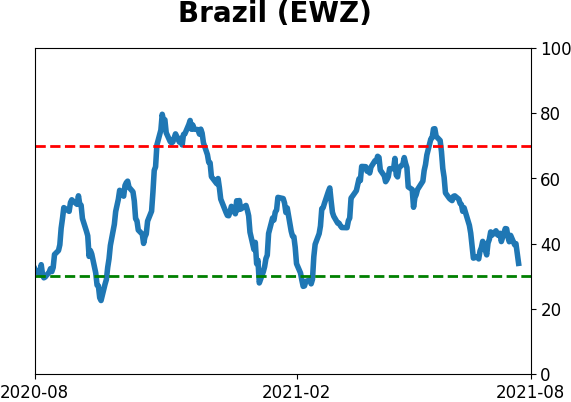
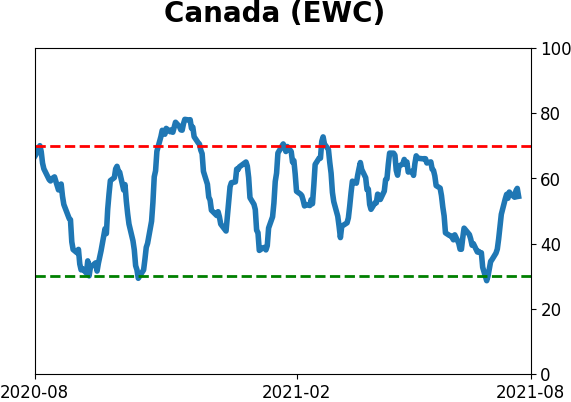
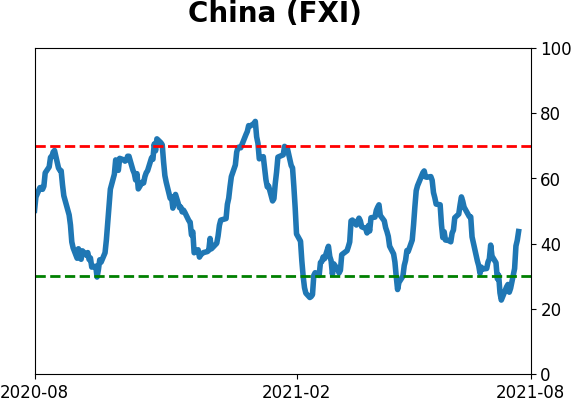
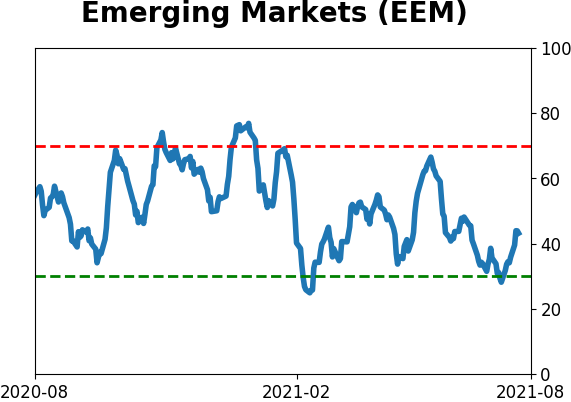
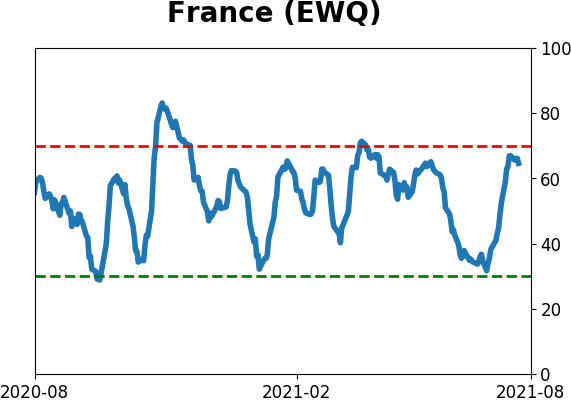
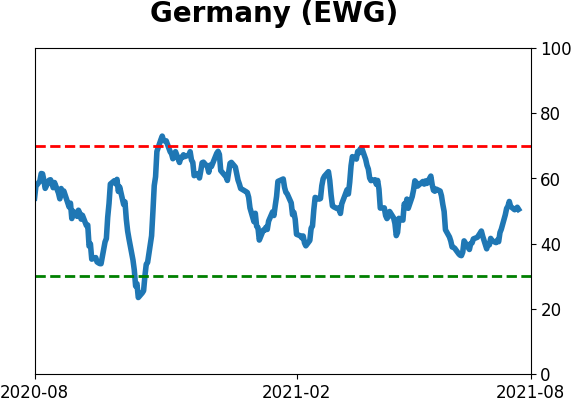
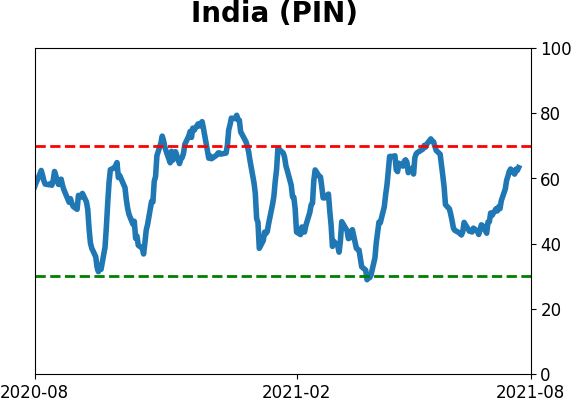
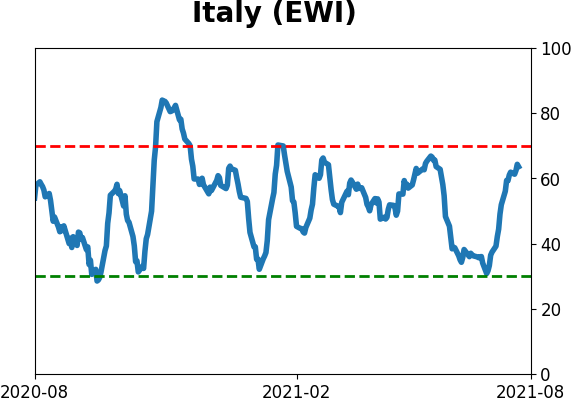
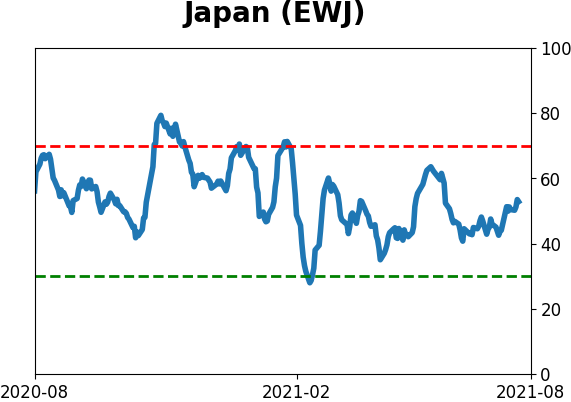
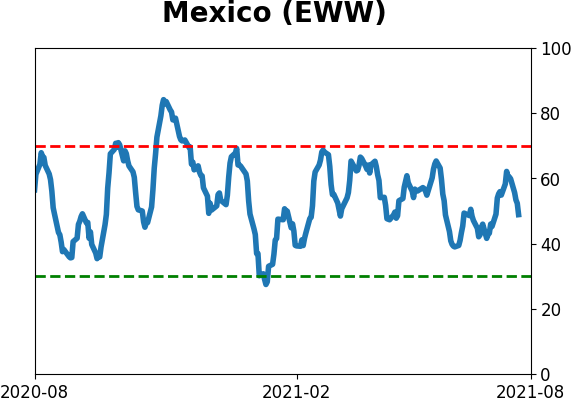
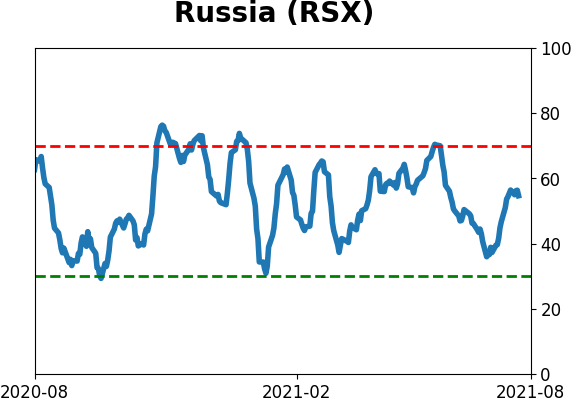
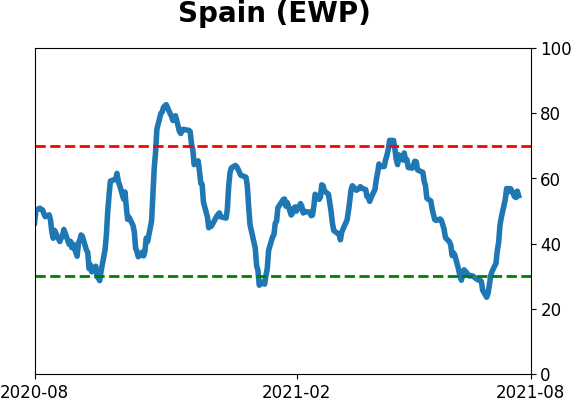
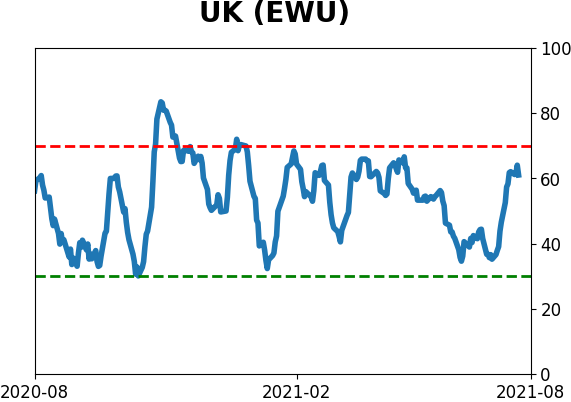
Sentiment Around The World
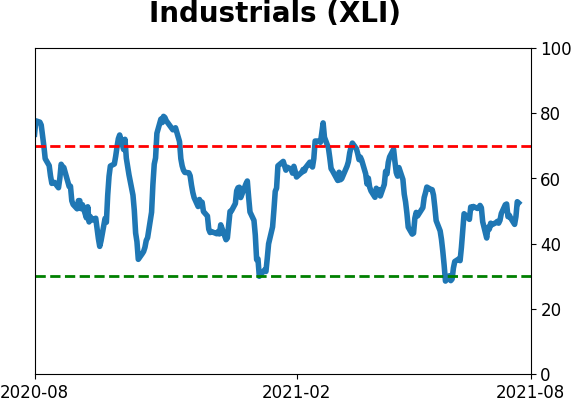
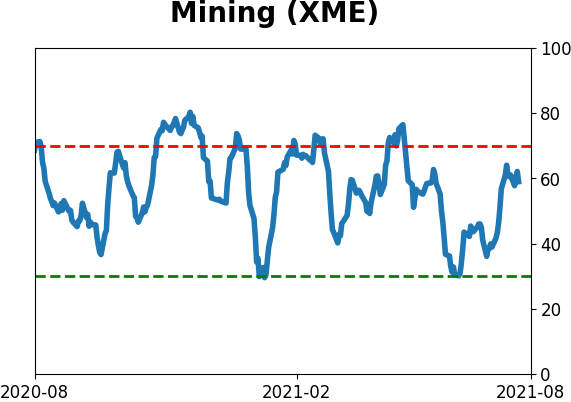
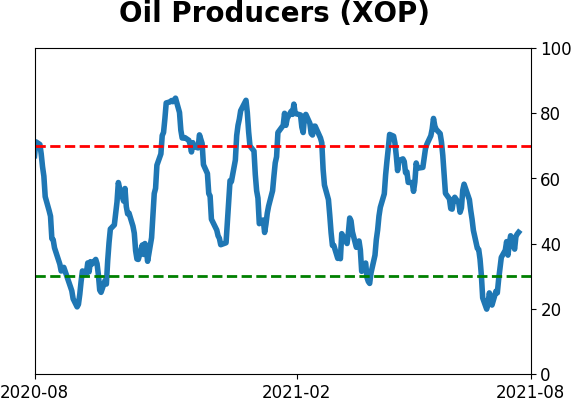
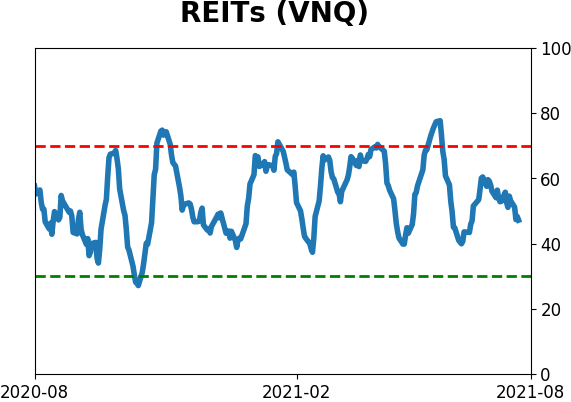
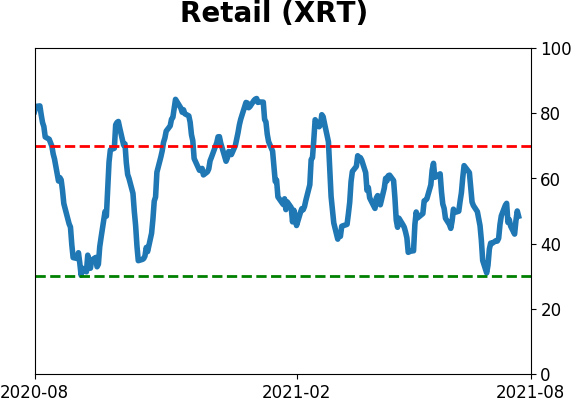
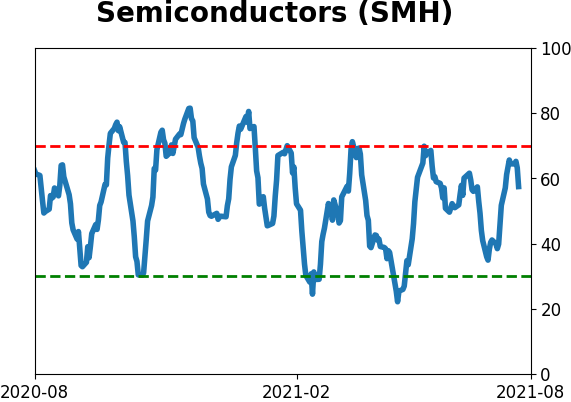
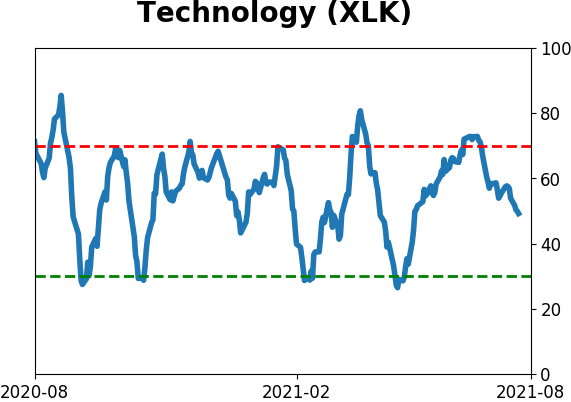
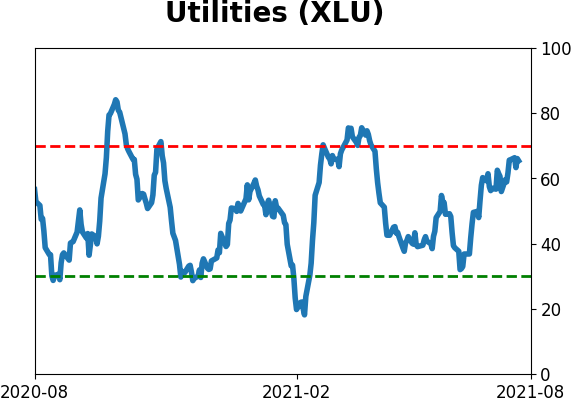
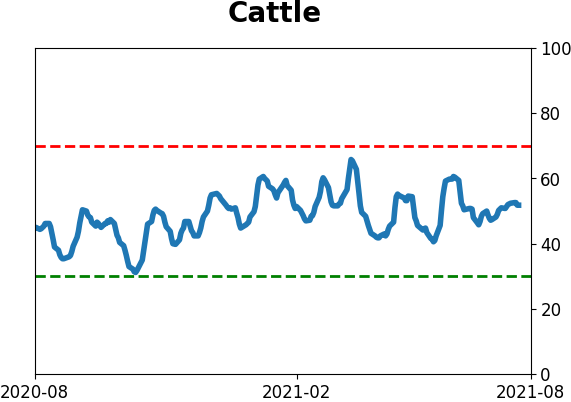
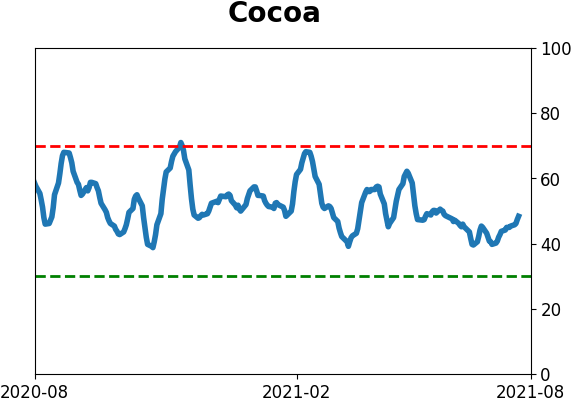
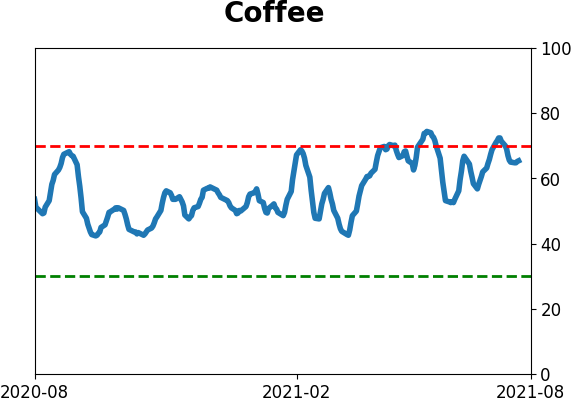
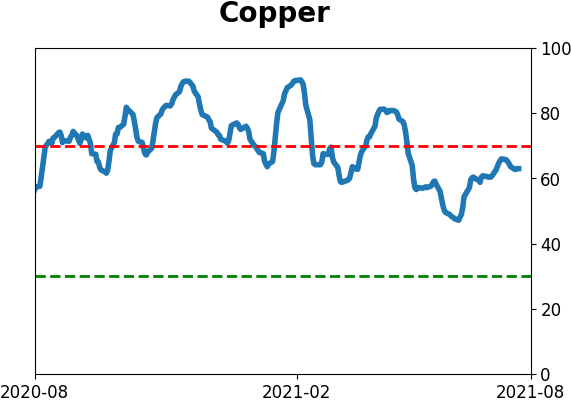
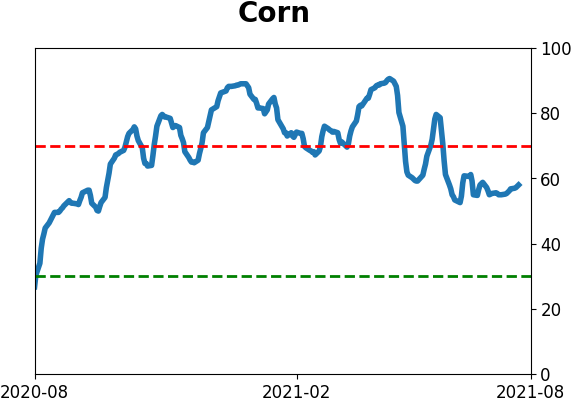
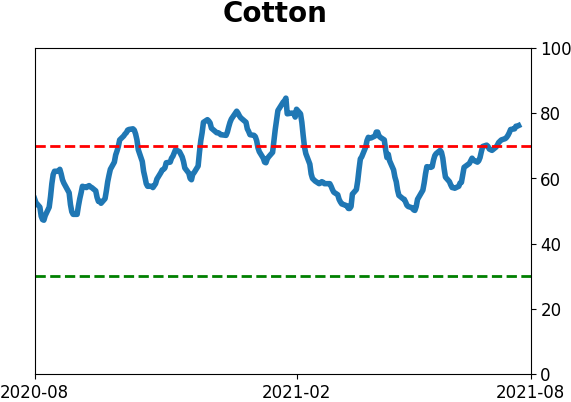
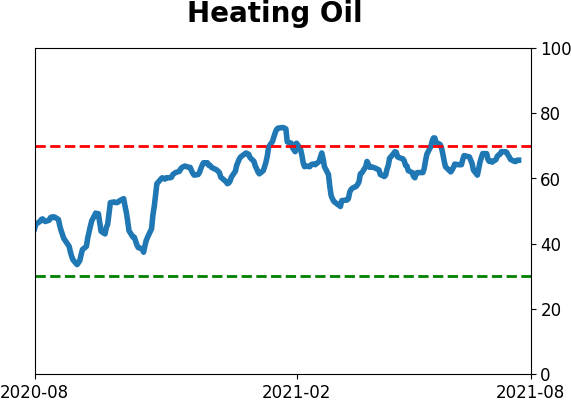
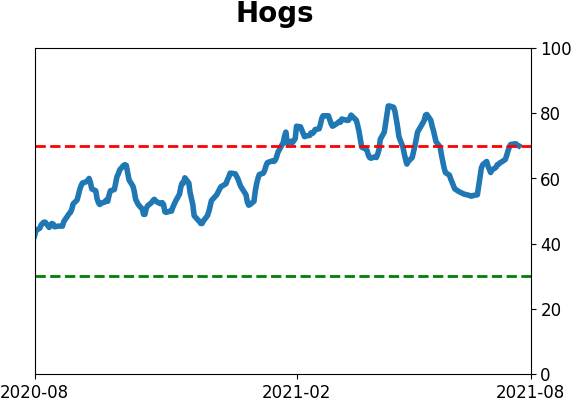
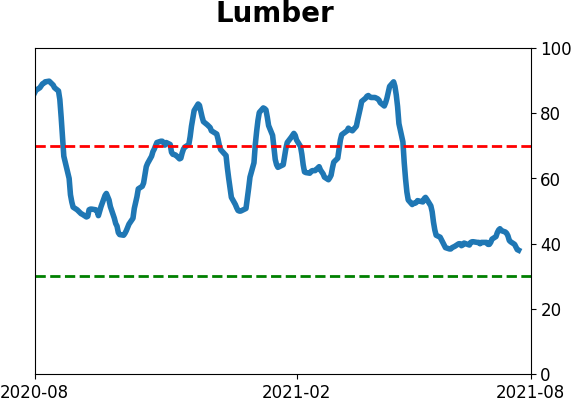
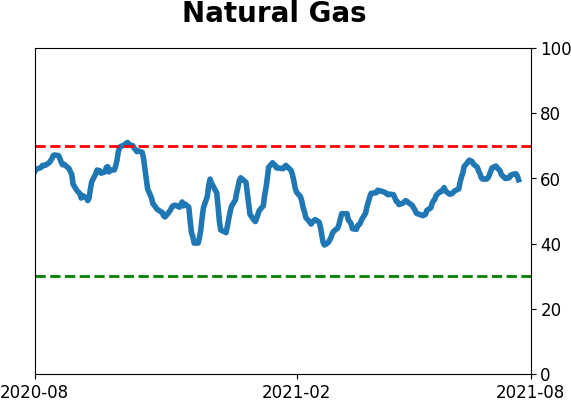
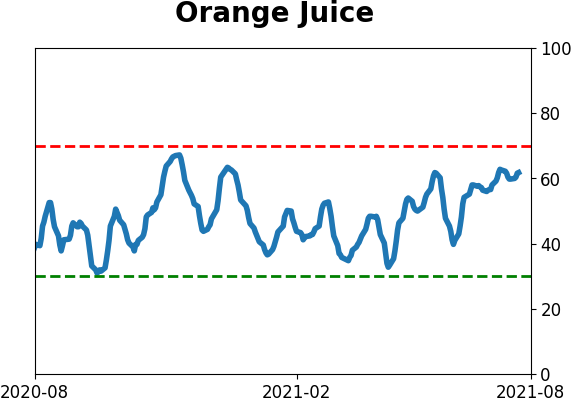
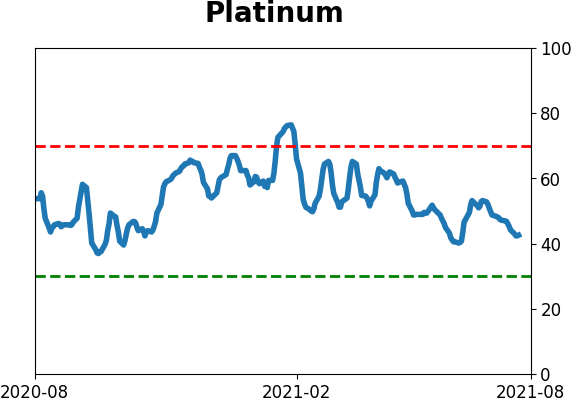
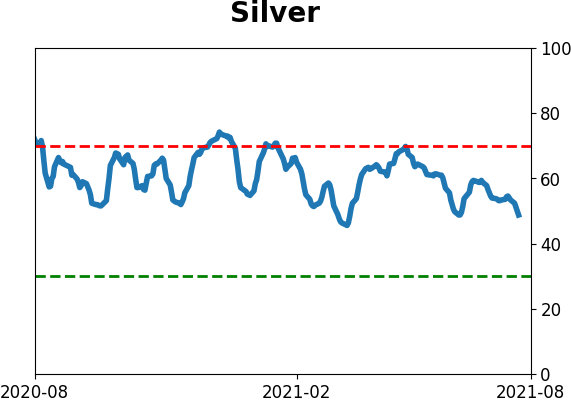
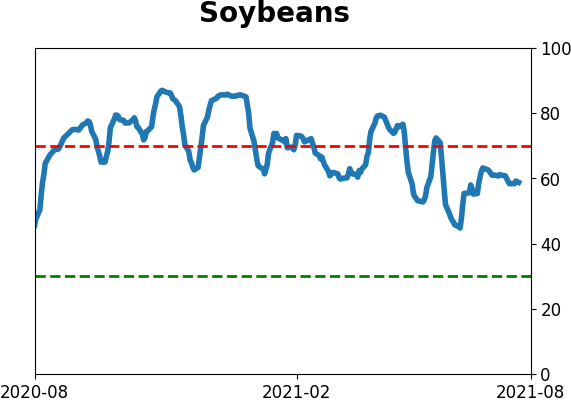
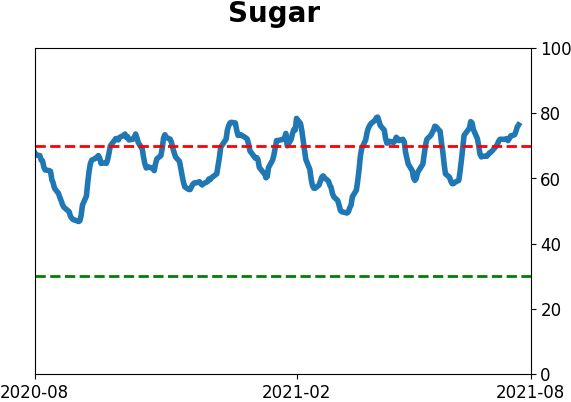
Optimism Index Thumbnails
|
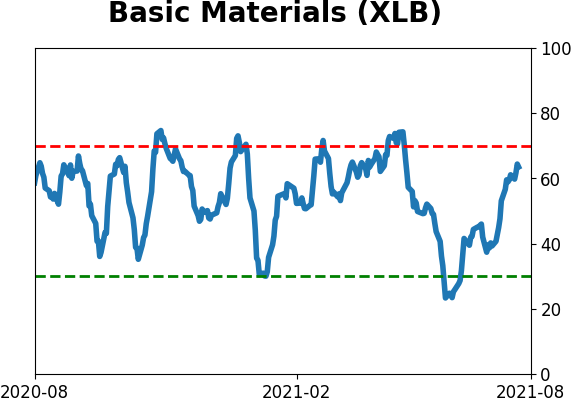
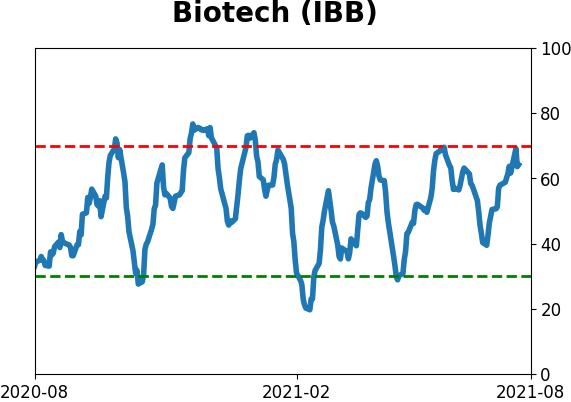
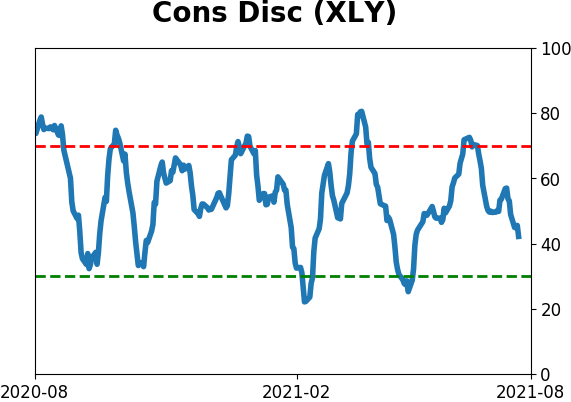
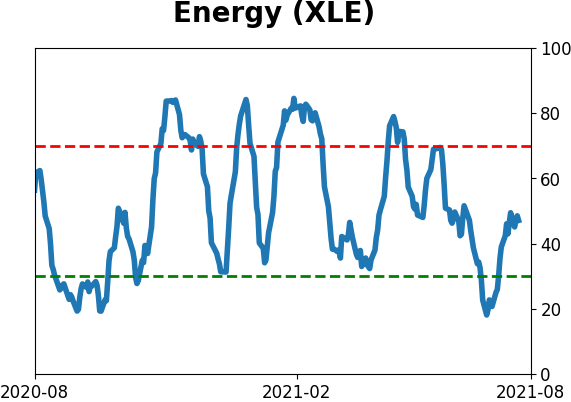
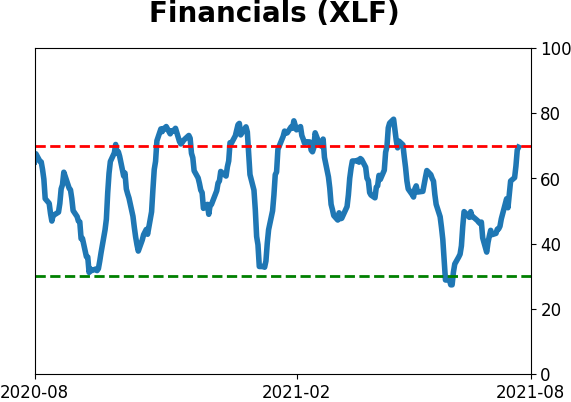
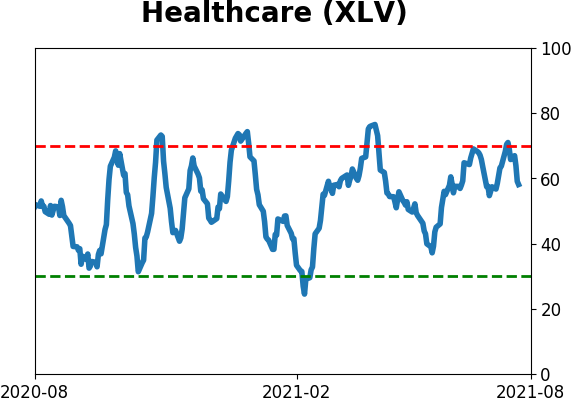
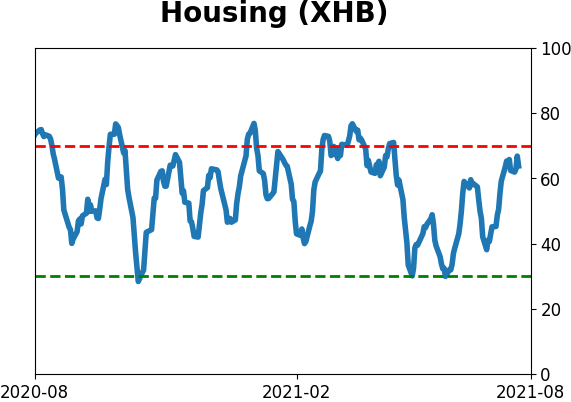
Sector ETF's - 10-Day Moving Average
|
|
|
Country ETF's - 10-Day Moving Average
|
|
|
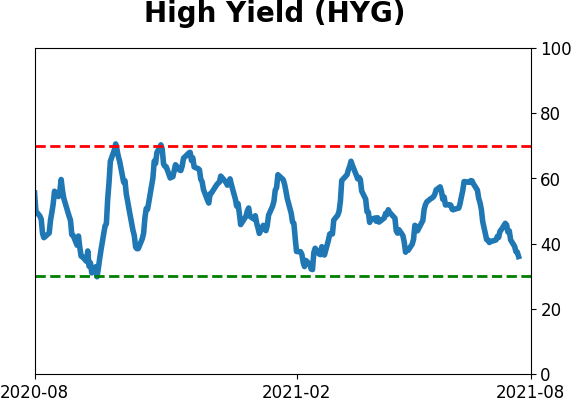
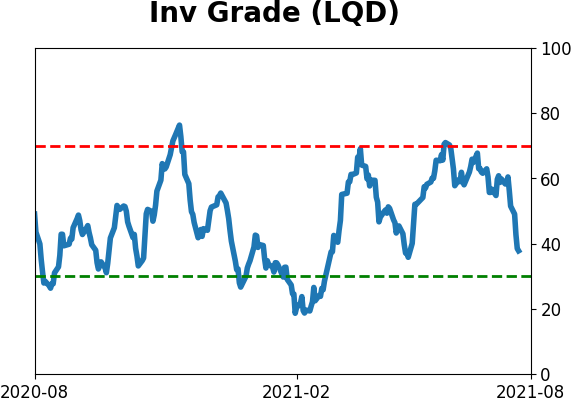
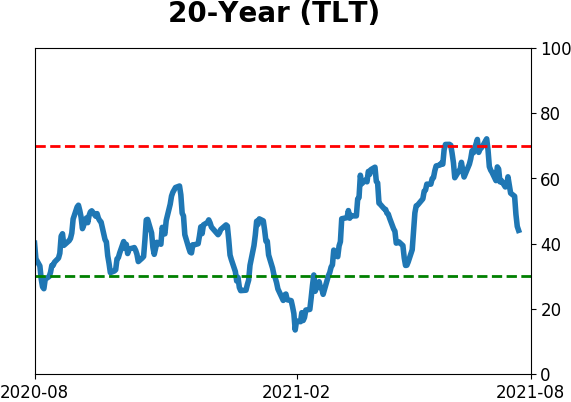
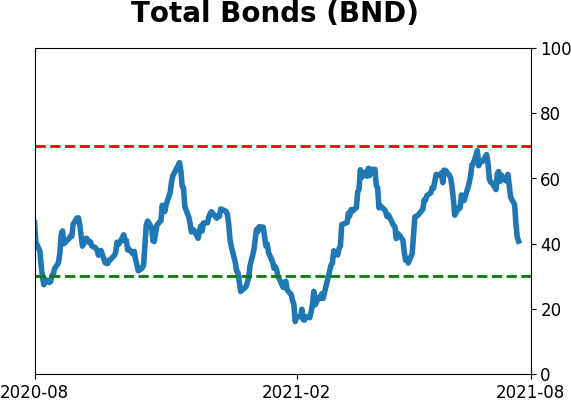
Bond ETF's - 10-Day Moving Average
|
|
|
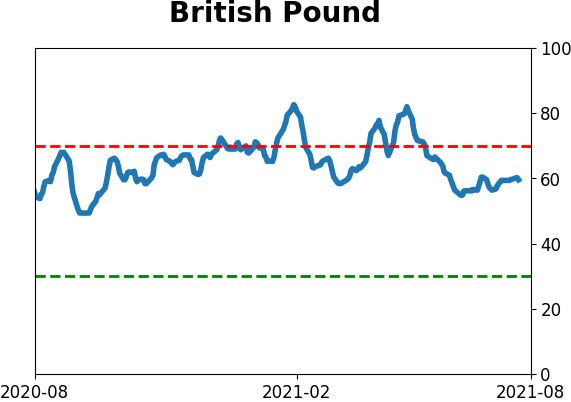
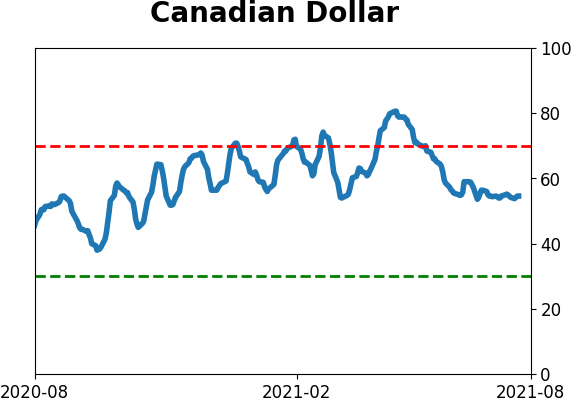
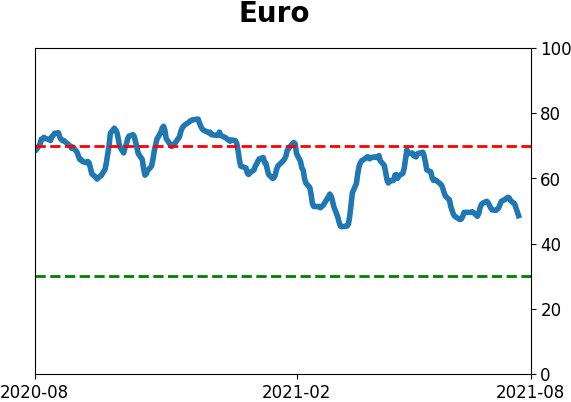
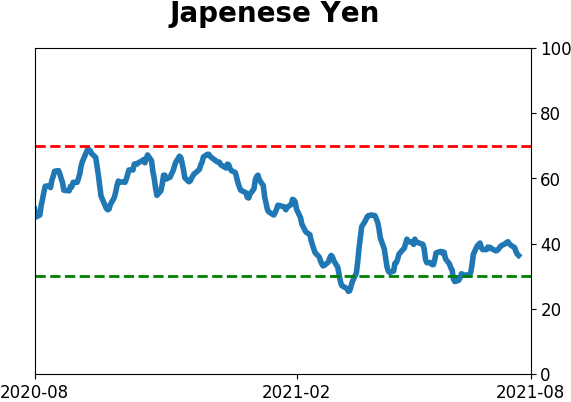
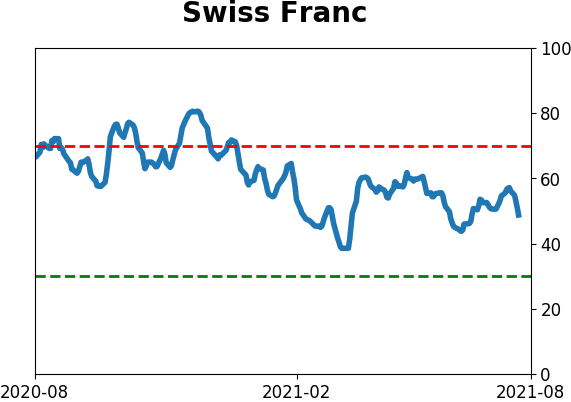
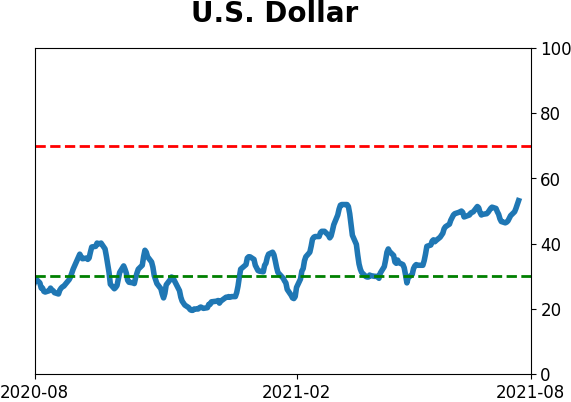
Currency ETF's - 5-Day Moving Average
|
|
|
Commodity ETF's - 5-Day Moving Average
|
|