Headlines
|
|
A Global Rising Tide of Trends Like Few Others:
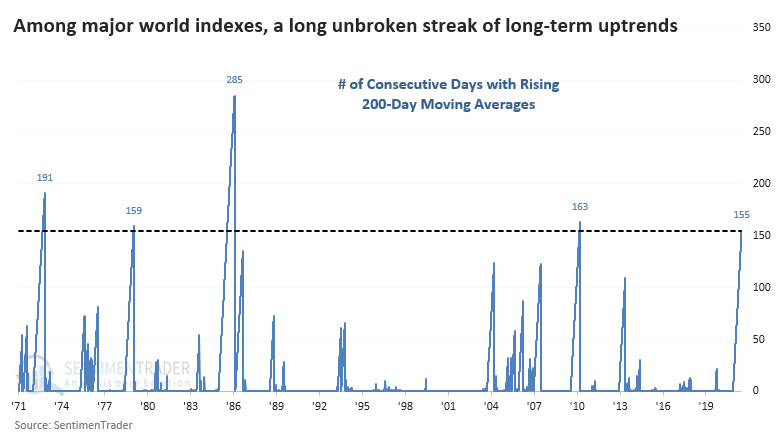
Every major world index has a rising 200-day moving average, and that's been the case for over 7 months now. This is nearing the longest streak in 35 years, and is among the best stretches in 50 years.
Bottom Line:
See the Outlook & Allocations page for more details on these summaries STOCKS: Hold
The speculative frenzy in February is wrung out. Internal dynamics have mostly held up, with some exceptions. Many of our studies still show a mixed to poor short-term view, with medium- and long-term ones turning more positive. BONDS: Hold
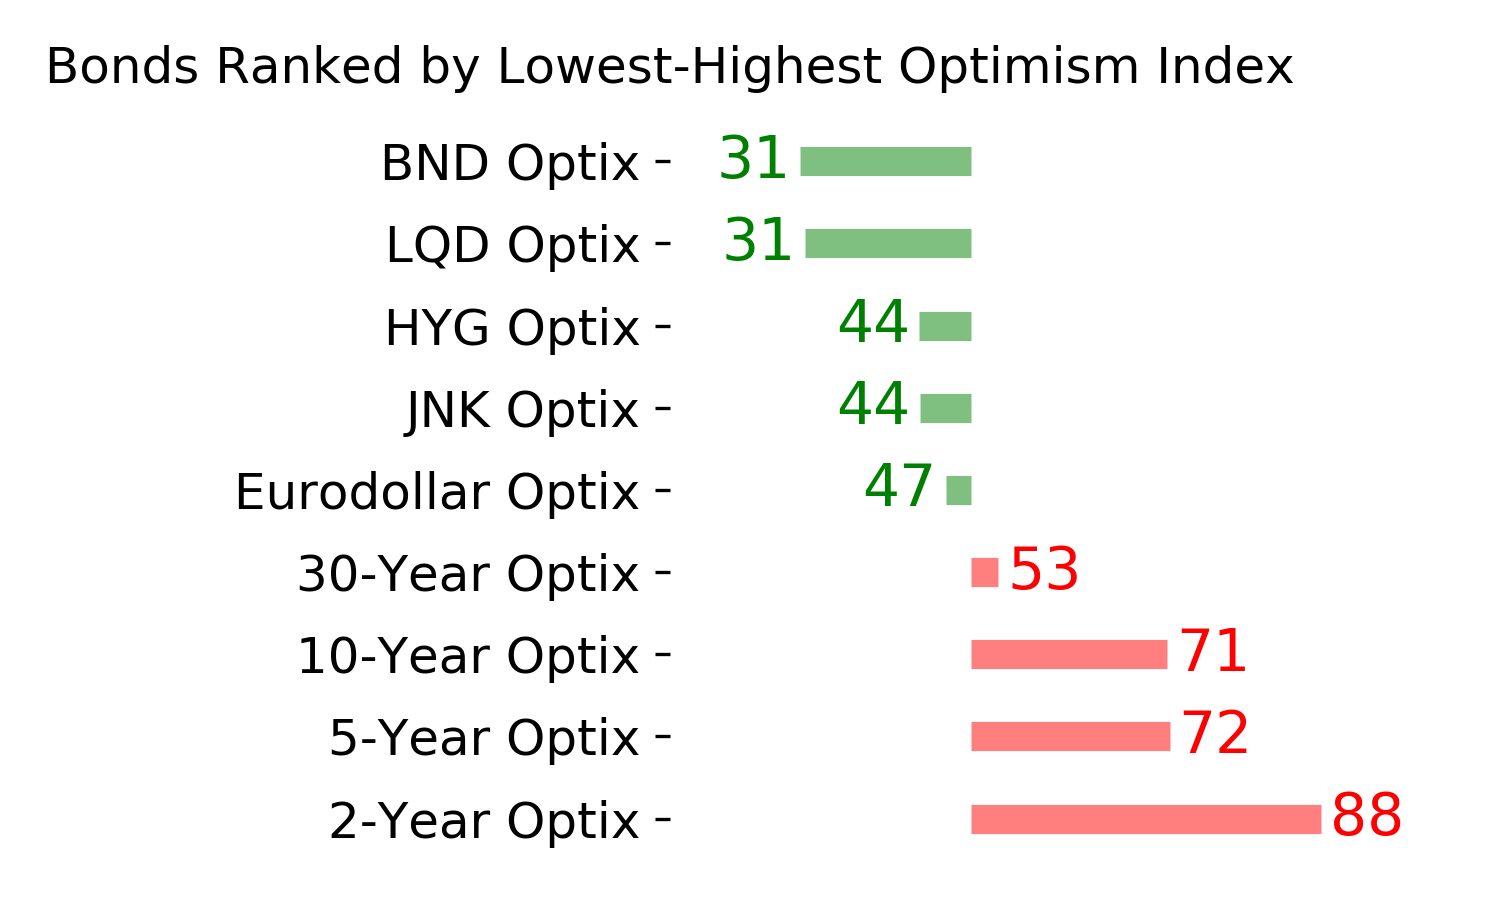
Various parts of the market got hit in March, with the lowest Bond Optimism Index we usually see during healthy environments. After a shaky couple of weeks, the broad bond market has modestly recovered. Not a big edge here either way. GOLD: Hold
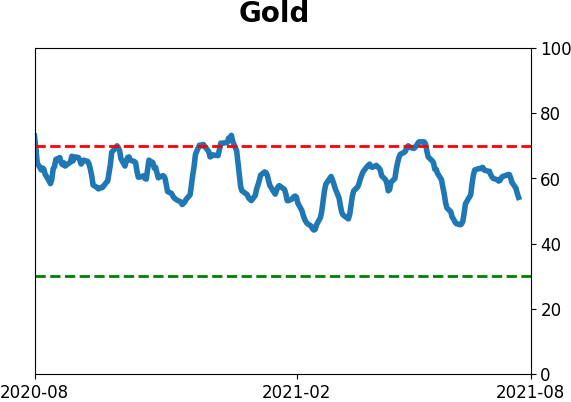
Gold and miners have done very well, recovering above long-term trend lines. The issue is that both have tended to perform poorly after similar situations - will have to wait and see how it plays out.
|
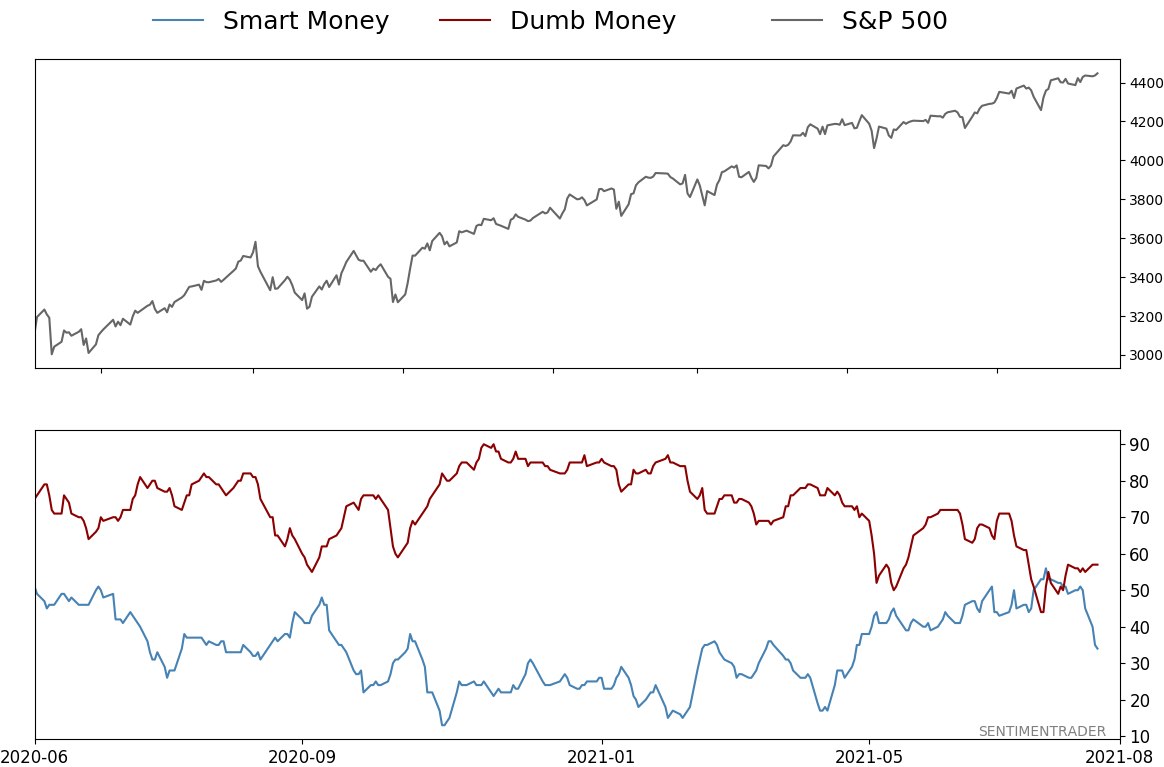
Smart / Dumb Money Confidence
|
Smart Money Confidence: 34%
Dumb Money Confidence: 57%
|
|
Risk Levels
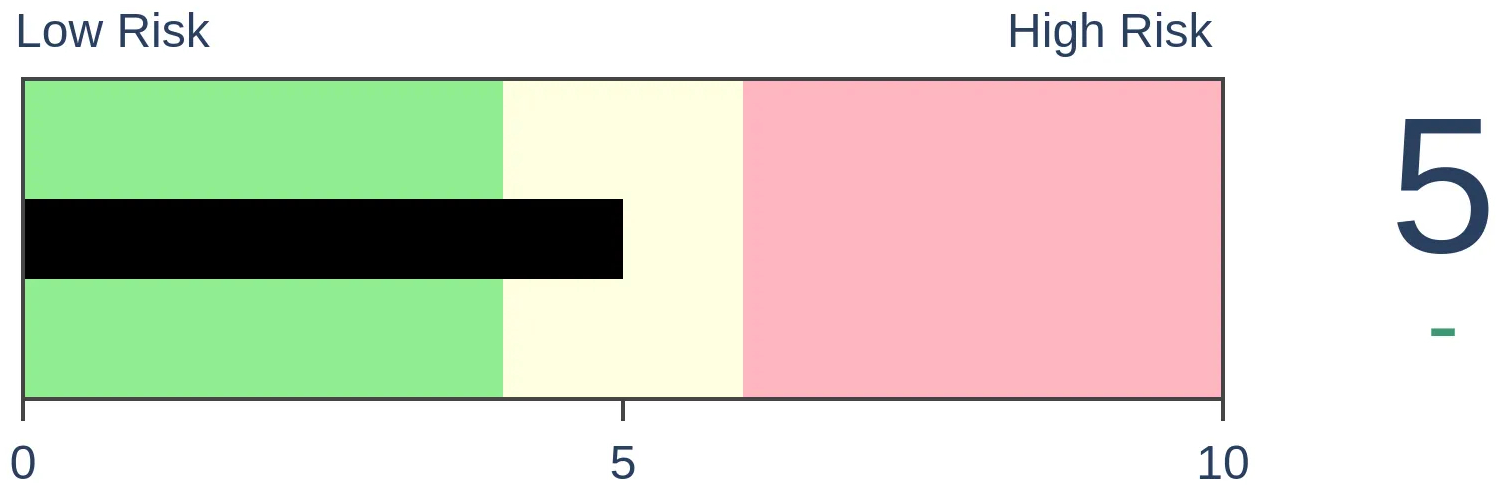
Stocks Short-Term
|
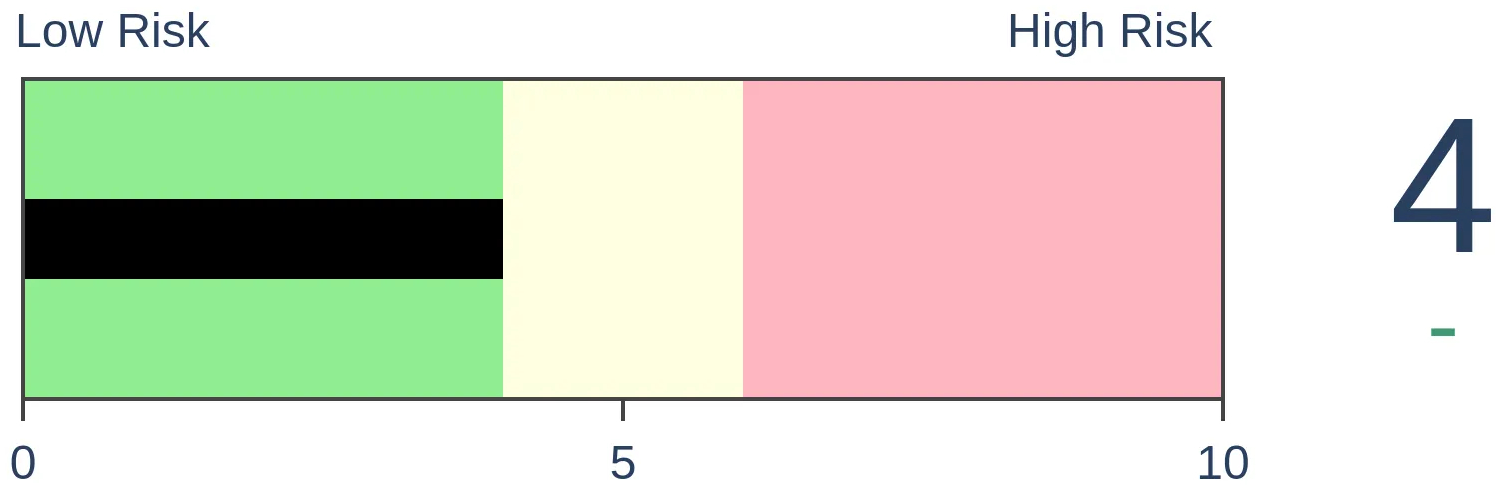
Stocks Medium-Term
|
|
Bonds

|
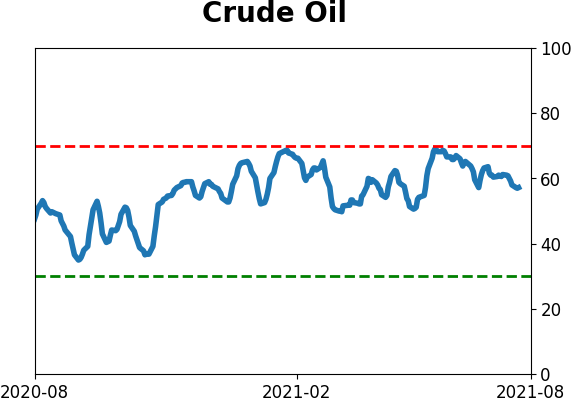
Crude Oil

|
|
Gold

|
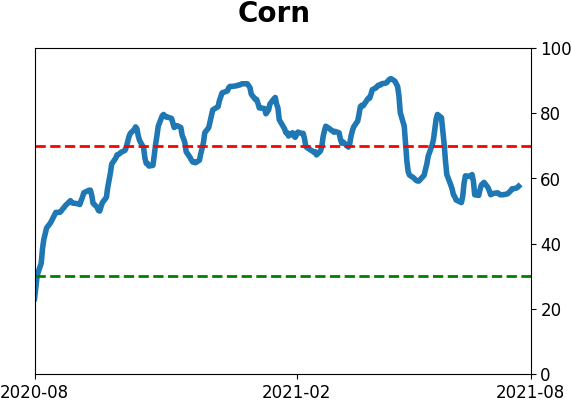
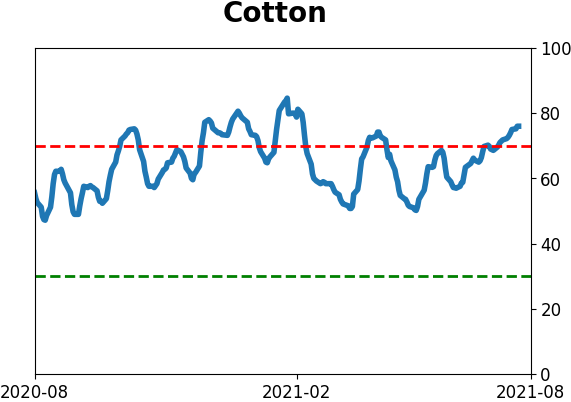
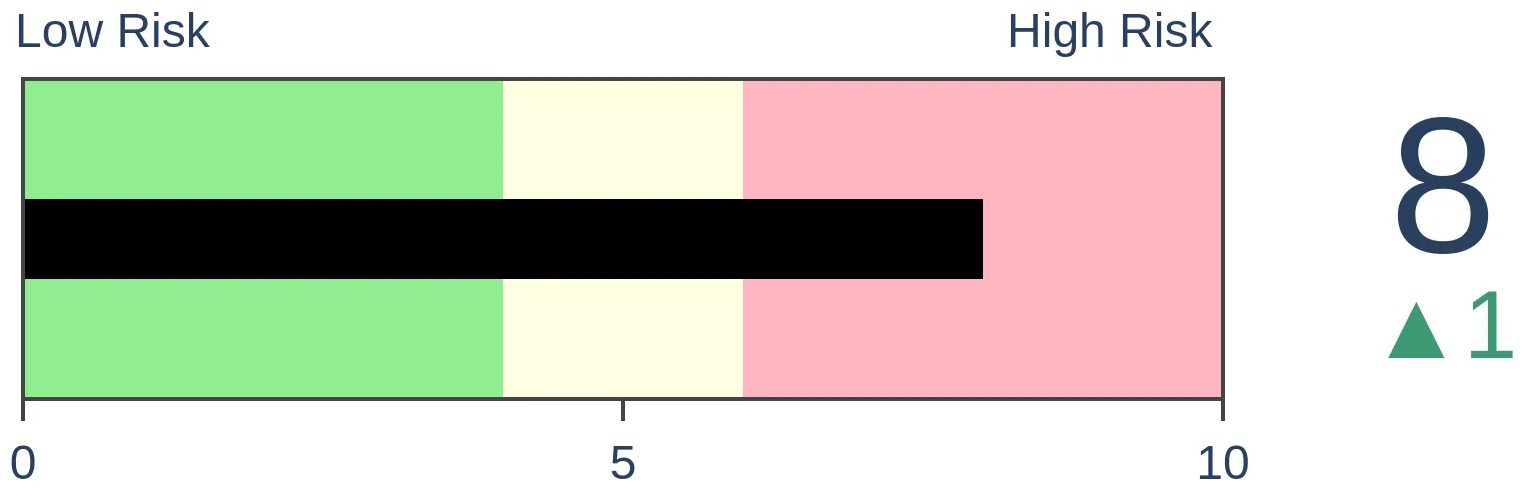
Agriculture
|
|
Research
By Jason Goepfert
BOTTOM LINE
Every major world index has a rising 200-day moving average, and that's been the case for over 7 months now. This is nearing the longest streak in 35 years, and is among the best stretches in 50 years.
FORECAST / TIMEFRAME
ACWI -- Up, Long-Term
|
It's been a heckuva year for the most benchmarked index in the world. And while some securities have been struggling (mostly of the smaller cap variety), the recovery in indexes has been a global phenomenon.
For more than 7 months now, every major world equity index that we follow has been in a solid long-term uptrend, with a rising 200-day moving average. Even the incredible momentum run in 2017 didn't see such pristine conditions, as there was usually at least one global index bucking the uptrend.
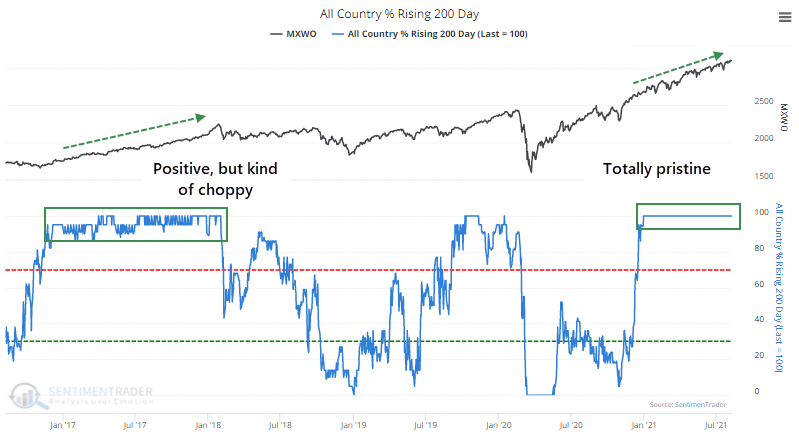
Over the past 50 years of data we have, this is now the 5th-longest streak of uninterrupted global uptrends and is creeping up on the longest in 35 years.
ONCE AGAIN, FEW PRECEDENTS
As we've seen with most momentum studies in recent months, there are few precedents.
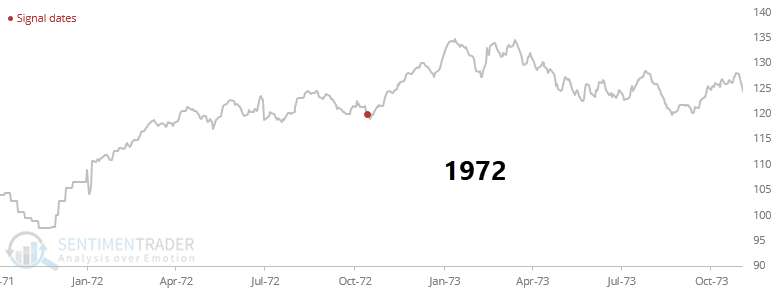
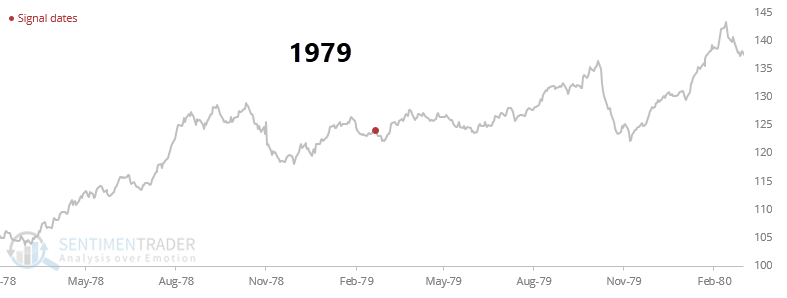
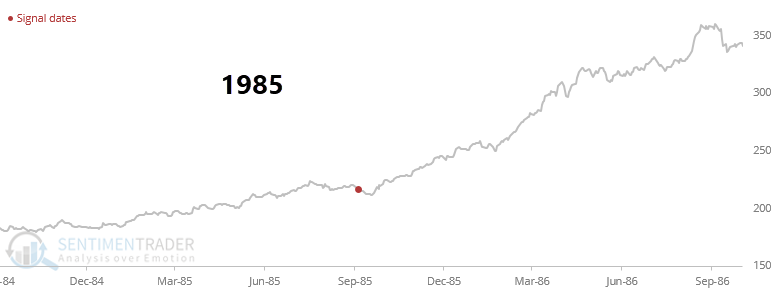
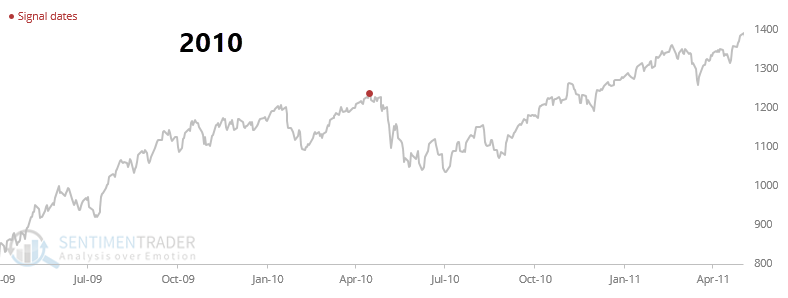
The general pattern after the few times this occurred is shorter-term weakness but medium- to long-term strength. The MSCI World Index saw one double-digit pause following the 2009-10 recovery. The other three all saw consistent and impressive gains.
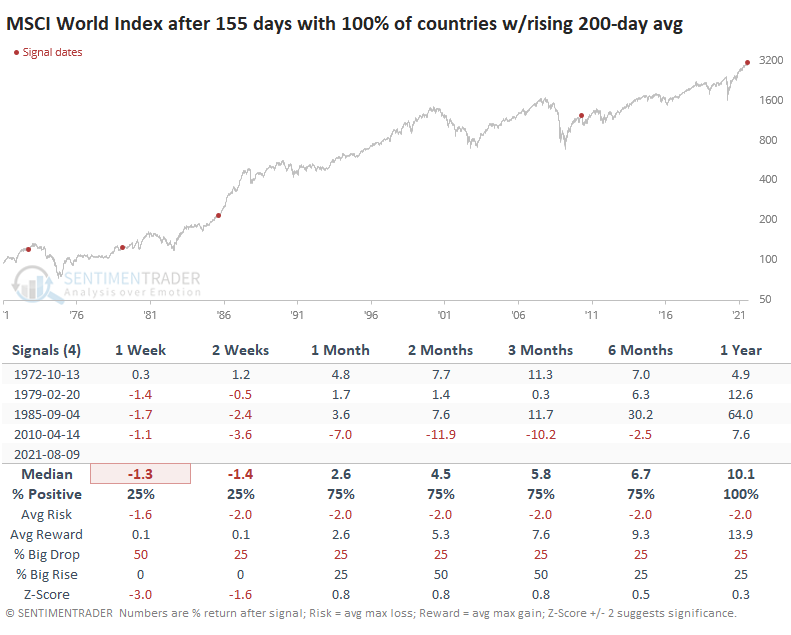
The charts below show the path of the MSCI World Index after each signal in more detail.
MORE SIGNALS, GOOD LONG-TERM RETURNS
It's hard to rely on such a small sample size, which is an increasing issue in 2021 as the year blows past many historical precedents. Even so, if we look at lesser extremes, the long-term positive ramifications remain.
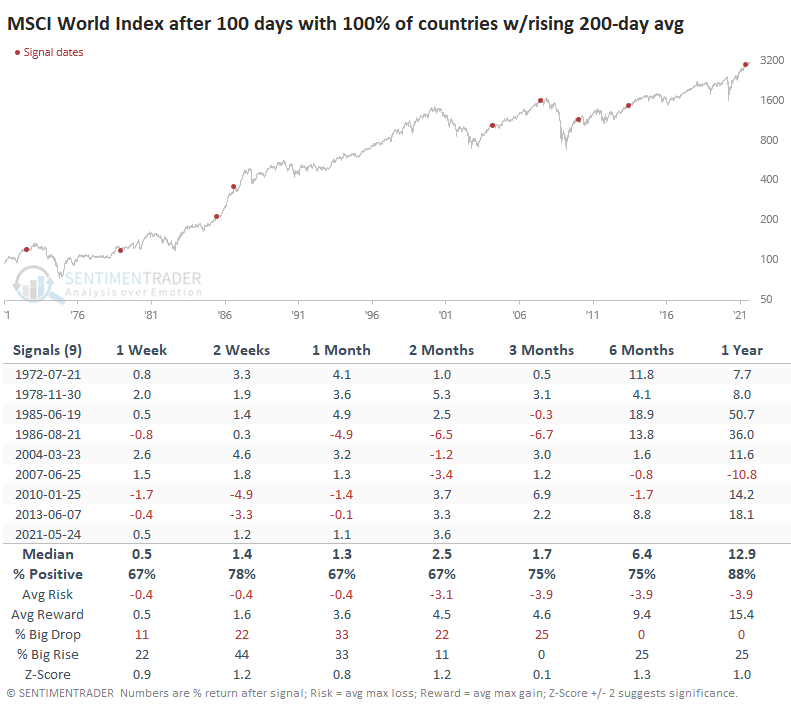
Even when there was a streak of "only" 100 days with every major global index in a sustained positive long-term trend, there were few medium- to long-term losses in the future, and only one big pullback (well, that was a crash, in 2008).
This has been a year like few others, and that has typically meant good things when viewed over a 6-12 month window.
Active Studies
| Time Frame | Bullish | Bearish | | Short-Term | 0 | 4 | | Medium-Term | 4 | 3 | | Long-Term | 10 | 5 |
|
Indicators at Extremes
Portfolio
| Position | Description | Weight % | Added / Reduced | Date | | Stocks | RSP | 4.1 | Added 4.1% | 2021-05-19 | | Bonds | 23.9% BND, 6.9% SCHP | 30.7 | Reduced 7.1% | 2021-05-19 | | Commodities | GCC | 2.6 | Reduced 2.1%
| 2020-09-04 | | Precious Metals | GDX | 5.6 | Reduced 4.2% | 2021-05-19 | | Special Situations | 4.3% XLE, 2.2% PSCE | 7.6 | Reduced 5.6% | 2021-04-22 | | Cash | | 49.4 | | |
|
Updates (Changes made today are underlined)
Much of our momentum and trend work has remained positive for several months, with some scattered exceptions. Almost all sentiment-related work has shown a poor risk/reward ratio for stocks, especially as speculation drove to record highs in exuberance in February. Much of that has worn off, and most of our models are back toward neutral levels. There isn't much to be excited about here. The same goes for bonds and even gold. Gold has been performing well lately and is back above long-term trend lines. The issue is that it has a poor record of holding onto gains when attempting a long-term trend change like this, so we'll take a wait-and-see approach. RETURN YTD: 8.4% 2020: 8.1%, 2019: 12.6%, 2018: 0.6%, 2017: 3.8%, 2016: 17.1%, 2015: 9.2%, 2014: 14.5%, 2013: 2.2%, 2012: 10.8%, 2011: 16.5%, 2010: 15.3%, 2009: 23.9%, 2008: 16.2%, 2007: 7.8%
|
|
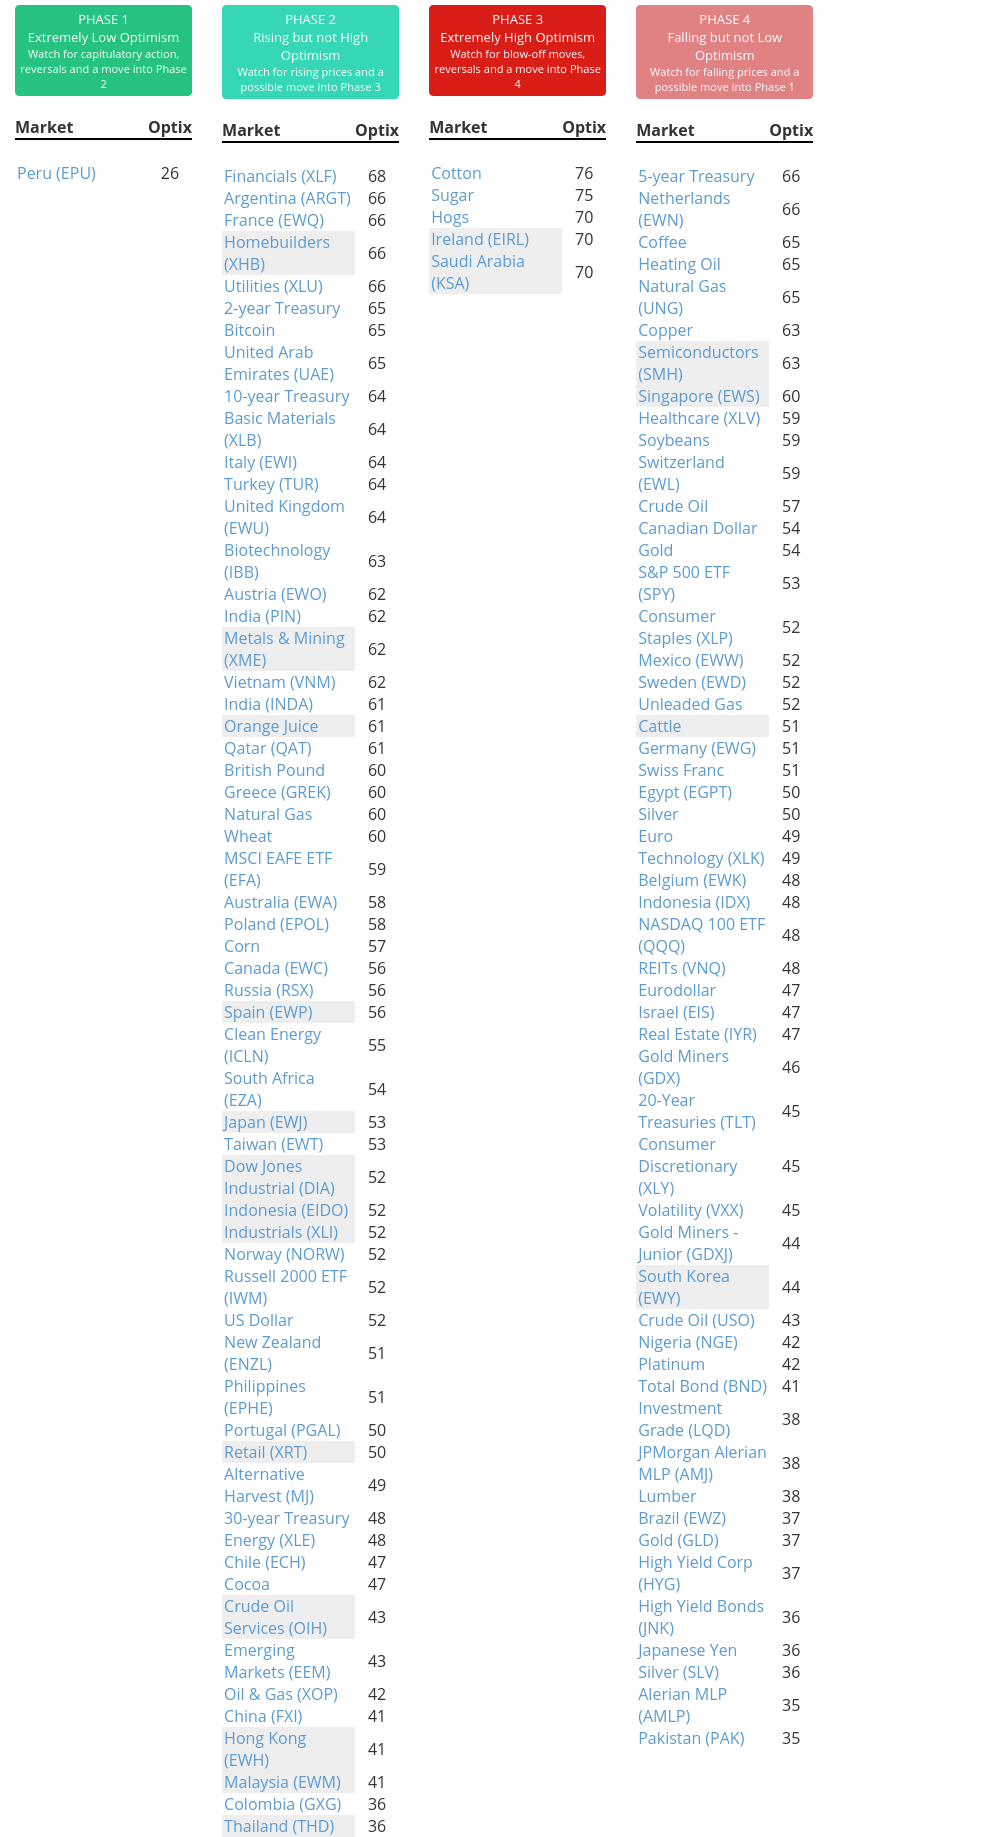
Phase Table
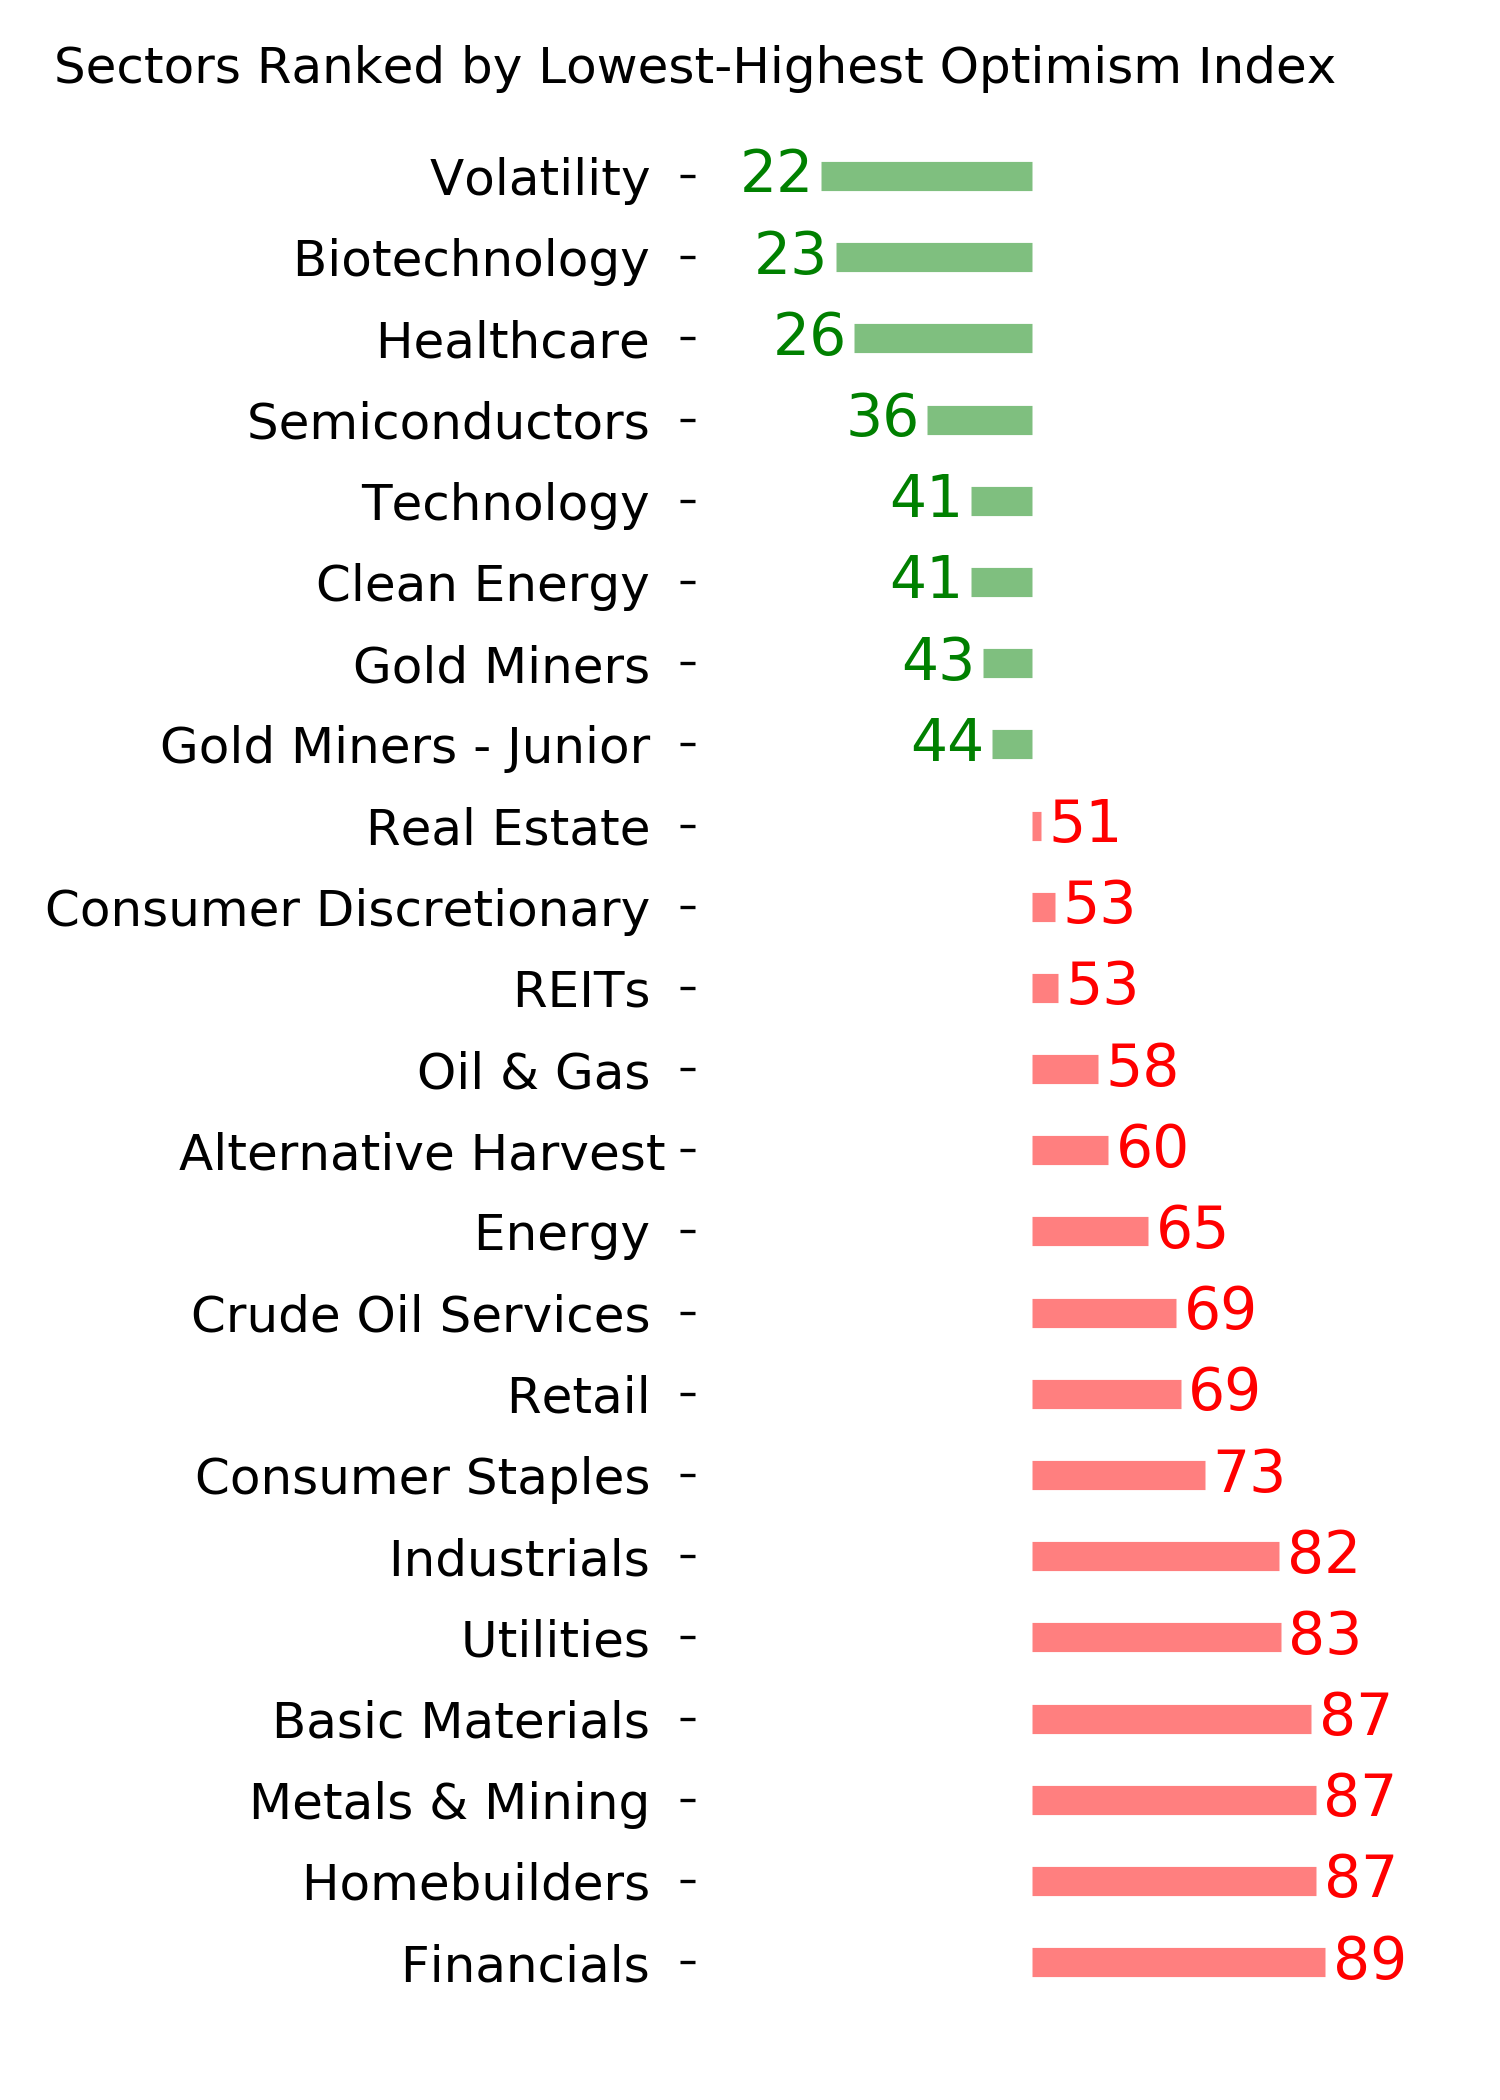
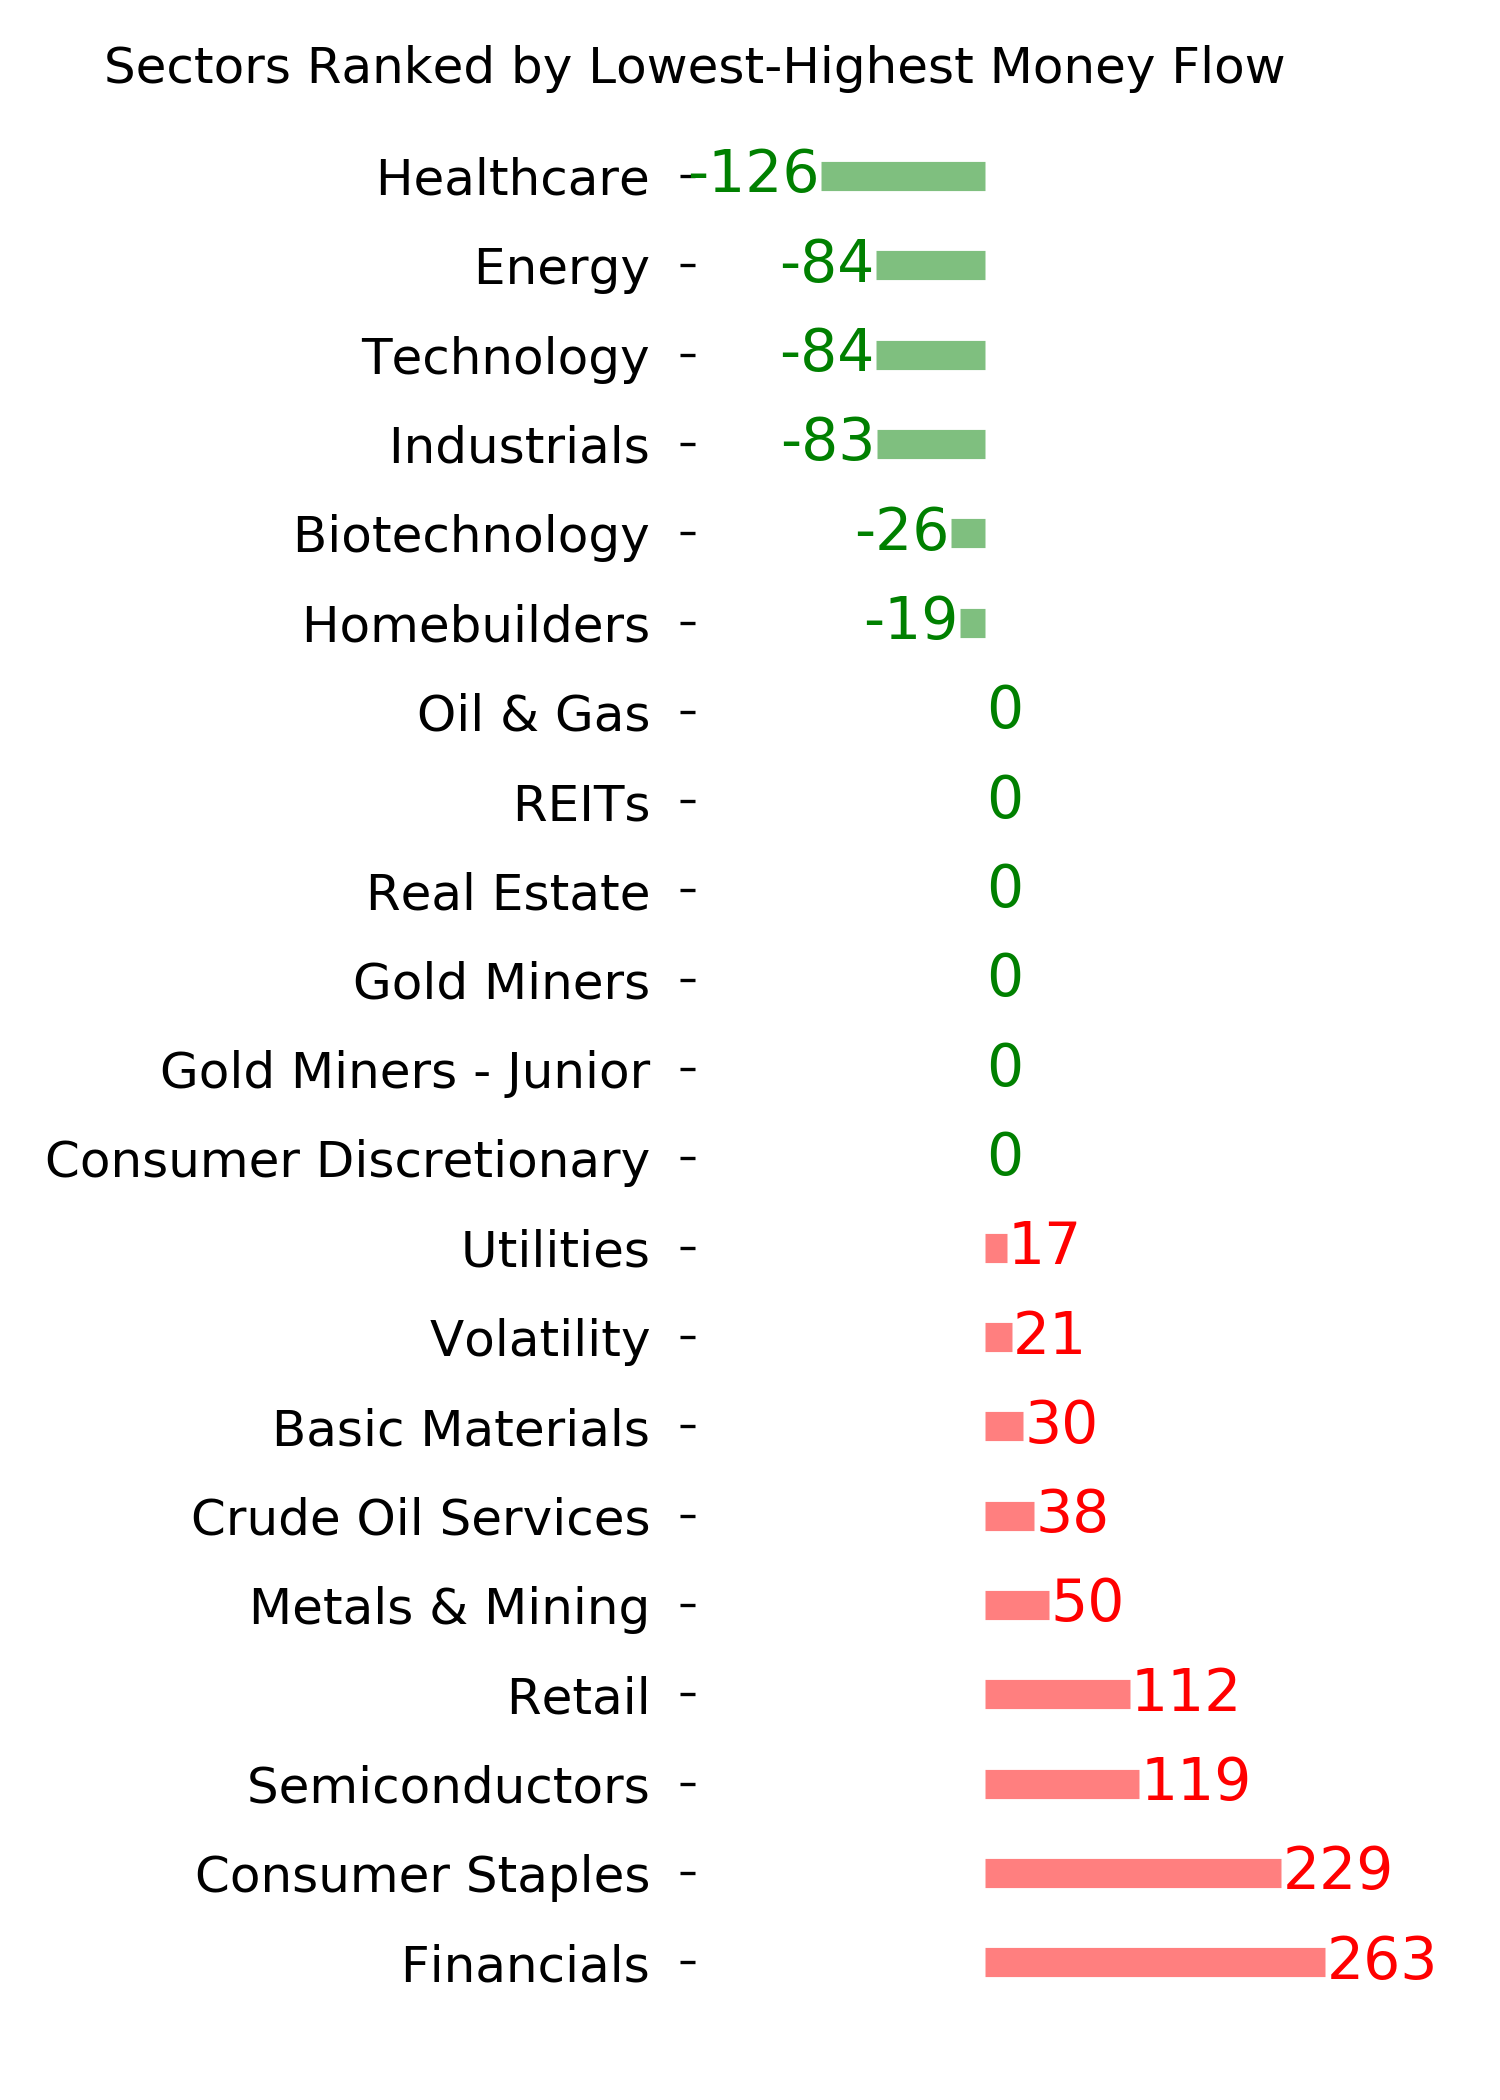
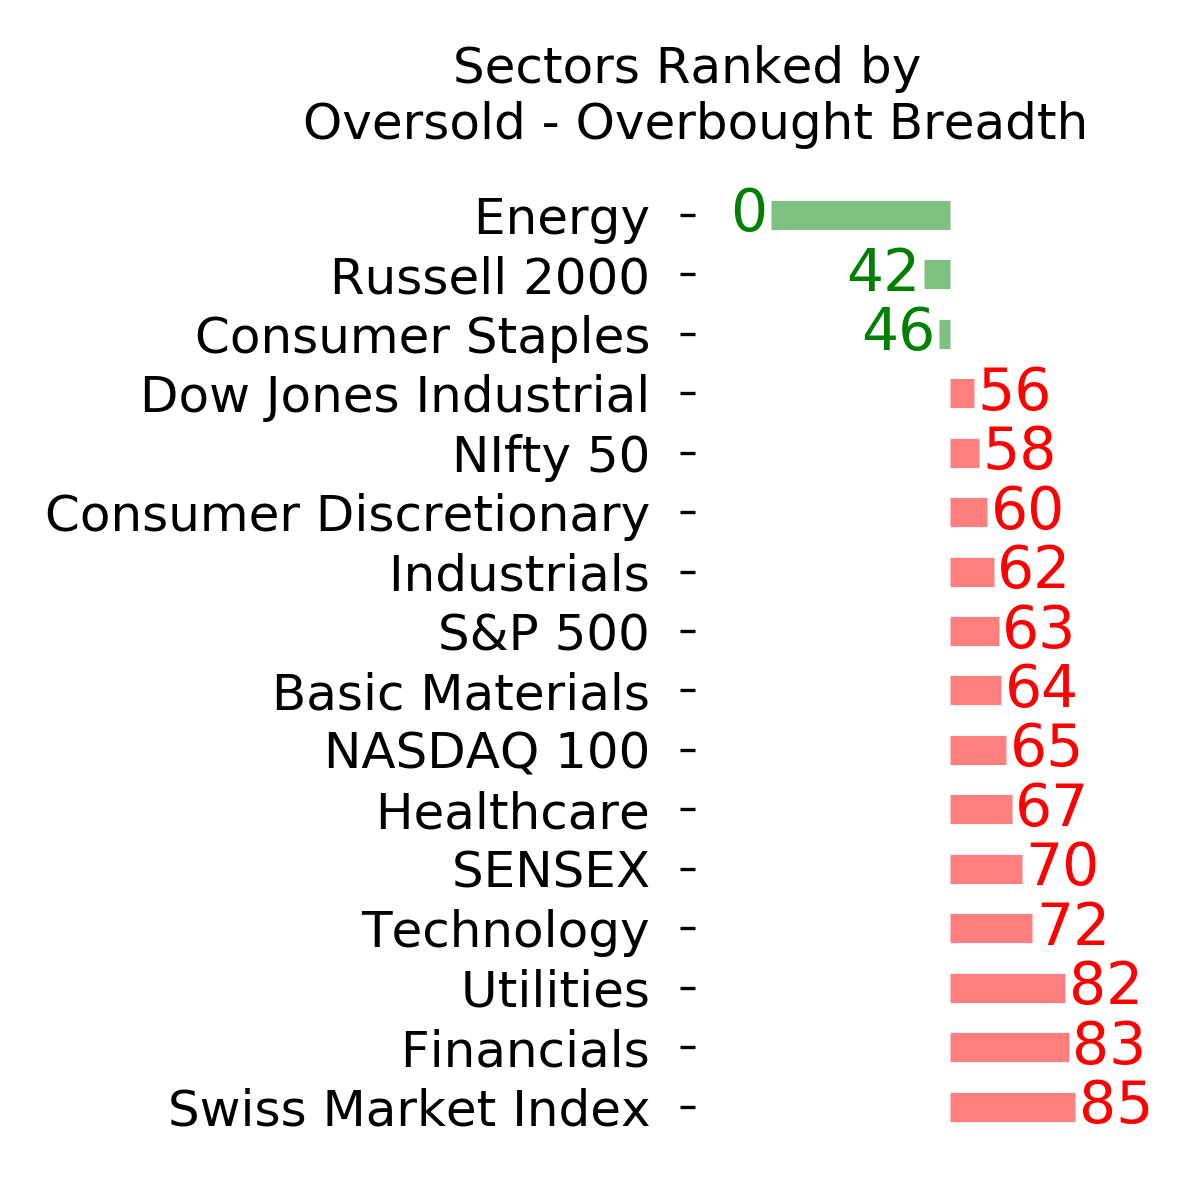
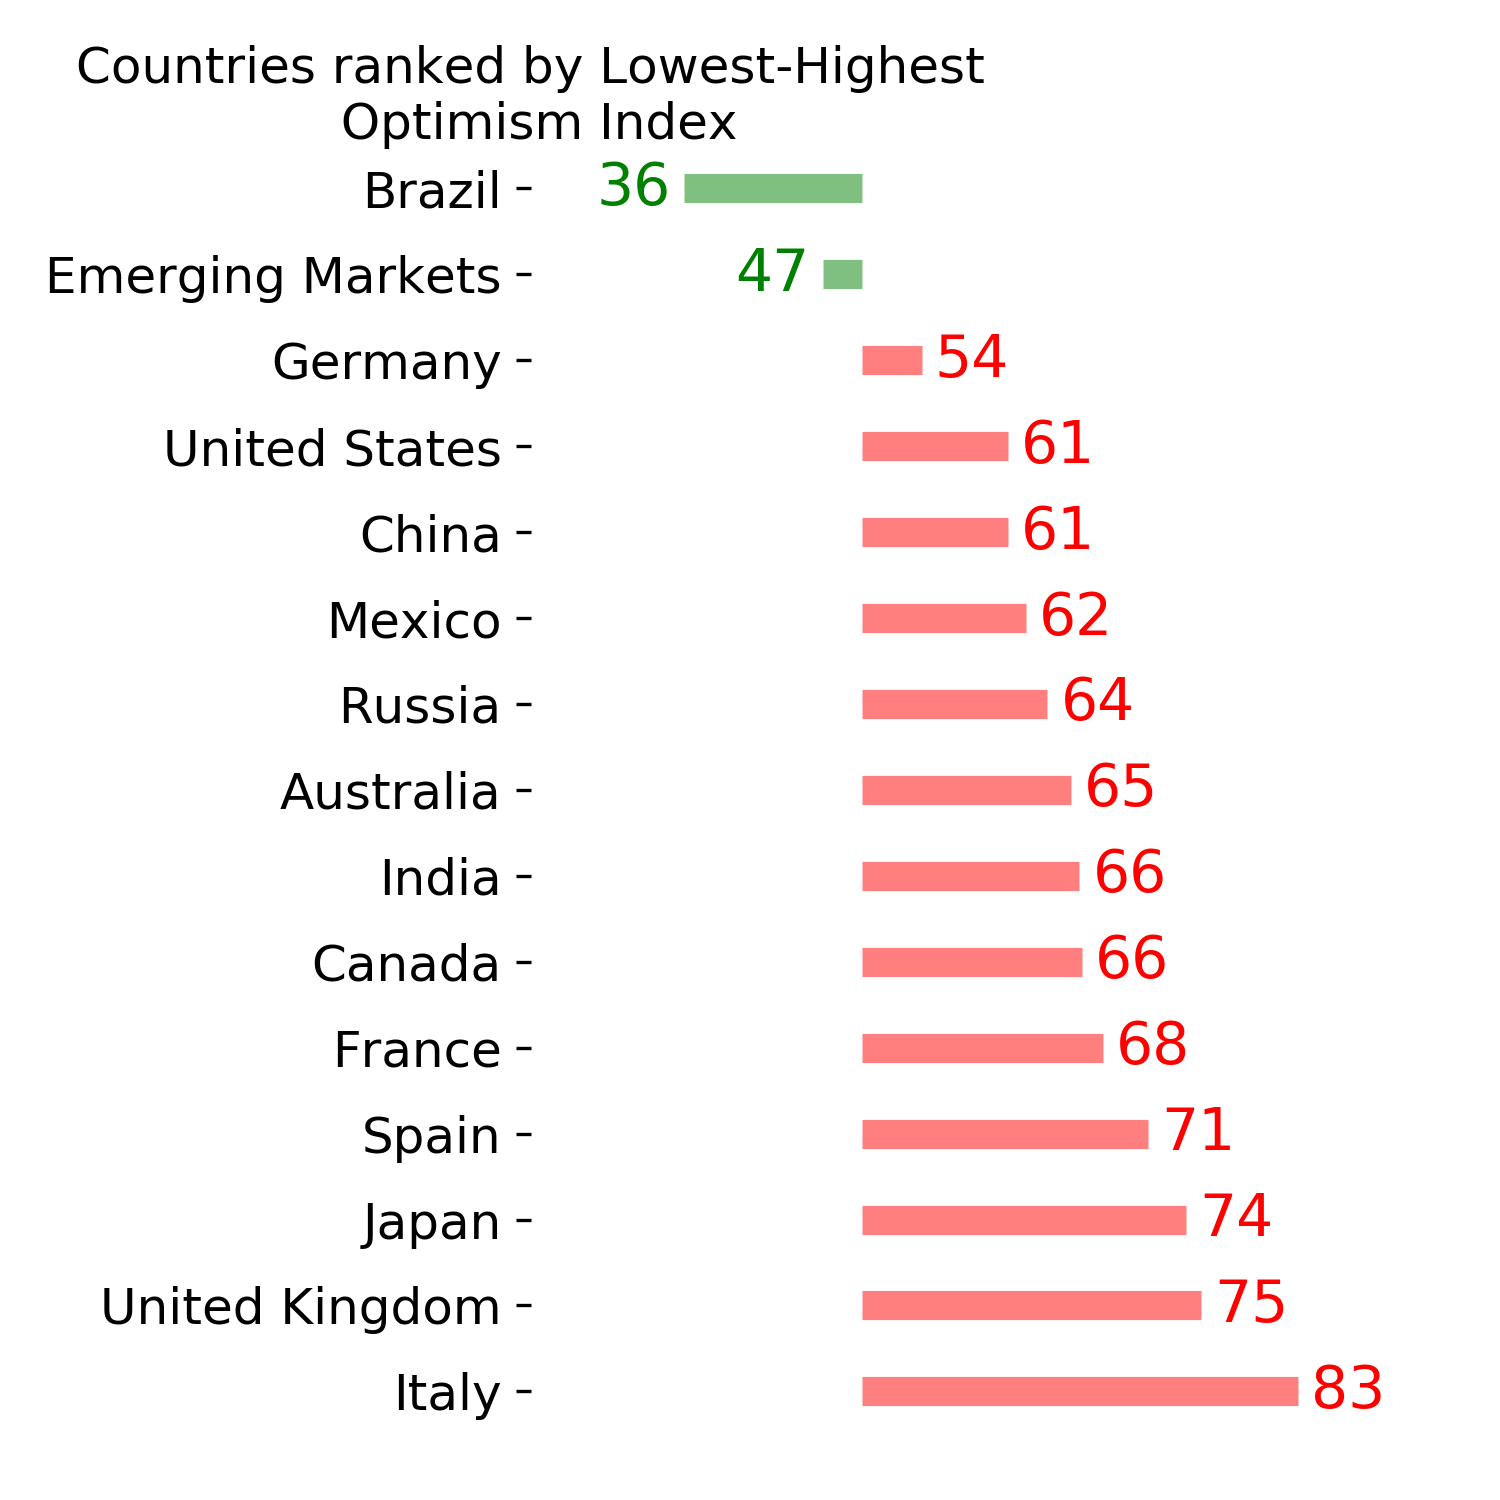
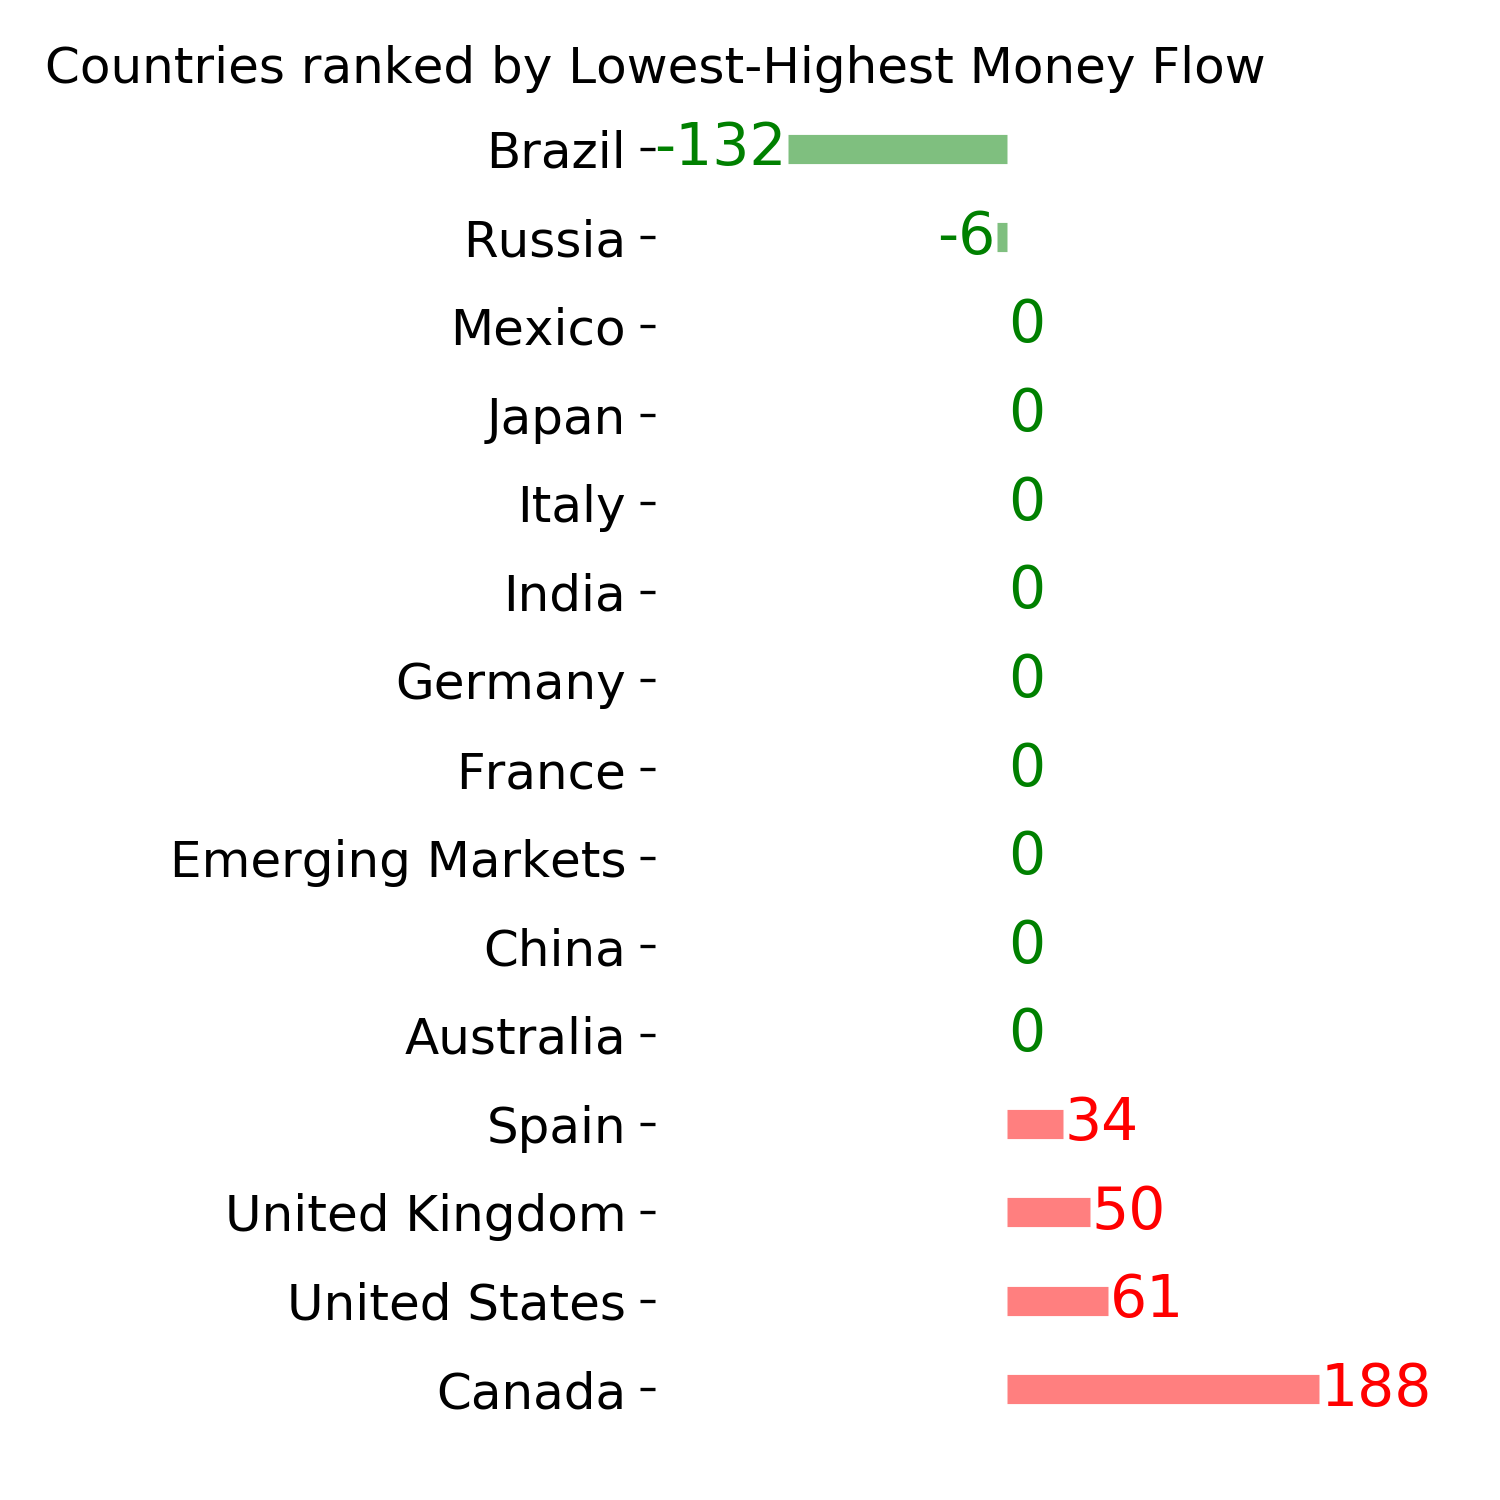
Ranks
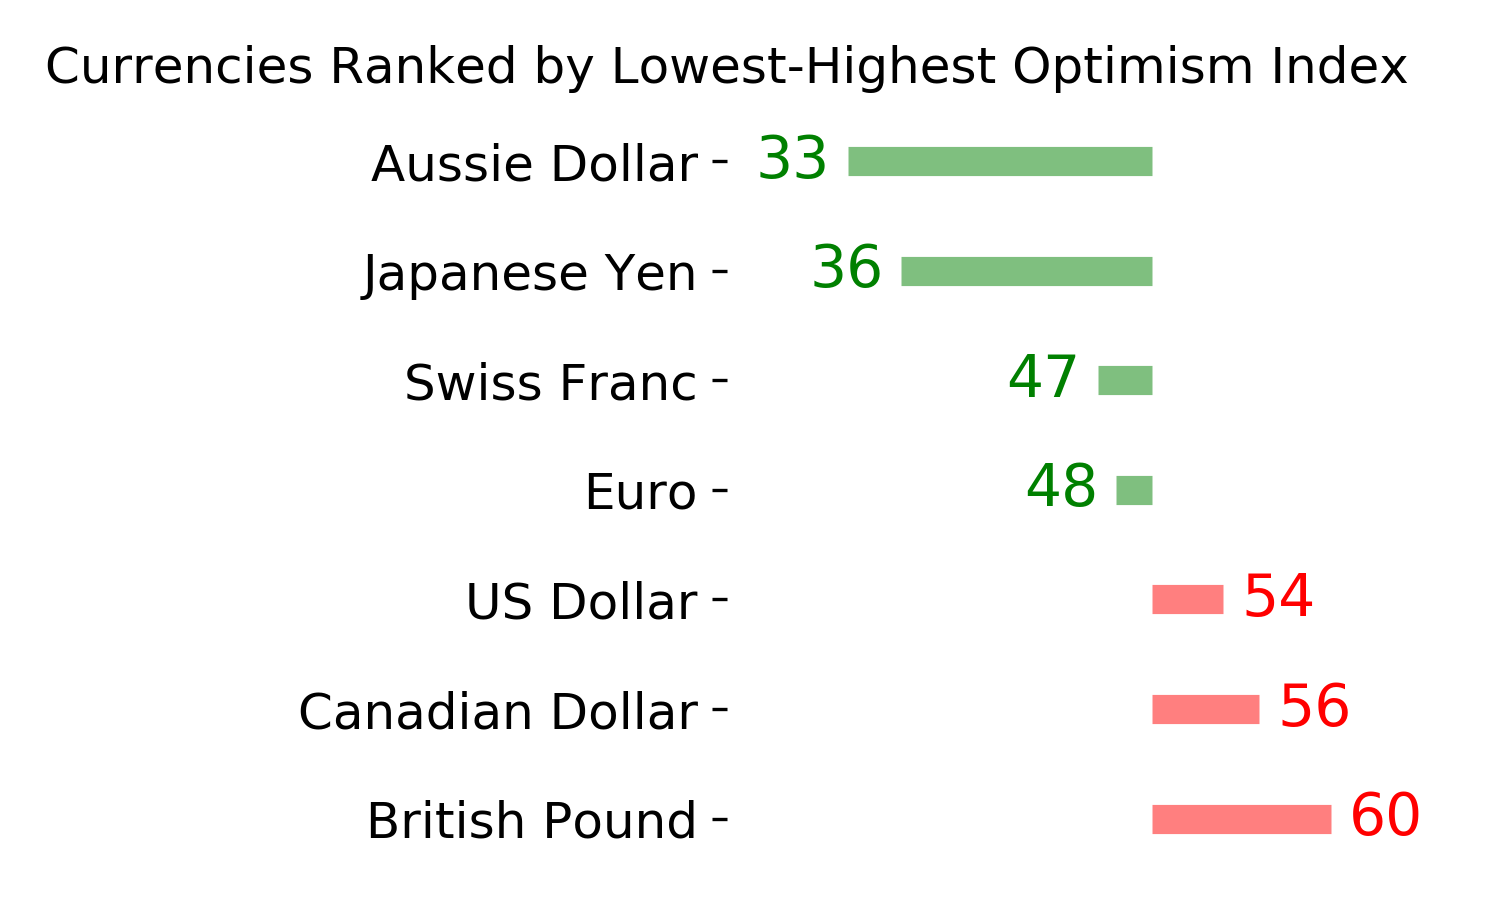
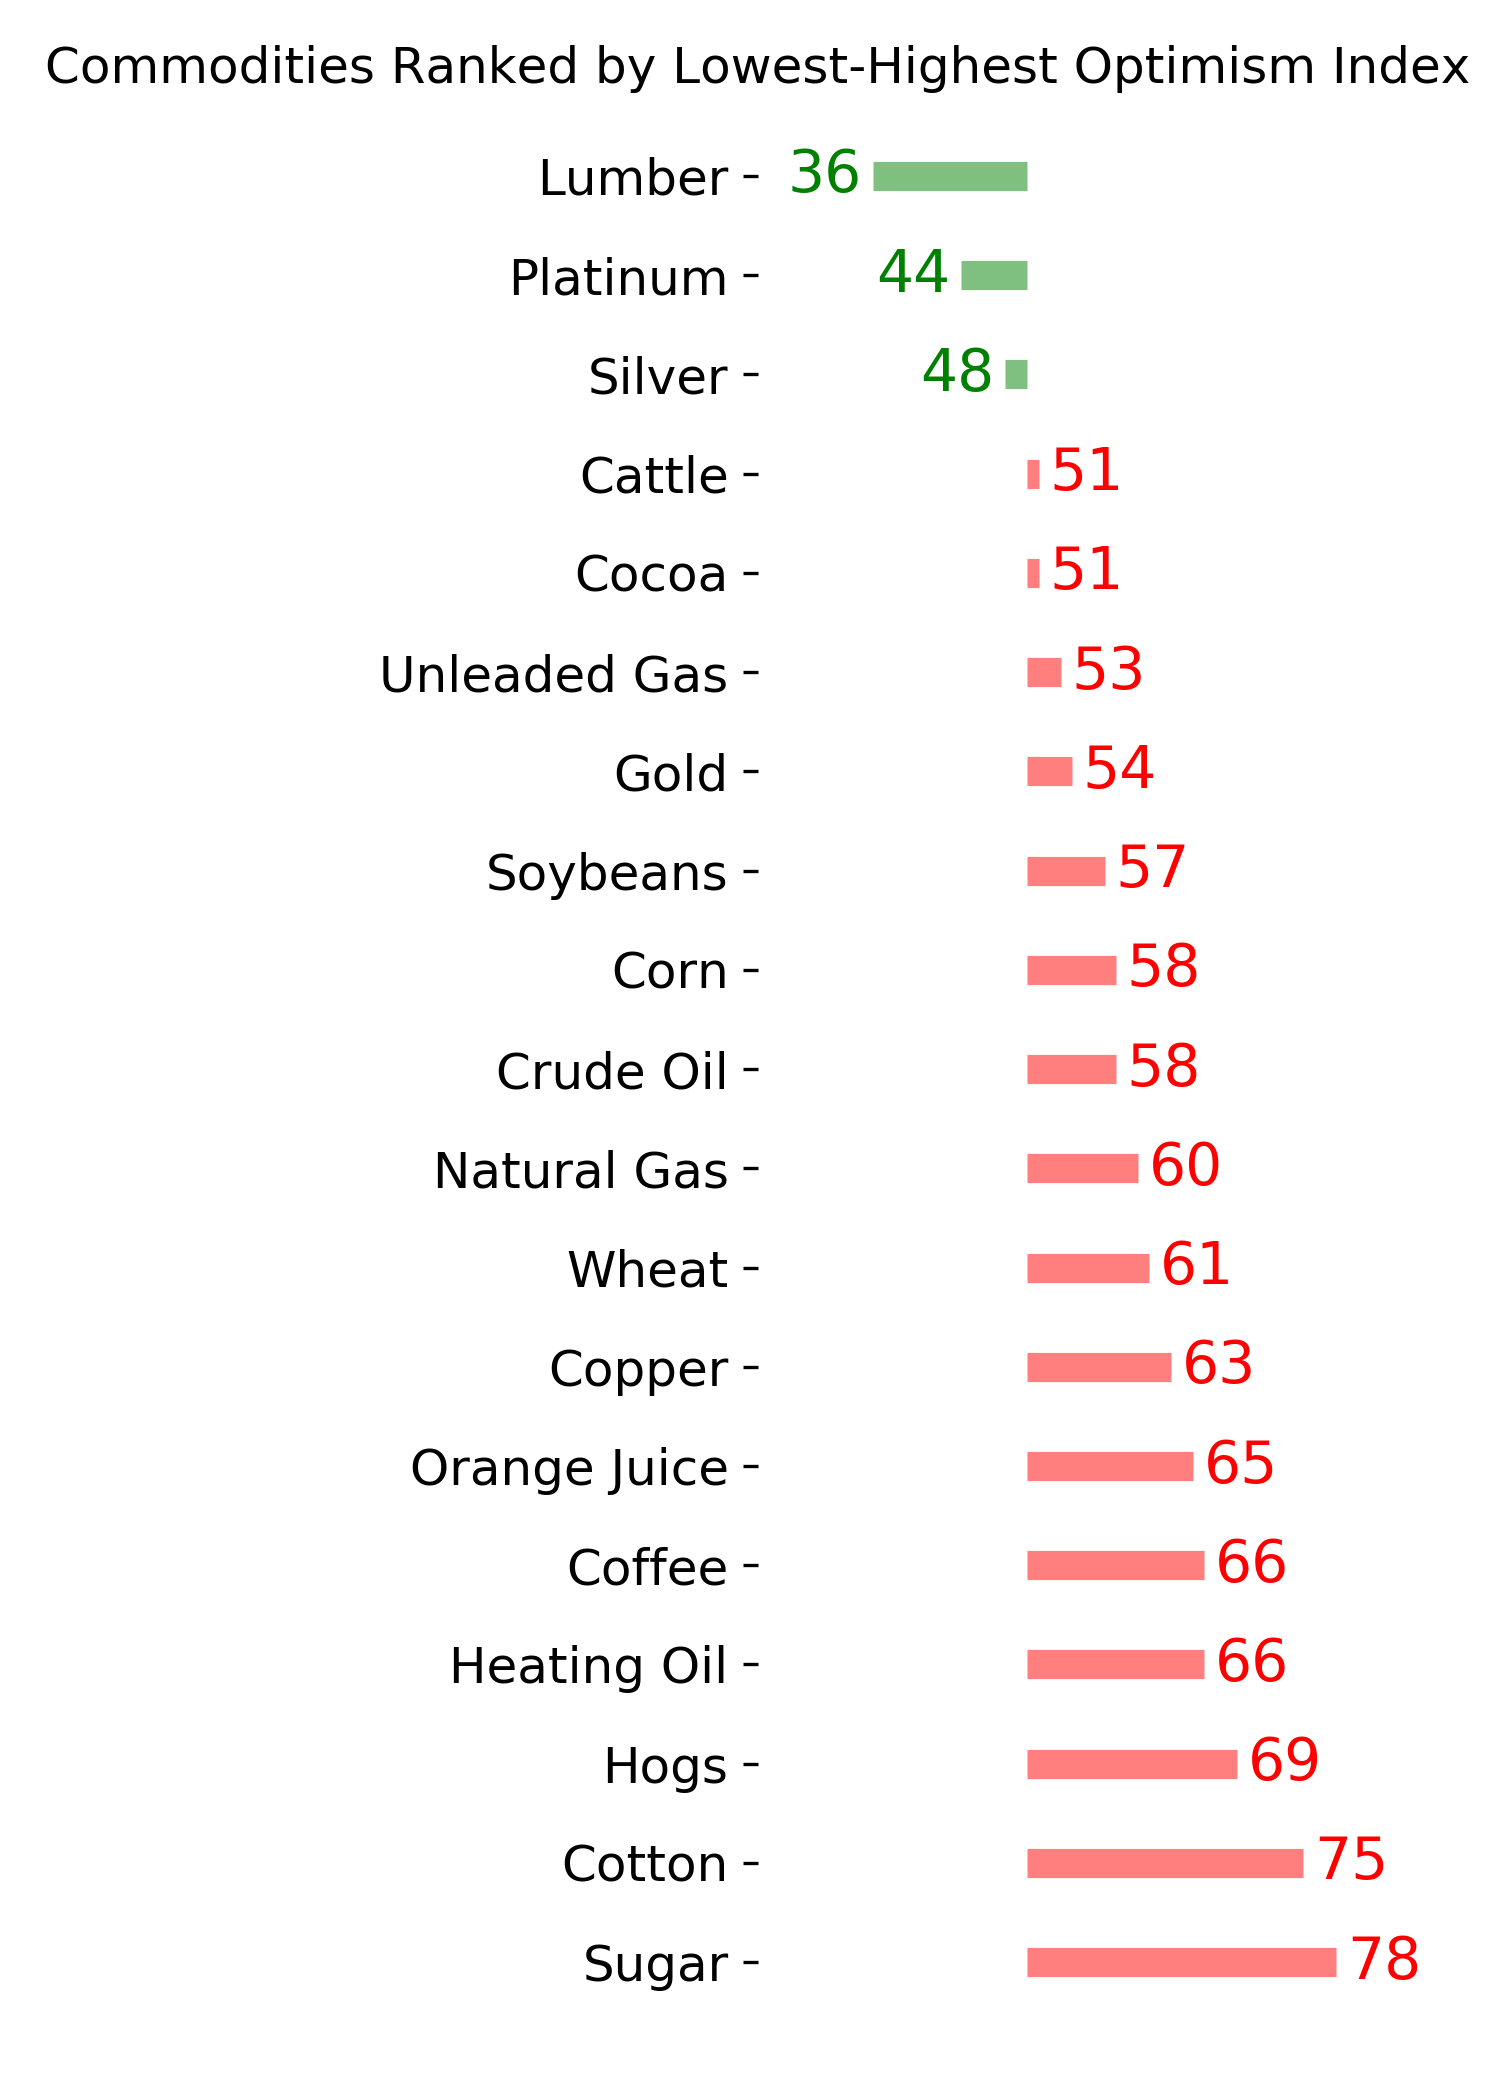
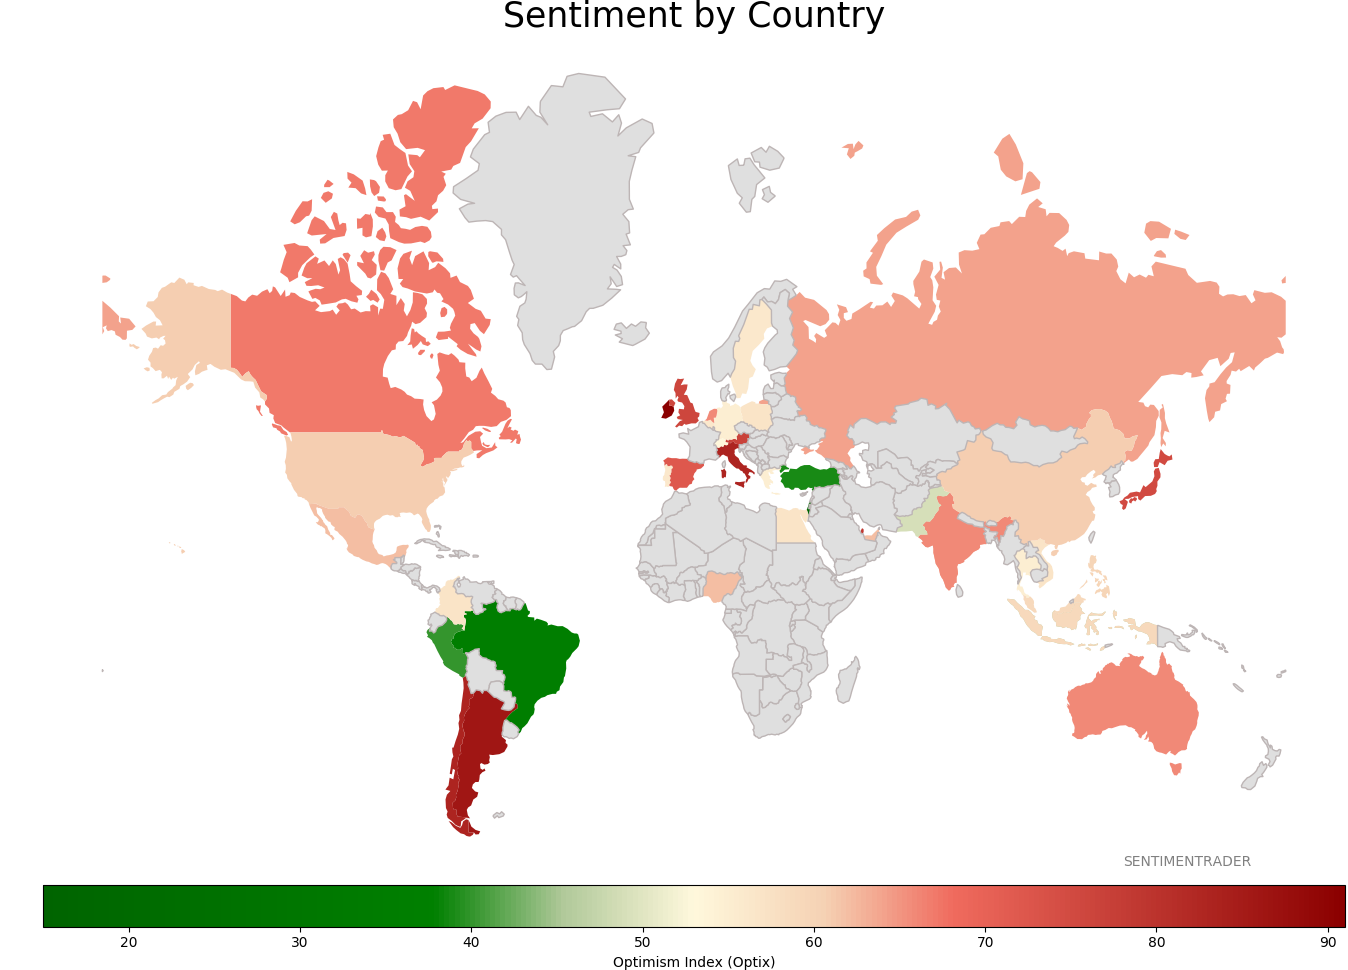
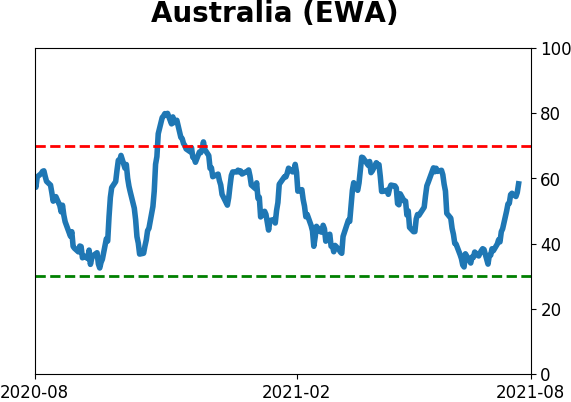
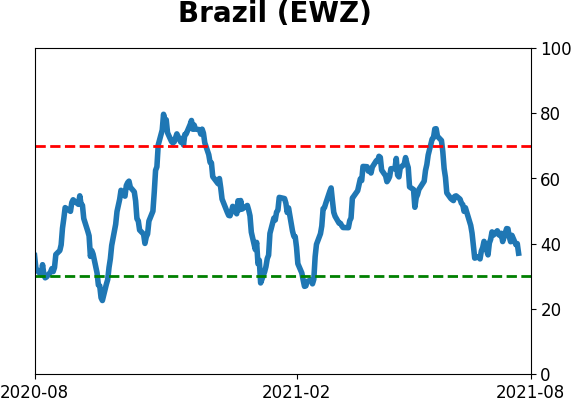
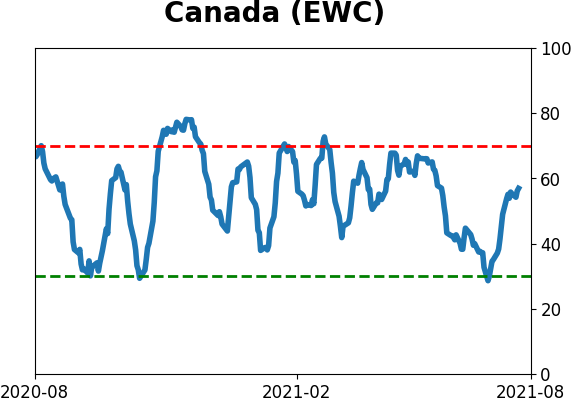
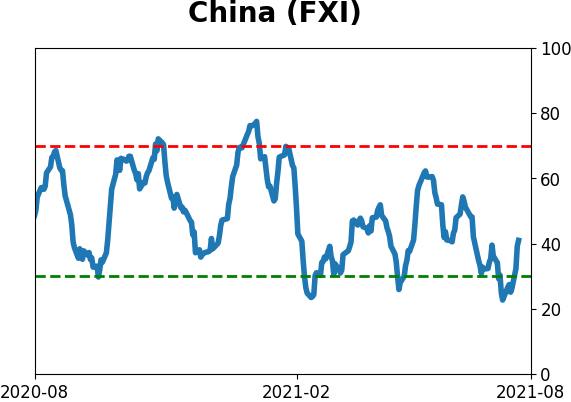
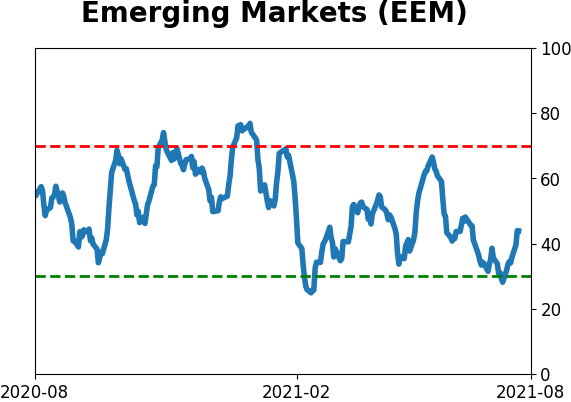
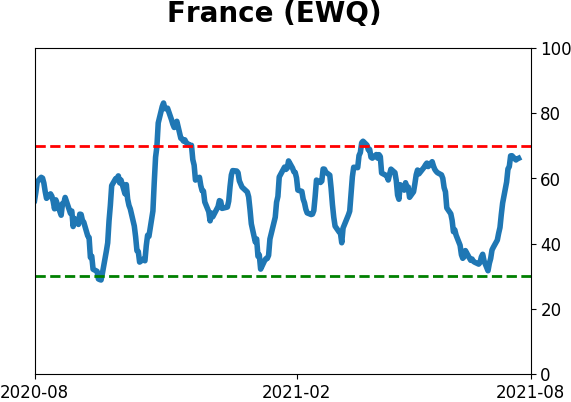
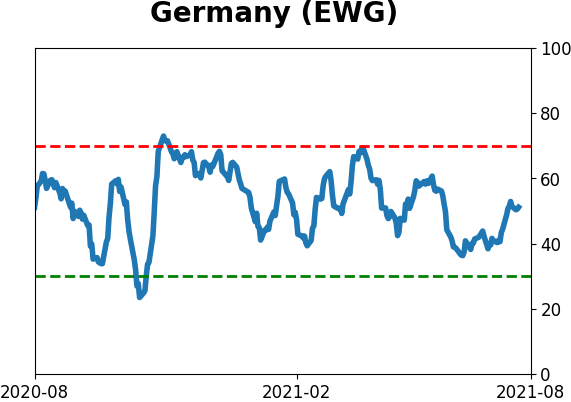
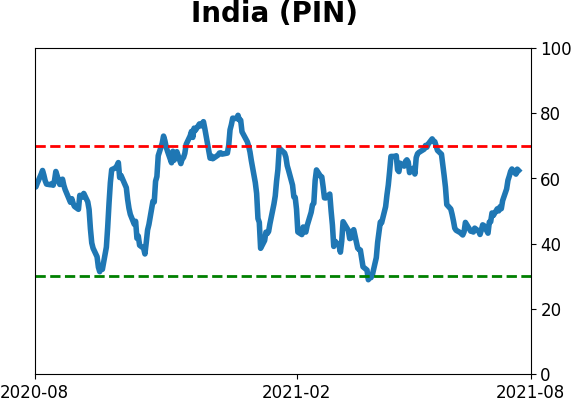
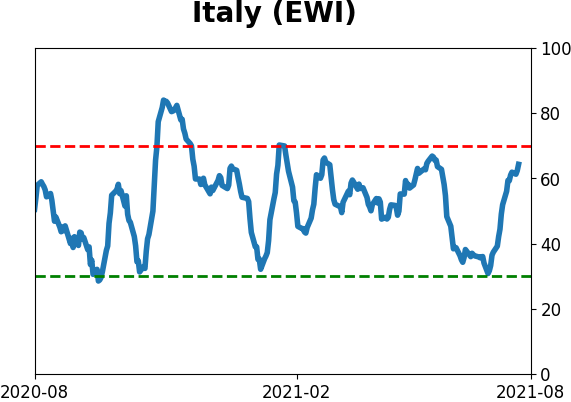
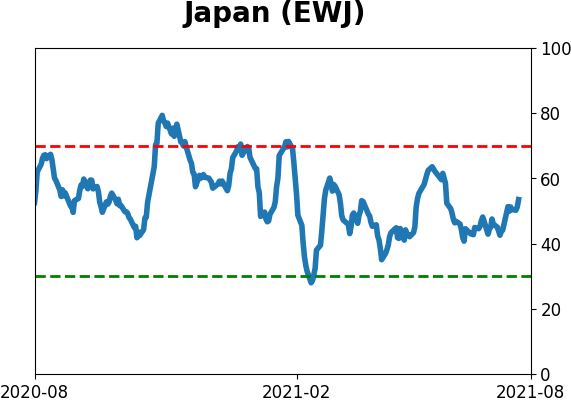
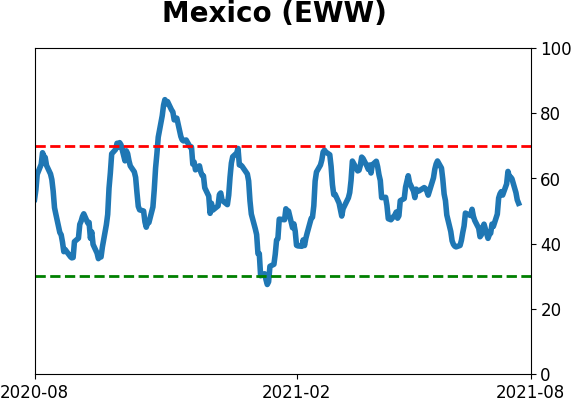
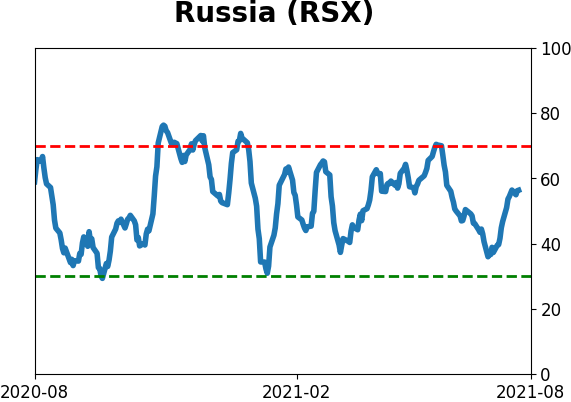
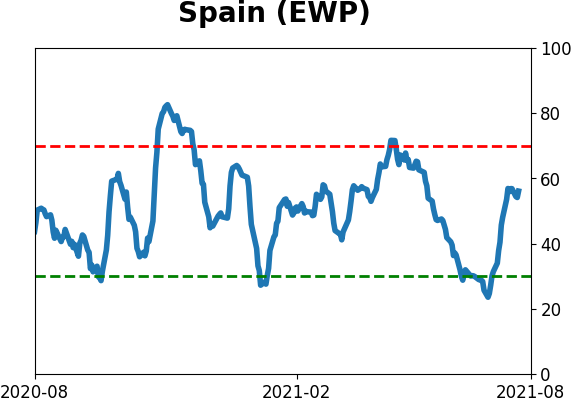
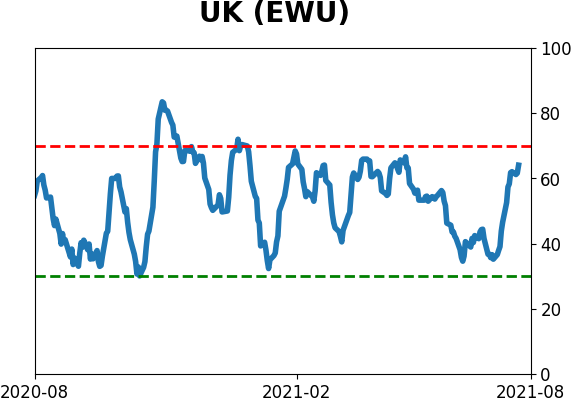
Sentiment Around The World
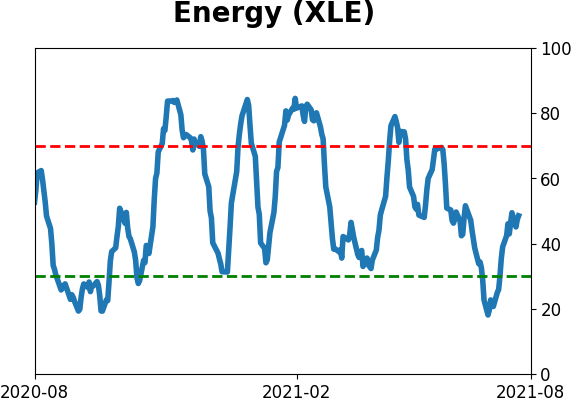
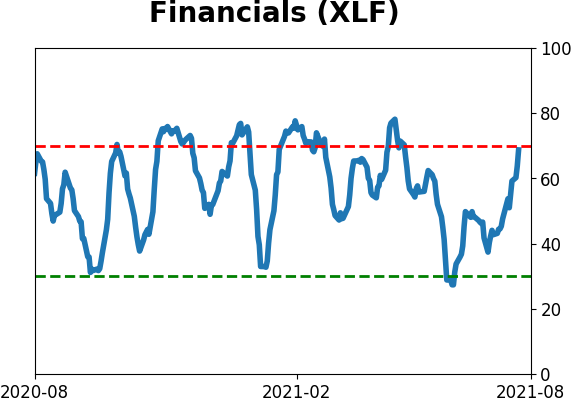
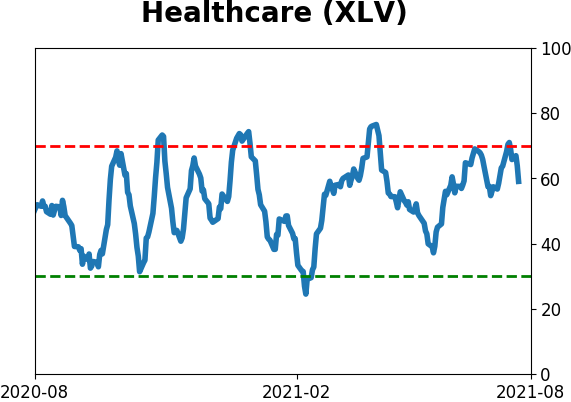
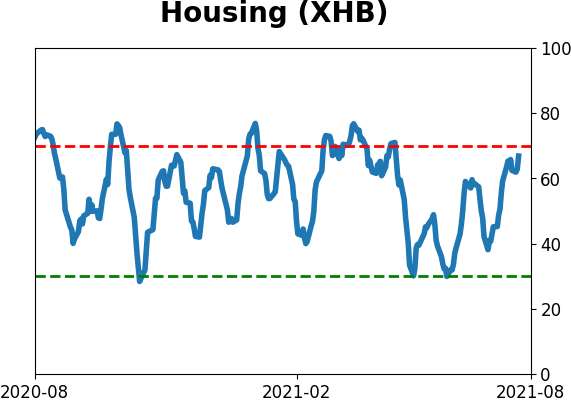
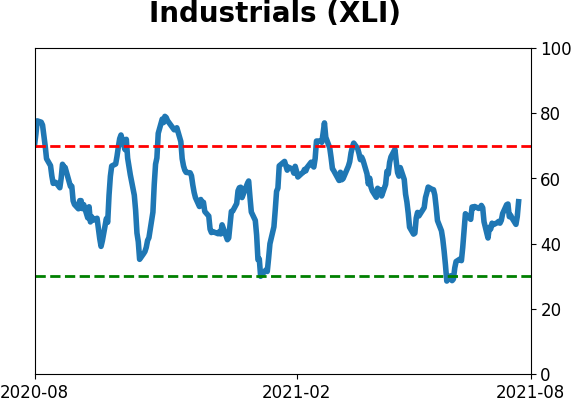
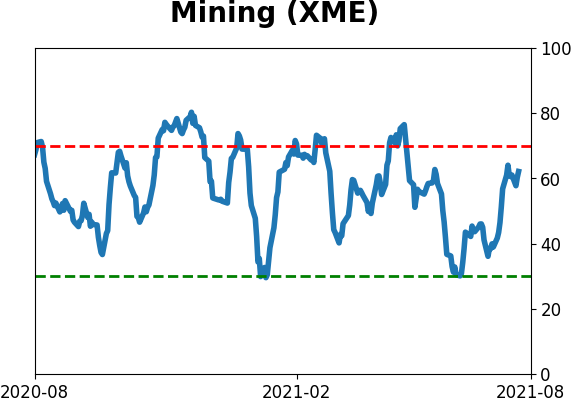
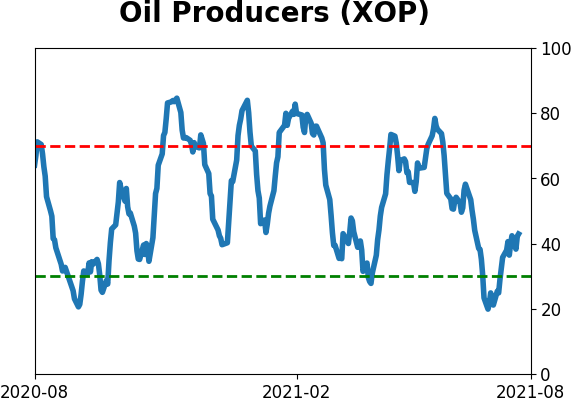
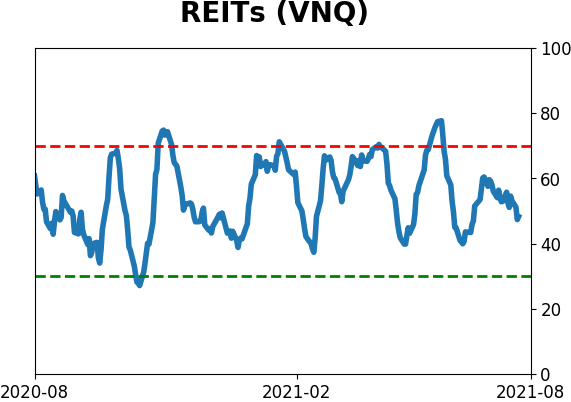
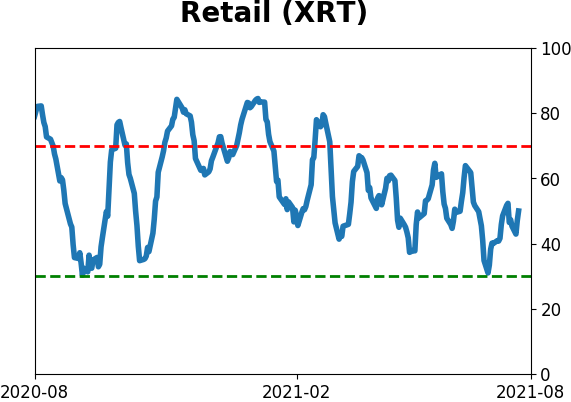
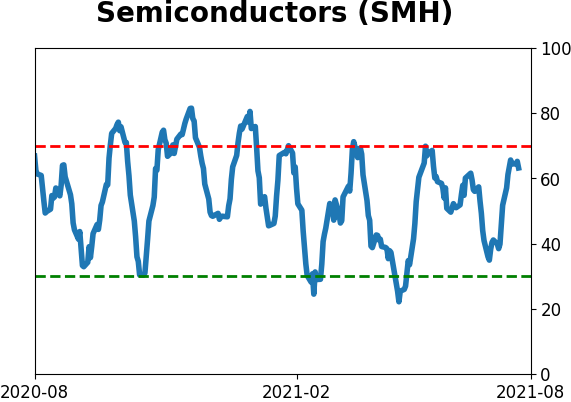
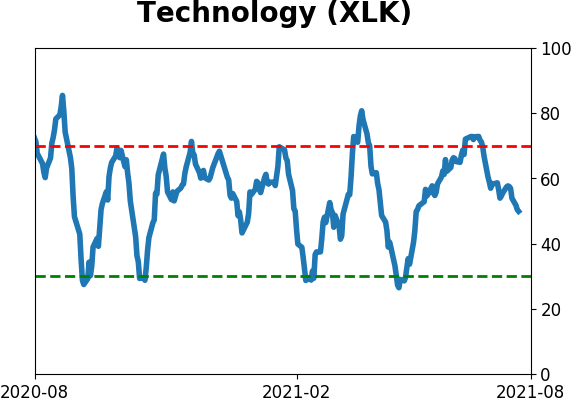
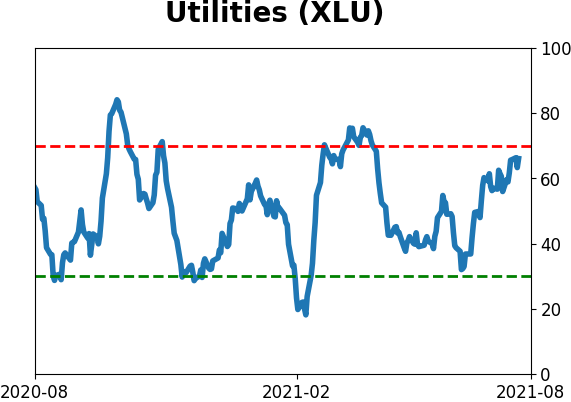
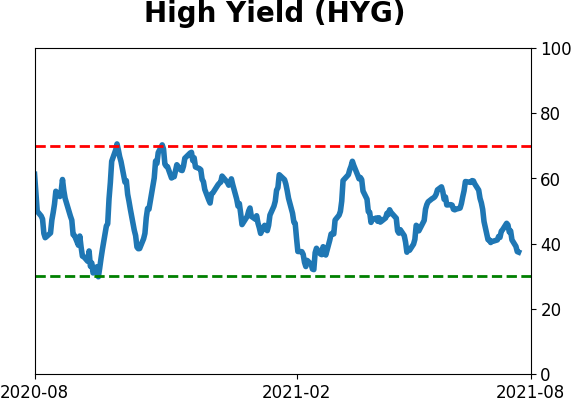
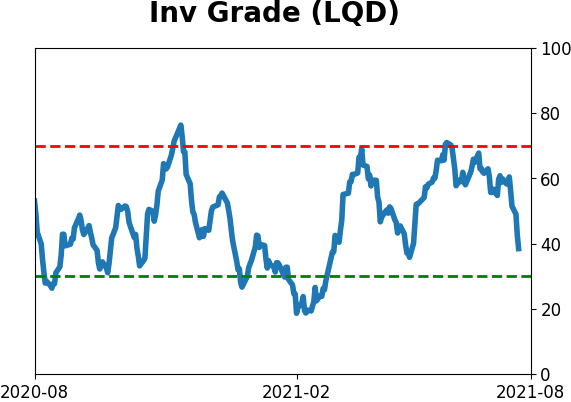
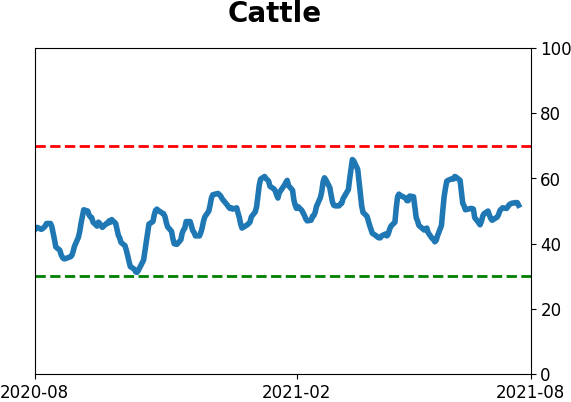
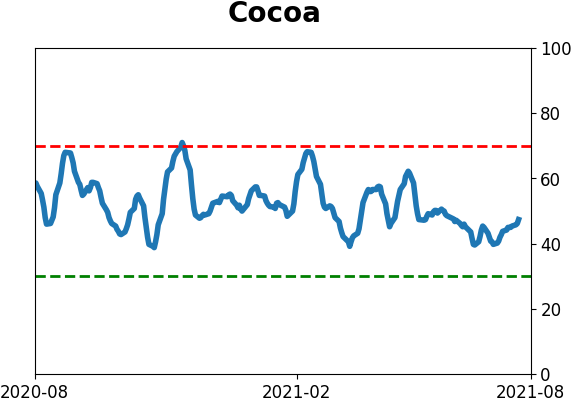
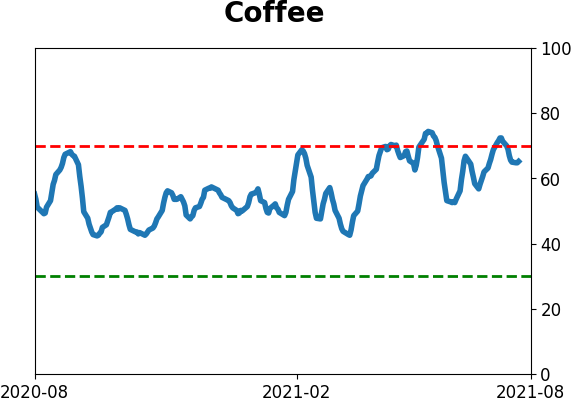
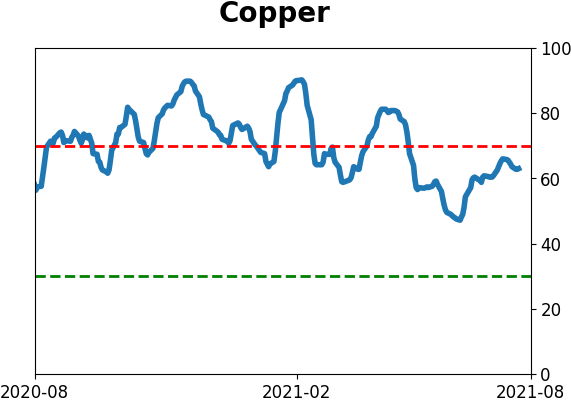
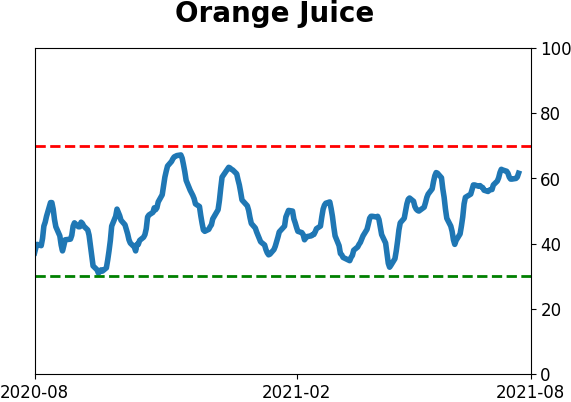
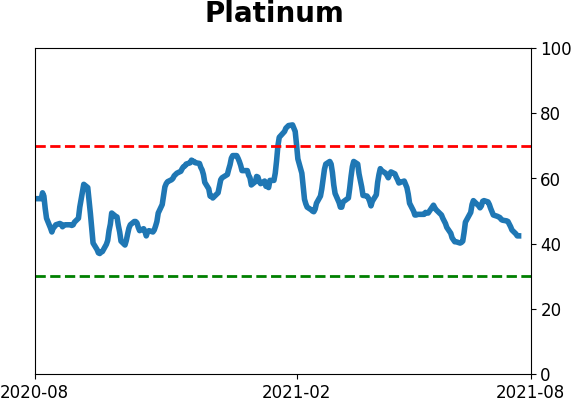
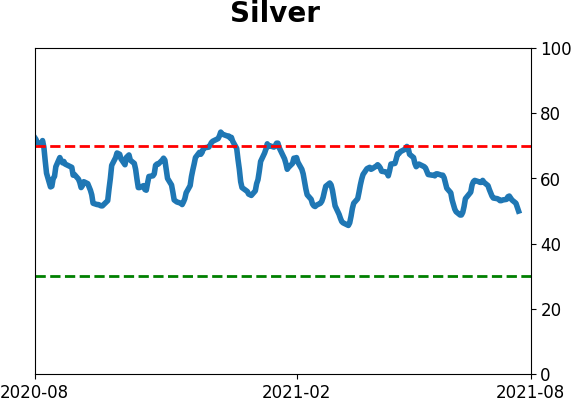
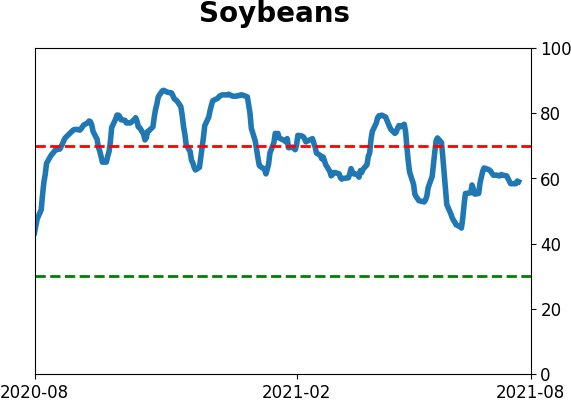
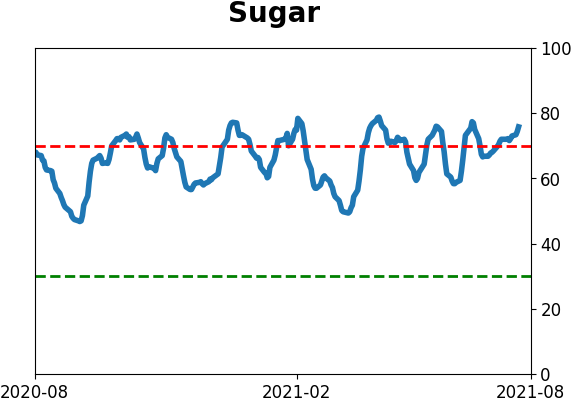
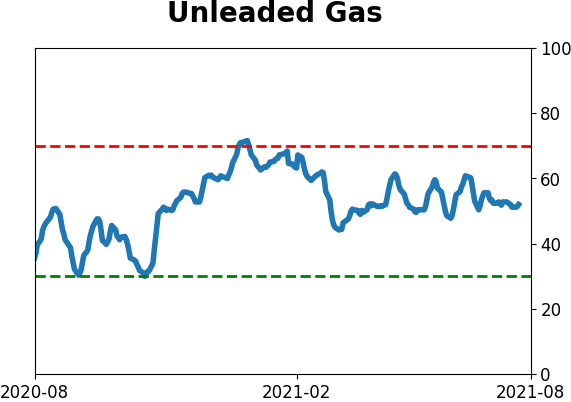
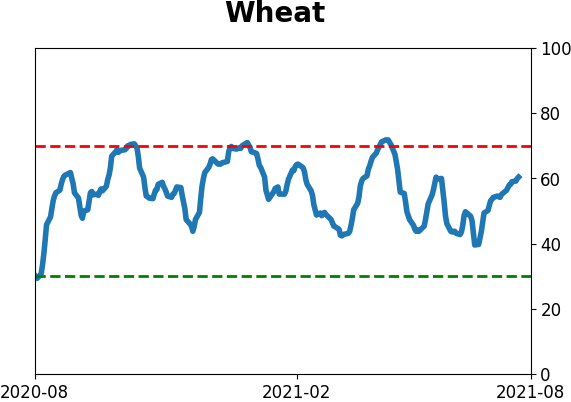
Optimism Index Thumbnails
|
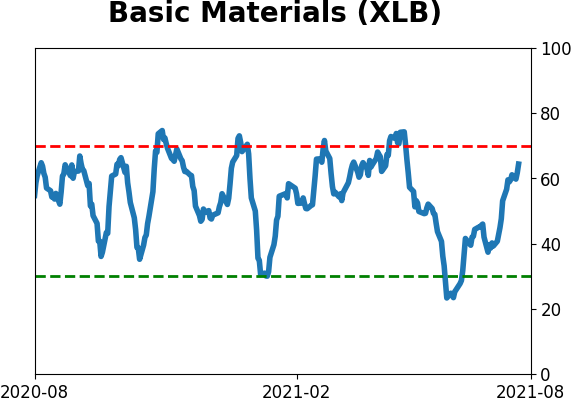
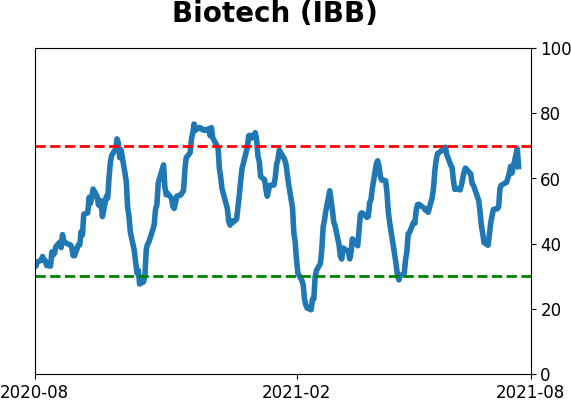
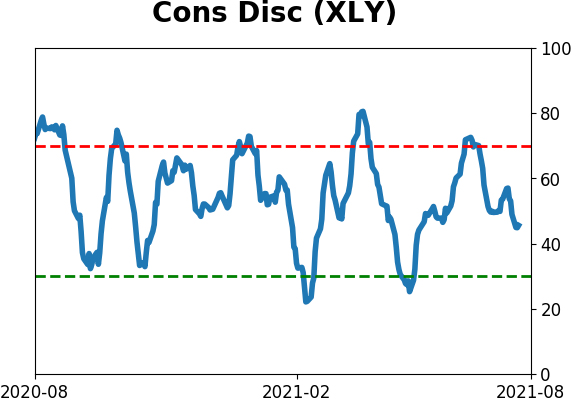
Sector ETF's - 10-Day Moving Average
|
|
|
Country ETF's - 10-Day Moving Average
|
|
|
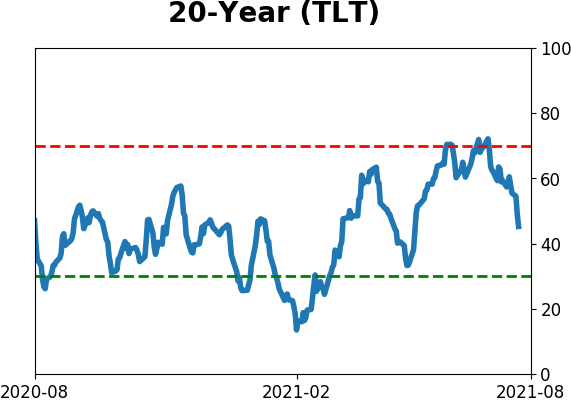
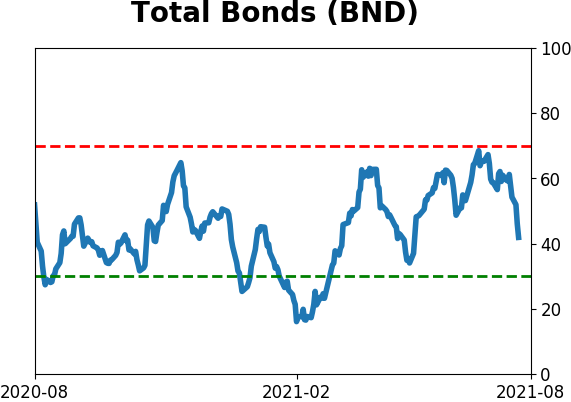
Bond ETF's - 10-Day Moving Average
|
|
|
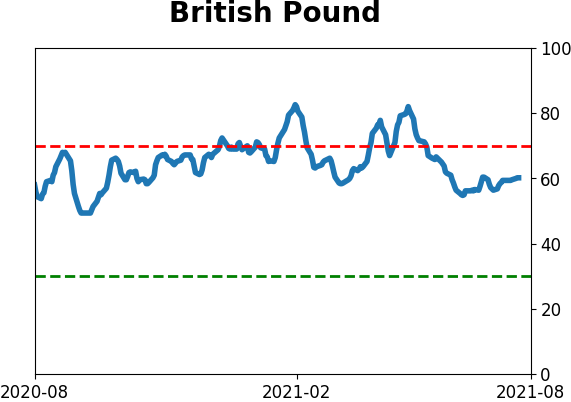
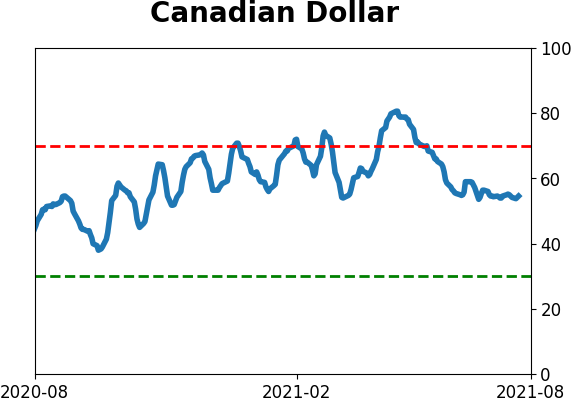
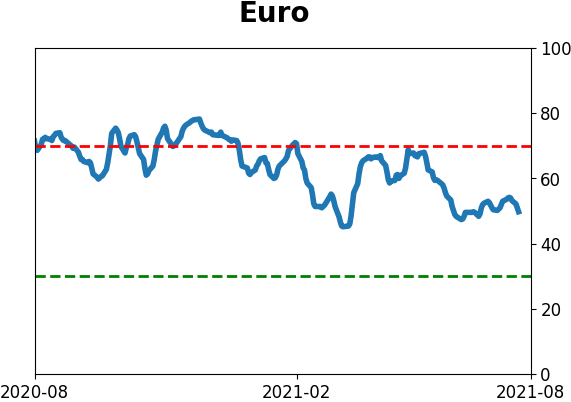
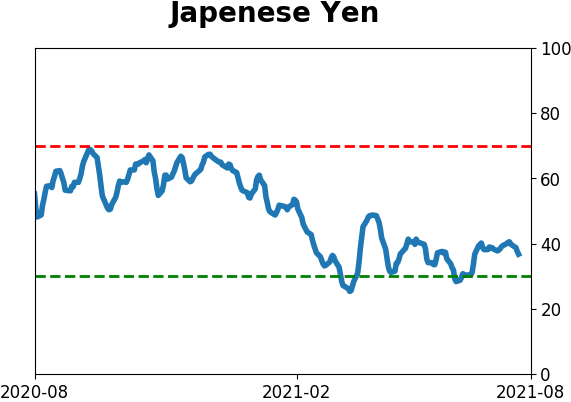
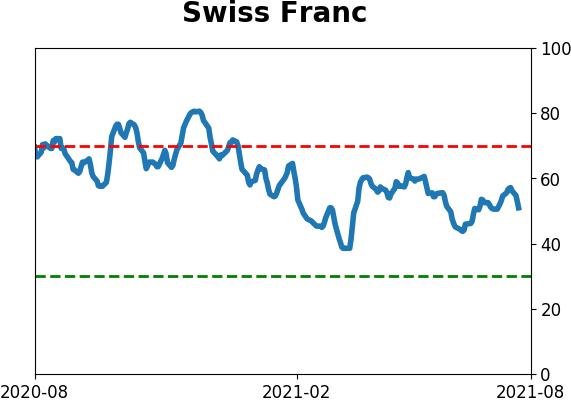
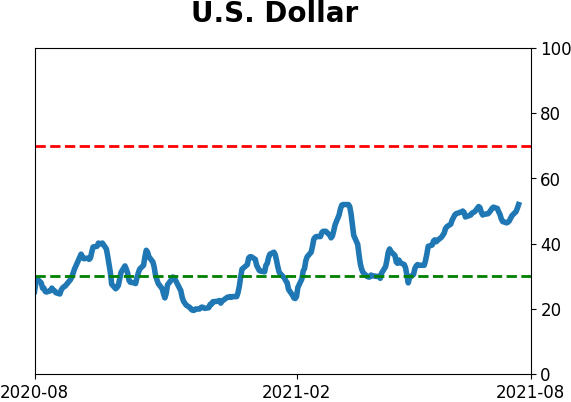
Currency ETF's - 5-Day Moving Average
|
|
|
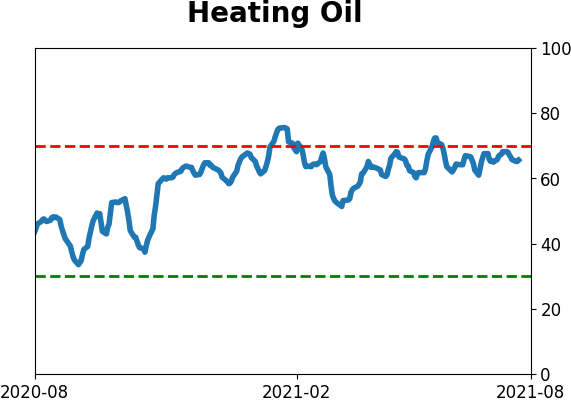
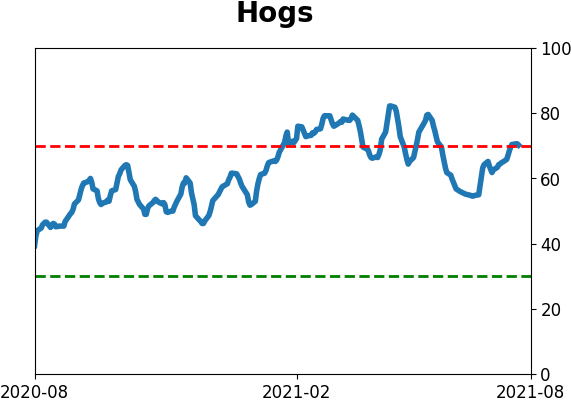
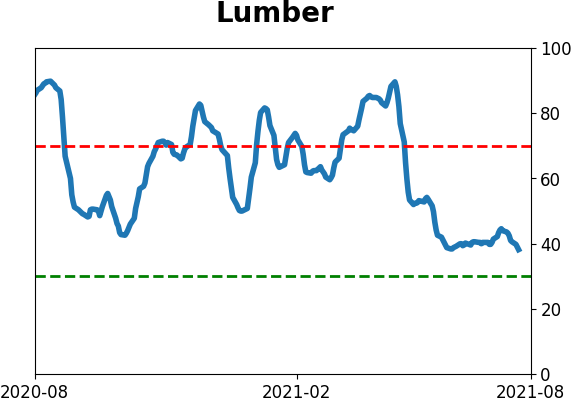
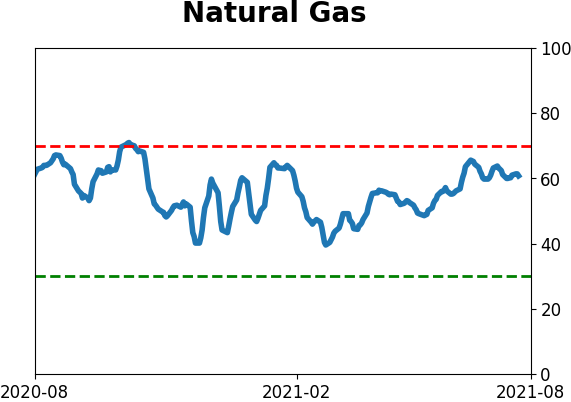
Commodity ETF's - 5-Day Moving Average
|
|