Headlines
|
|
A Historic Spread in Big Stocks in Medium Term Uptrends:
Many more Nasdaq 100 stocks have been trading above their 50-day moving averages than have stocks within the broader Nasdaq Composite index. The spread between them is now among the widest in 20 years.
Bottom Line:
See the Outlook & Allocations page for more details on these summaries STOCKS: Hold
The speculative frenzy in February is wrung out. Internal dynamics have mostly held up, with some exceptions. Many of our studies still show a mixed to poor short-term view, with medium- and long-term ones turning more positive. BONDS: Hold
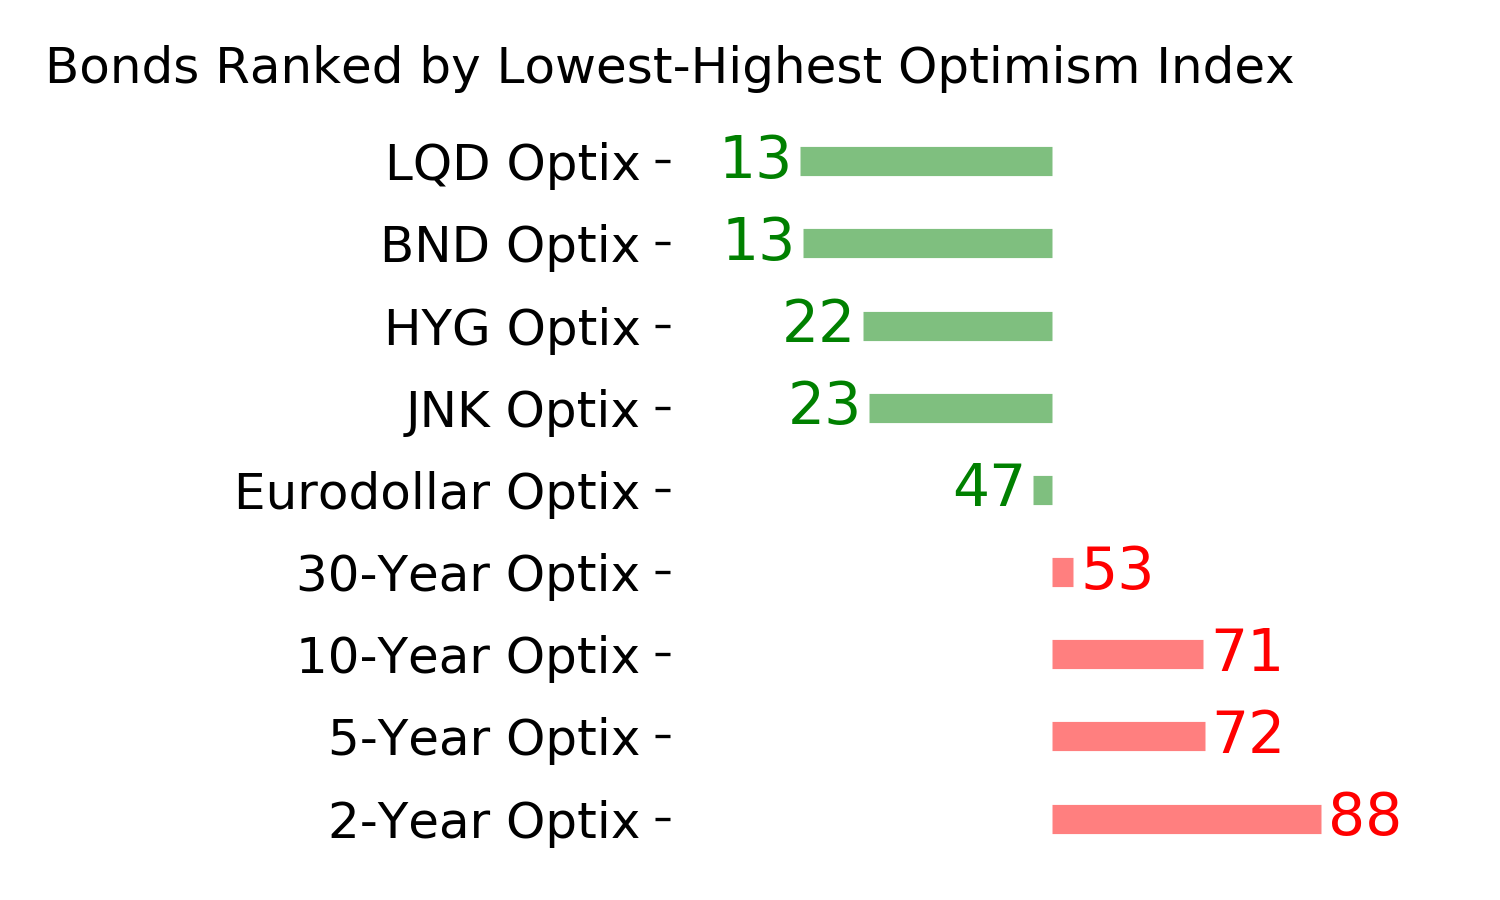
Various parts of the market got hit in March, with the lowest Bond Optimism Index we usually see during healthy environments. After a shaky couple of weeks, the broad bond market has modestly recovered. Not a big edge here either way. GOLD: Hold
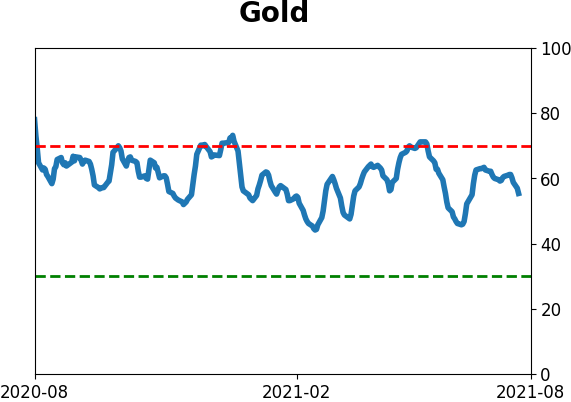
Gold and miners have done very well, recovering above long-term trend lines. The issue is that both have tended to perform poorly after similar situations - will have to wait and see how it plays out.
|
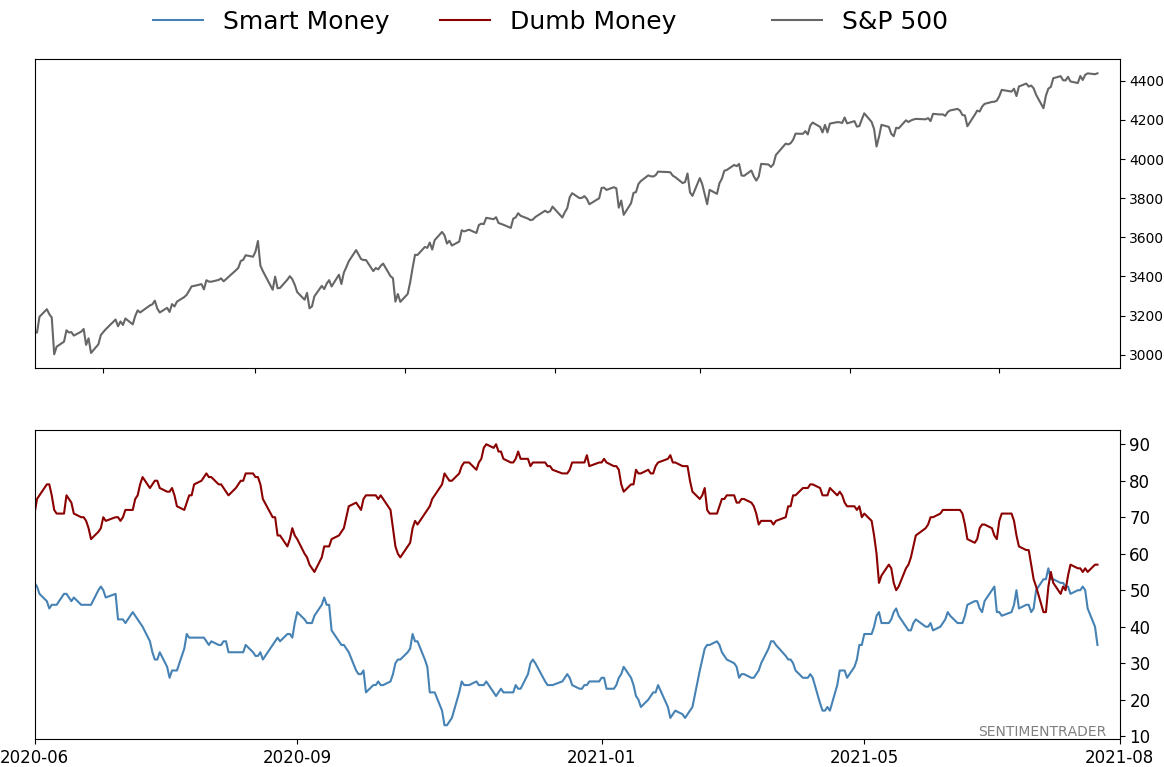
Smart / Dumb Money Confidence
|
Smart Money Confidence: 35%
Dumb Money Confidence: 57%
|
|
Risk Levels
Stocks Short-Term
|
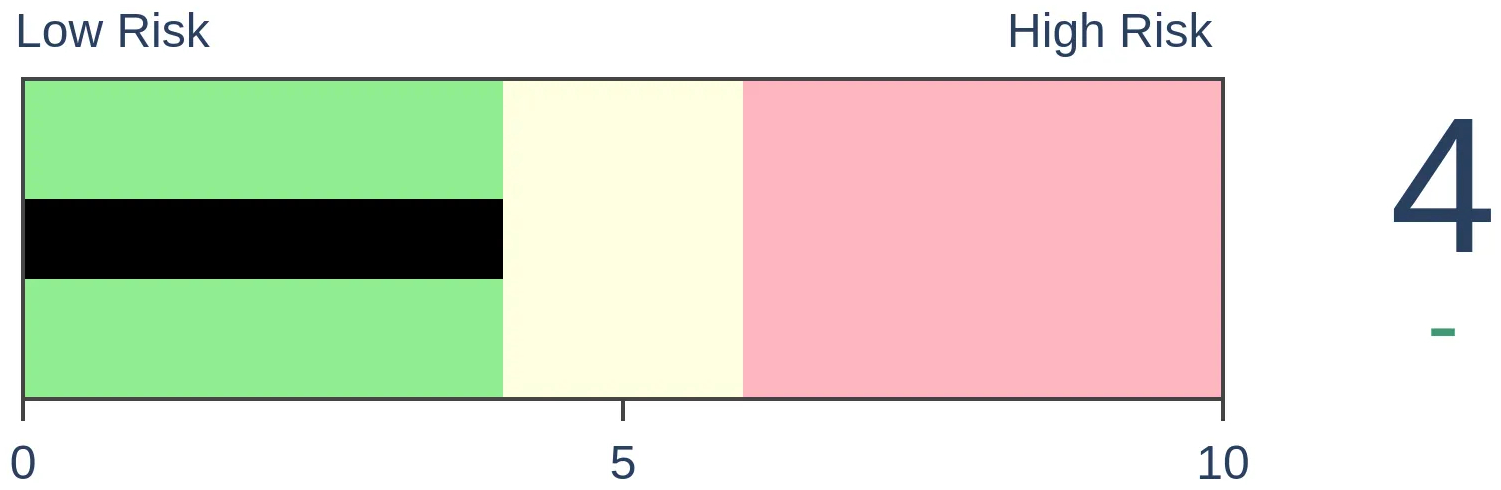
Stocks Medium-Term

|
|
Bonds
|
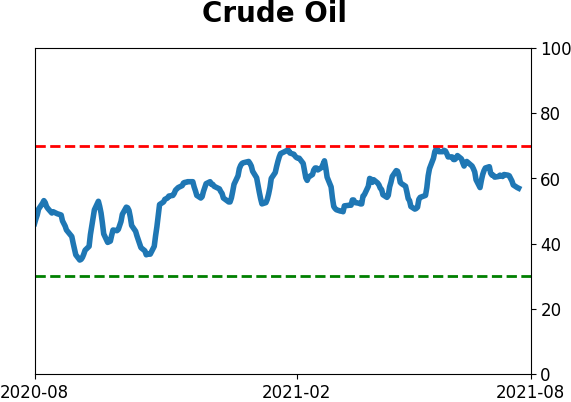
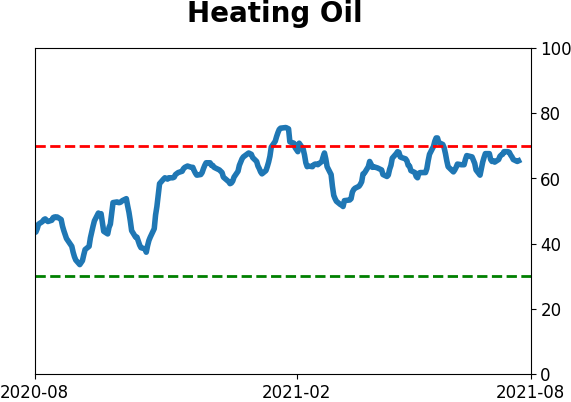
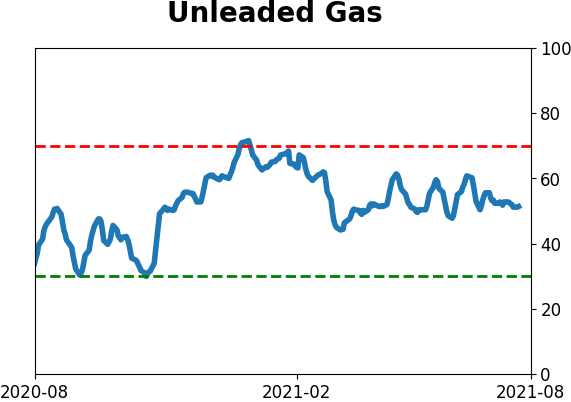
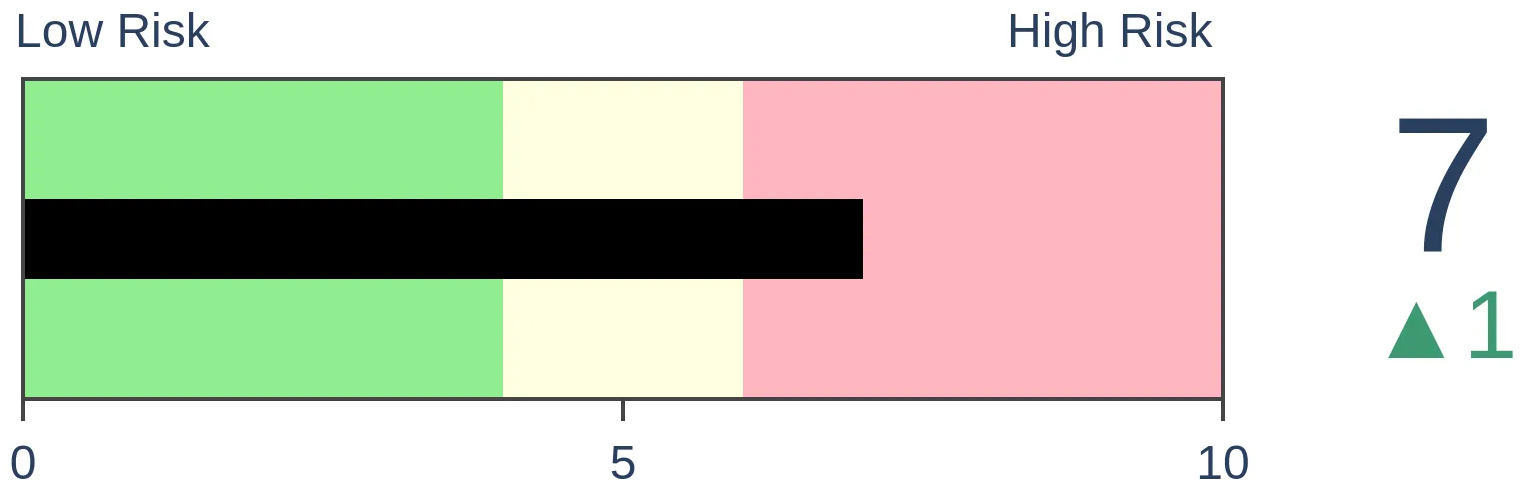
Crude Oil

|
|
Gold

|
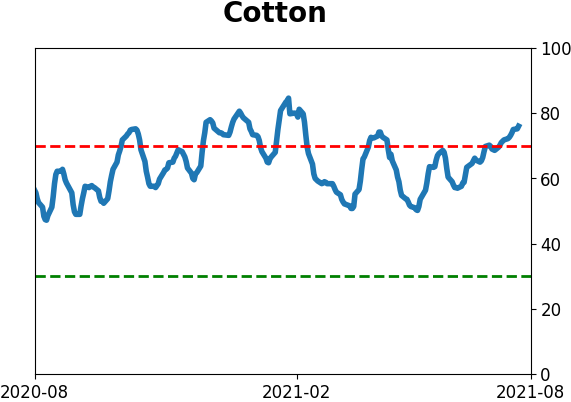
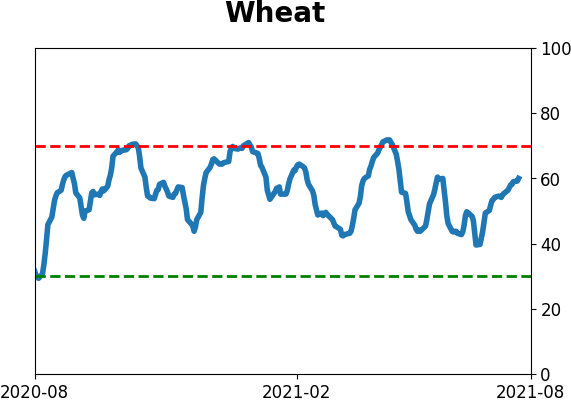
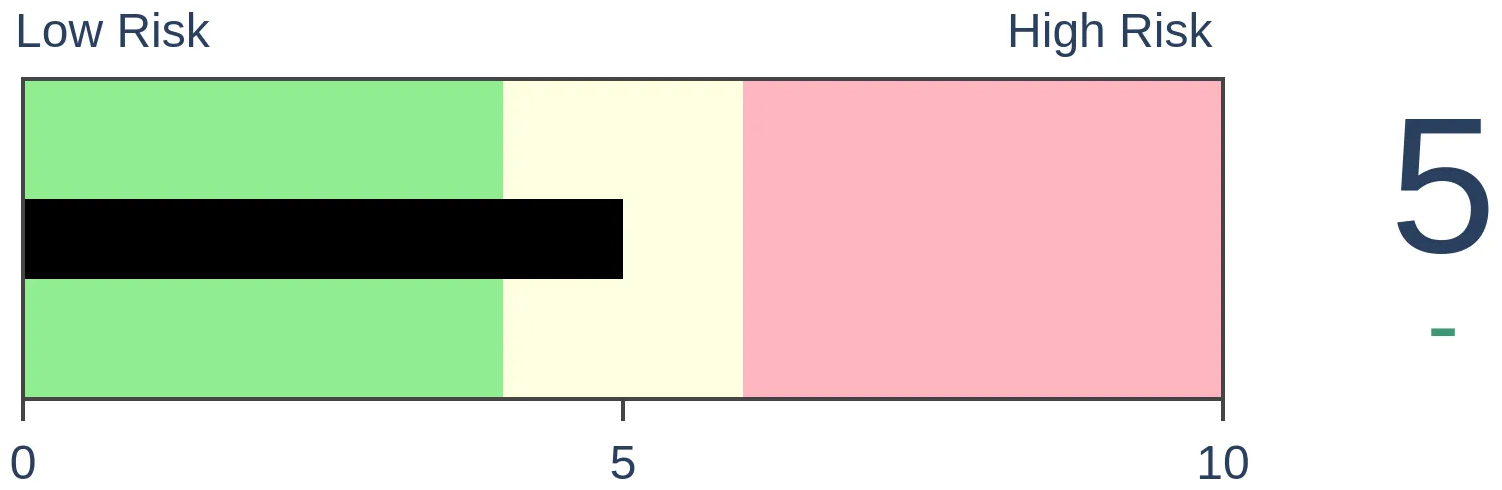
Agriculture
|
|
Research
By Jason Goepfert
BOTTOM LINE
Many more Nasdaq 100 stocks have been trading above their 50-day moving averages than have stocks within the broader Nasdaq Composite index. The spread between them is now among the widest in 20 years.
FORECAST / TIMEFRAME
None
|
Since the speculative peak in February, the stock market has become more bifurcated between winners and losers. That's normally a bad sign for the overall market, but 2021 has steamrolled every "bad sign" so far.
This winner-vs-everyone-else divergence is especially evident on the Nasdaq. In recent days, more than 70% of stocks included in the Nasdaq 100 index have closed above their 50-day moving averages. But within the broader Nasdaq Composite index, fewer than 40% of stocks are above those trendlines.
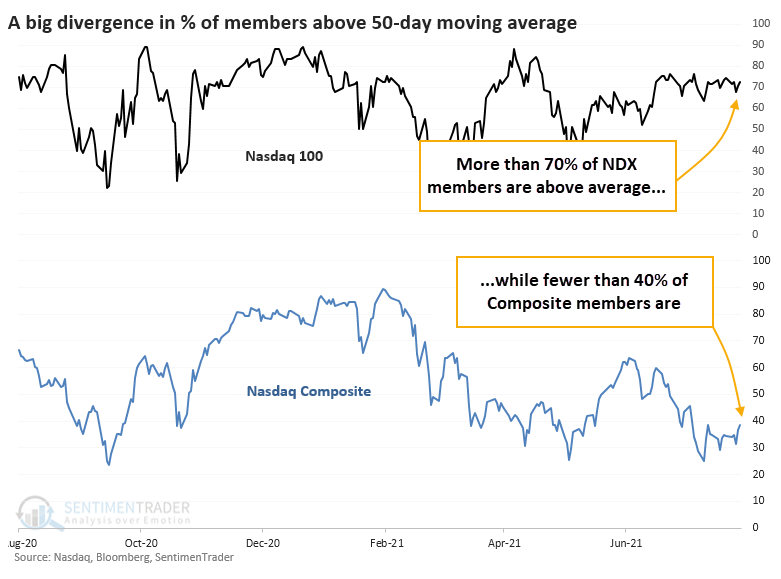
There are 102 stocks in the Nasdaq 100, and they have a median market capitalization of $58 billion. There are 3,423 securities in the Nasdaq Composite, with a median market cap of $471 million. Many of the smaller stocks in the broader Composite are dragging the internal breadth figures lower.
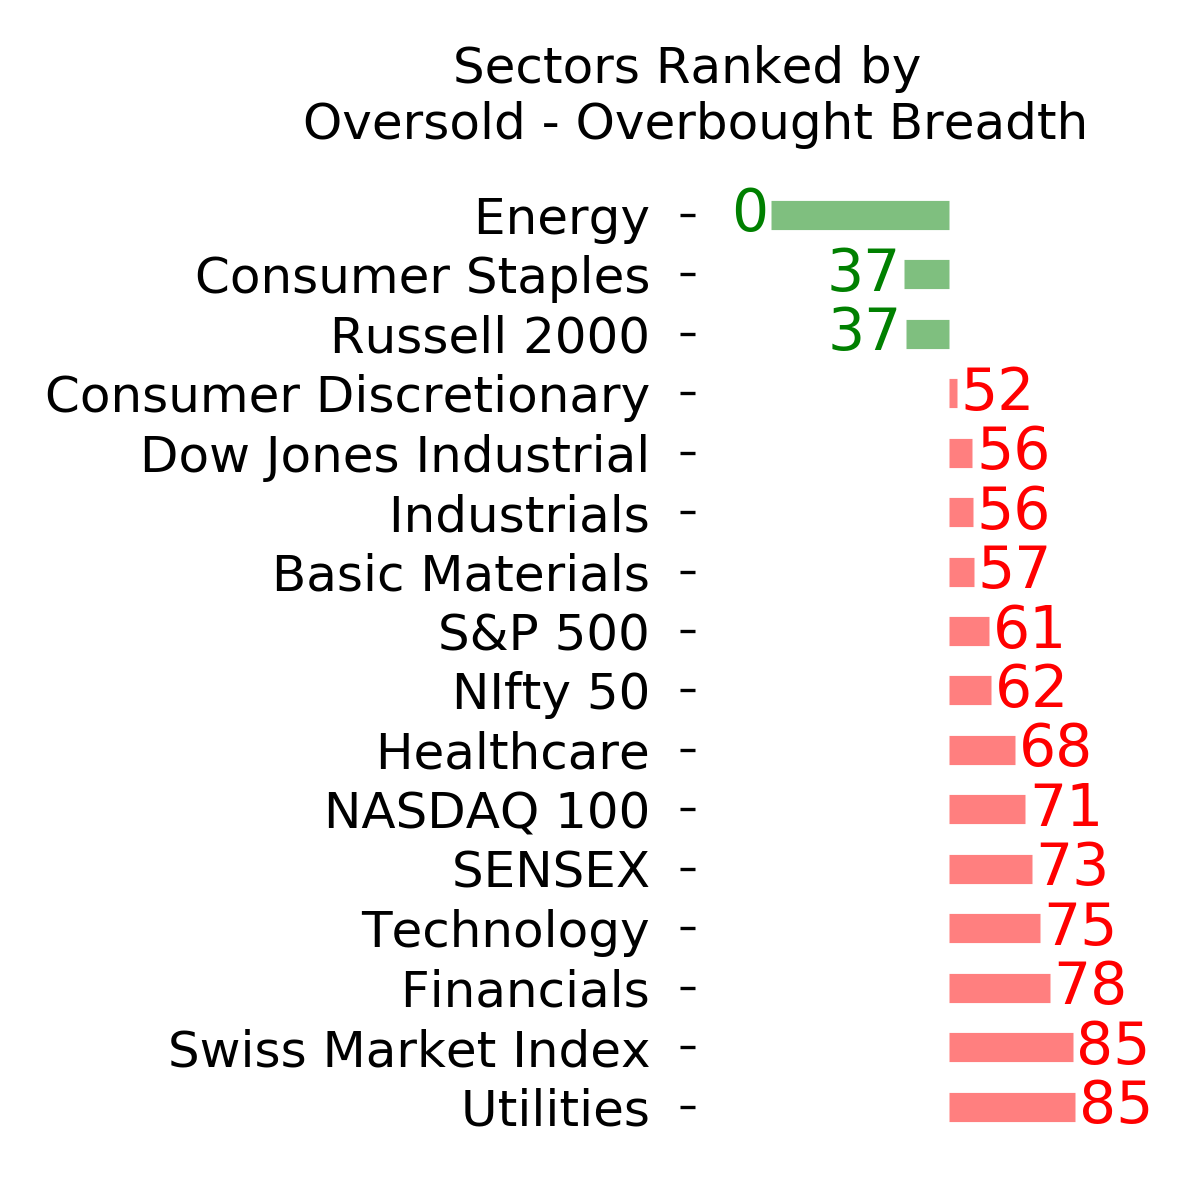
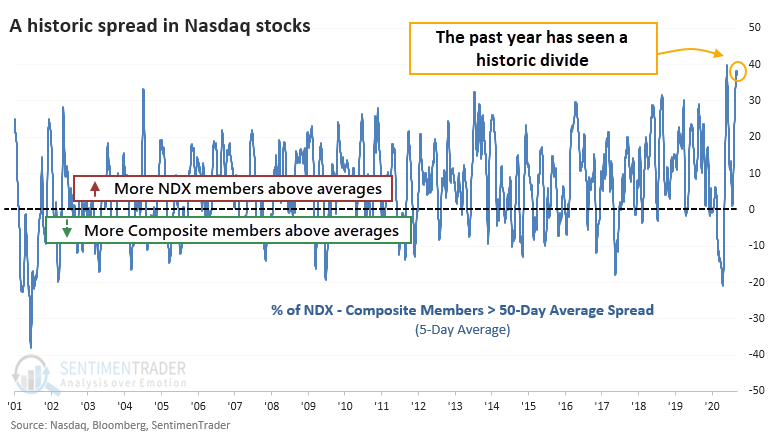
NEAR-RECORD SPREAD IN BREADTH
The 5-day average of the spread in breadth between those indexes is now among the widest in 20 years.
After other peaks in the spread, the Nasdaq 100 suffered some short-term pain but recovered nicely longer-term.
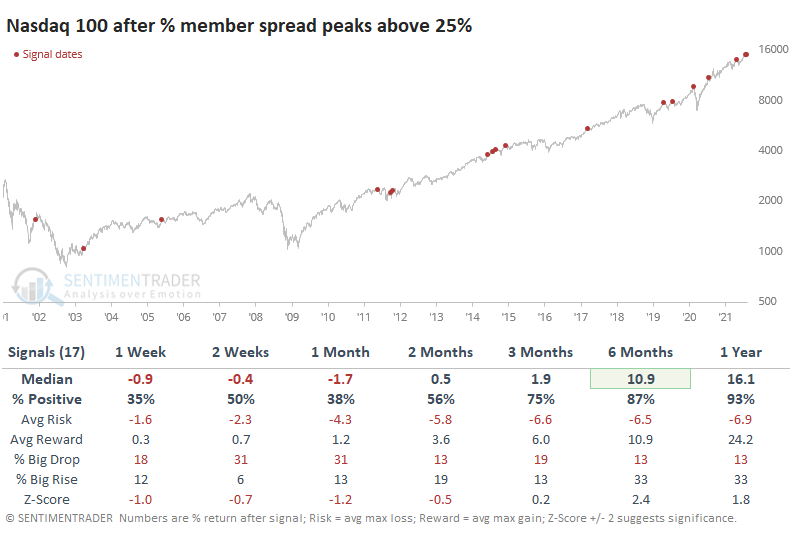
The same goes for the Composite.
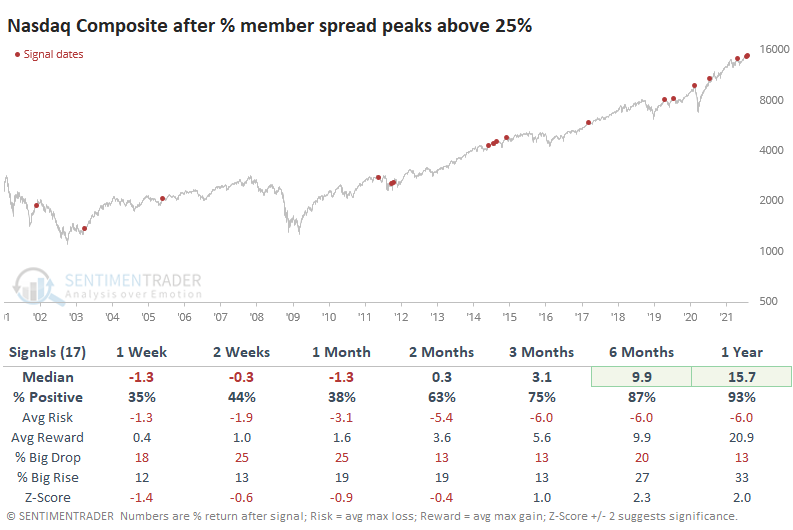
Like the Nasdaq 100, the Composite tended to show weak returns in the short-term but strong long-term returns thanks to the dominant bull market during most of the study period.
A BLOW-OFF SIGNAL
Looking at the ratio between them, these extremes in the medium-term trends tended to coincide with shorter-term blowoff peaks in the Nasdaq 100 to Nasdaq Composite ratio.
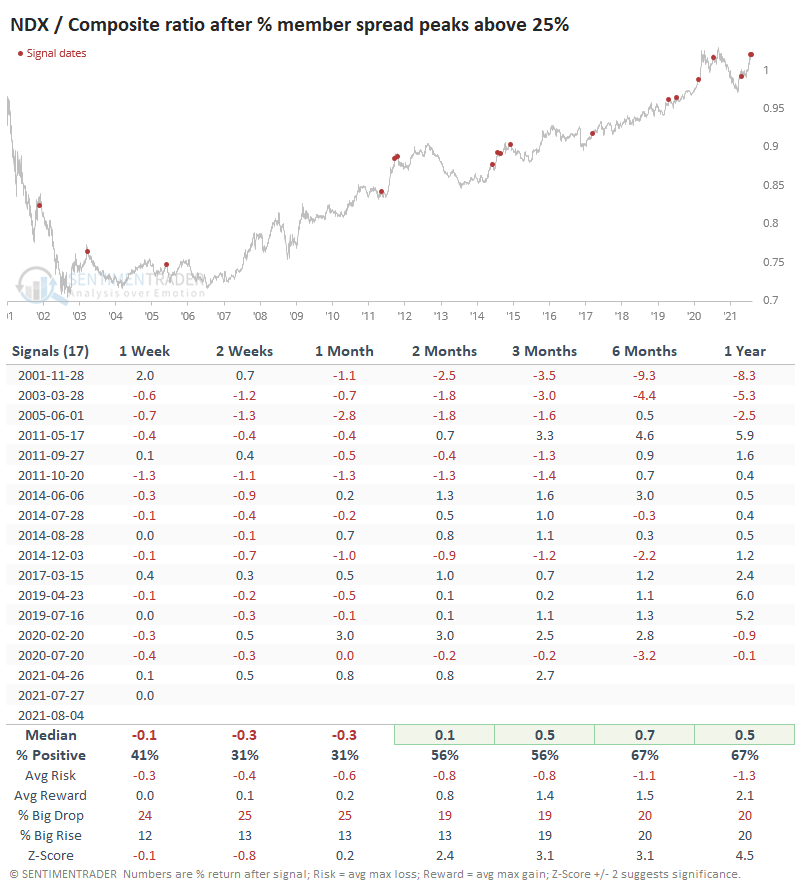
Over the next 2-4 weeks, the Nasdaq 100 tended to lag the broader Composite, with more risk and less reward. But, again, because most of the study period was dominated by a roaring bull market for riskier assets, the medium- to long-term trend tended to favor the 100.
If we assume that these spreads coincide with periods of speculative fervor among investors, then when they've triggered while the S&P 500 was at or near a 52-week high at the time, it preceded some shorter-term trouble. The table below shows returns in the S&P 500 after the same signals but filters out the few signals that triggered when the S&P was not at or near a 52-week high.
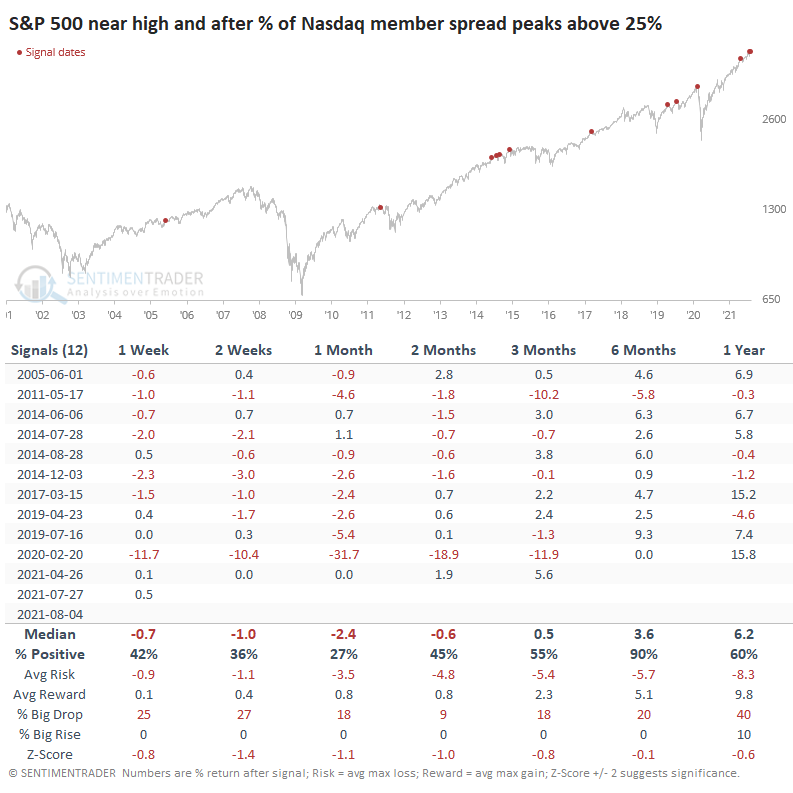
Over the next month, the S&P managed to show a positive return after only 3 of the 12 signals, and 2 of those were just barely. The other one quickly turned into a loss. The S&P's returns across all time frames were below average, with a poor risk/reward ratio.
Most of the losses were relatively tame, with the biggest exception being the one that triggered near the peak before the pandemic. The persistency of the price trend in 2021 is nearing all-time great status, and trends like that usually don't just collapse. An exogenous event can do it, but typically they meander along until deterioration under the surface gets to be too much for the index itself to maintain. There are some signs of that occurring now and have been for weeks, if not months. It's a yellow flag for markets.
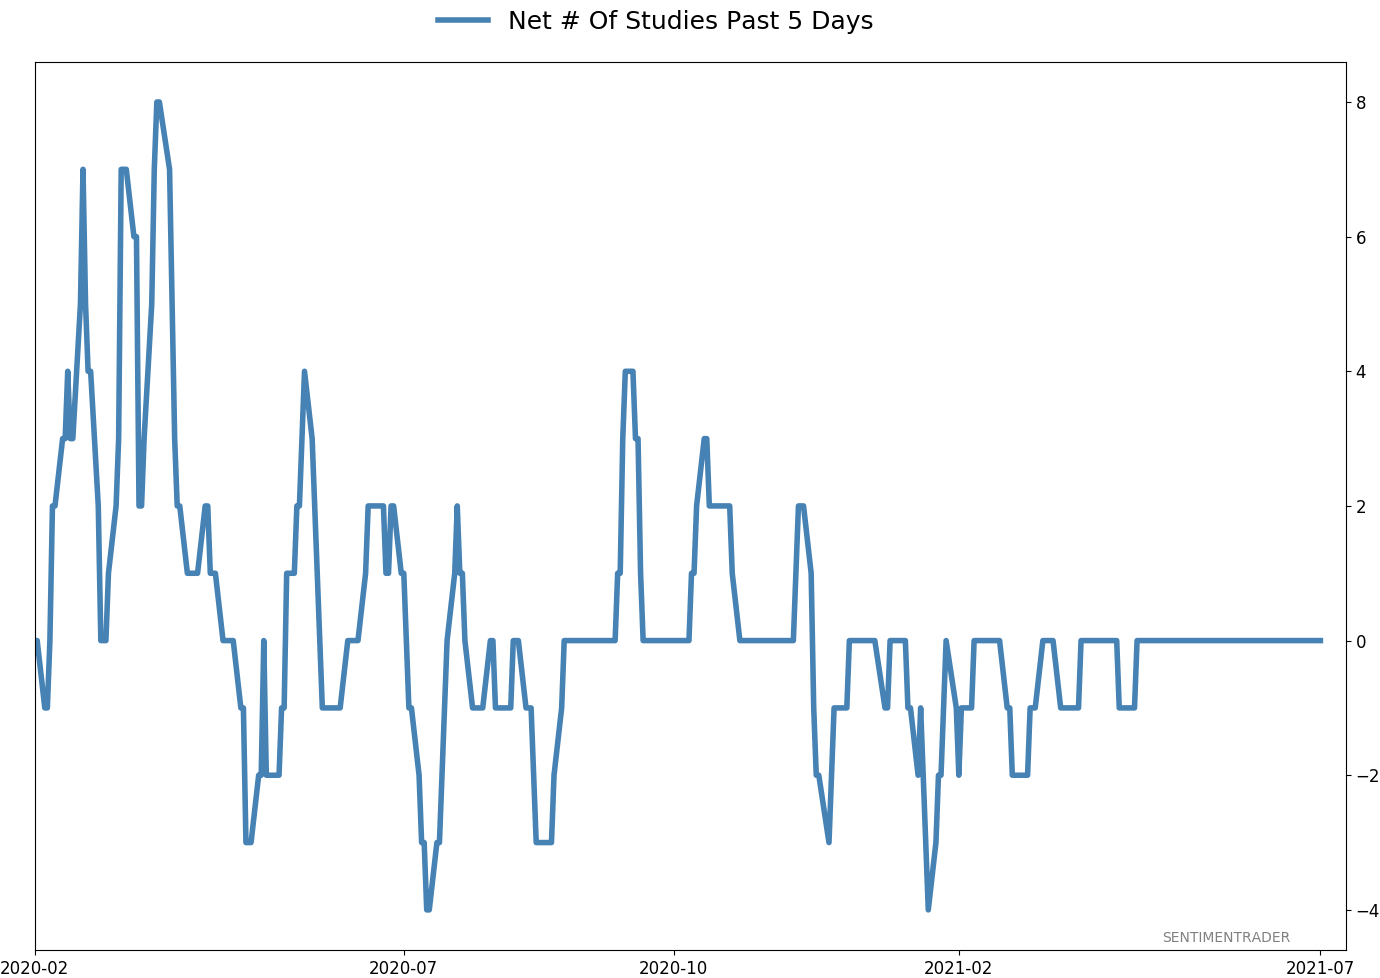
Active Studies
| Time Frame | Bullish | Bearish | | Short-Term | 0 | 4 | | Medium-Term | 4 | 3 | | Long-Term | 10 | 5 |
|
Indicators at Extremes
Portfolio
| Position | Description | Weight % | Added / Reduced | Date | | Stocks | RSP | 4.1 | Added 4.1% | 2021-05-19 | | Bonds | 23.9% BND, 6.9% SCHP | 30.7 | Reduced 7.1% | 2021-05-19 | | Commodities | GCC | 2.6 | Reduced 2.1%
| 2020-09-04 | | Precious Metals | GDX | 5.6 | Reduced 4.2% | 2021-05-19 | | Special Situations | 4.3% XLE, 2.2% PSCE | 7.6 | Reduced 5.6% | 2021-04-22 | | Cash | | 49.4 | | |
|
Updates (Changes made today are underlined)
Much of our momentum and trend work has remained positive for several months, with some scattered exceptions. Almost all sentiment-related work has shown a poor risk/reward ratio for stocks, especially as speculation drove to record highs in exuberance in February. Much of that has worn off, and most of our models are back toward neutral levels. There isn't much to be excited about here. The same goes for bonds and even gold. Gold has been performing well lately and is back above long-term trend lines. The issue is that it has a poor record of holding onto gains when attempting a long-term trend change like this, so we'll take a wait-and-see approach. RETURN YTD: 8.4% 2020: 8.1%, 2019: 12.6%, 2018: 0.6%, 2017: 3.8%, 2016: 17.1%, 2015: 9.2%, 2014: 14.5%, 2013: 2.2%, 2012: 10.8%, 2011: 16.5%, 2010: 15.3%, 2009: 23.9%, 2008: 16.2%, 2007: 7.8%
|
|
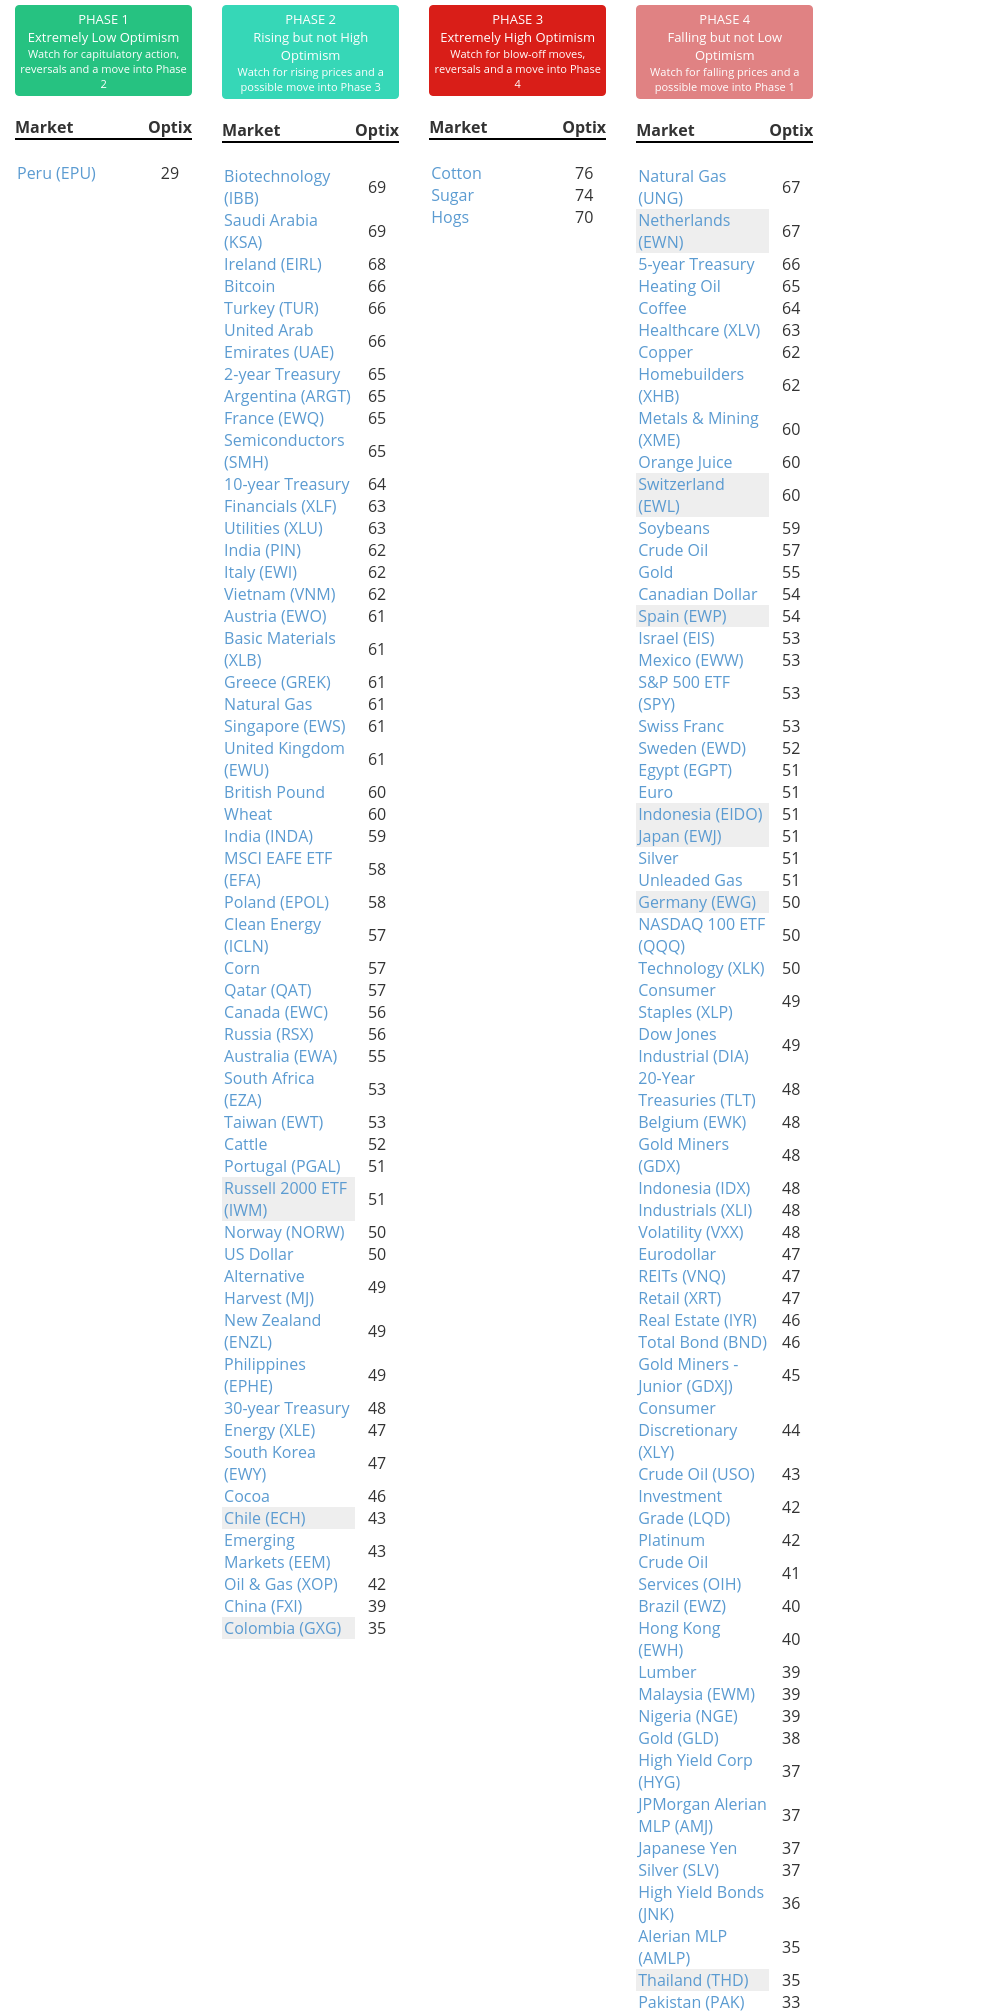
Phase Table
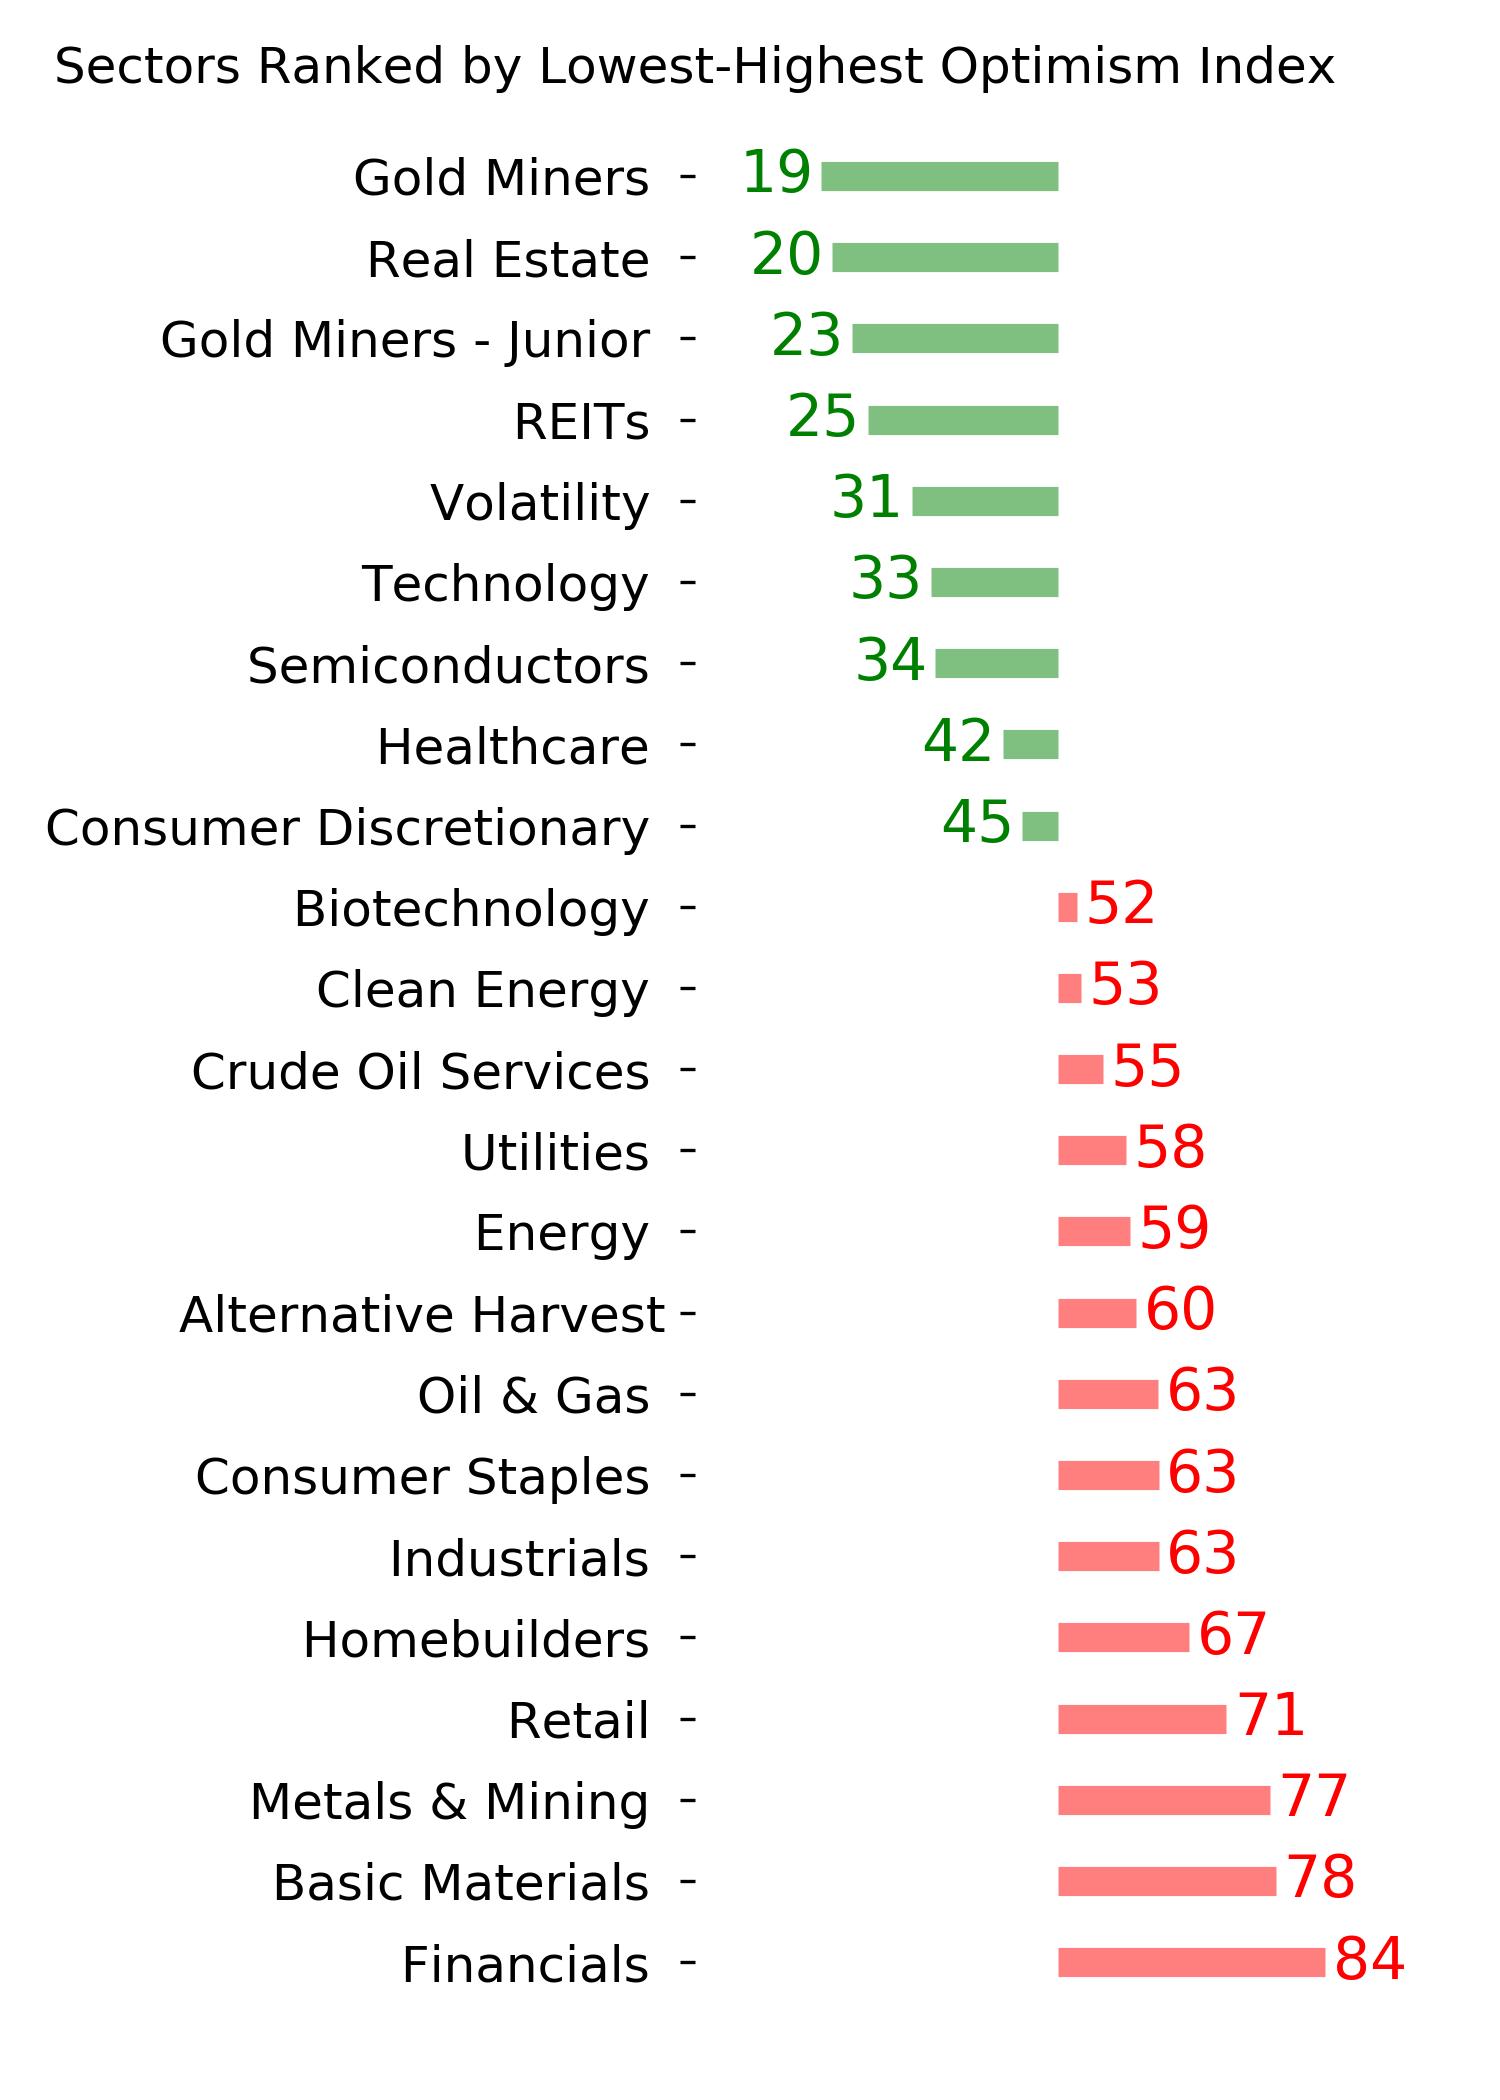
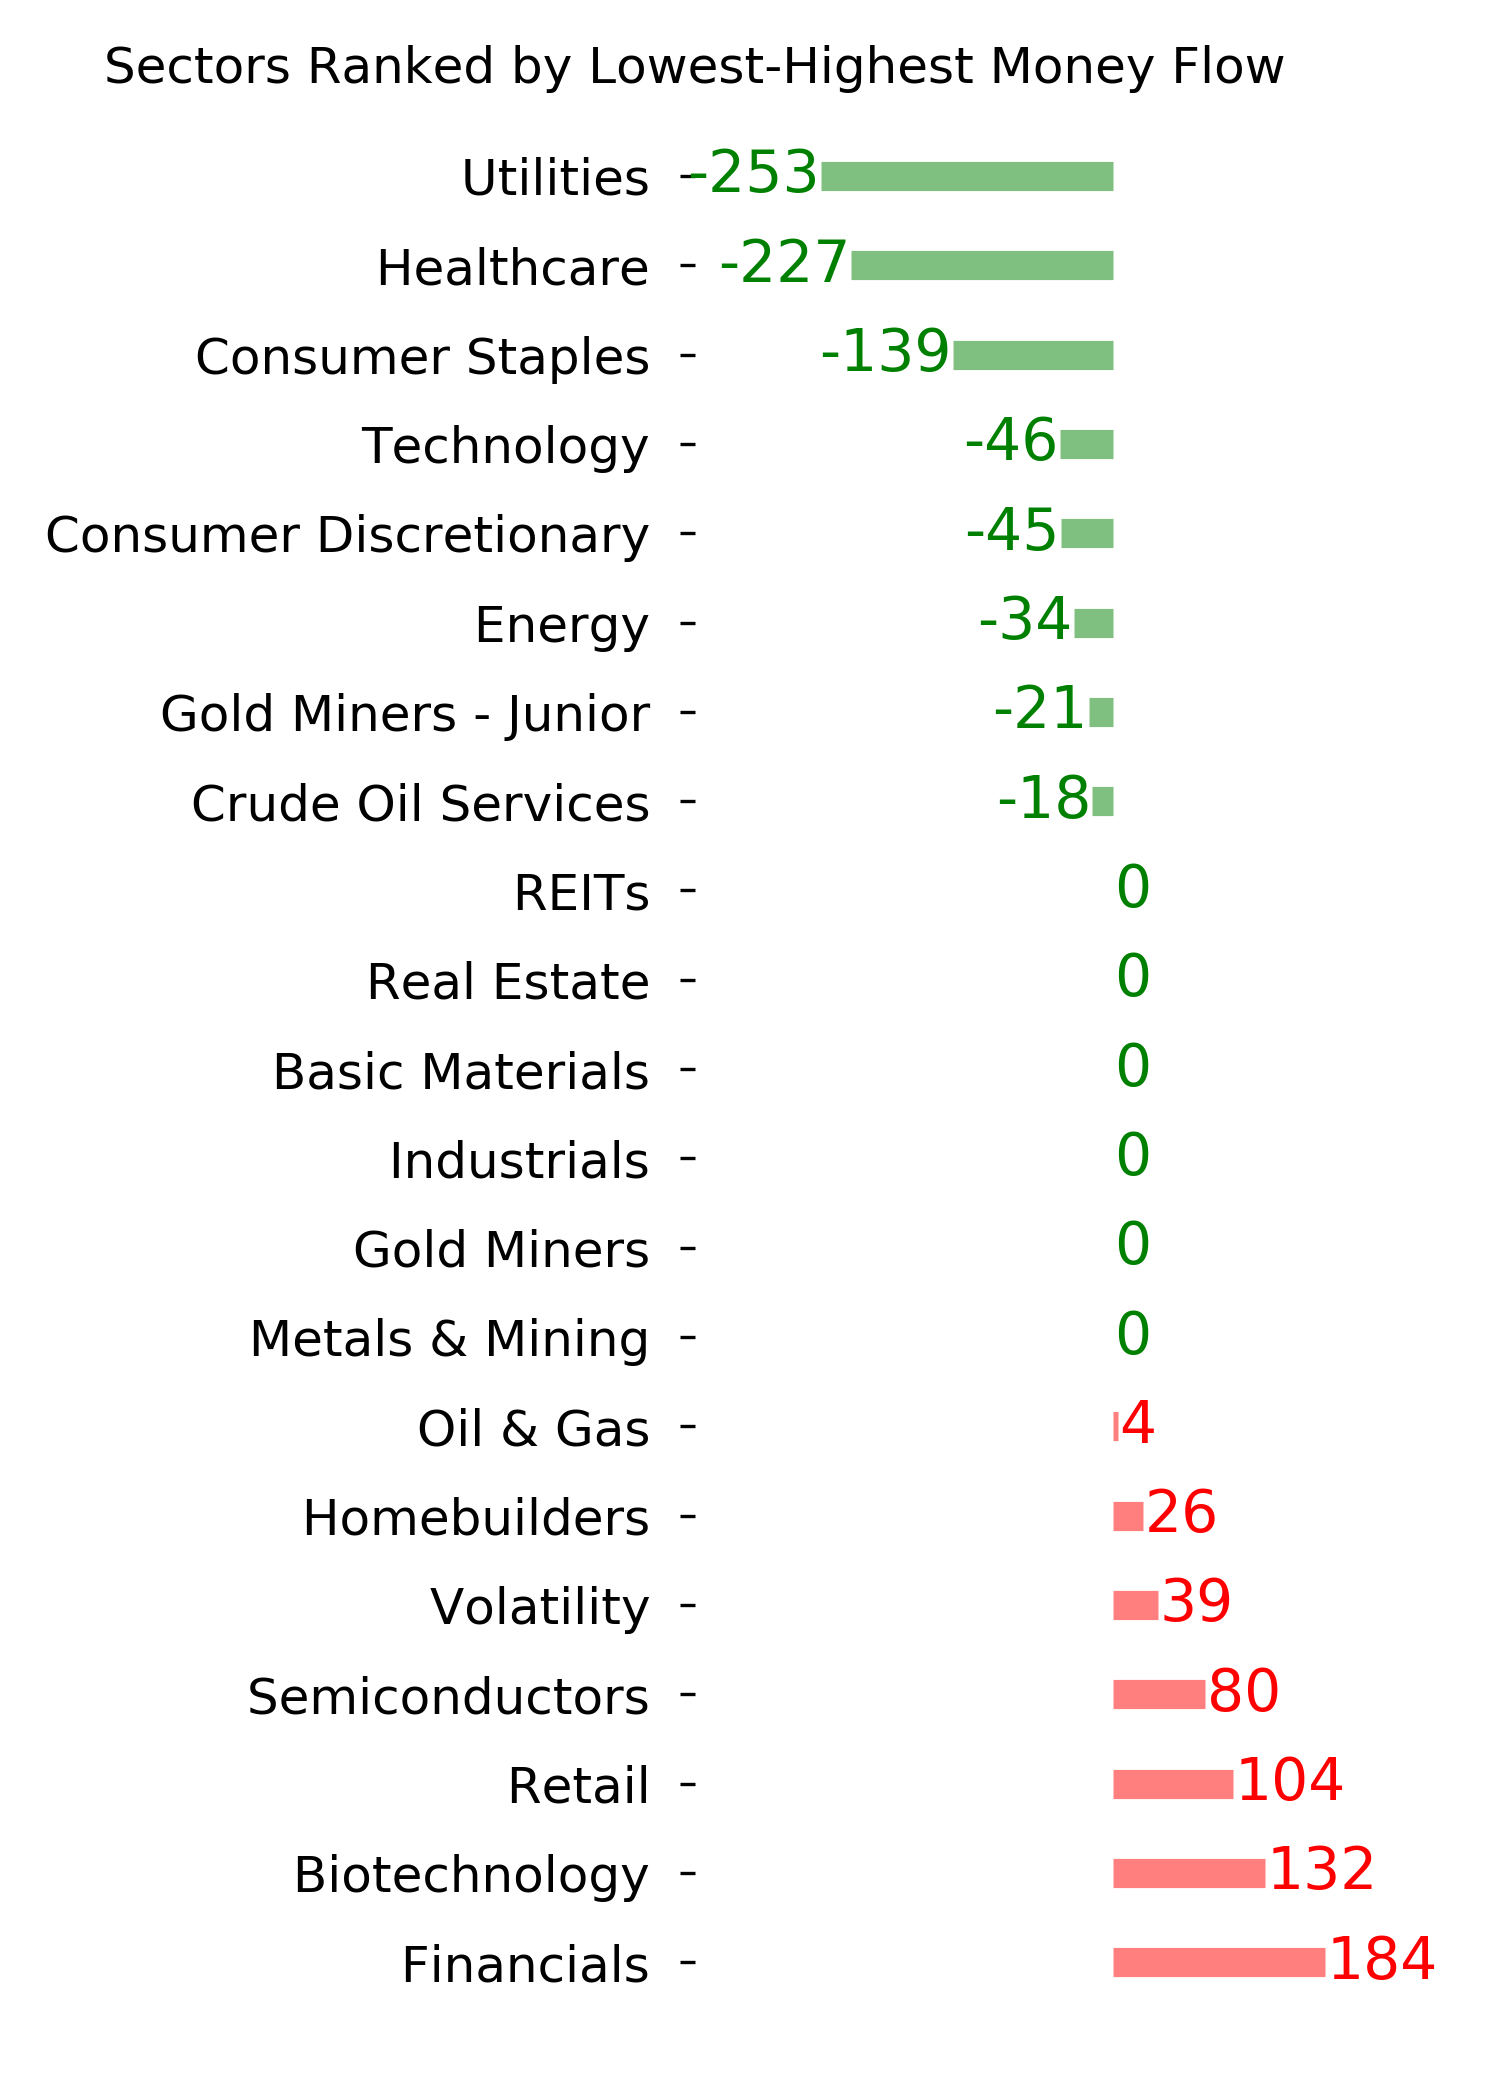
Ranks
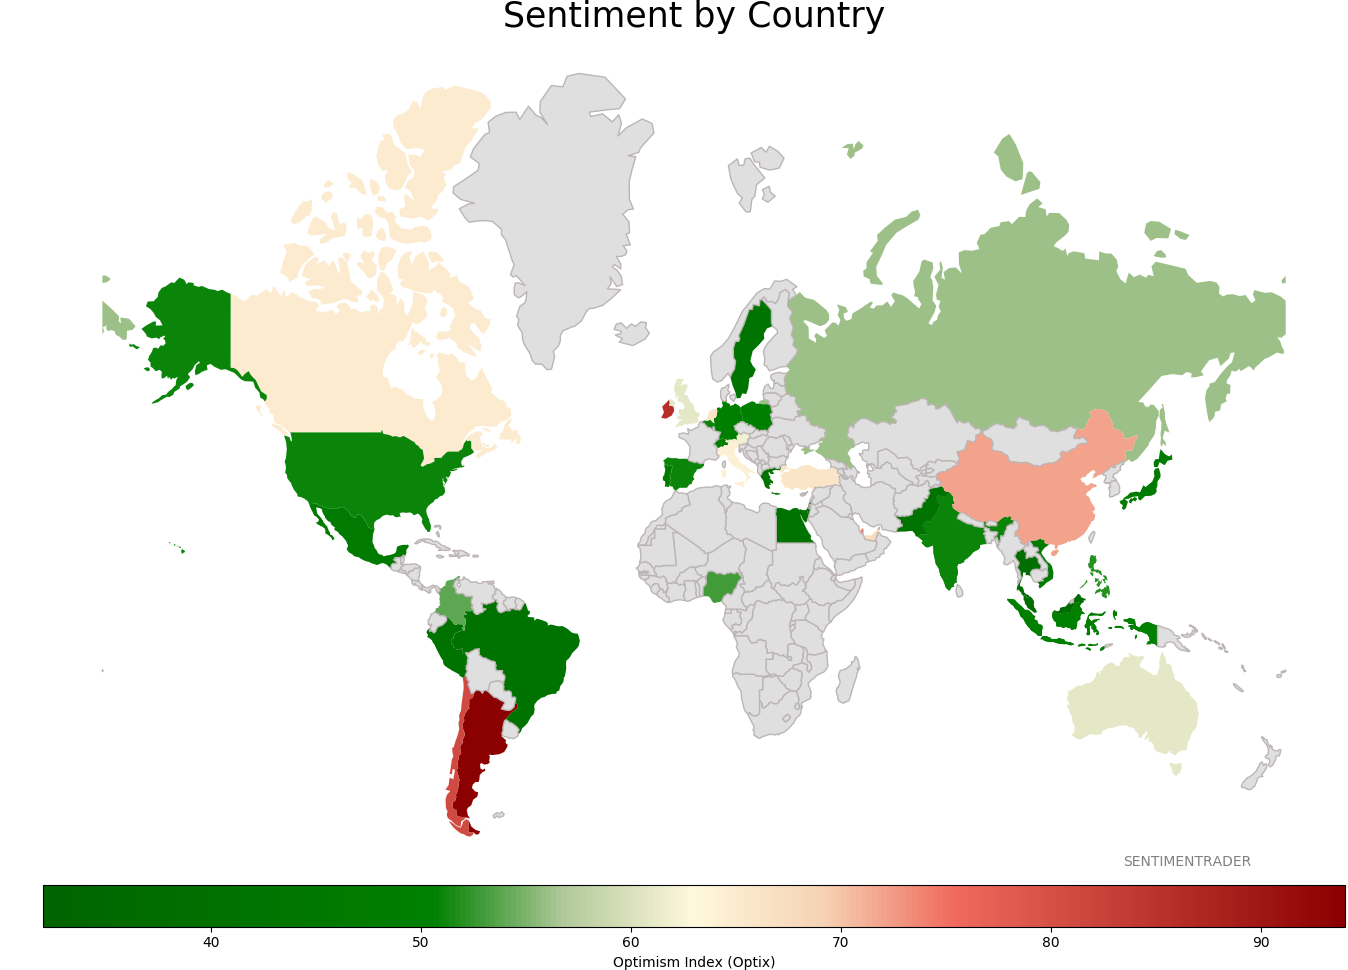
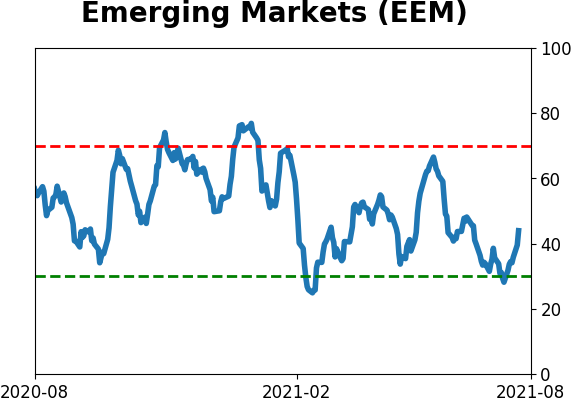
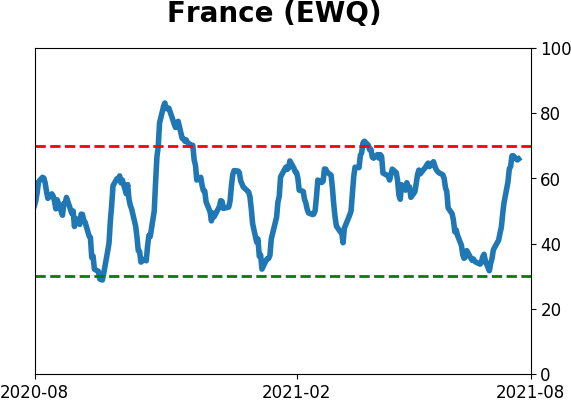
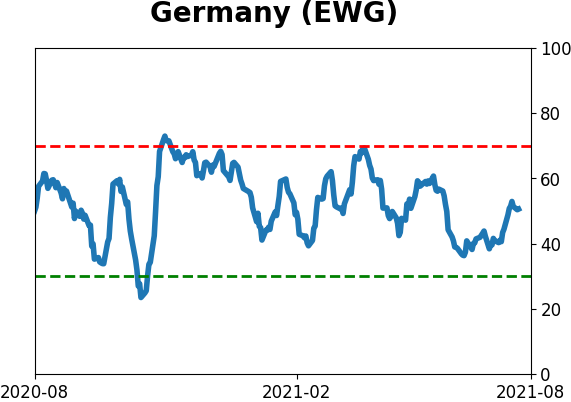
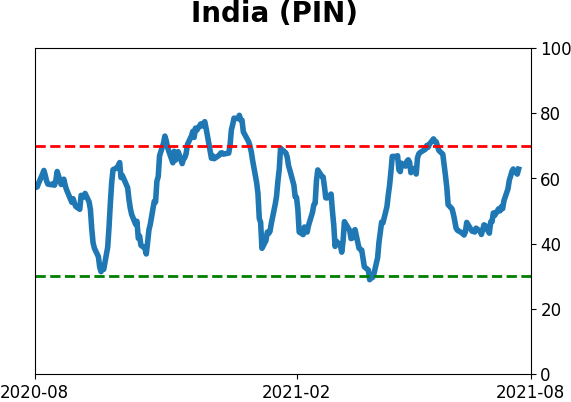
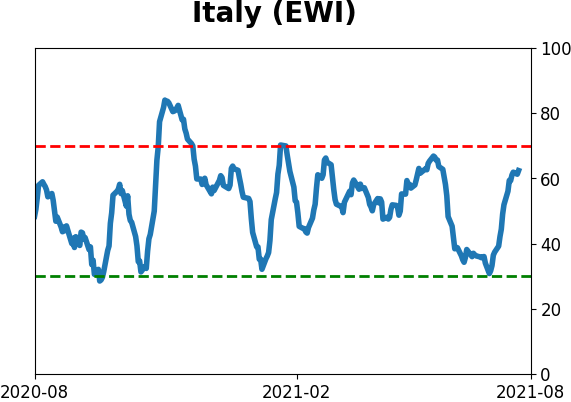
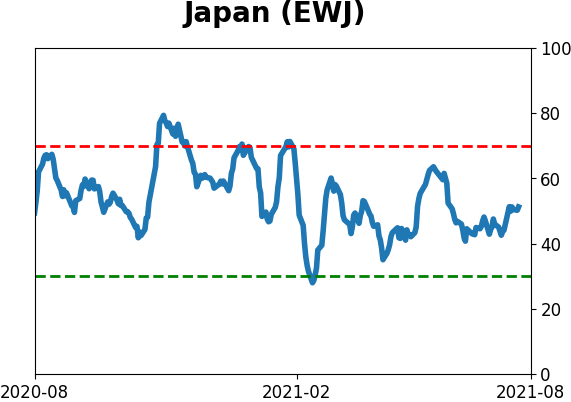
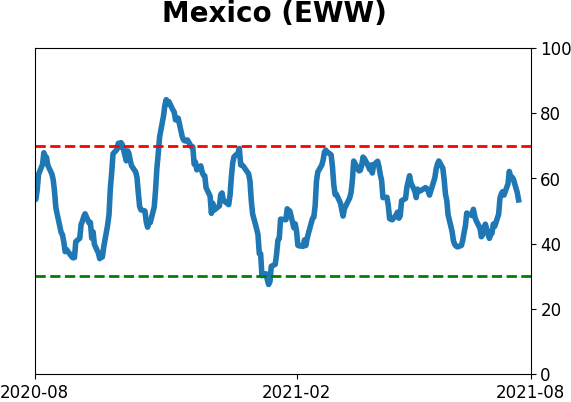
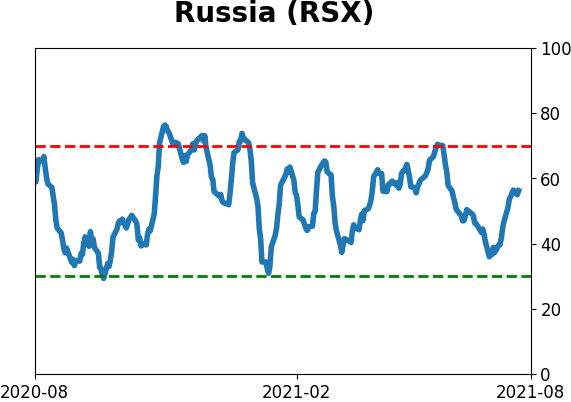
Sentiment Around The World
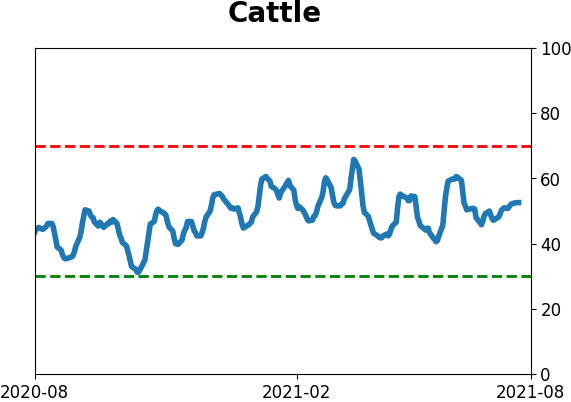
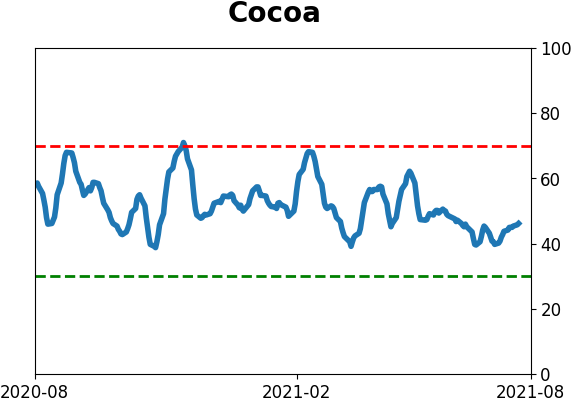
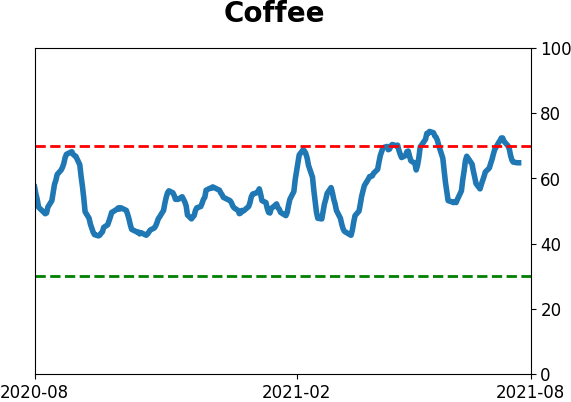
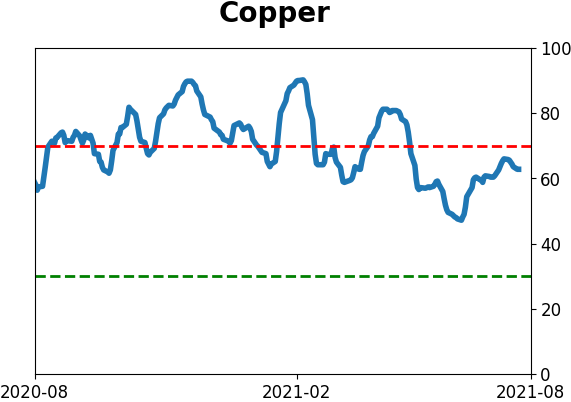
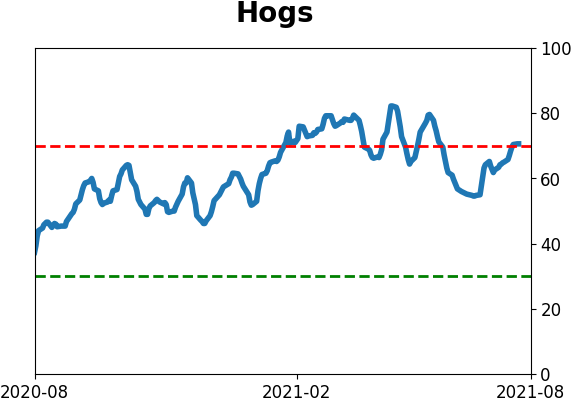
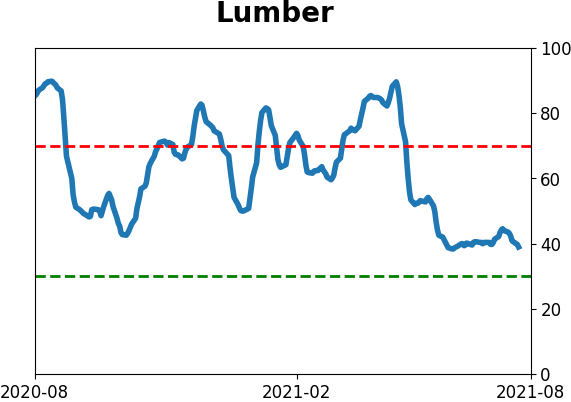
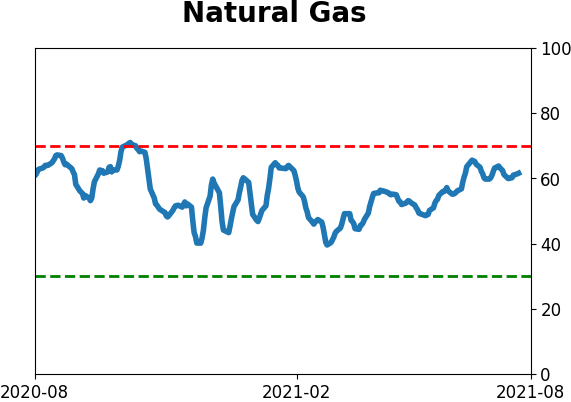
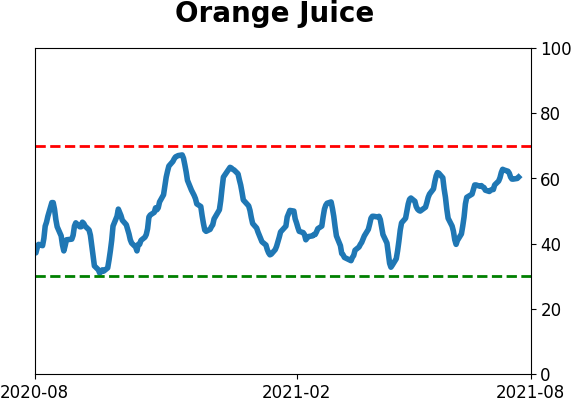
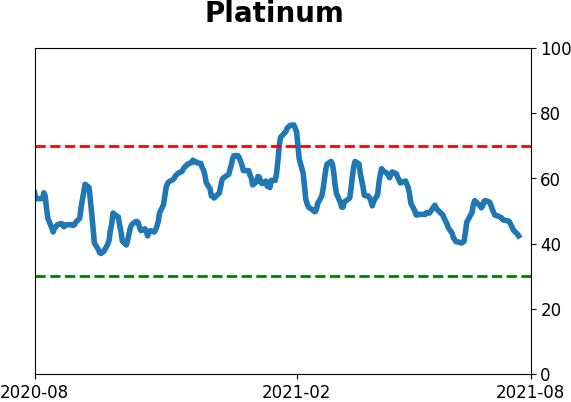
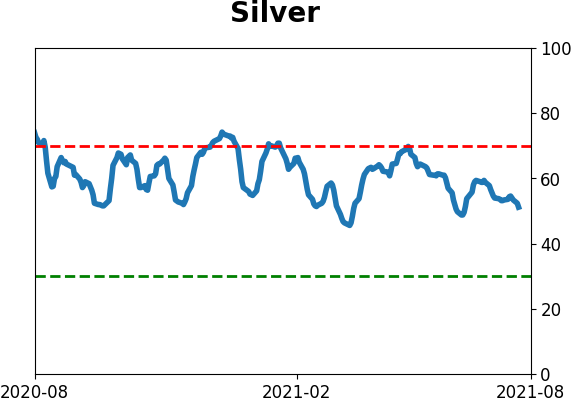
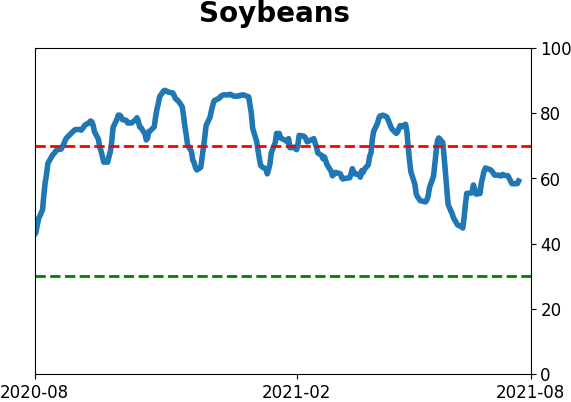
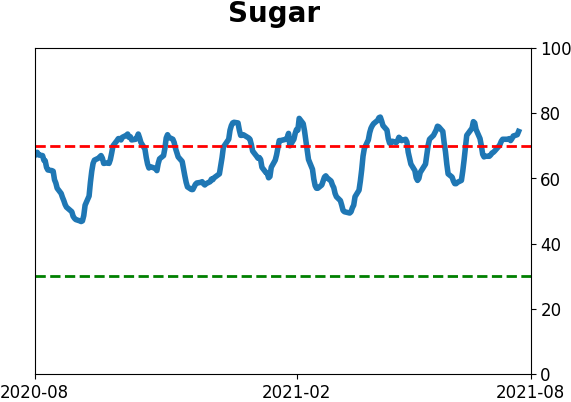
Optimism Index Thumbnails
|
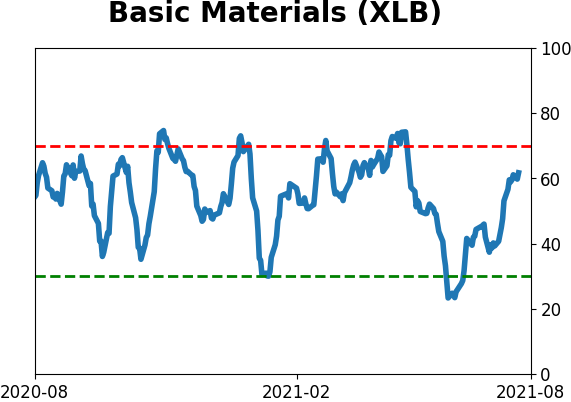
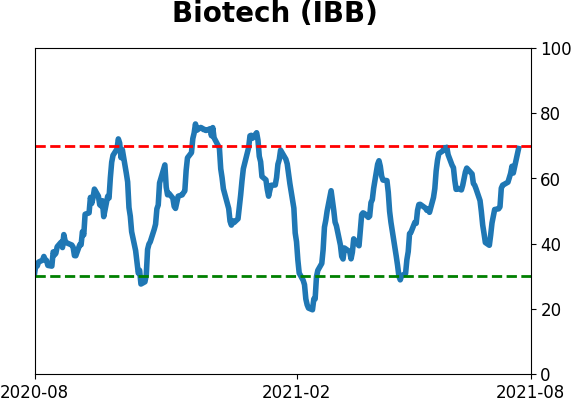
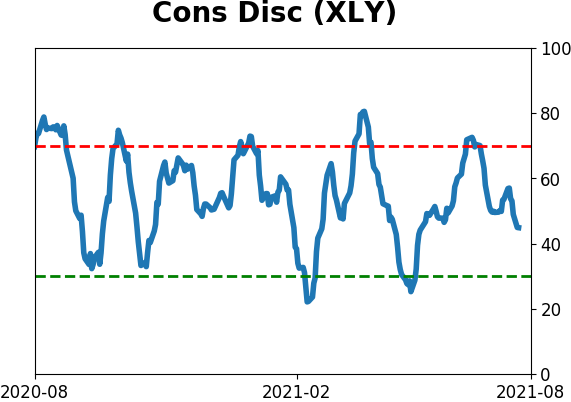
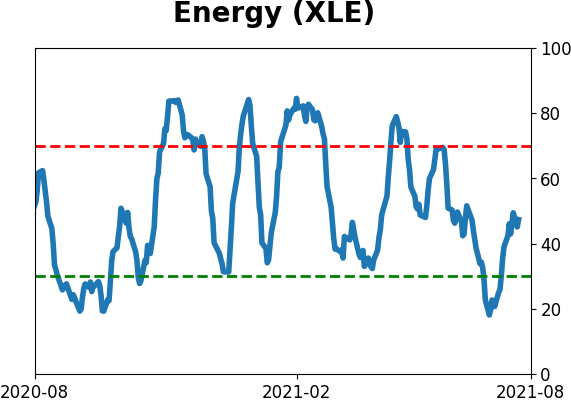
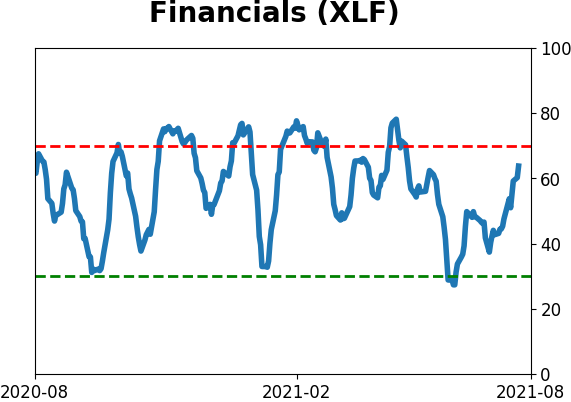
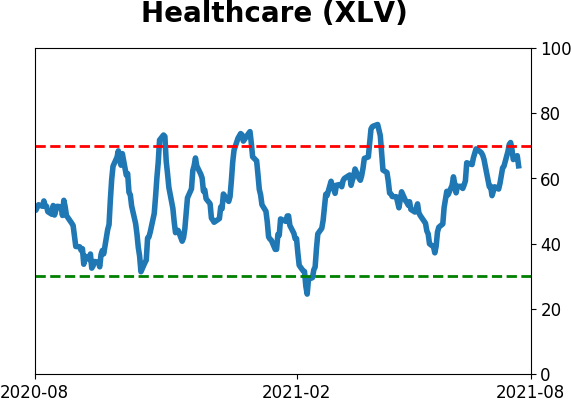
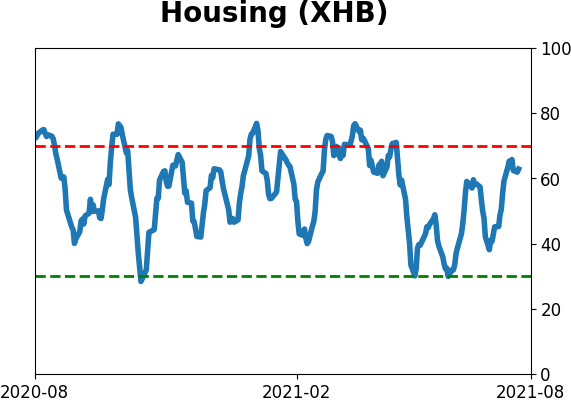
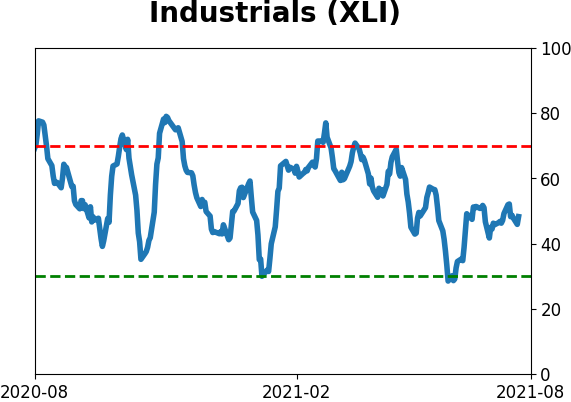
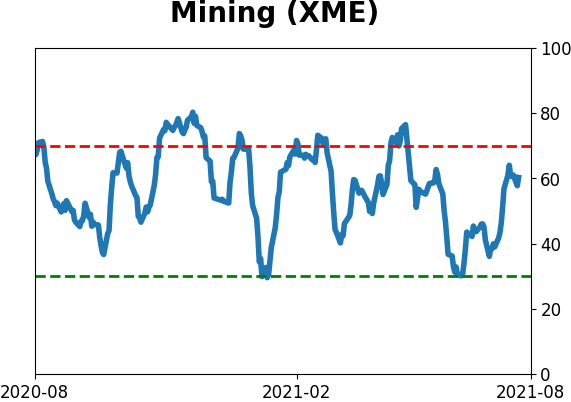
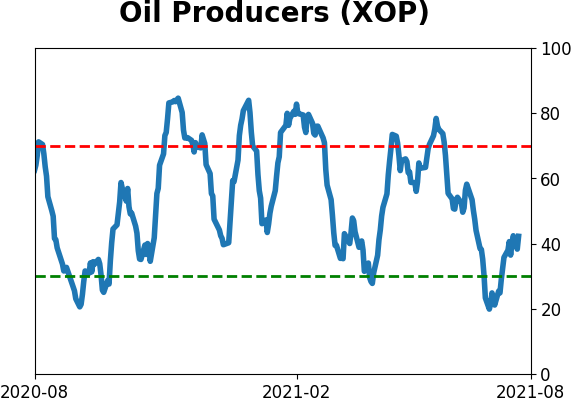
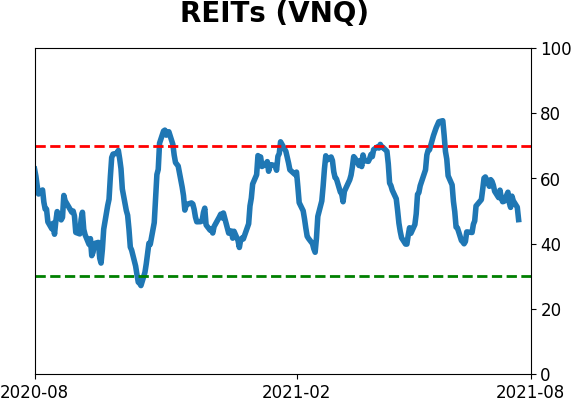
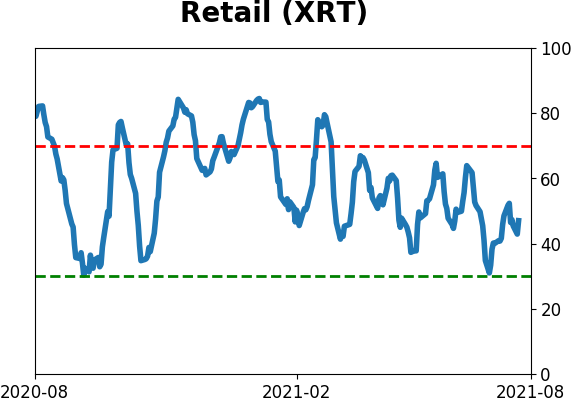
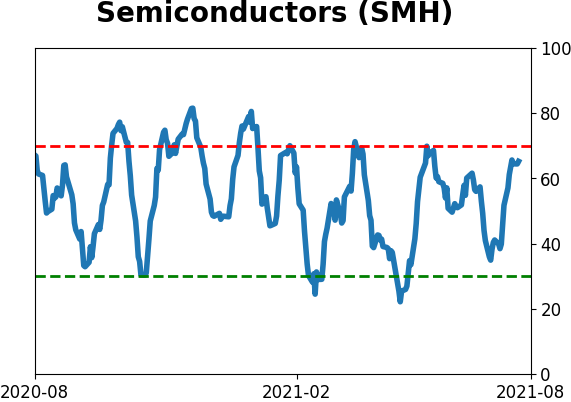
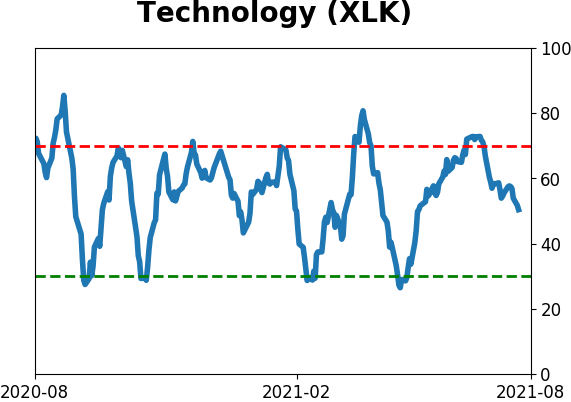
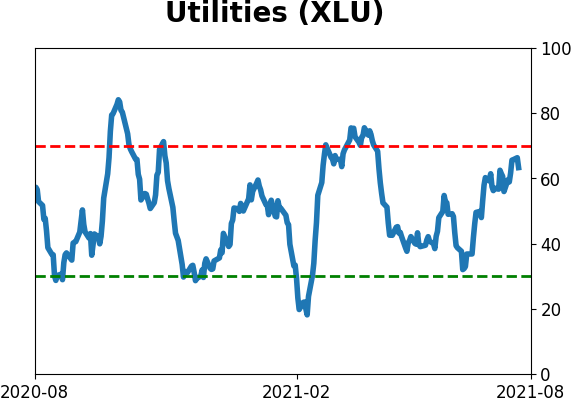
Sector ETF's - 10-Day Moving Average
|
|
|
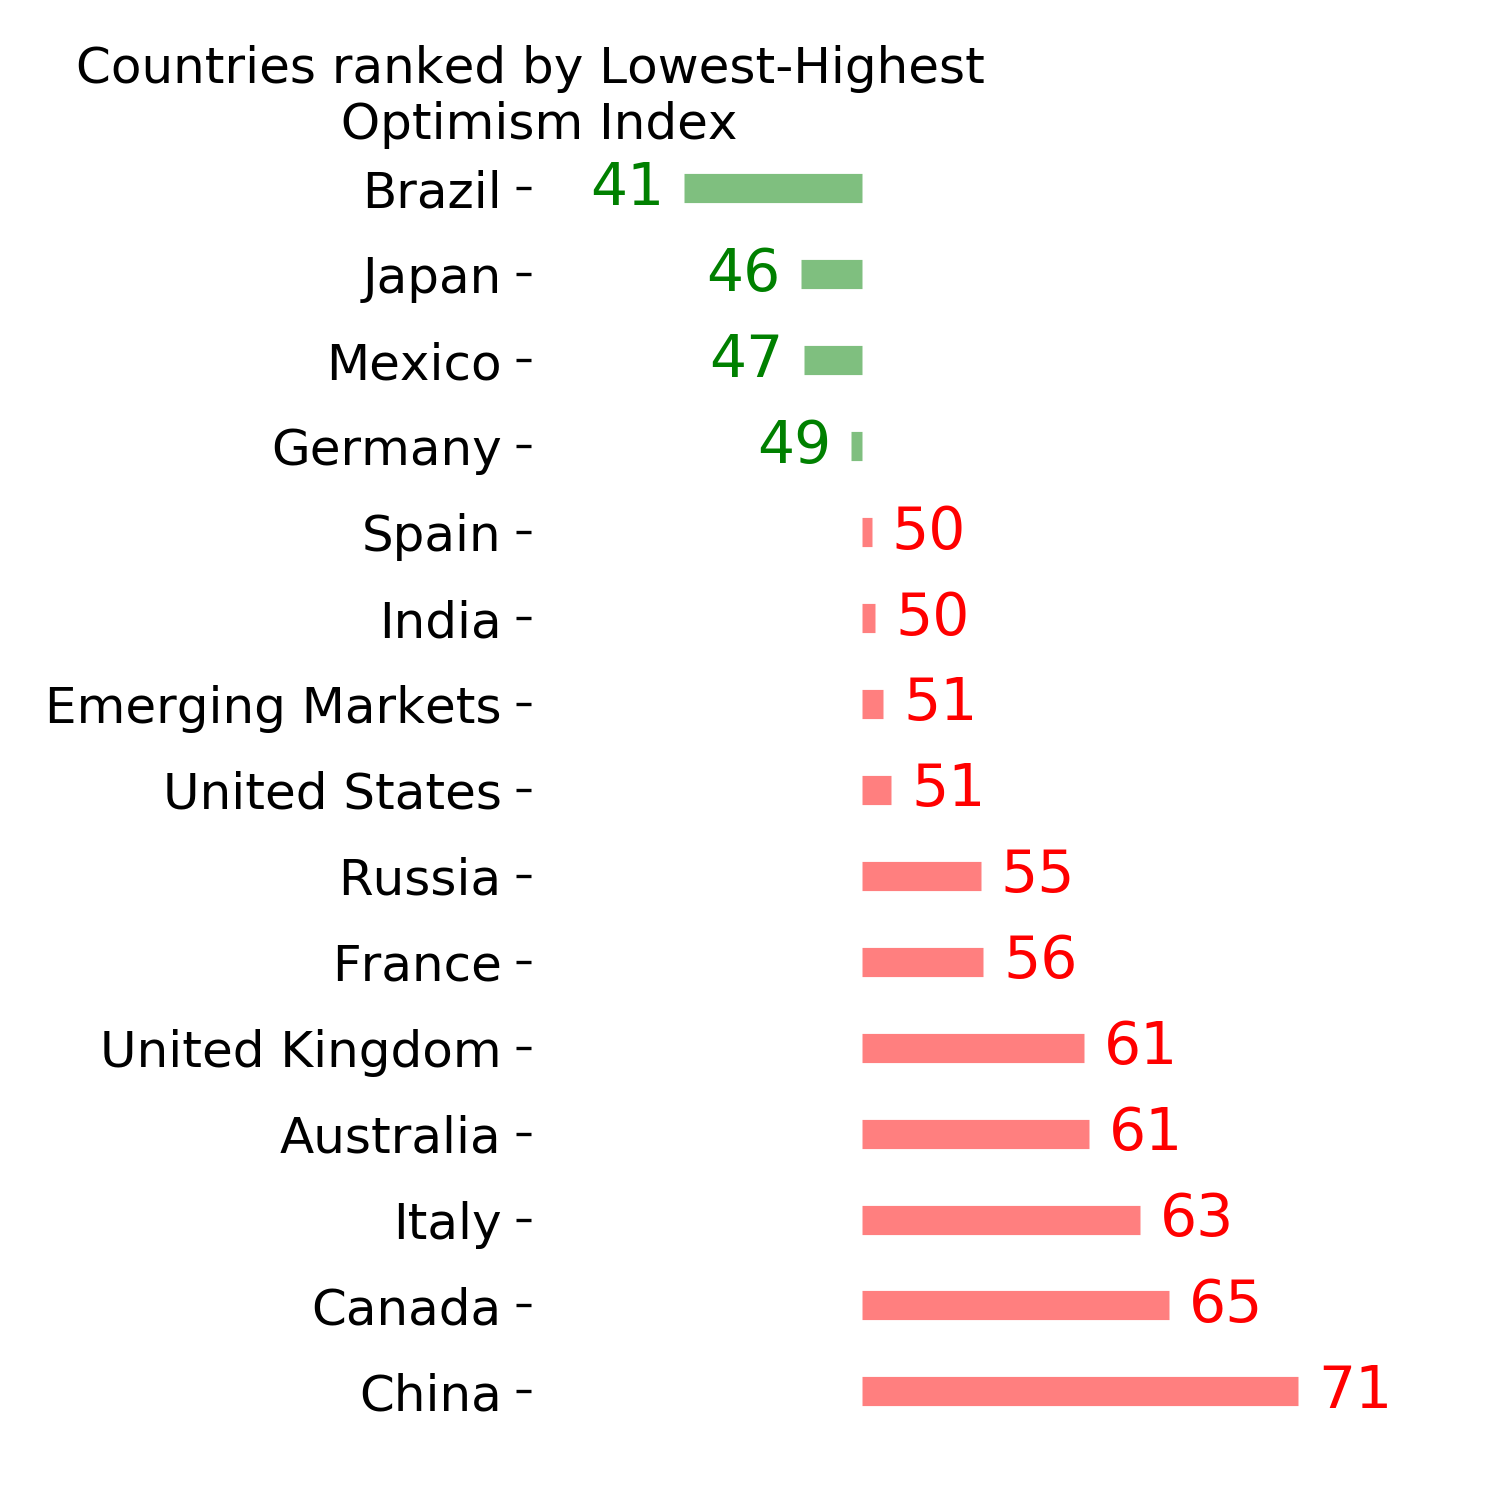
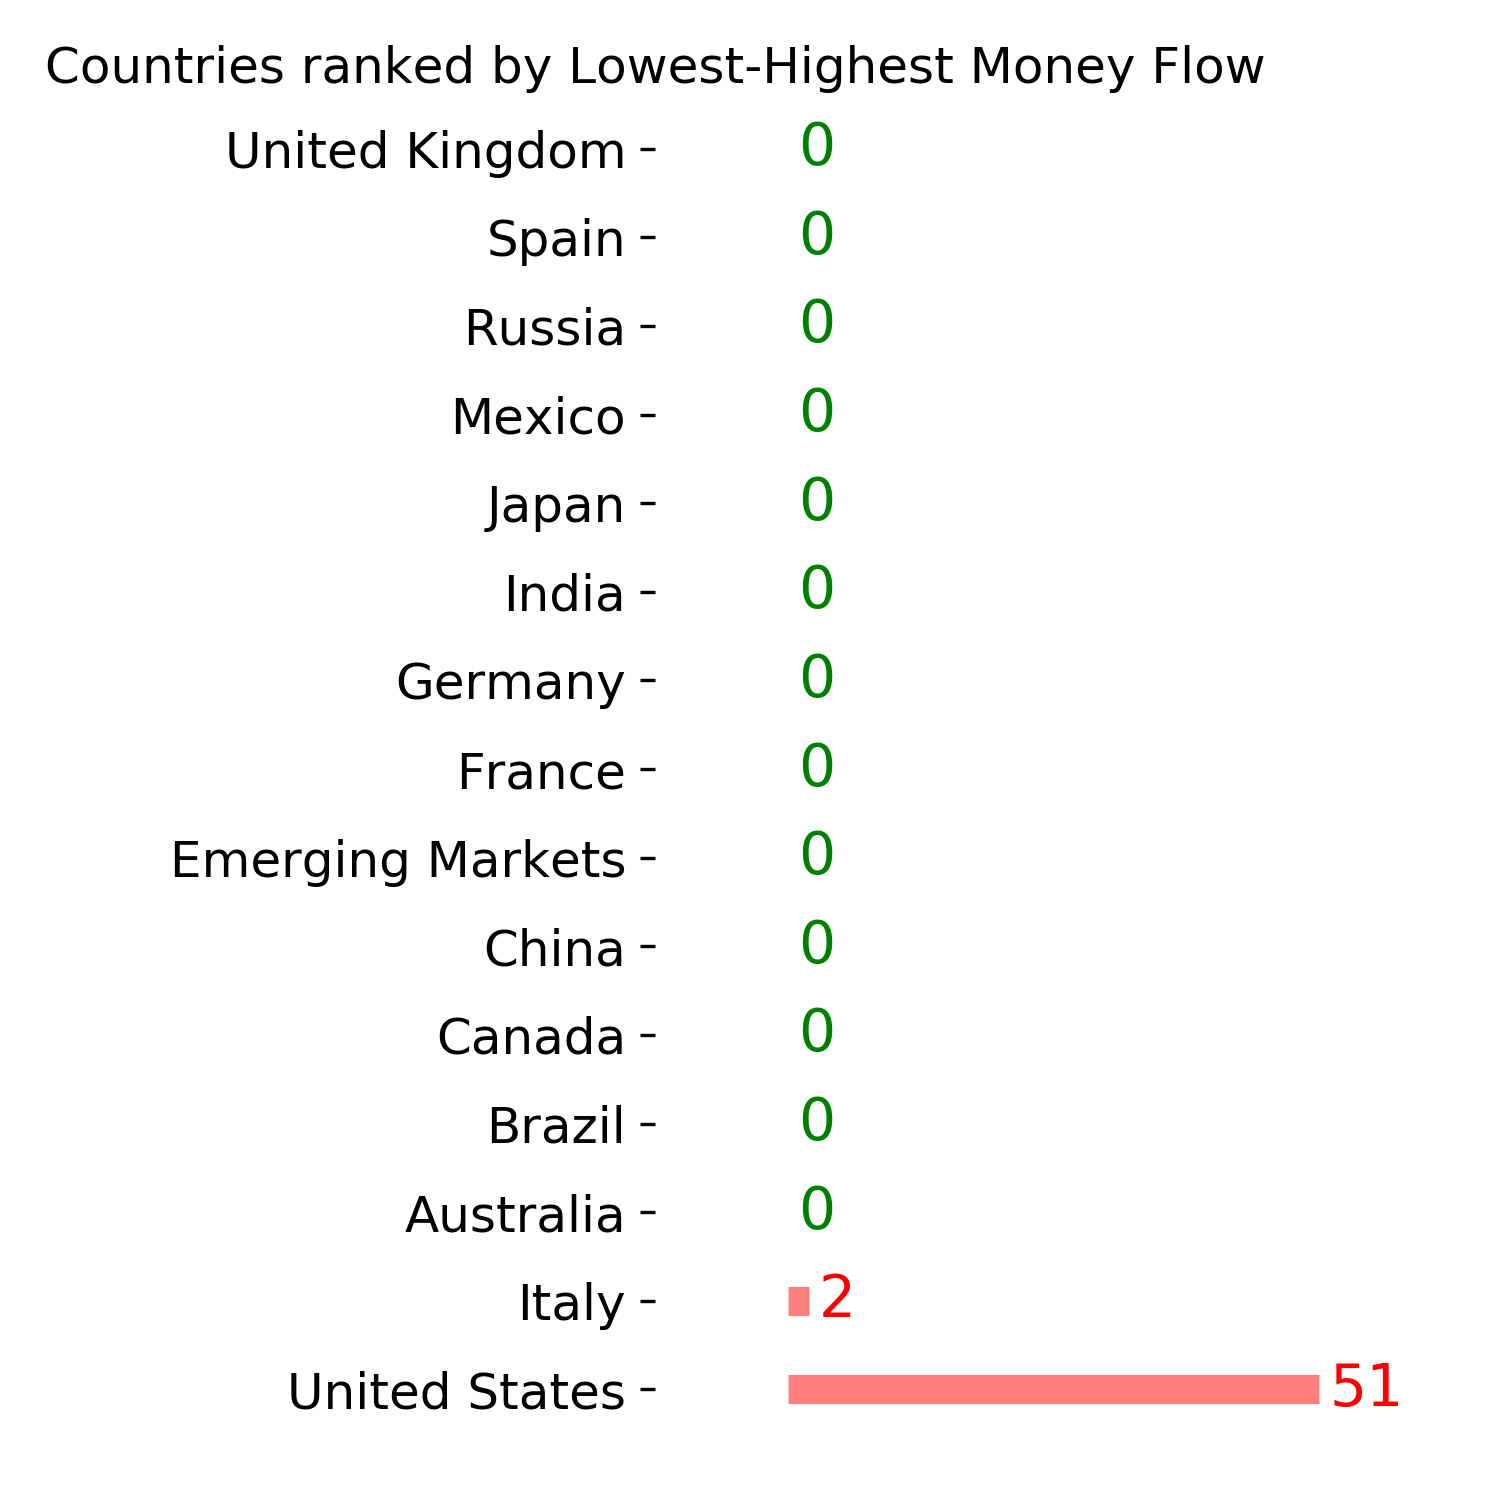
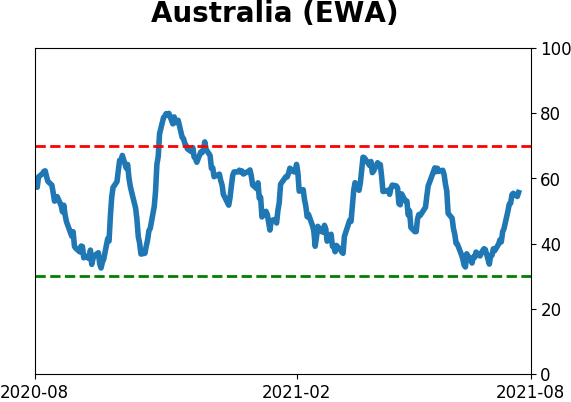
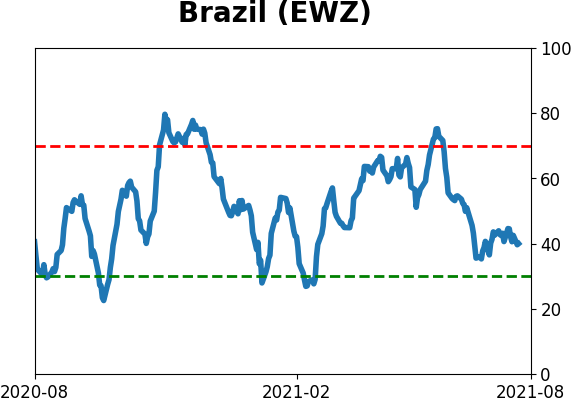
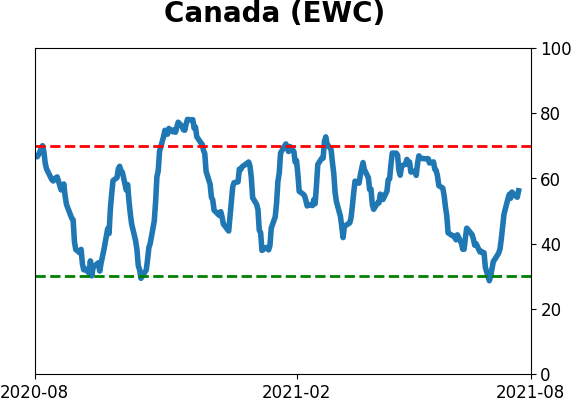
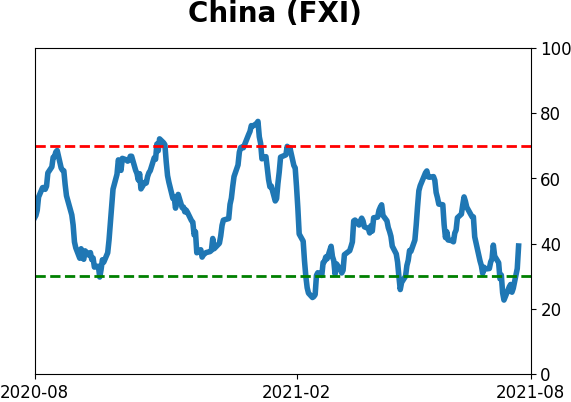
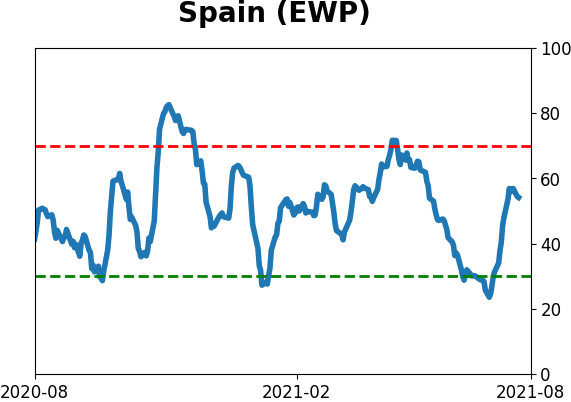
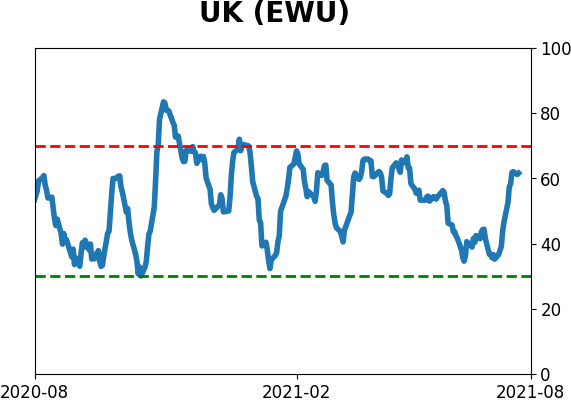
Country ETF's - 10-Day Moving Average
|
|
|
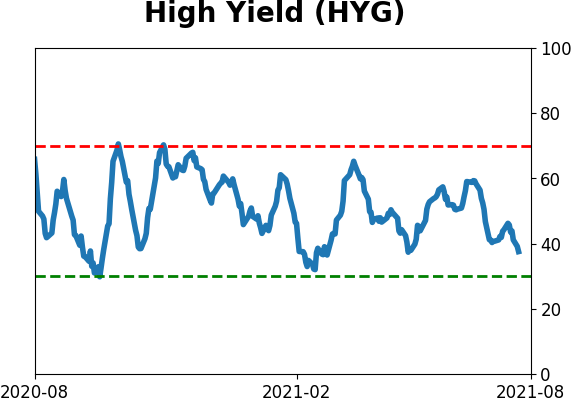
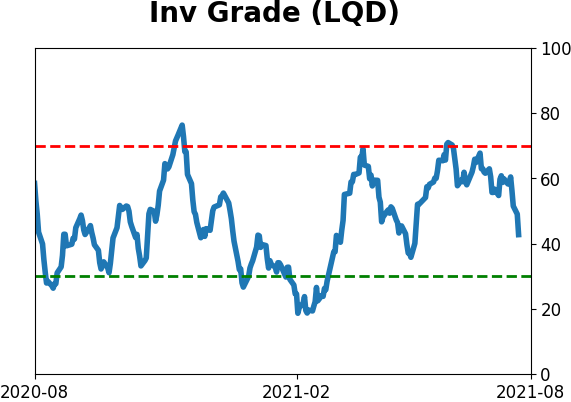
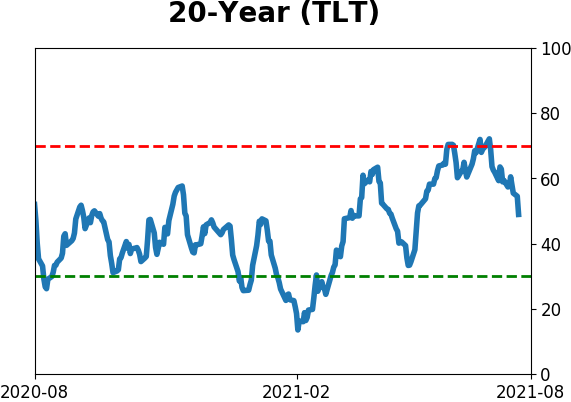
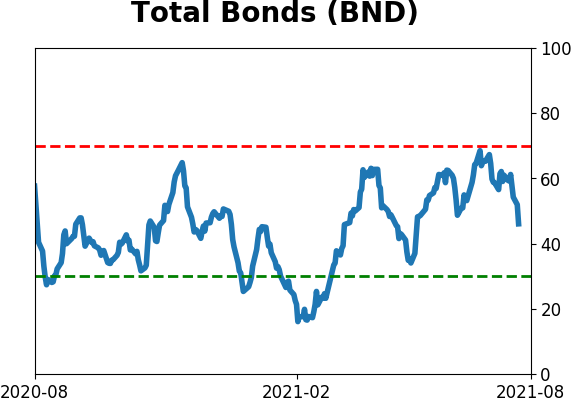
Bond ETF's - 10-Day Moving Average
|
|
|
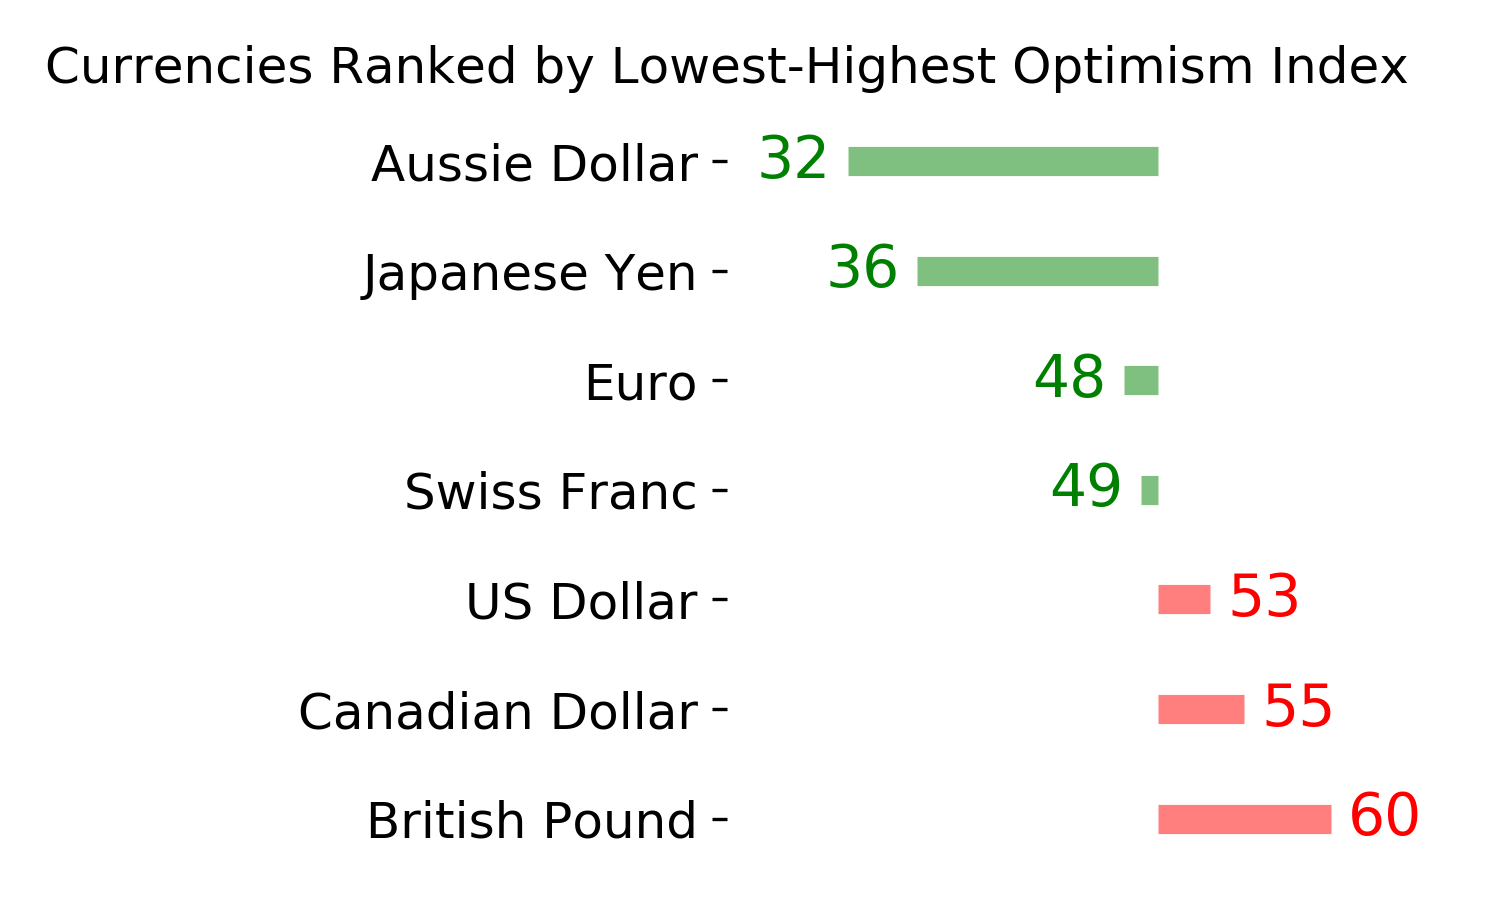
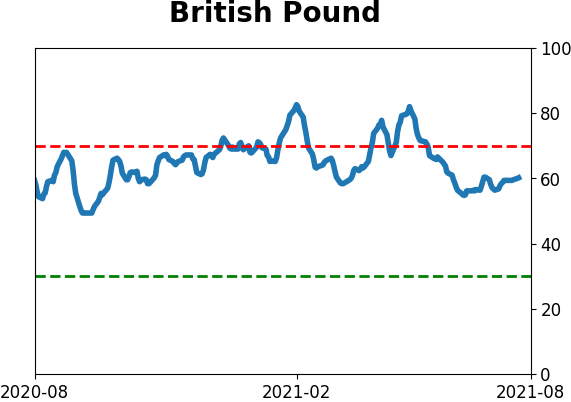
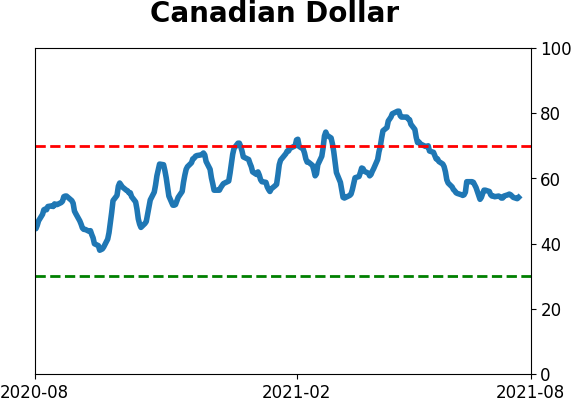
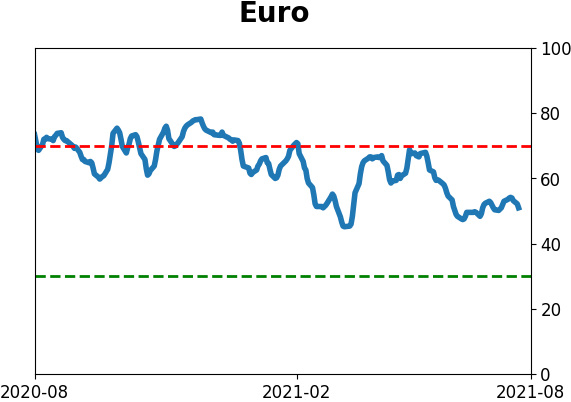
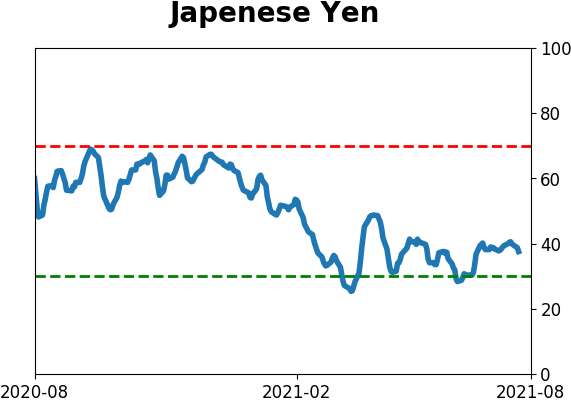
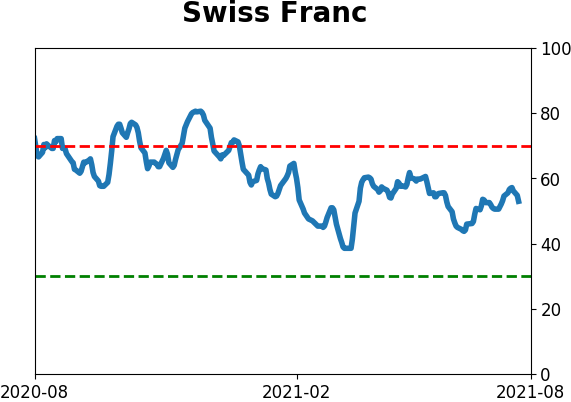
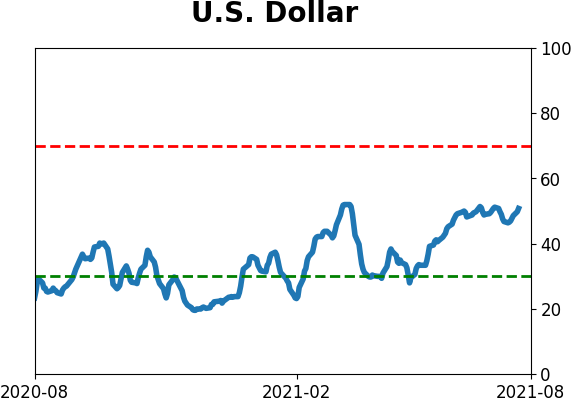
Currency ETF's - 5-Day Moving Average
|
|
|
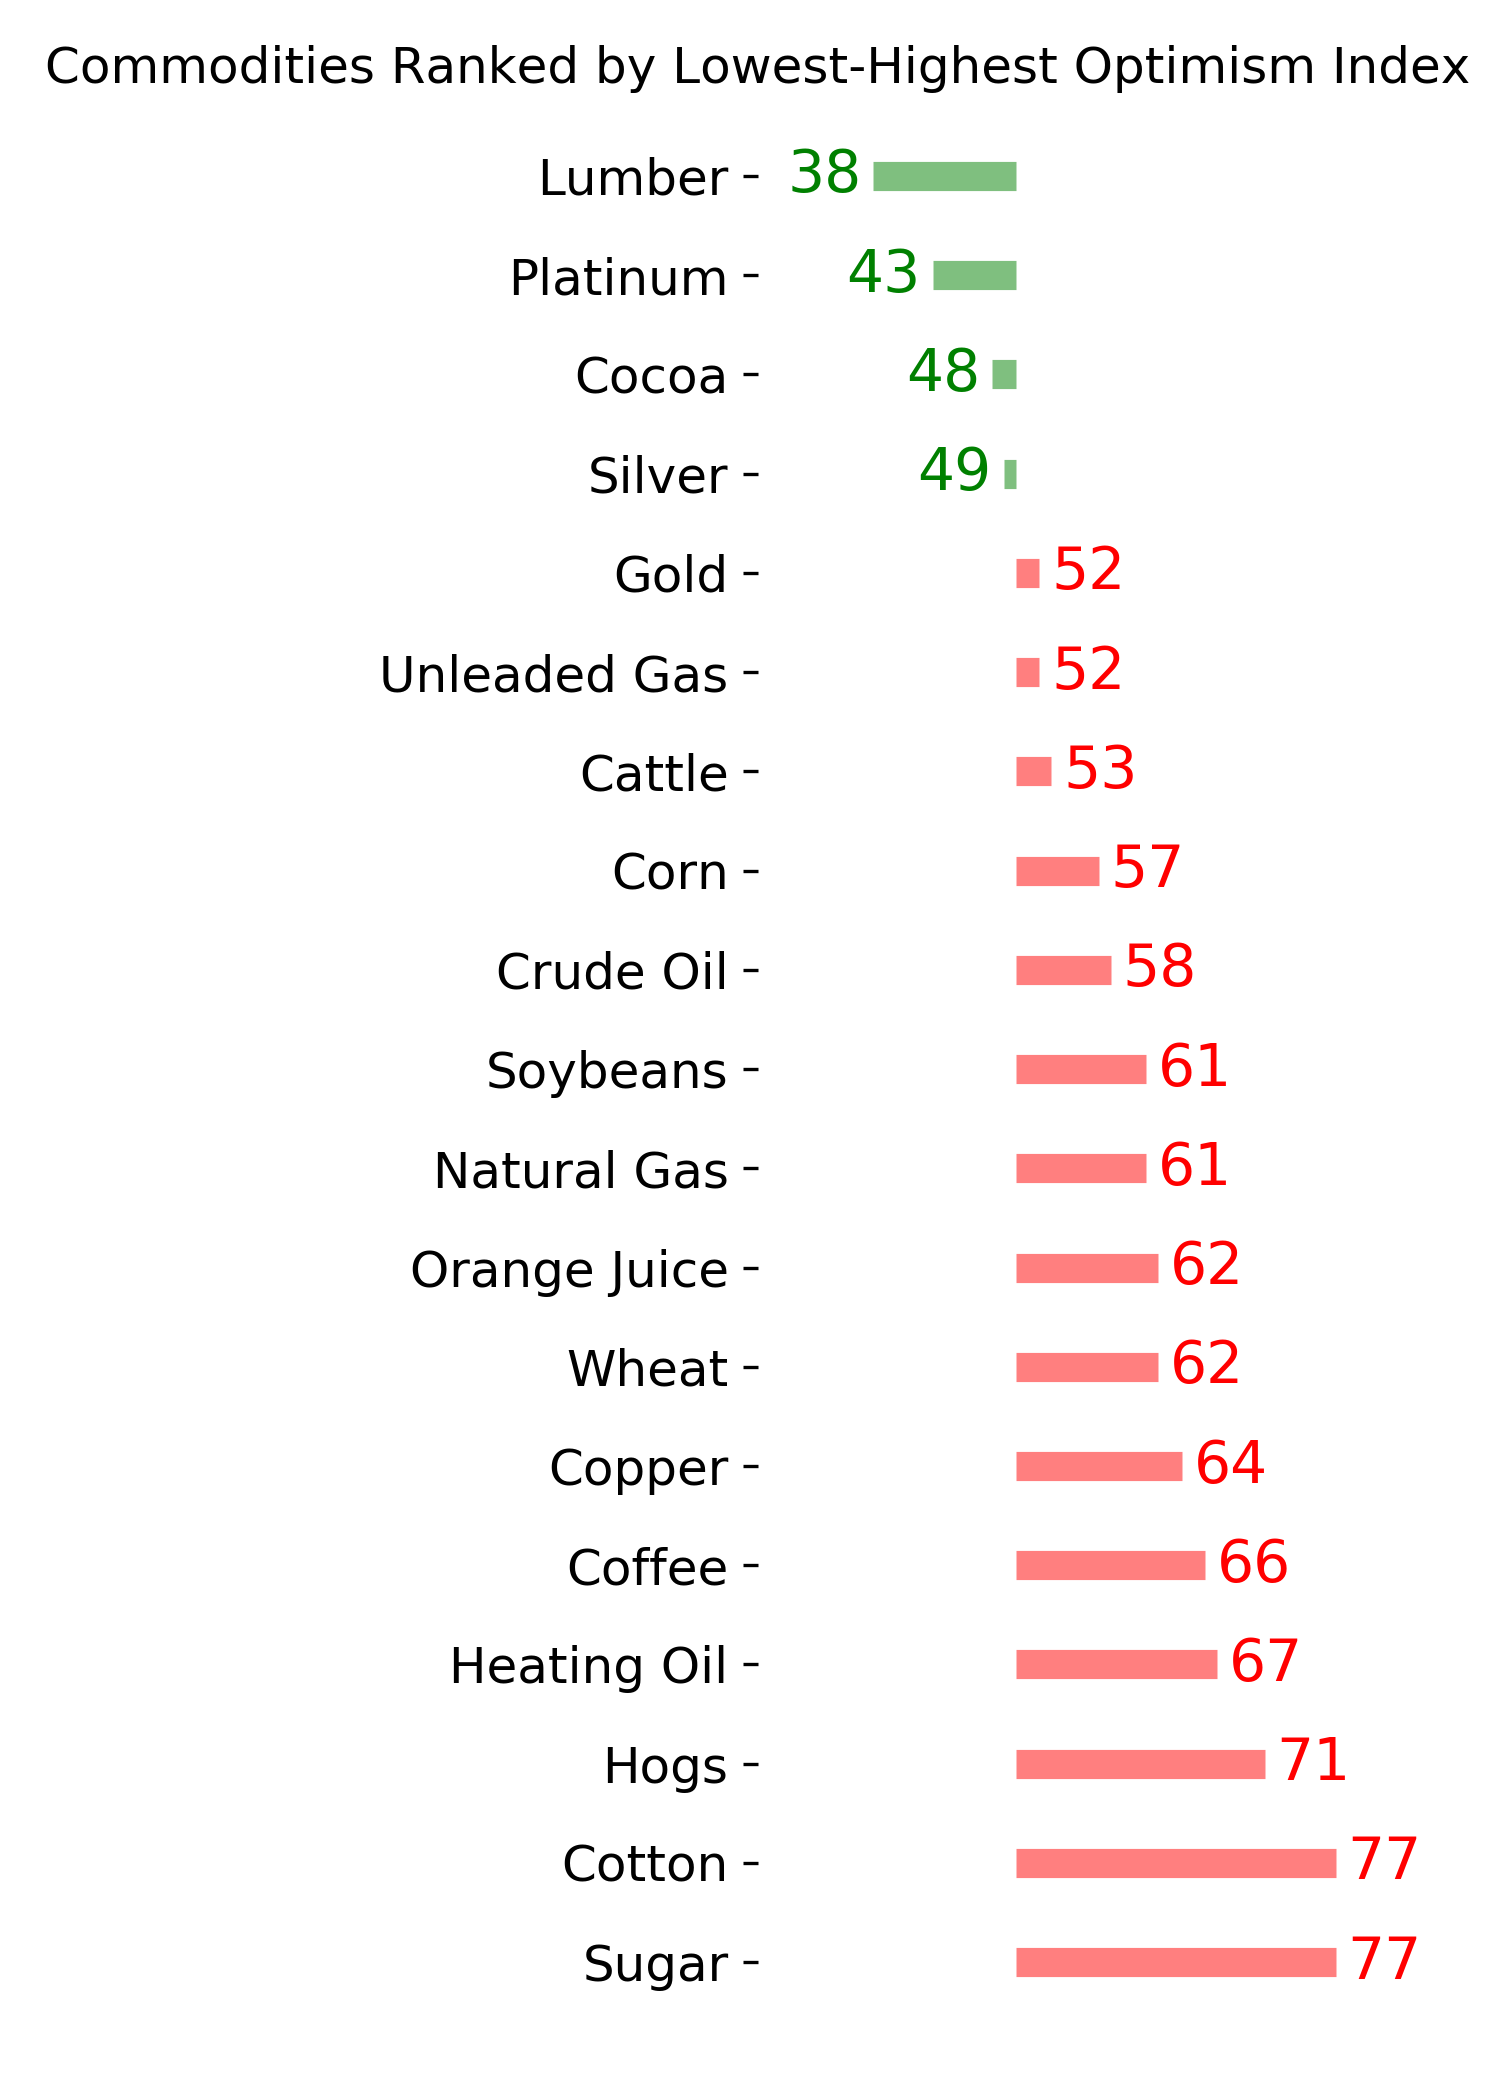
Commodity ETF's - 5-Day Moving Average
|
|