Headlines
|
|
Options traders start to jump aboard the rally:
Last week, small options traders picked up the pace of their bets on a market rally. When that happens during a week with only a small gain in stocks, it tends to be a modest negative for forward returns. But this is occurring in the context of what had been near-record bearish bets, so there should be more room for recovery.
|
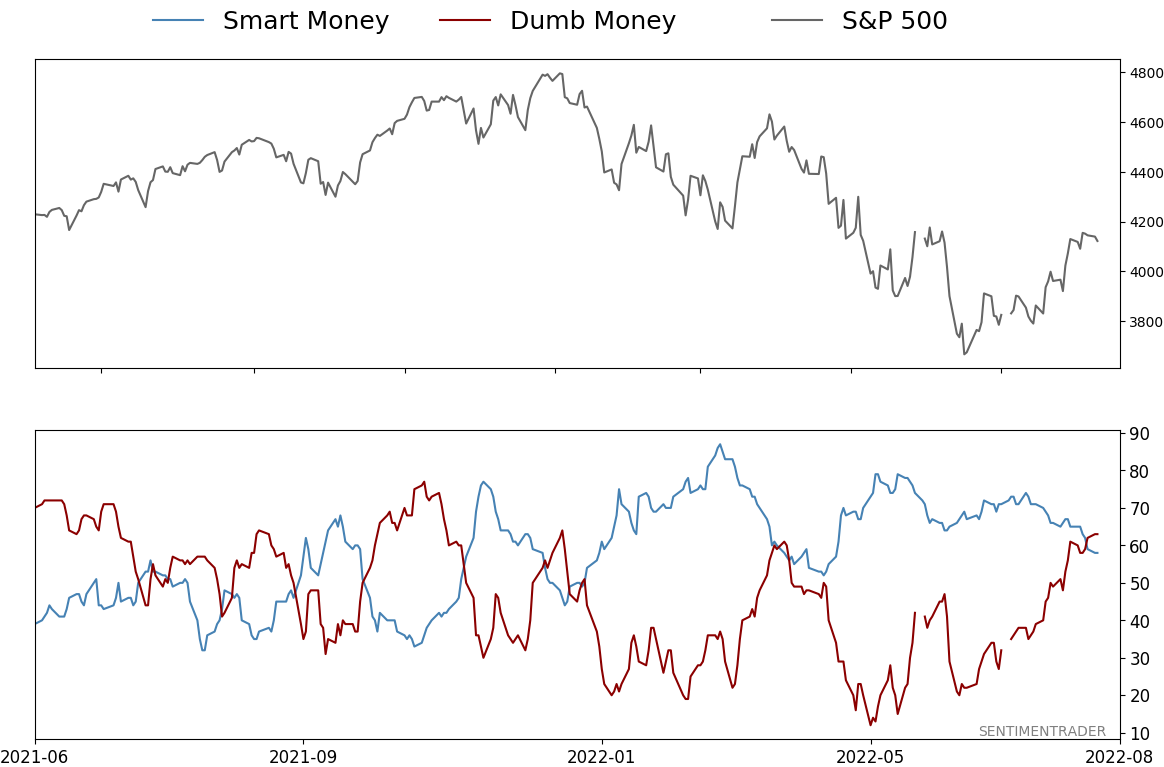
Smart / Dumb Money Confidence
|
Smart Money Confidence: 58%
Dumb Money Confidence: 63%
|
|
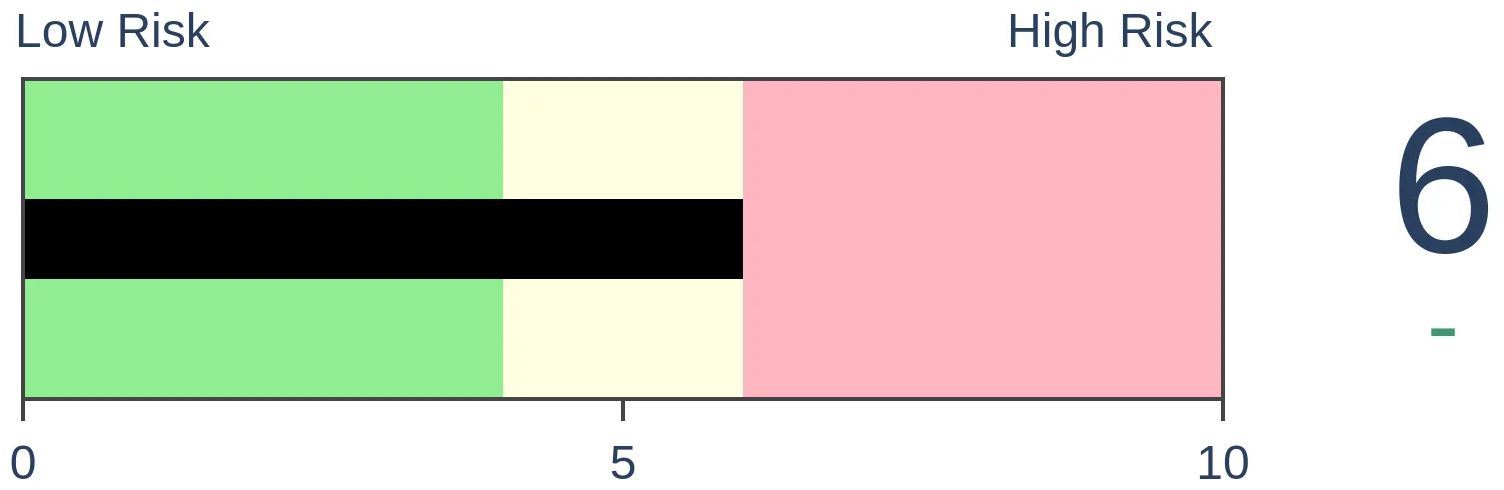
Risk Levels
Stocks Short-Term

|
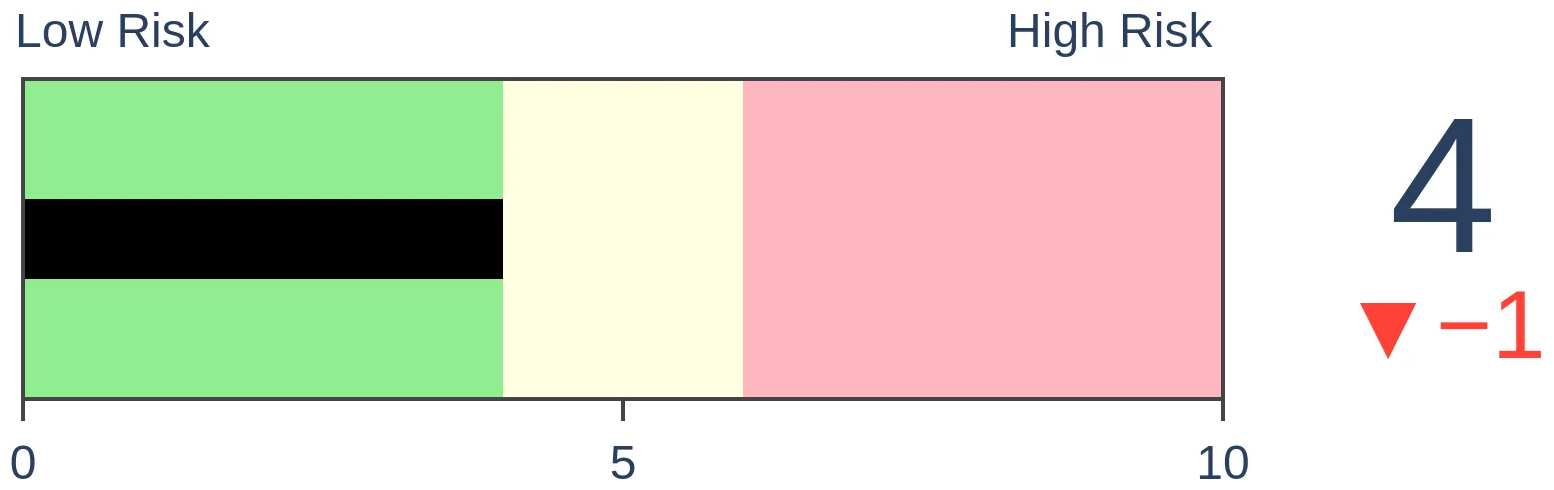
Stocks Medium-Term
|
|
Bonds
|
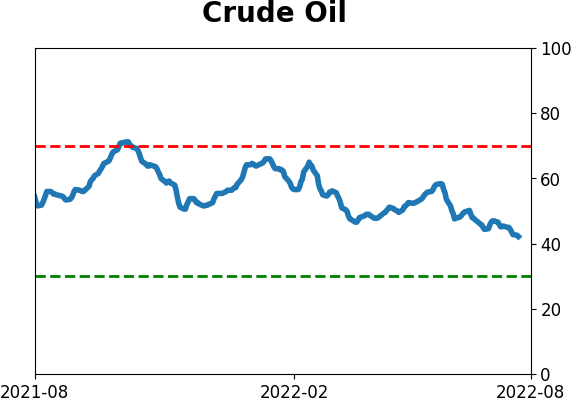
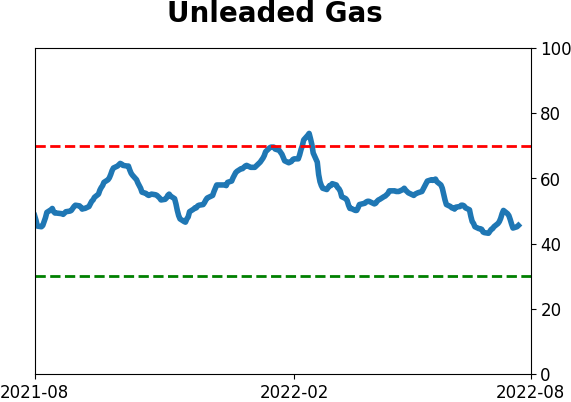
Crude Oil

|
|
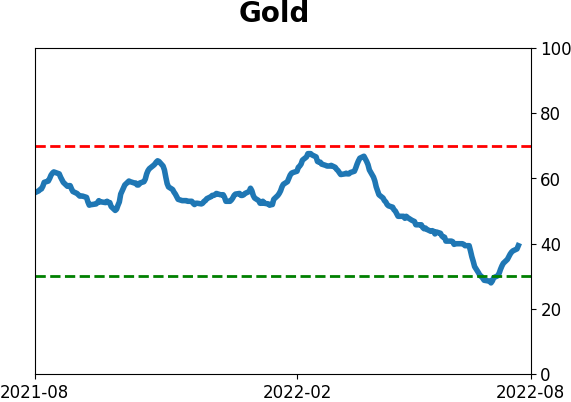
Gold
|
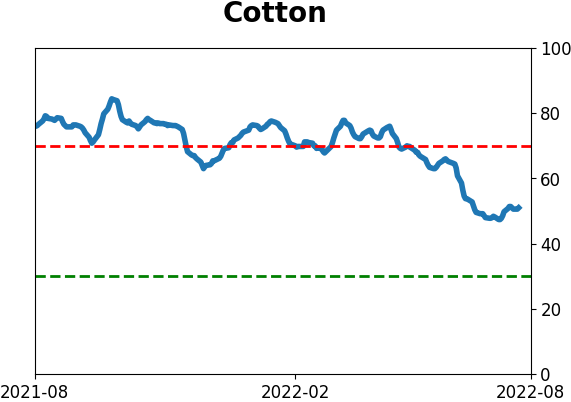
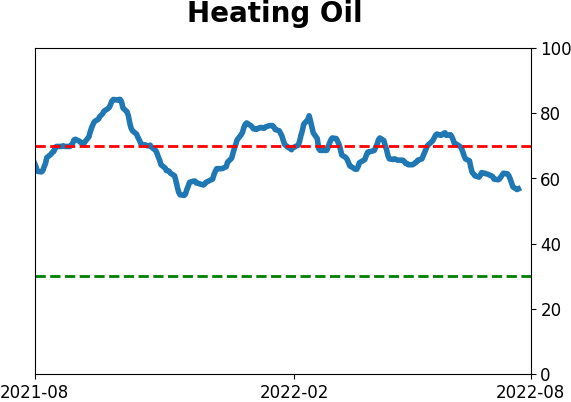
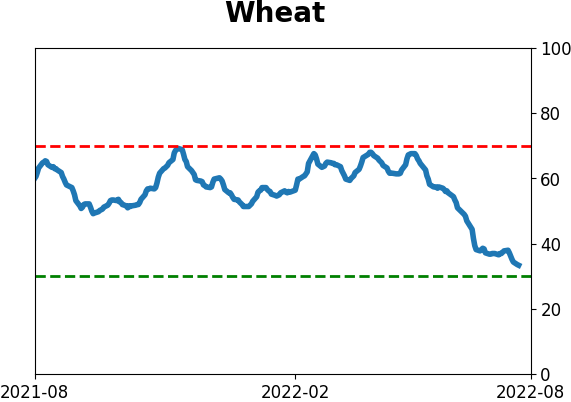
Agriculture

|
|
Research
By Jason Goepfert
BOTTOM LINE
Last week, small options traders picked up the pace of their bets on a market rally. When that happens during a week with only a small gain in stocks, it tends to be a modest negative for forward returns. But this is occurring in the context of what had been near-record bearish bets, so there should be more room for recovery.
FORECAST / TIMEFRAME
None
|
Key points:
- Small options traders increased their net speculative volume last week
- Big jumps in speculation during a small rally in stocks have been a minor negative
- The improvement in sentiment is happening after a near-record surge in bearish bets
Small traders are starting to feel that FOMO
Well, that was quick.
In June, small options traders placed heavy bets against a stock rally. A near record-breaking bet. Even after a double-digit rally, they were undecided at best, and a big weekly jump in the most benchmarked index in the world wasn't enough to get them off the sidelines.
But apparently, last week was just too much. Maybe it was the best bear market rally so far; maybe it was the inability of sellers to push stocks down despite negative headlines. Whatever it was, small traders decided last week that they'd had enough, and they focused the most on call options since April.
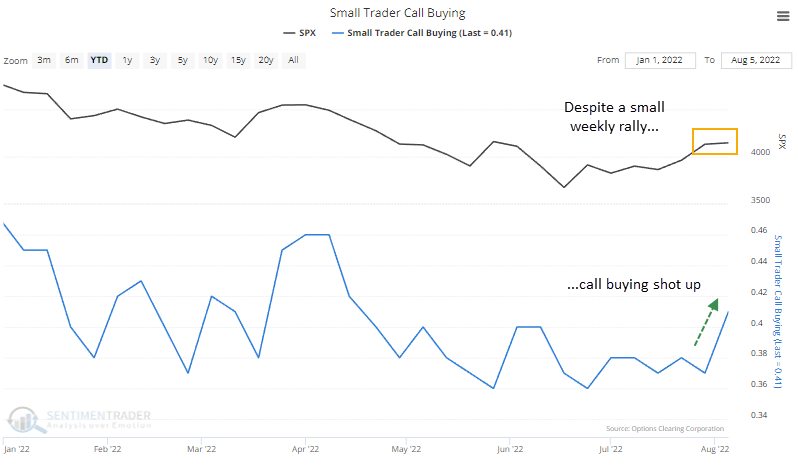
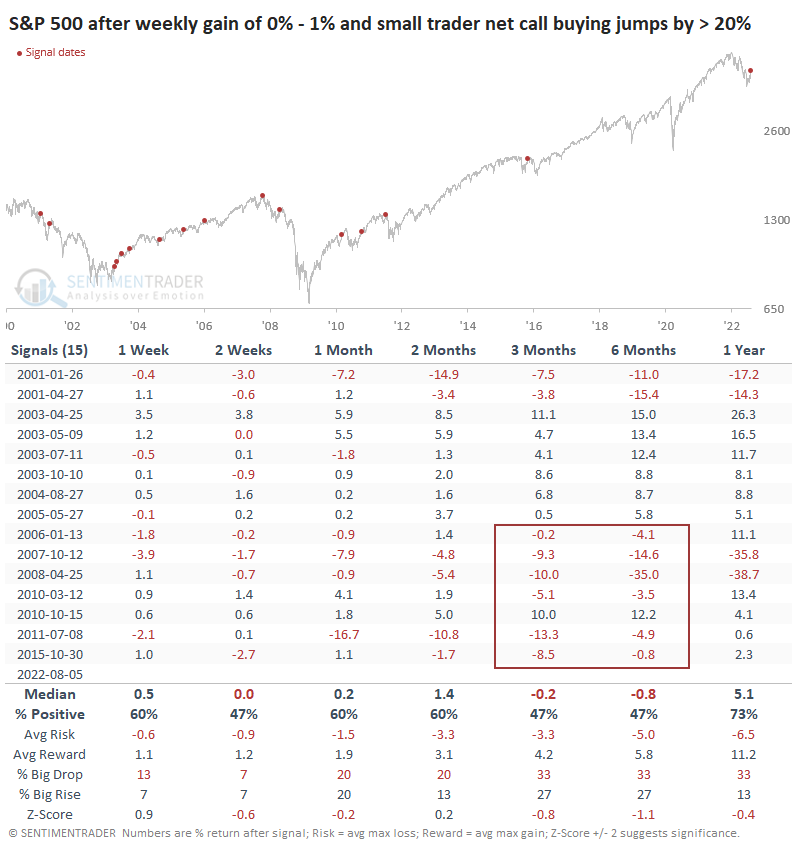
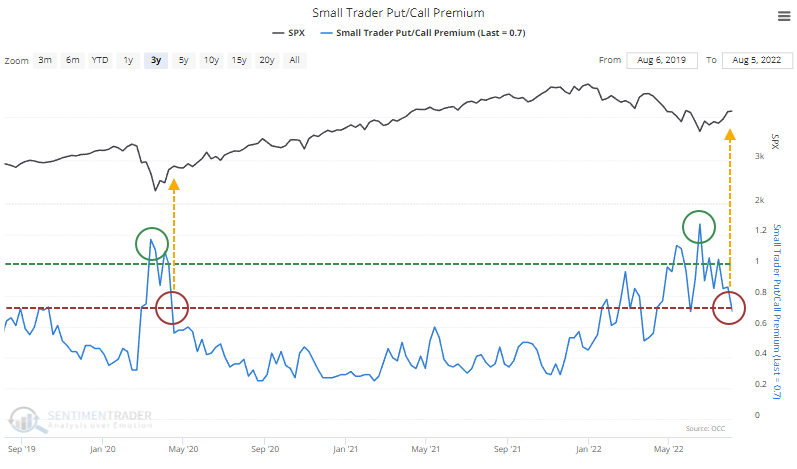
If we look at modest weekly rallies in the S&P 500, a gain of less than 1%, then last week marked one of the largest jumps in net speculative volume in 22 years. In this case, "net speculative volume" is the weekly percentage change in call buying to open minus put buying to open.
A jump in speculative volume during only a small rally led to modestly negative returns for the S&P 500. Since 2006, it preceded a negative 3-6 month return every time but once. So, this is a bit of a concern.
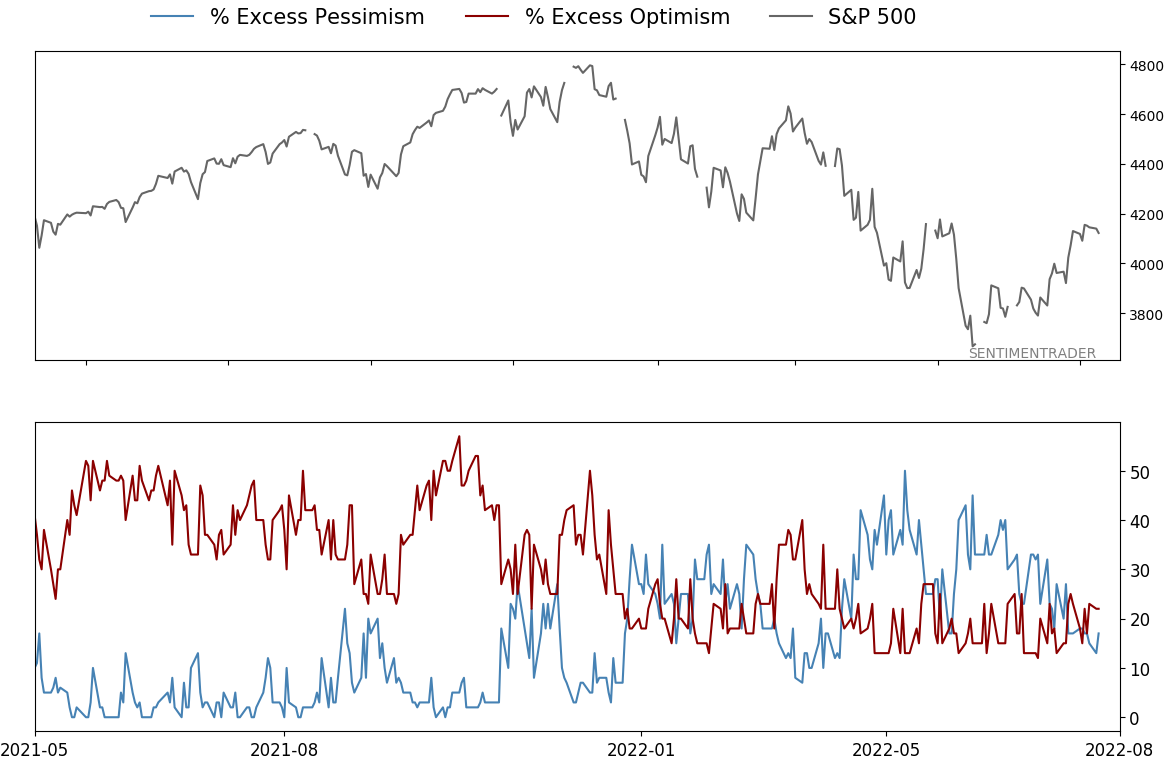
Renewed optimism after a spike in bearish bets
Context is essential, though. As noted in June, small traders were panicking and spent the most on bearish bets relative to bullish ones since the financial crisis. Each time they spent more to hedge against a crash than bet on a rally, it coincided with the end games of bear markets.
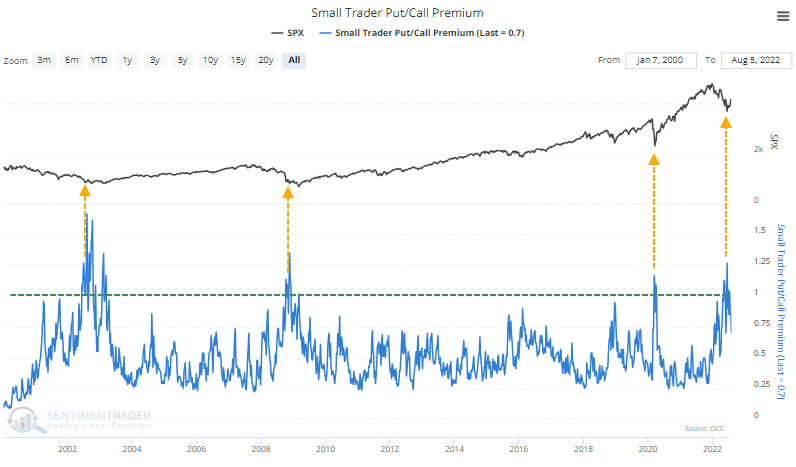
Those bets have since melted off. When that happened in 2020, stocks continued to shoot higher.
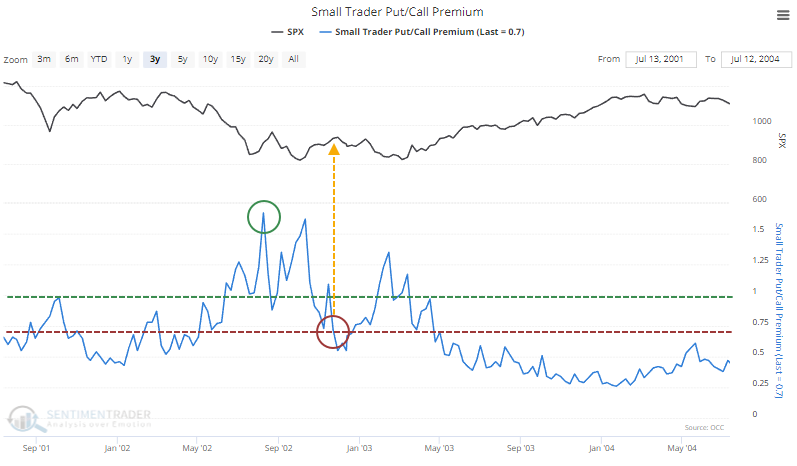
In 2002, a similar cycle marked the peak of the initial thrust off the low. The S&P then spent the next couple of months testing the low as traders renewed their bets against stocks.
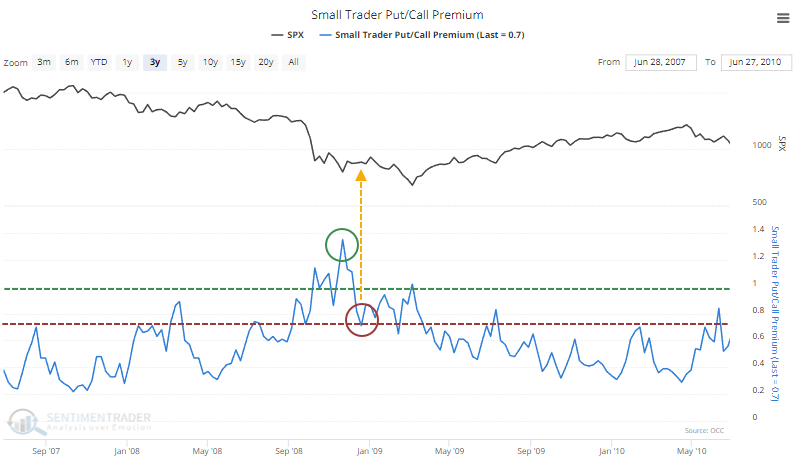
In 2008, something similar occurred. By the time bearish bets rolled off, stocks had peaked and then headed back down to test (and violate) the prior low before the ultimate bottom occurred.
Bullish bets have spread across all trader sizes
It wasn't just small traders with rewed optimism. Across all trader sizes and all strategies, there was an uptick in bullish bets last week.
The Options Speculation Index shows the percentage of all volume that went toward bullish-oriented options strategies (buying calls and selling puts) versus bearish-oriented ones (selling calls and buying puts).
The indicator dipped below 1.0 in late June, meaning traders placed more bearish bets than bullish ones, a consistent contrary indicator. Last week, traders placed 20% more bullish bets than bearish ones, on the upper end of the range over the past decade - outside of the stimulus-fueled speculative excesses from 2020-21.
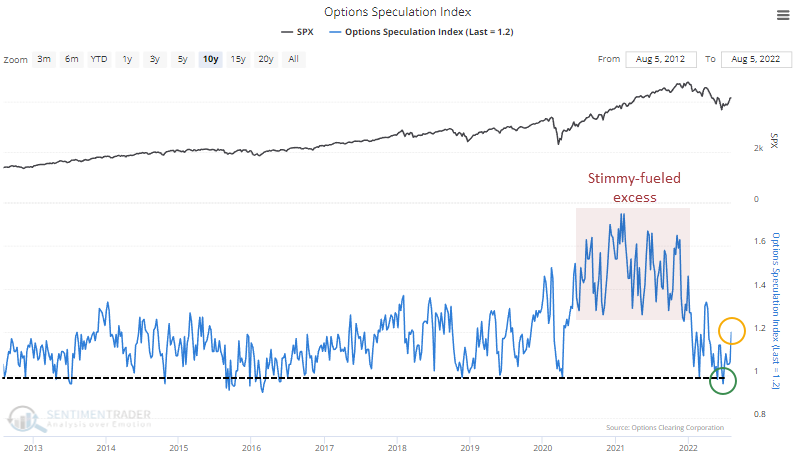
The current reading isn't quite high enough to be a concern, but it's getting close. A high reading didn't have a negative impact during 2020-21, but I have doubts about whether we can count on that going forward. More likely, we'll see a reading above 1.25 in this indicator lead to poor forward returns as it did for most of the prior 20 years.
What the research tells us...
Sentiment has gone from morose to modestly less so in recent weeks. It usually doesn't recover much more during bear markets before sellers sense their opportunity. There are signs this time could be different - the breadth thrusts and retracement are extremely compelling. But for bulls to regain their full confidence, they have to get past the coming weeks, when there is a true test of whether this is really just another bear market rally.
Indicators at Extremes
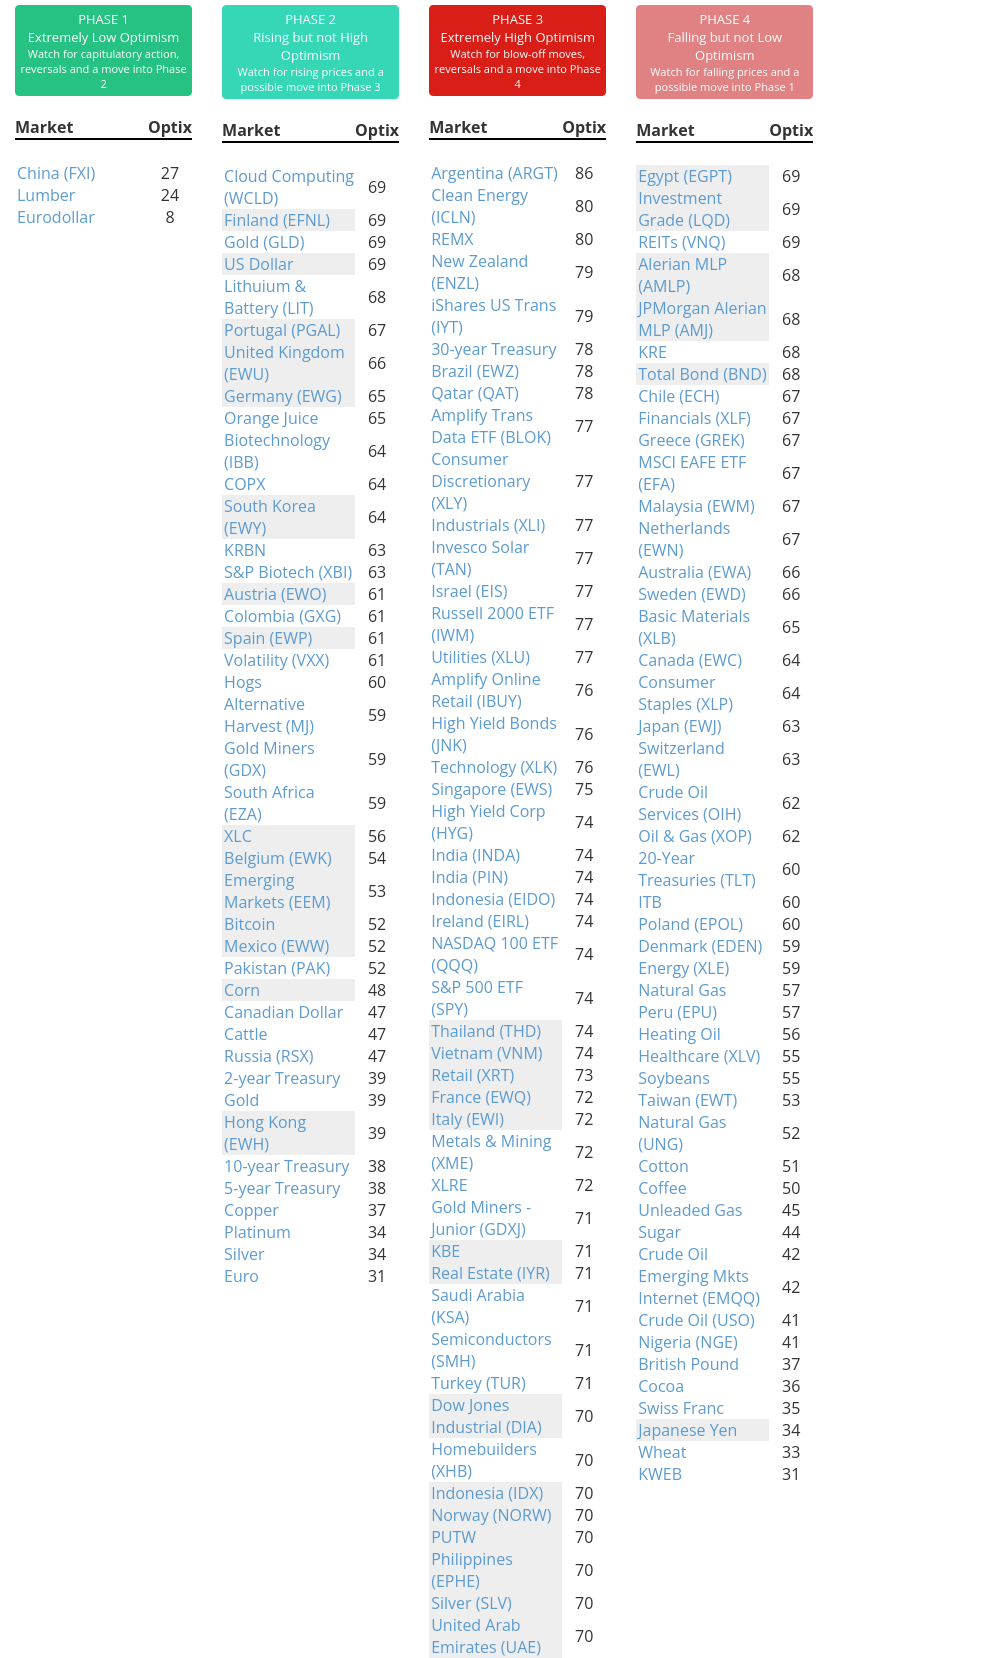
Phase Table
Ranks
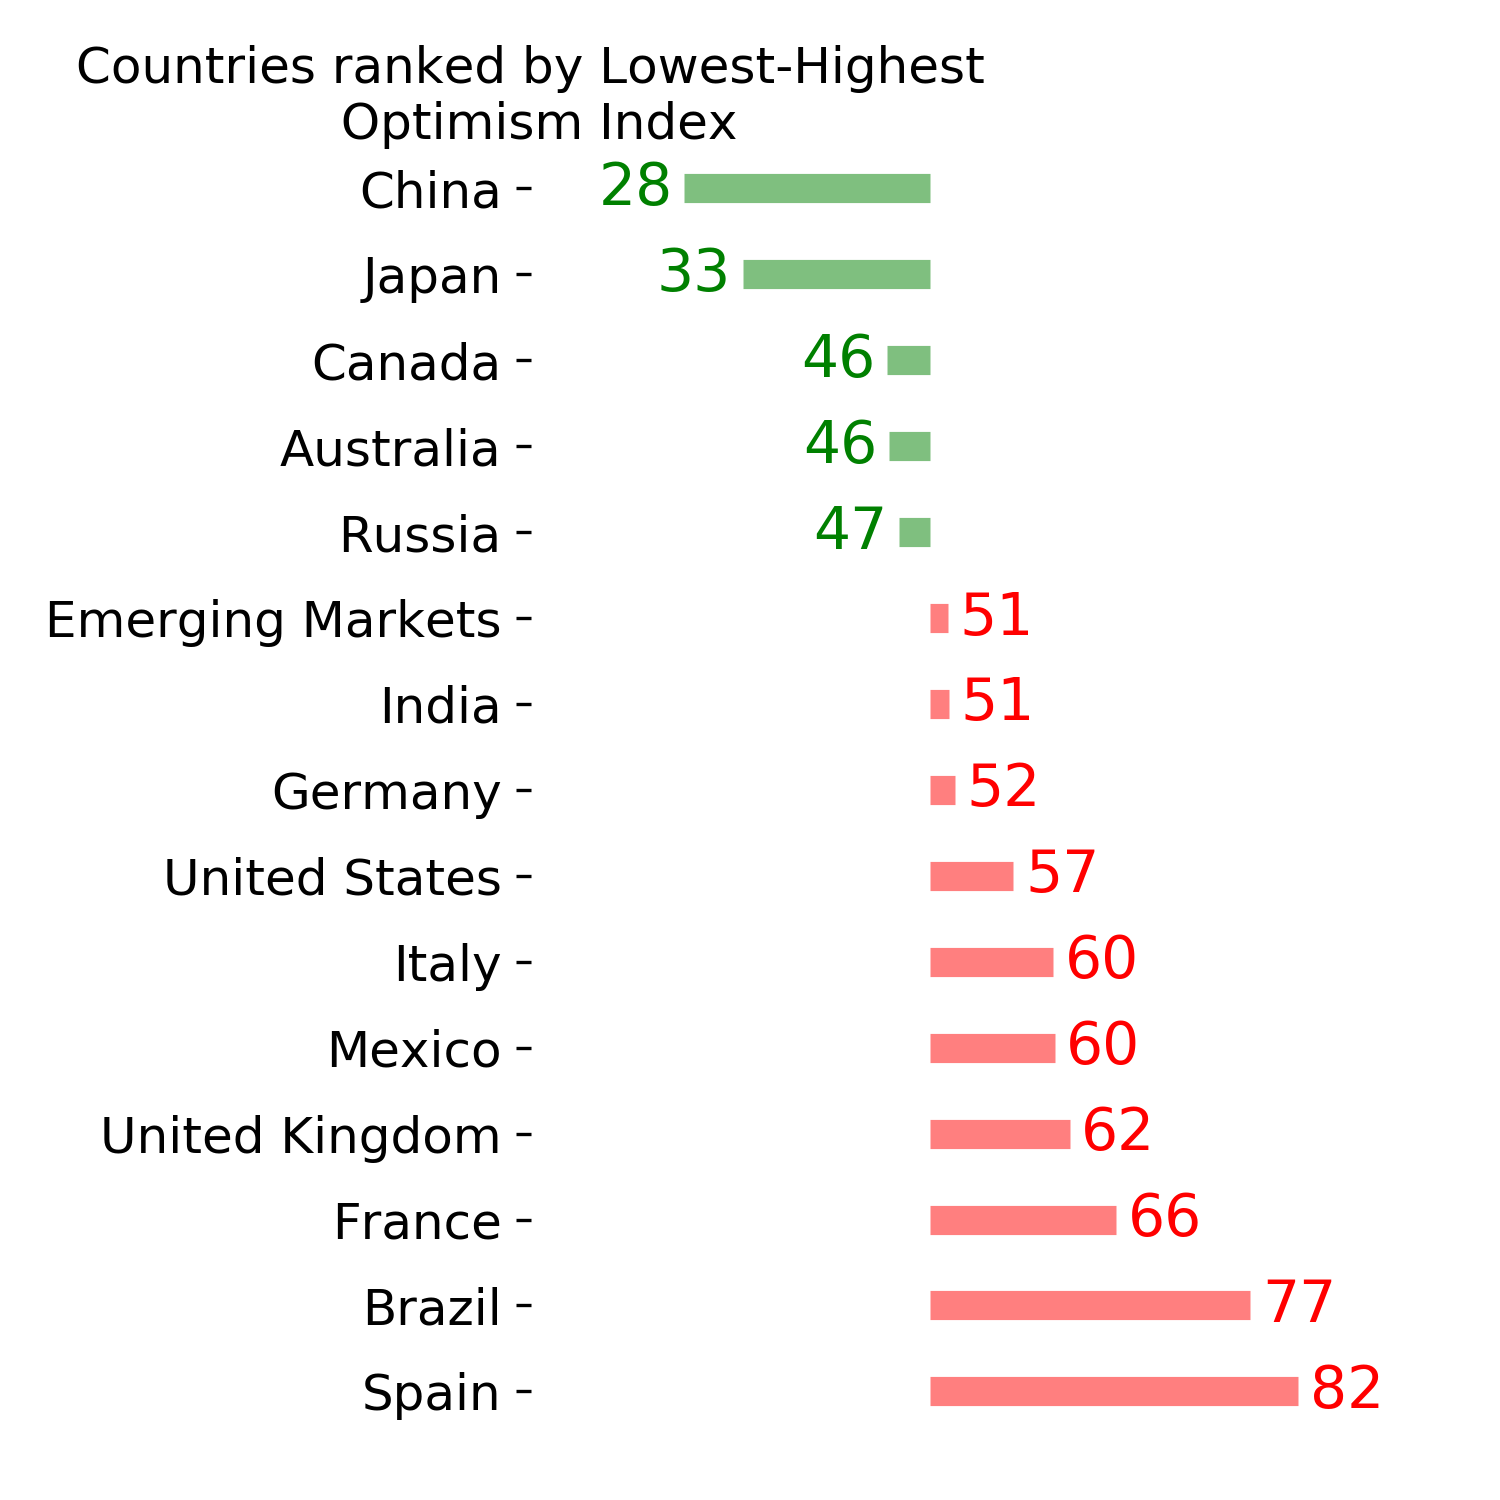
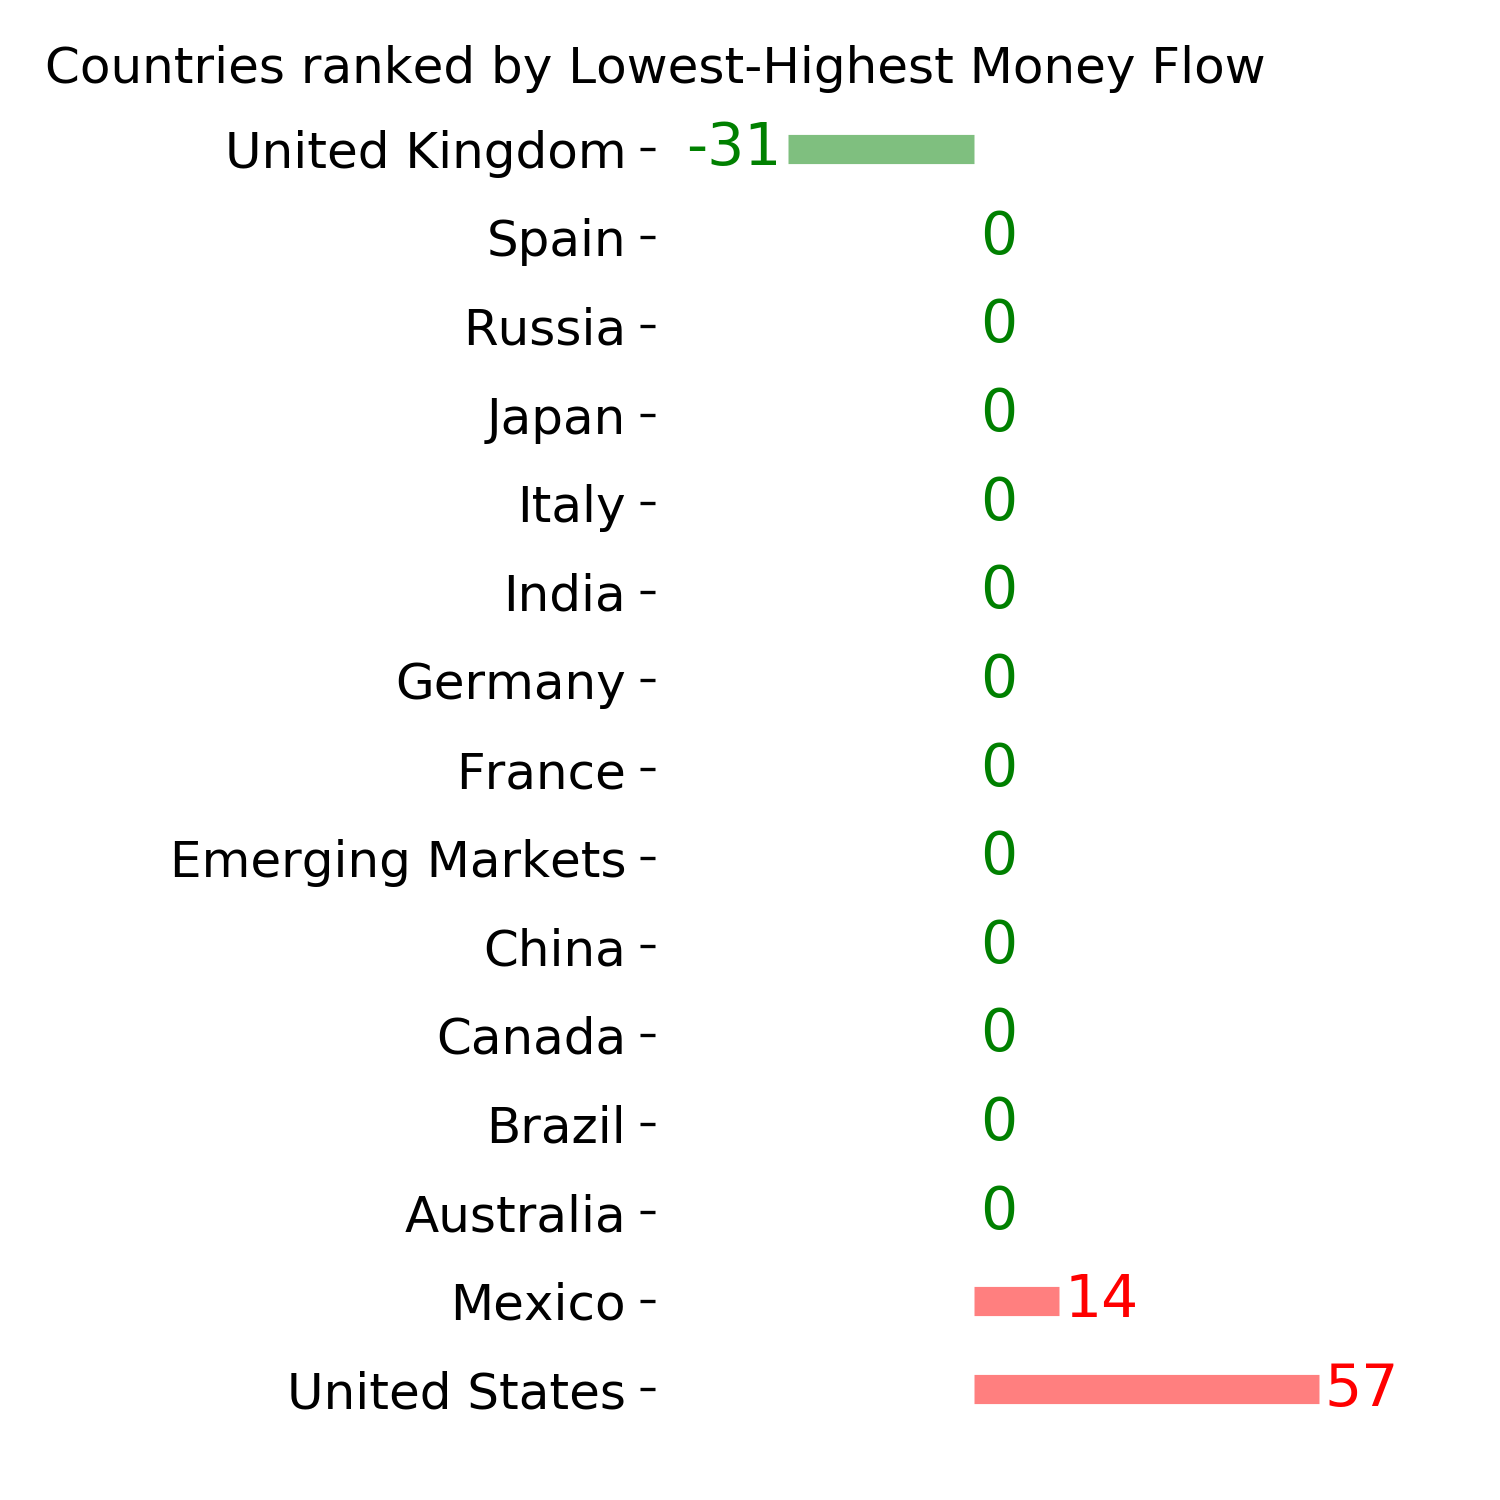
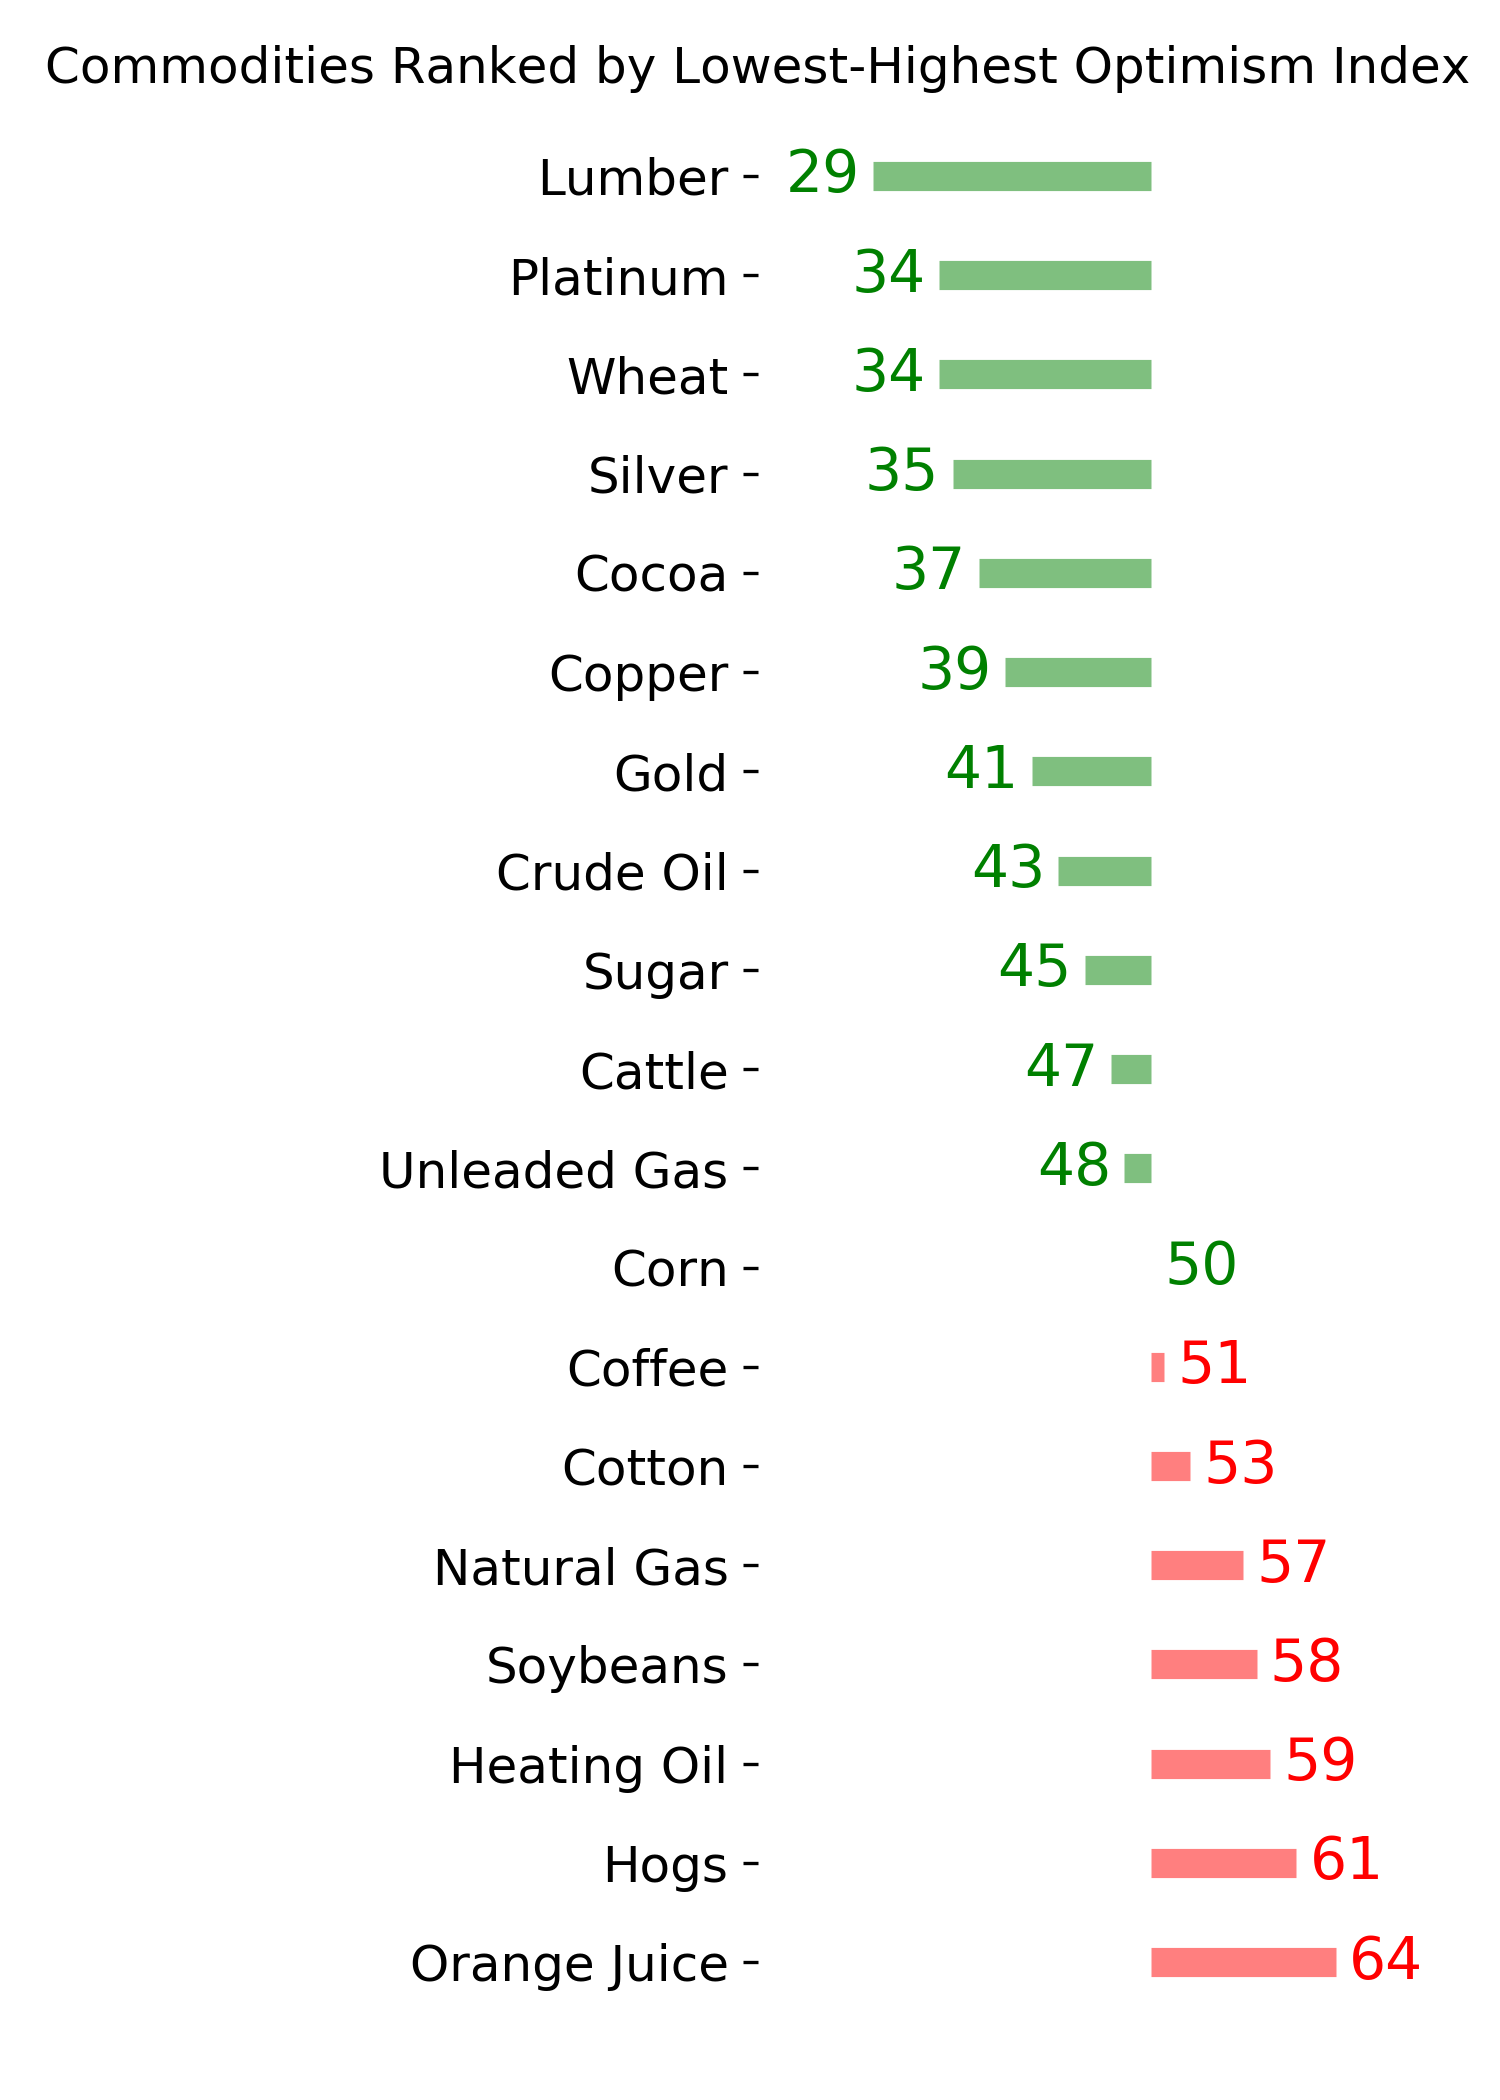
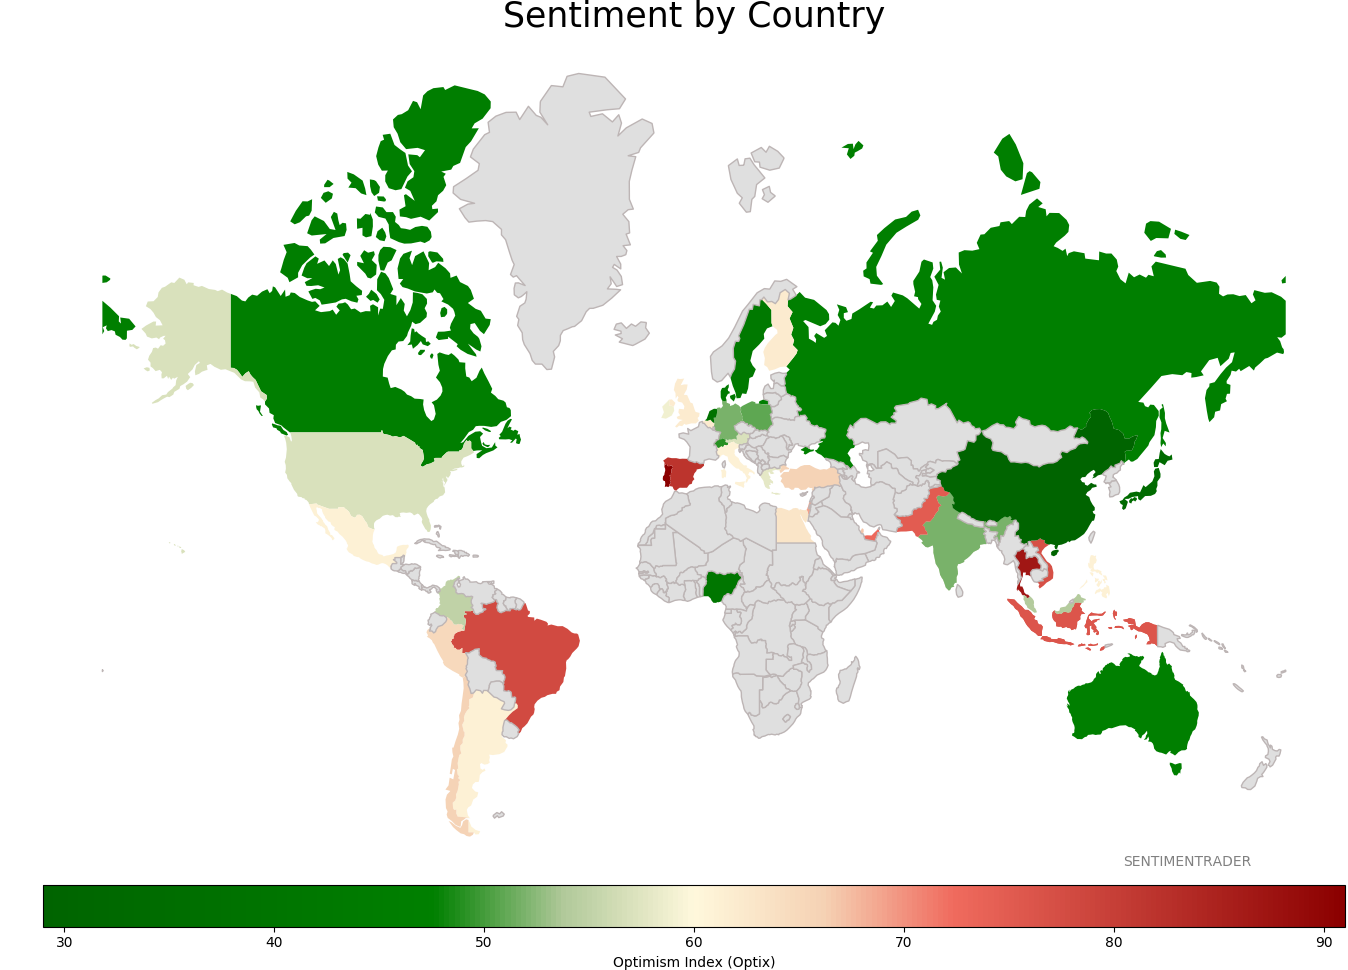
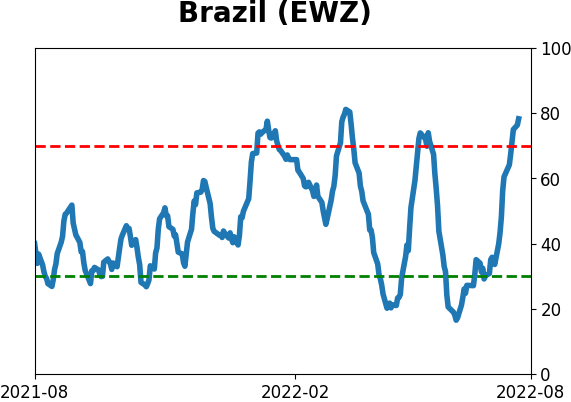
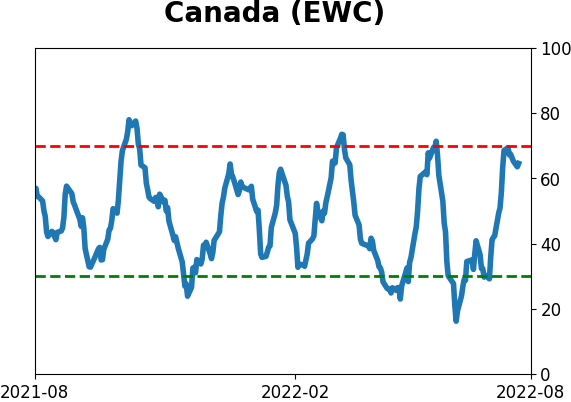
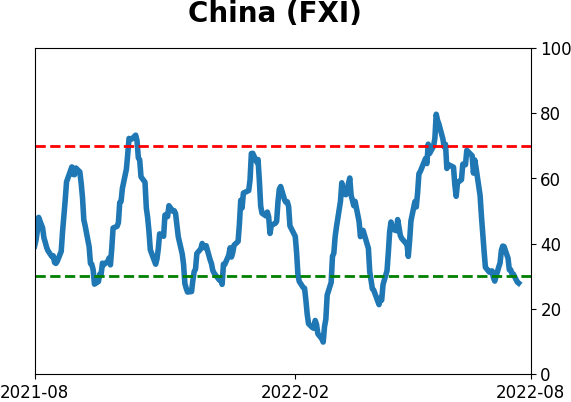
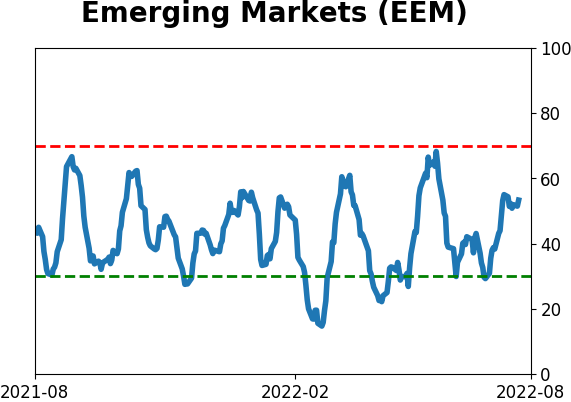
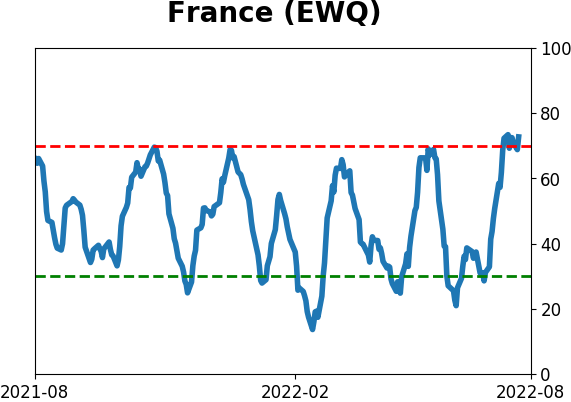
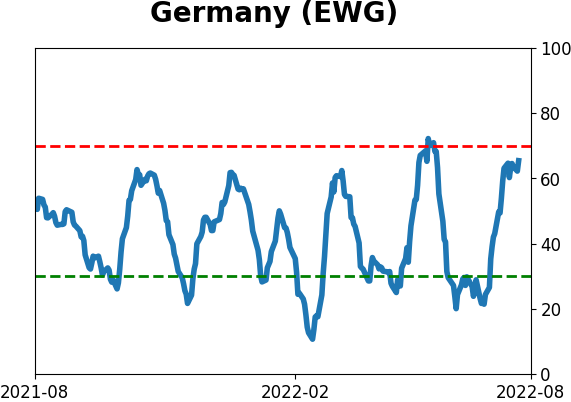
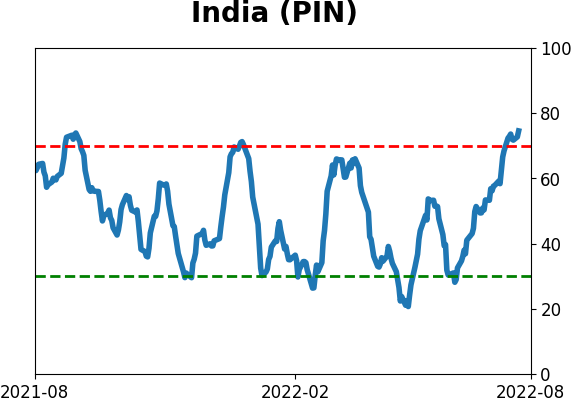
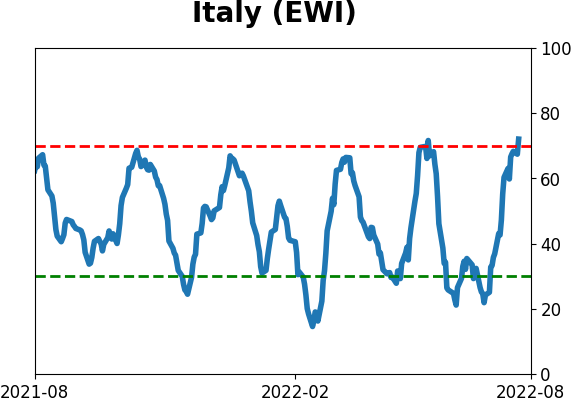
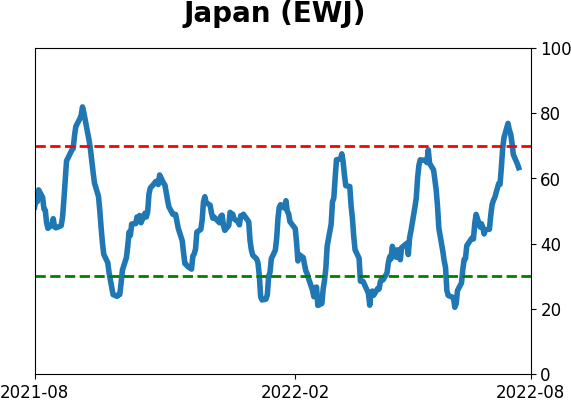
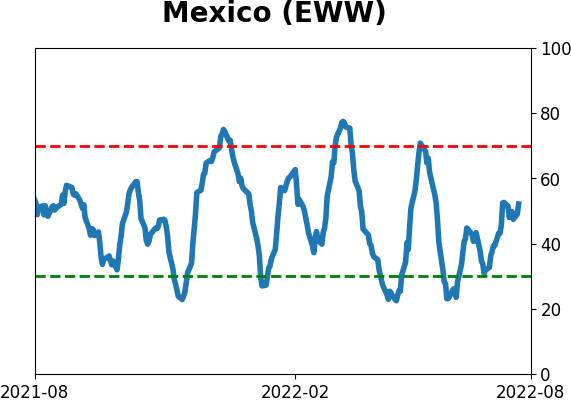
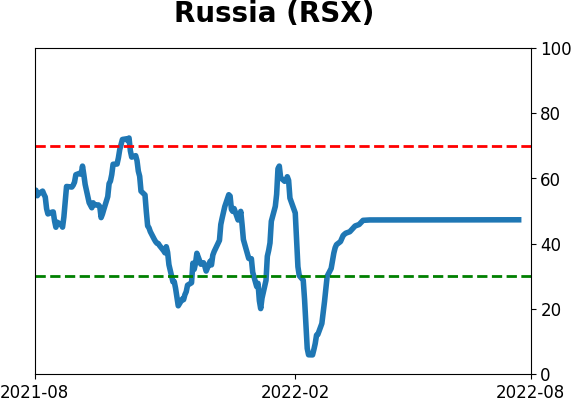
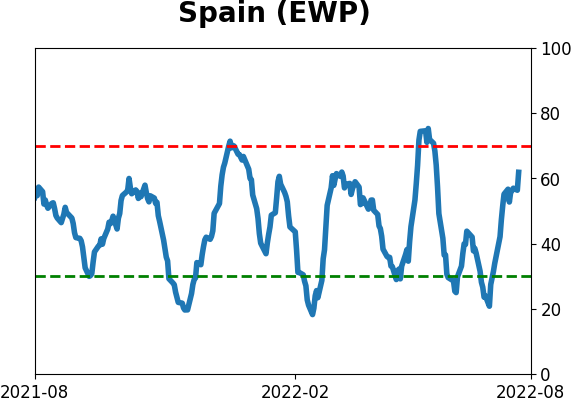
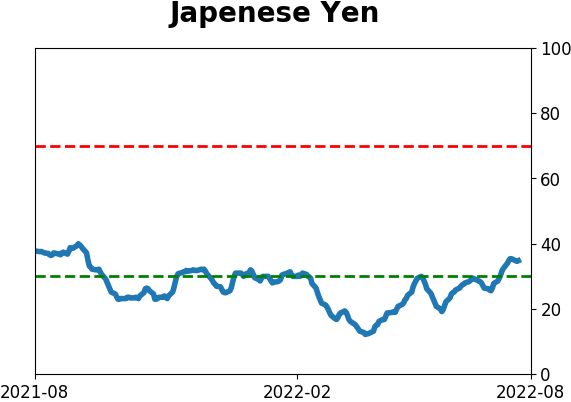
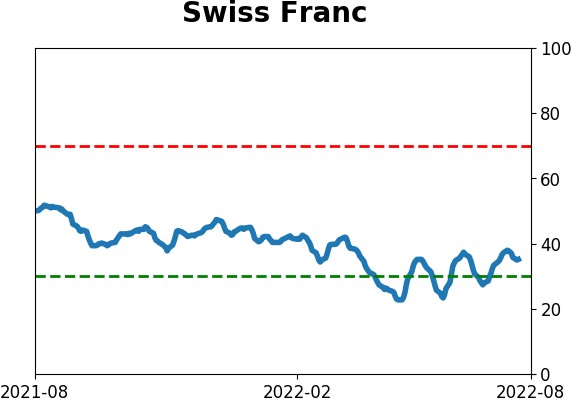
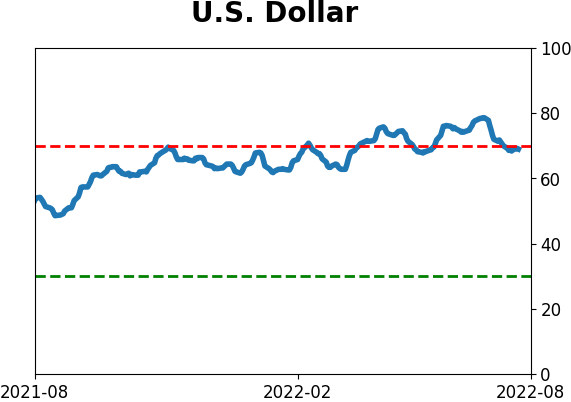
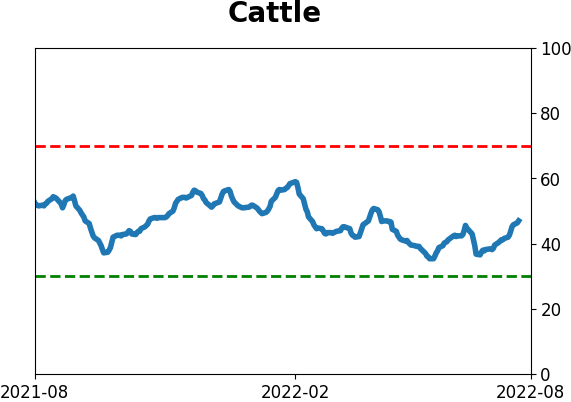
Sentiment Around The World
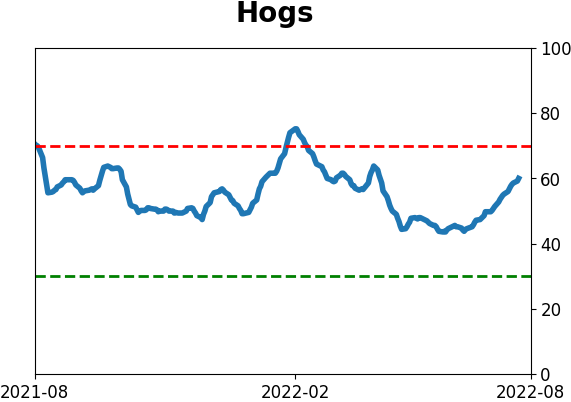
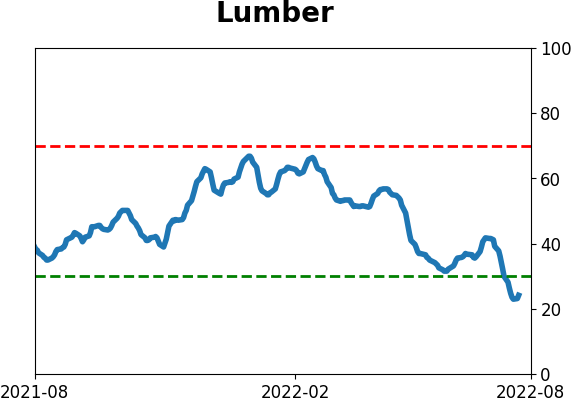
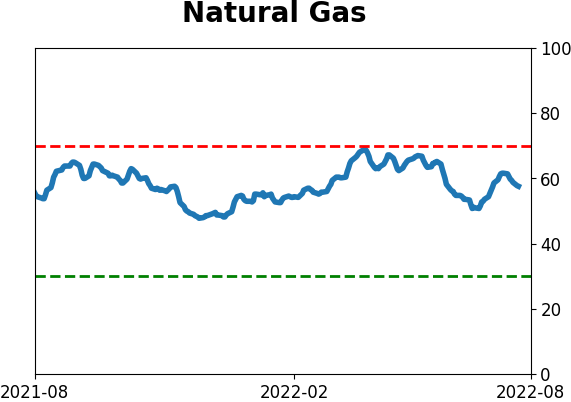
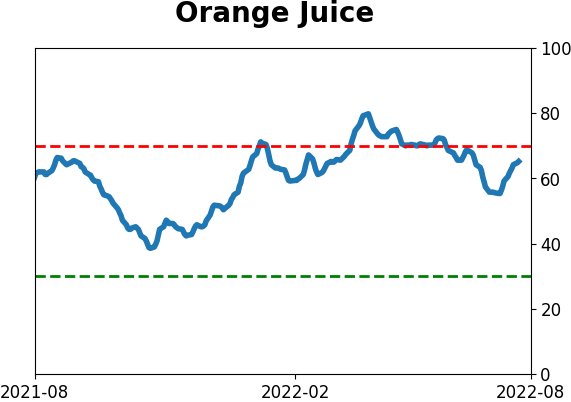
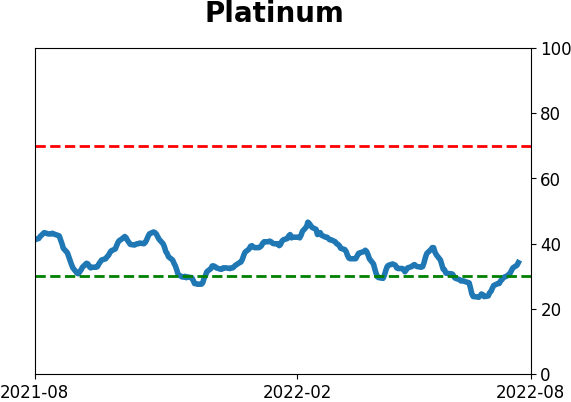
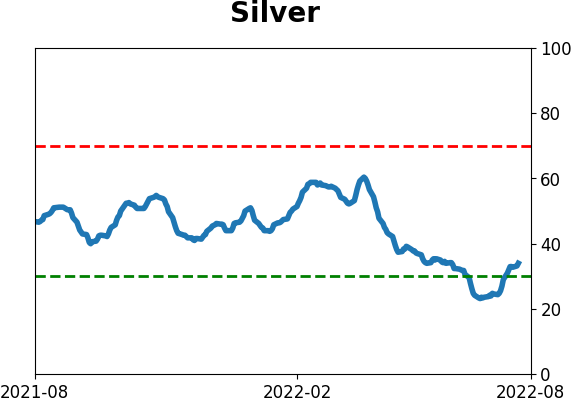
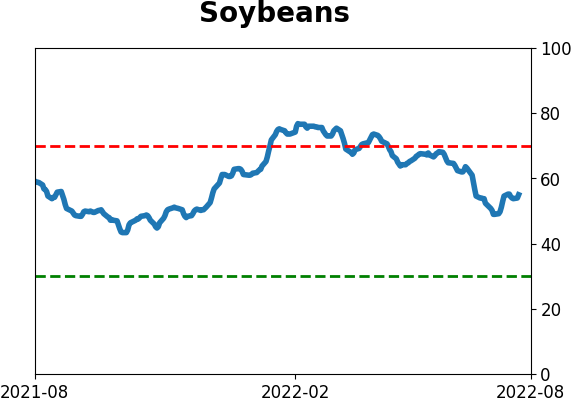
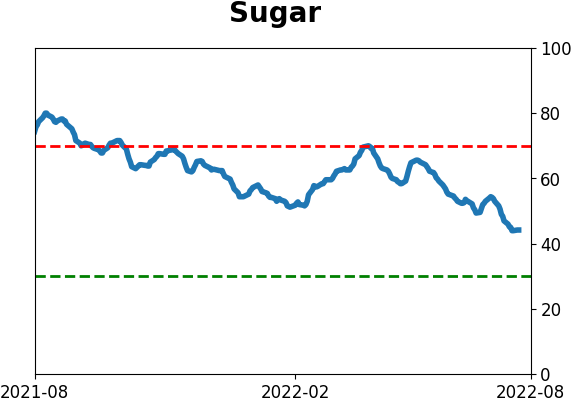
Optimism Index Thumbnails
|
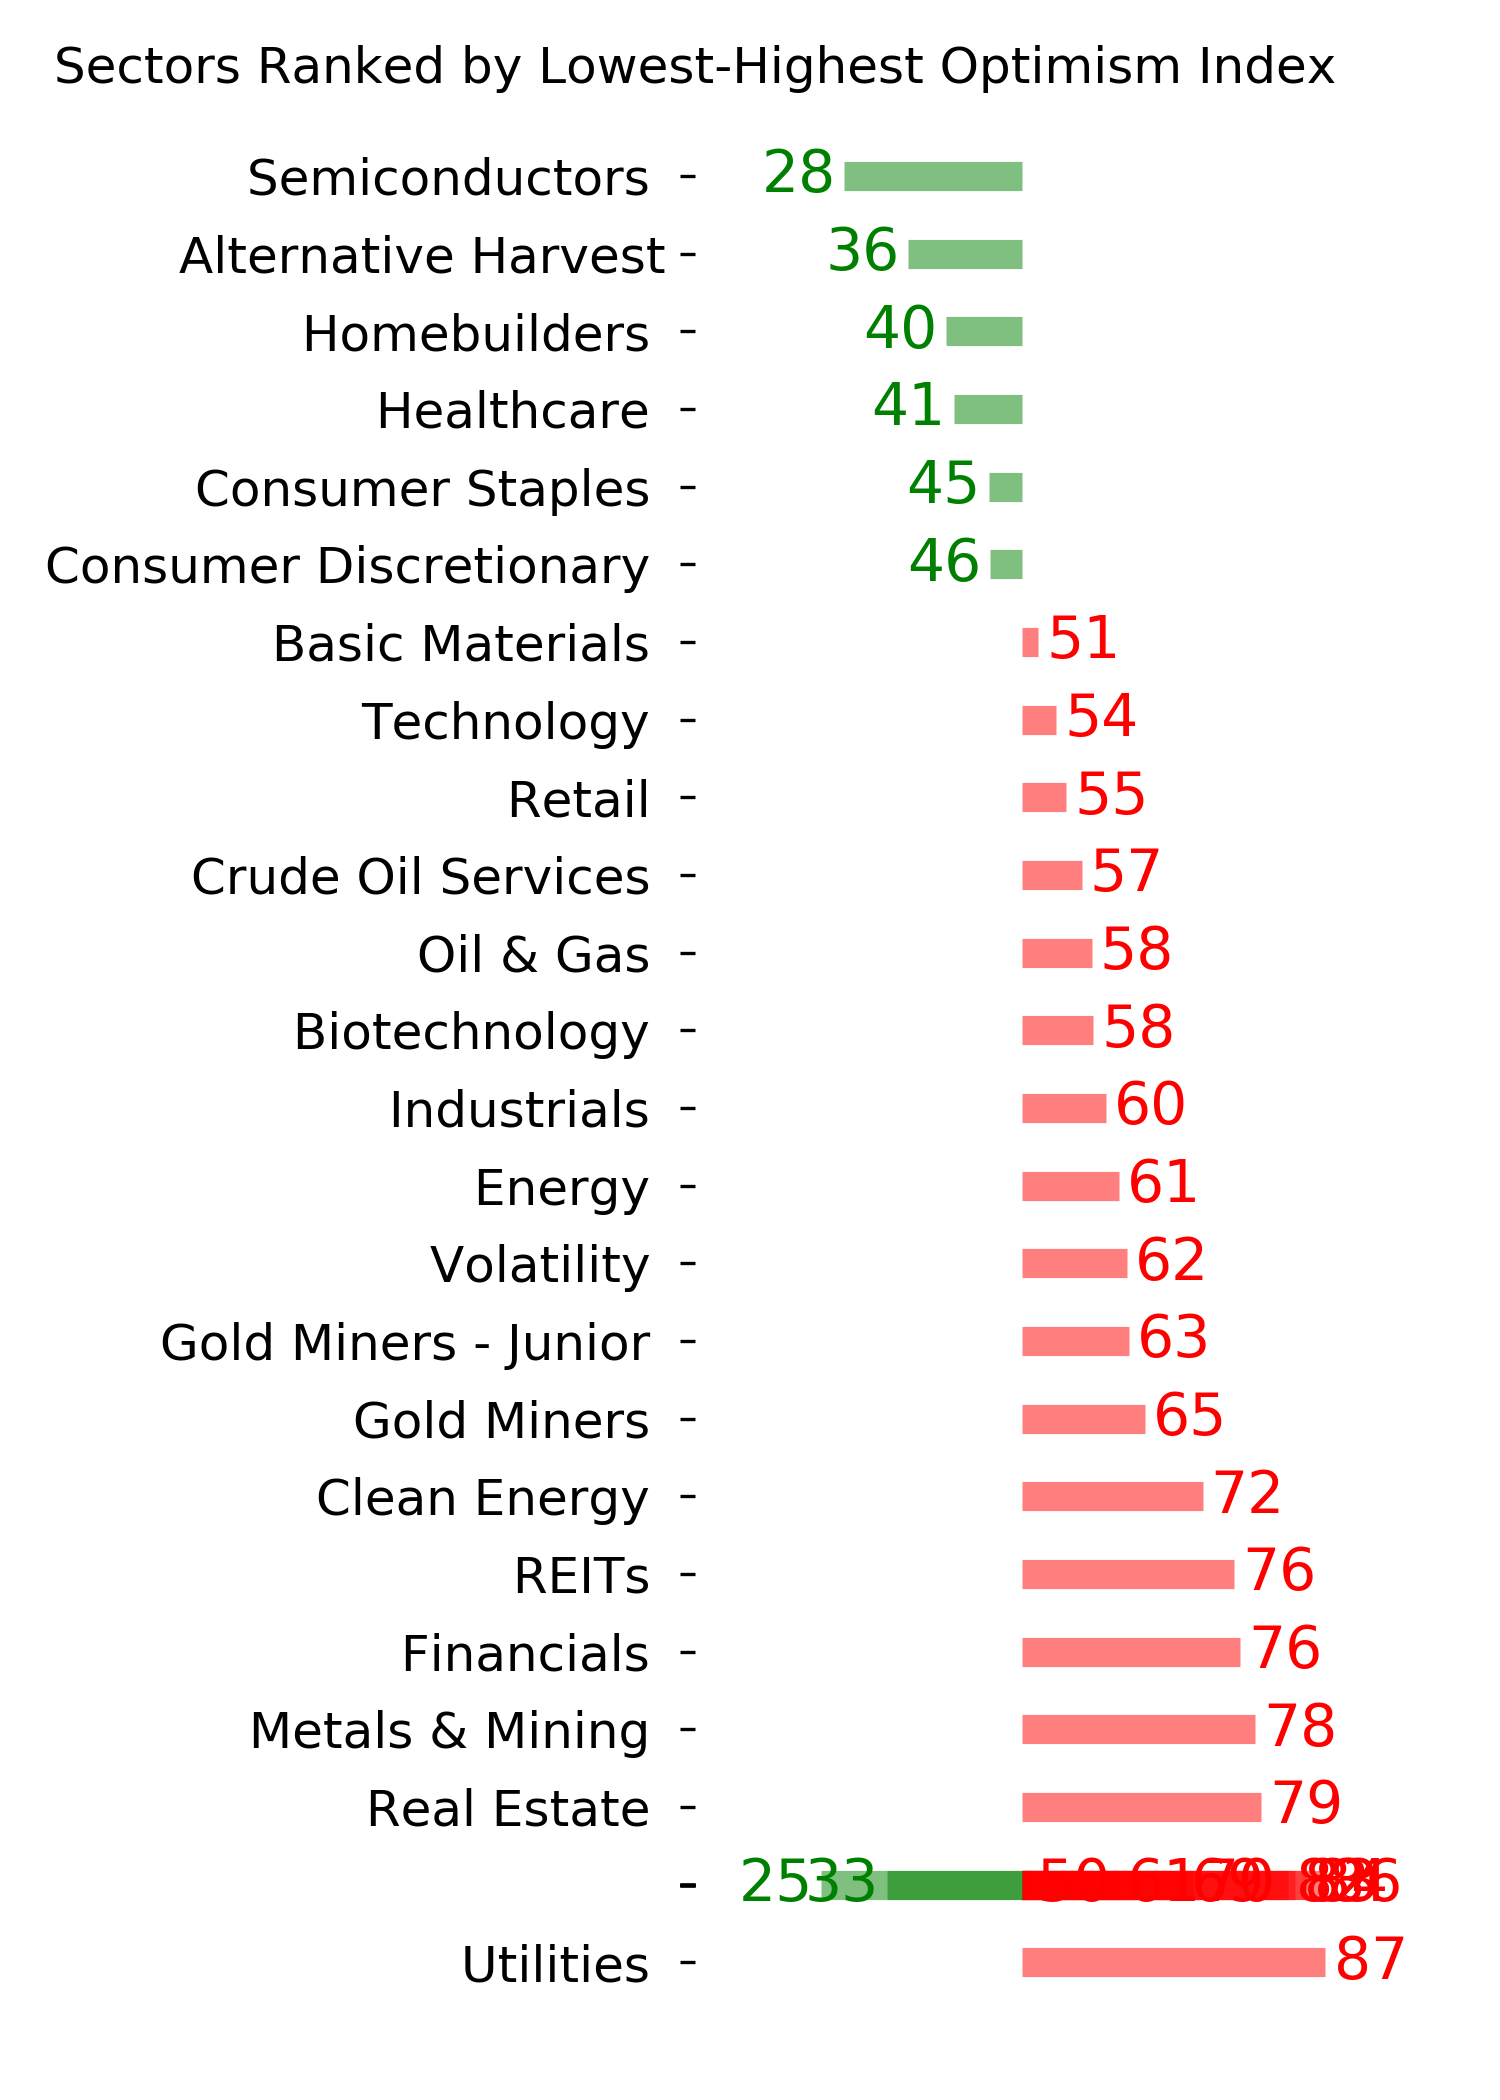
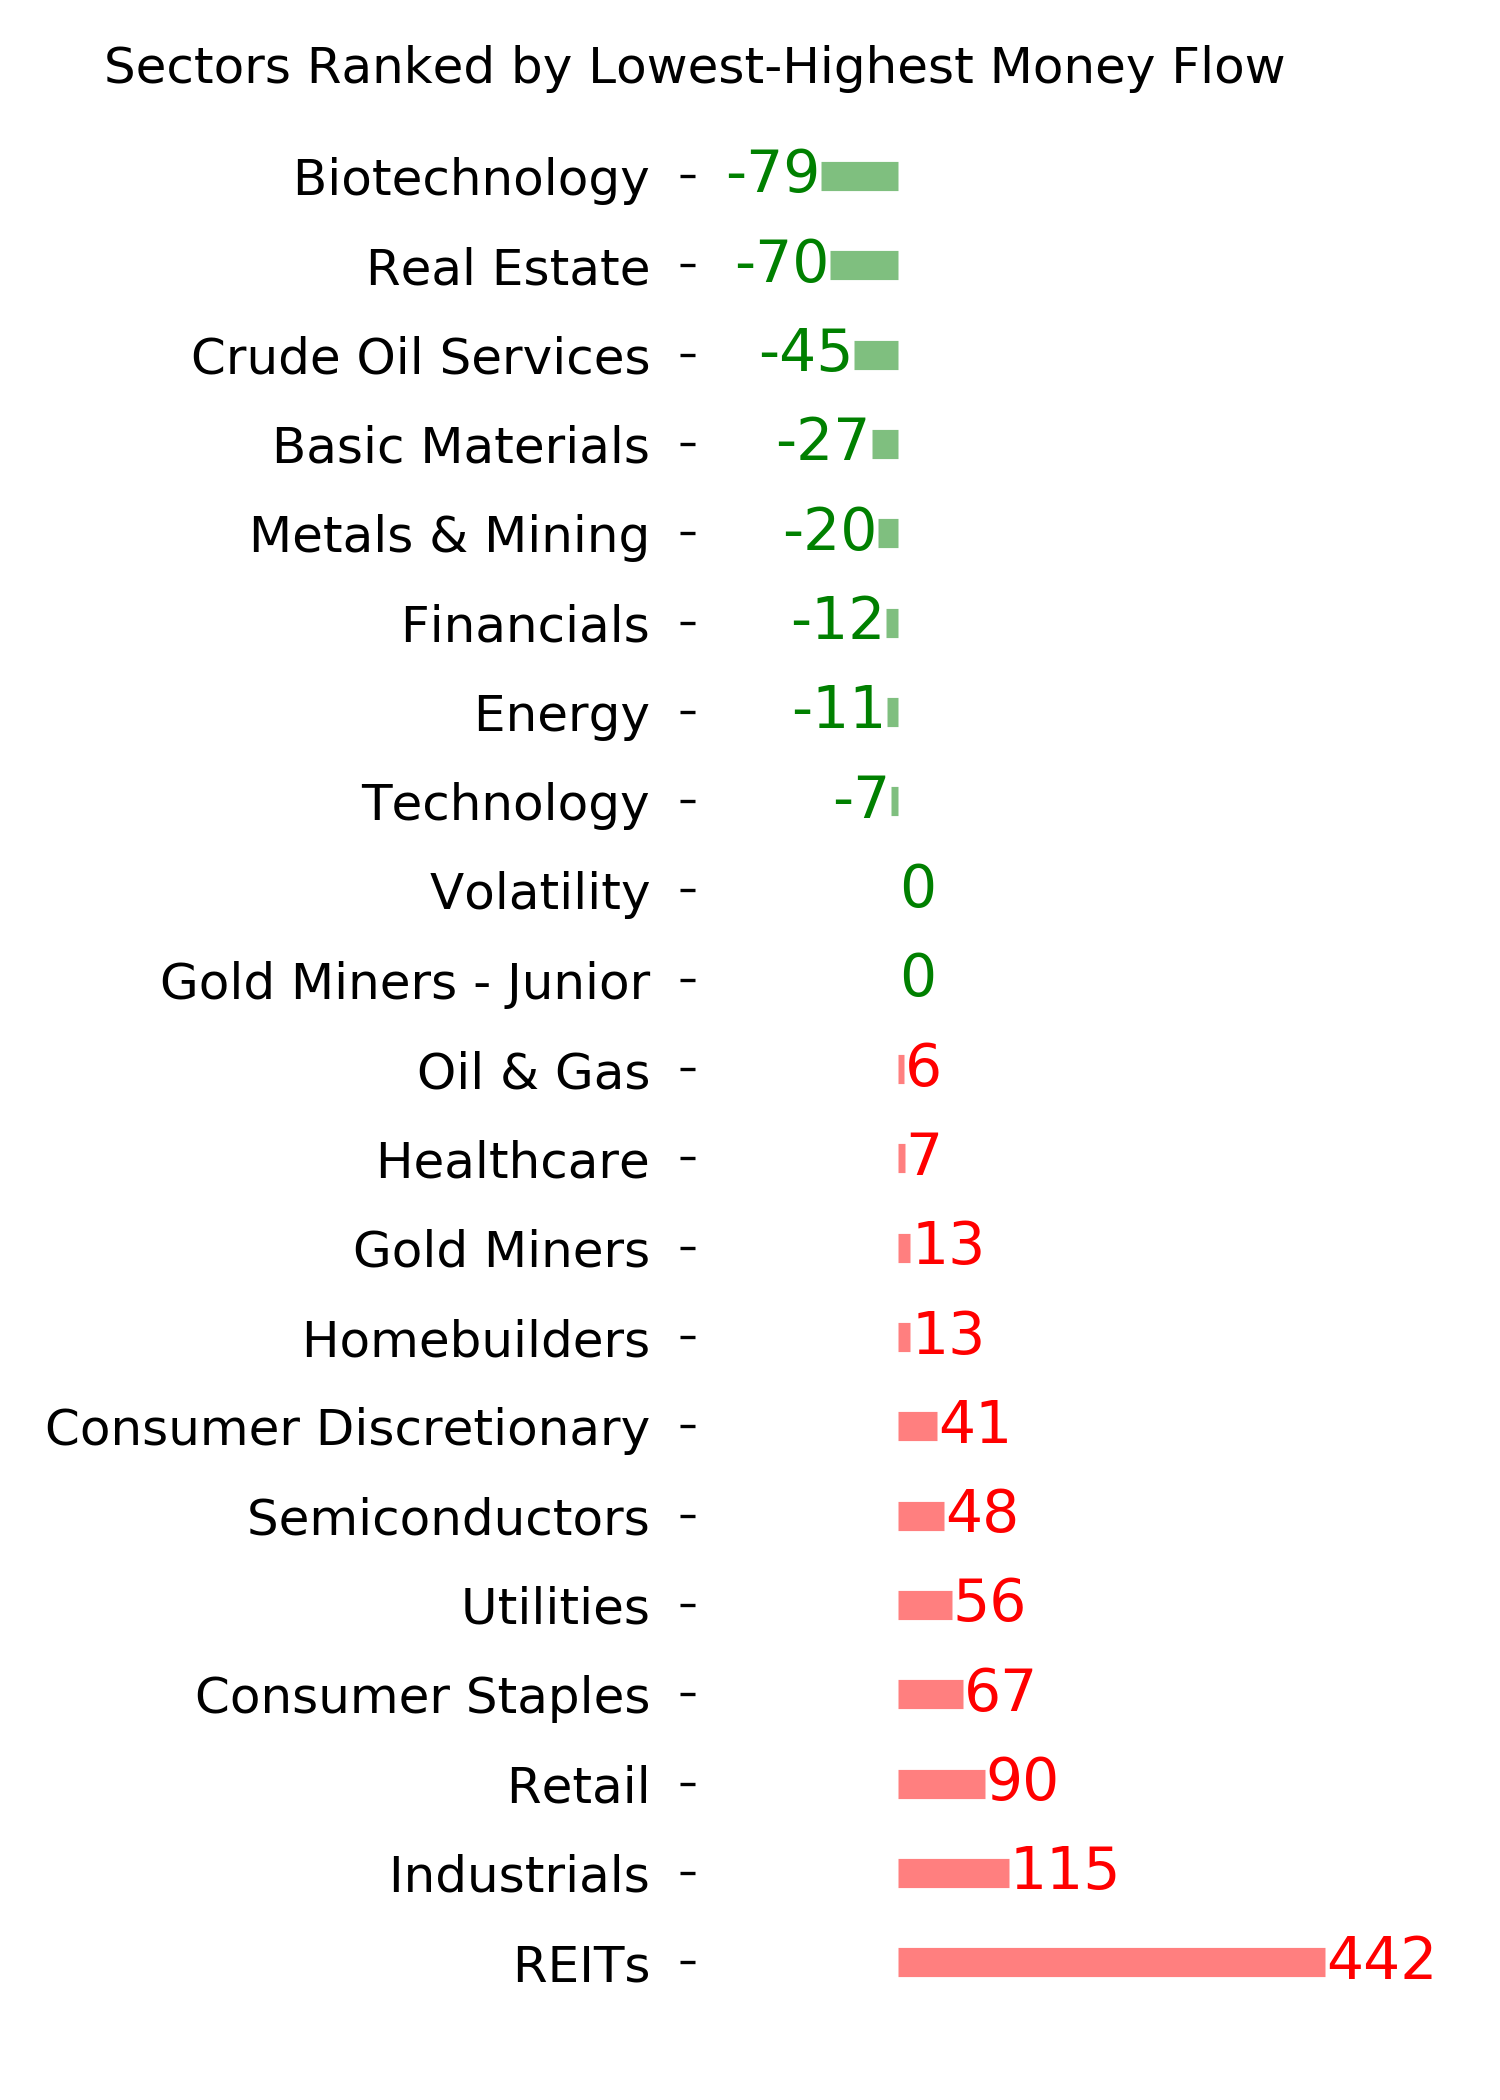
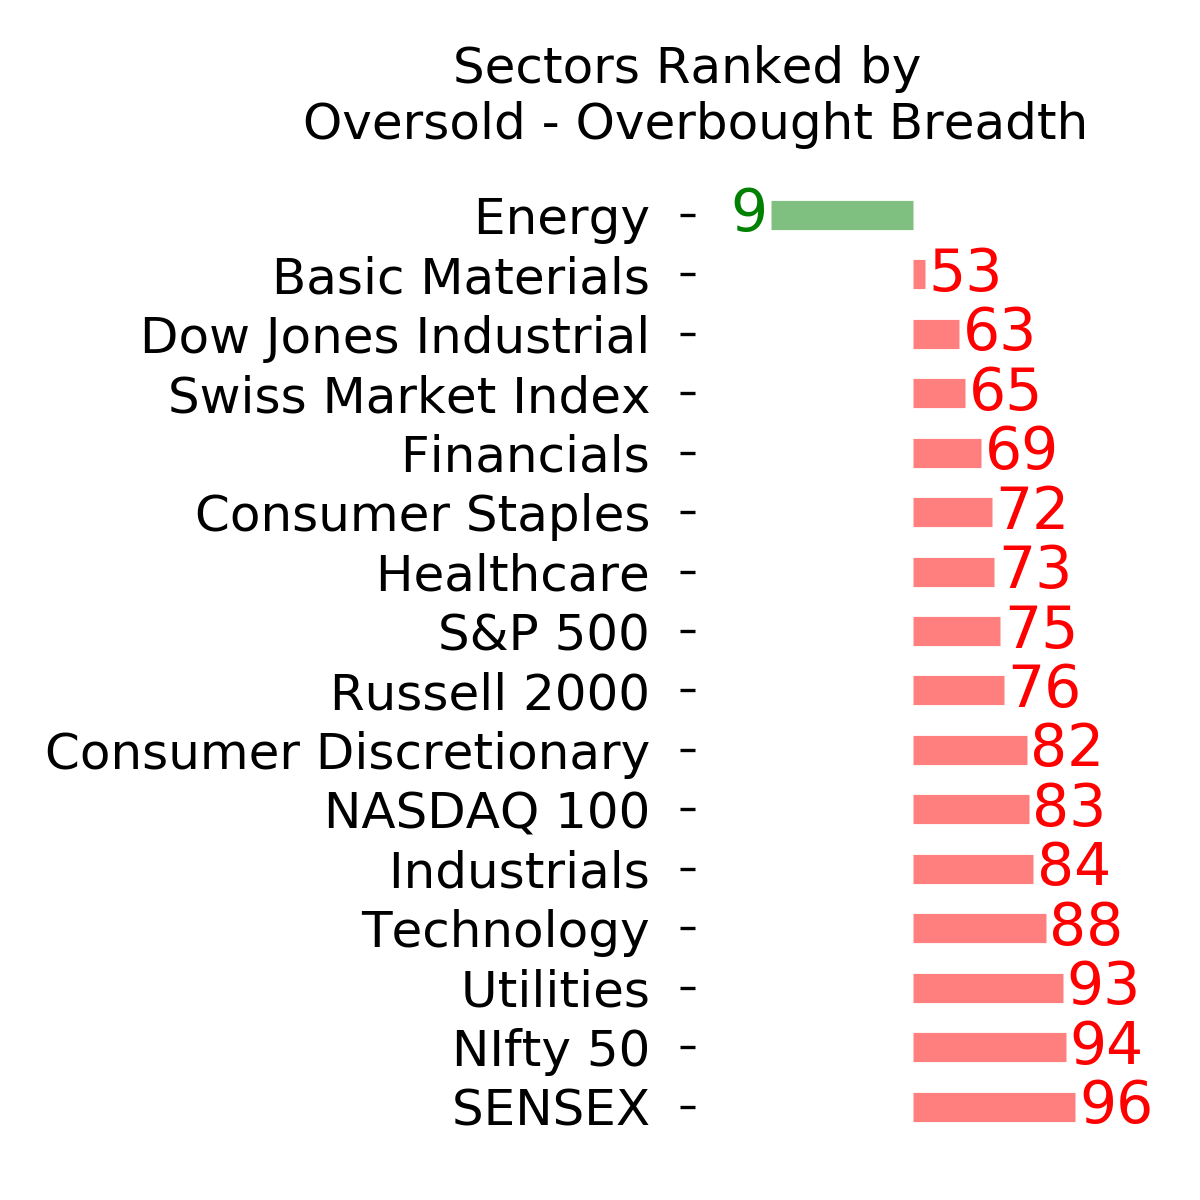
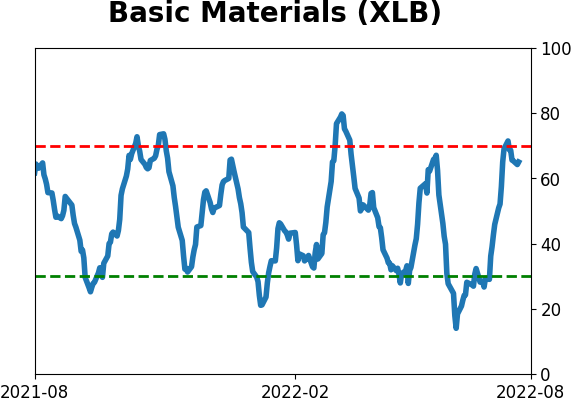
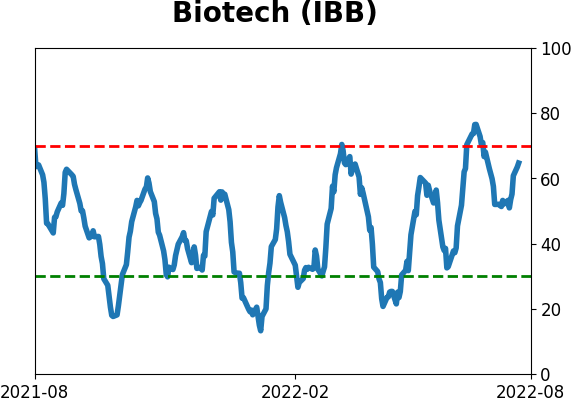
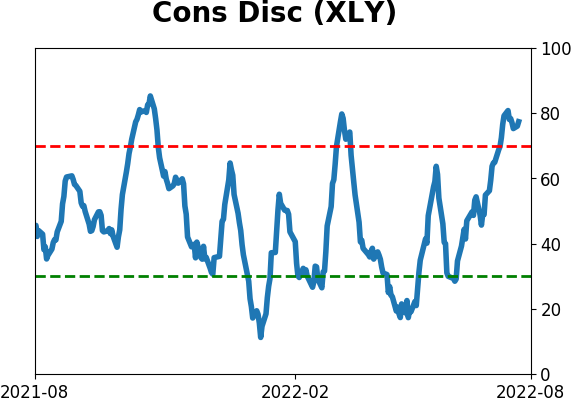
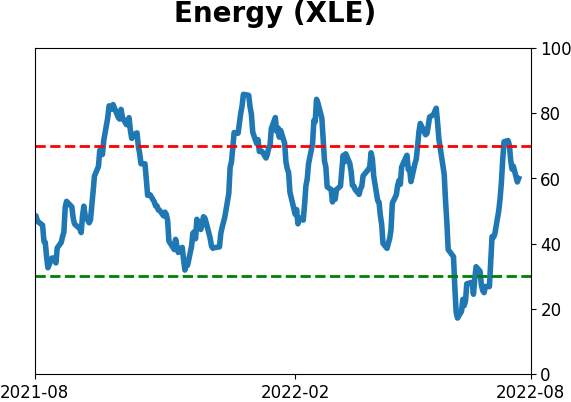
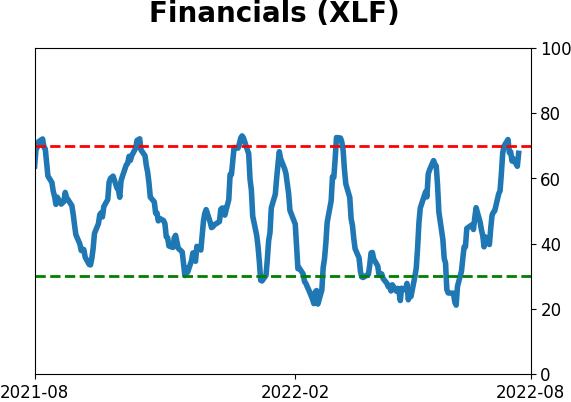
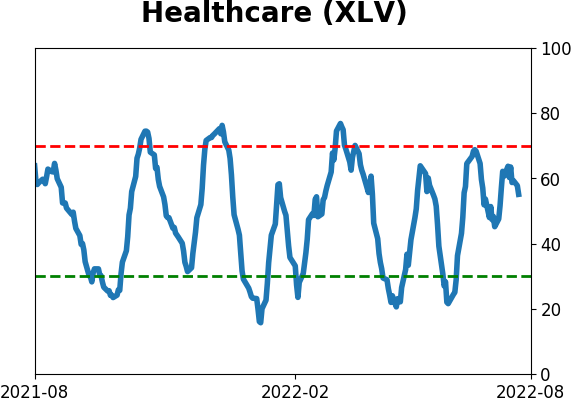
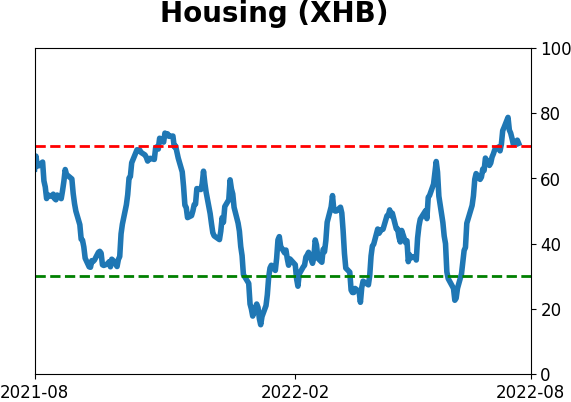
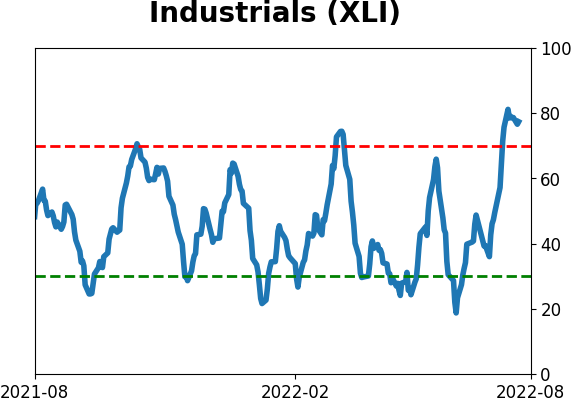
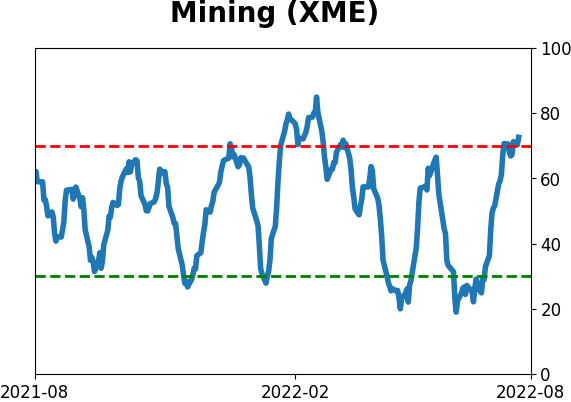
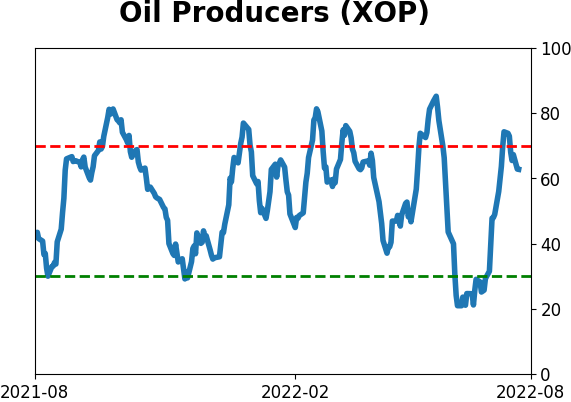
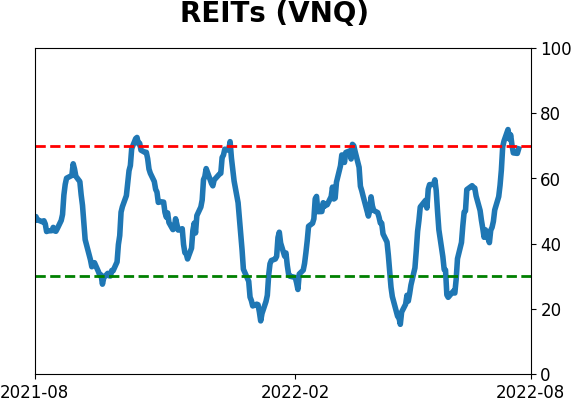
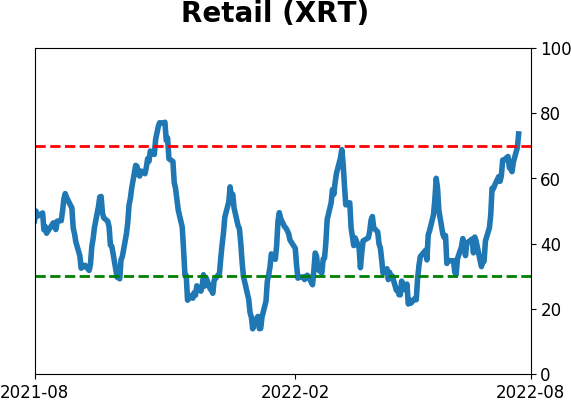
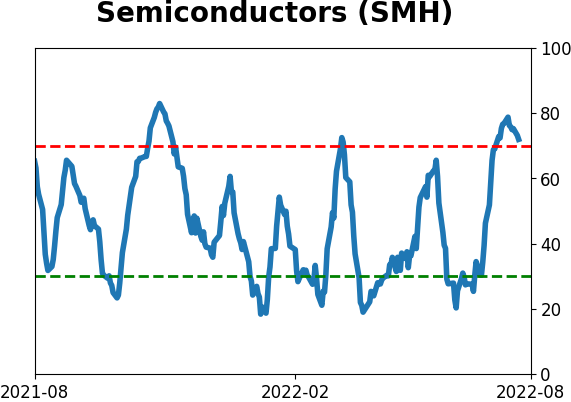
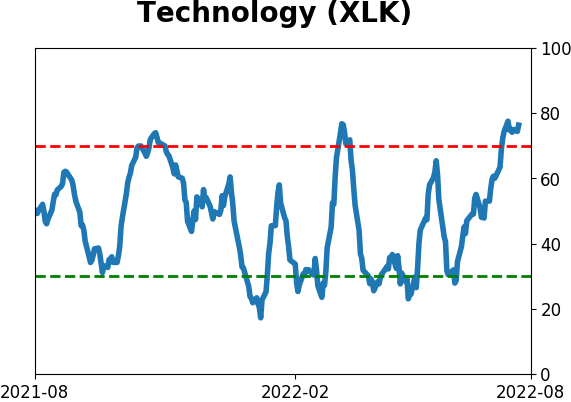
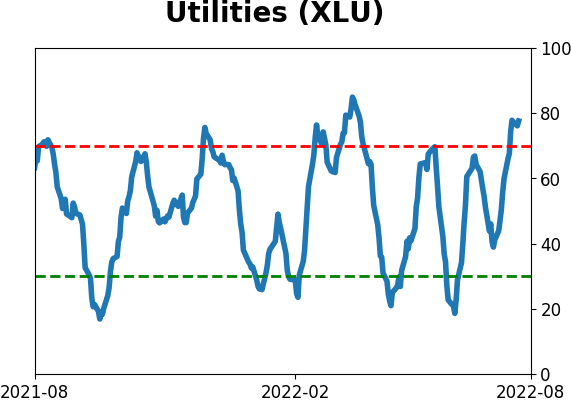
Sector ETF's - 10-Day Moving Average
|
|
|
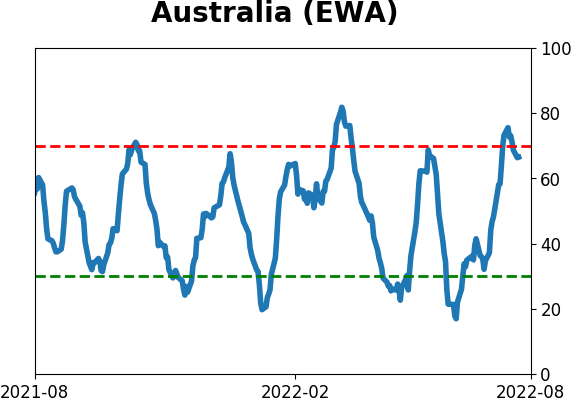
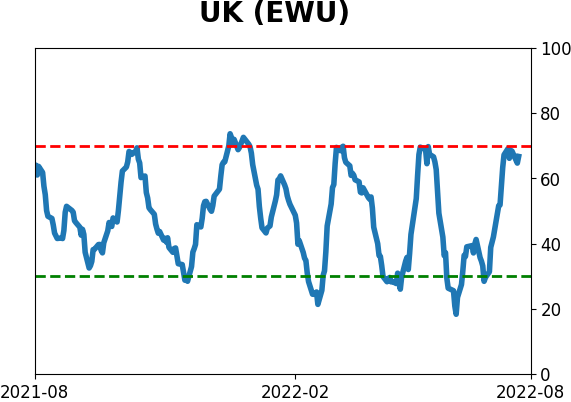
Country ETF's - 10-Day Moving Average
|
|
|
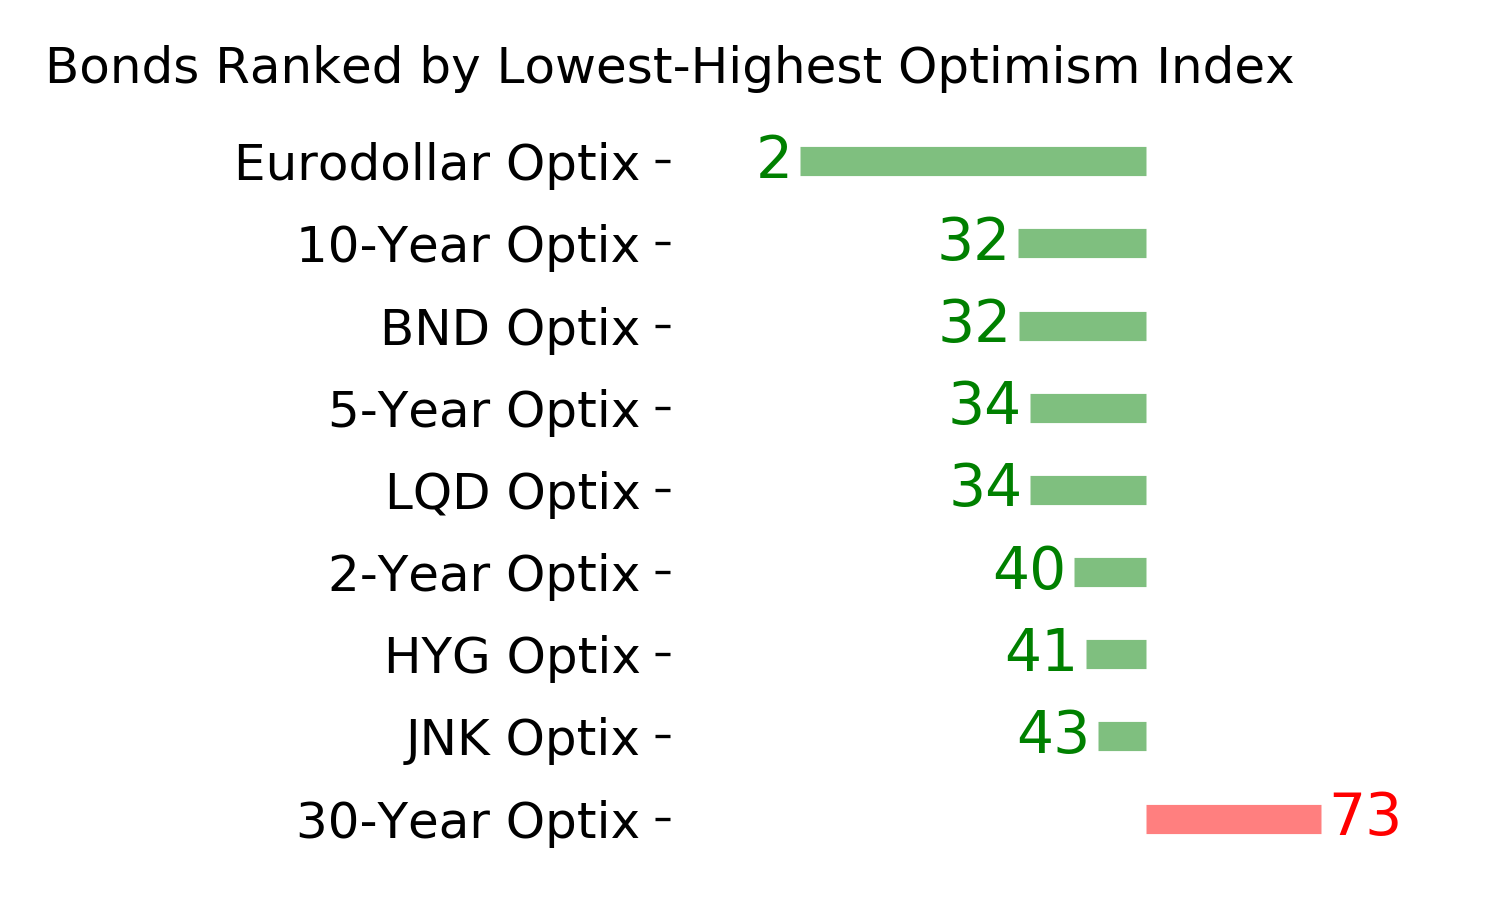
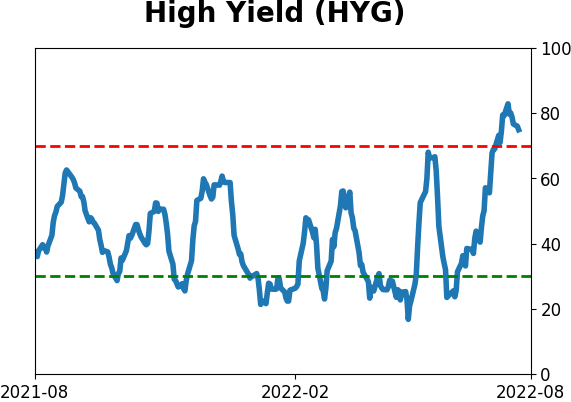
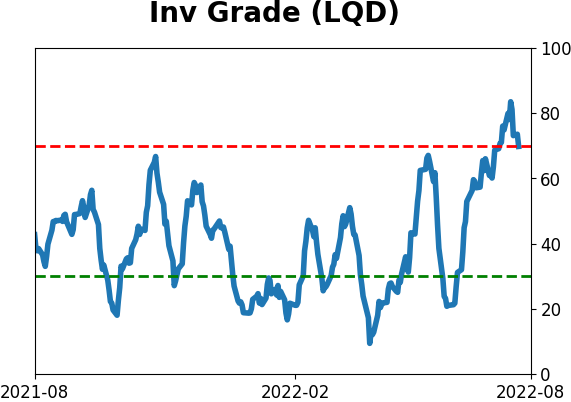
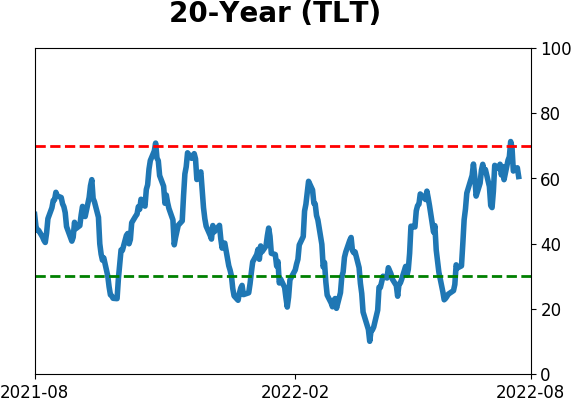
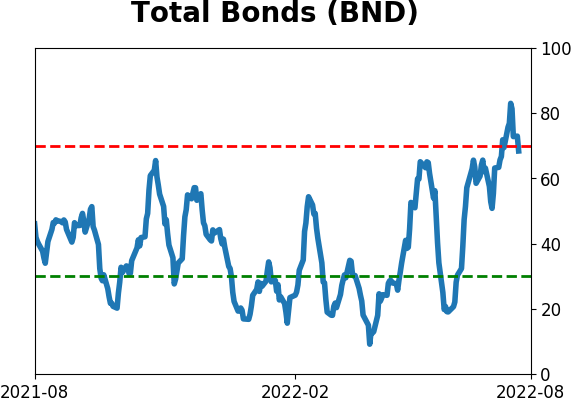
Bond ETF's - 10-Day Moving Average
|
|
|
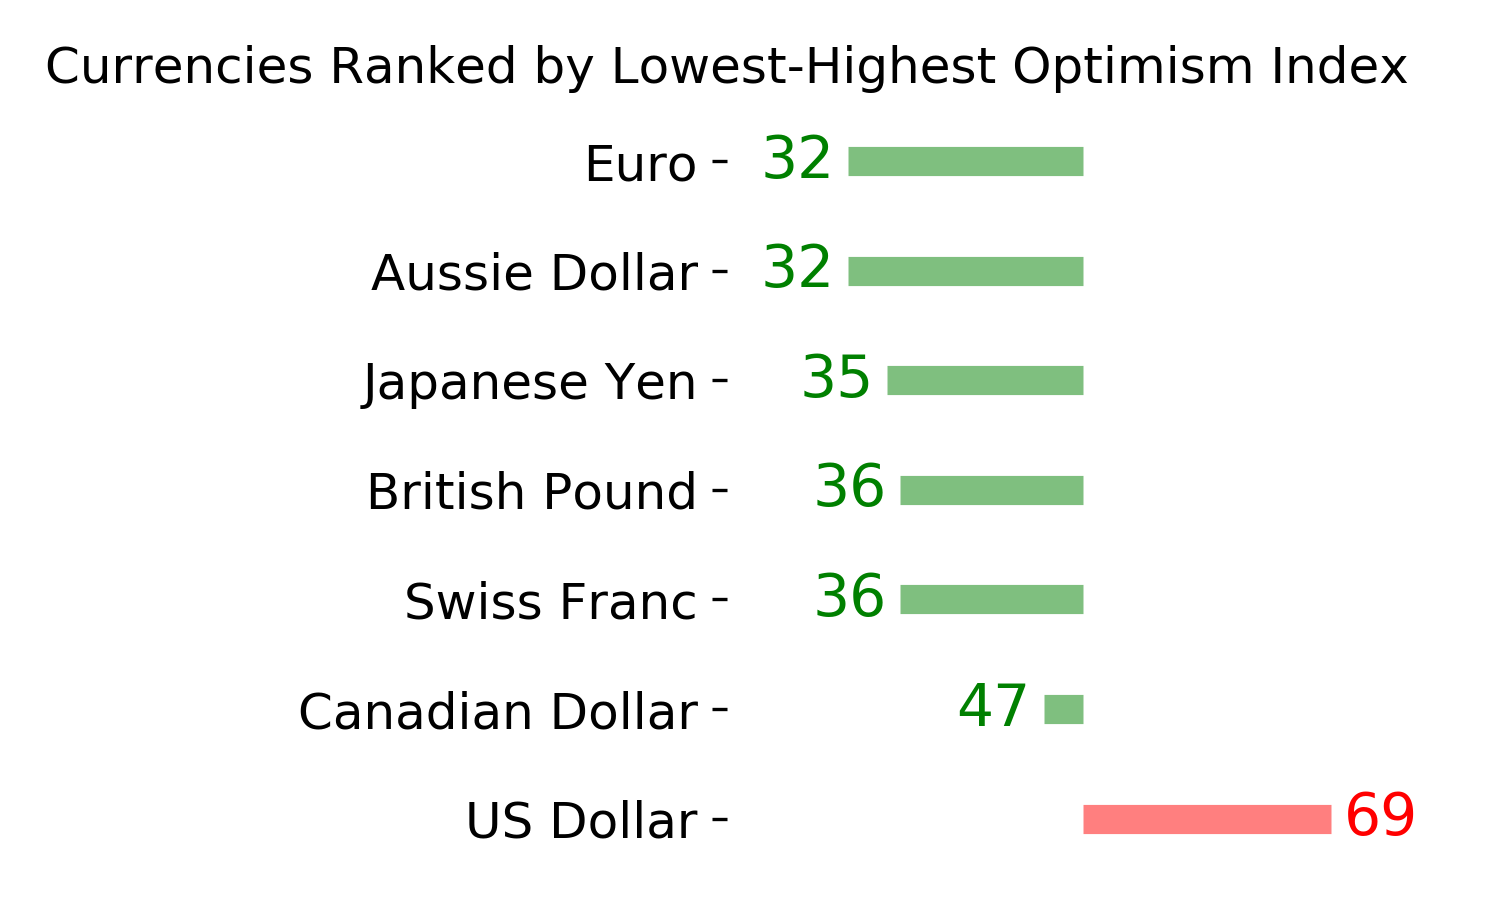
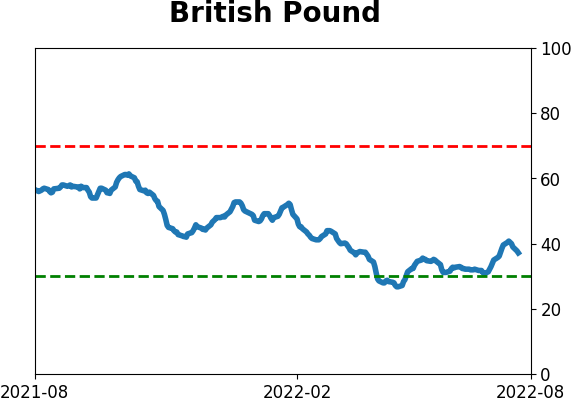
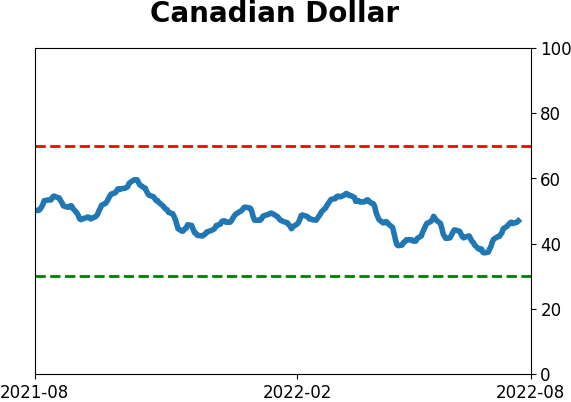
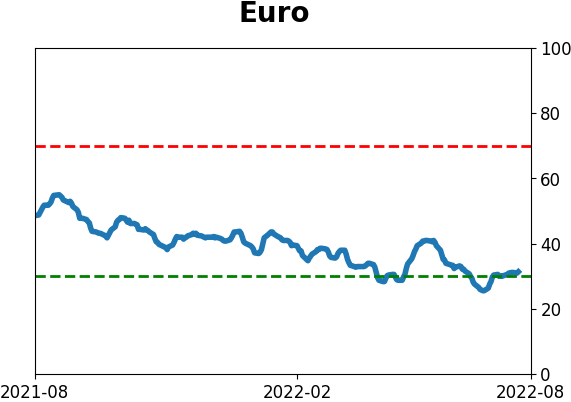
Currency ETF's - 5-Day Moving Average
|
|
|
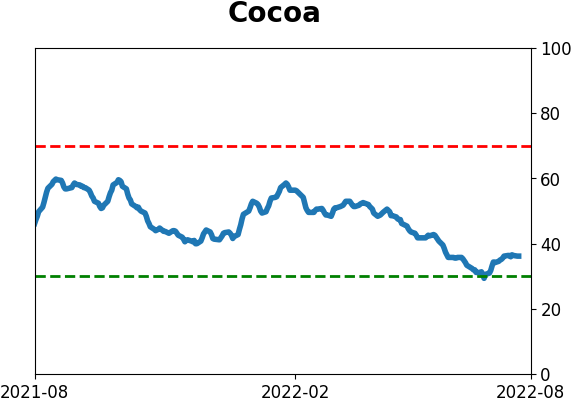
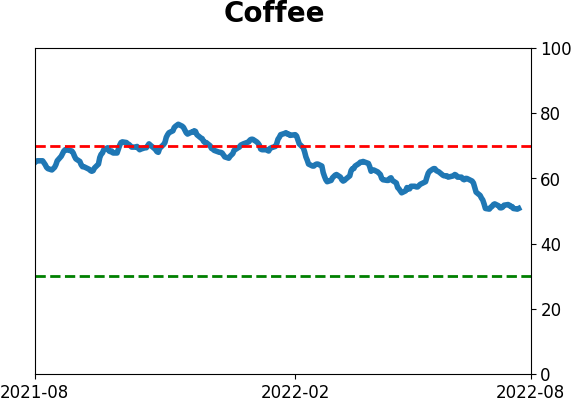
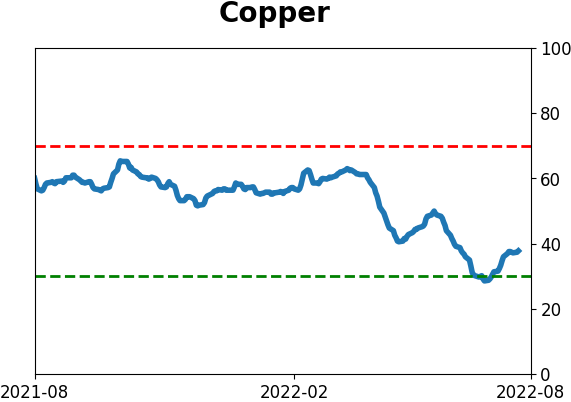
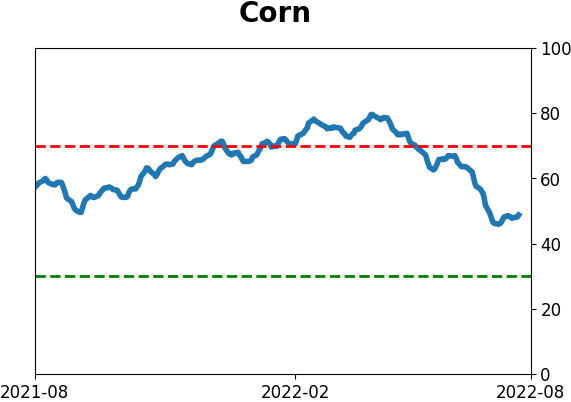
Commodity ETF's - 5-Day Moving Average
|
|