Headlines
|
|
GLD and SLV premium to NAV:
GLD and SLV are trading at a significant premium to net asset value.
S&P approaching all time highs:
The past few weeks and months have seen U.S. tech stocks rally relentlessly while other countries' stock indices bounced sideways. The tech rally managed to drag the S&P 500 towards all-time highs, which is quite amazing given all the doomsday predictions we saw in late-March.
Another type of mask: Once again on Thursday, the S&P 500's performance masked underlying weakness. The index gained more than 0.5%, yet there were more declining securities than advancing ones, and more volume flowing into those declining stocks. Of the 24 times this has triggered since 1962, 3 of them have been in just the last three weeks. See the bottom table in the July 21 post to see full results. Maybe this is a "nothing matters" market like we've seen a few times since 2009, and that would be about the only scenario for this kind of behavior to not lead to weakness.
Bottom Line:
- Weight of the evidence has been suggesting flat/lower stock prices short- to medium-term again; still suggesting higher prices long-term
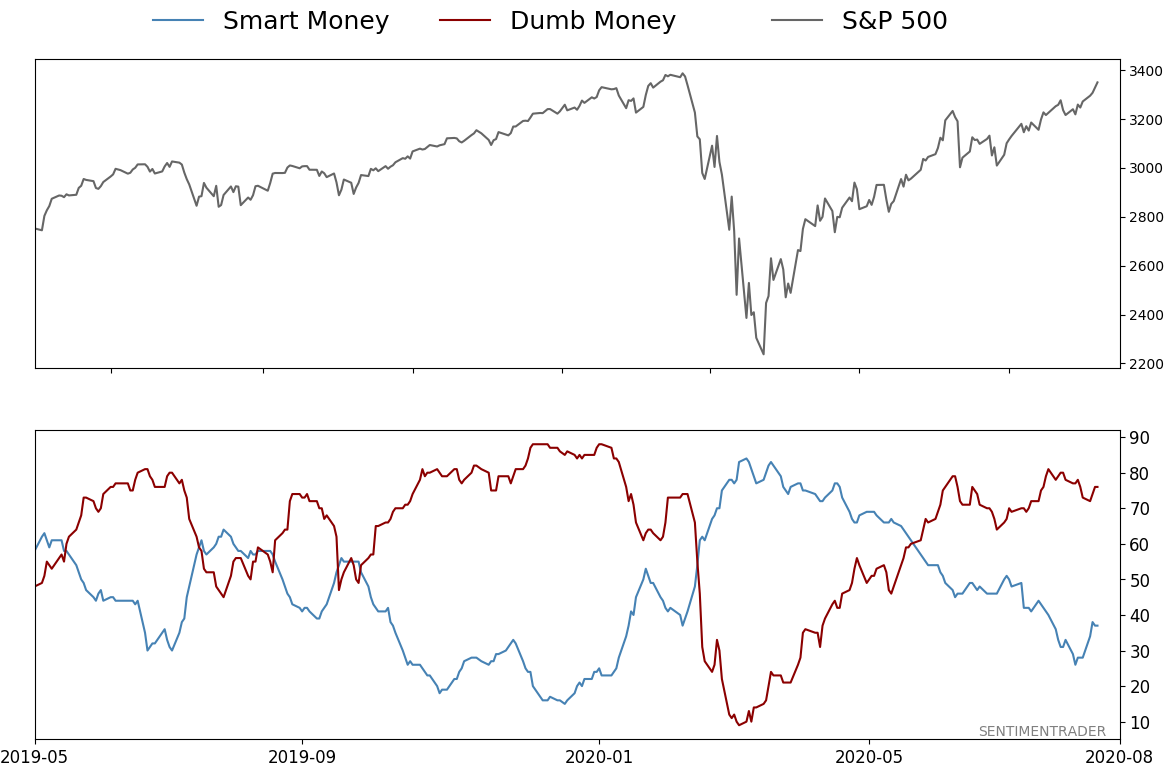
- Indicators show high optimism, with Dumb Money Confidence recently above 80% with signs of reckless speculation during what appears to be an unhealthy market environment, historically a bad combination
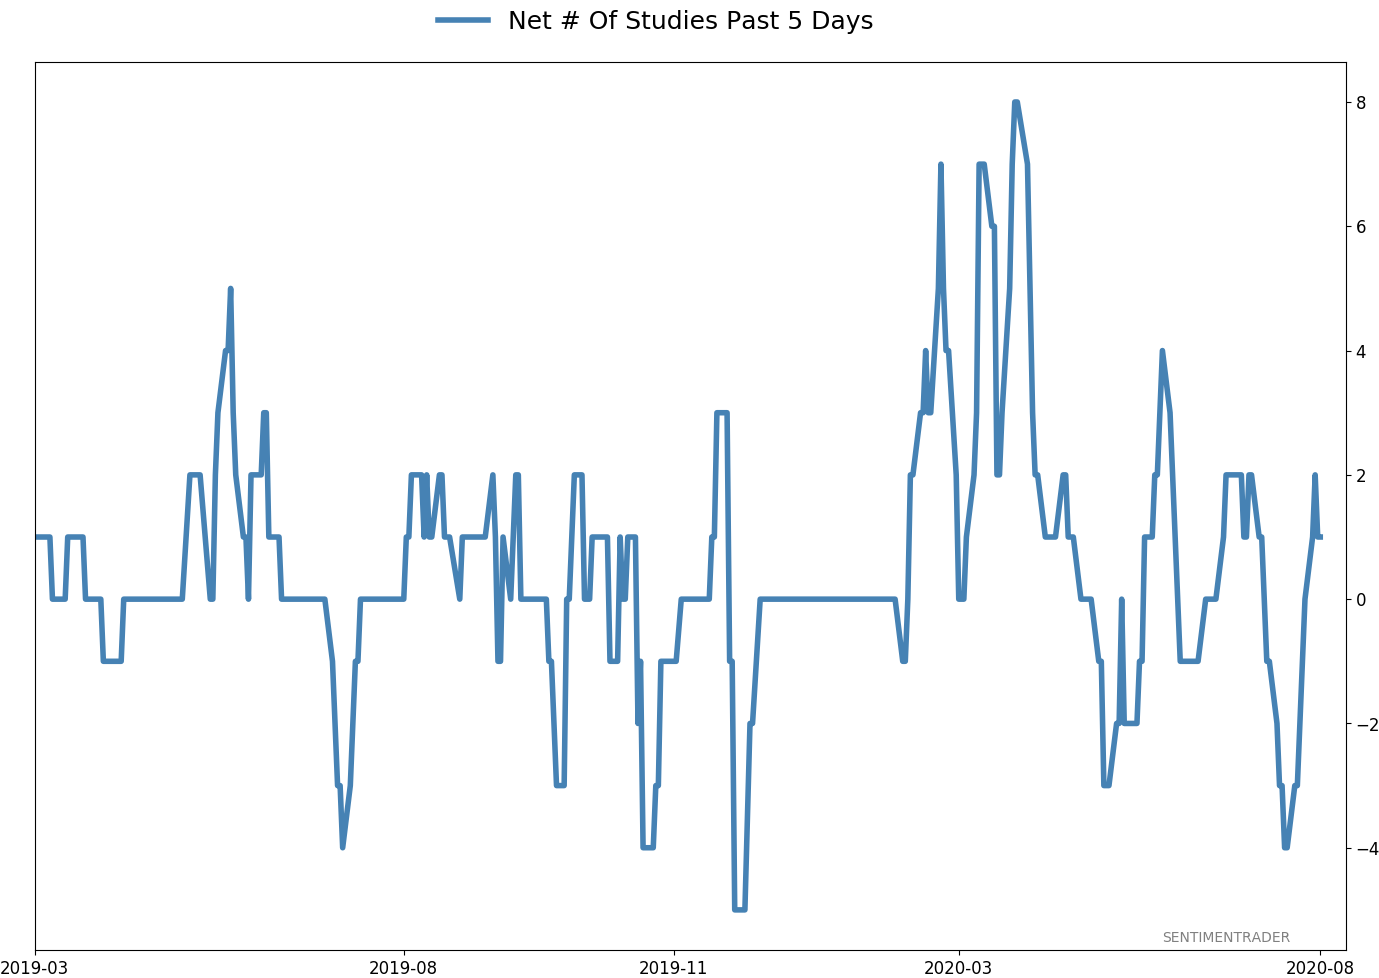
- Active Studies show a heavy positive skew over the medium- to long-term; breadth thrusts, recoveries, and trend changes have an almost unblemished record at preceding higher prices over a 6-12 month time frame
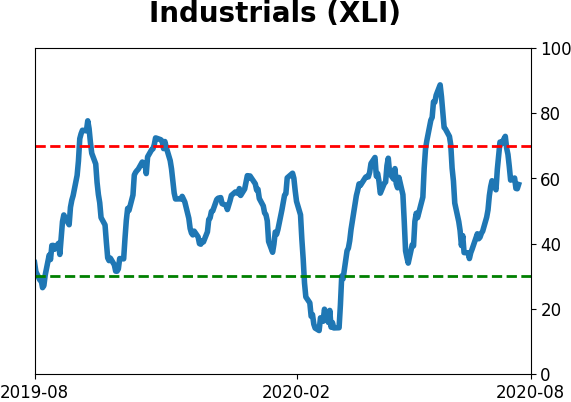
- Signs of extremely skewed preference for tech stocks neared exhaustion by late June, especially relative to industrials and financials (here and here)
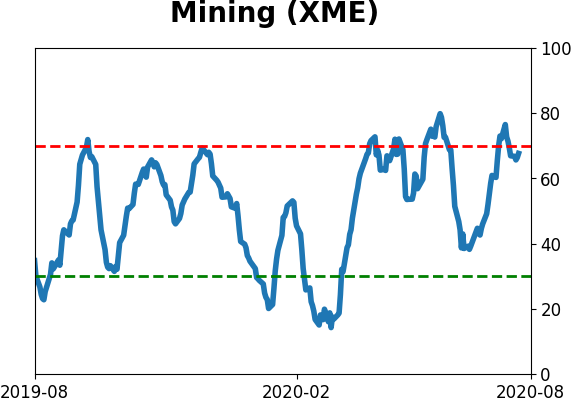
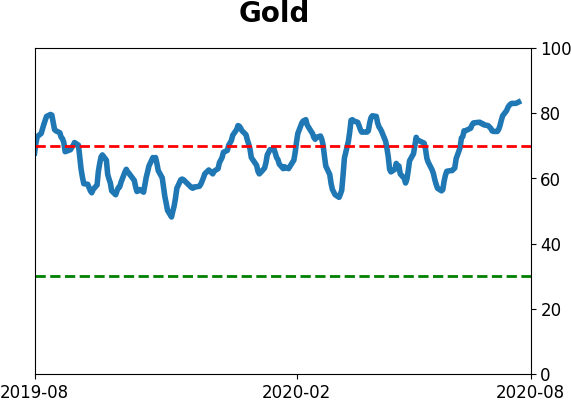
- Indicators and studies for other markets are showing less consistent forward results, though it's not a great sign for Treasuries that hedgers are net short and optimism on metals has become extreme, with "perfect" breadth among miners
|
Smart / Dumb Money Confidence
|
Smart Money Confidence: 37%
Dumb Money Confidence: 76%
|
|
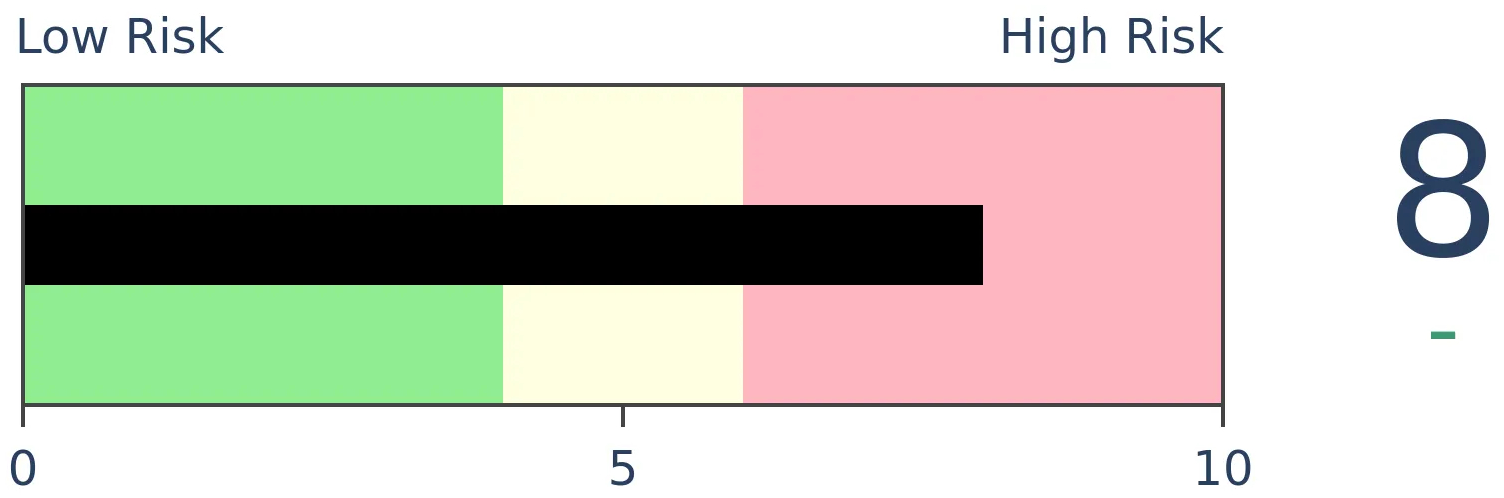
Risk Levels
Stocks Short-Term
|
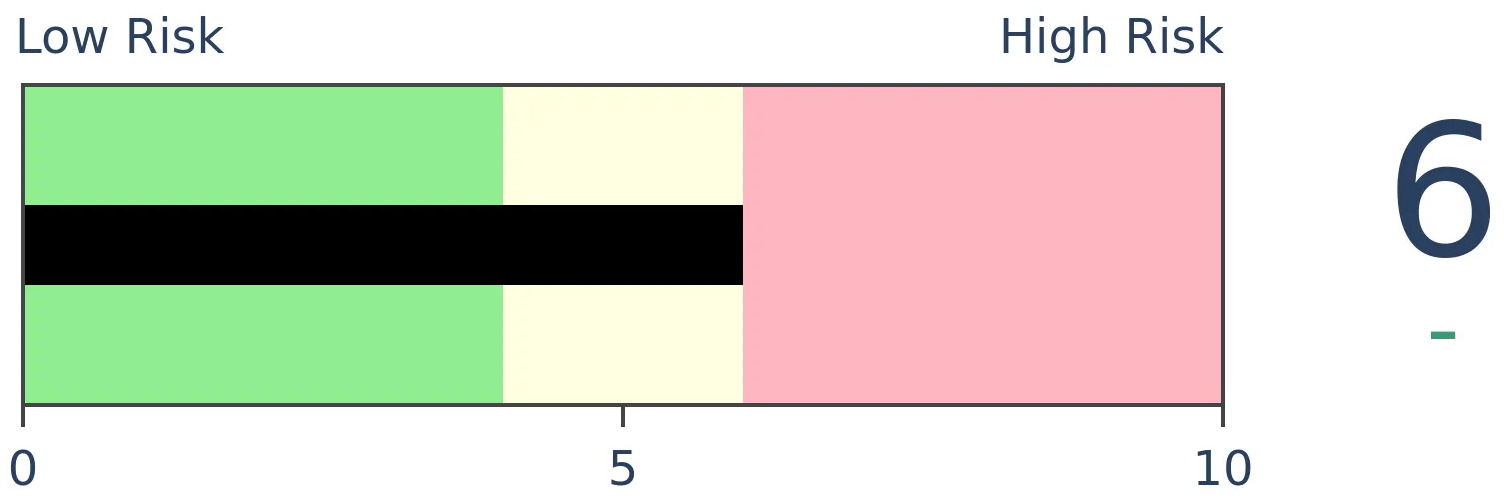
Stocks Medium-Term
|
|
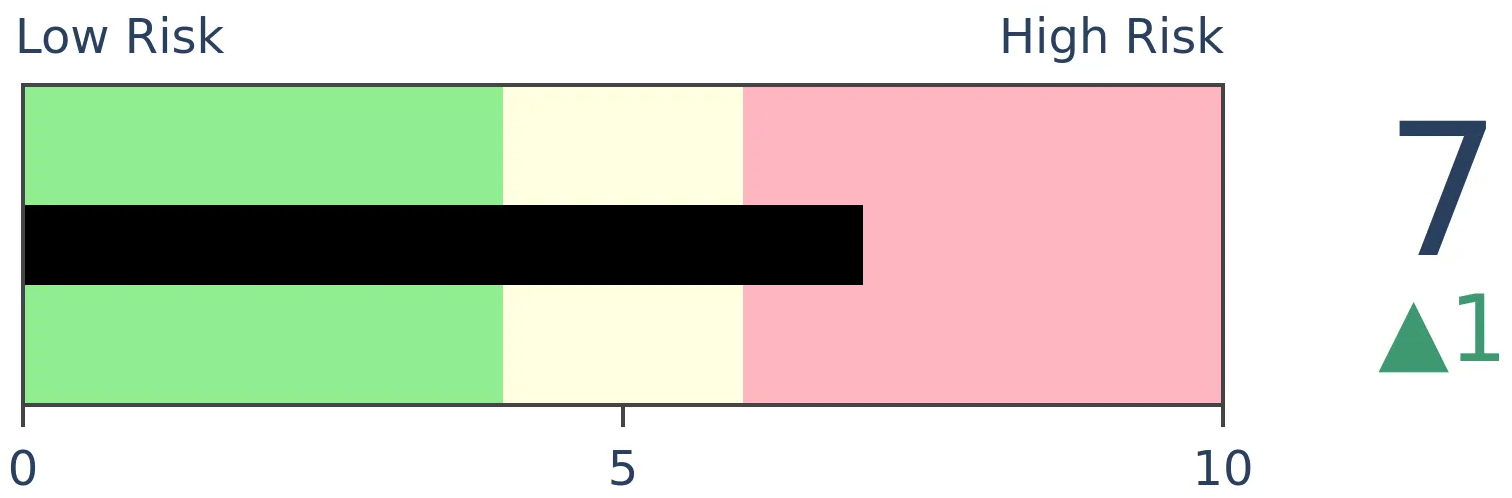
Bonds
|
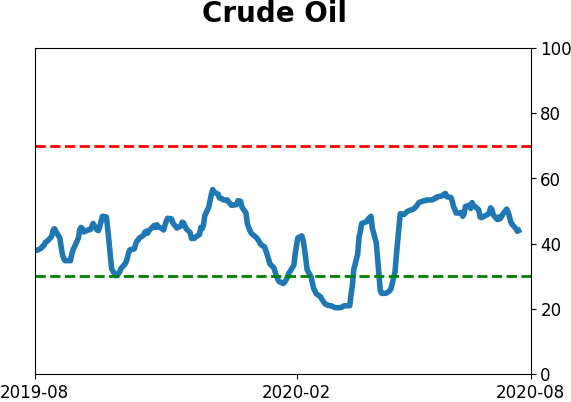
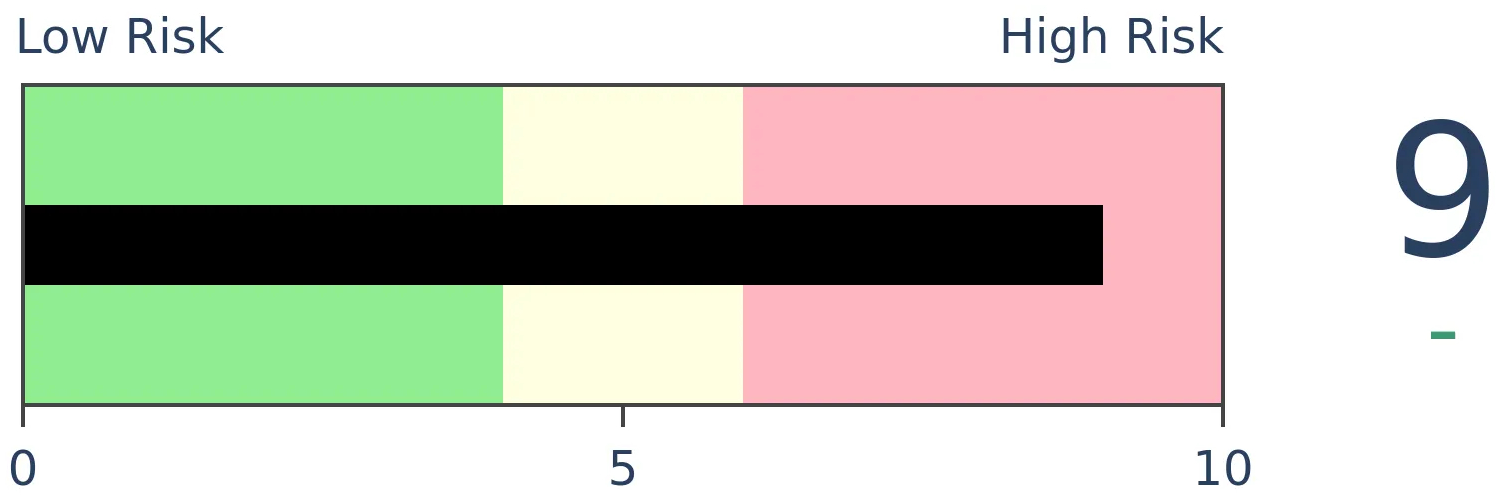
Crude Oil
|
|
Gold
|
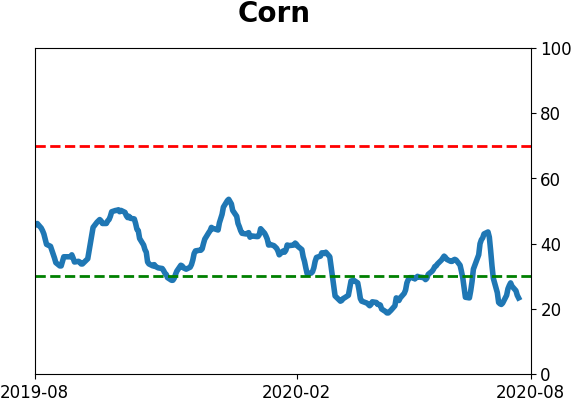
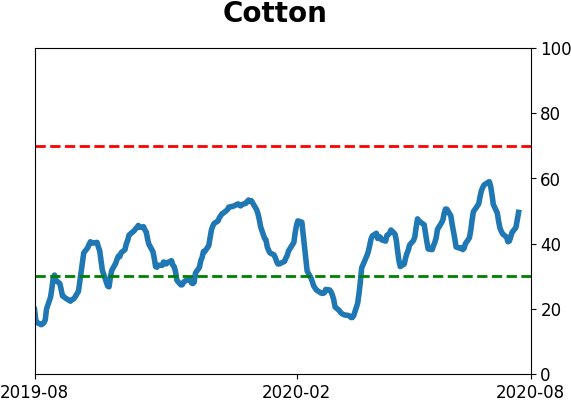
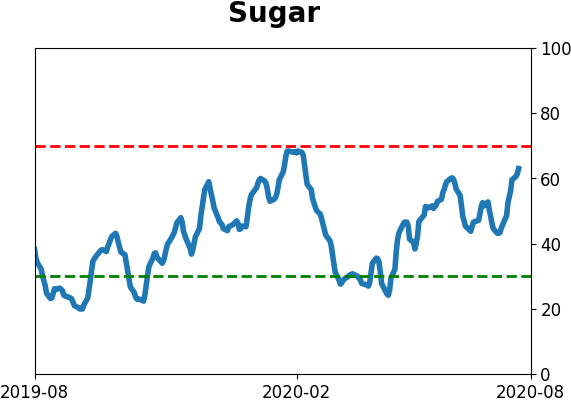
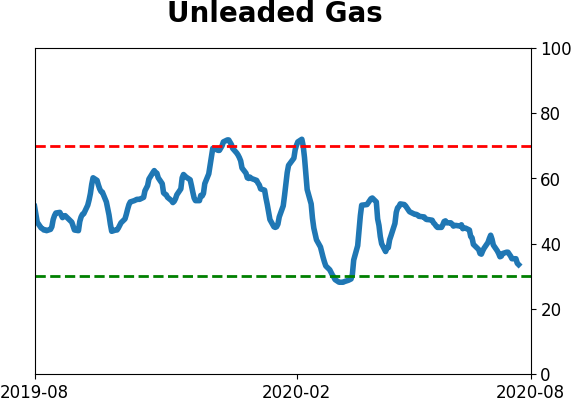
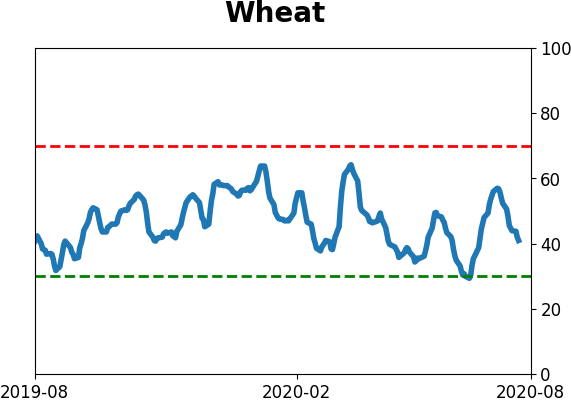
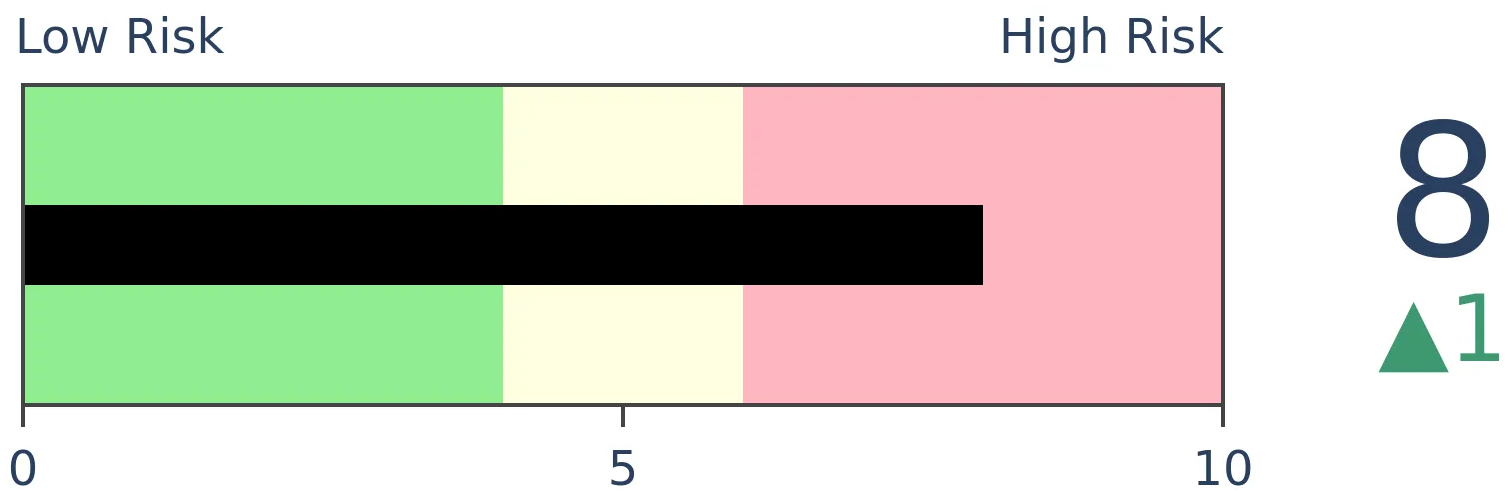
Agriculture

|
|
Research
BOTTOM LINE
GLD and SLV are trading at a significant premium to net asset value.
FORECAST / TIMEFRAME
None
|
NOTE: I (Jason) am dealing with some family health issues, so I'm re-publishing Troy's note with some quick notes from myself, noted with [Jason]
As The Market Ear noted, GLD and SLV are trading at a significant premium to net asset value. This is to be expected given investors' and traders' headlong rush towards precious metals. Looking at a longer term version of this indicator, GLD premium to Net Asset Value (NAV)'s 100 day average is at the 3rd highest level of all time. The last 2 spikes occurred during the previous 2 precious metals bull markets:
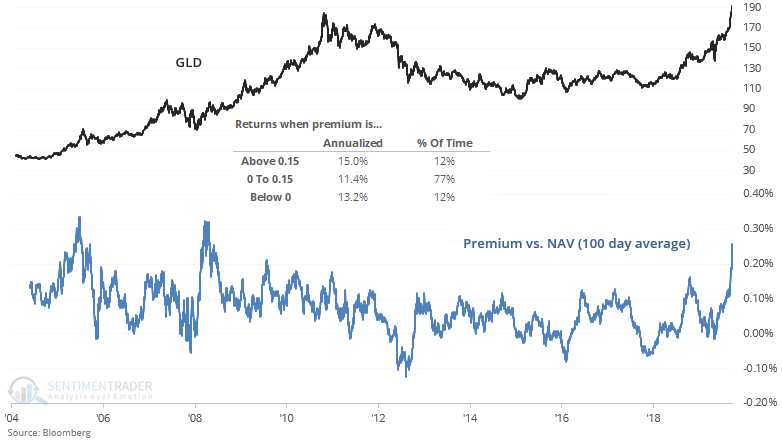
Those 2 historical cases saw gold climb further in the short term (animal spirits!) before a multi-month pullback/correction began.
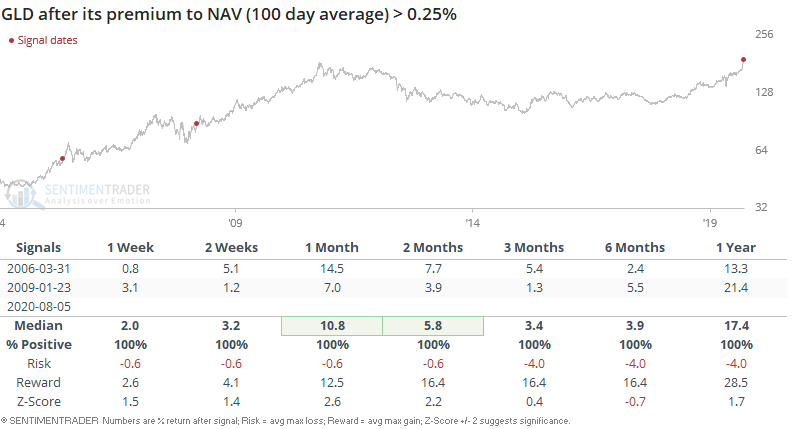
[Jason]: The annualized return for GLD is actually higher when the premium is above .15% than it is when the fund is trading at a persistent discount. While some of the extremes in premium/discount preceded peaks/troughs in gold, respectively, trying to identify those peaks/troughs in real-time proved inconsistent. GLD's premium is higher than any over the past decade, lending more credence to the idea that we'll probably have more success using precedents from the 2000s bull market rather than the last decade, the potential for which we started noting last July. Some of the shorter-term extremes in gold are definitely worrying from a risk/reward perspective, but longer-term it is hard to ignore the fact that the metal itself has ignored some extremes in recent months.
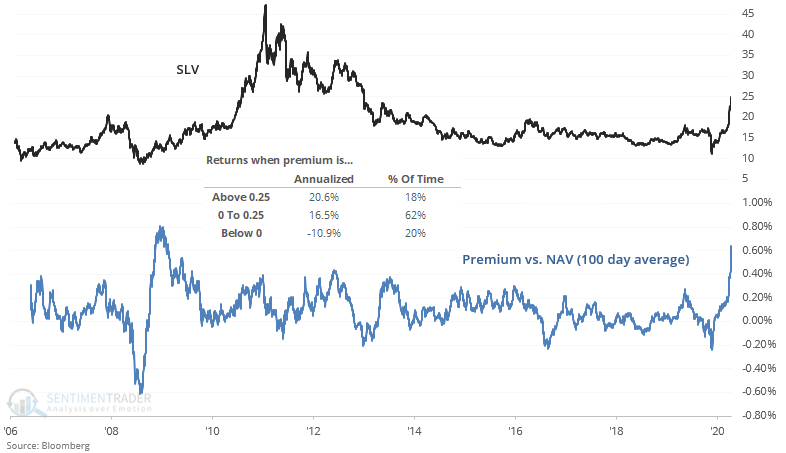
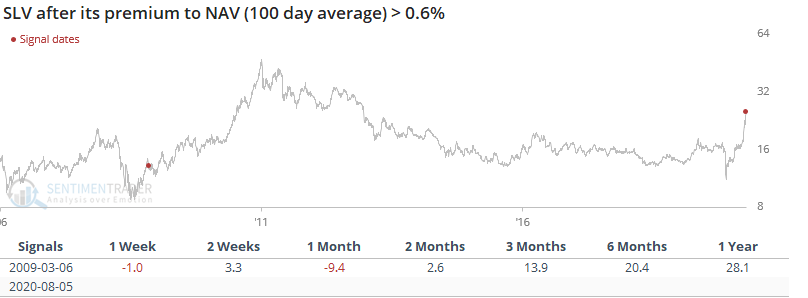
Similarly, SLV premium to Net Asset Value's 100 day average is at the 2nd highest level of all time:
The record in early-2009 occurred as silver began a multi-year bull market. Back then, silver made a sharp correction before trending higher:
[Jason]: Like GLD, SLV actually showed better annualized returns when it had been at a persistent premium than a discount. Again, extremes in the premium/discount highlighted some extremes in SLV, but they were relatively short-term in effectiveness.
BOTTOM LINE
The past few weeks and months have seen U.S. tech stocks rally relentlessly while other countries' stock indices bounced sideways. The tech rally managed to drag the S&P 500 towards all-time highs, which is quite amazing given all the doomsday predictions we saw in late-March.
FORECAST / TIMEFRAME
None
|
NOTE: I (Jason) am dealing with some family health issues, so I'm re-publishing Troy's note with some quick notes from myself, noted with [Jason]
The past few weeks and months have seen U.S. tech stocks rally relentlessly while other countries' stock indices bounced sideways. The tech rally managed to drag the S&P 500 towards all-time highs, which is quite amazing given all the doomsday predictions we saw in late-March.
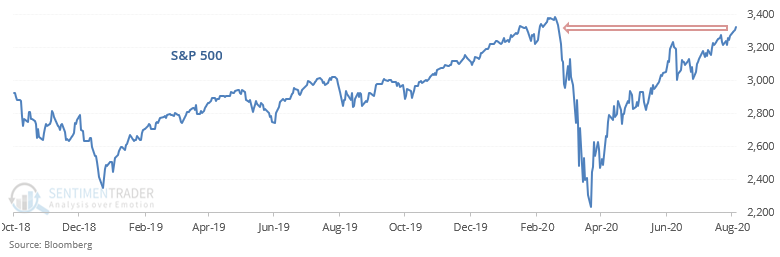
The S&P is now less than -2% from its all-time high. When the S&P cycled from bear market territory to within -2% of a 1 year high, the S&P usually trended higher over the next 2+ months:
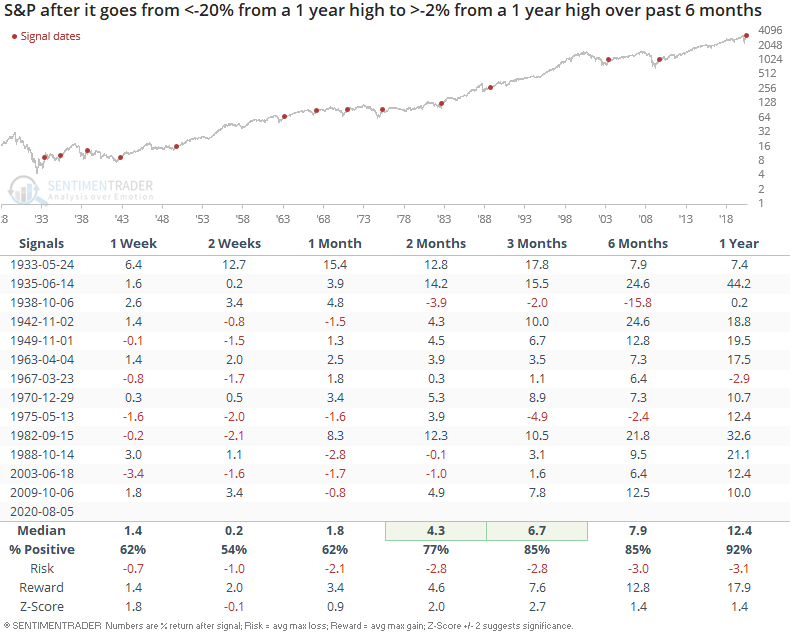
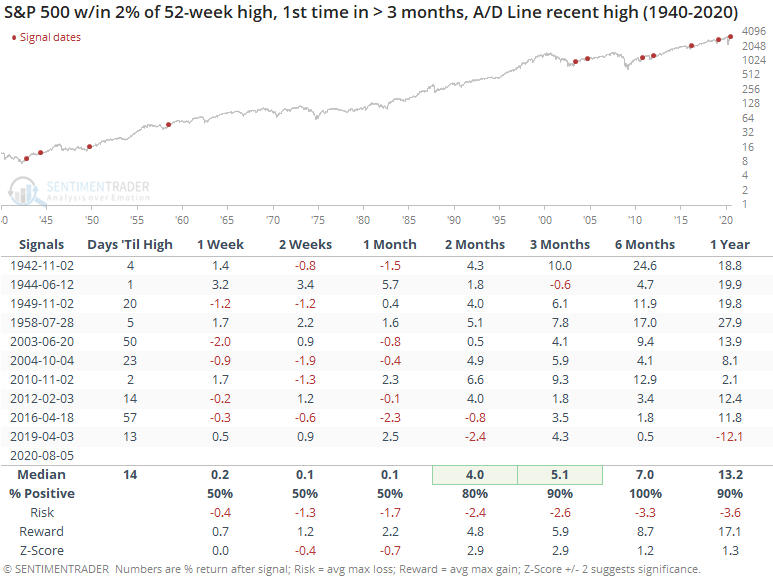
[Jason]: We also know that the Advance/Decline Line is hitting new highs, suggesting a broad rally. That isn't really the case, and we're still seeing a somewhat poor environment coupled with high optimism, but the recent run has been persistent enough that even though (relatively) few securities are advancing, they've been advancing long enough that the line is hitting new highs. When we see that in combination with the S&P approaching its prior highs, the S&P has always been able to eclipse its prior high within 60 days, usually much quicker. How do we square that with the negatives that have cropped up over the past 1-2 months? I don't think we can, we just need to weigh which is more important. So far, momentum has clearly been winning out, even if the rally has tapered off some. Given the environment/sentiment combination in recent weeks, it still seems likely that reward should be limited, with a high probability that the gains will be given back at some point in the coming months.
One of the big complaints during the entire course of this rally is "weak breadth". Breath is still weak, but at least for the NASDAQ Composite is ever so slightly improving. 52% of the NASDAQ Composite's members are now above their 200 dma:
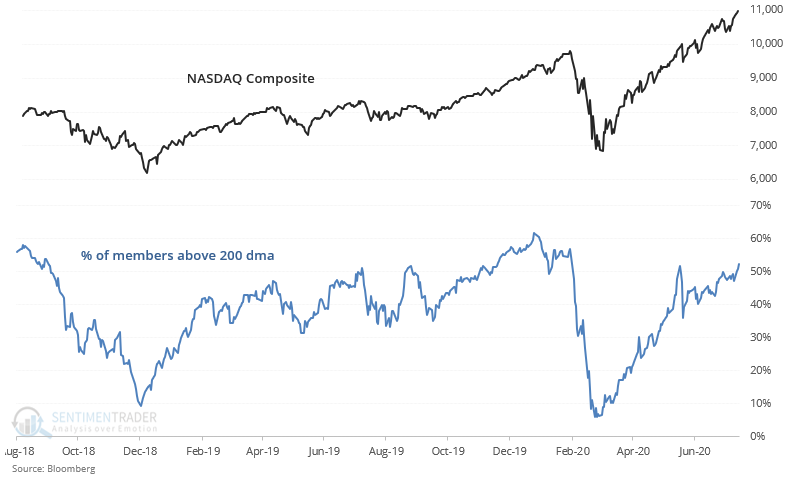
When this happened in the past, the NASDAQ Composite usually rallied over the next 3 months:
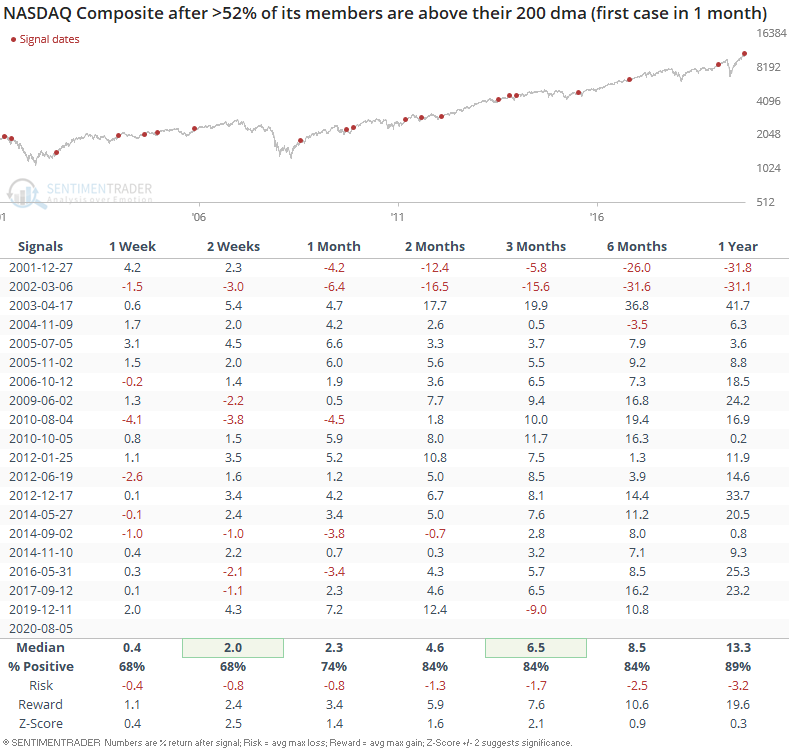
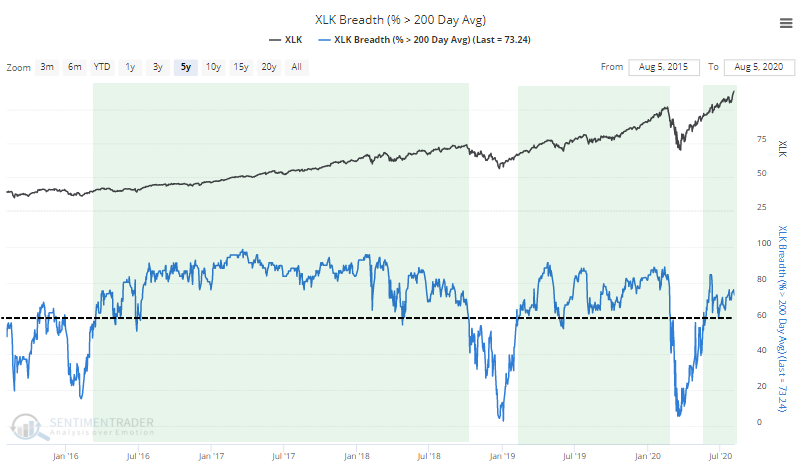
[Jason]: Unlike what we're seeing within the S&P 500 (and industries, sectors, and countries), more than 60% of stocks in the S&P tech sector have consistently been holding above their 200-day moving averages. This is a hallmark of healthy markets, so for this sector, anyway, it's bucking the broader environment.
Active Studies
| Time Frame | Bullish | Bearish | | Short-Term | 0 | 1 | | Medium-Term | 8 | 11 | | Long-Term | 46 | 1 |
|
Indicators at Extremes
Portfolio
| Position | Weight % | Added / Reduced | Date | | Stocks | 29.8 | Reduced 9.1% | 2020-06-11 | | Bonds | 0.0 | Reduced 6.7% | 2020-02-28 | | Commodities | 5.2 | Added 2.4%
| 2020-02-28 | | Precious Metals | 0.0 | Reduced 3.6% | 2020-02-28 | | Special Situations | 0.0 | Reduced 31.9% | 2020-03-17 | | Cash | 65.0 | | |
|
Updates (Changes made today are underlined)
After stocks bottomed on March 23rd, they enjoyed a historic buying thrust and retraced a larger amount of the decline than "just a bear market rally" tends to. Through June, there were signs of breadth thrusts, recoveries, and trend changes that have an almost unblemished record at preceding higher prices over a 6-12 month time frame. On a shorter-term basis, our indicators have been showing high optimism, with Dumb Money Confidence recently above 80%, along with signs of reckless speculation during what appears to be an unhealthy market environment, historically a bad combination. While there are certainly some outlier indicators that are showing apathy or even outright pessimism, a weight-of-the-evidence approach suggests high risk over a multi-week to multi-month time frame. I've been carrying a low (too low) level of exposure to stocks, as well as bonds and gold. I don't see a good opportunity to add to any of those currently, with poor prospects pretty much all the way around. As worried as I am over the medium-term, I would only grudgingly reduce my exposure even further given the longer-term positives we spent so much time discussing in the spring. At this point, I would only look seriously at lowering exposure further if the S&P 500 drops below approximately 3220, an initial sign that its recent mini-breakout had failed.
RETURN YTD: -2.8% 2019: 12.6%, 2018: 0.6%, 2017: 3.8%, 2016: 17.1%, 2015: 9.2%, 2014: 14.5%, 2013: 2.2%, 2012: 10.8%, 2011: 16.5%, 2010: 15.3%, 2009: 23.9%, 2008: 16.2%, 2007: 7.8%
|
|
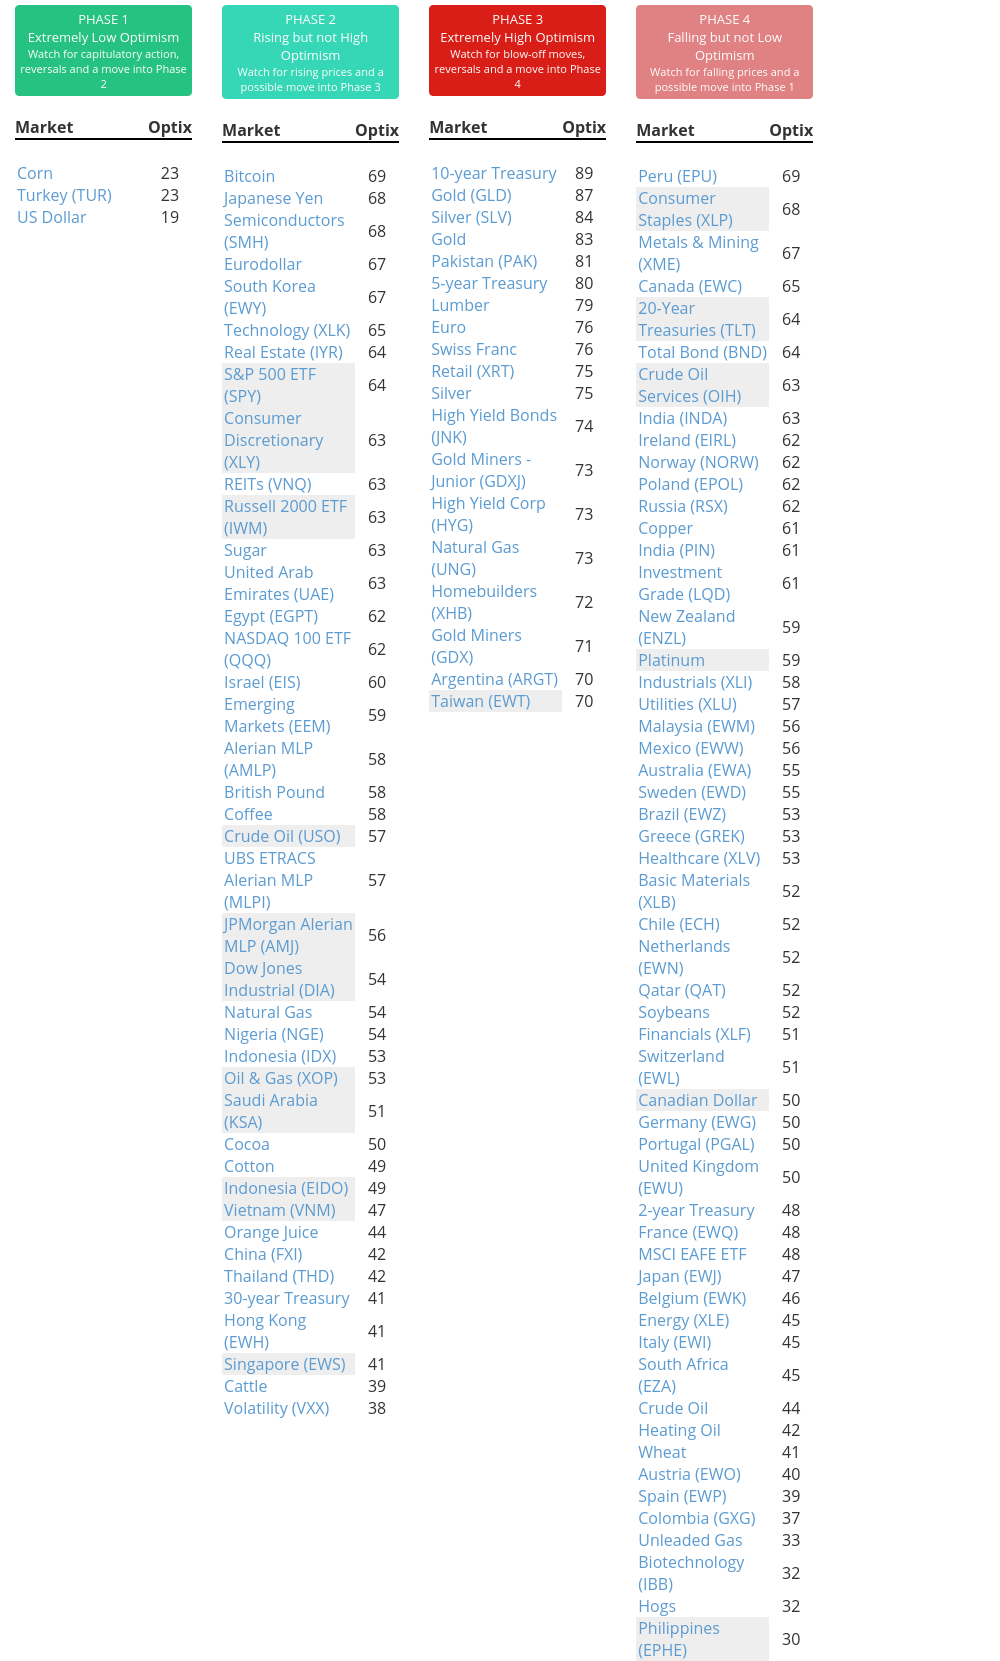
Phase Table
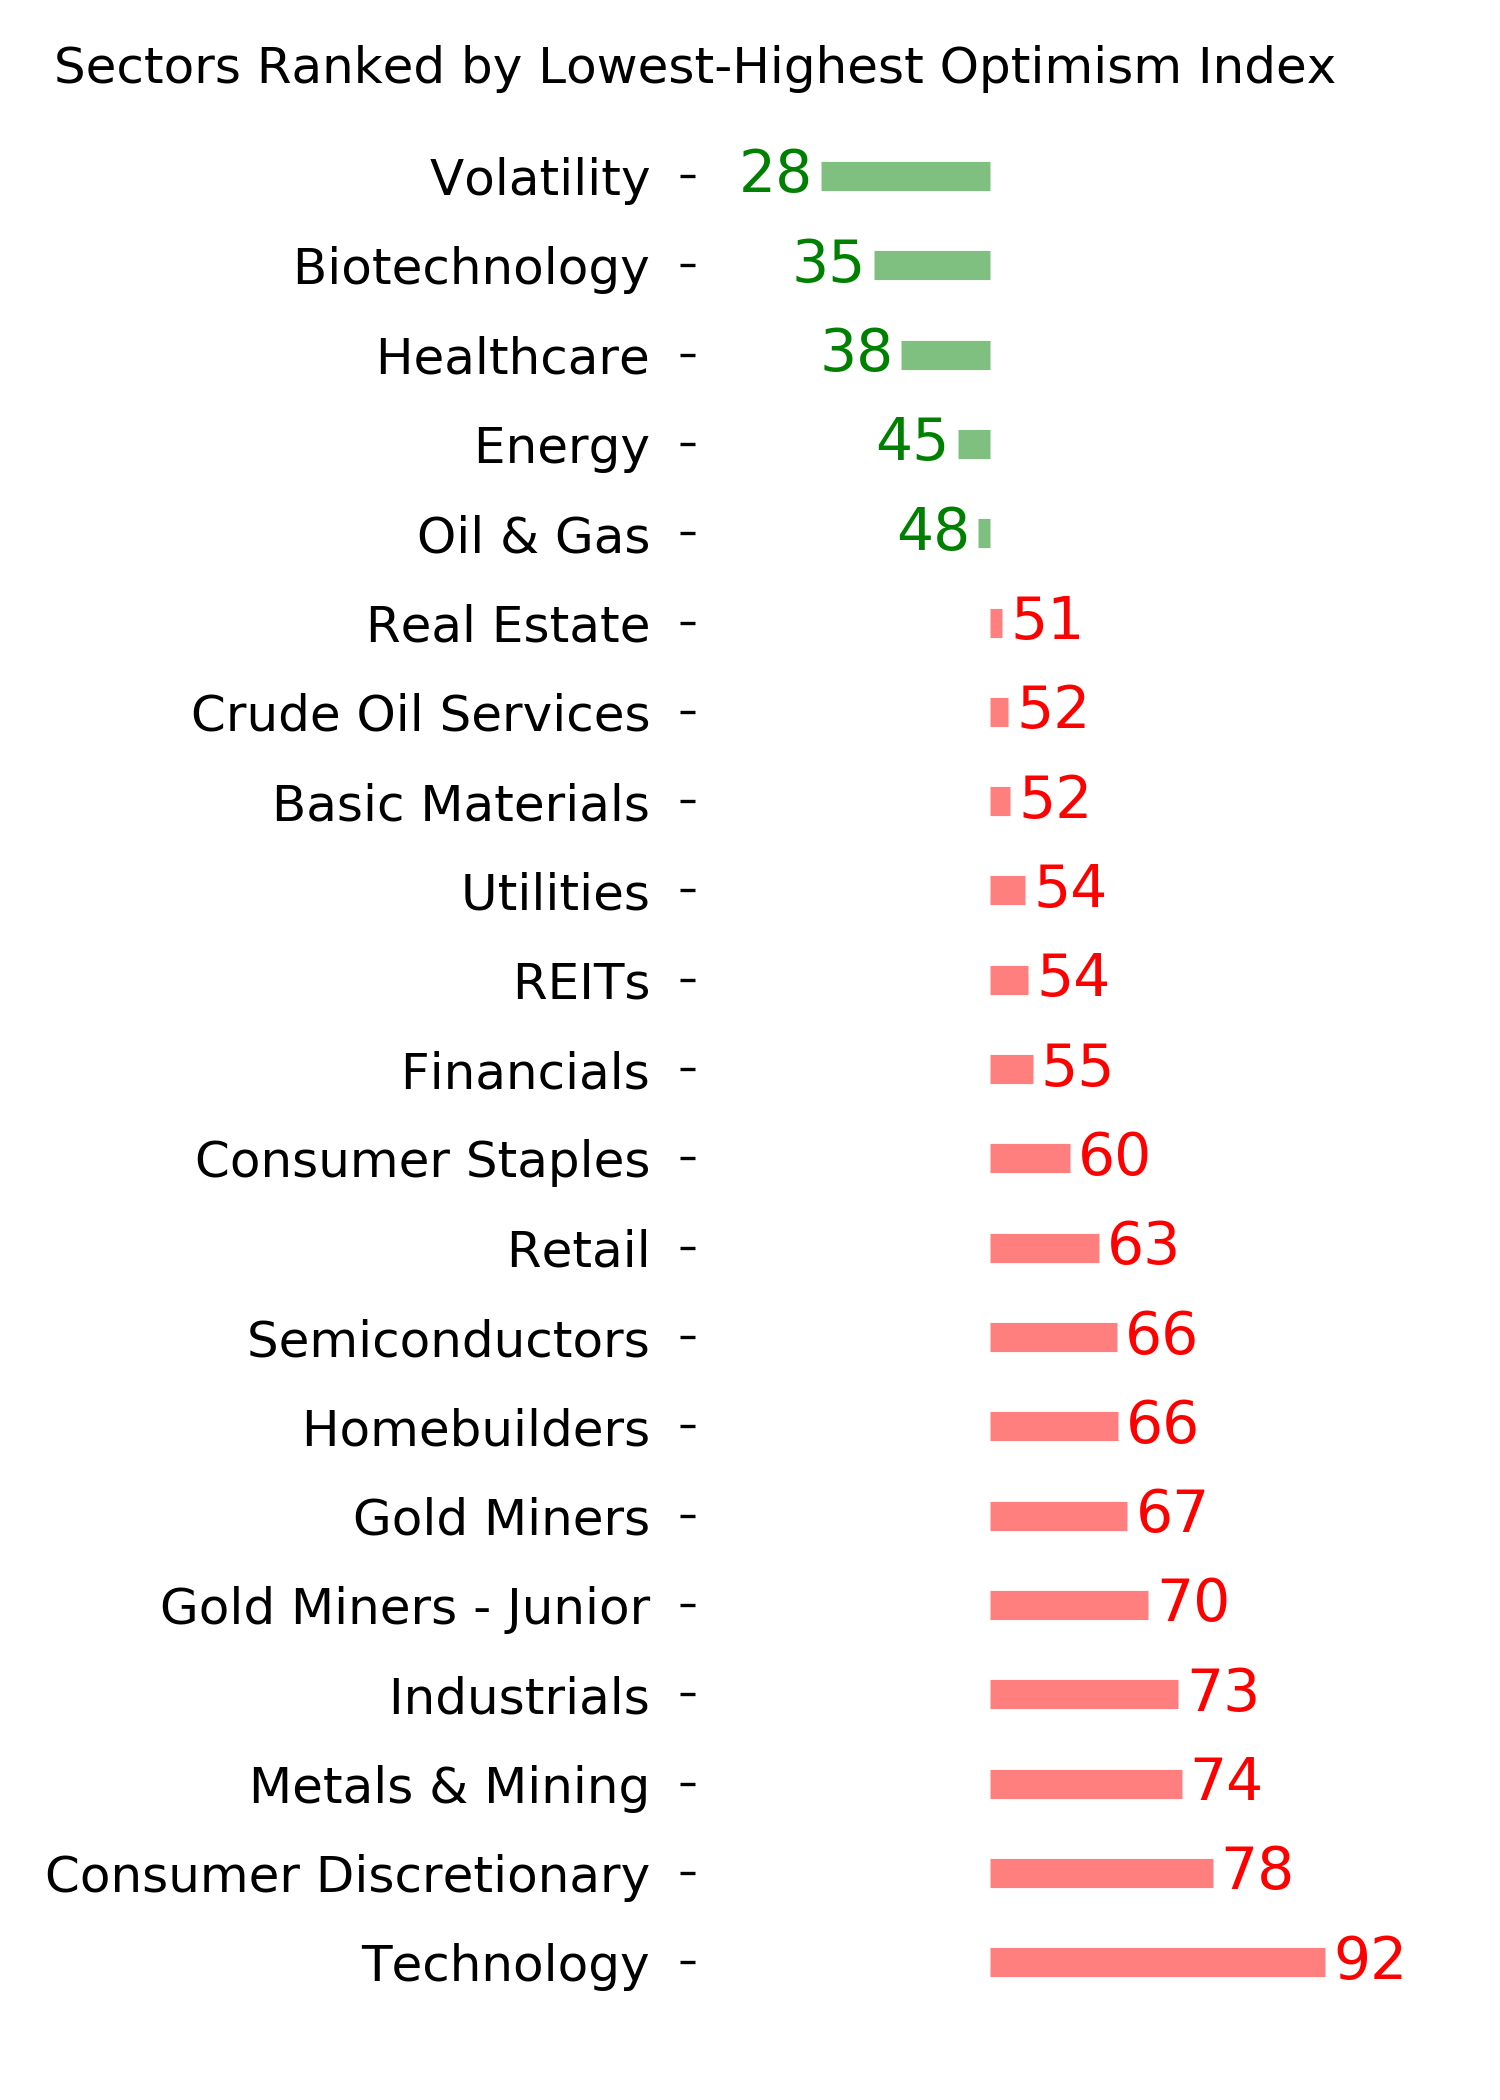
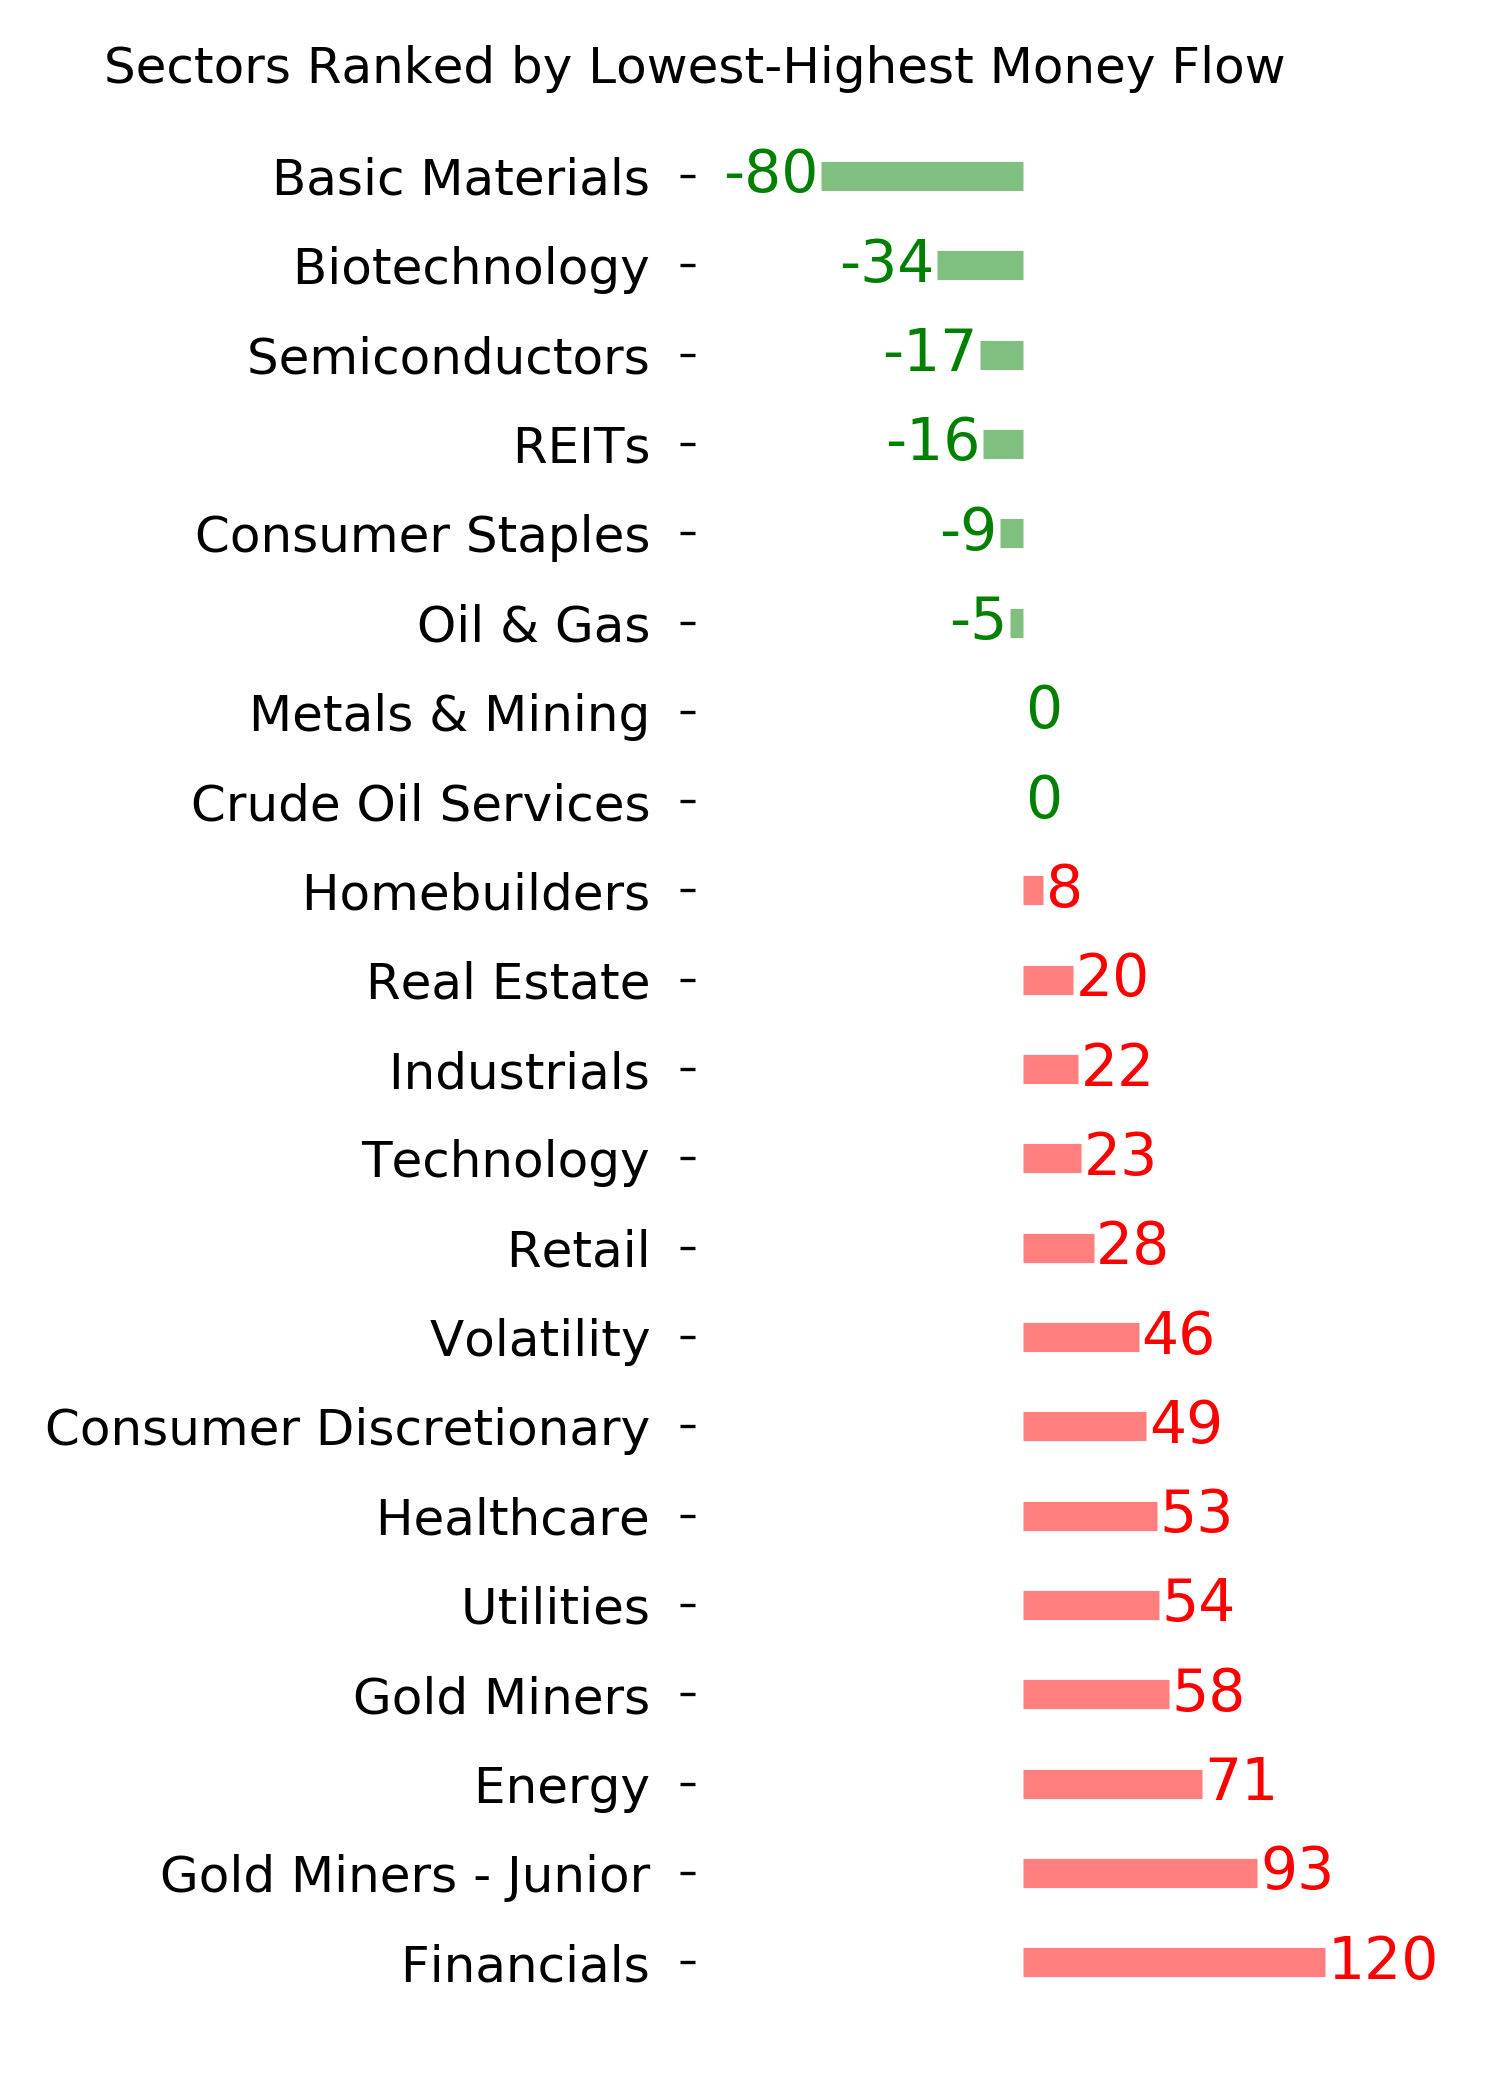
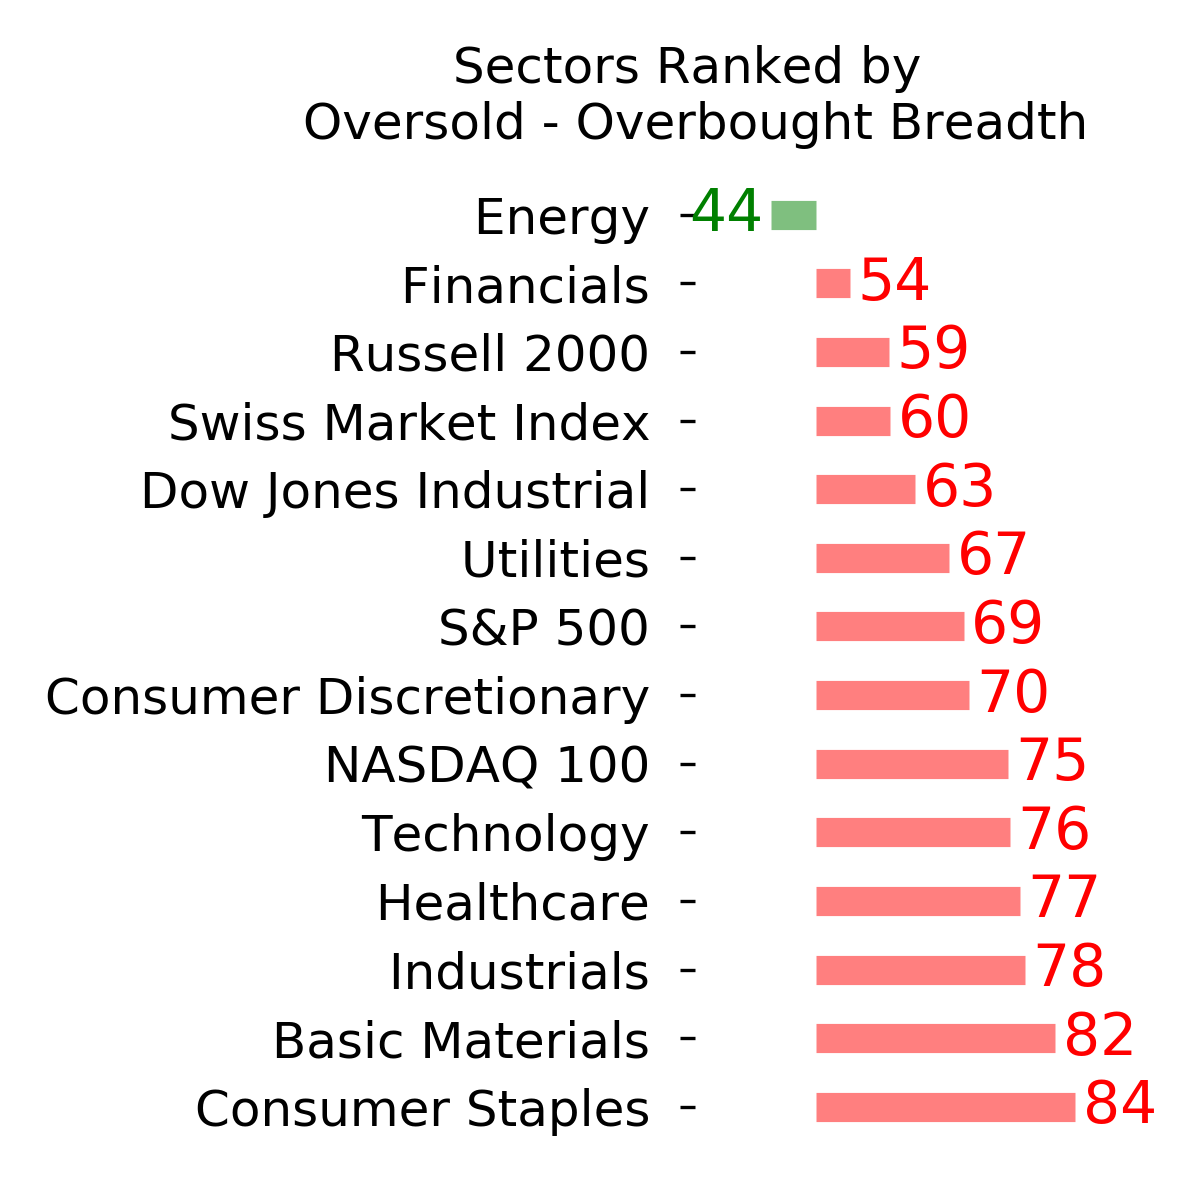
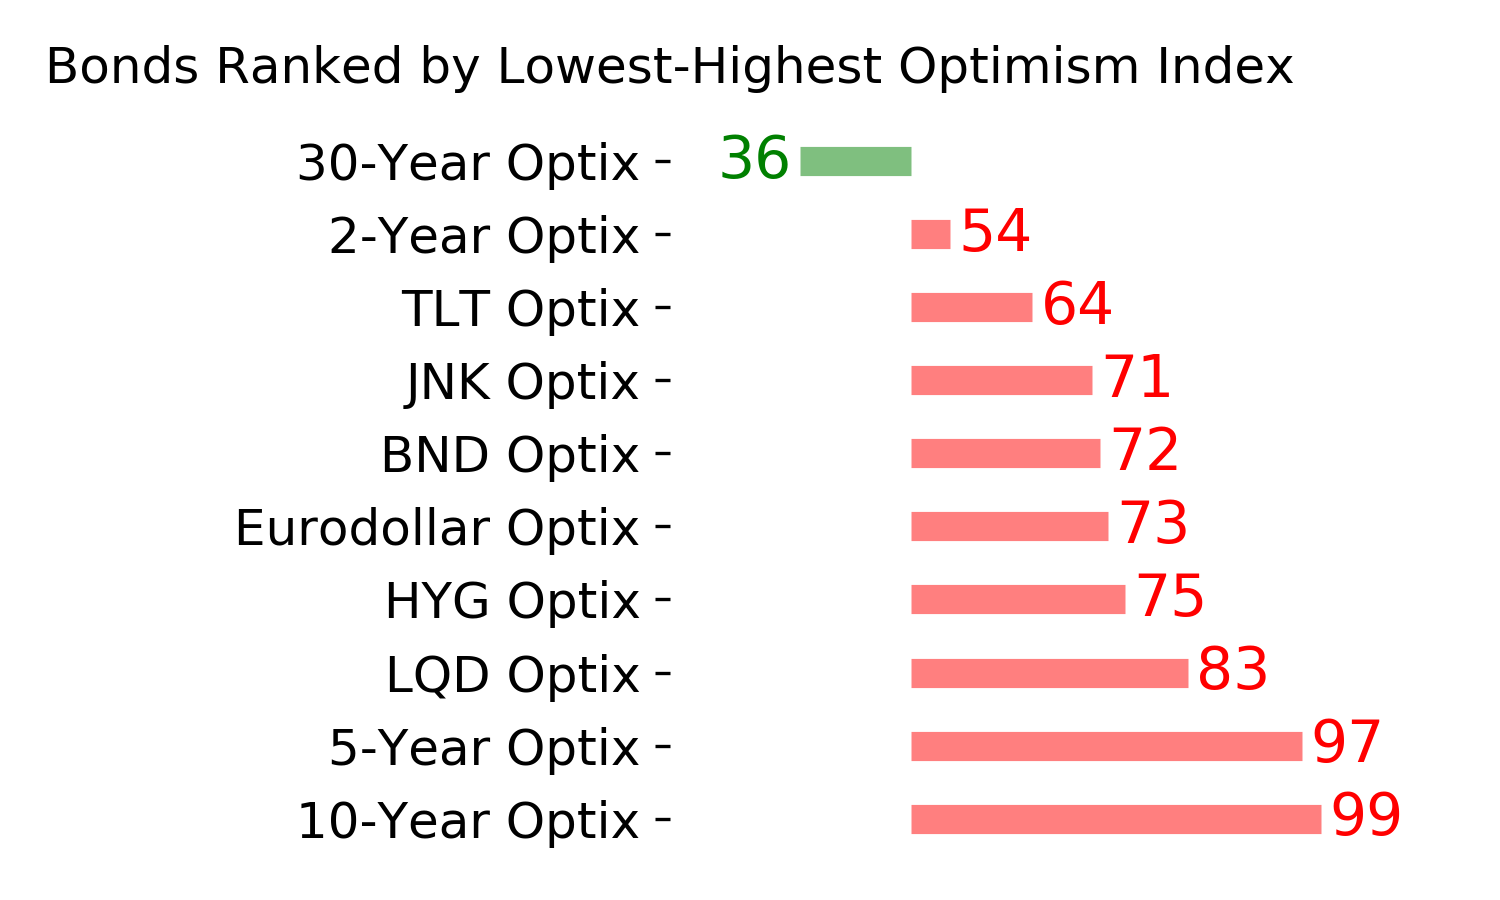
Ranks
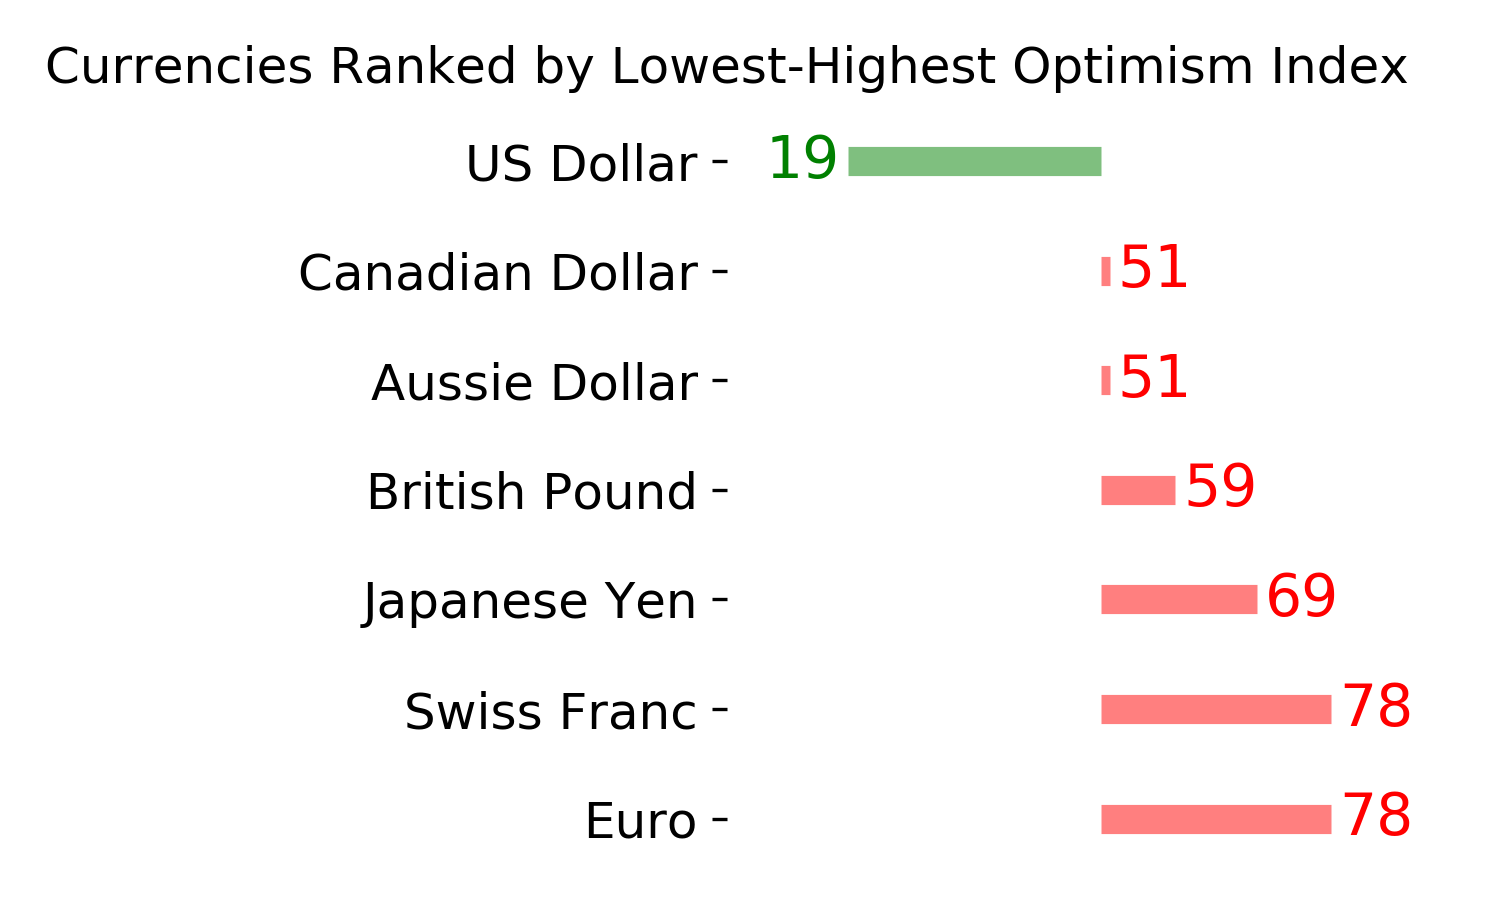
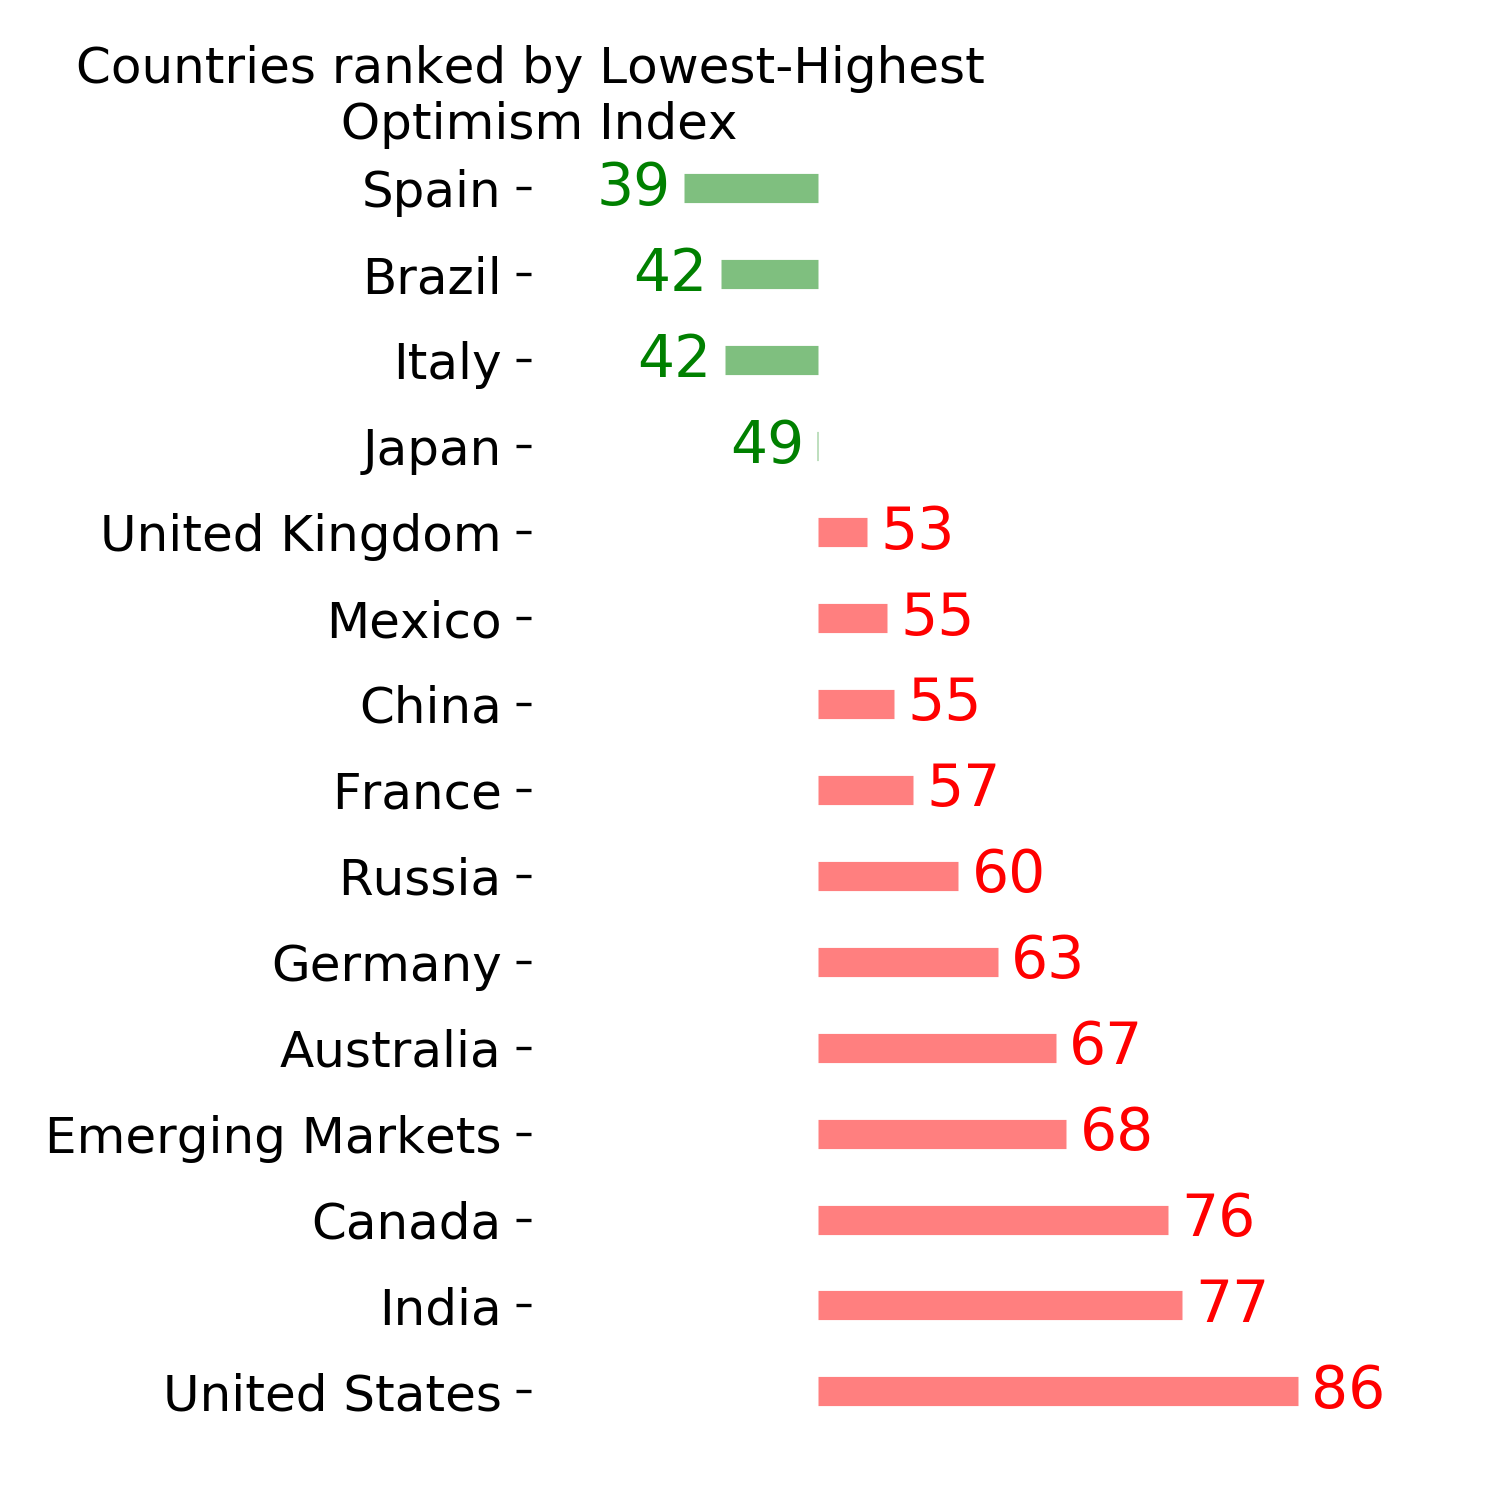
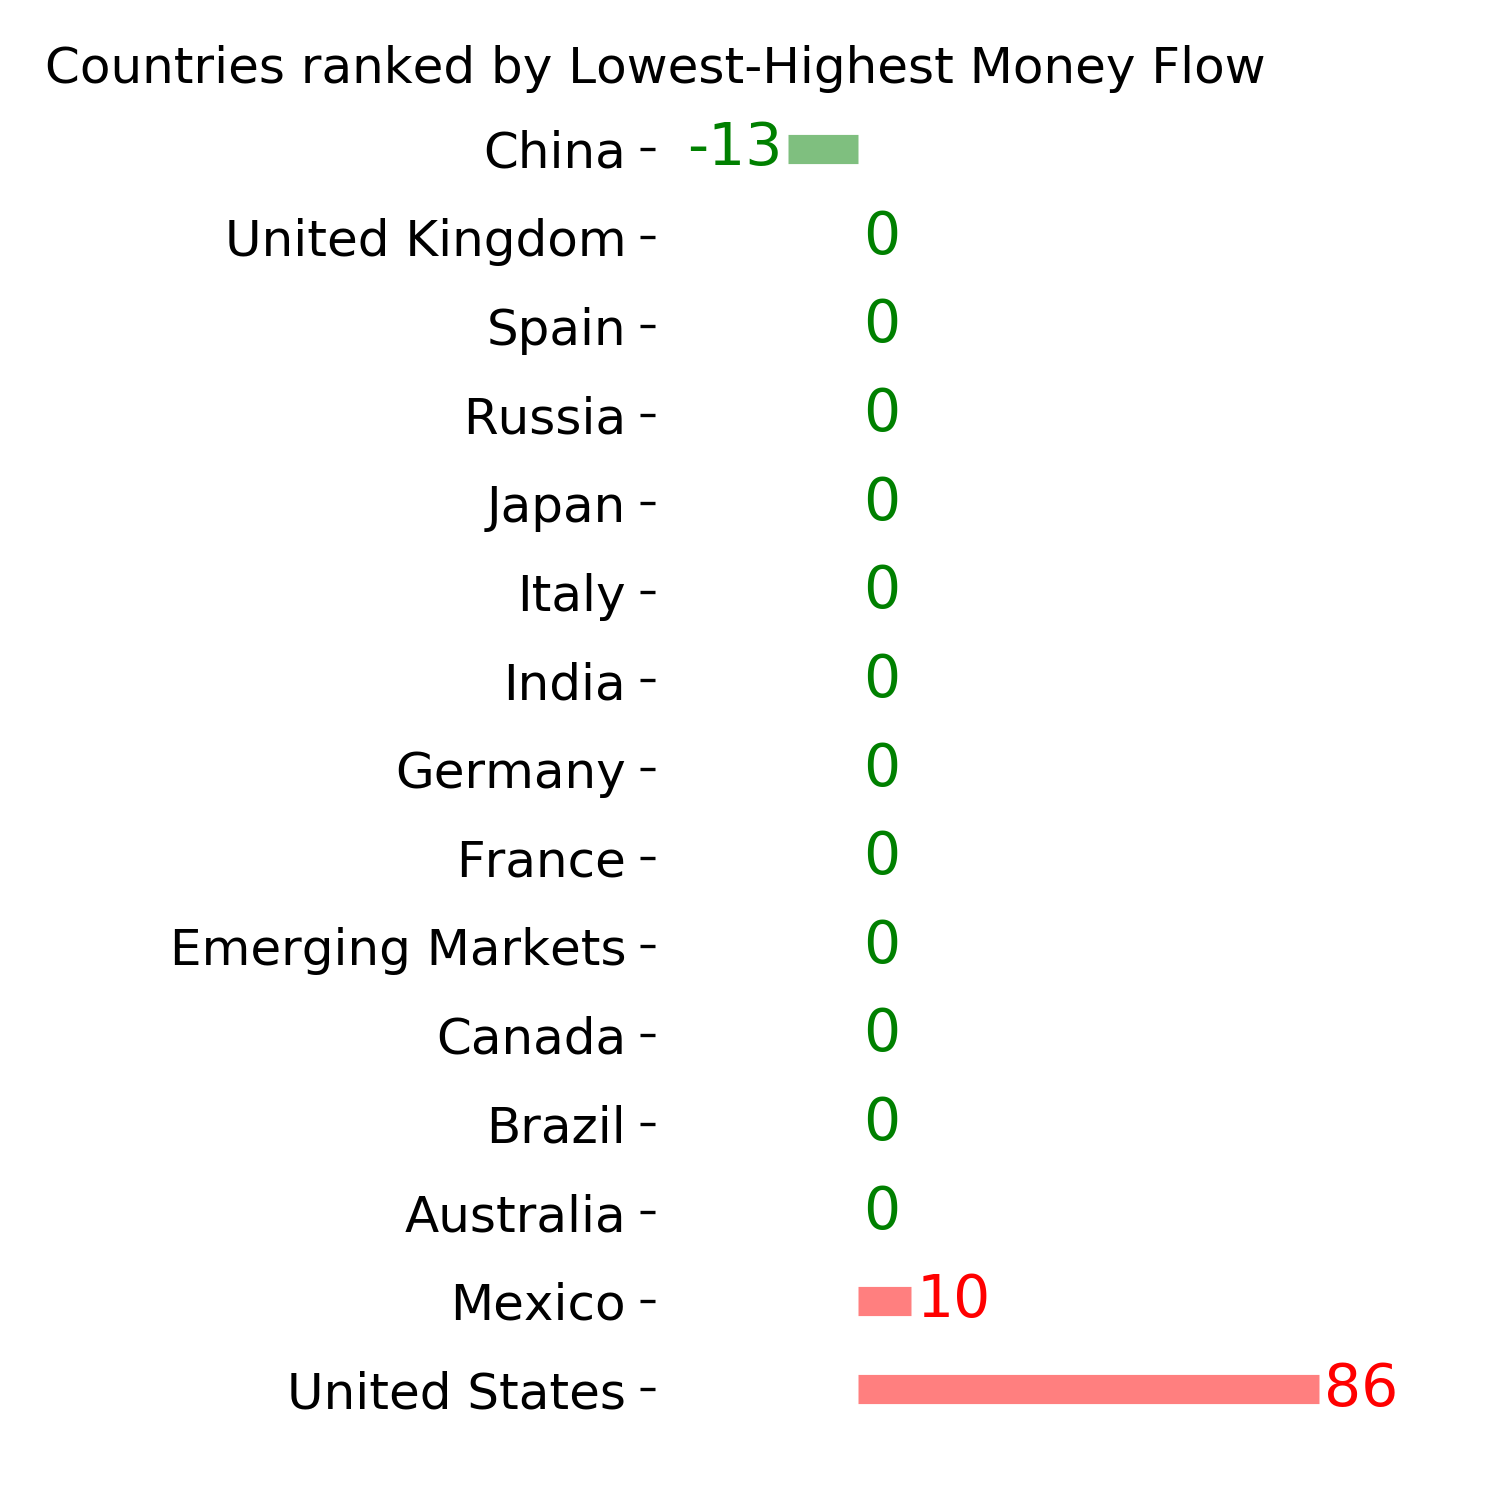
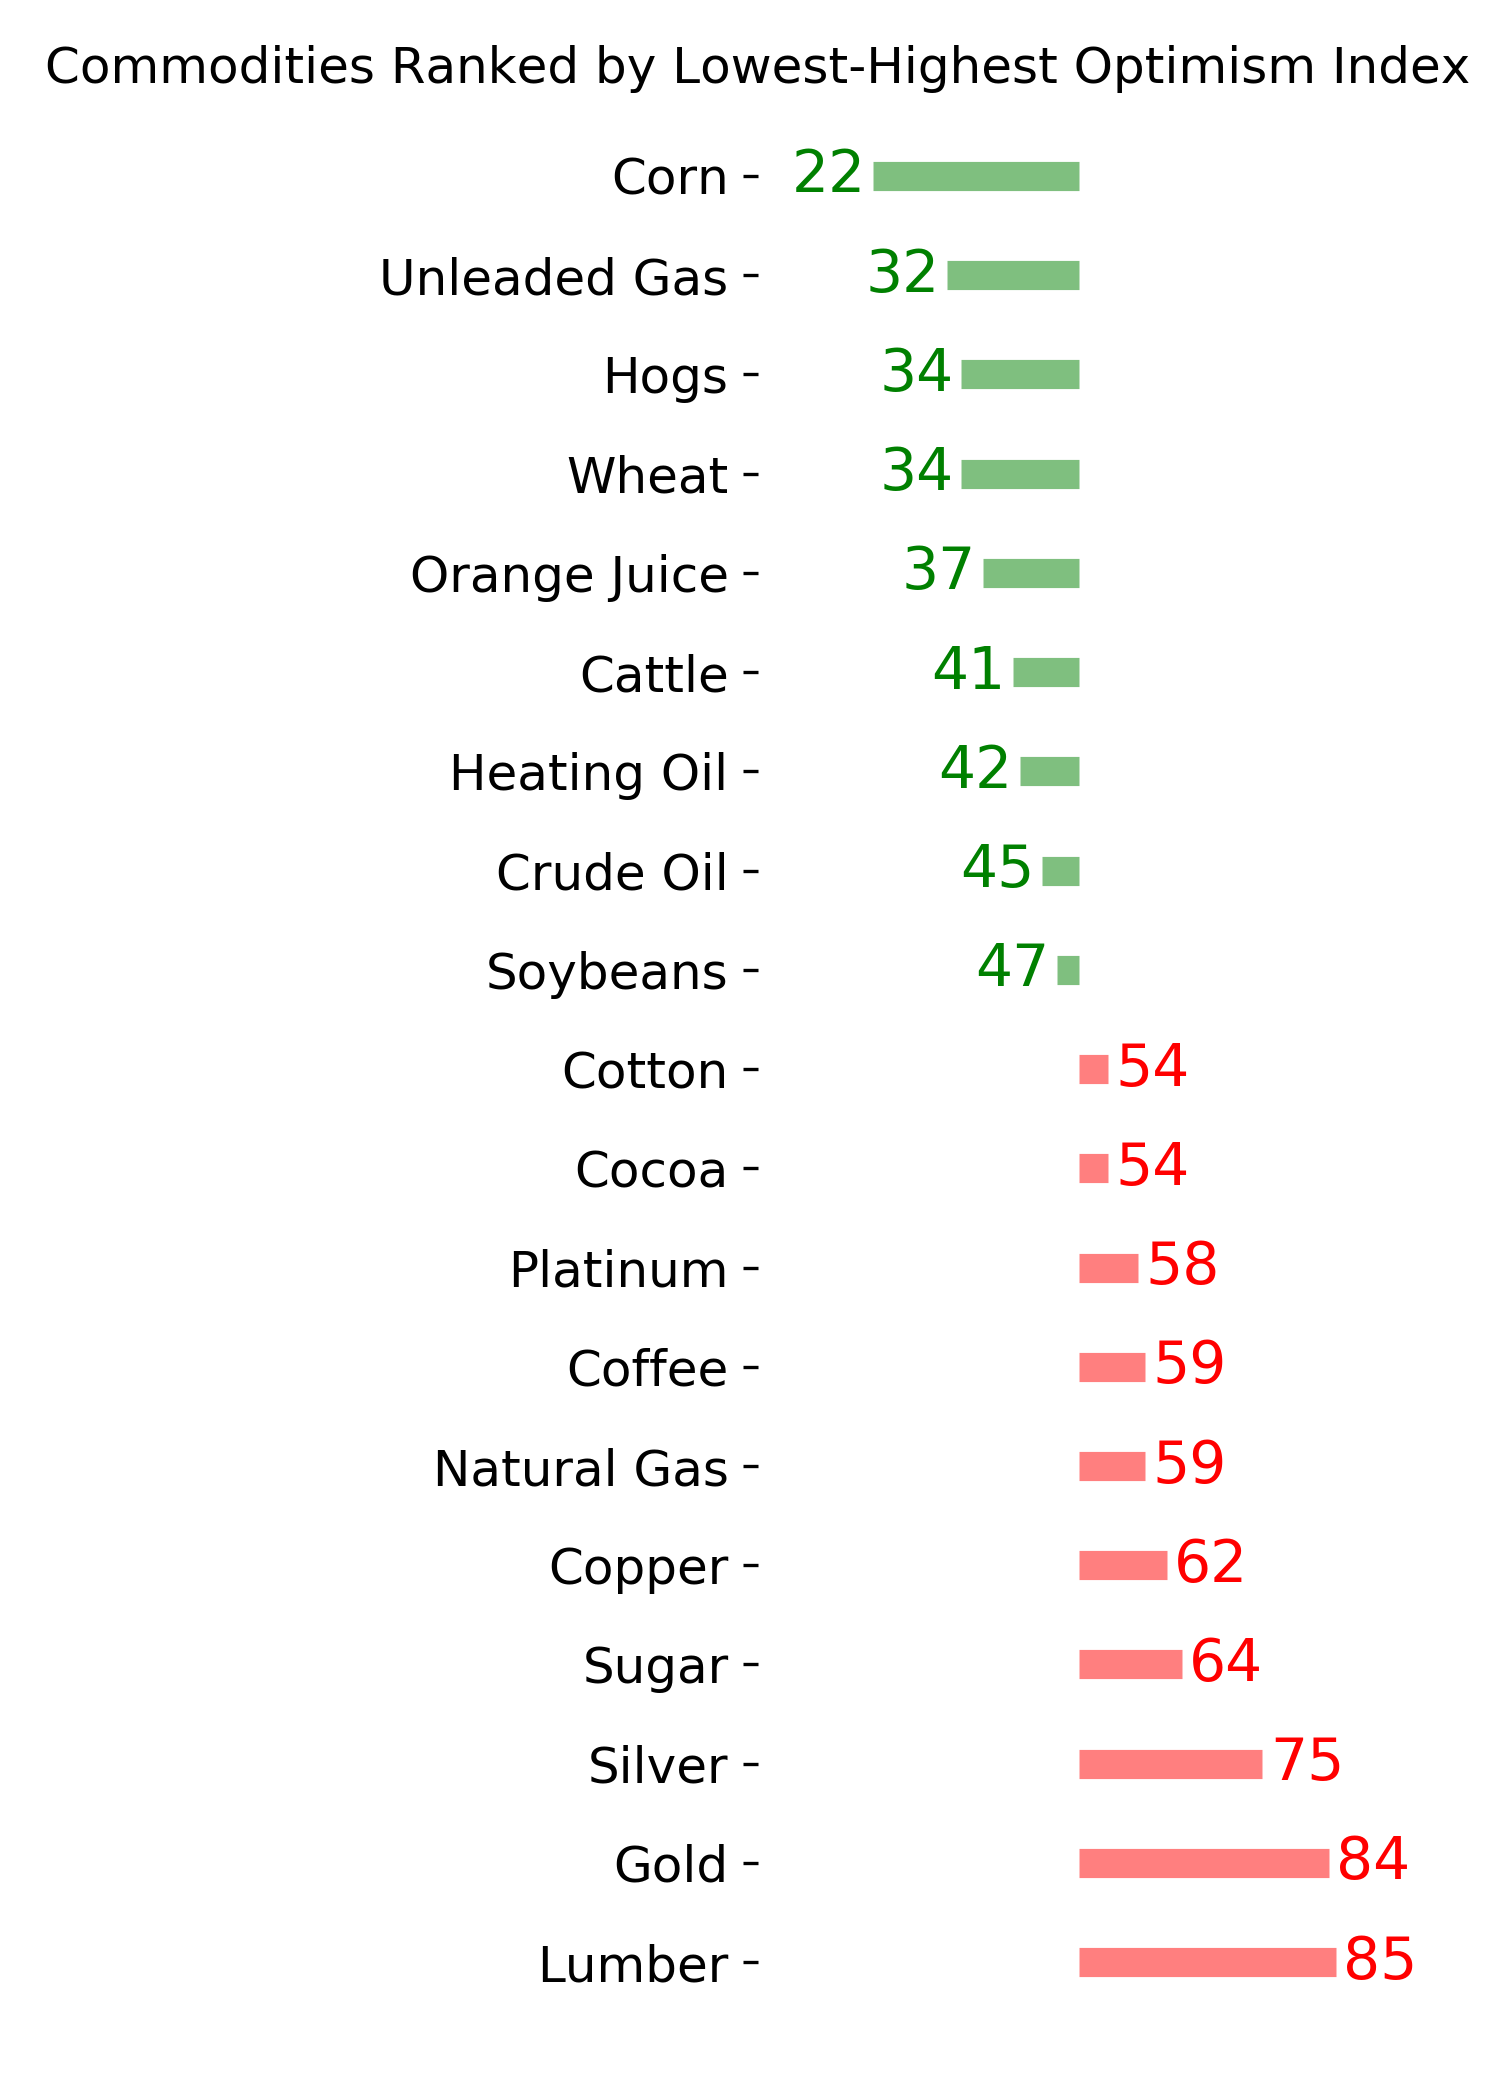
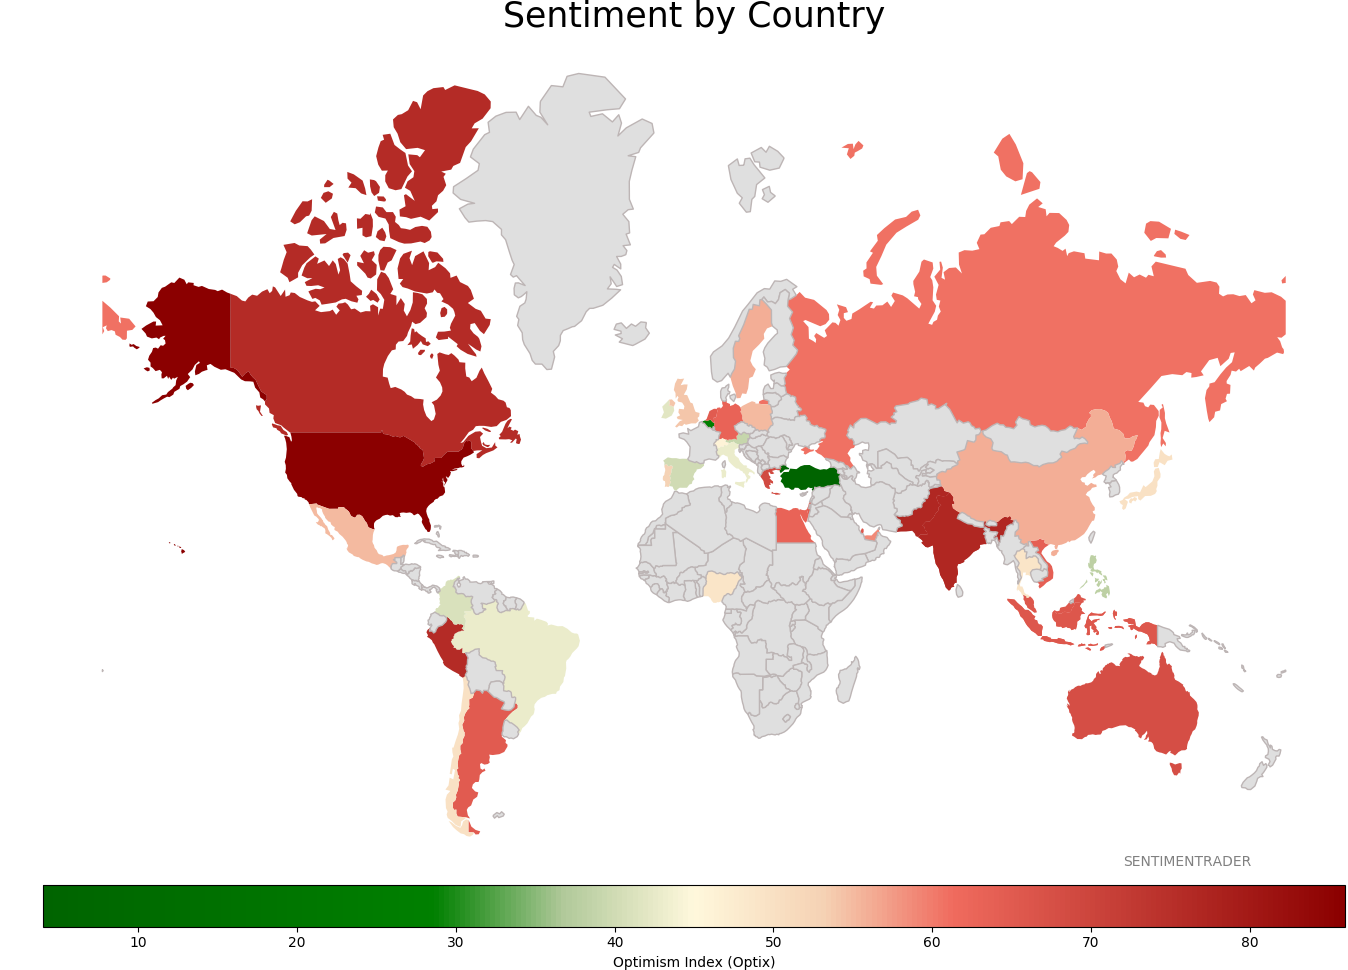
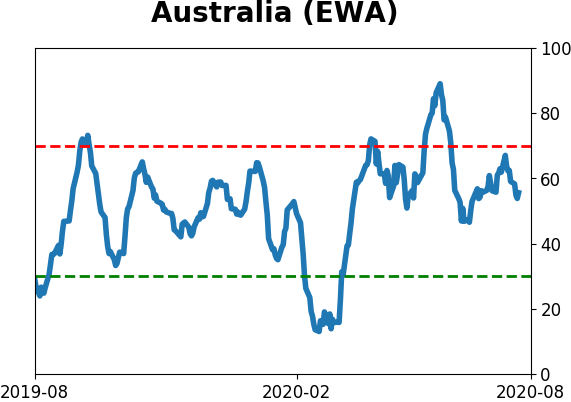
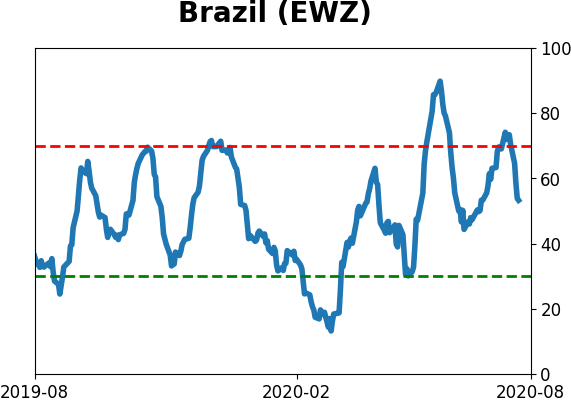
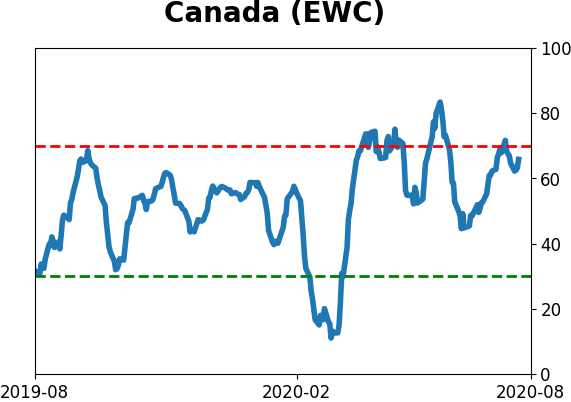
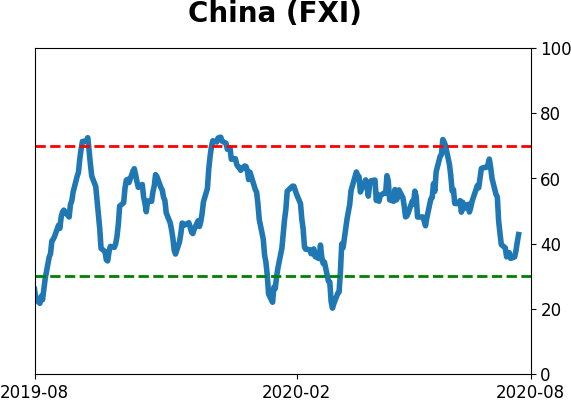
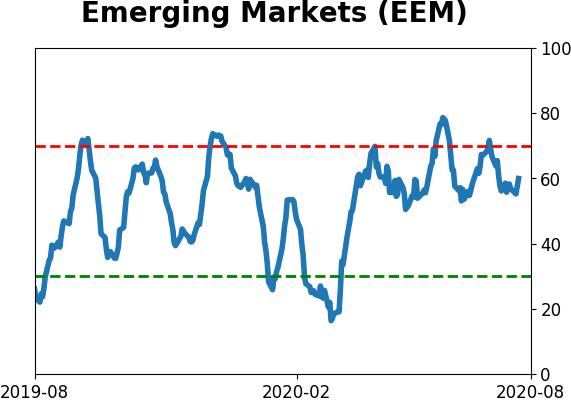
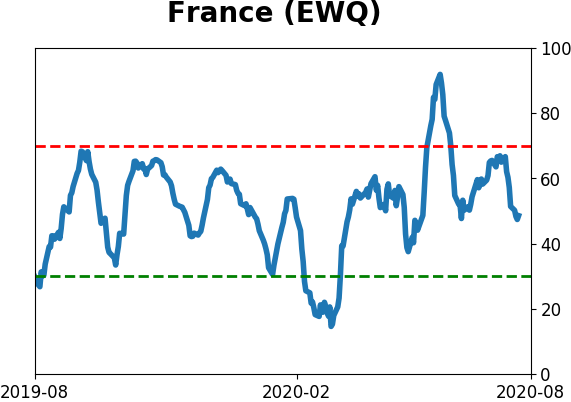
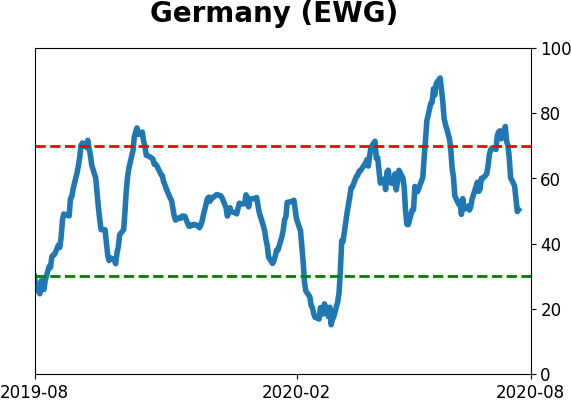
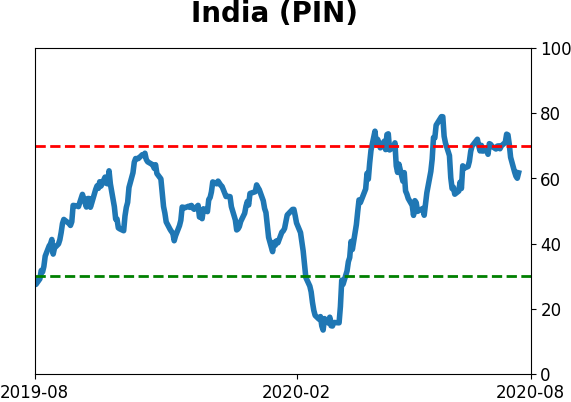
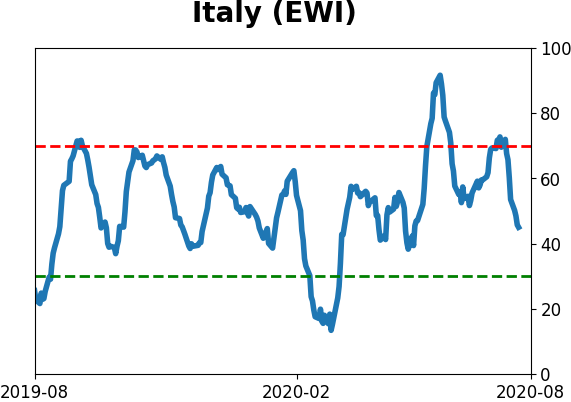
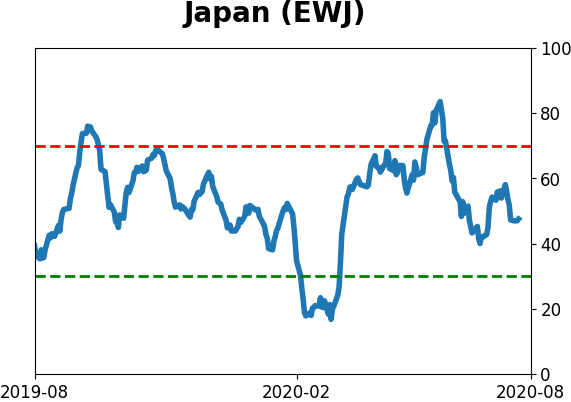
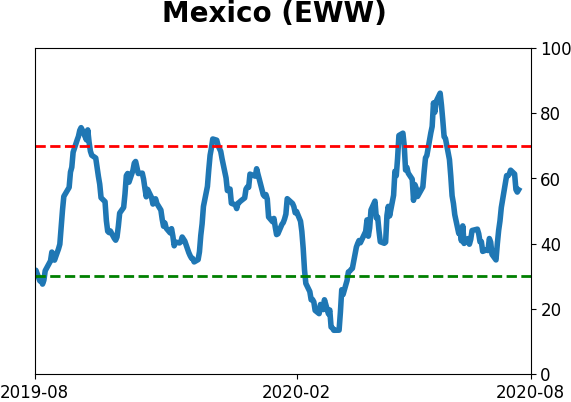
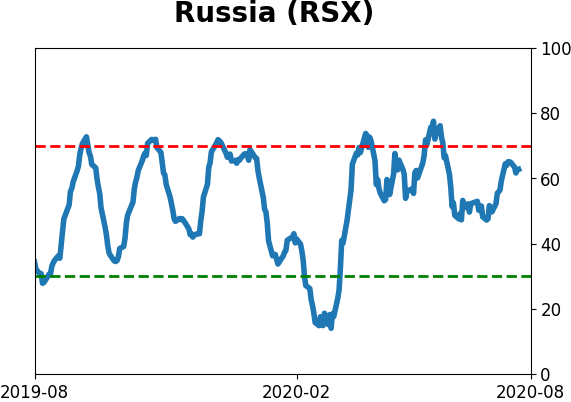
Sentiment Around The World
Optimism Index Thumbnails
|
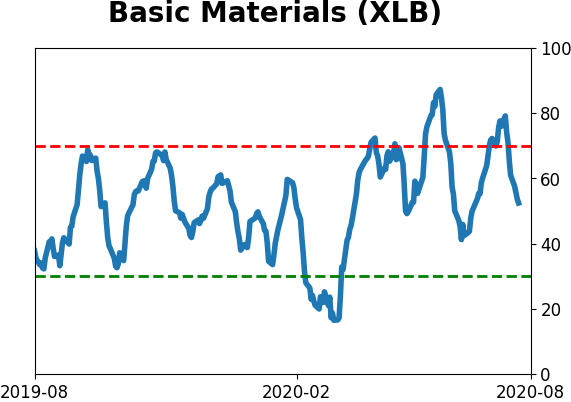
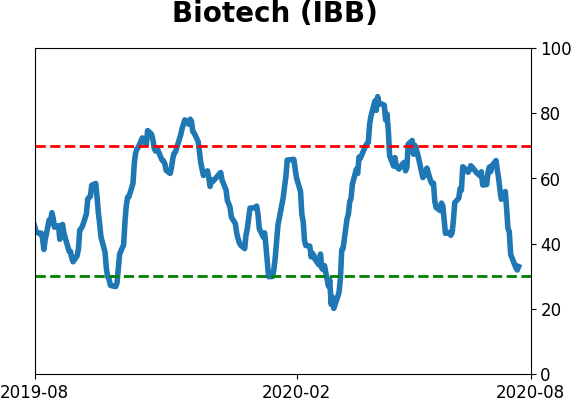
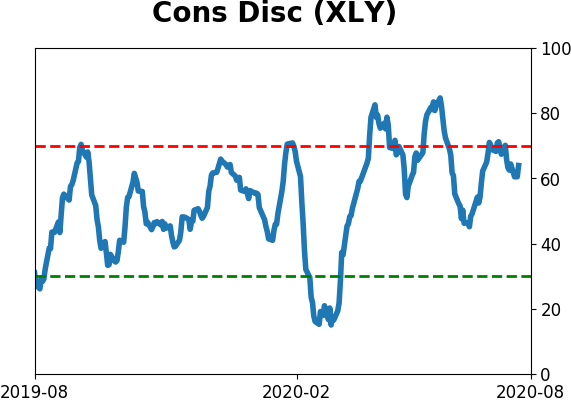
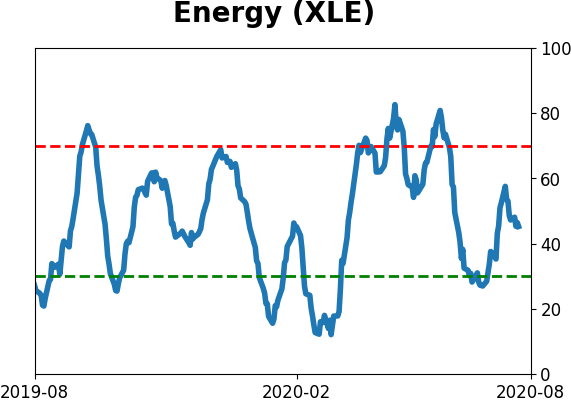
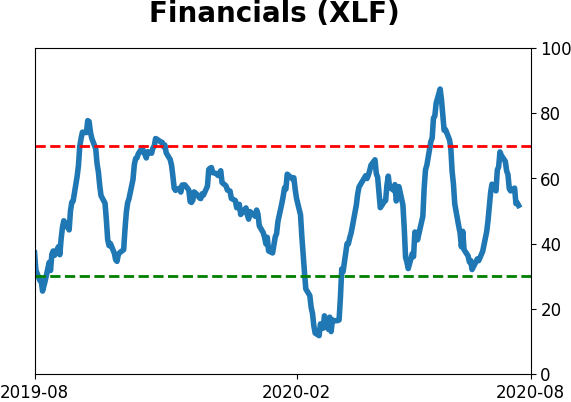
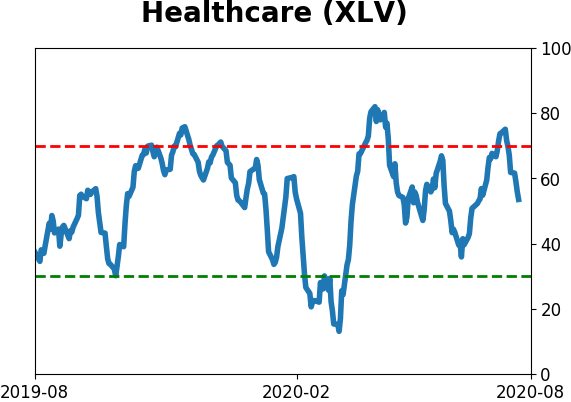
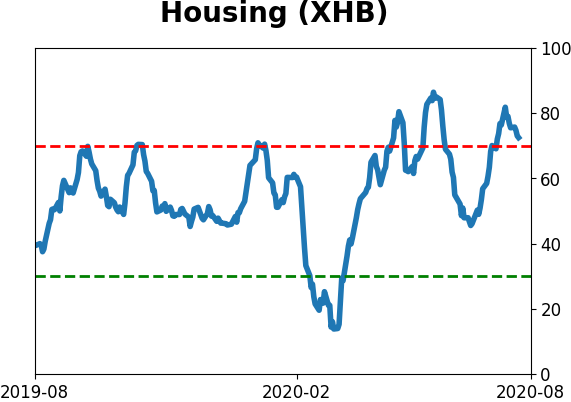
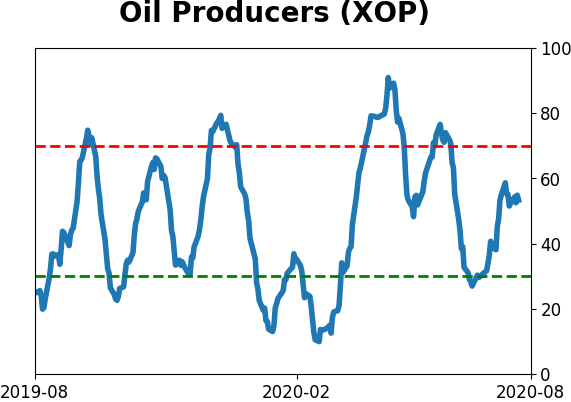
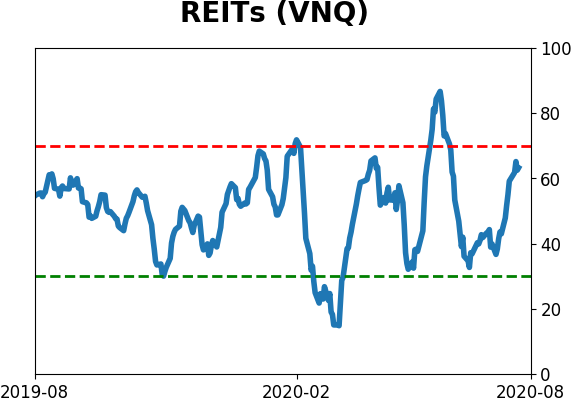
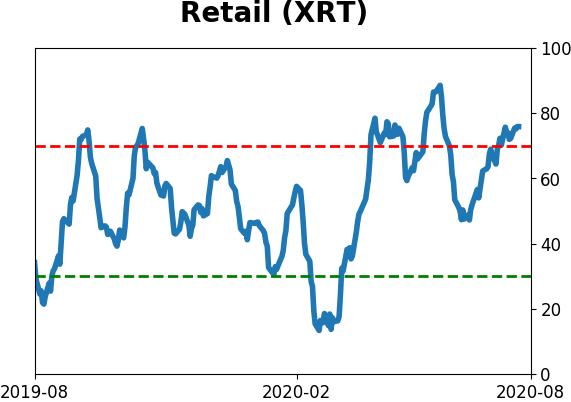
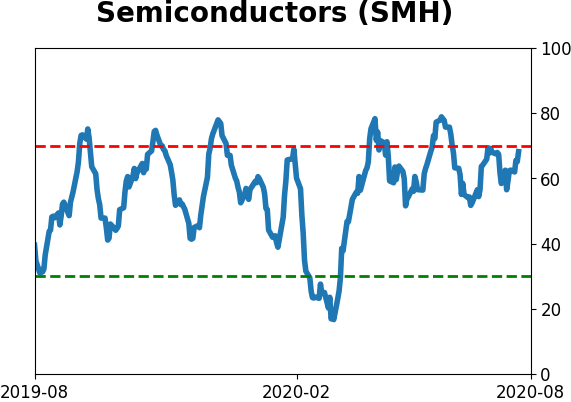
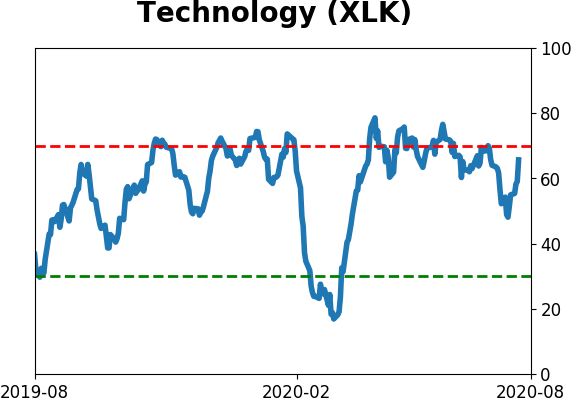
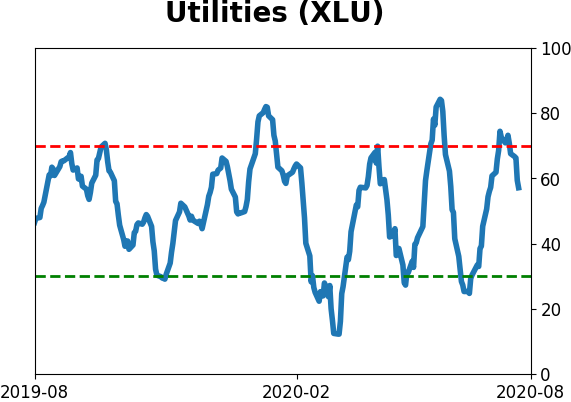
Sector ETF's - 10-Day Moving Average
|
|
|
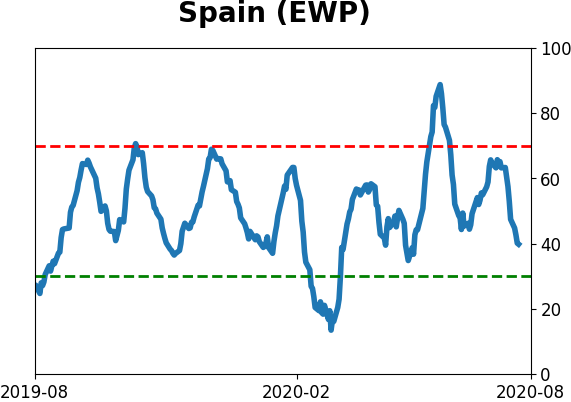
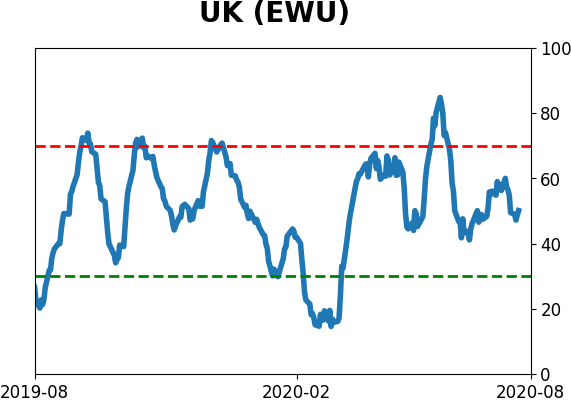
Country ETF's - 10-Day Moving Average
|
|
|
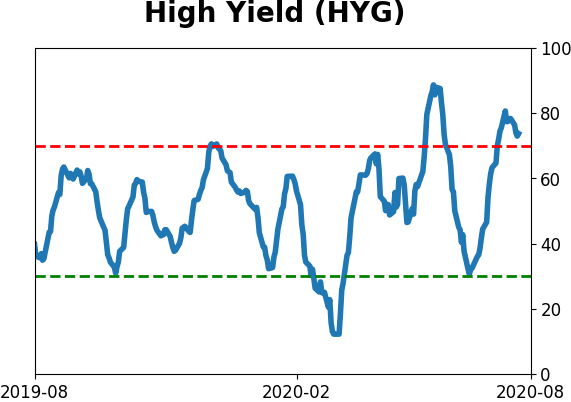
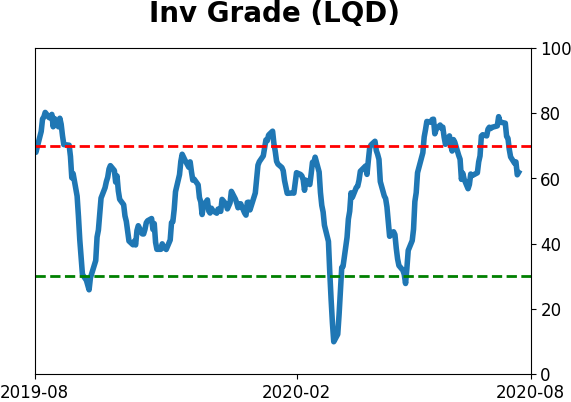
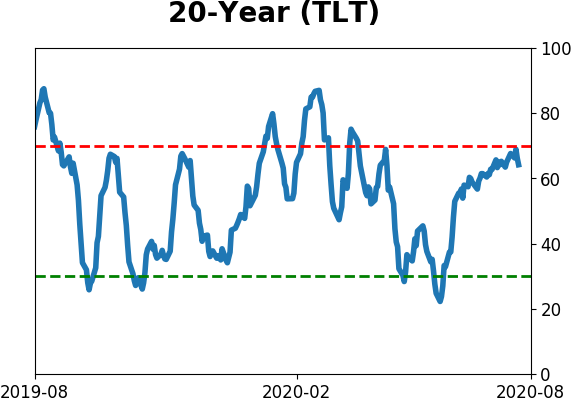
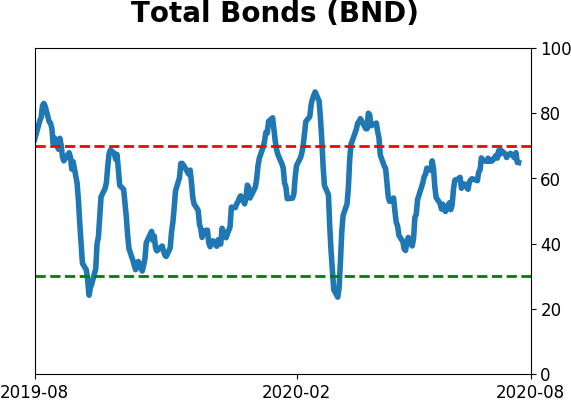
Bond ETF's - 10-Day Moving Average
|
|
|
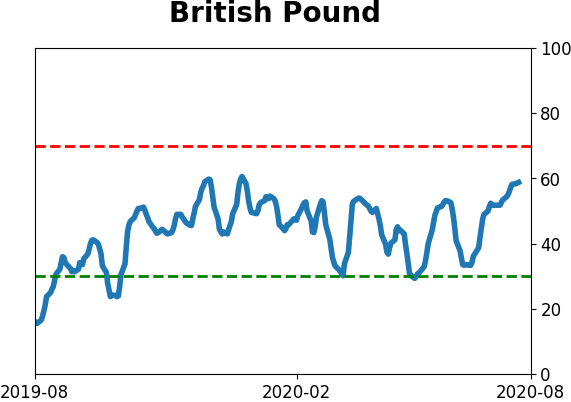
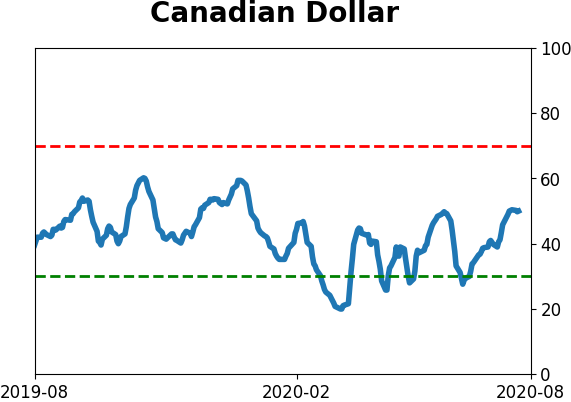
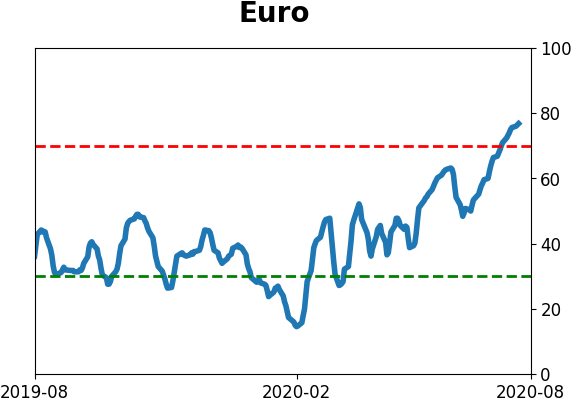
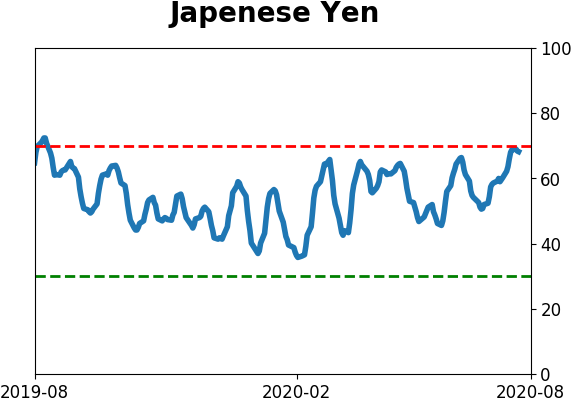
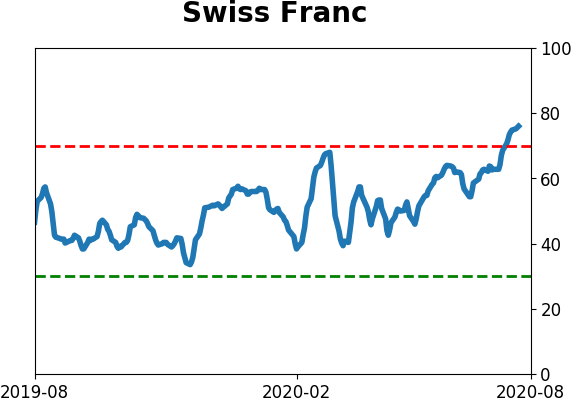
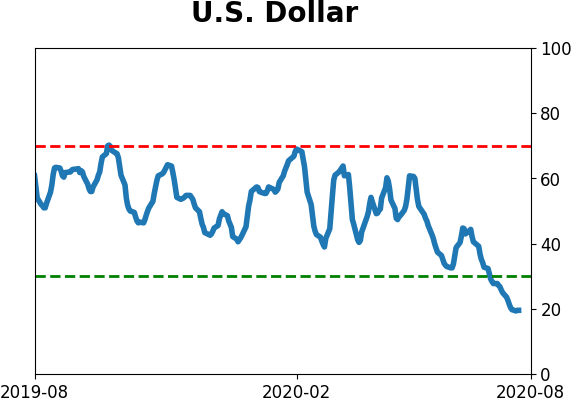
Currency ETF's - 5-Day Moving Average
|
|
|
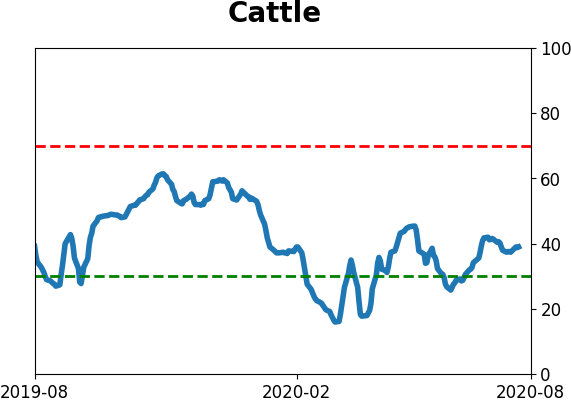
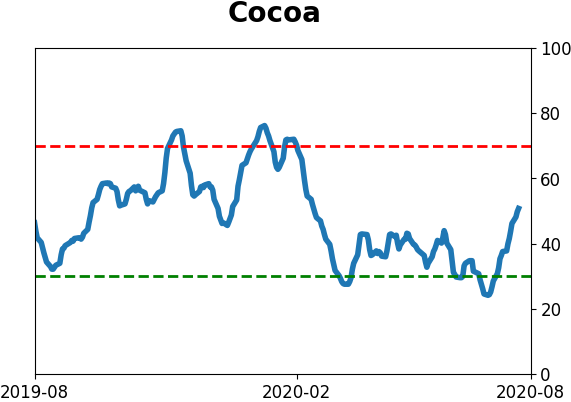
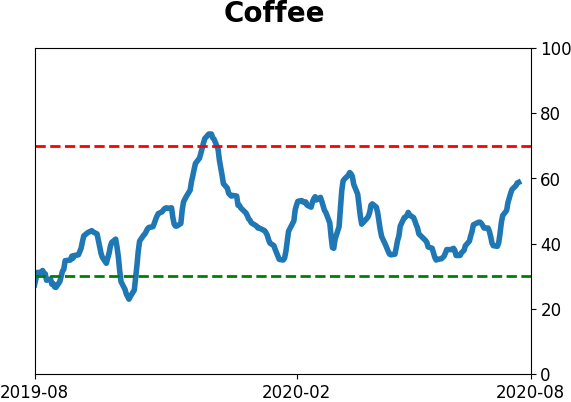
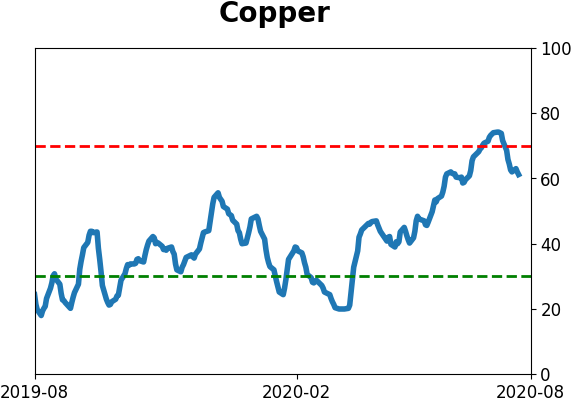
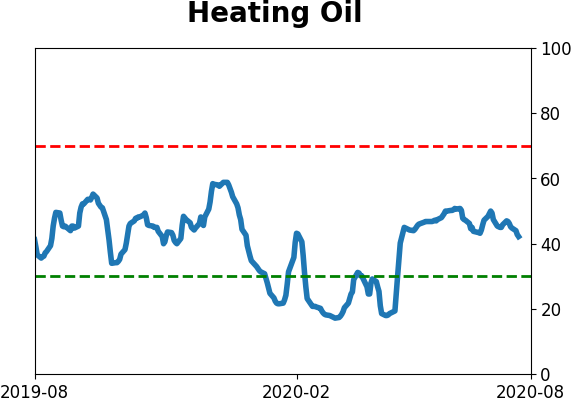
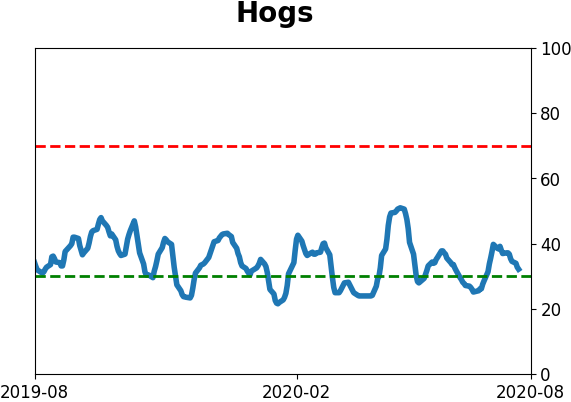
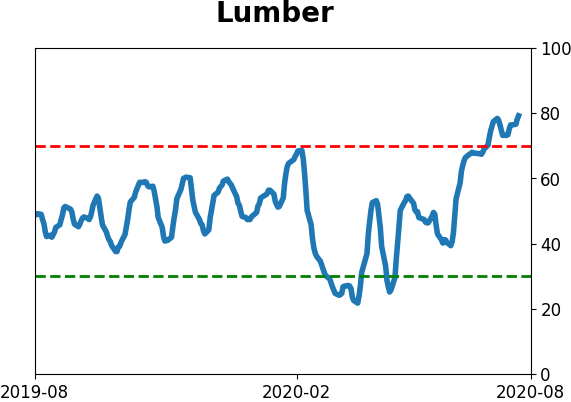
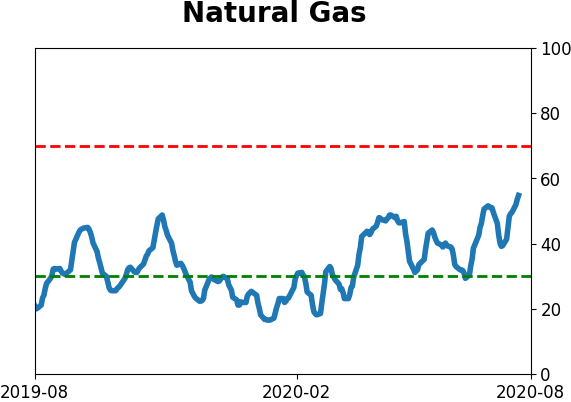
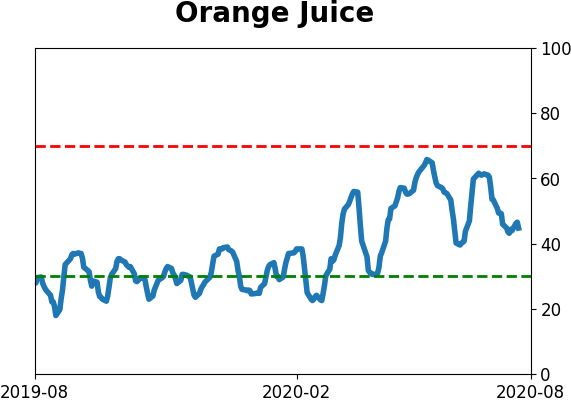
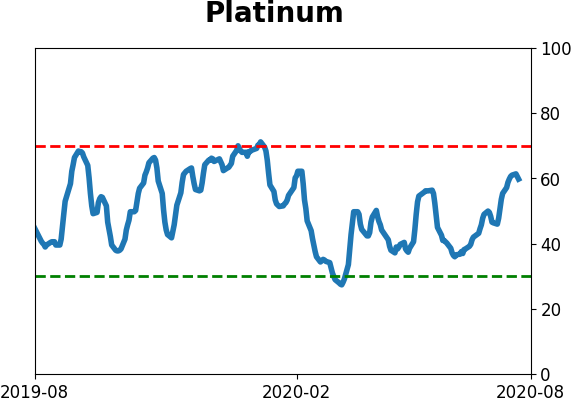
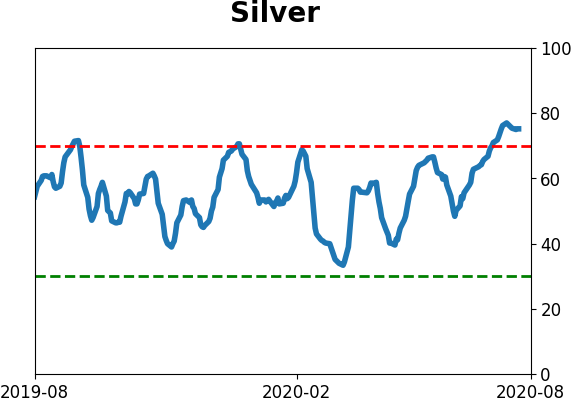
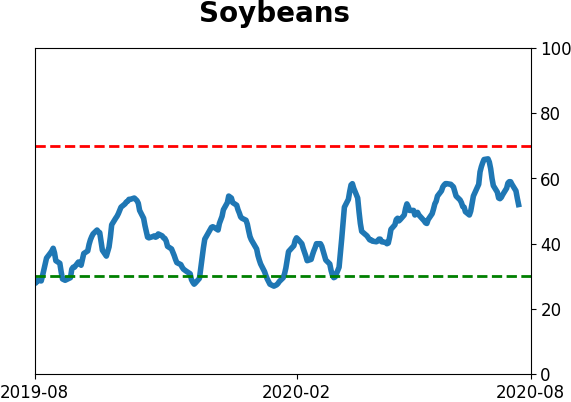
Commodity ETF's - 5-Day Moving Average
|
|