Headlines
|
|
A Historic Streak of Tepid Energy Trends:
Over the past 3 weeks, no energy stock has managed to close above its 50-day moving average. This is the 4th-longest streak of this kind of activity in the past 70 years.
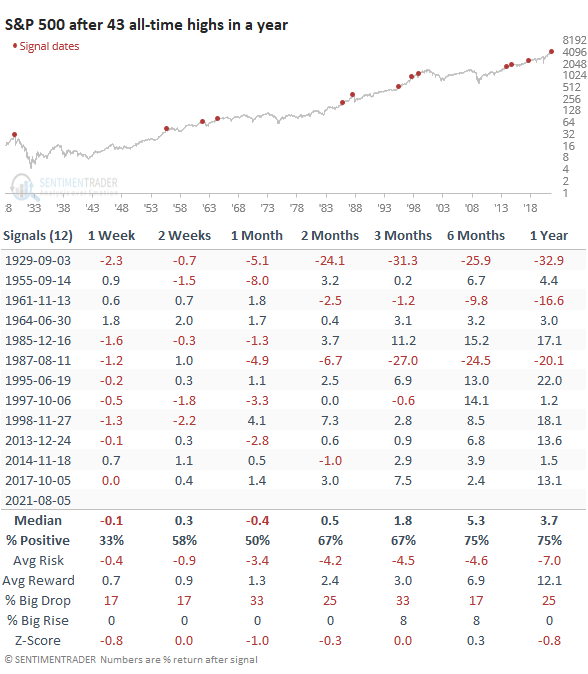
Yet another one: Thursday's new high in the S&P 500 was its 43rd of the year, the most in a calendar year since 2017. That one (in 2017) didn't happen until October, though. Since 1928, this is the 3rd-quickest year to record so many all-time highs. One caveat for bulls is that we also reached 43 all-time highs in August...1987, right before one of the largest crashes in market history.
Bottom Line:
See the Outlook & Allocations page for more details on these summaries STOCKS: Hold
The speculative frenzy in February is wrung out. Internal dynamics have mostly held up, with some exceptions. Many of our studies still show a mixed to poor short-term view, with medium- and long-term ones turning more positive. BONDS: Hold
Various parts of the market got hit in March, with the lowest Bond Optimism Index we usually see during healthy environments. After a shaky couple of weeks, the broad bond market has modestly recovered. Not a big edge here either way. GOLD: Hold
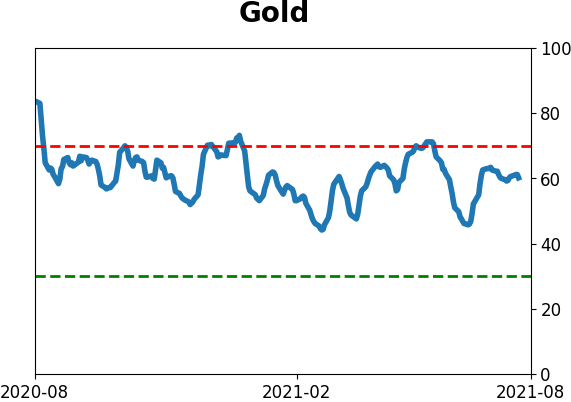
Gold and miners have done very well, recovering above long-term trend lines. The issue is that both have tended to perform poorly after similar situations - will have to wait and see how it plays out.
|
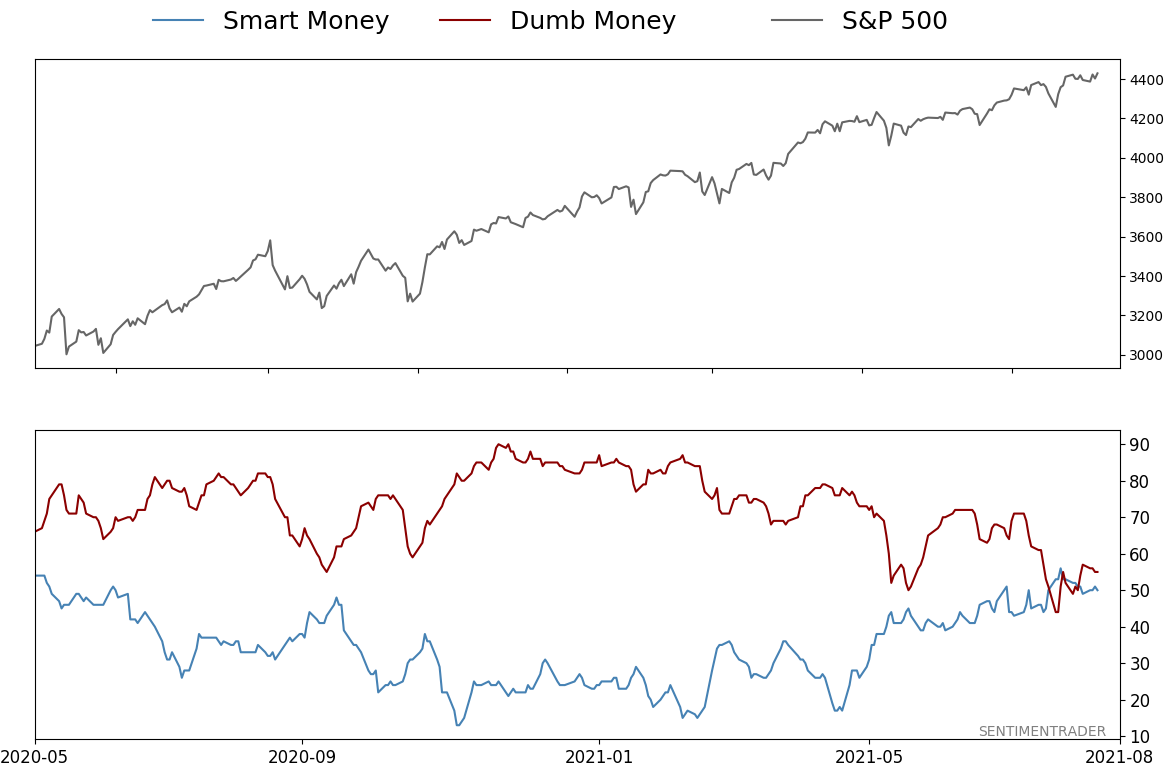
Smart / Dumb Money Confidence
|
Smart Money Confidence: 50%
Dumb Money Confidence: 55%
|
|
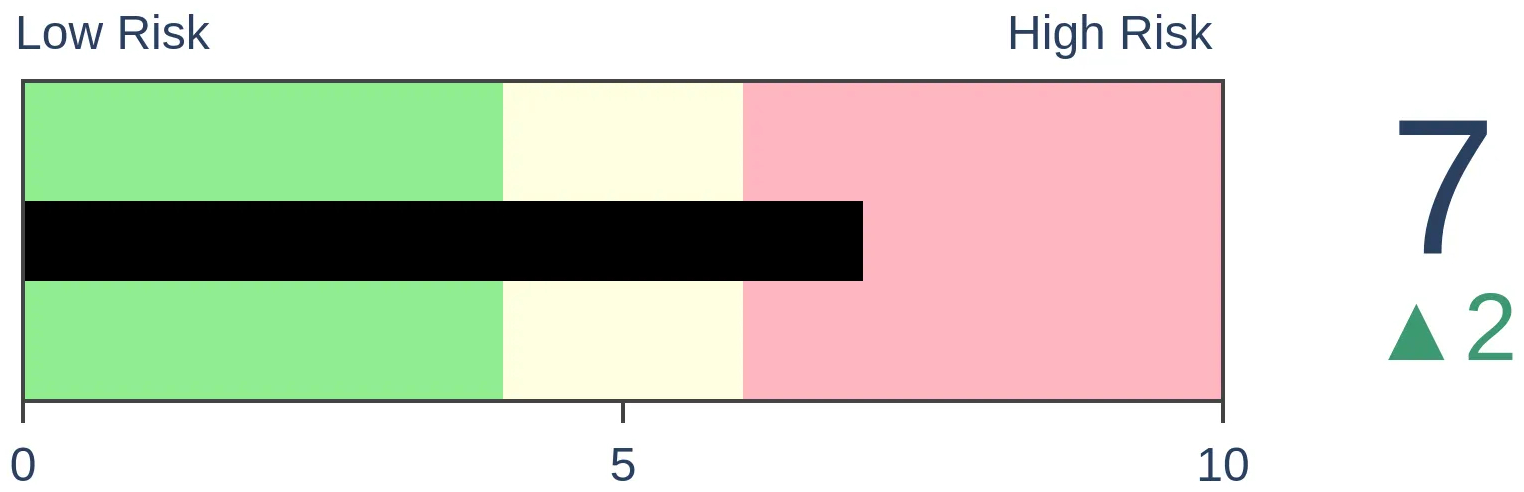
Risk Levels
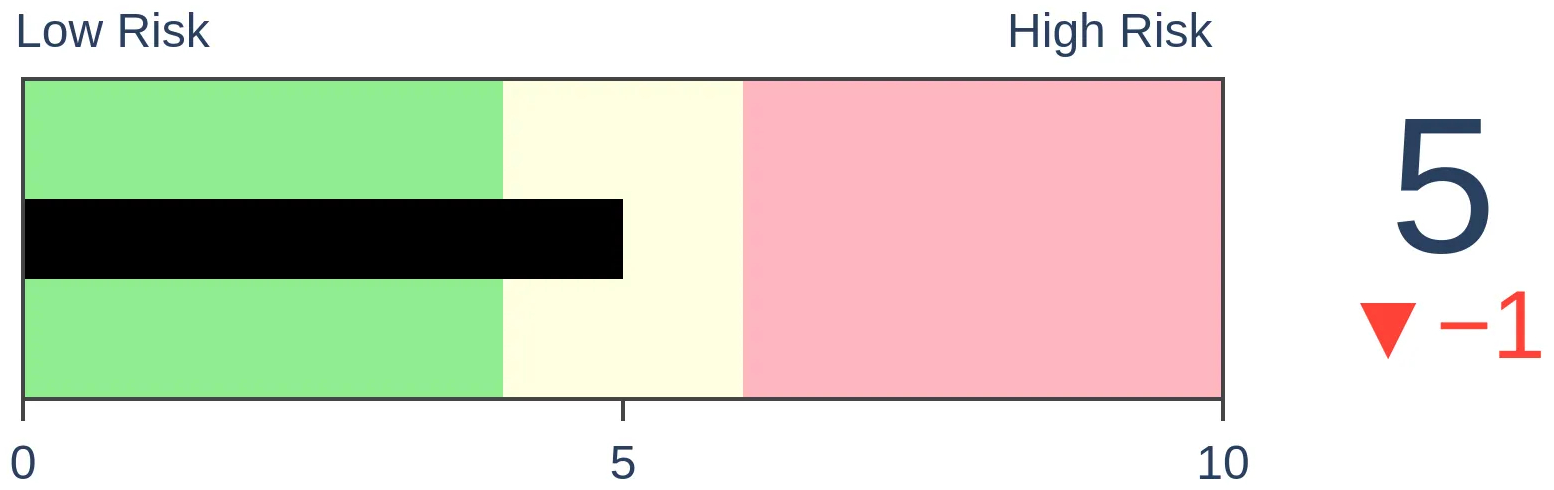
Stocks Short-Term
|
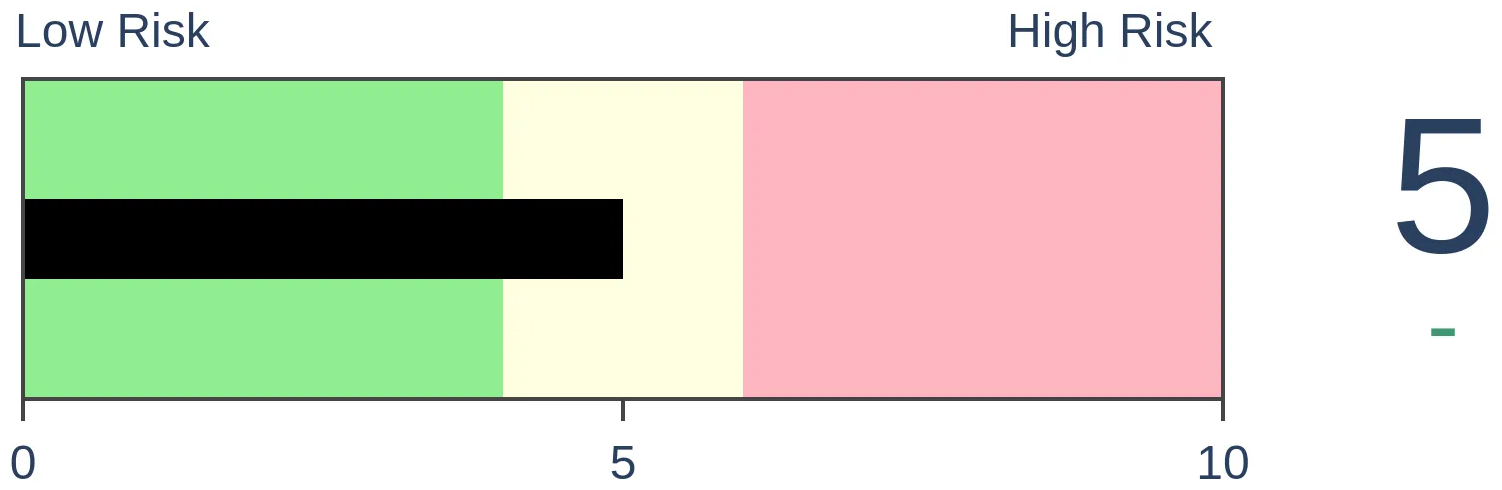
Stocks Medium-Term

|
|
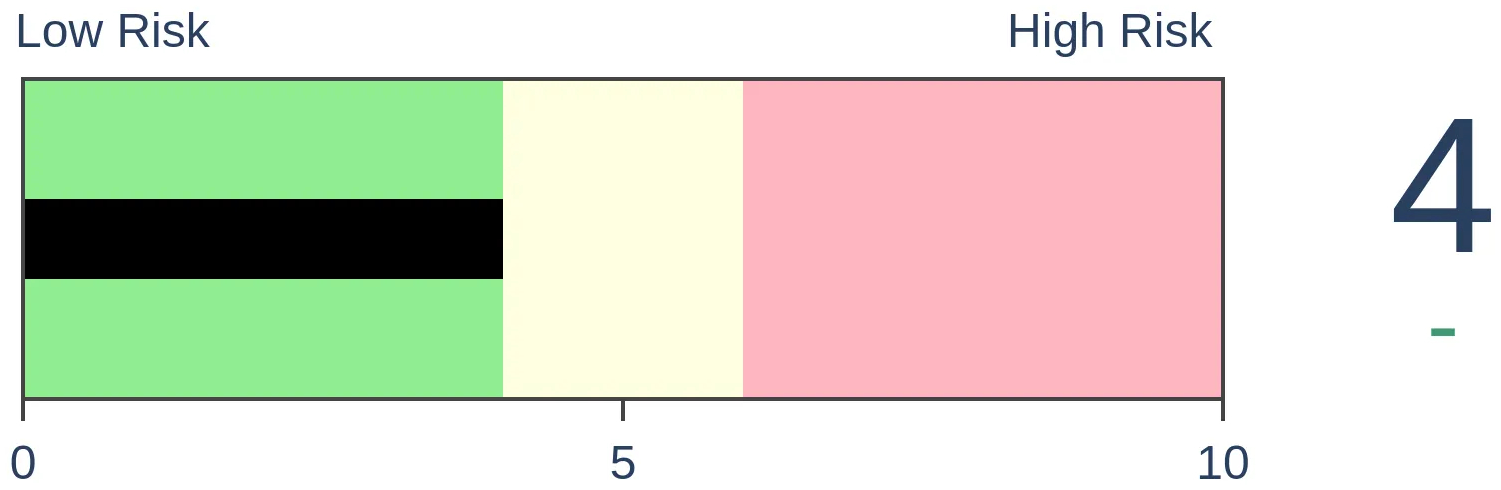
Bonds
|
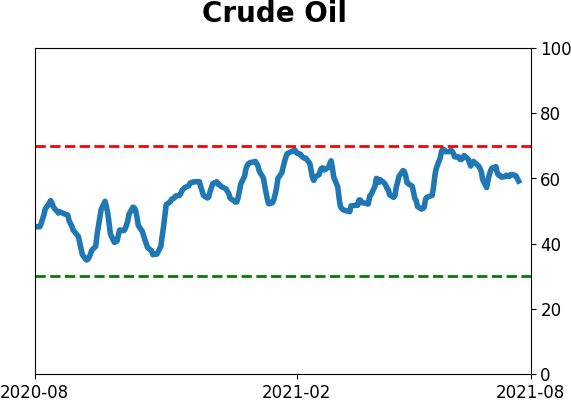
Crude Oil

|
|
Gold
|
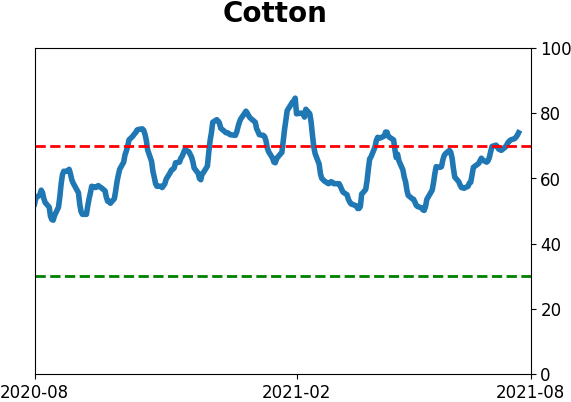
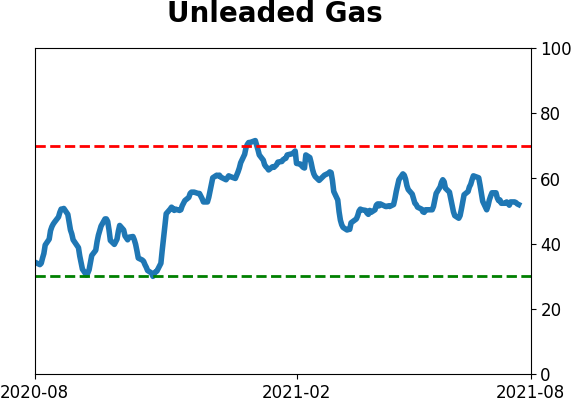
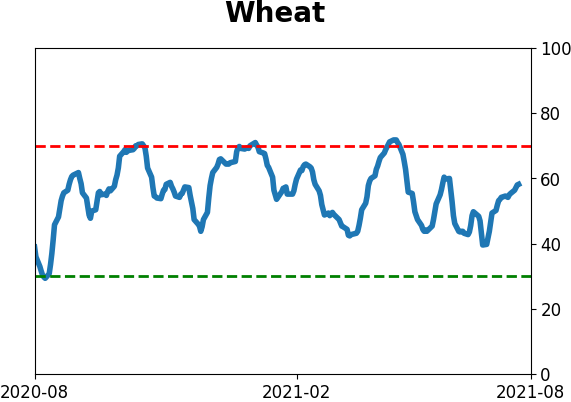
Agriculture
|
|
Research
By Jason Goepfert
BOTTOM LINE
Over the past 3 weeks, no energy stock has managed to close above its 50-day moving average. This is the 4th-longest streak of this kind of activity in the past 70 years.
FORECAST / TIMEFRAME
XLE -- Up, Medium-Term
|
Energy stocks enjoyed a historic thrust off their low, following a complete give-up among investors.
For the past few weeks, they've been stuck in neutral. While many are still holding above their long-term trends, none of them have managed to close above their medium-term 50-day moving averages for three straight weeks.
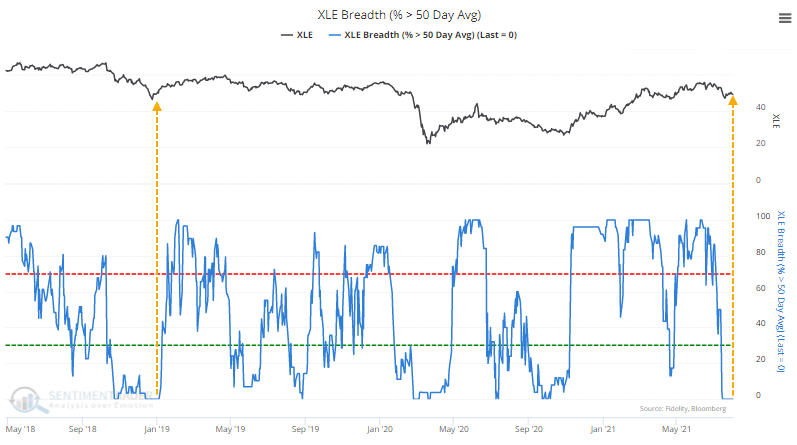
This is the longest stretch since the end of 2018. Over 70 years, this is now tied for the 4th-longest streak without a single stock in a medium-term uptrend.
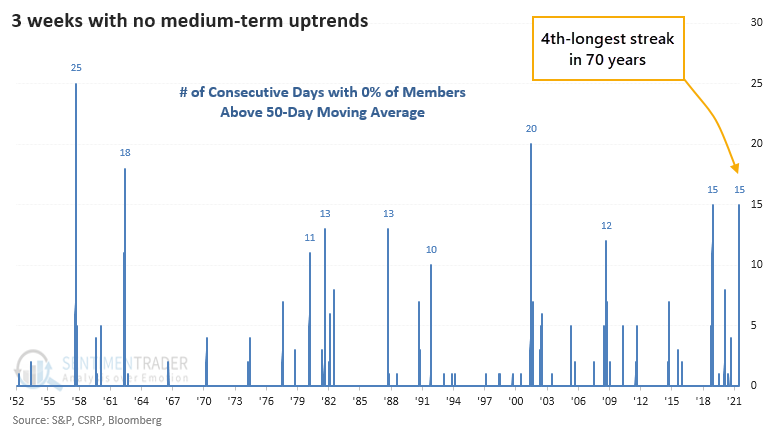
Energy stocks suffered a similar bout of medium-term failure at the end of 2018, but before that, there were only three other comparable stretches since 1952.
A WASHOUT SIGNAL...MOSTLY
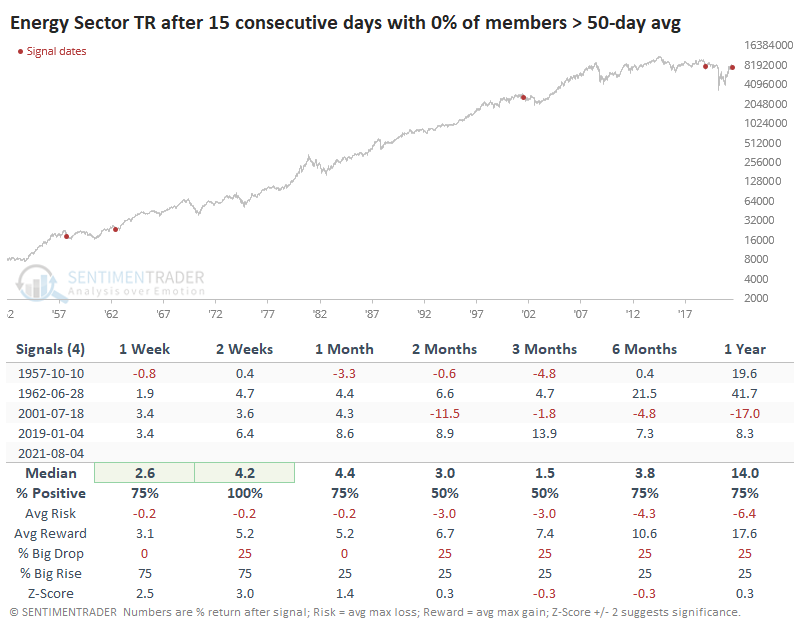
The other four saw the sector rally over the next couple of weeks, but then it faltered a couple of times. The 2001 occurrence was the only one that ended up leading to a protracted downtrend, though the 2019 signal did eventually lead to the pandemic crash.
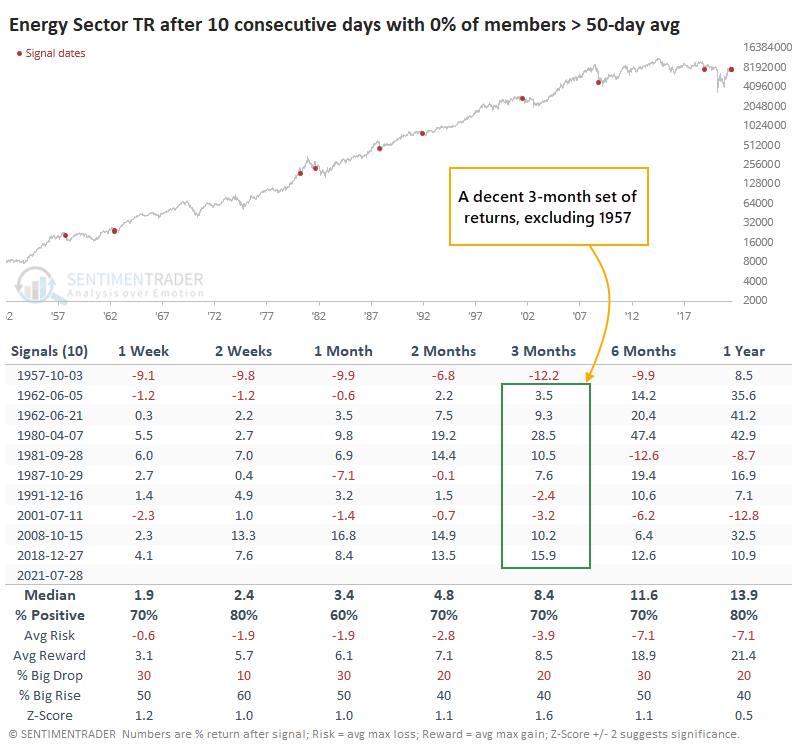
If we relax the parameters to look for streaks of 10 consecutive days with no energy stocks trading above their 50-day averages, we continue to see mostly positive returns in the week and months ahead. Only 2 of the 10 signals preceded losses over the next couple of weeks, and since 1960, none of them led to a loss of more than -3.5% over the next three months.
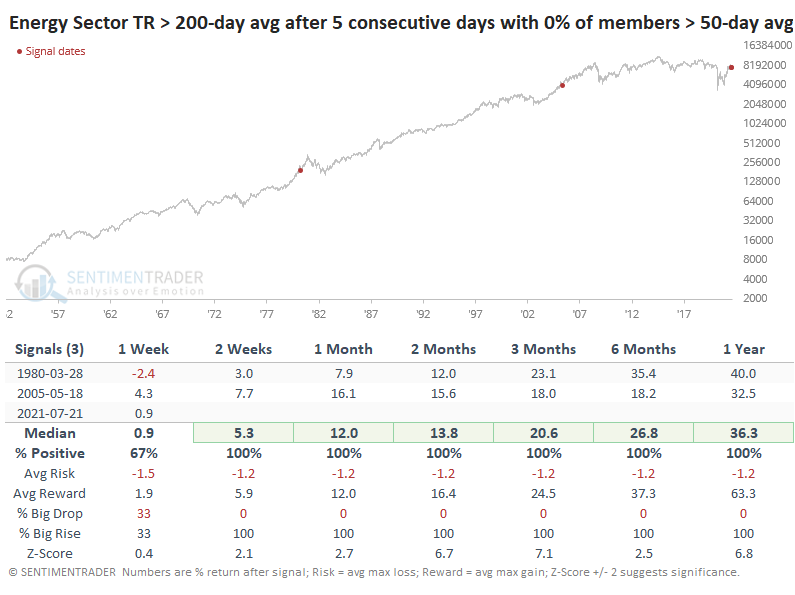
This is only the 3rd signal that saw even 5 consecutive days with no medium-term uptrends while the Energy sector was still trading above its 200-day moving average. We cannot read much into a sample size of two, but both preceded massive gains.
With another hit on Wednesday, Energy stocks haven't been able to recreate the sense of interest among buyers they enjoyed for most of the past eight months. Longer-term indicators aren't showing major oversold conditions, with the exception of the McClellan Summation Index, and there is a still-impressive 70% of members trading above their 200-day averages. But with weakness over the past few weeks, some of the medium-term ones, like the percentage of members above their 50-day averages, are signaling a decent risk/reward setup over the short- to medium-term.
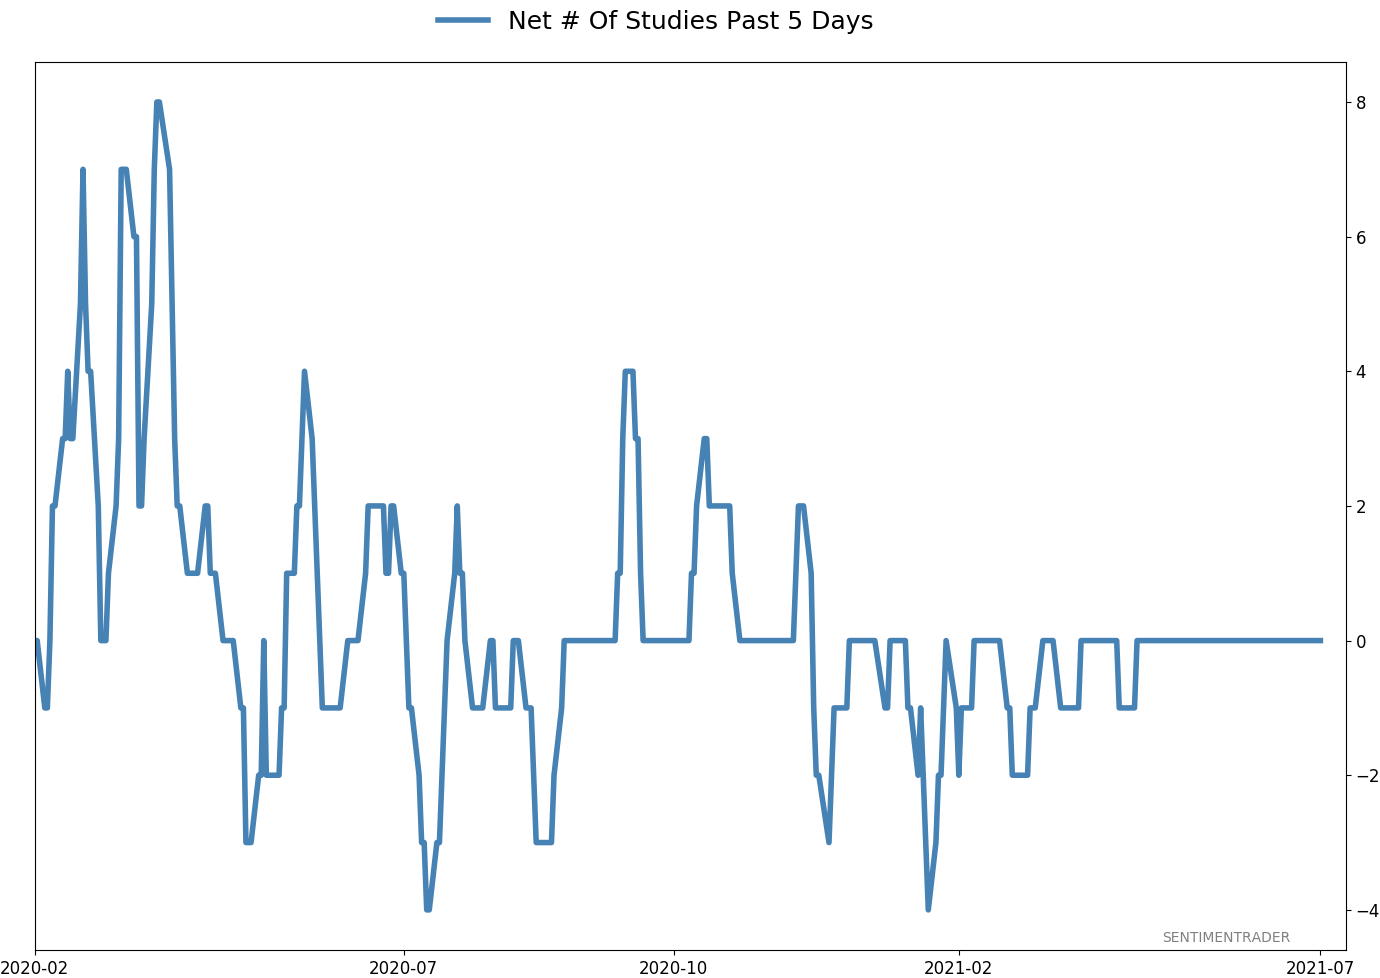
Active Studies
| Time Frame | Bullish | Bearish | | Short-Term | 0 | 4 | | Medium-Term | 4 | 3 | | Long-Term | 10 | 5 |
|
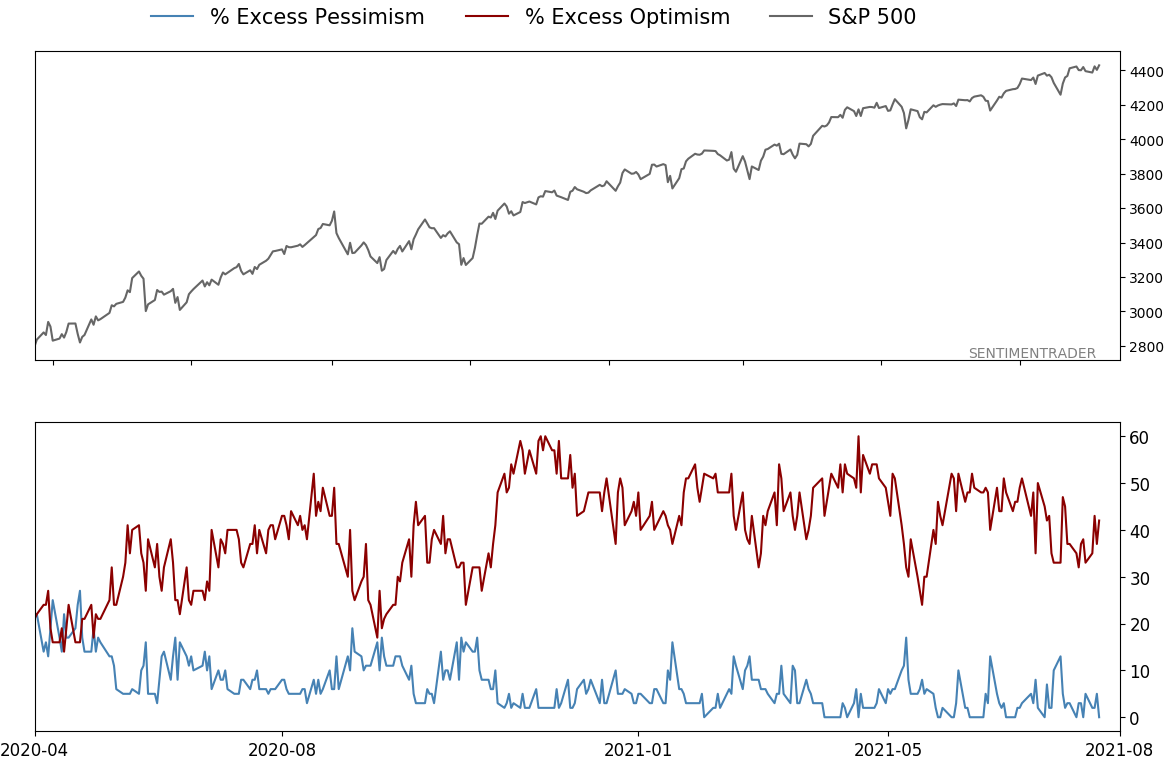
Indicators at Extremes
|
% Showing Pessimism: 0%
Bullish for Stocks
|
|
Portfolio
| Position | Description | Weight % | Added / Reduced | Date | | Stocks | RSP | 4.1 | Added 4.1% | 2021-05-19 | | Bonds | 23.9% BND, 6.9% SCHP | 30.7 | Reduced 7.1% | 2021-05-19 | | Commodities | GCC | 2.6 | Reduced 2.1%
| 2020-09-04 | | Precious Metals | GDX | 5.6 | Reduced 4.2% | 2021-05-19 | | Special Situations | 4.3% XLE, 2.2% PSCE | 7.6 | Reduced 5.6% | 2021-04-22 | | Cash | | 49.4 | | |
|
Updates (Changes made today are underlined)
Much of our momentum and trend work has remained positive for several months, with some scattered exceptions. Almost all sentiment-related work has shown a poor risk/reward ratio for stocks, especially as speculation drove to record highs in exuberance in February. Much of that has worn off, and most of our models are back toward neutral levels. There isn't much to be excited about here. The same goes for bonds and even gold. Gold has been performing well lately and is back above long-term trend lines. The issue is that it has a poor record of holding onto gains when attempting a long-term trend change like this, so we'll take a wait-and-see approach. RETURN YTD: 9.0% 2020: 8.1%, 2019: 12.6%, 2018: 0.6%, 2017: 3.8%, 2016: 17.1%, 2015: 9.2%, 2014: 14.5%, 2013: 2.2%, 2012: 10.8%, 2011: 16.5%, 2010: 15.3%, 2009: 23.9%, 2008: 16.2%, 2007: 7.8%
|
|
Phase Table
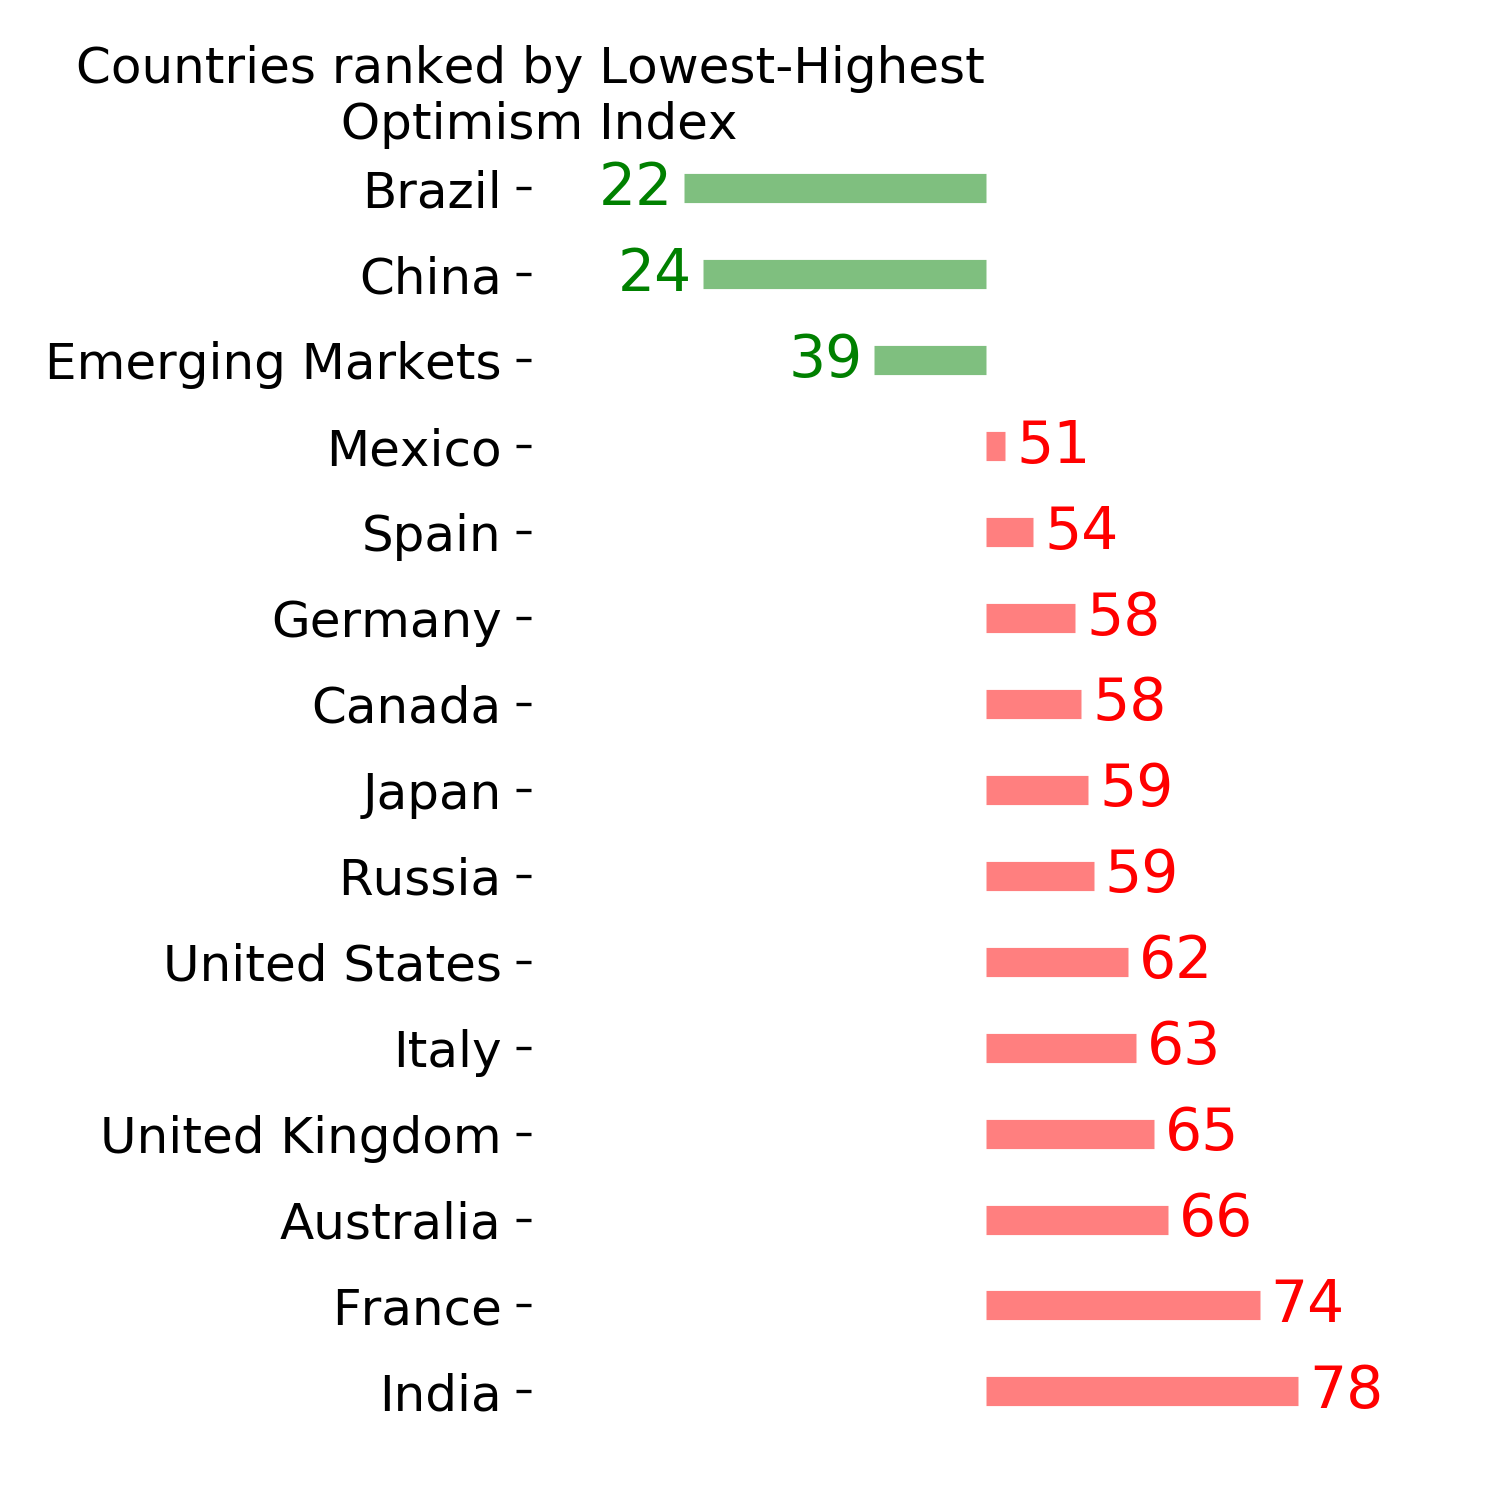
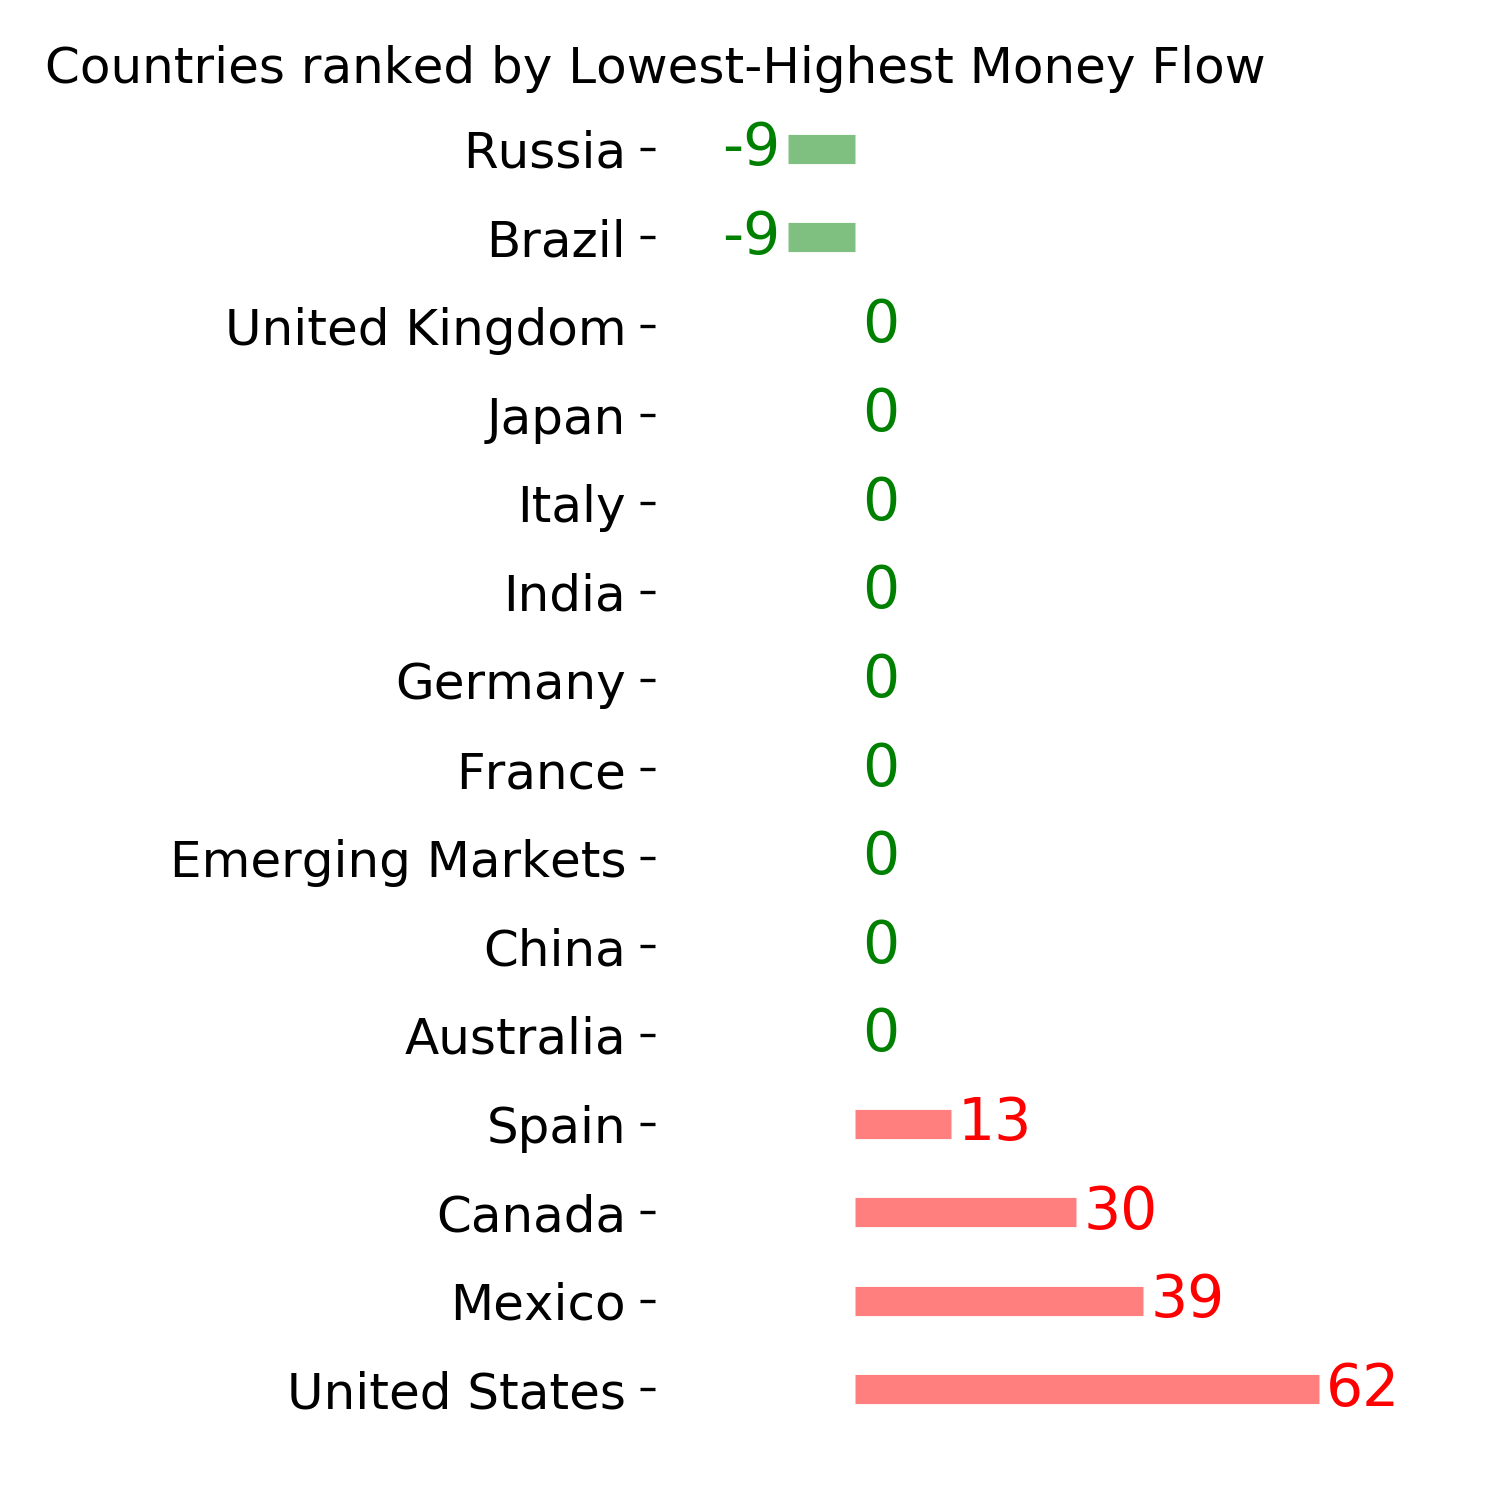
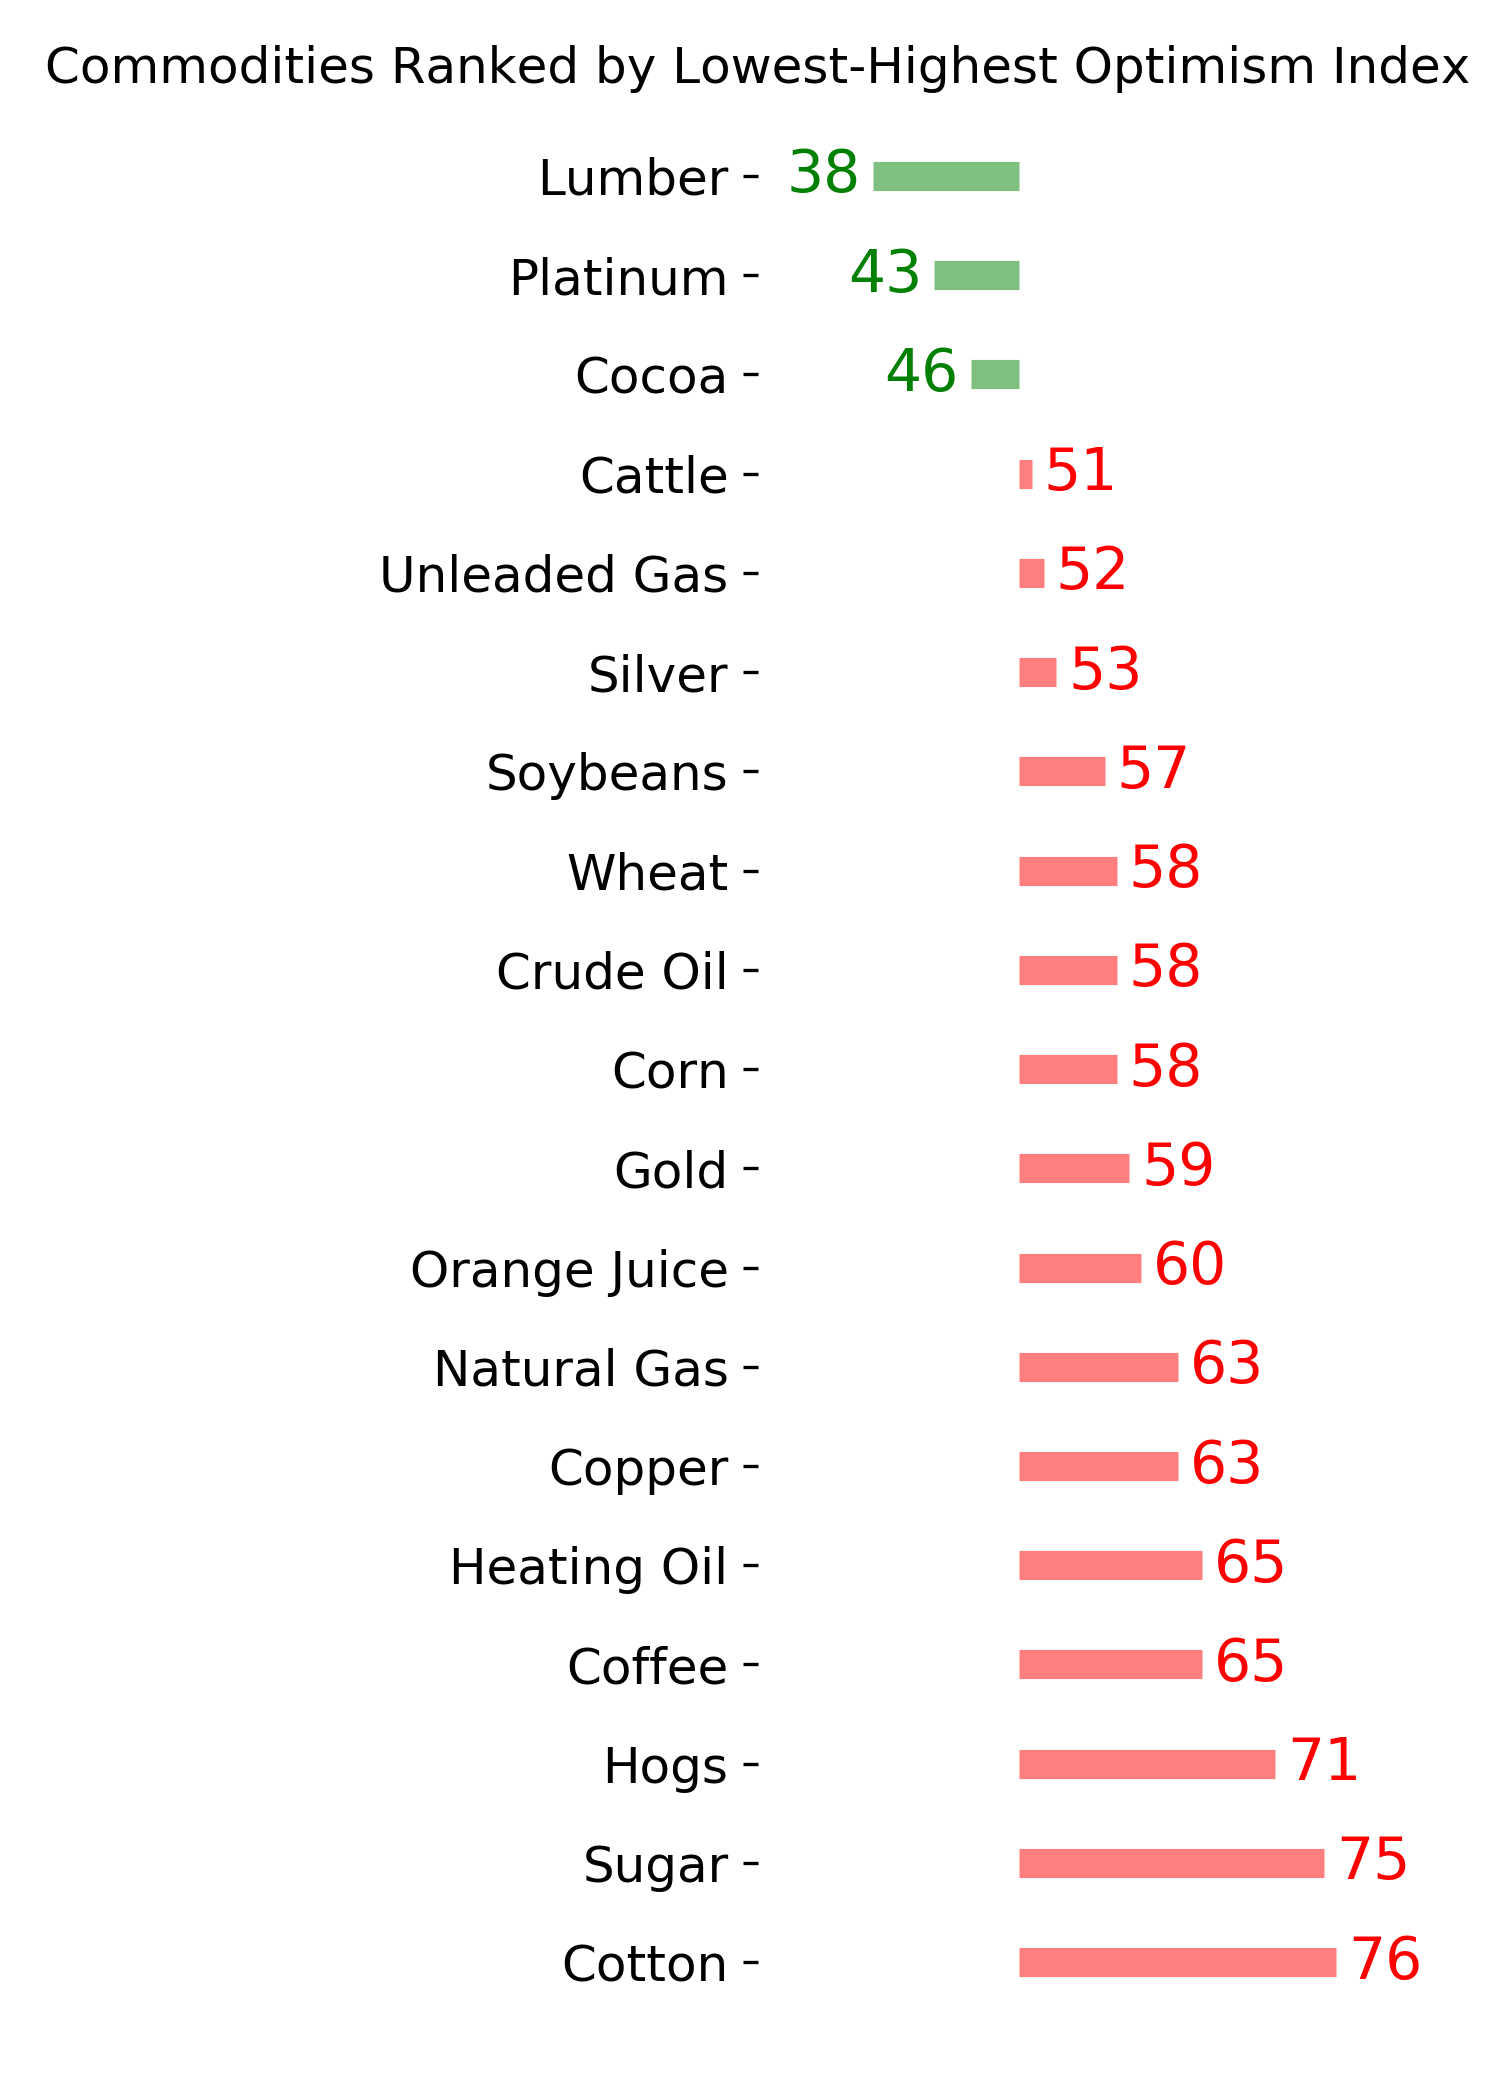
Ranks
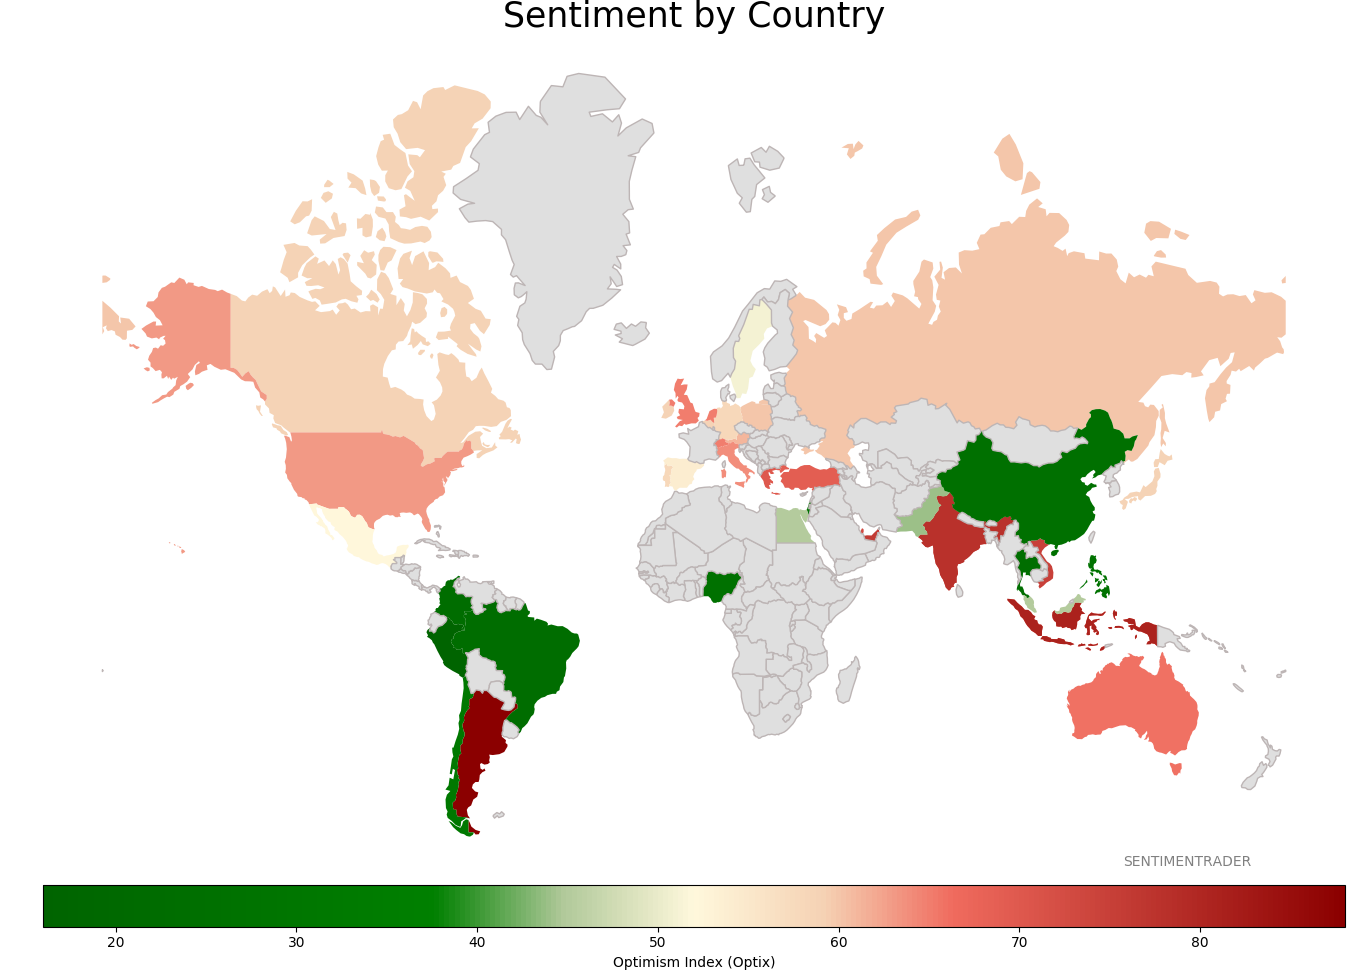
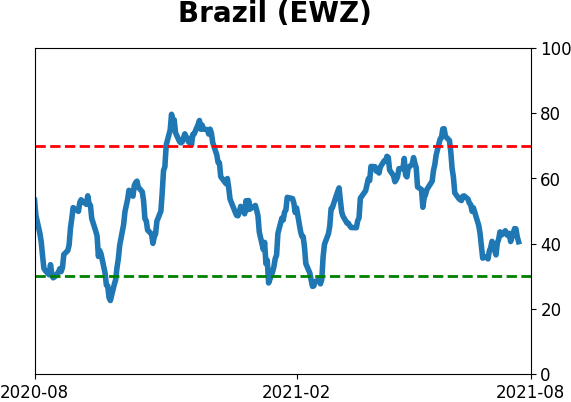
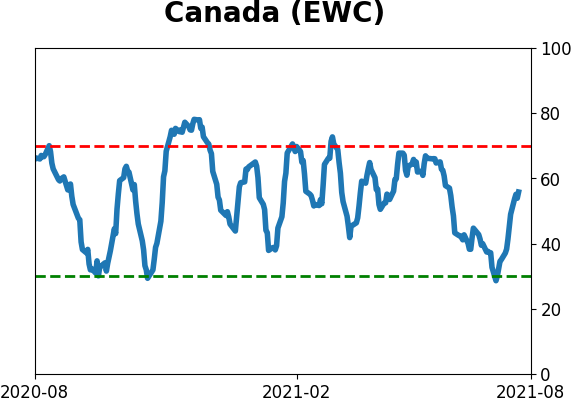
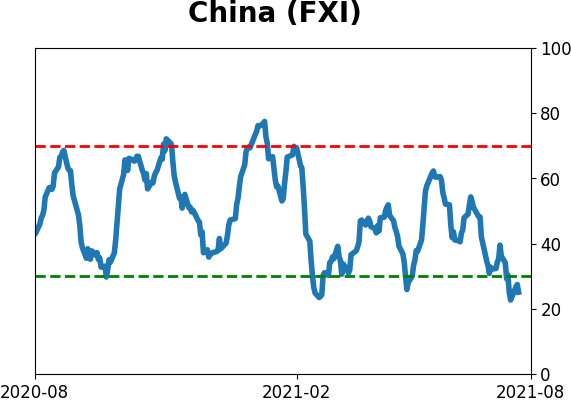
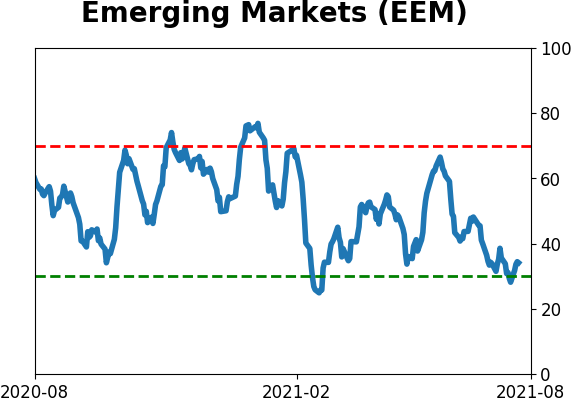
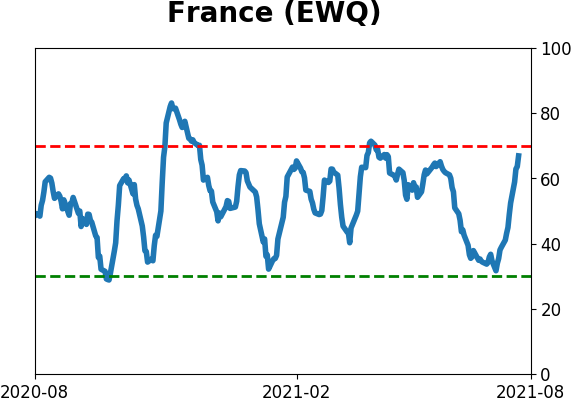
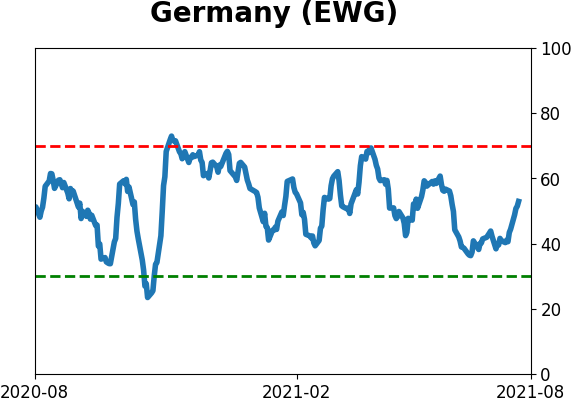
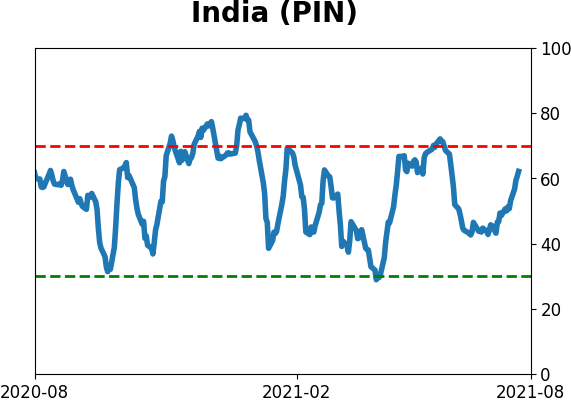
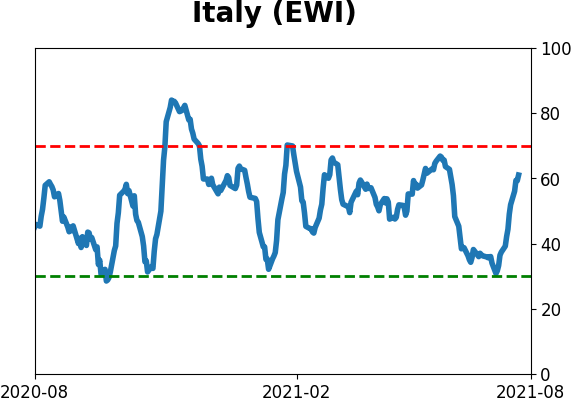
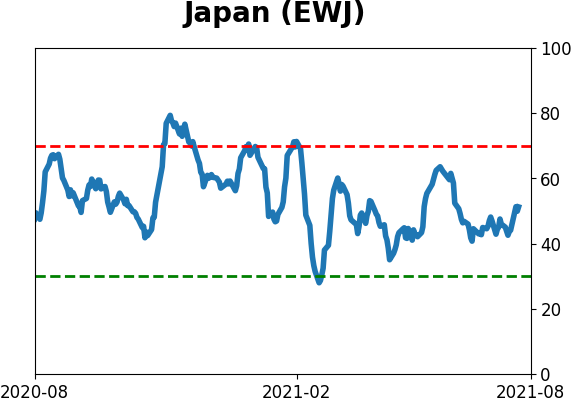
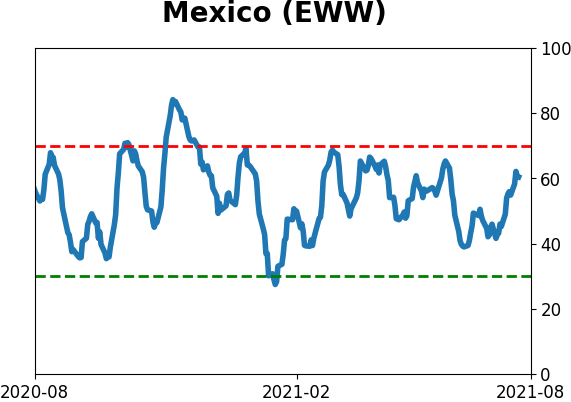
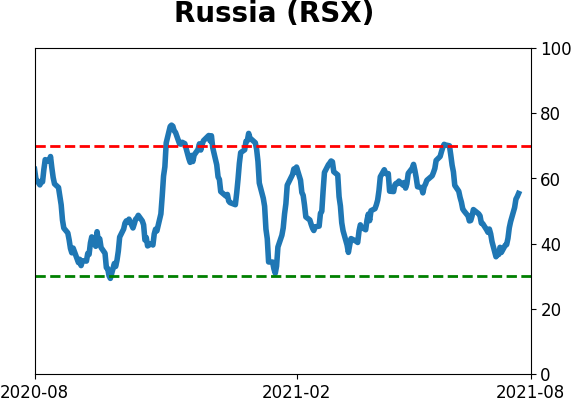
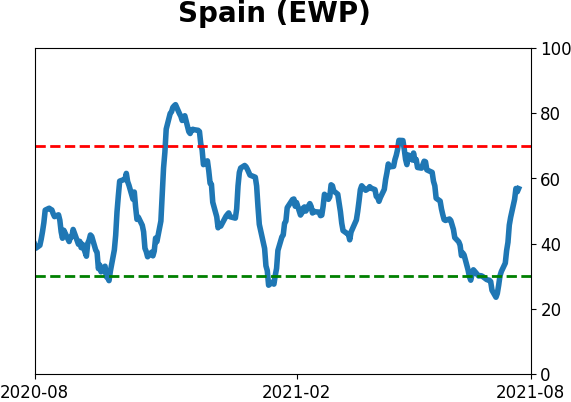
Sentiment Around The World
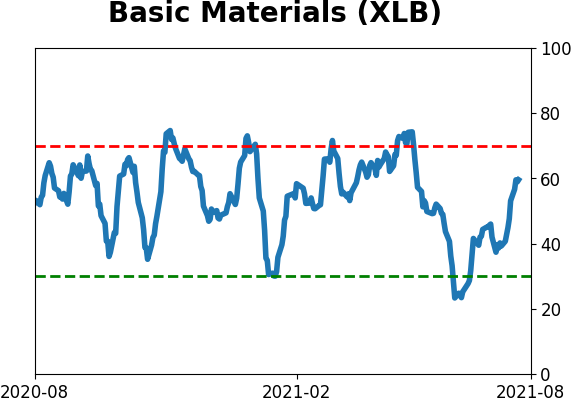
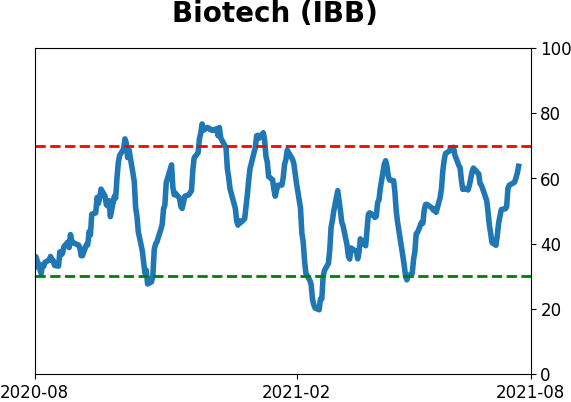
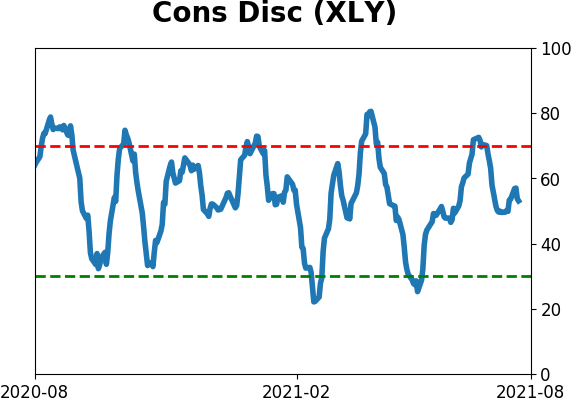
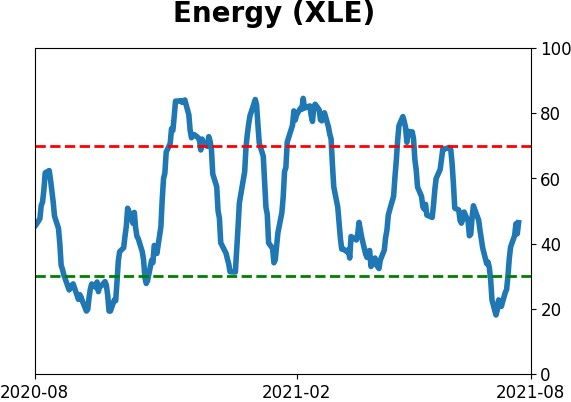
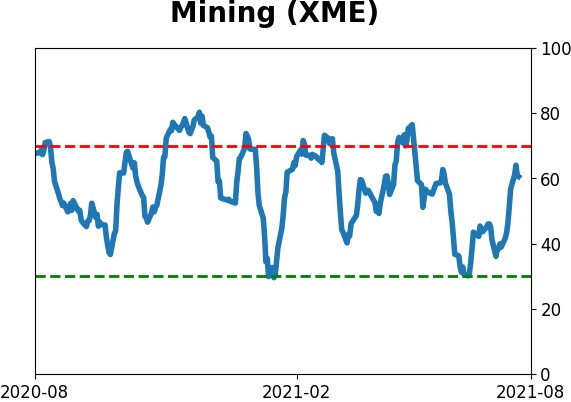
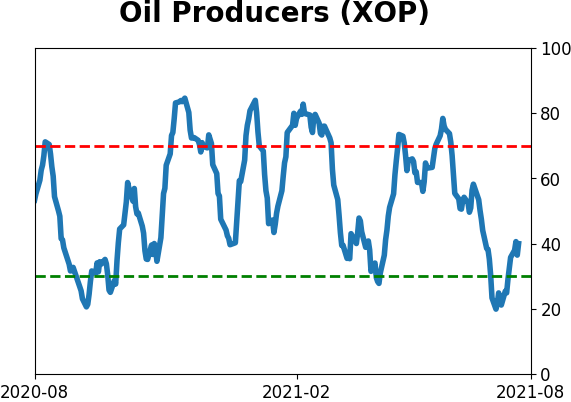
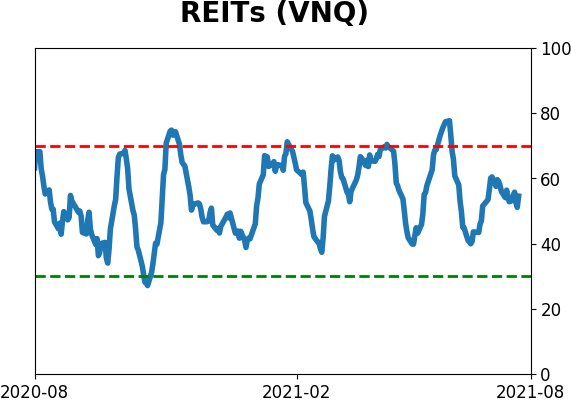
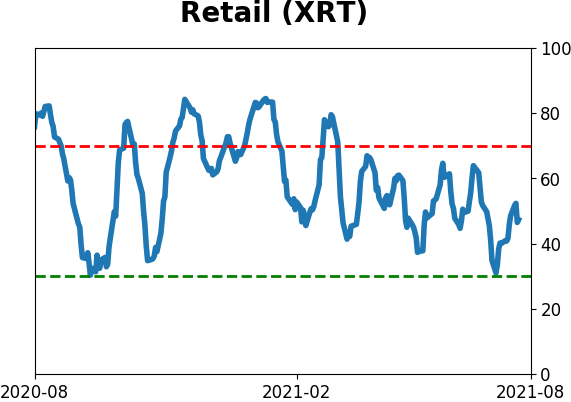
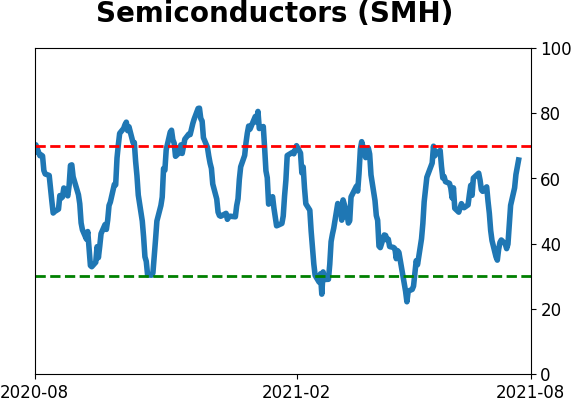
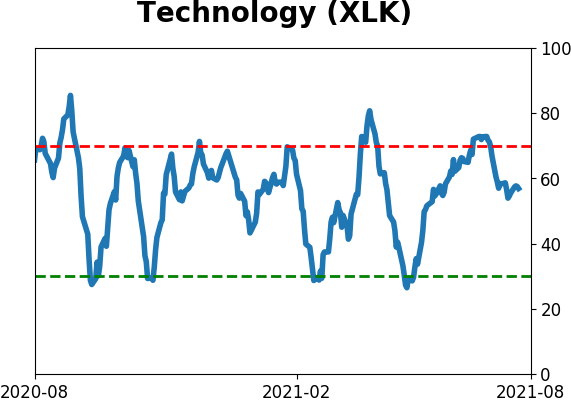
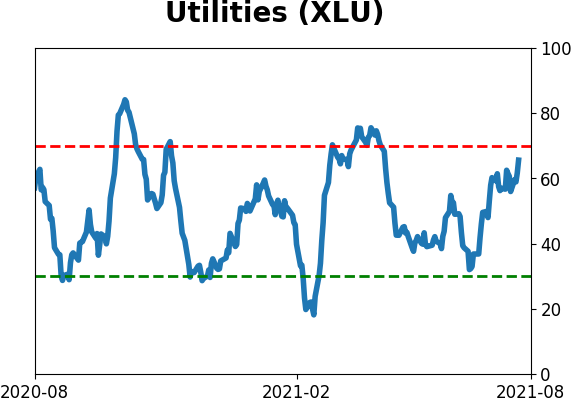
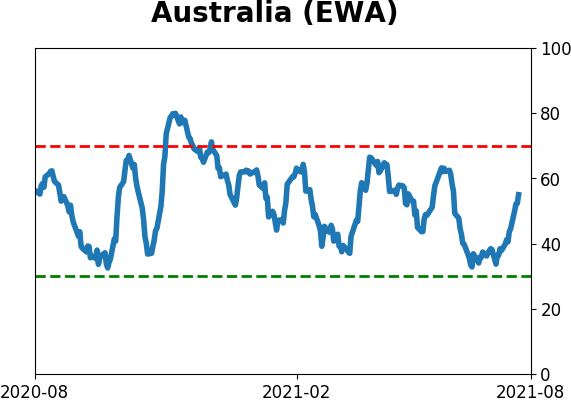
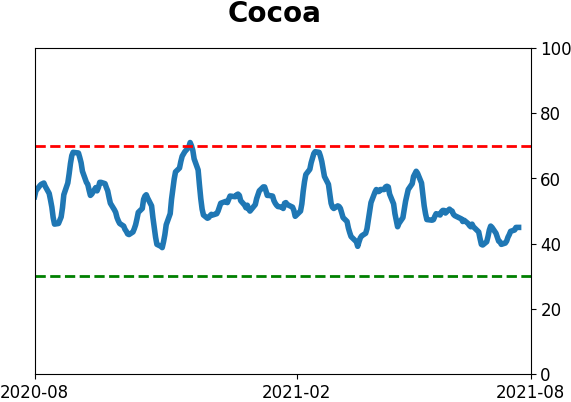
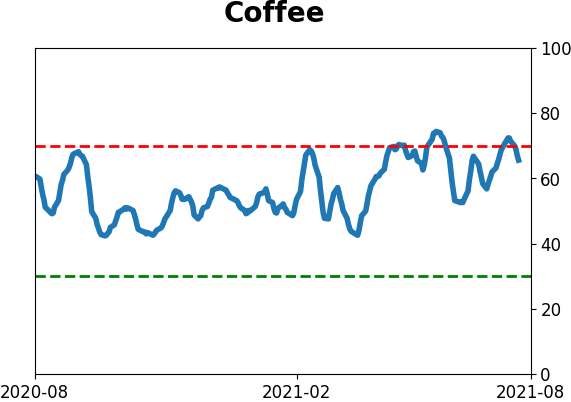
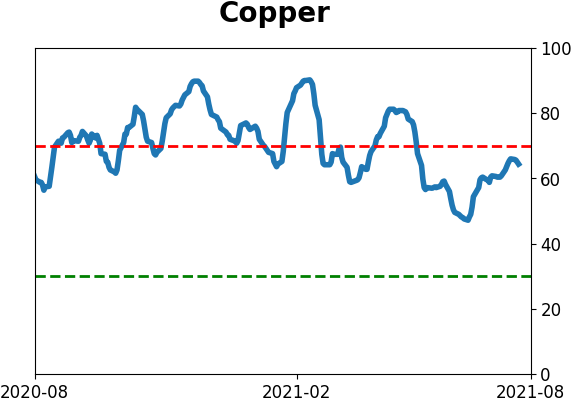
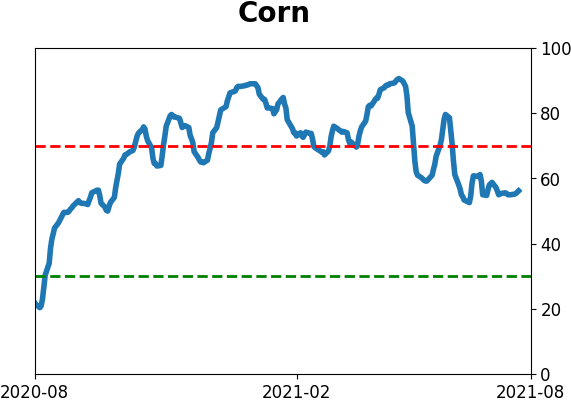
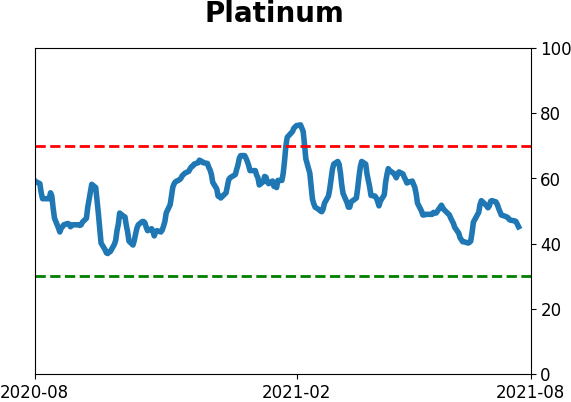
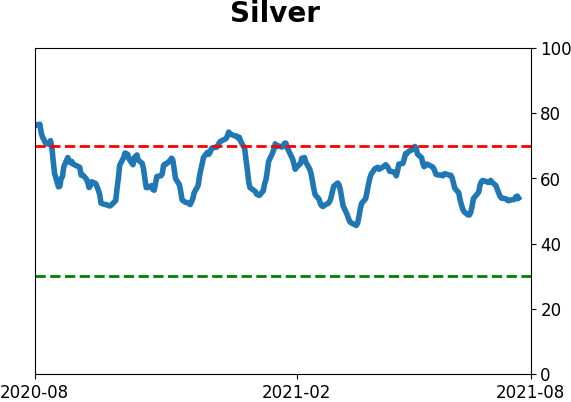
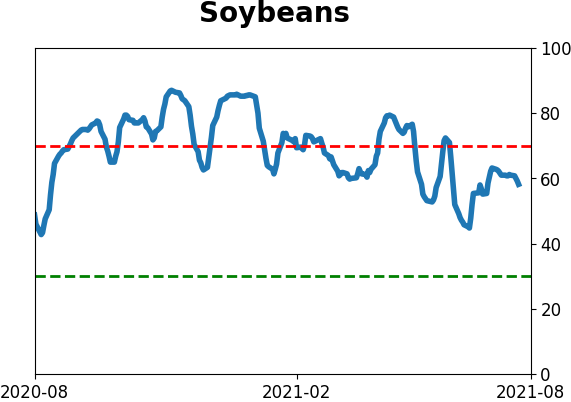
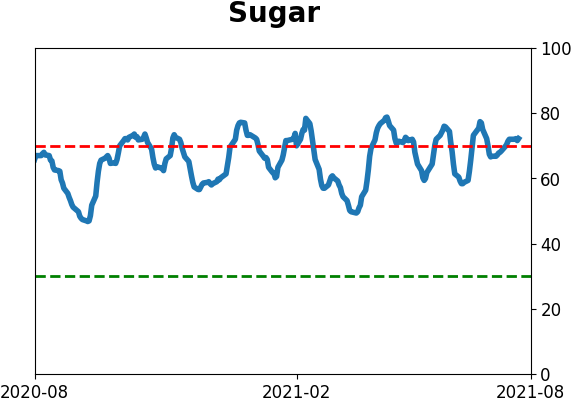
Optimism Index Thumbnails
|
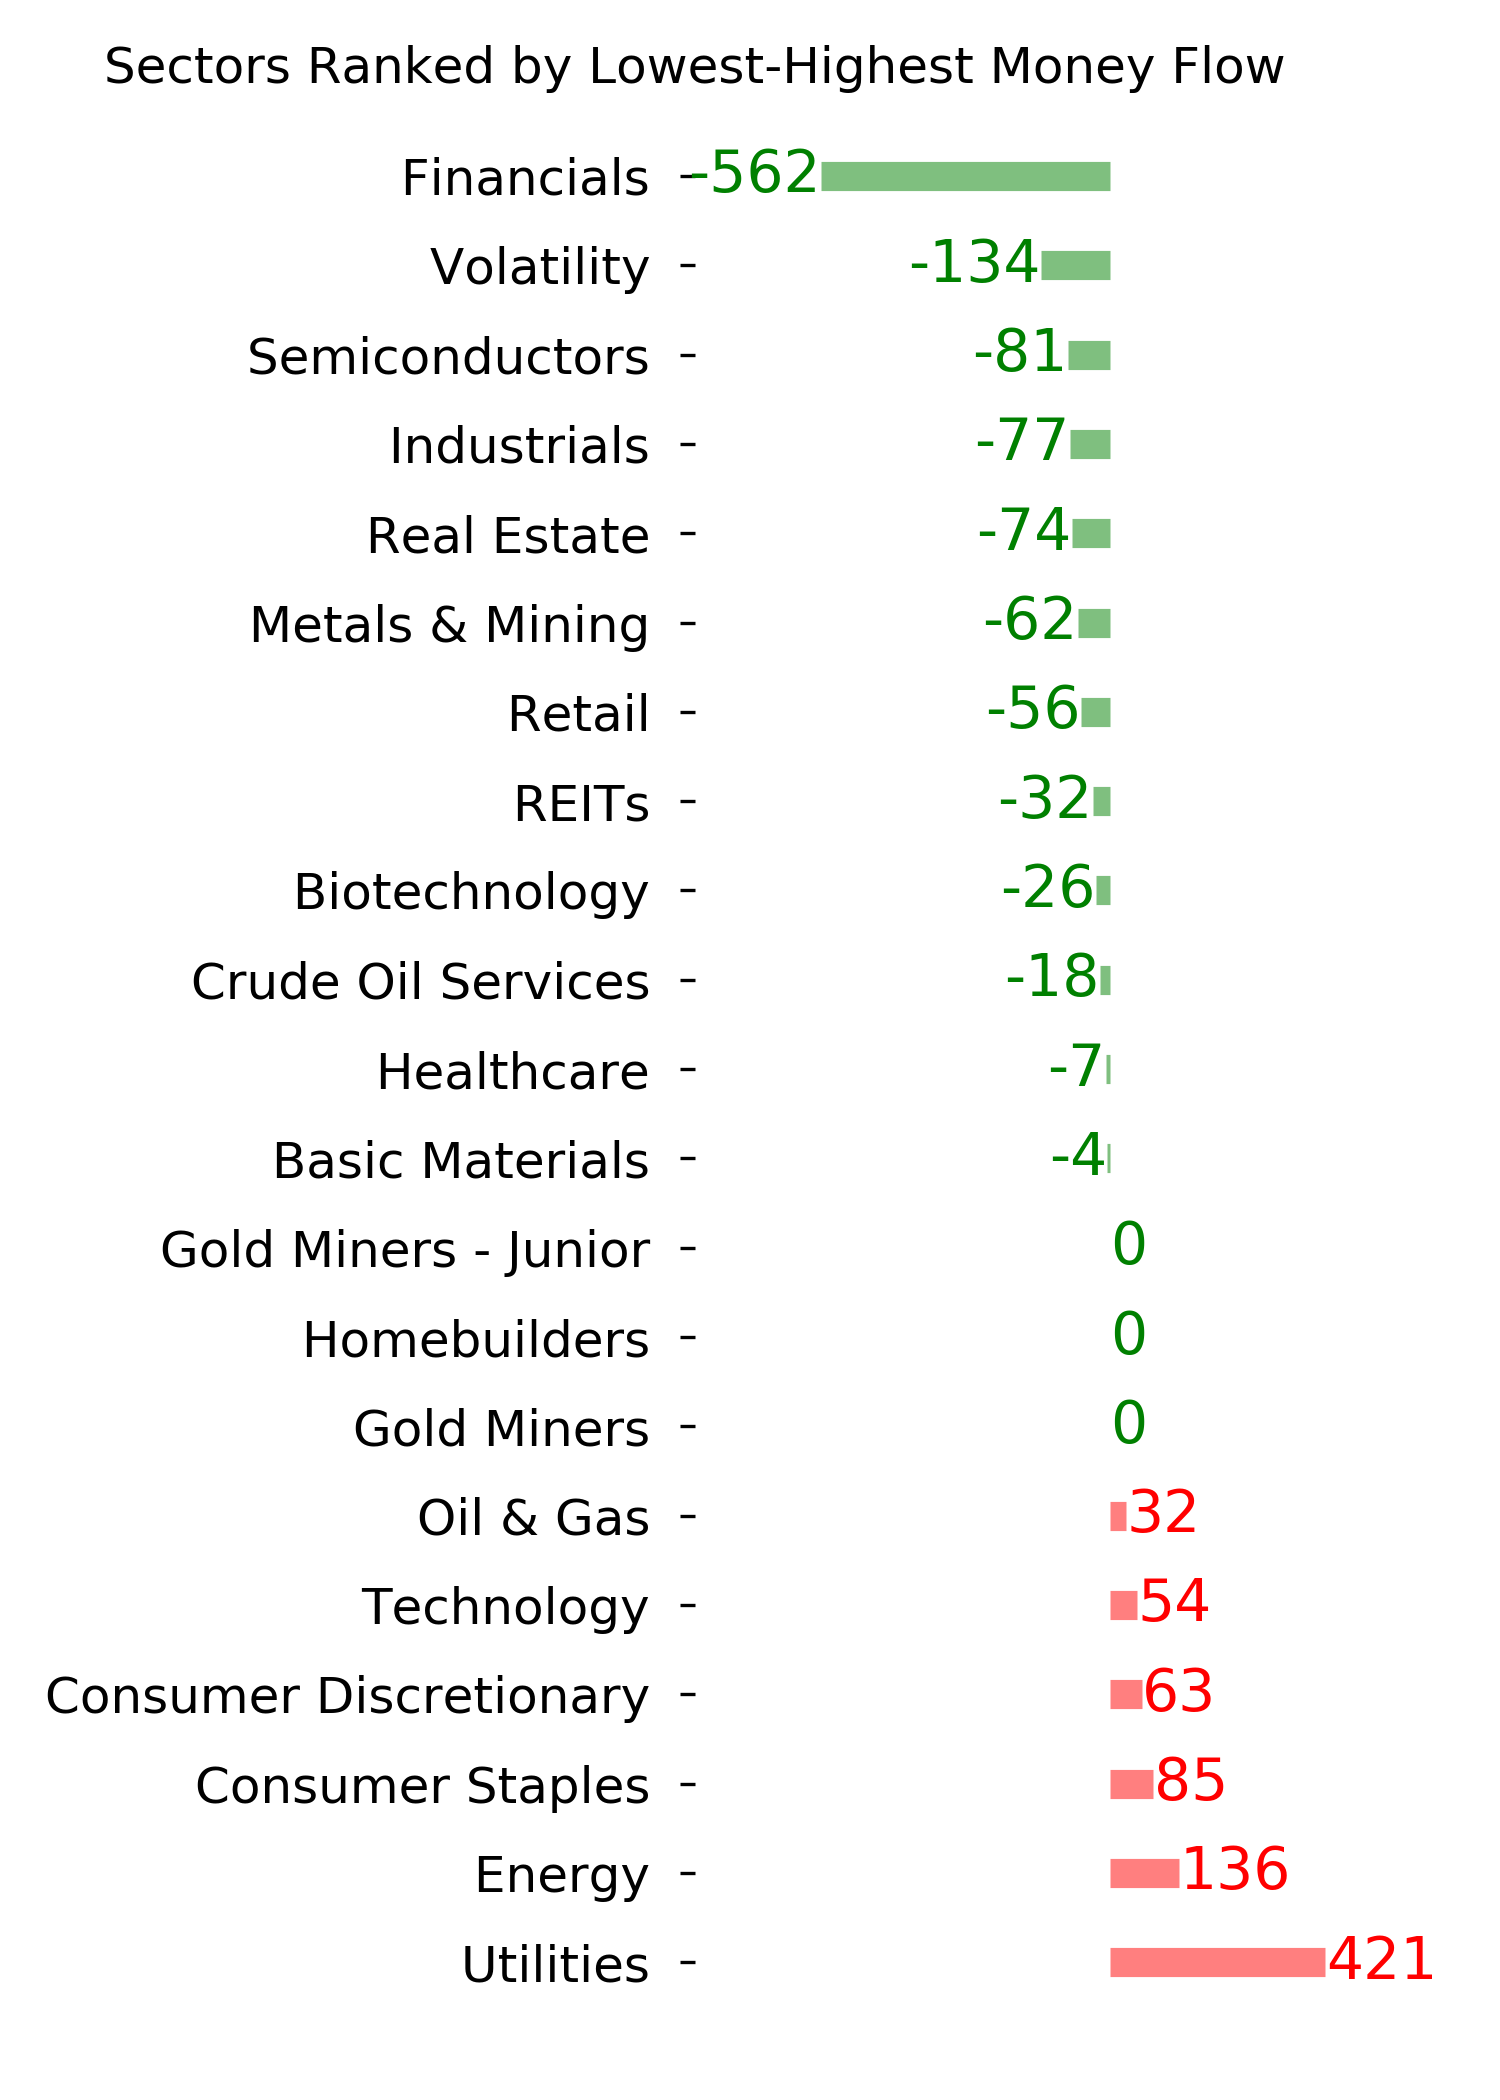
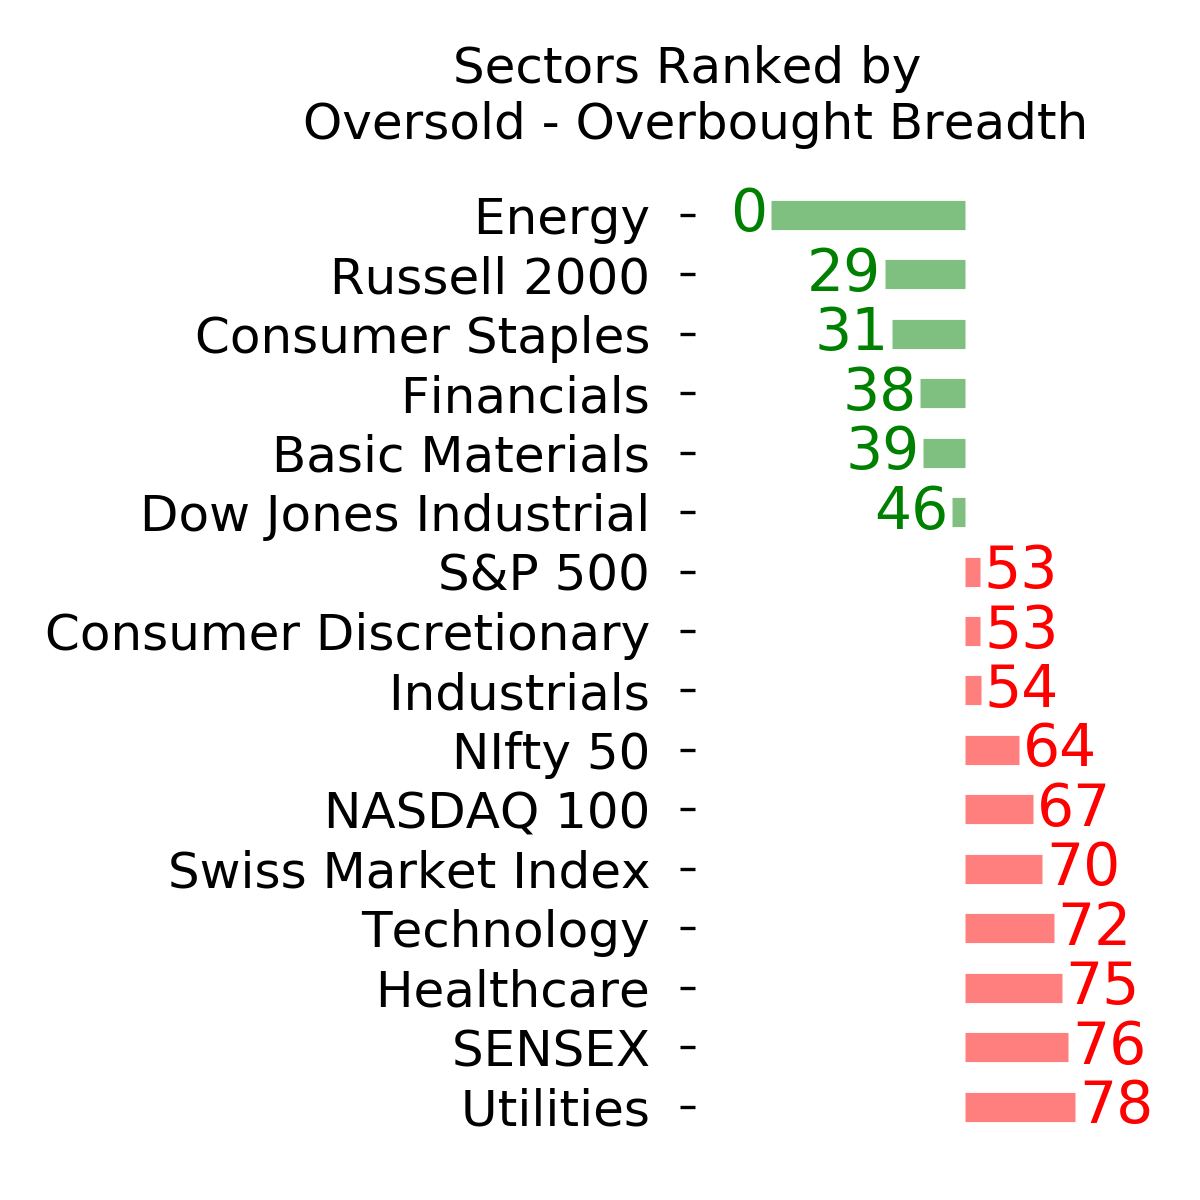
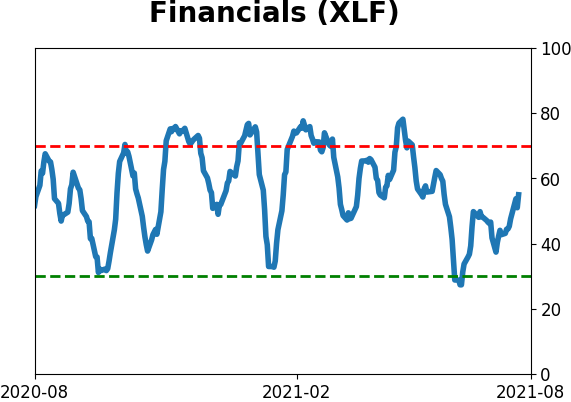
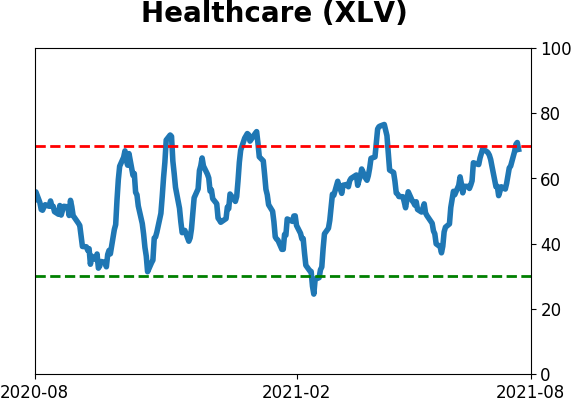
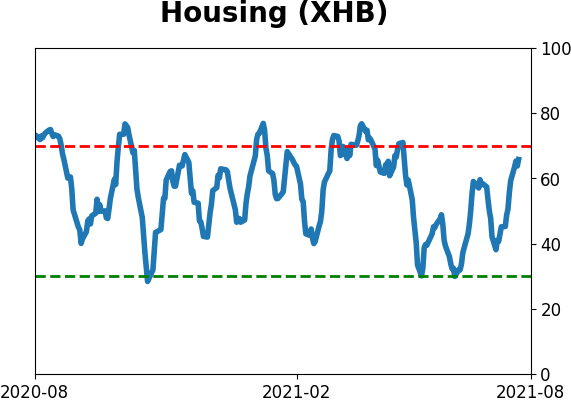
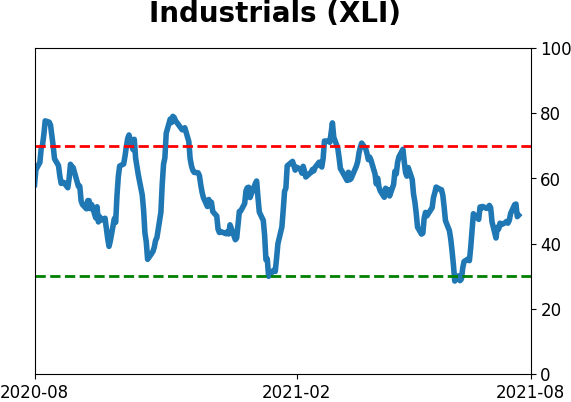
Sector ETF's - 10-Day Moving Average
|
|
|
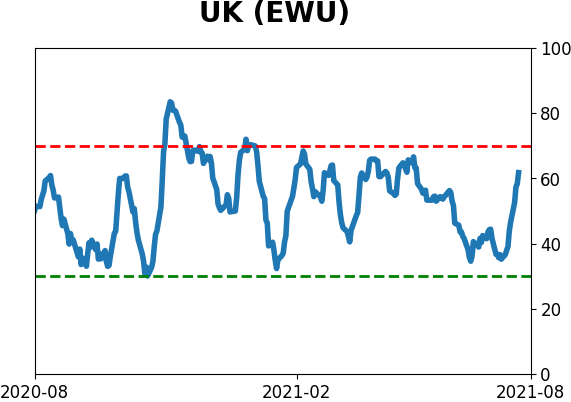
Country ETF's - 10-Day Moving Average
|
|
|
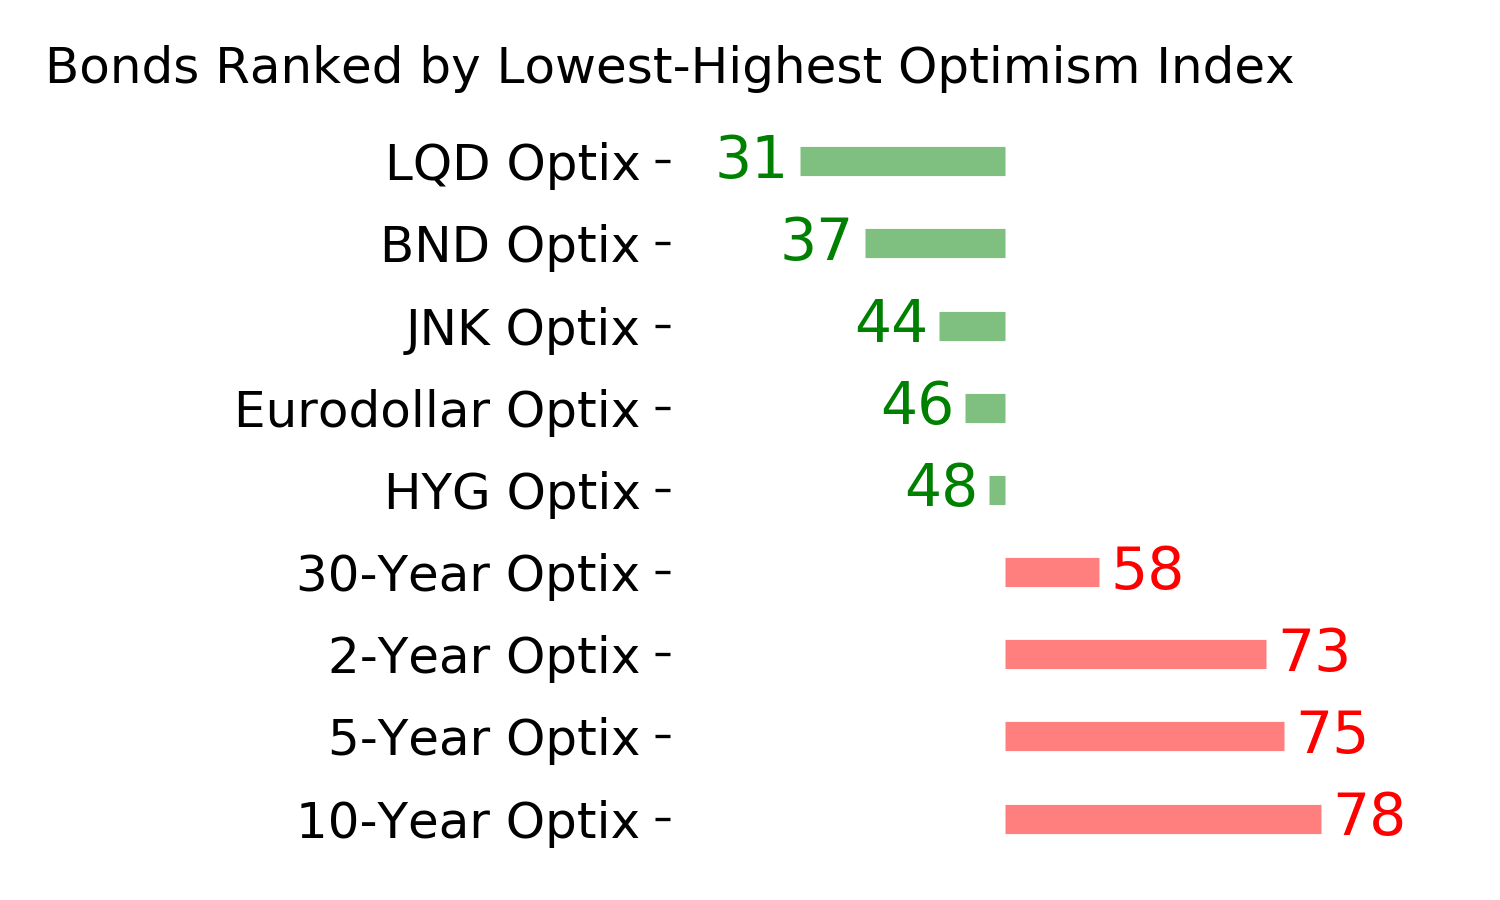
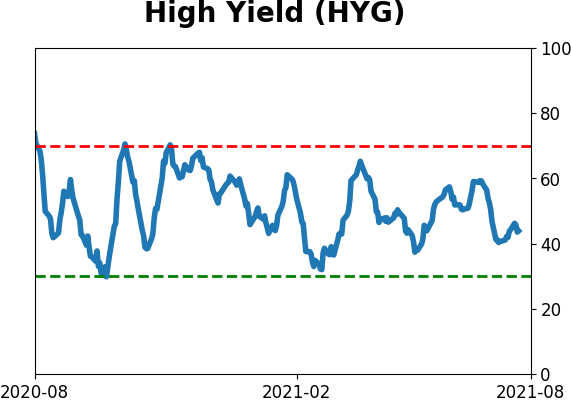
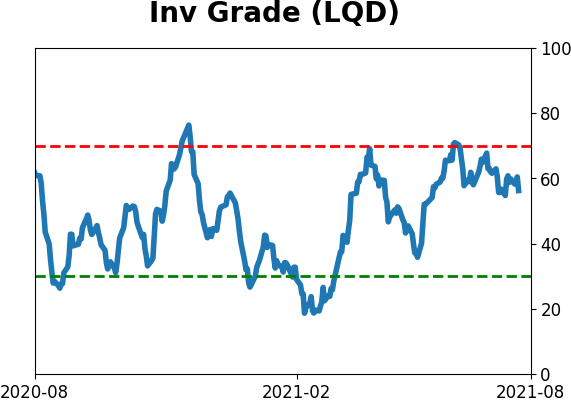
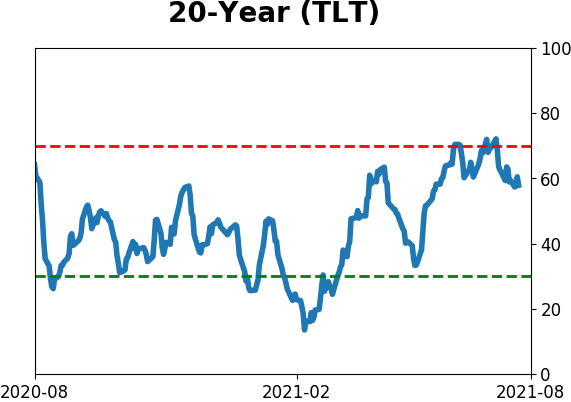
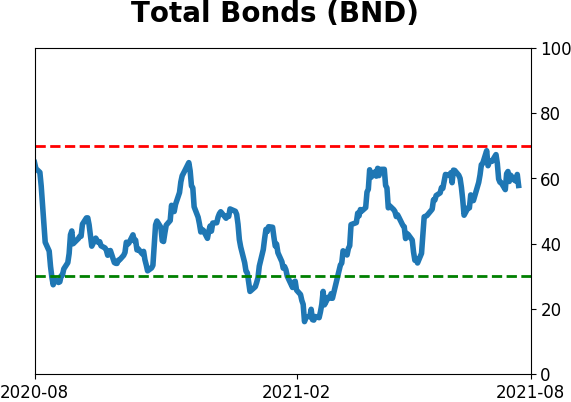
Bond ETF's - 10-Day Moving Average
|
|
|
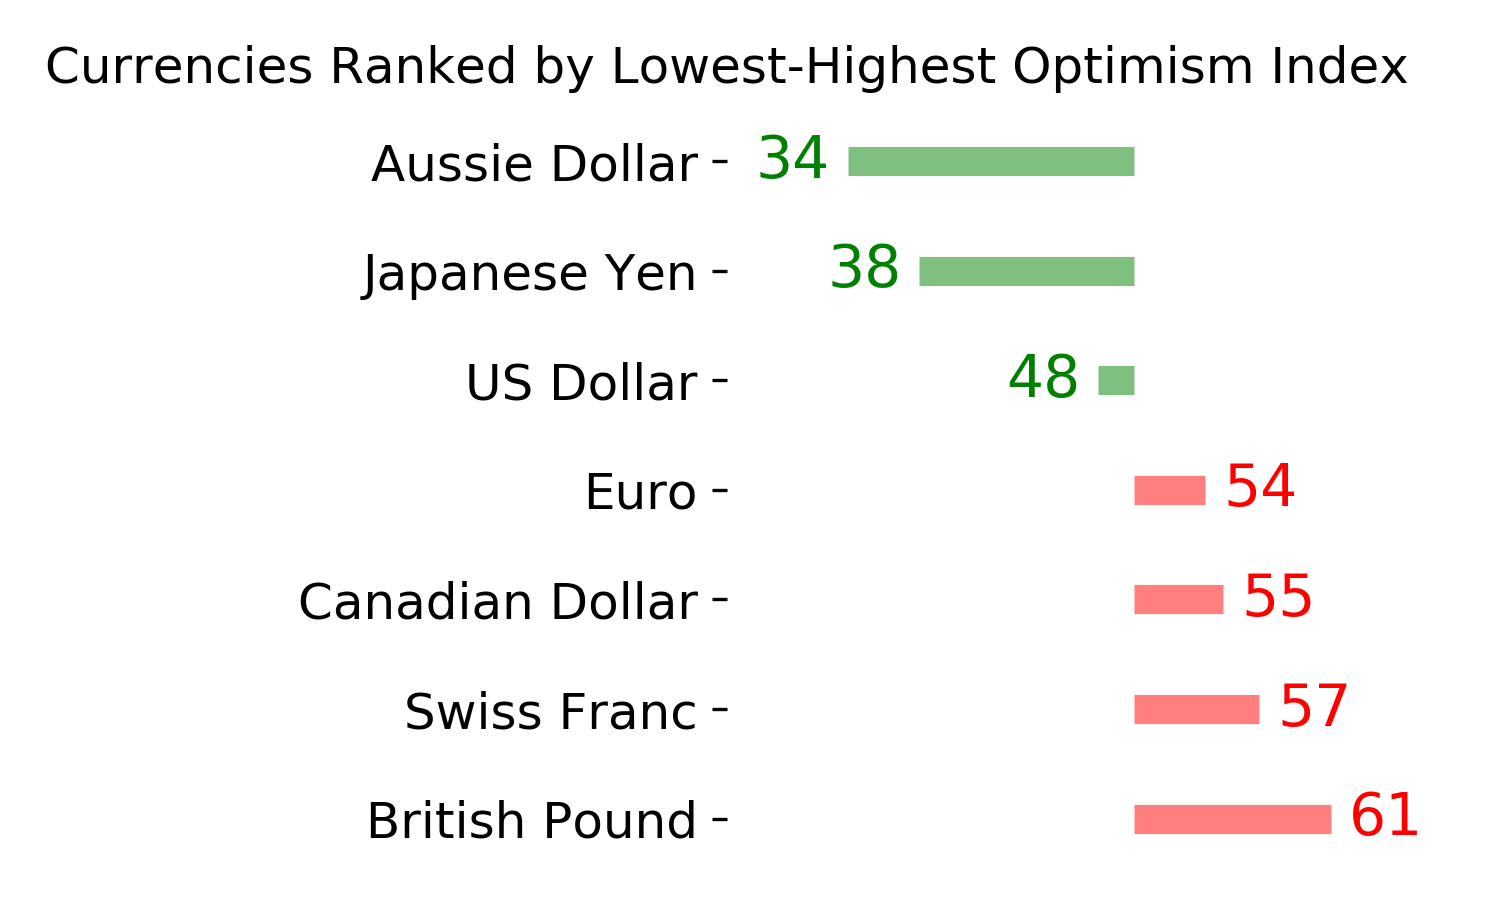
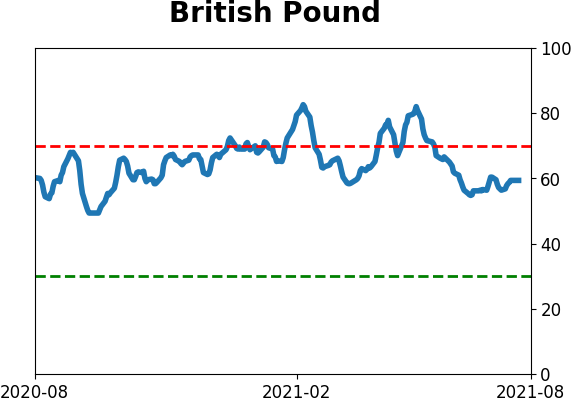
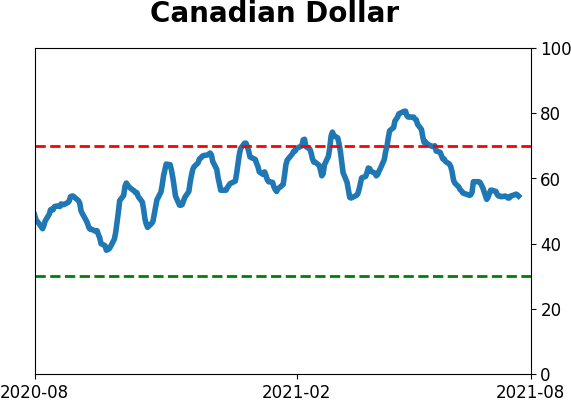
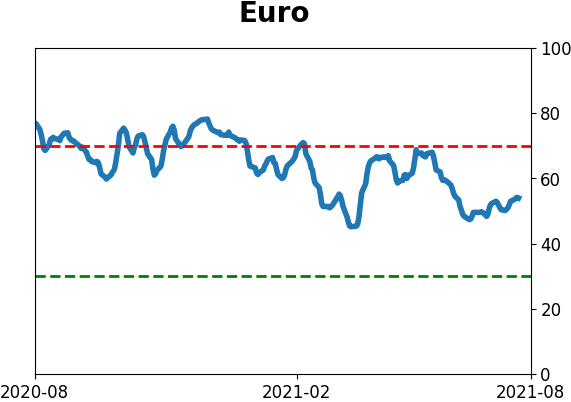
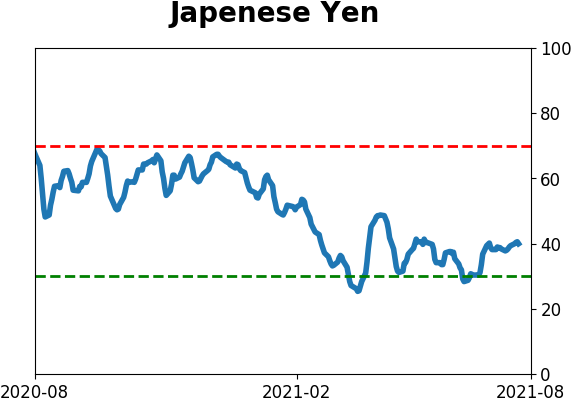
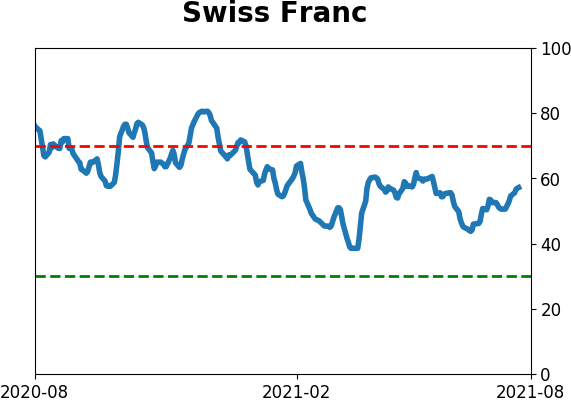
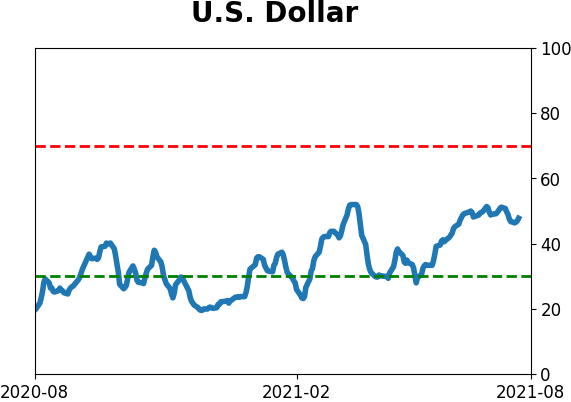
Currency ETF's - 5-Day Moving Average
|
|
|
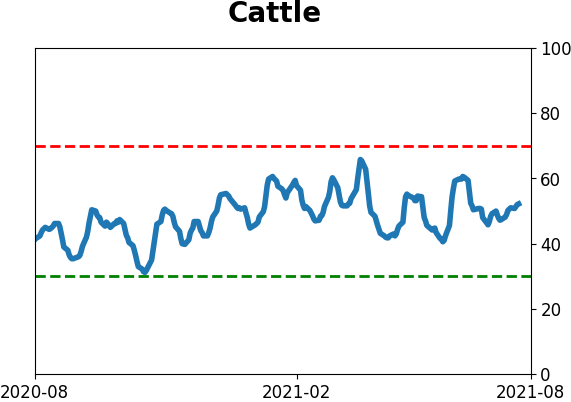
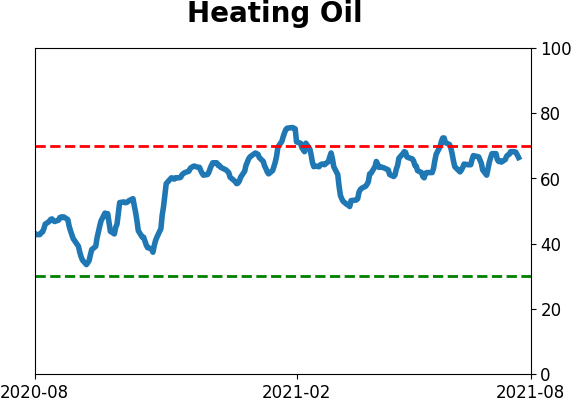
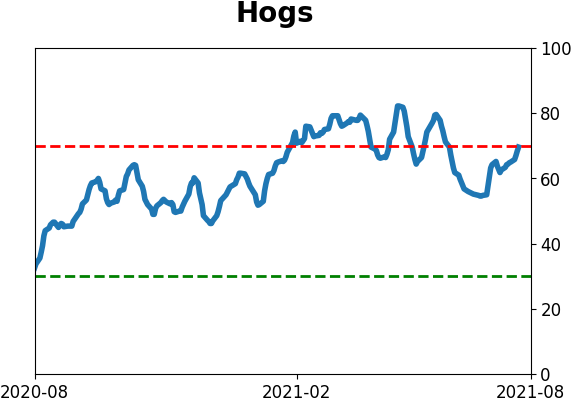
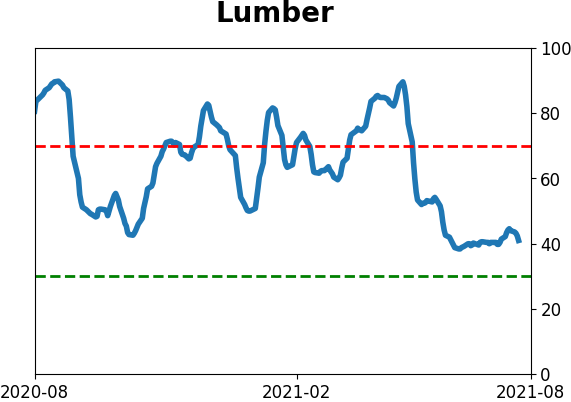
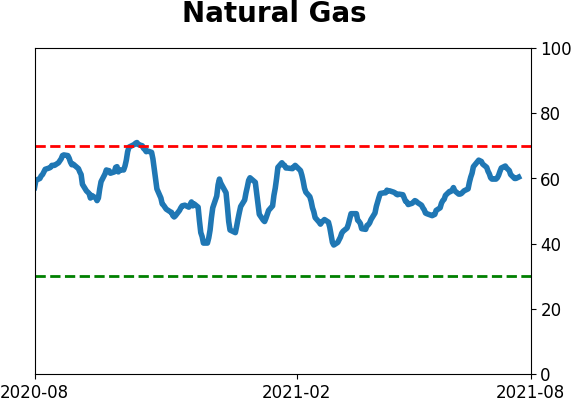
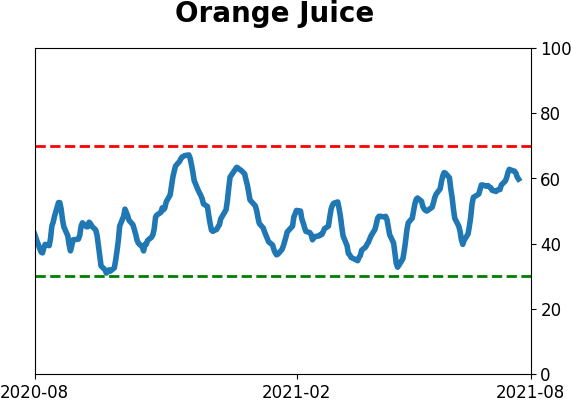
Commodity ETF's - 5-Day Moving Average
|
|