Headlines
|
|
Gold Miners Need to See Buyers Stick Around:
The percentage of gold mining stocks trading above their 50-day moving averages hit a low level and is curling up. That has been a decent sign for forward returns but longer-term breadth measures are still showing weak breadth in the sector.
Bottom Line:
See the Outlook & Allocations page for more details on these summaries STOCKS: Hold
The speculative frenzy in February is wrung out. Internal dynamics have mostly held up, with some exceptions. Many of our studies still show a mixed to poor short-term view, with medium- and long-term ones turning more positive. BONDS: Hold
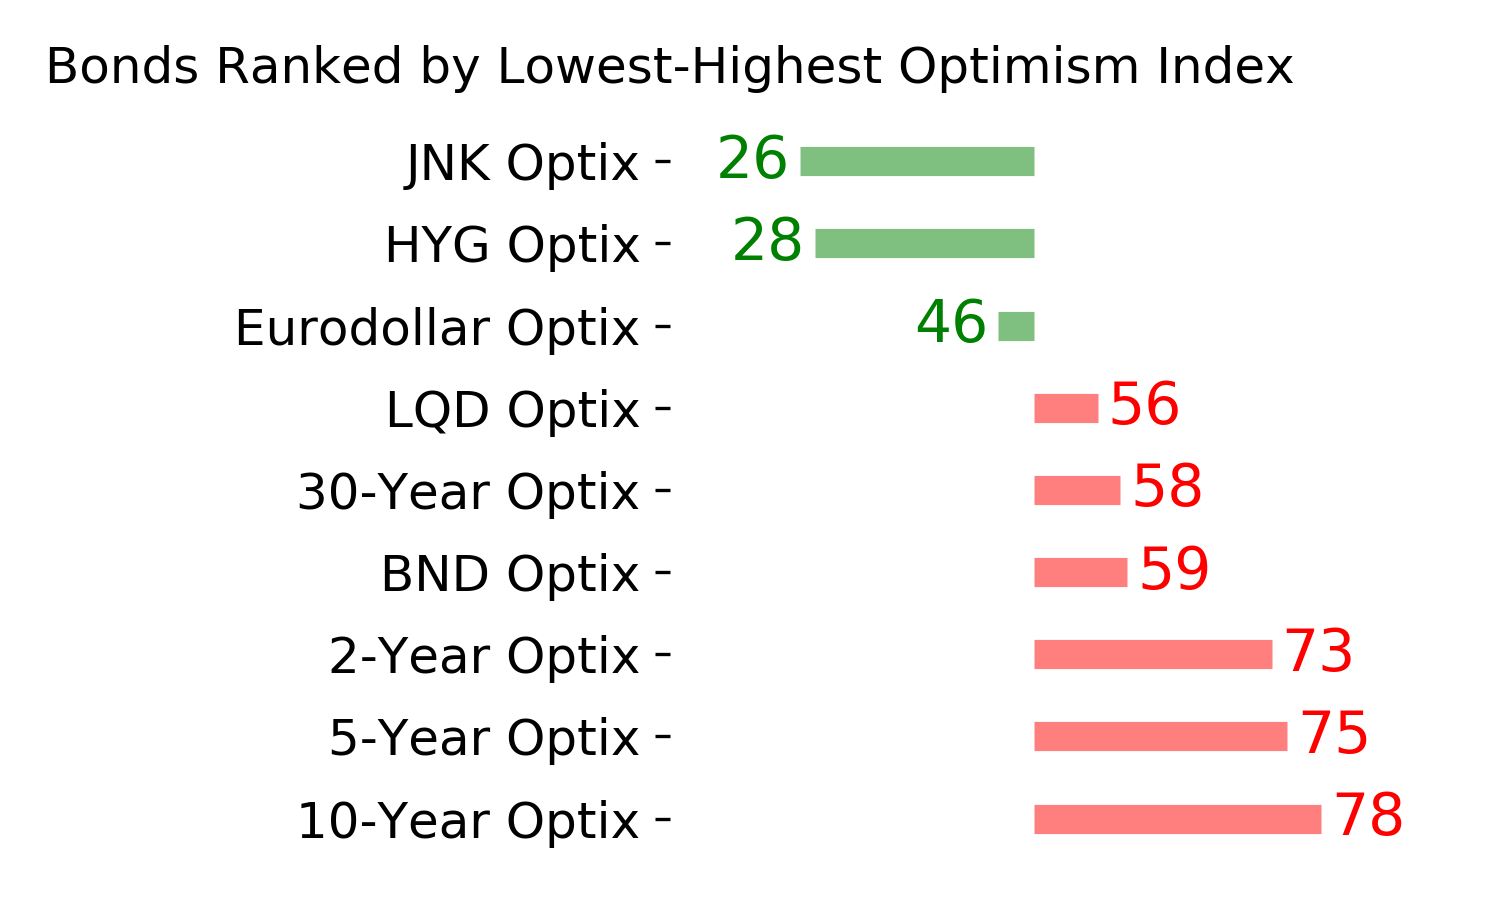
Various parts of the market got hit in March, with the lowest Bond Optimism Index we usually see during healthy environments. After a shaky couple of weeks, the broad bond market has modestly recovered. Not a big edge here either way. GOLD: Hold
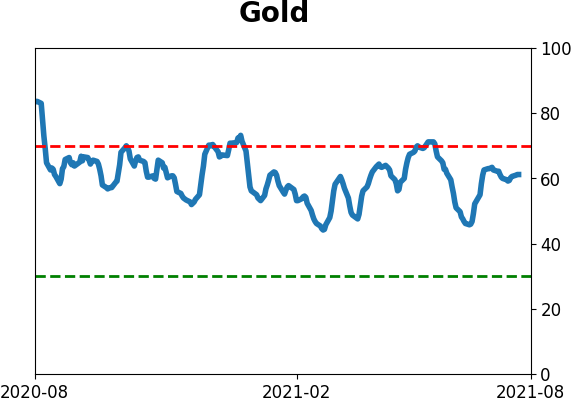
Gold and miners have done very well, recovering above long-term trend lines. The issue is that both have tended to perform poorly after similar situations - will have to wait and see how it plays out.
|
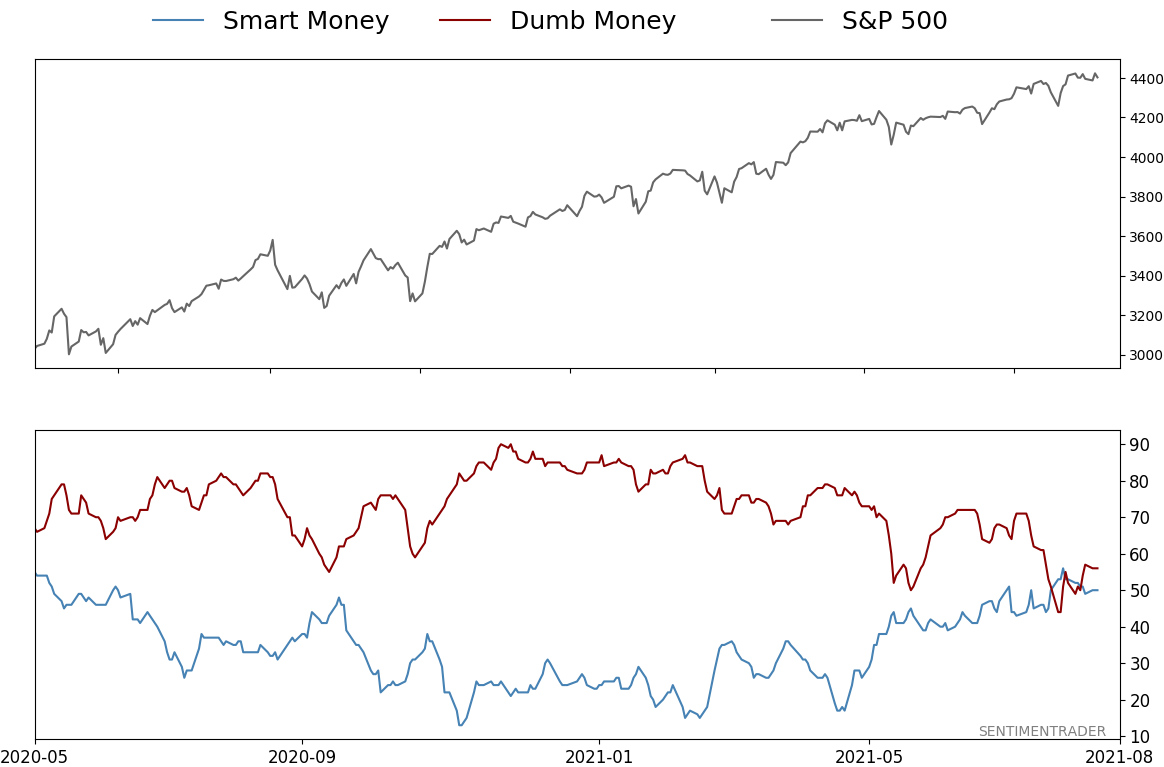
Smart / Dumb Money Confidence
|
Smart Money Confidence: 50%
Dumb Money Confidence: 56%
|
|
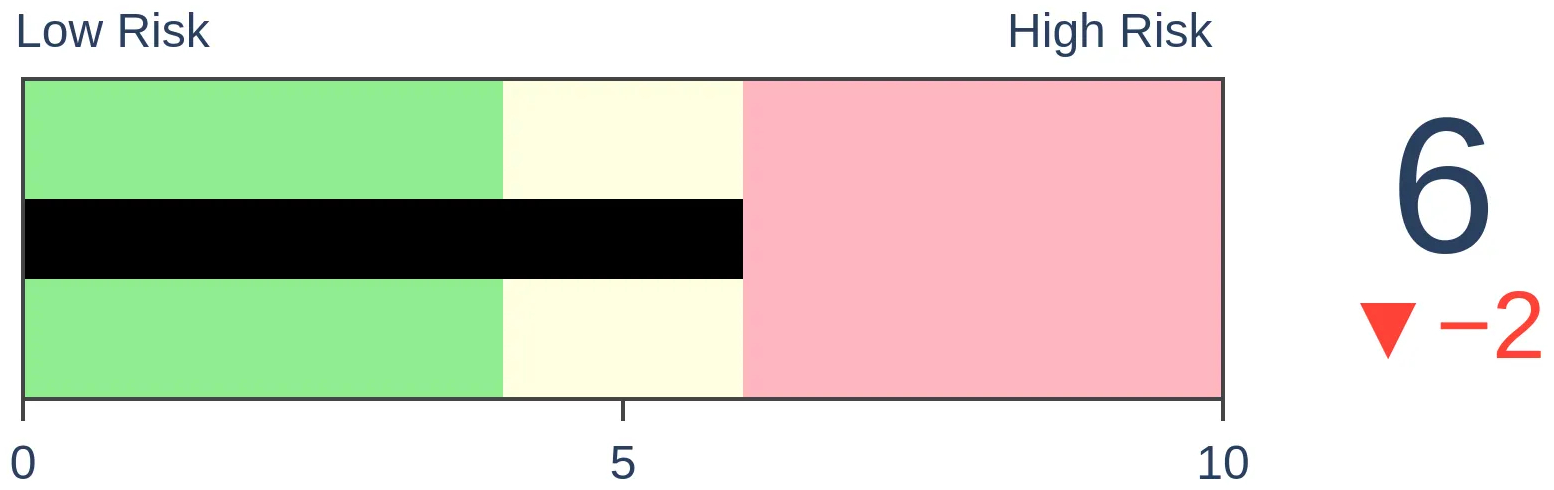
Risk Levels
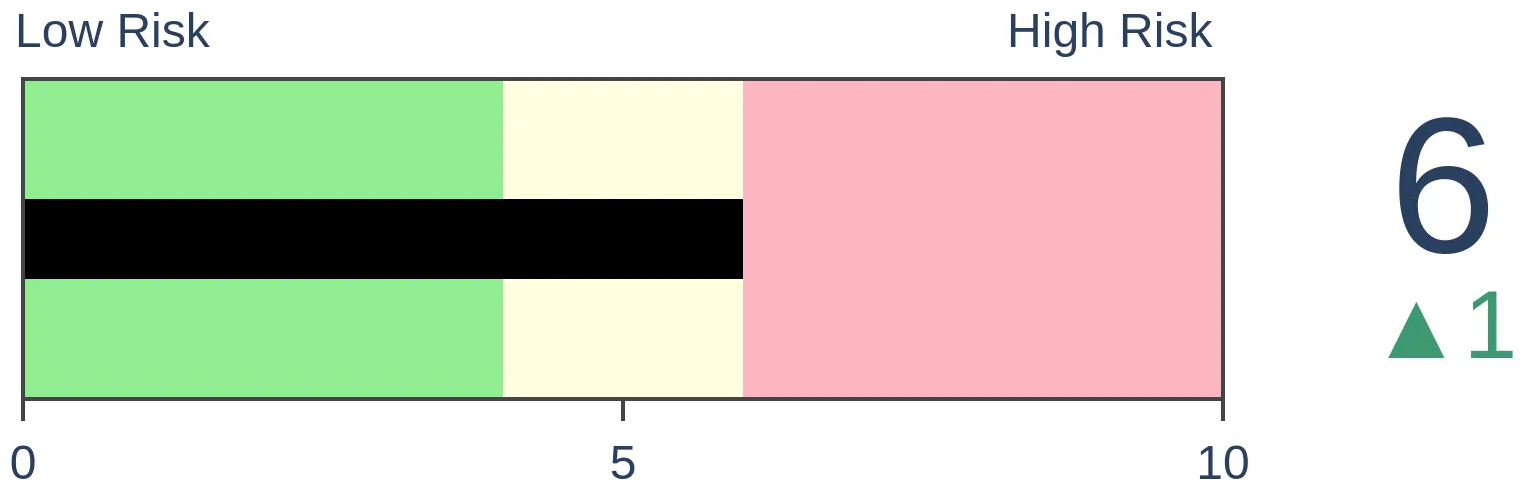
Stocks Short-Term
|
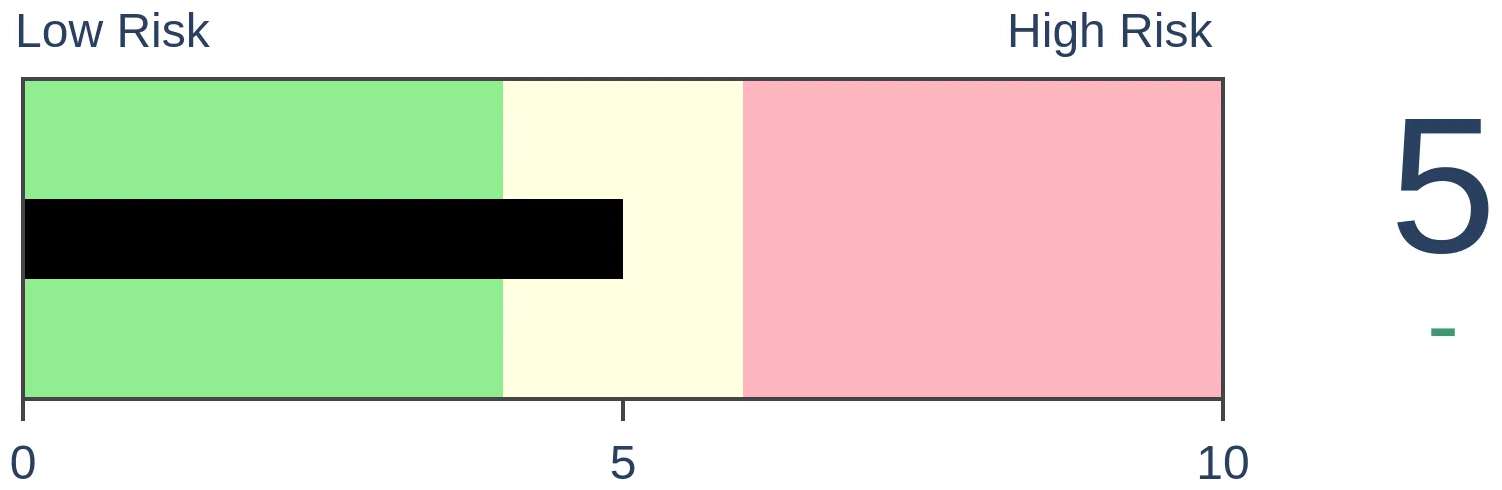
Stocks Medium-Term

|
|
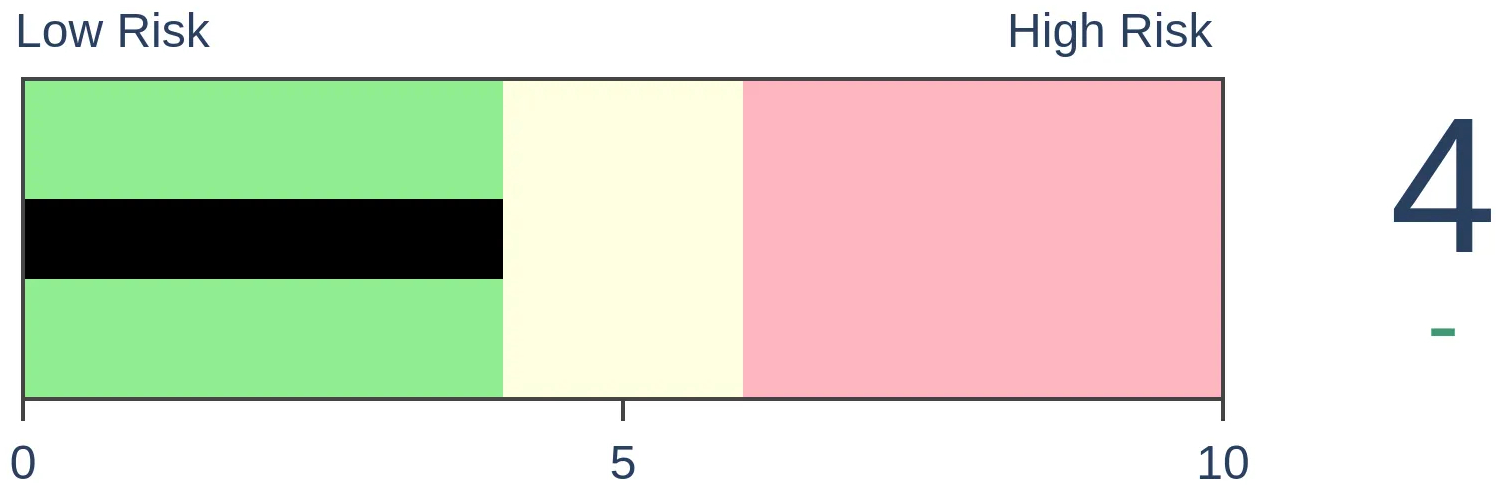
Bonds
|
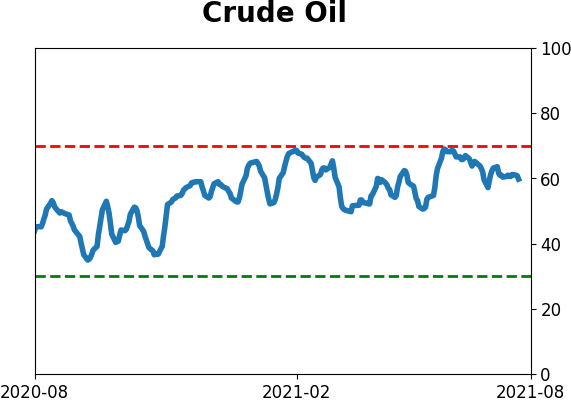
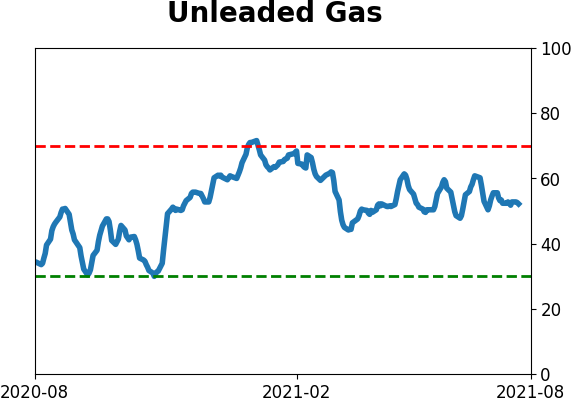
Crude Oil

|
|
Gold
|
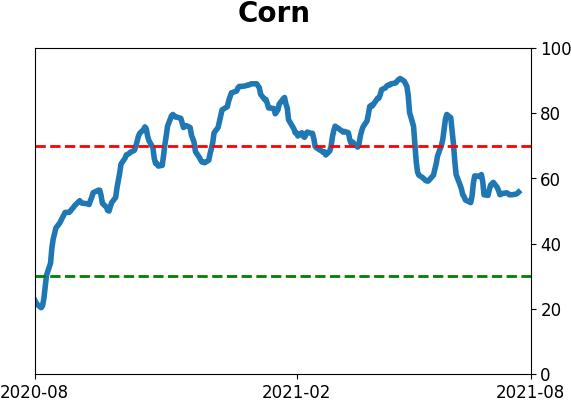
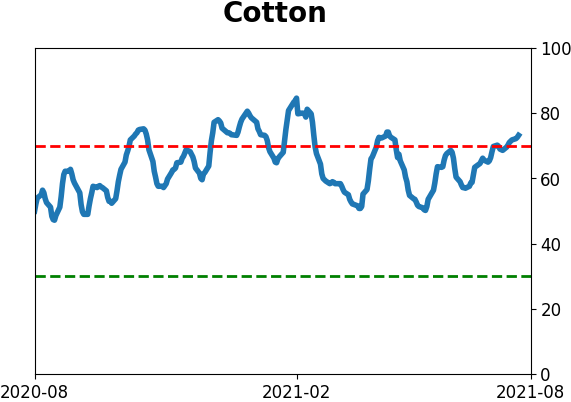
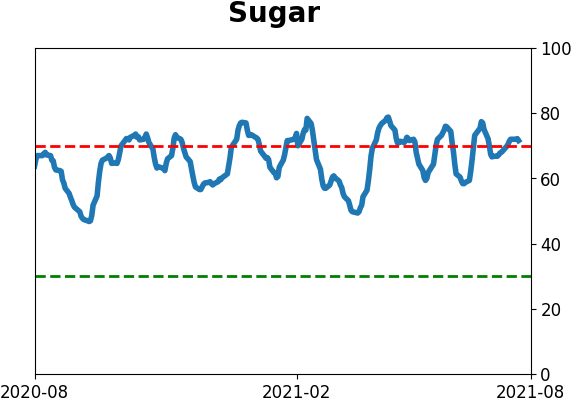
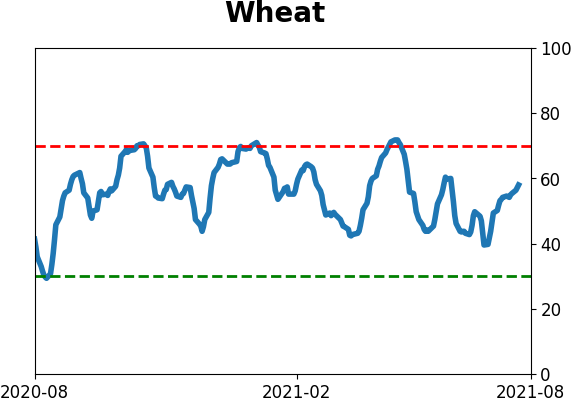
Agriculture
|
|
Research
By Jason Goepfert
BOTTOM LINE
The percentage of gold mining stocks trading above their 50-day moving averages hit a low level and is curling up. That has been a decent sign for forward returns but longer-term breadth measures are still showing weak breadth in the sector.
FORECAST / TIMEFRAME
None
|
Gold miners have been struggling to hold up with a multitude of cross-currents. They've gone almost nowhere for a month and a half, though they finally started to show some life in recent sessions.
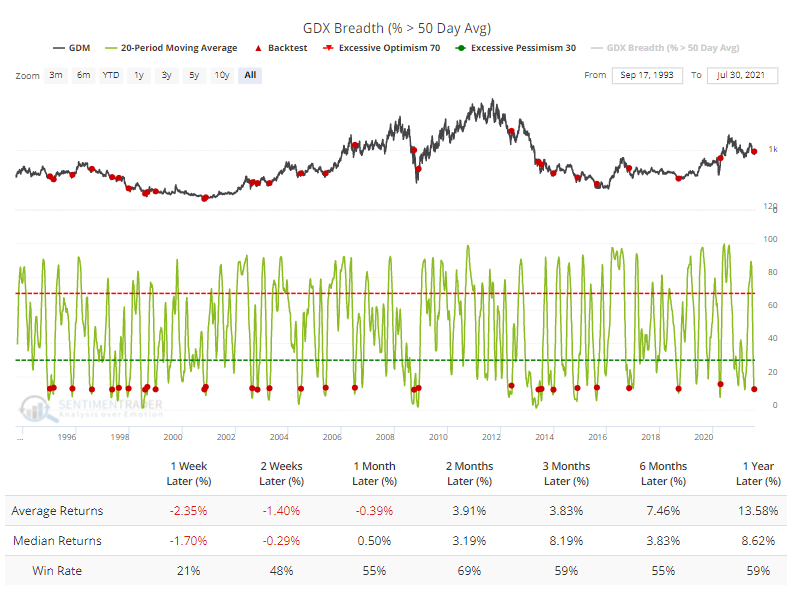
Thanks to their tepid early summer, over the past 20 days, an average of fewer than 12% of gold miners were trading above their 50-day moving average. That is now starting to curl higher.
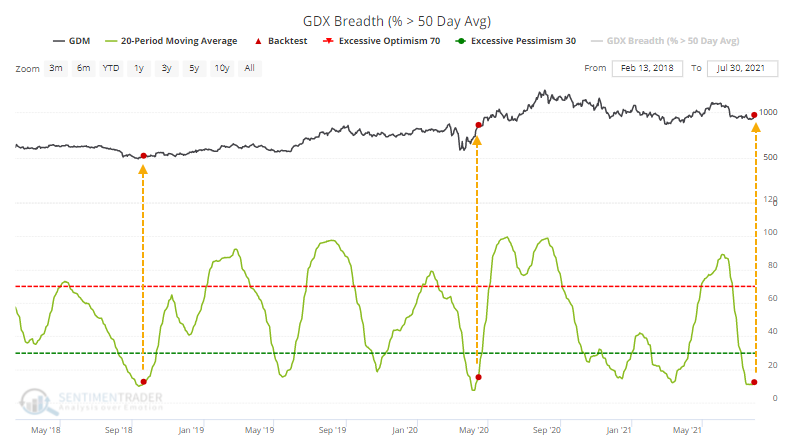
The last two times this triggered in the past few years, it preceded sustained rallies in the miners. Even lesser extremes led to further price gains.
HISTORY SUGGESTS WATCHING THE SHORT-TERM
The Backtest Engine shows that miners often fell back in the very short-term before recovering over the next couple of months (click the Backtest Engine link to load this test). These are times when the 20-day average of medium-term breadth was below 12% then crossed above.
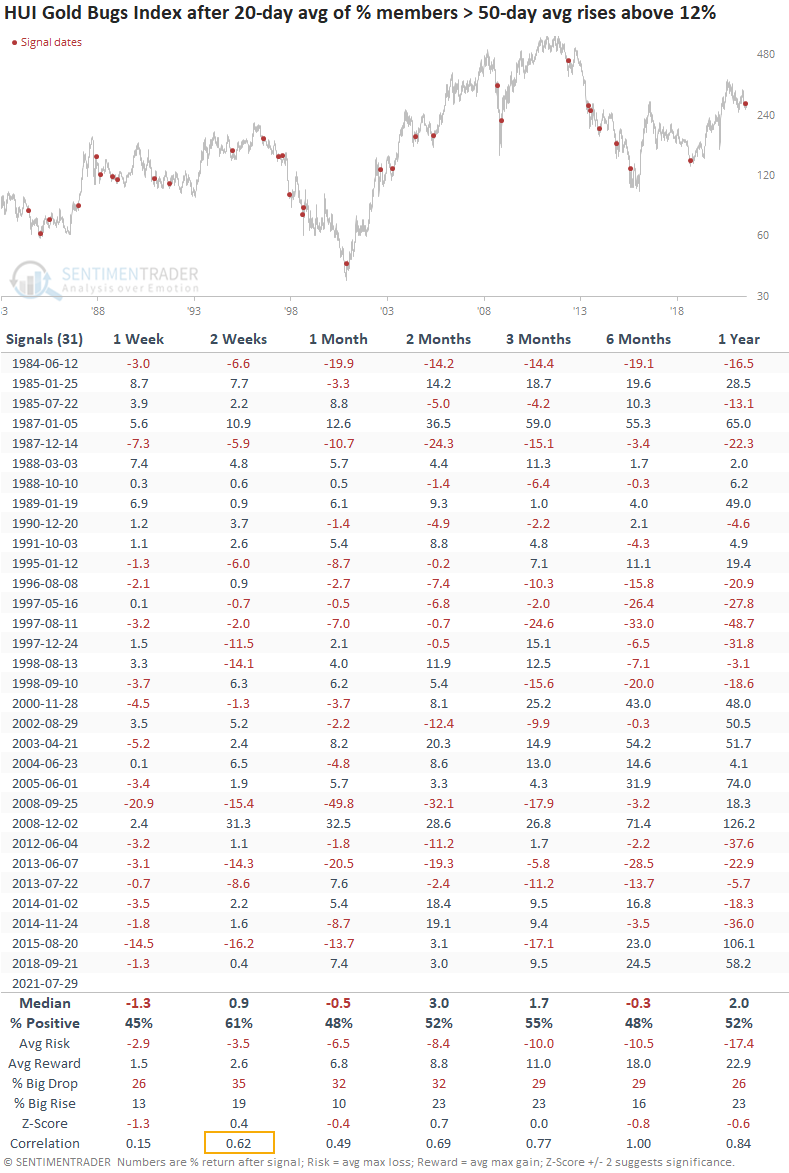
Going back further, there was a high correlation between returns over the next two weeks and those over the next six months. The "correlation" row at the bottom of the table shows this relationship. This suggests that if buyers are interested enough to continue the nascent recovery from oversold conditions, then there is a decent probability that they will continue to do so in the months ahead.
SOME LONGER-TERM WORRIES
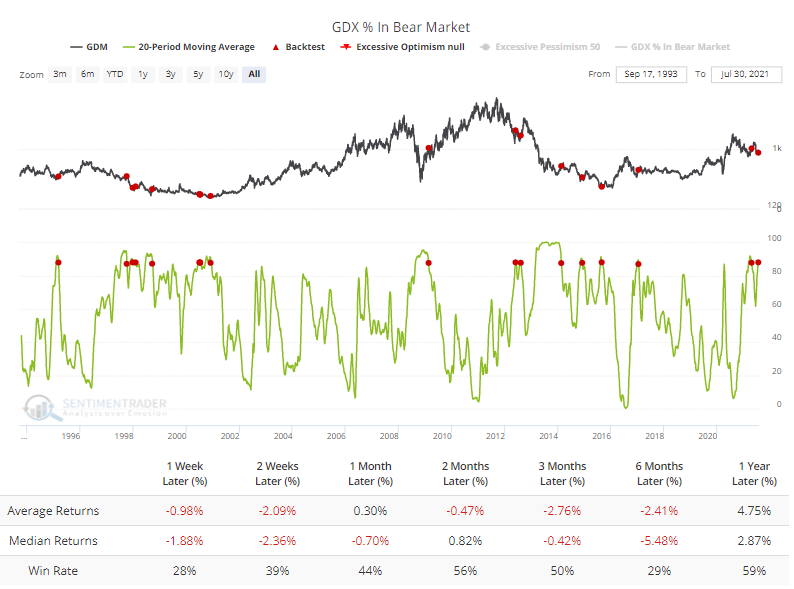
Long-term, there are worries. The percentage of miners in a bear market, more than 20% off their 52-week highs, is rolling over from a very high level. The Backtest Engine shows weak short-term returns again, and these had more of a tendency to persist.
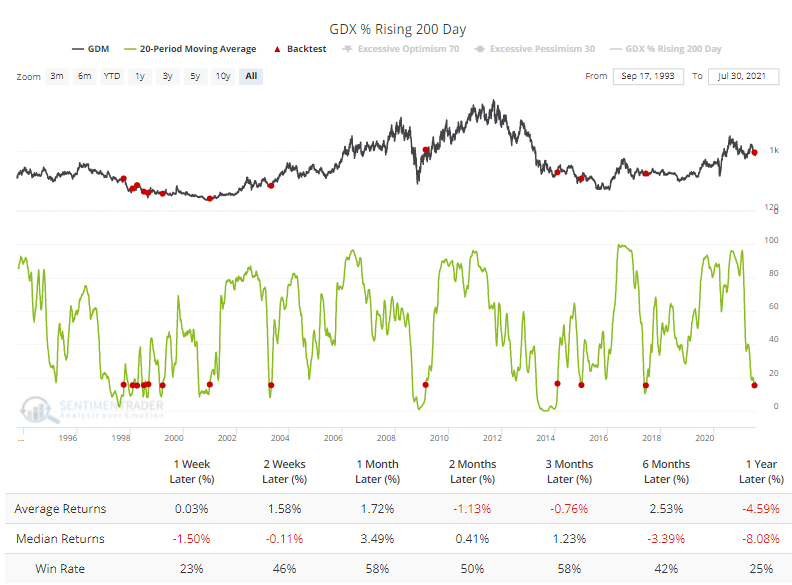
Fewer than 15% of gold miners had a rising 200-day moving average, which is starting to curl higher. The Backtest Engine shows us that once again, short-term returns were weak.
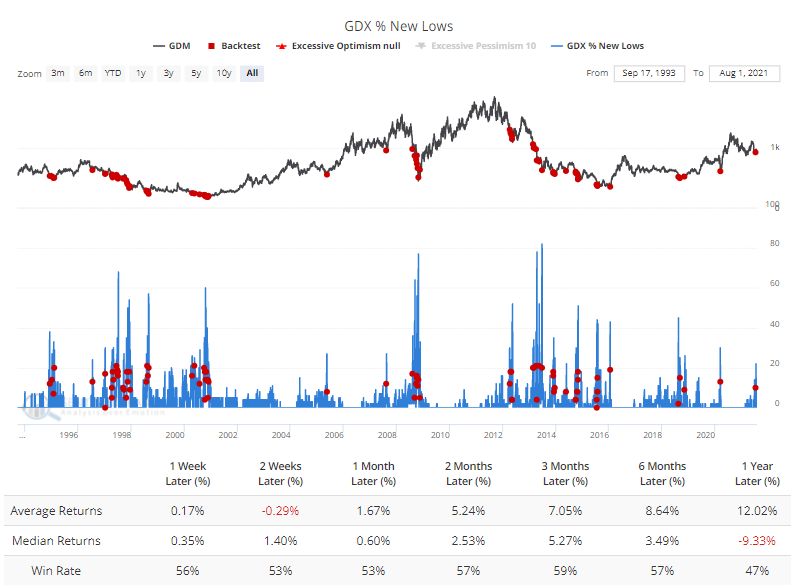
There was a recent spike in 52-week lows, with 22% of gold miners hitting that extreme recently. The Backtest Engine shows decent returns following an ebb in a rise in new lows.
None of these are especially encouraging for gold investors and those who prefer to focus on real companies in the sector instead of a commodity. Breadth among miners has been poor on all time frames, but not so poor that it suggests a high probability of a long-term washout among sellers. The momentum thrust in 2020 has some impressive precedents for long-term gains, but bulls will want to see buyers willing to step in soon.
Active Studies
| Time Frame | Bullish | Bearish | | Short-Term | 0 | 4 | | Medium-Term | 4 | 3 | | Long-Term | 10 | 5 |
|
Indicators at Extremes
Portfolio
| Position | Description | Weight % | Added / Reduced | Date | | Stocks | RSP | 4.1 | Added 4.1% | 2021-05-19 | | Bonds | 23.9% BND, 6.9% SCHP | 30.7 | Reduced 7.1% | 2021-05-19 | | Commodities | GCC | 2.6 | Reduced 2.1%
| 2020-09-04 | | Precious Metals | GDX | 5.6 | Reduced 4.2% | 2021-05-19 | | Special Situations | 4.3% XLE, 2.2% PSCE | 7.6 | Reduced 5.6% | 2021-04-22 | | Cash | | 49.4 | | |
|
Updates (Changes made today are underlined)
Much of our momentum and trend work has remained positive for several months, with some scattered exceptions. Almost all sentiment-related work has shown a poor risk/reward ratio for stocks, especially as speculation drove to record highs in exuberance in February. Much of that has worn off, and most of our models are back toward neutral levels. There isn't much to be excited about here. The same goes for bonds and even gold. Gold has been performing well lately and is back above long-term trend lines. The issue is that it has a poor record of holding onto gains when attempting a long-term trend change like this, so we'll take a wait-and-see approach. RETURN YTD: 9.0% 2020: 8.1%, 2019: 12.6%, 2018: 0.6%, 2017: 3.8%, 2016: 17.1%, 2015: 9.2%, 2014: 14.5%, 2013: 2.2%, 2012: 10.8%, 2011: 16.5%, 2010: 15.3%, 2009: 23.9%, 2008: 16.2%, 2007: 7.8%
|
|
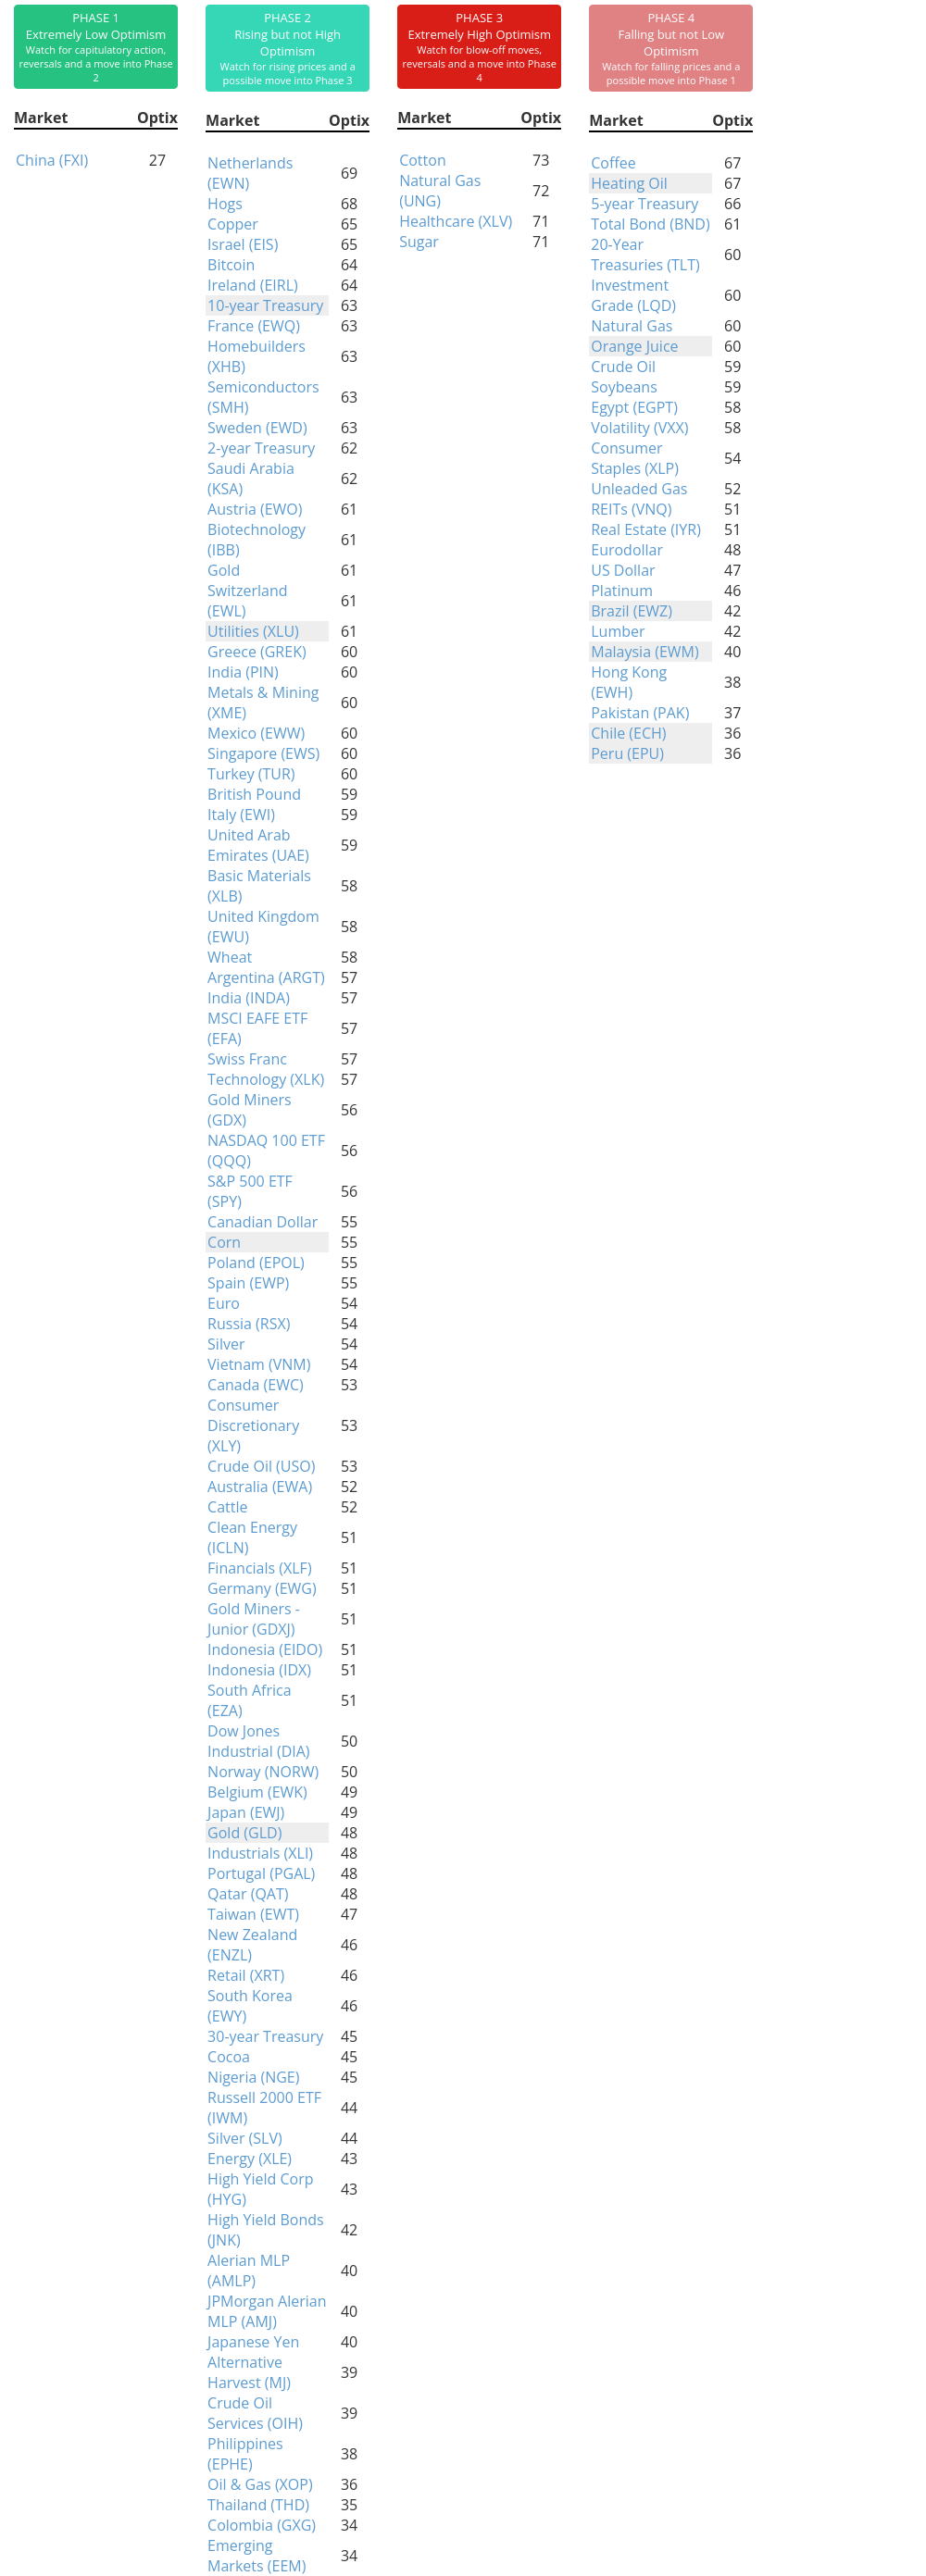
Phase Table
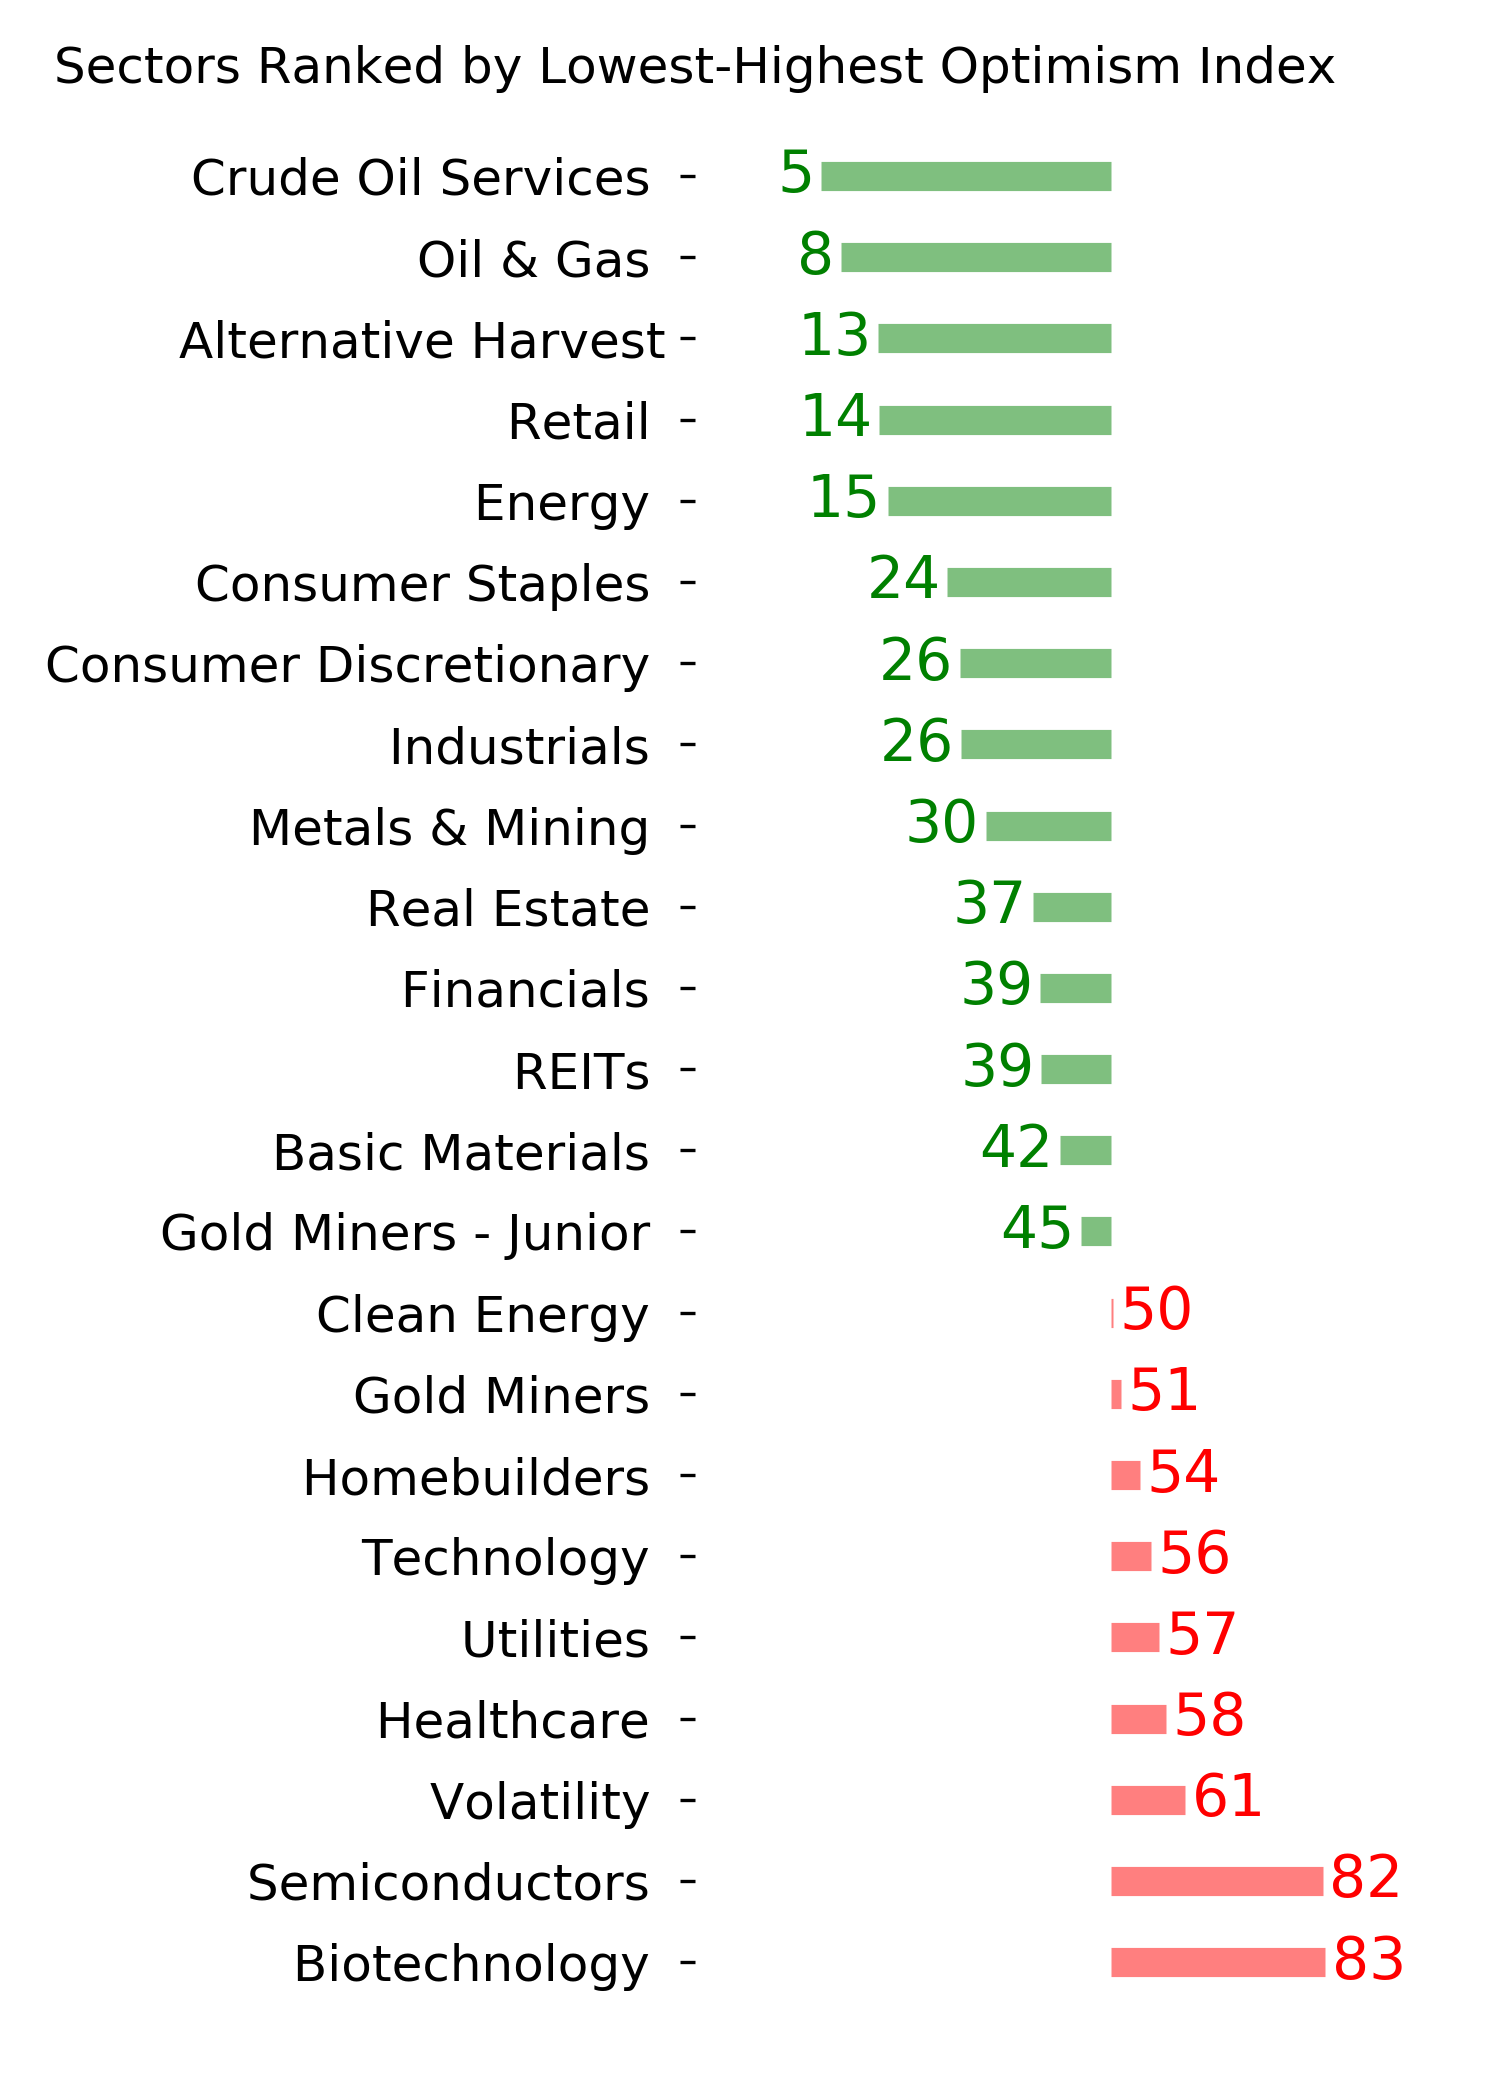
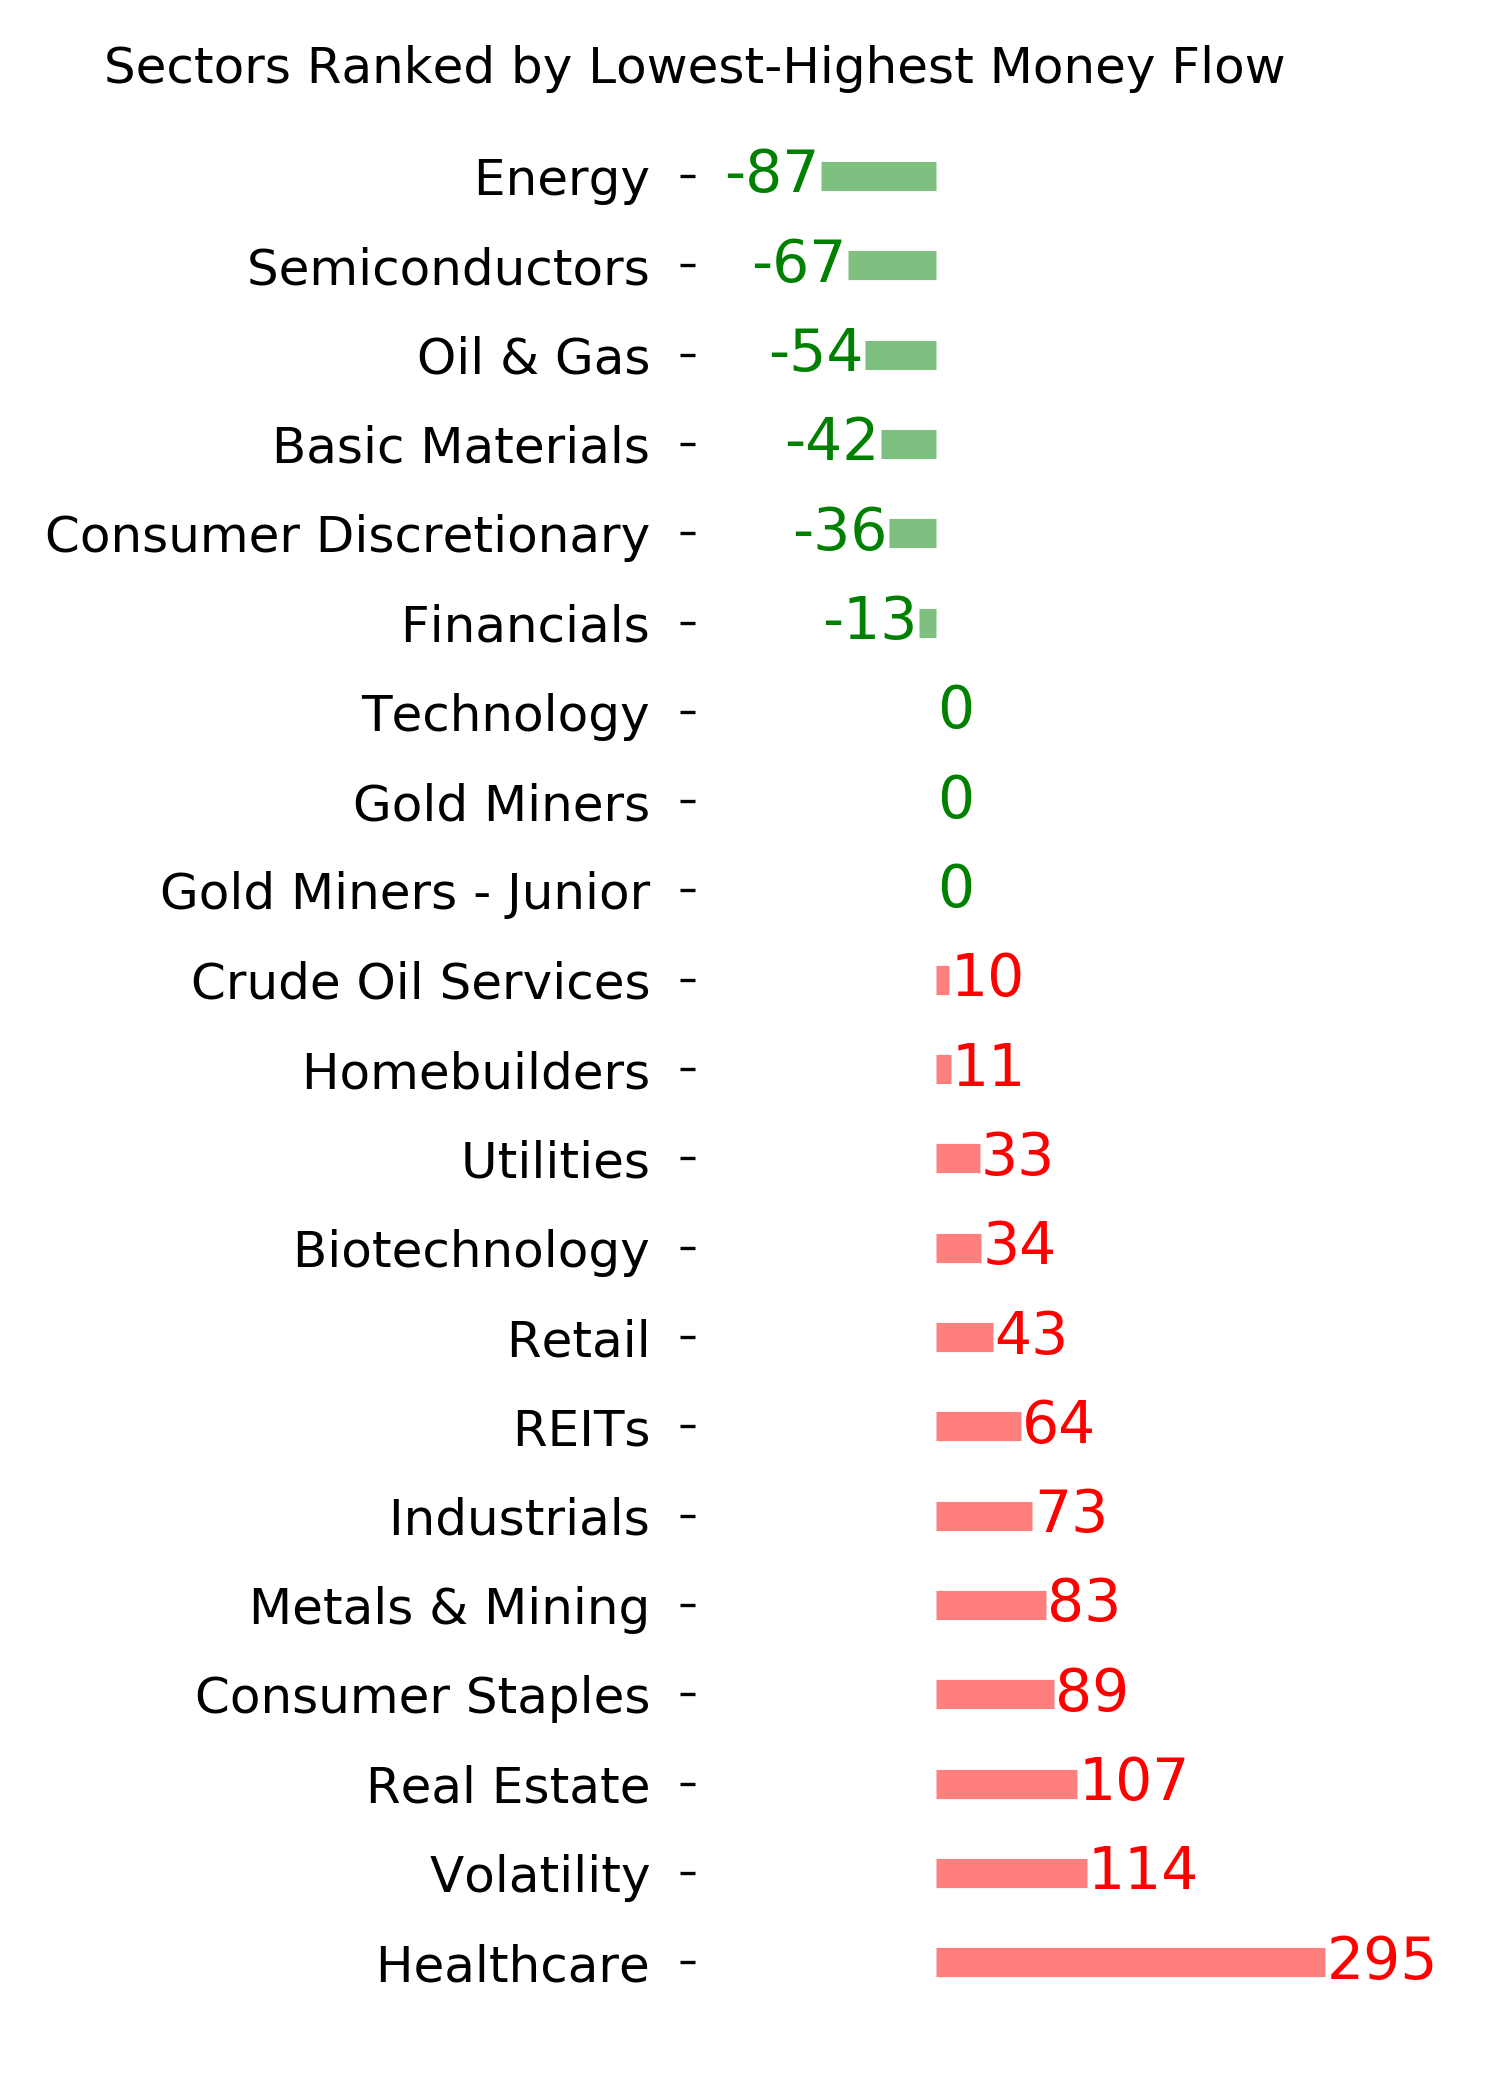
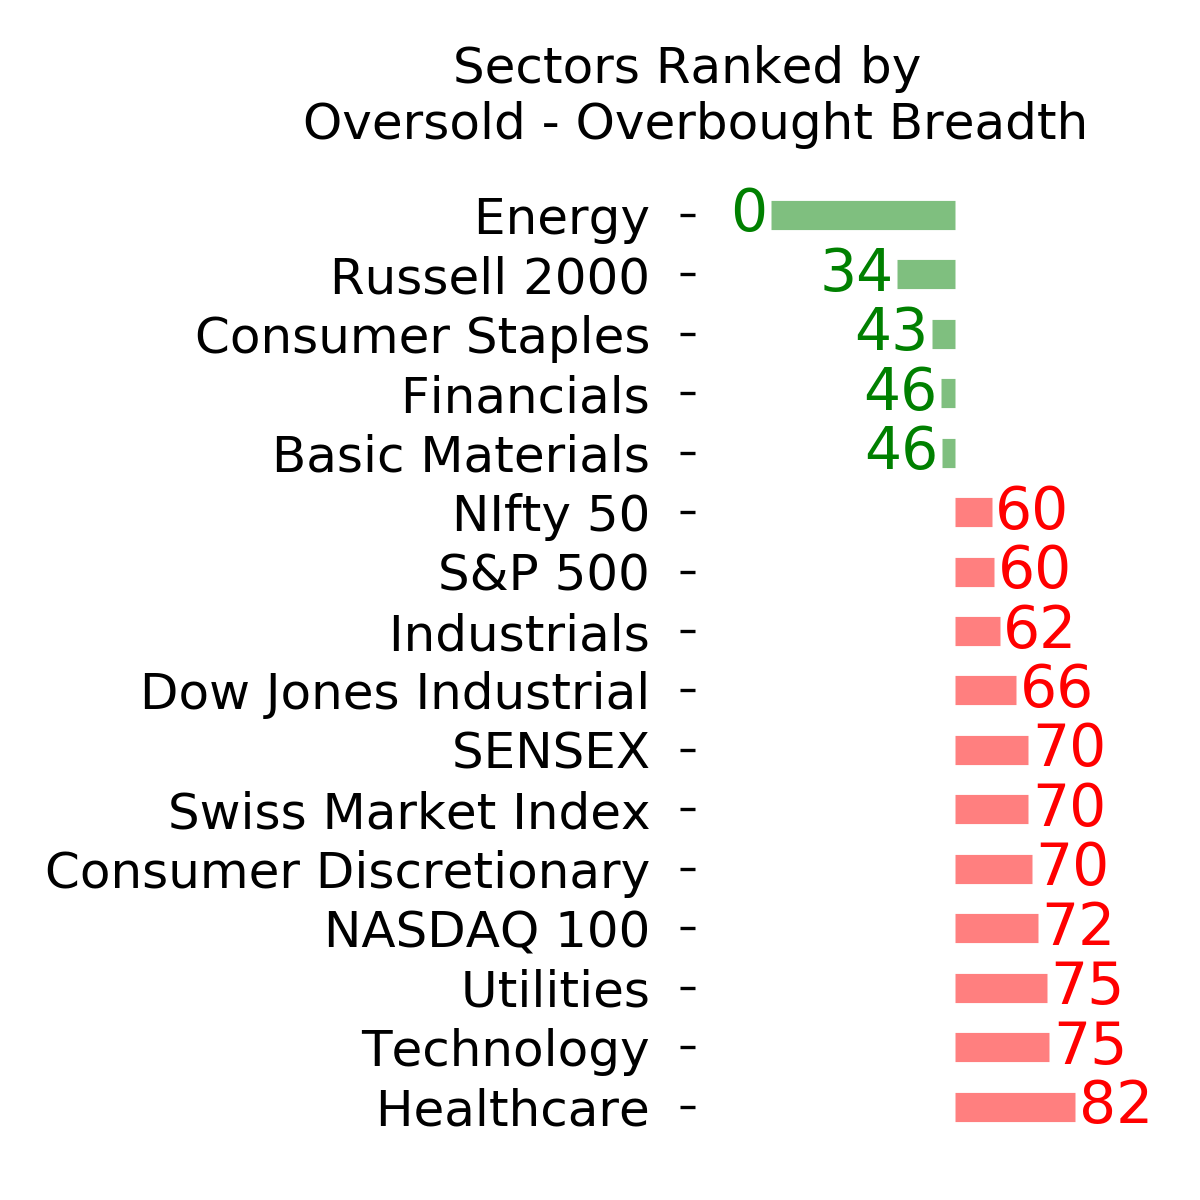
Ranks
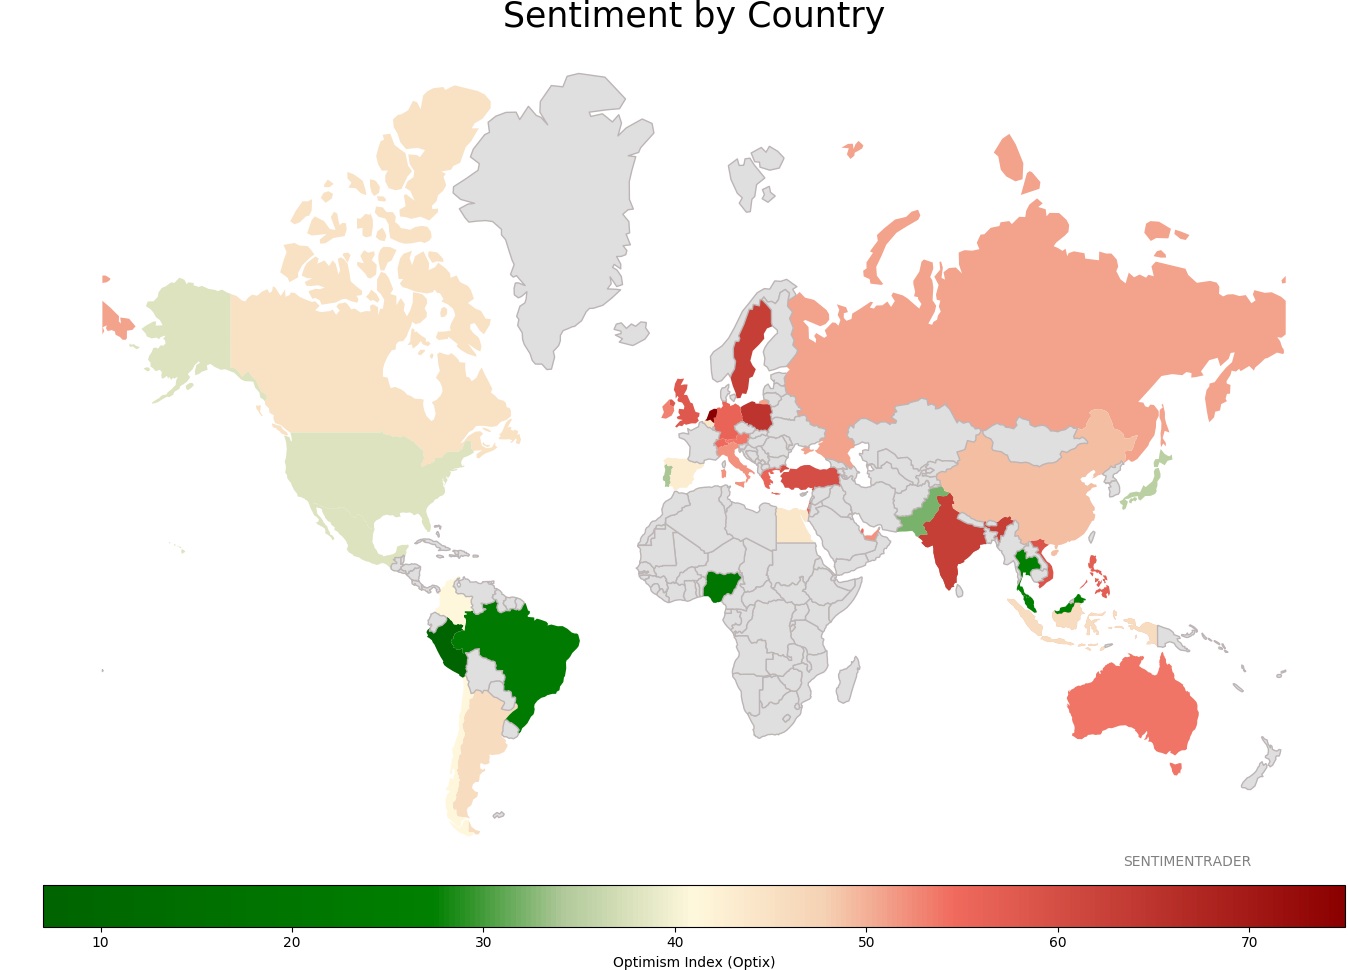
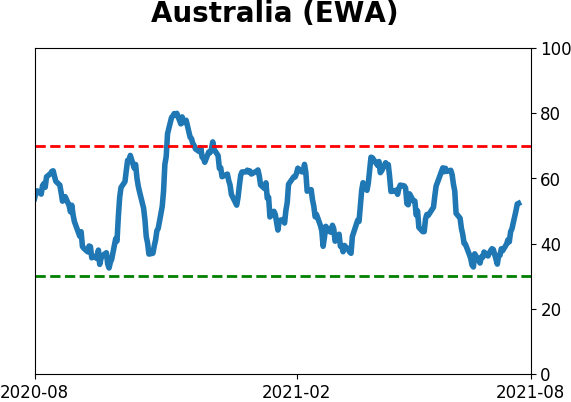
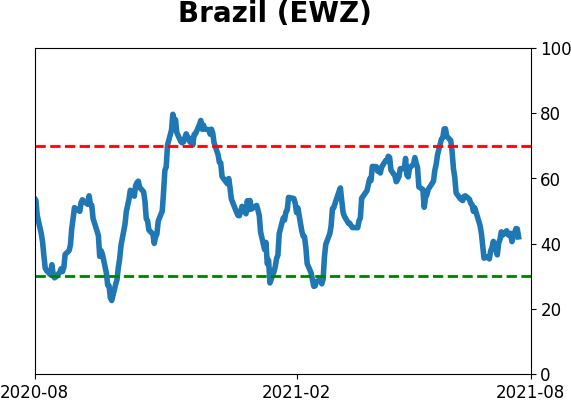
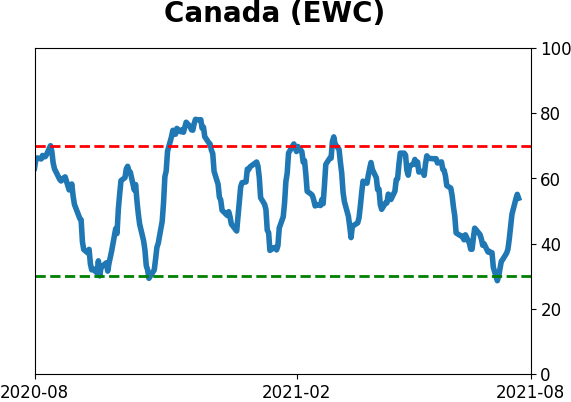
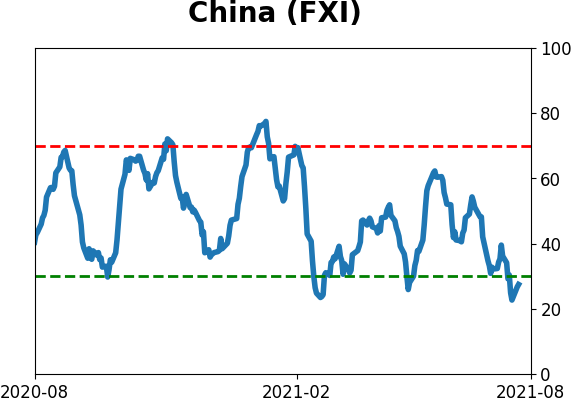
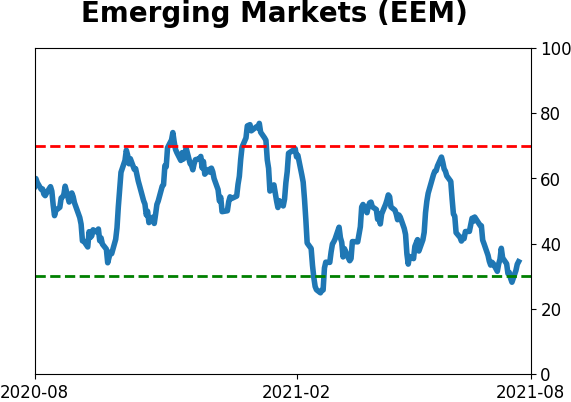
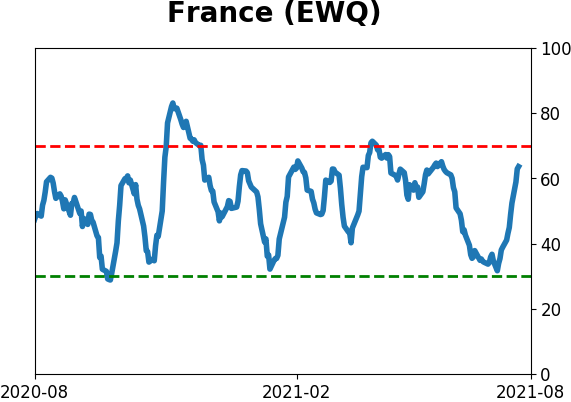
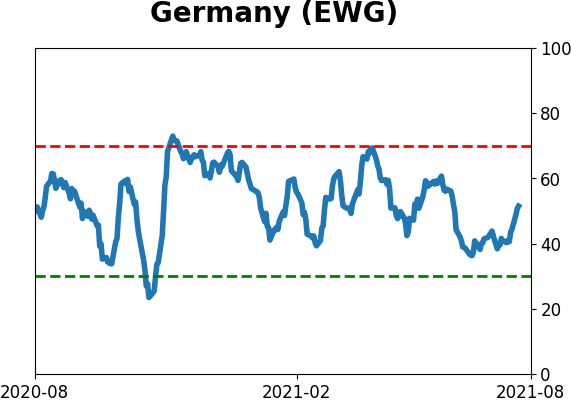
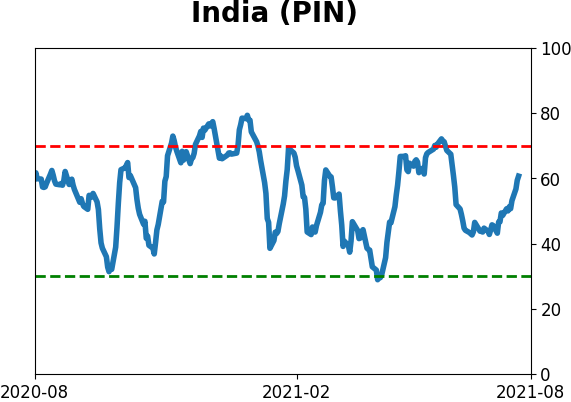
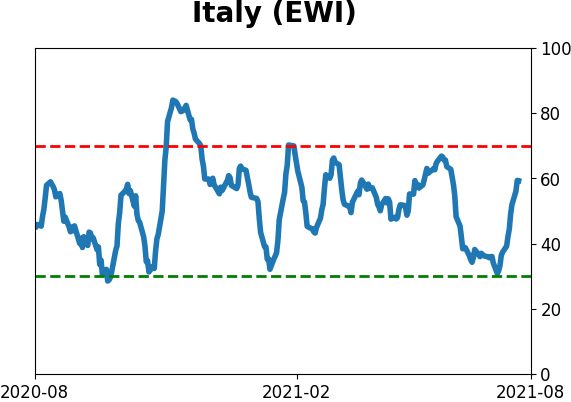
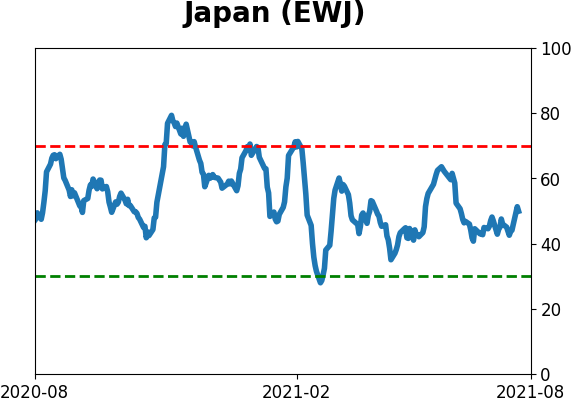
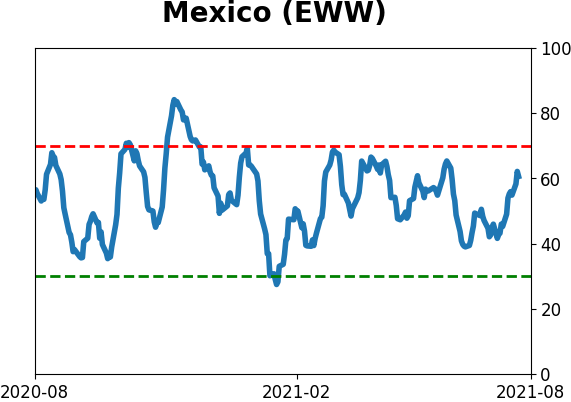
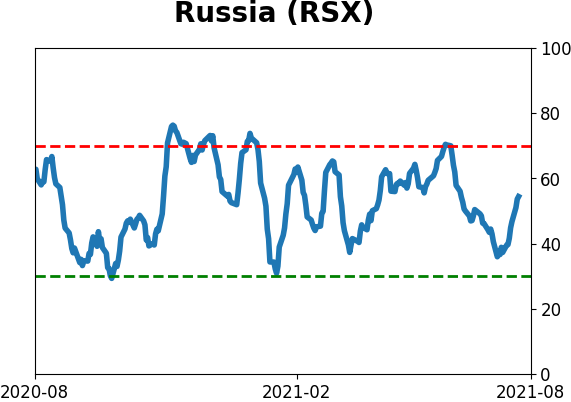
Sentiment Around The World
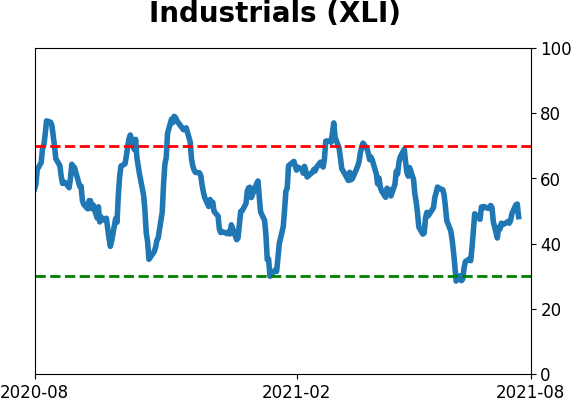
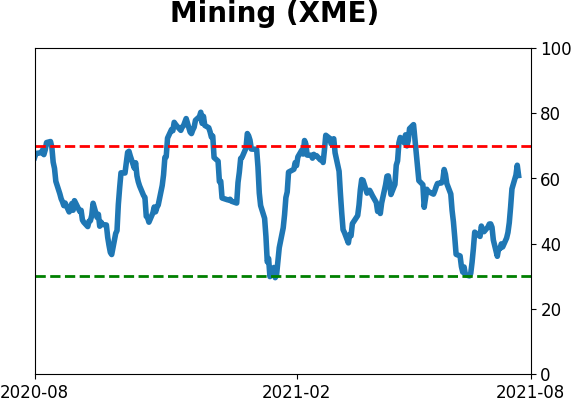
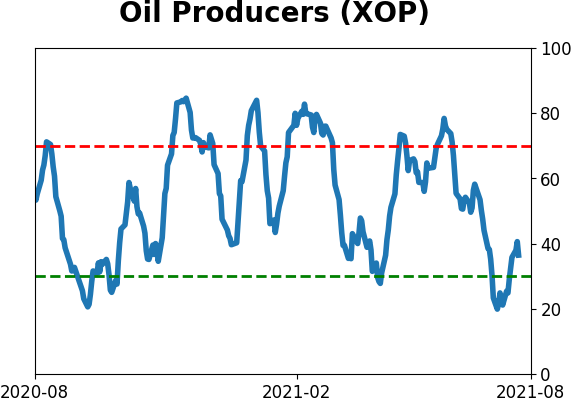
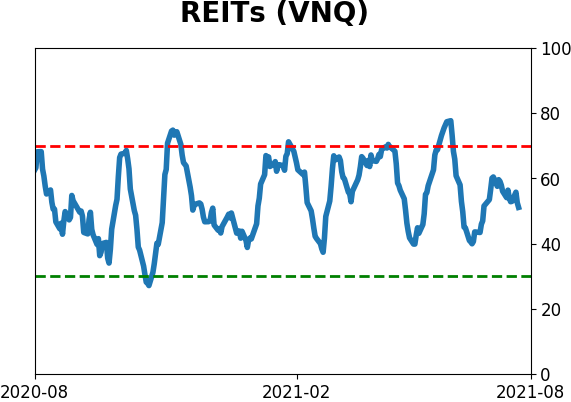
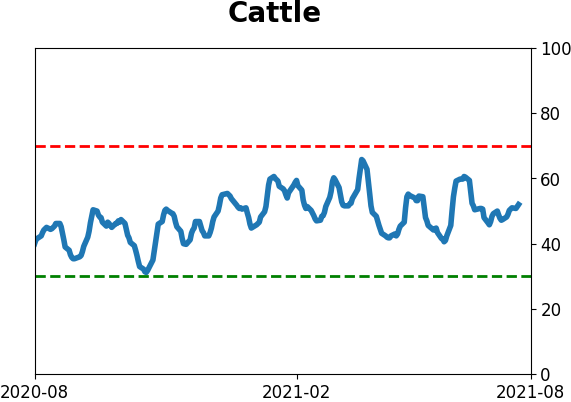
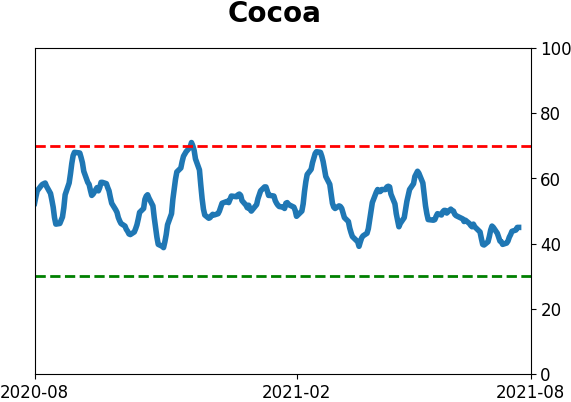
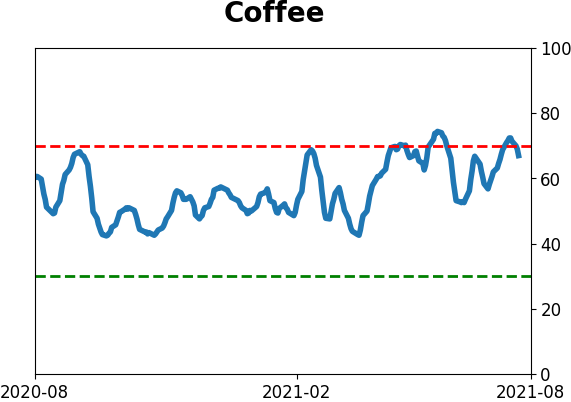
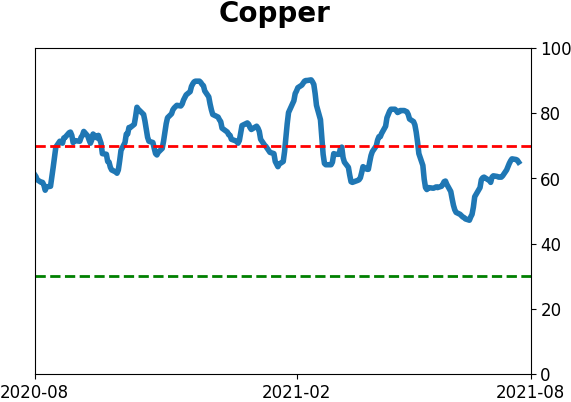
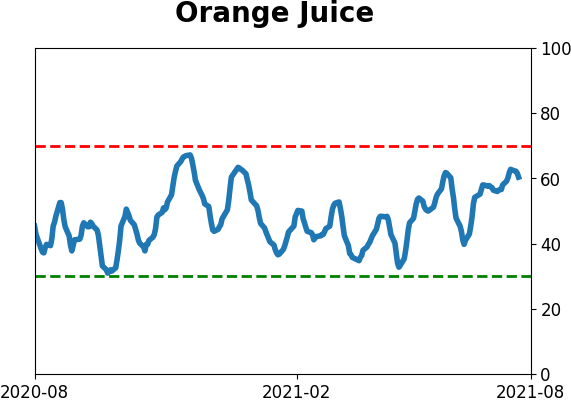
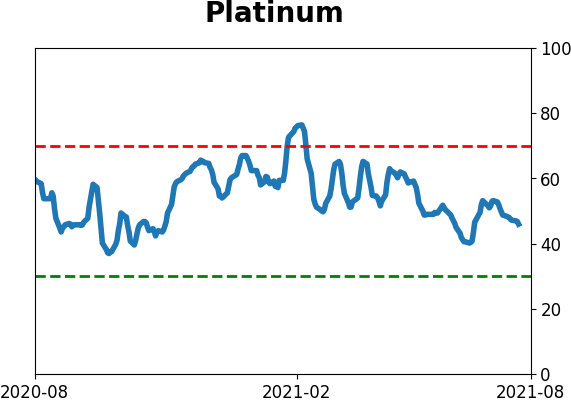
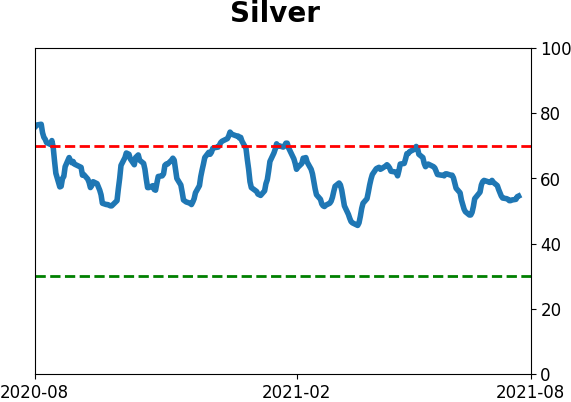
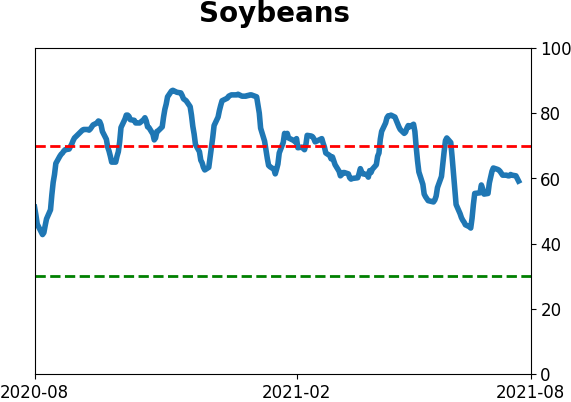
Optimism Index Thumbnails
|
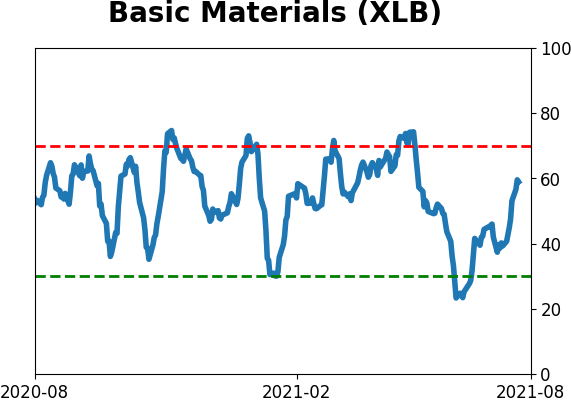
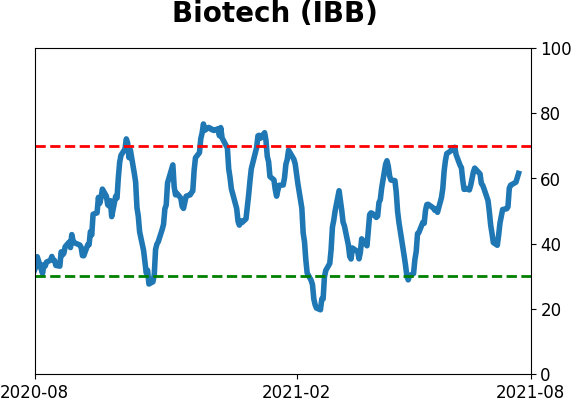
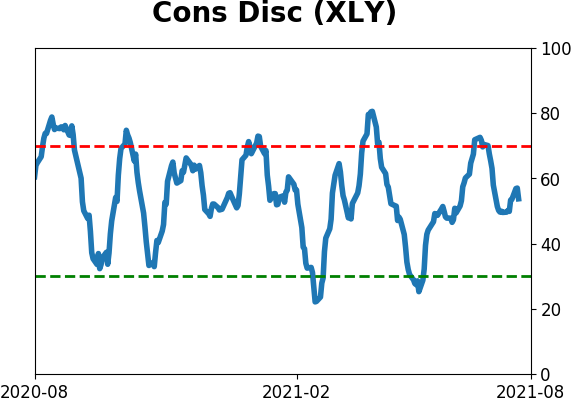
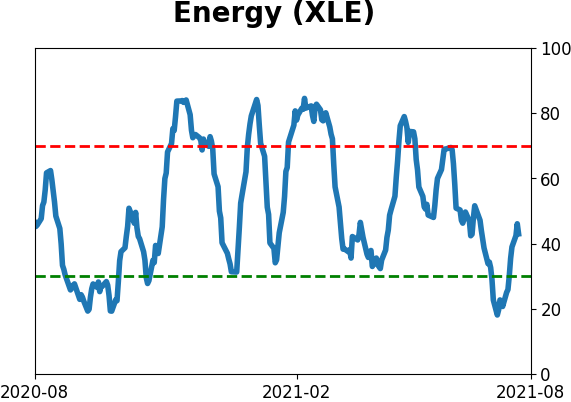
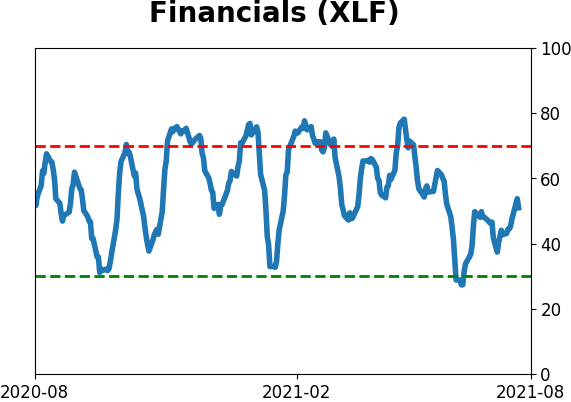
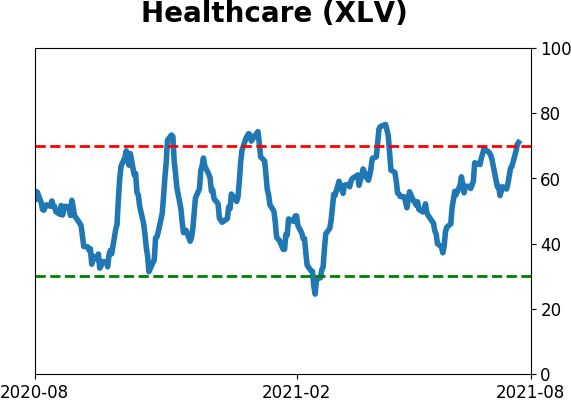
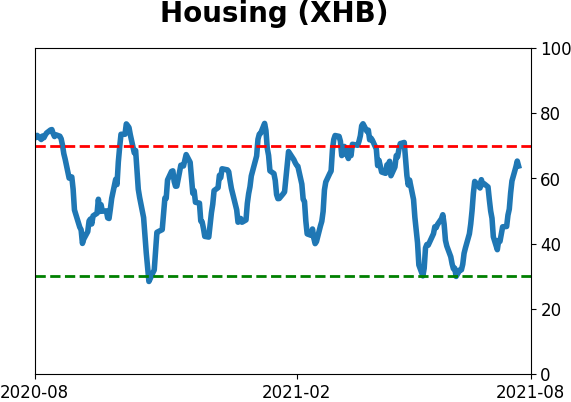
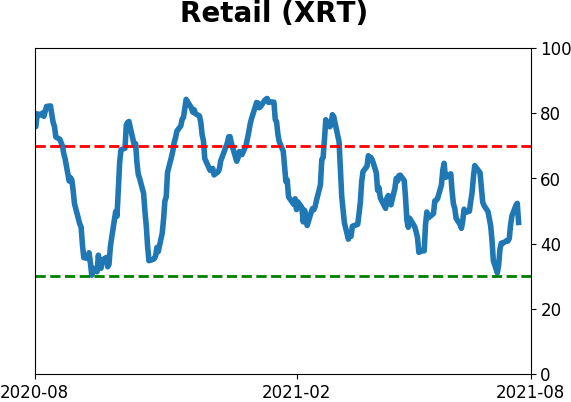
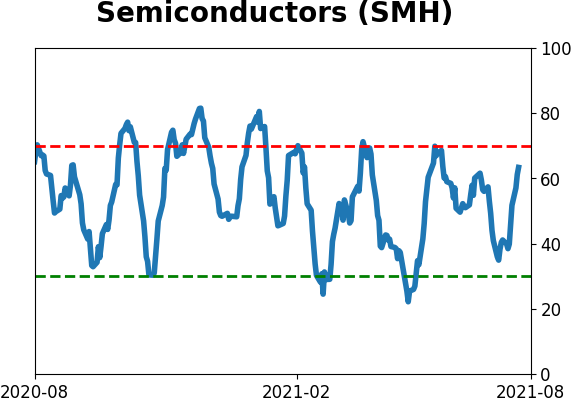
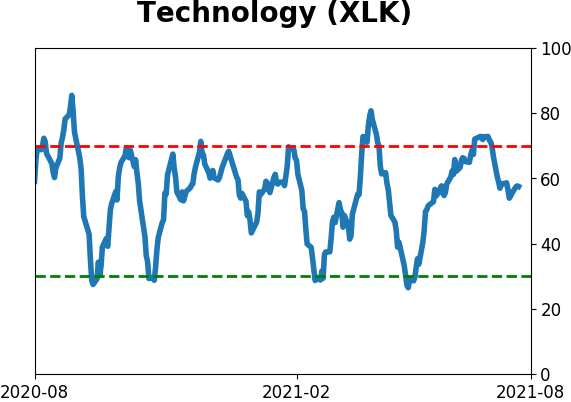
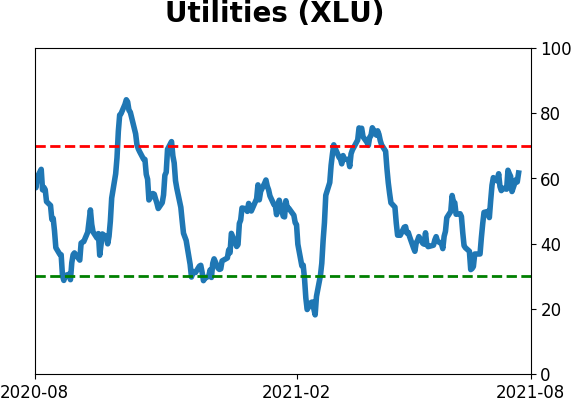
Sector ETF's - 10-Day Moving Average
|
|
|
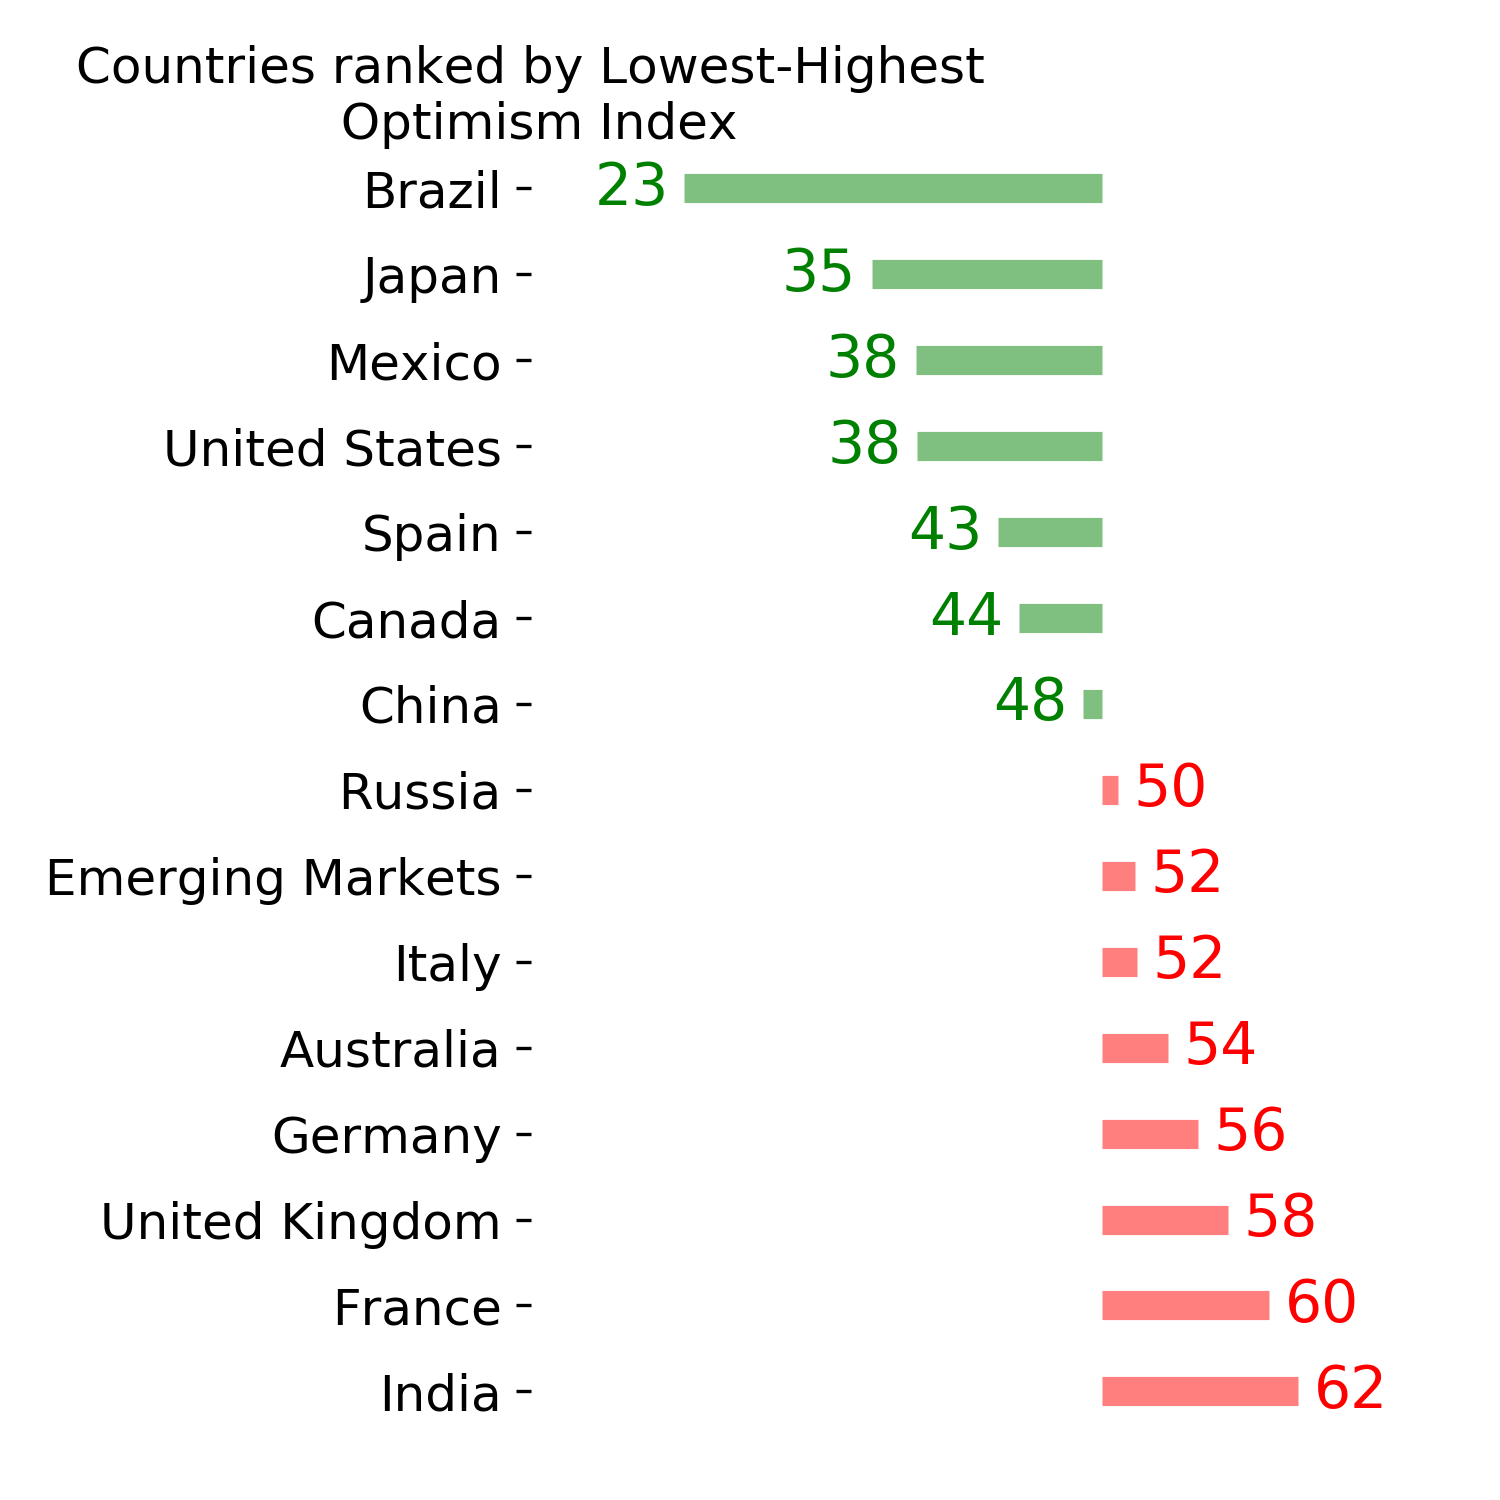
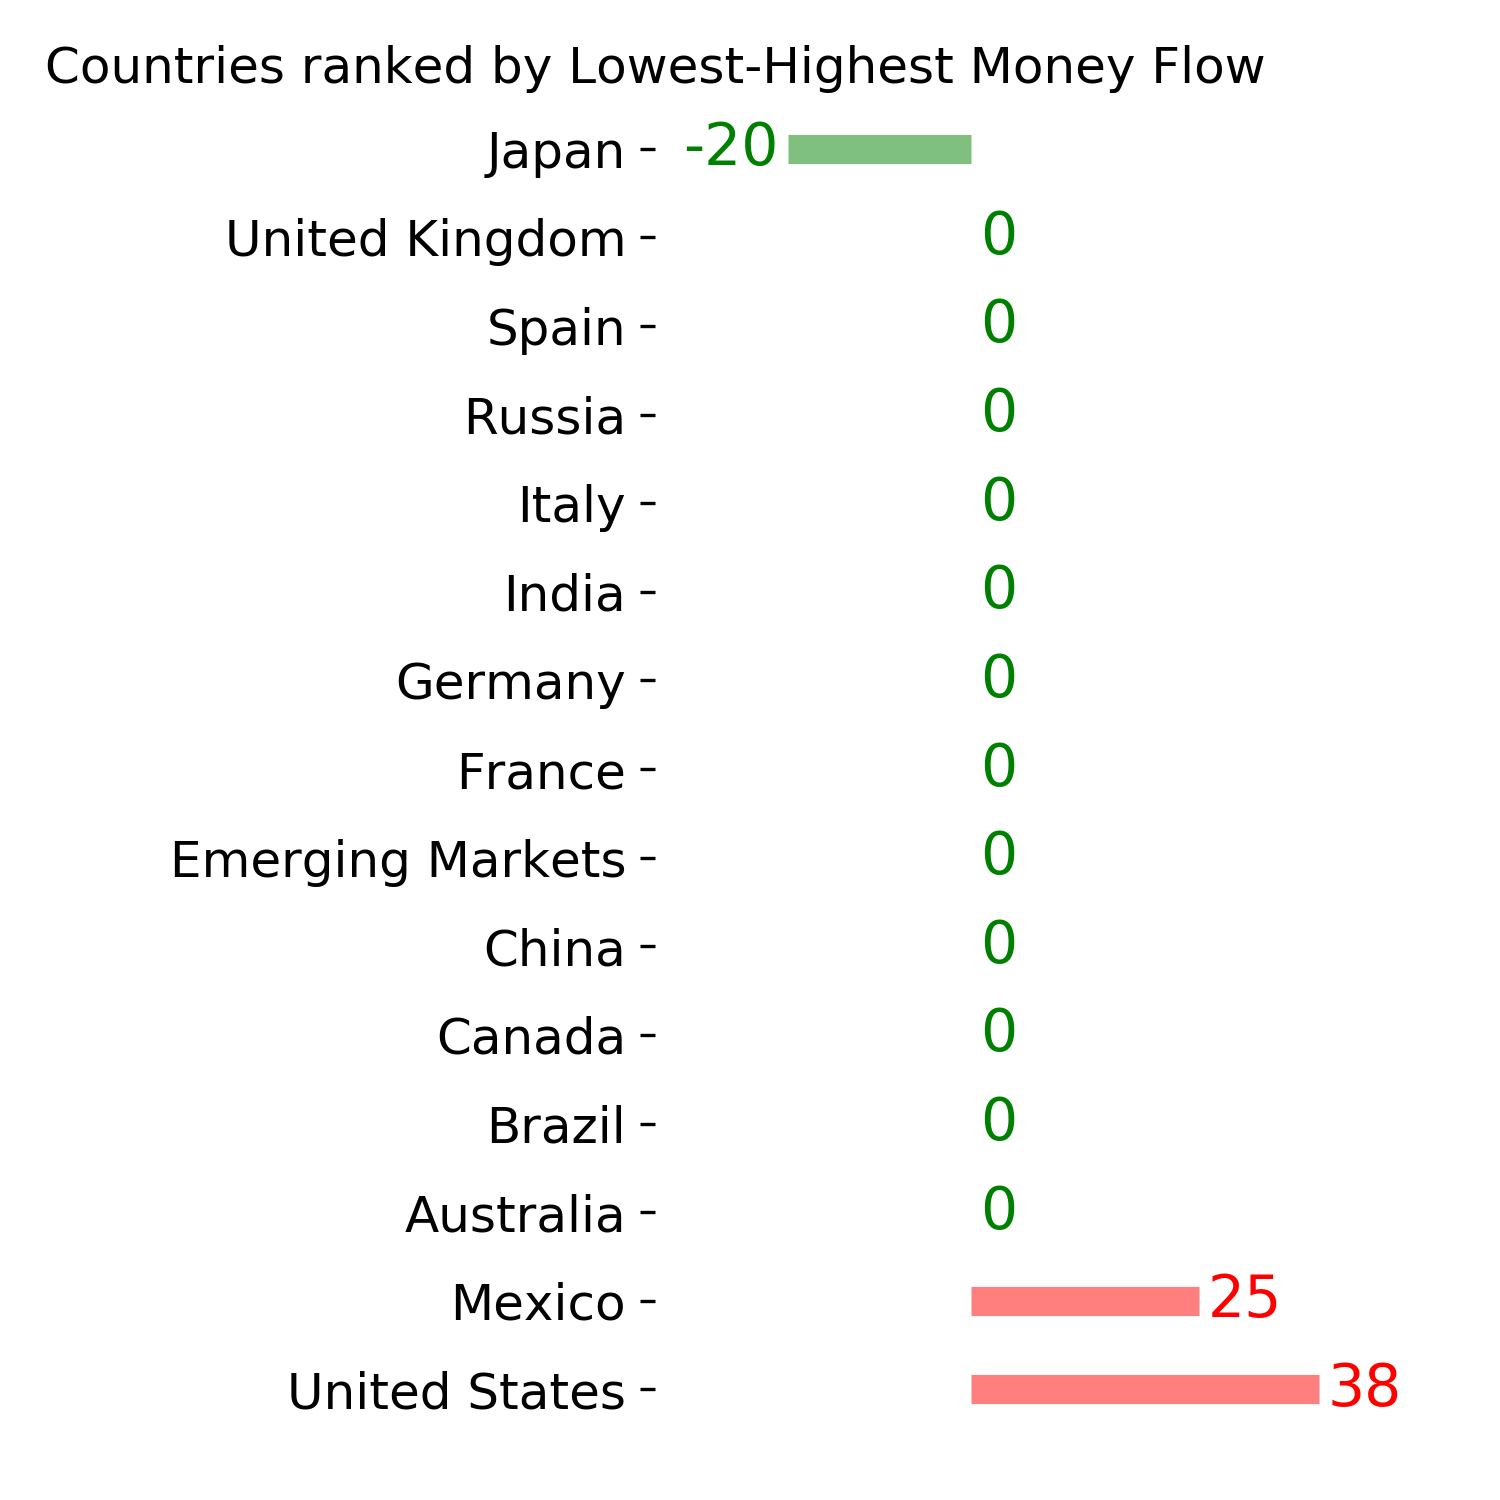
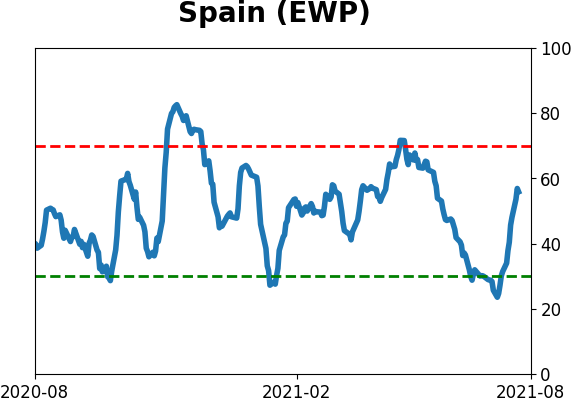
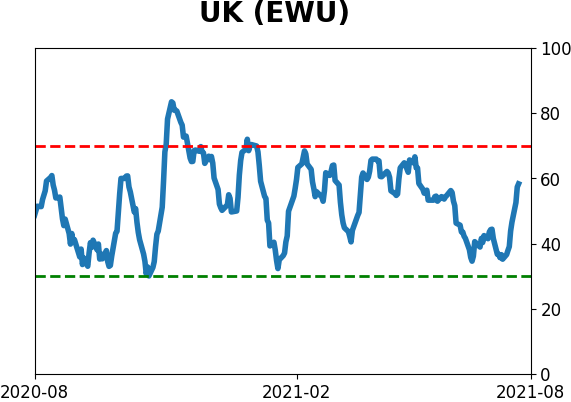
Country ETF's - 10-Day Moving Average
|
|
|
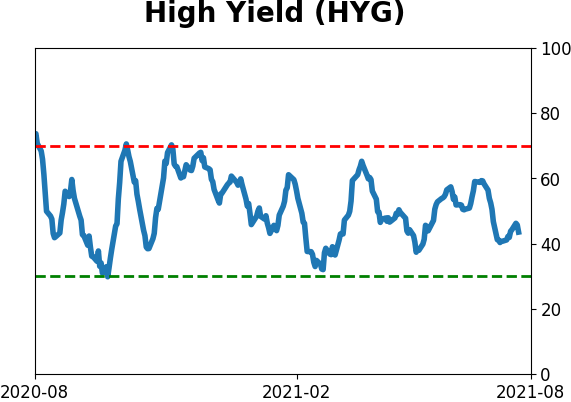
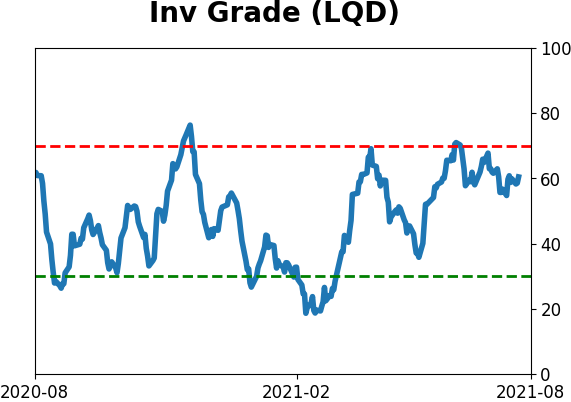
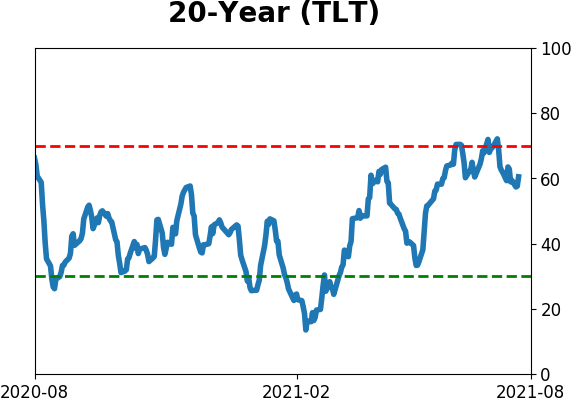
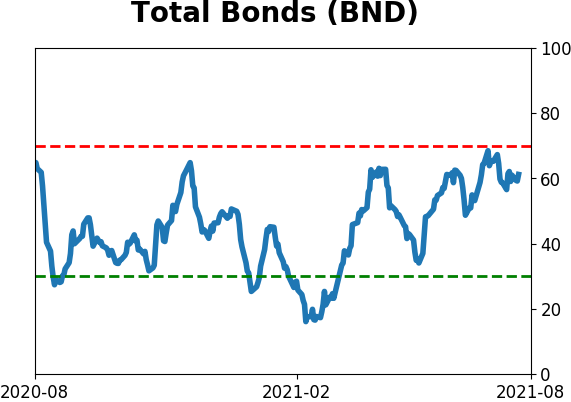
Bond ETF's - 10-Day Moving Average
|
|
|
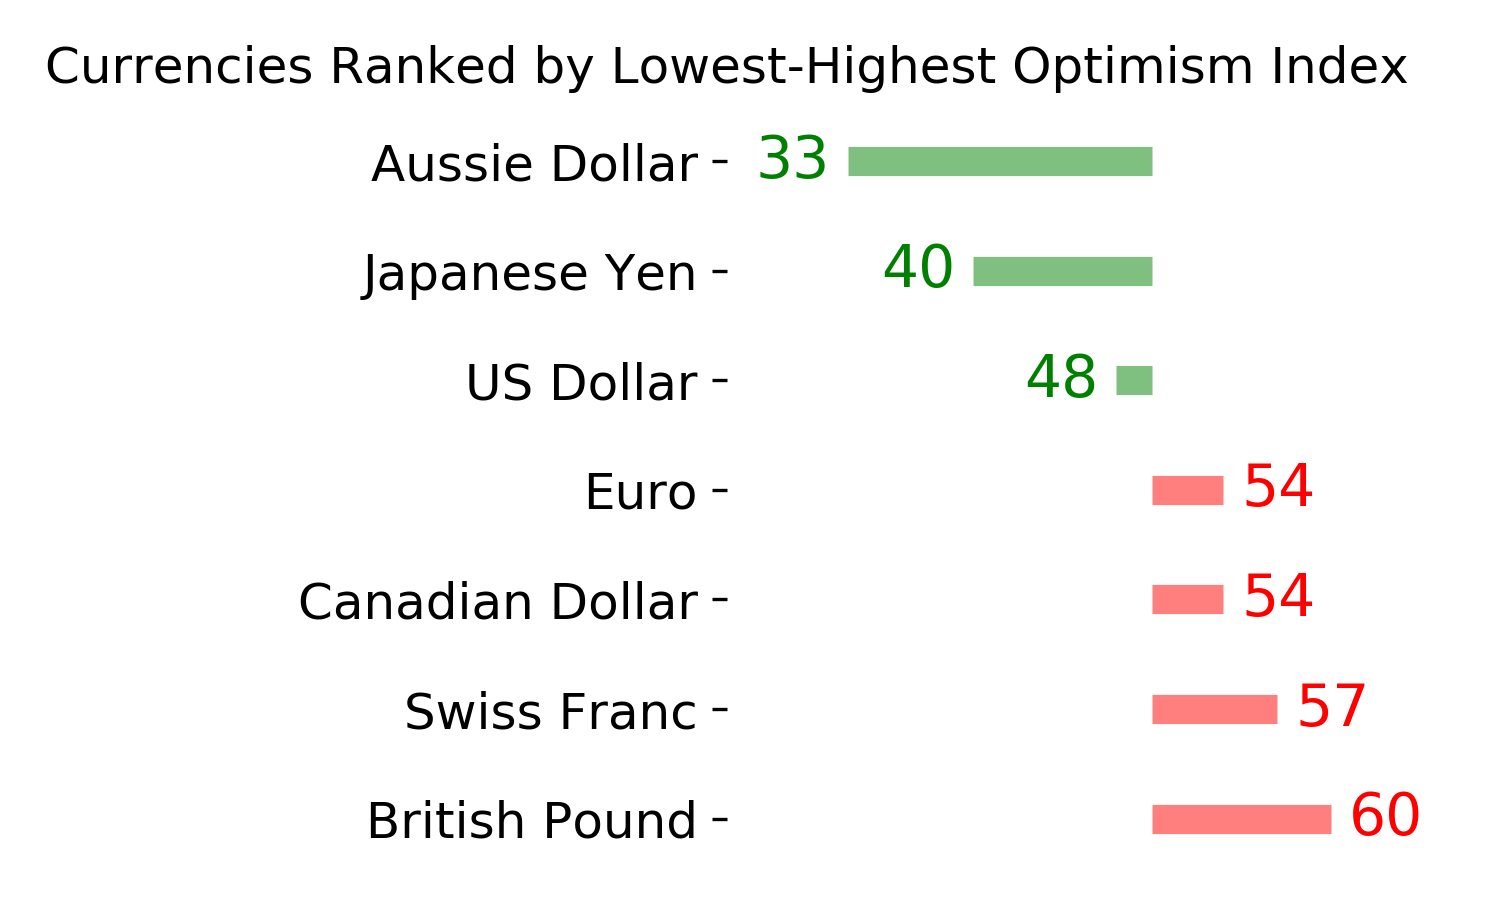
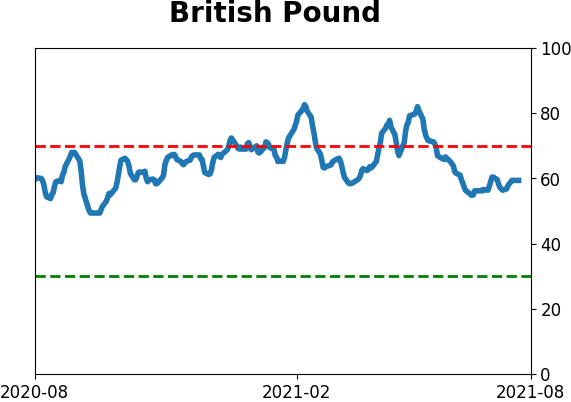
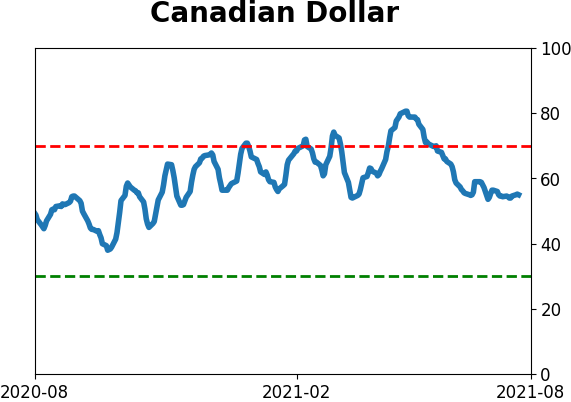
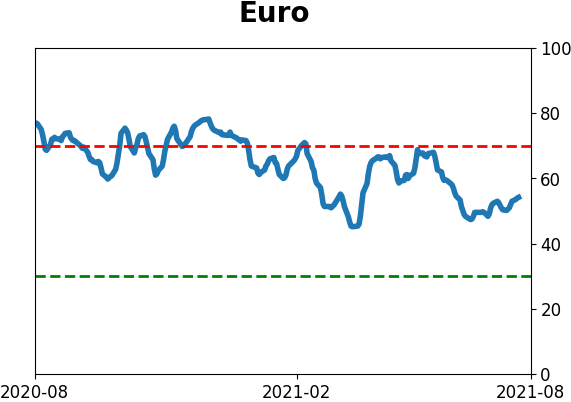
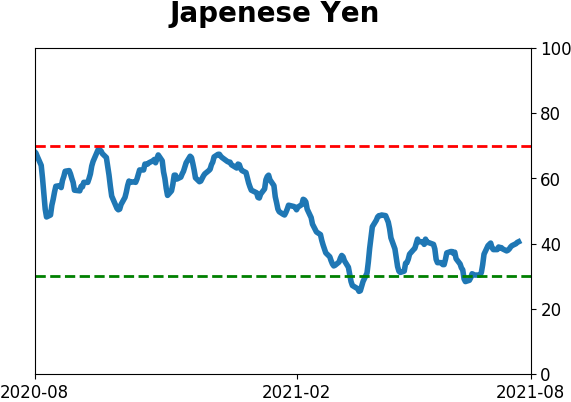
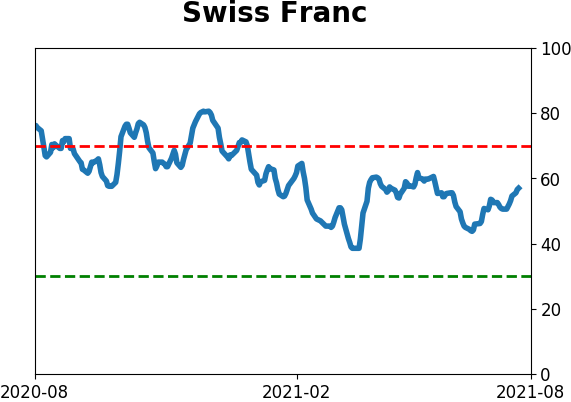
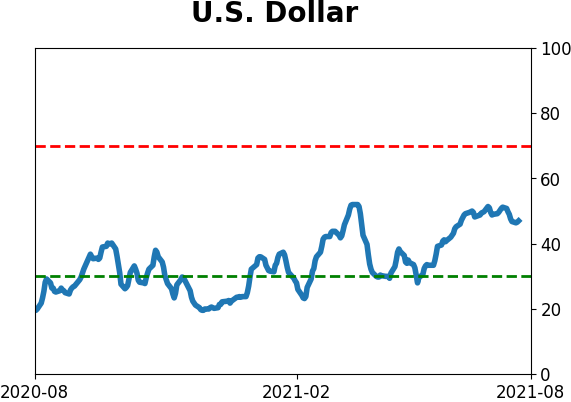
Currency ETF's - 5-Day Moving Average
|
|
|
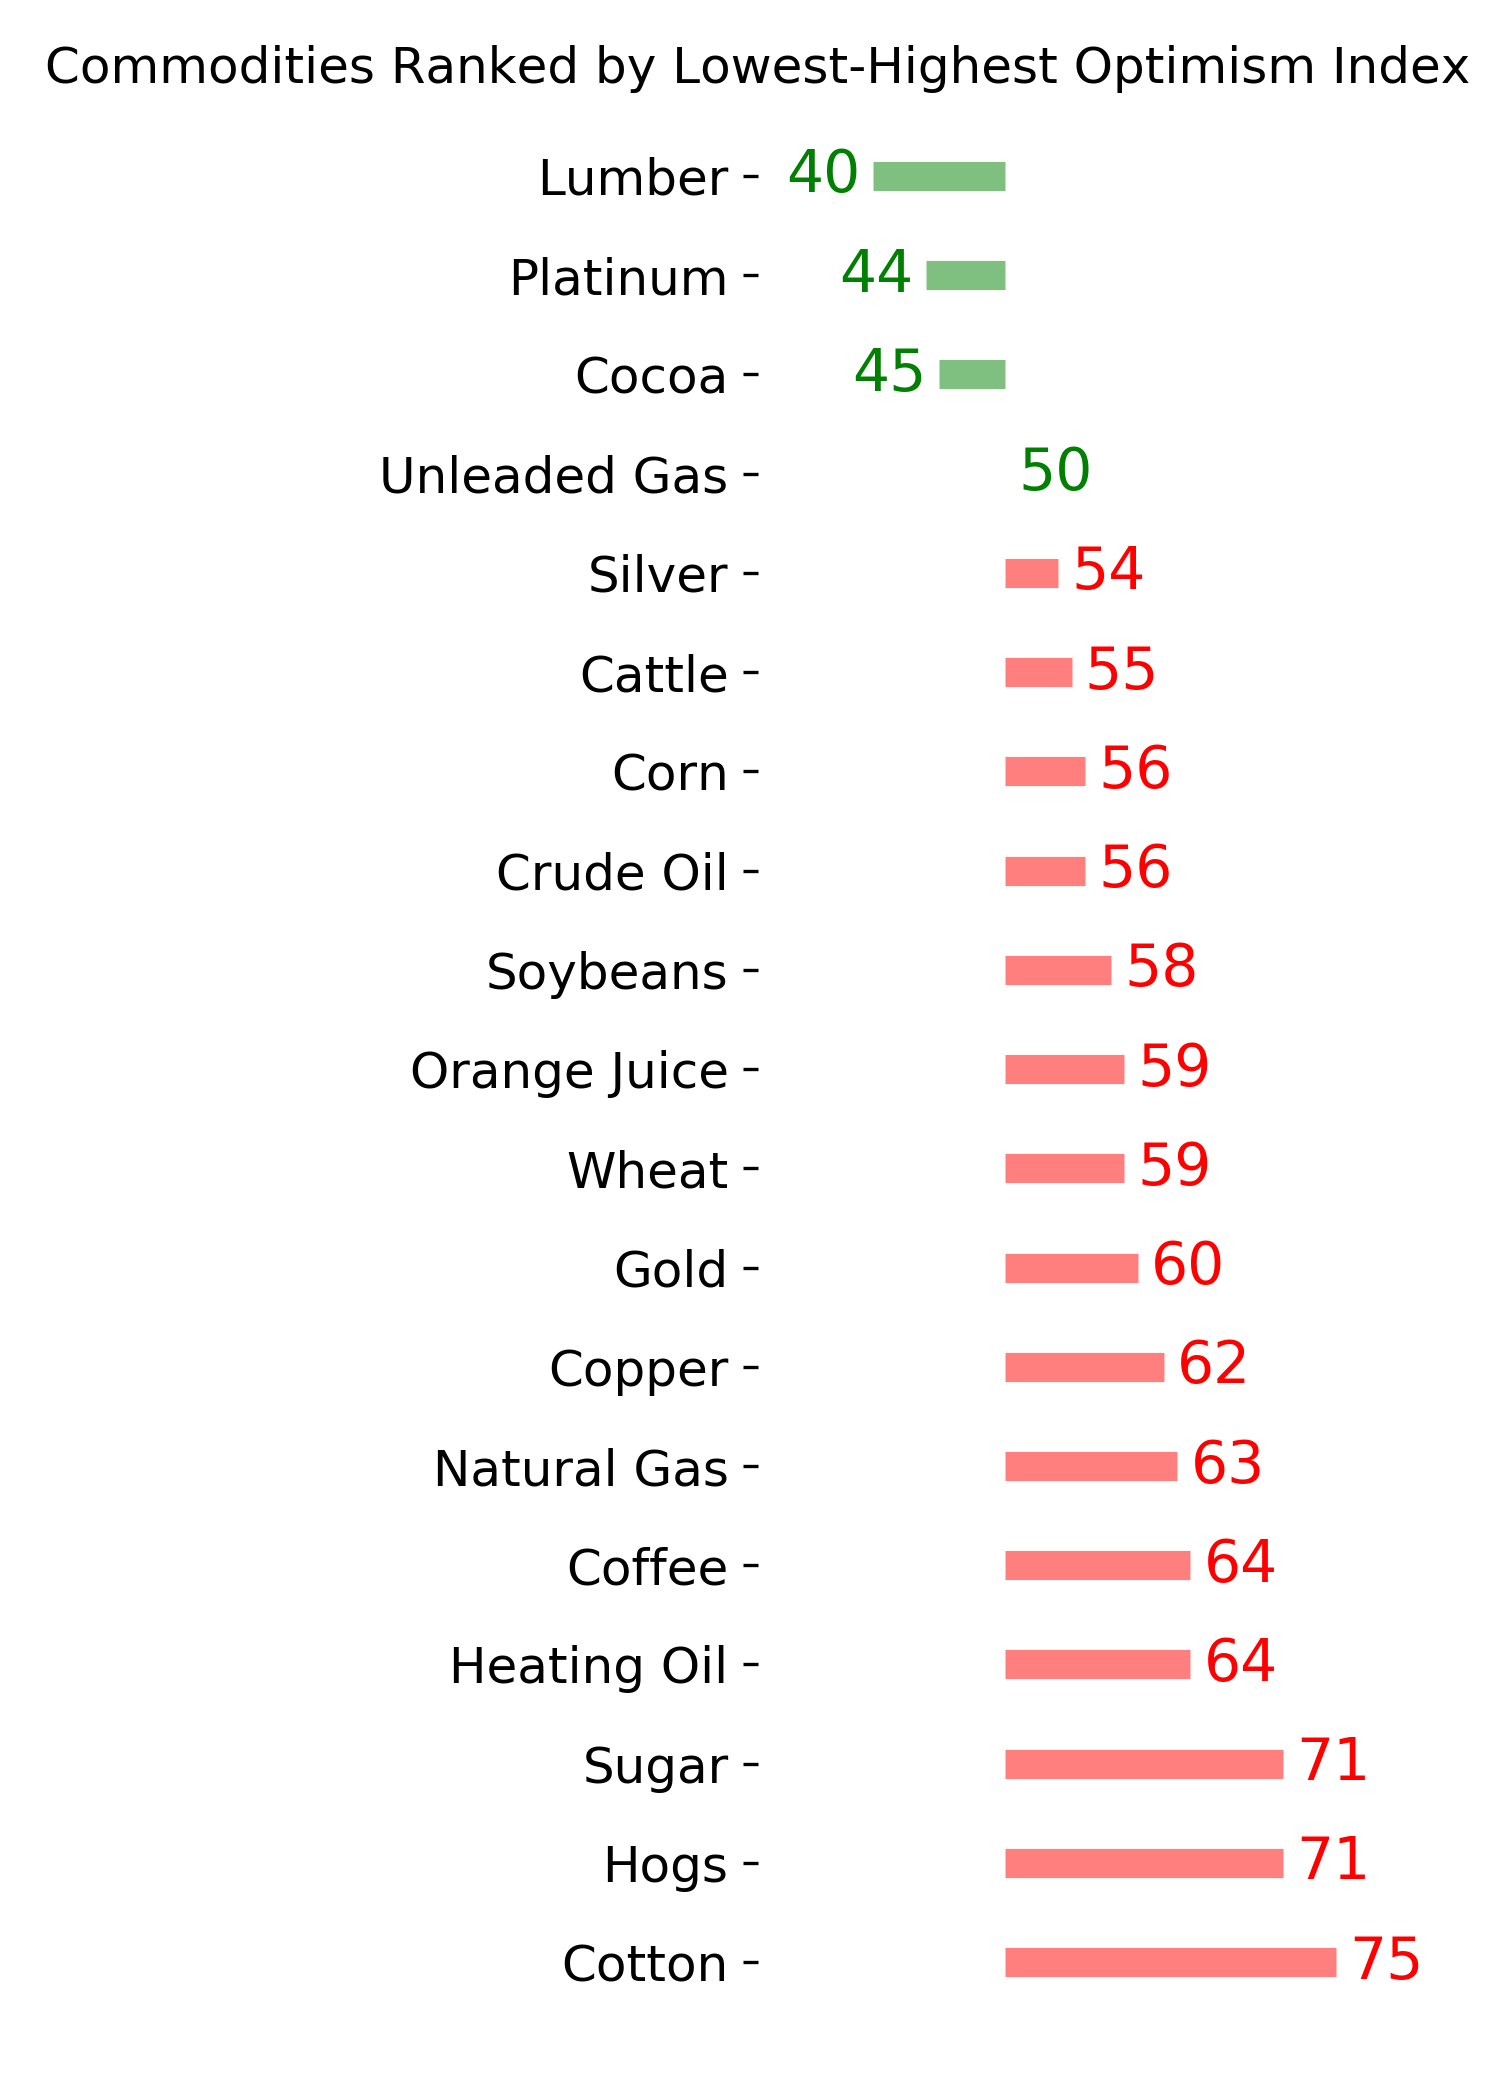
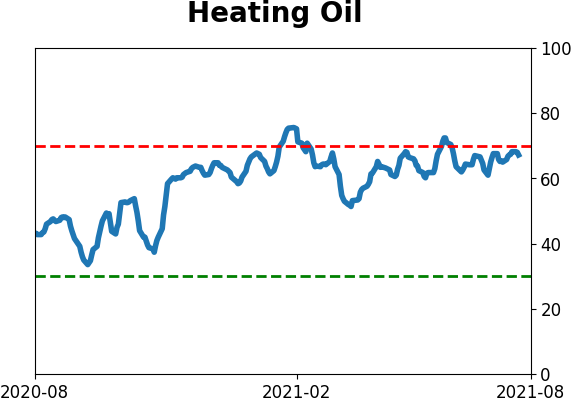
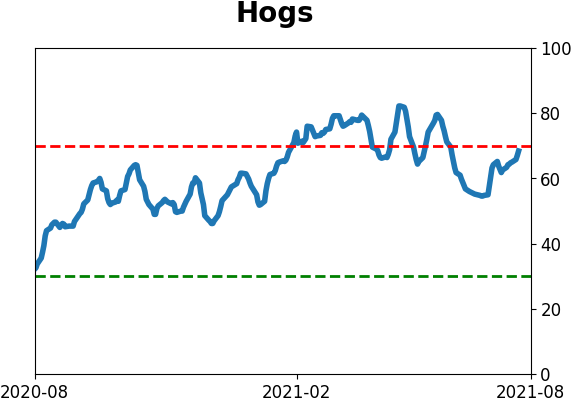
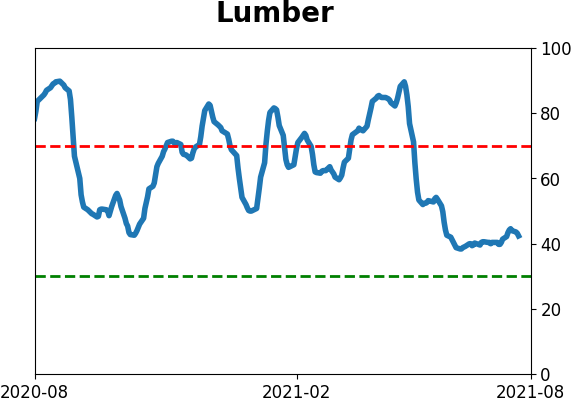
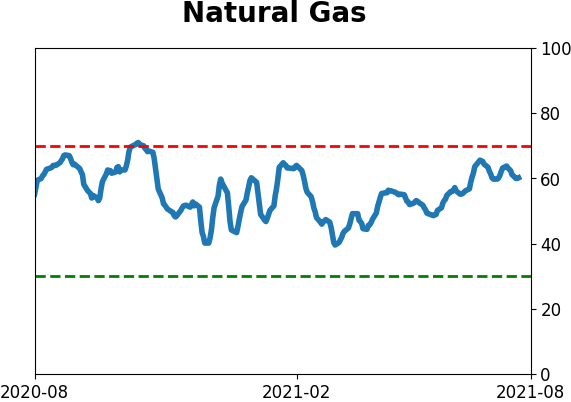
Commodity ETF's - 5-Day Moving Average
|
|