Headlines
|
|
Consumers Are Confident But Not Optimistic:
Consumer confidence is sky-high right now, but consumer sentiment is less optimistic. The divergence between the two is the highest in history. Other divergences mostly led to higher stocks and a lower dollar.
Bottom Line:
See the Outlook & Allocations page for more details on these summaries STOCKS: Hold
The speculative frenzy in February is wrung out. Internal dynamics have mostly held up, with some exceptions. Many of our studies still show a mixed to poor short-term view, with medium- and long-term ones turning more positive. BONDS: Hold
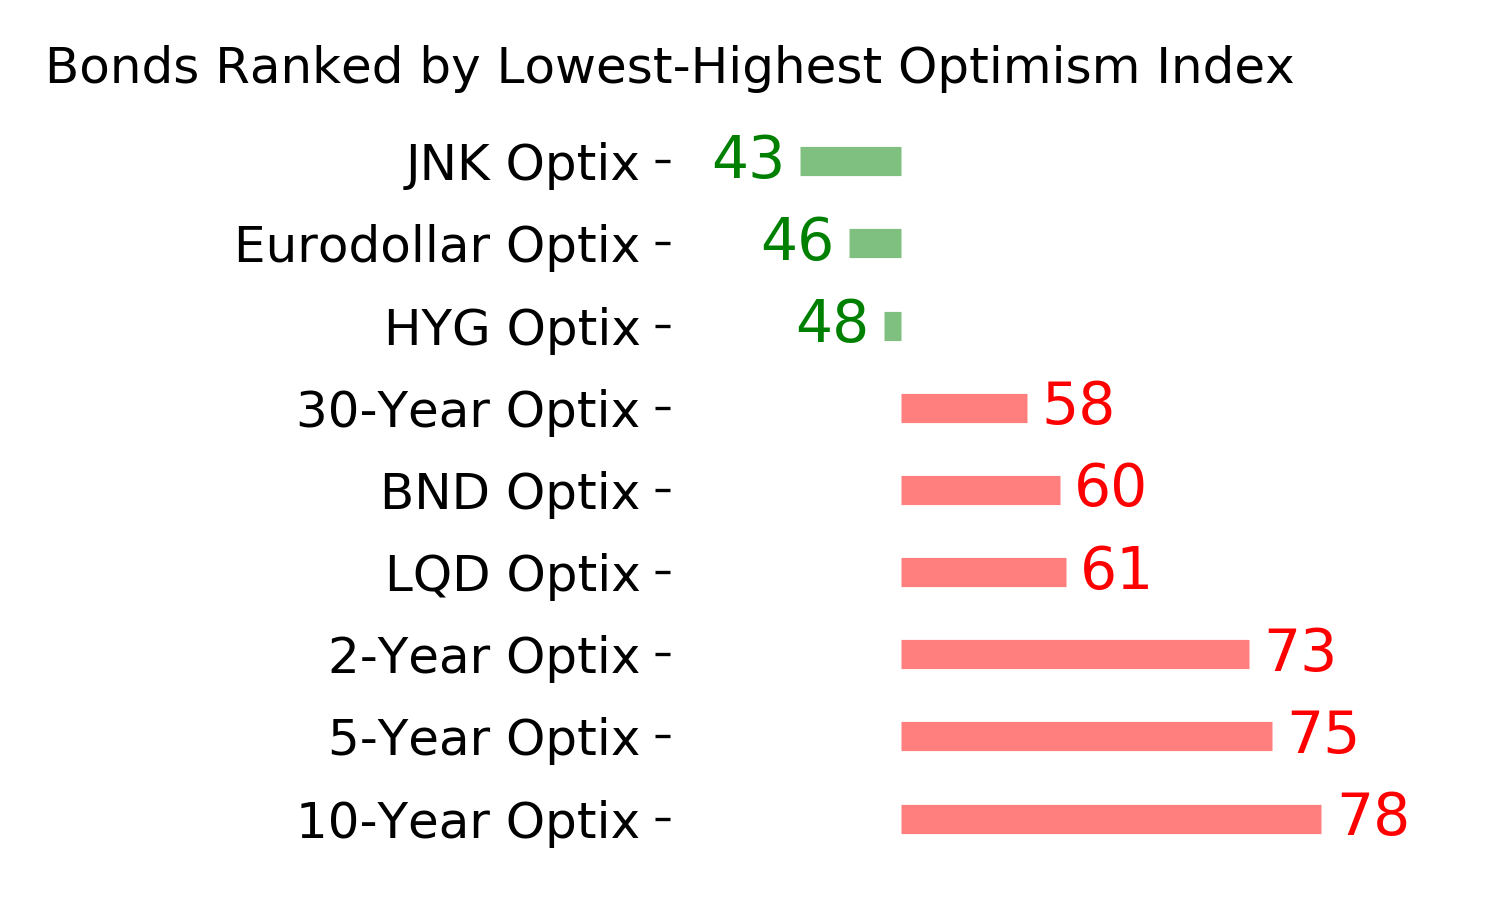
Various parts of the market got hit in March, with the lowest Bond Optimism Index we usually see during healthy environments. After a shaky couple of weeks, the broad bond market has modestly recovered. Not a big edge here either way. GOLD: Hold
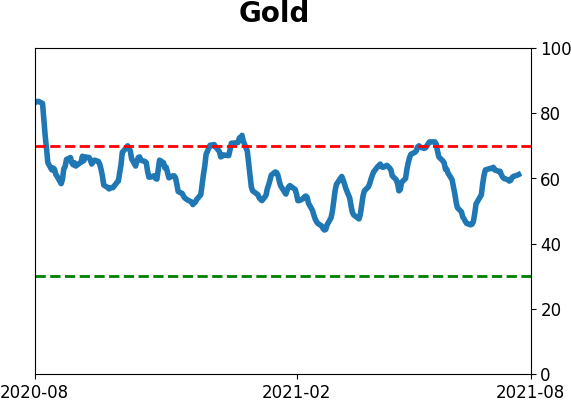
Gold and miners have done very well, recovering above long-term trend lines. The issue is that both have tended to perform poorly after similar situations - will have to wait and see how it plays out.
|
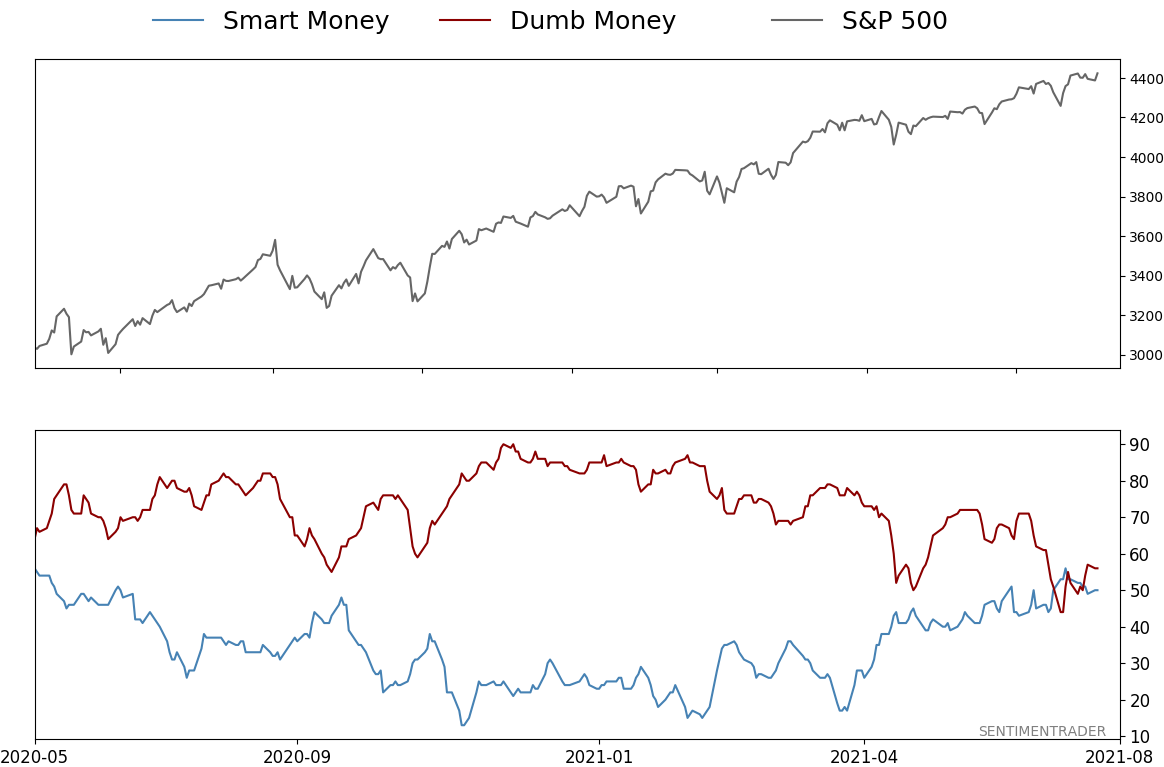
Smart / Dumb Money Confidence
|
Smart Money Confidence: 50%
Dumb Money Confidence: 56%
|
|
Risk Levels
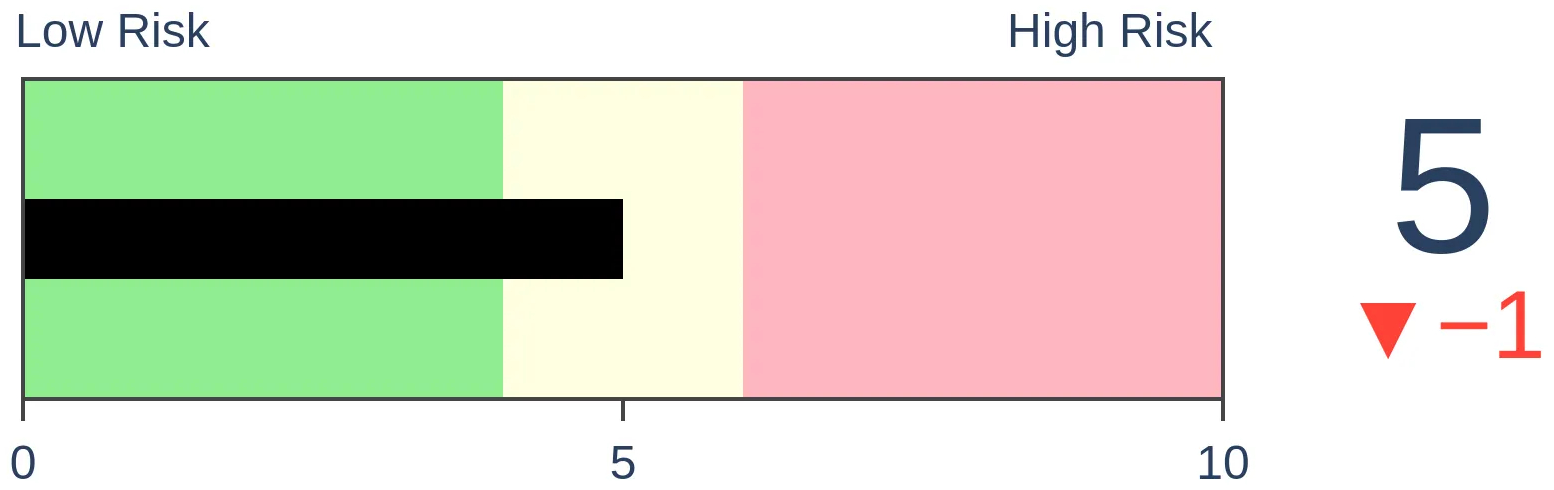
Stocks Short-Term
|
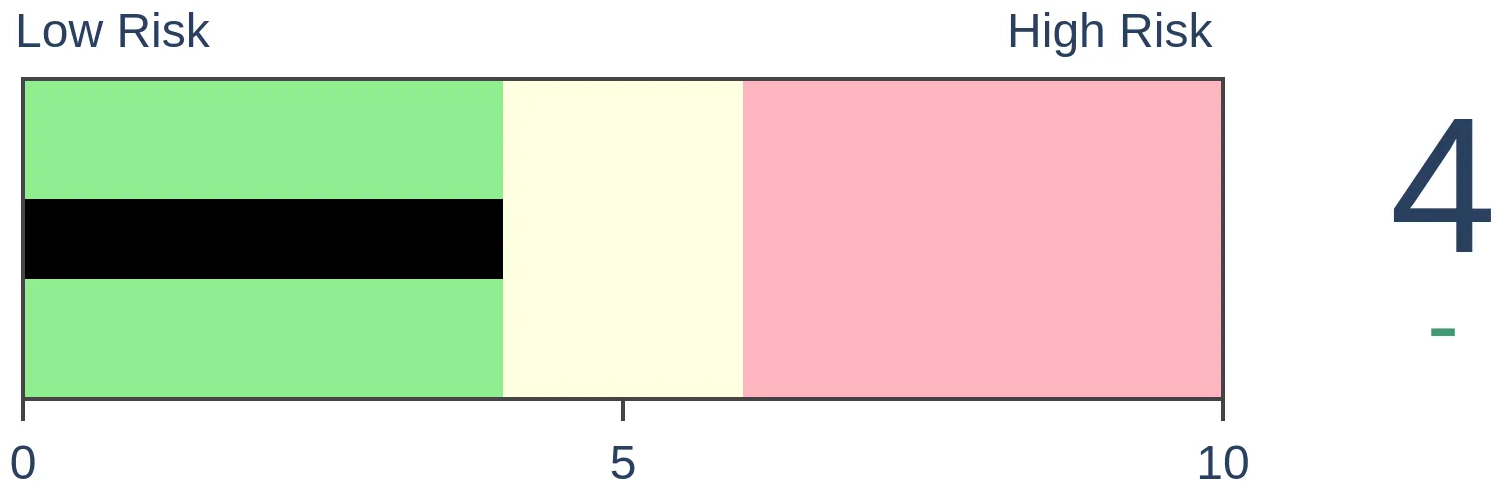
Stocks Medium-Term

|
|
Bonds
|
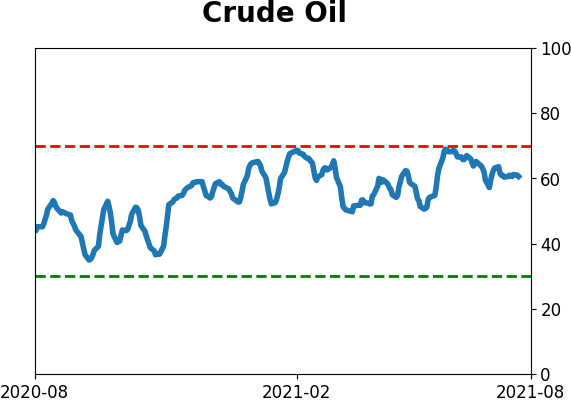
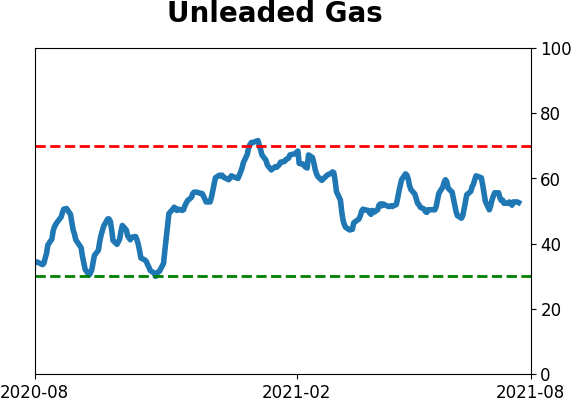
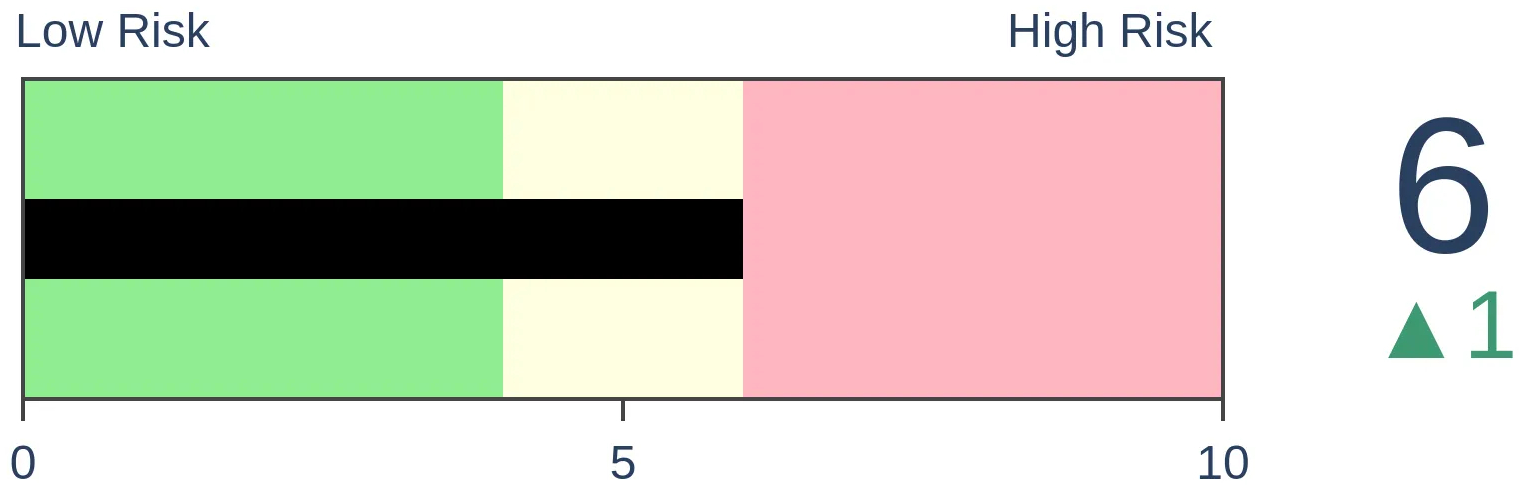
Crude Oil

|
|
Gold
|
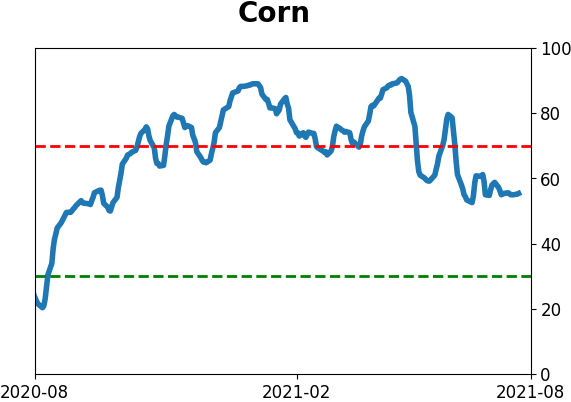
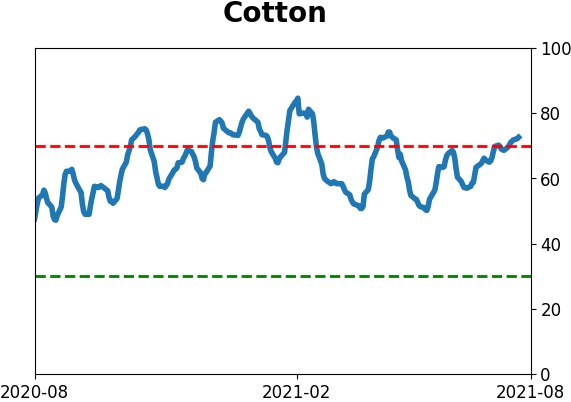
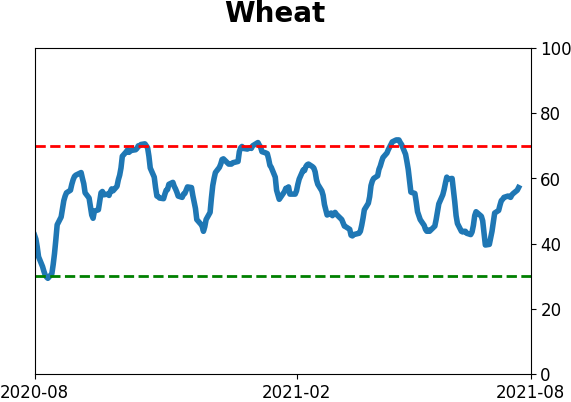
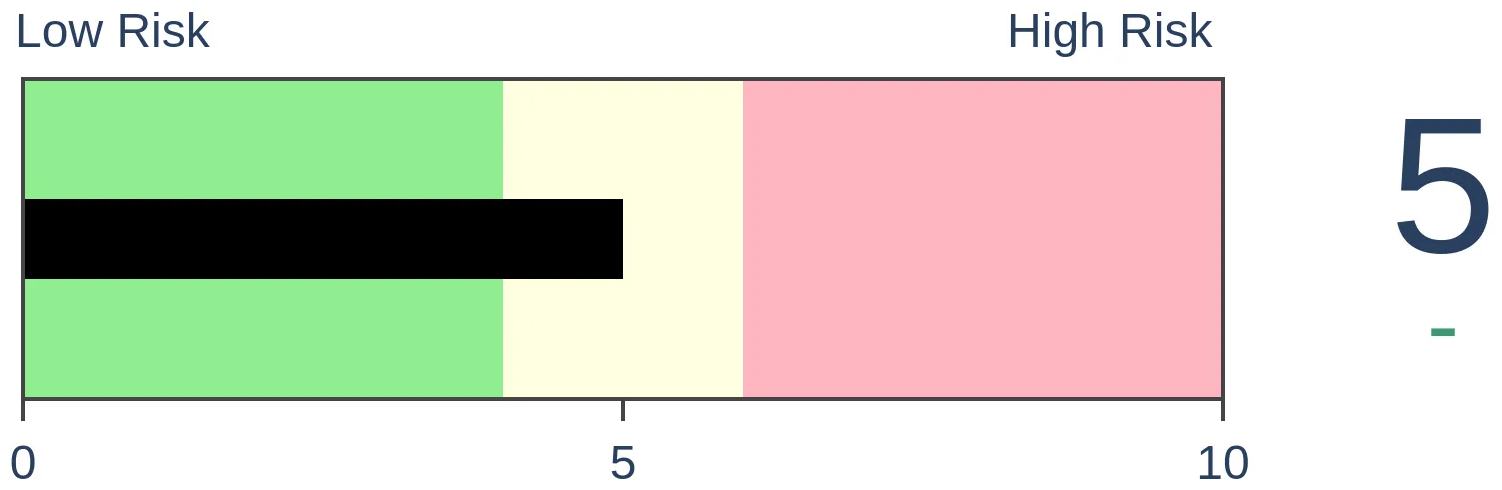
Agriculture
|
|
Research
By Jason Goepfert
BOTTOM LINE
Consumer confidence is sky-high right now, but consumer sentiment is less optimistic. The divergence between the two is the highest in history. Other divergences mostly led to higher stocks and a lower dollar.
FORECAST / TIMEFRAME
None
|
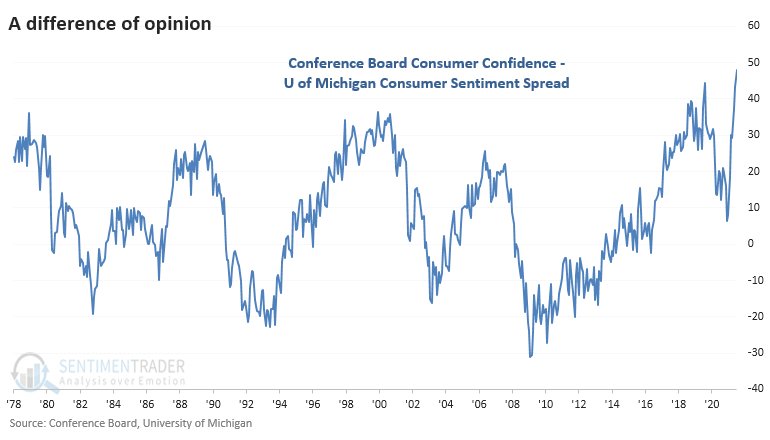
Consumers are a lot more confident than they are optimistic.
Those seem like they should be the same thing but aren't necessarily so. As measured by the Conference Board, consumer confidence was at extremely high levels as of the end of July, while Consumer Sentiment, as measured by the University of Michigan, was in the middle of its long-term range.
According to Investopedia:
"Many who watch both numbers say that the Conference Board survey tends to be better at picking up on indicators related to the job market and job security, while the Michigan survey is a better measure of pocketbook issues like the price of gasoline."
If we go with this theory, then it makes sense that consumers would feel good about employment prospects and pay while also worried about a jump in prices for everyday necessities. Whatever the reasons, we can see below that the spread between Confidence and Sentiment is now the widest in history.
MOSTLY GOOD FOR STOCKS
Assuming that July's reading will mark the peak spread between the two surveys, the table below shows returns in the S&P 500 following all other notable peaks in the past 40+ years.
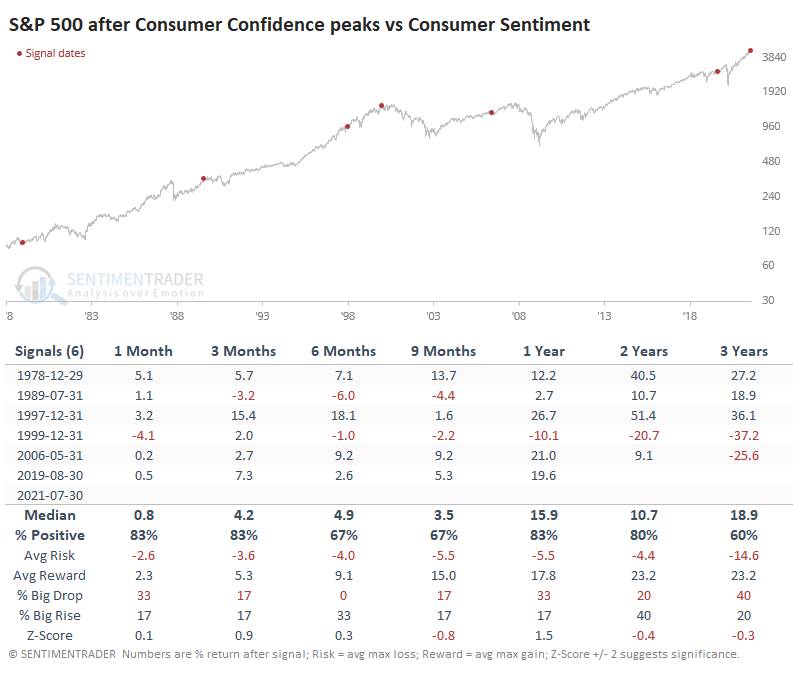
For the most part, stocks held up well...for a while. The biggest issue is that at some point - and it was an inconsistent "at some point" - stocks fell into a bear market following these divergences. They preceded trouble in 1990, 2000, 2008, and 2020. The first two triggered within months; the latter two took a long time to play out. It's hard to rely on something with such inconsistent timing.
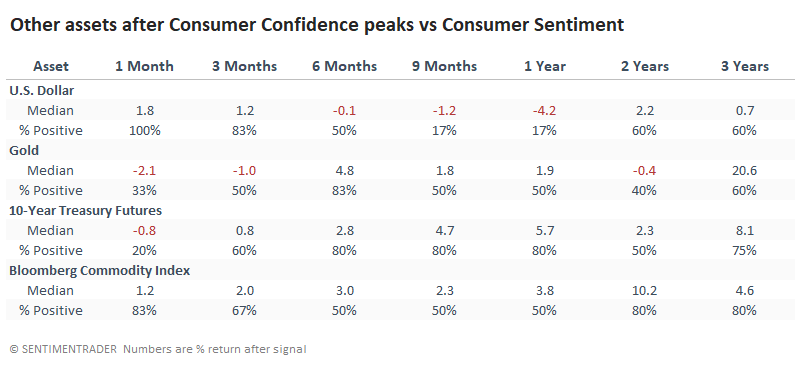
BAD FOR THE BUCK
The dollar rallied in the few months following these signals for other assets, then declined 5 out of 6 times over the next 9-12 months. Treasury note futures prices dropped shorter-term, then rallied 6-12 months later. Gold and commodities were mixed.
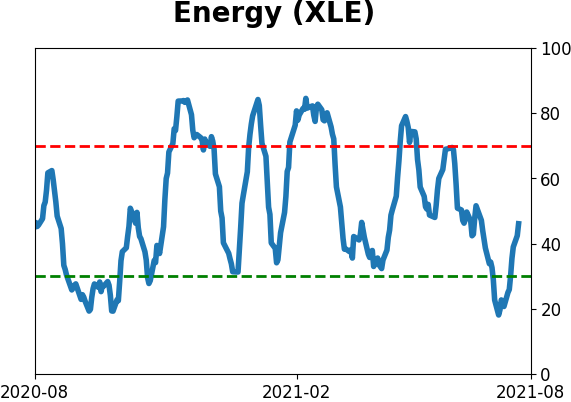
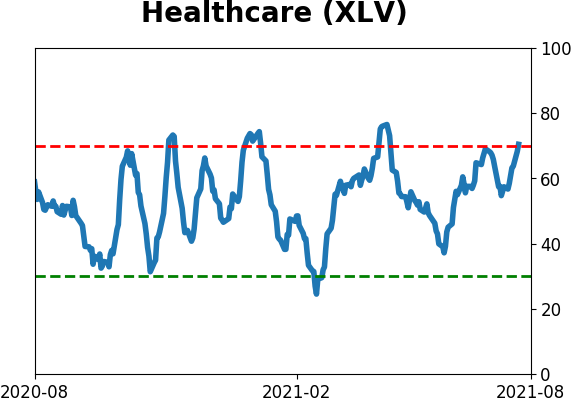
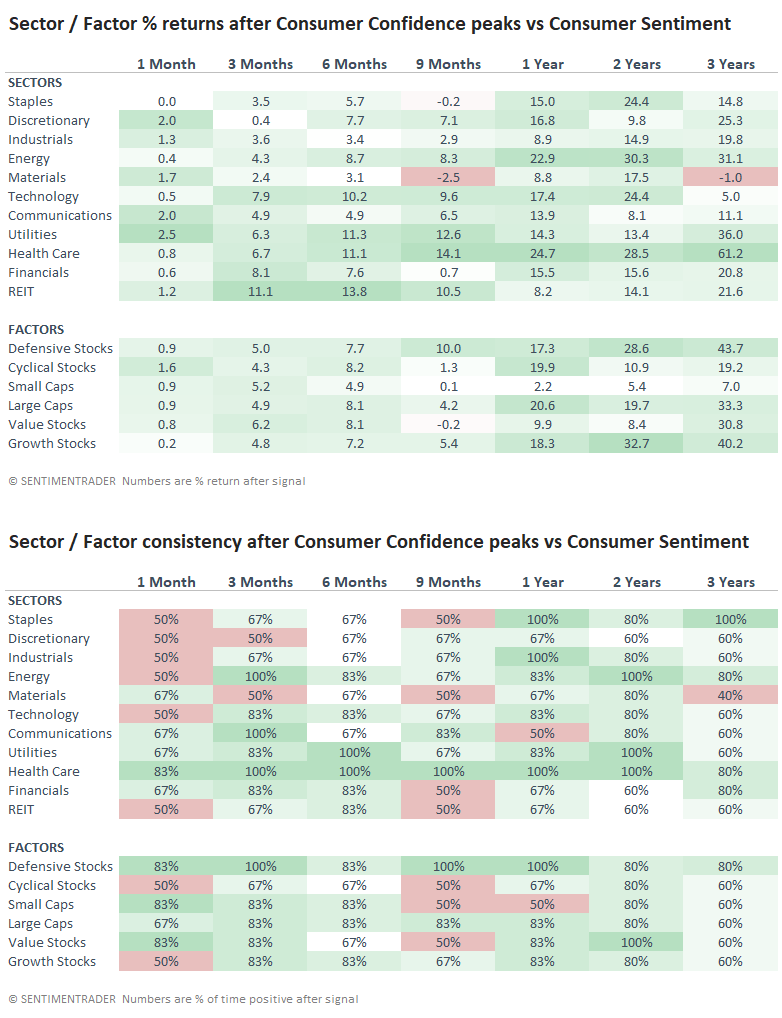
Among sectors and factors, some of the best returns were in Energy, Health Care, and Defensive stocks in general.
A wide disparity in how consumers feel about the economy, depending on which part of the economy they're focused on, can be a cause for concern. The best returns tend to occur when broad swaths of them are feeling poorly and being to become optimistic. Now, we see high confidence in some parts and pessimism in others. Divergences, in general, tend to harm forward returns. With this particular set of data, the timing has been too inconsistent to be an imminent worry for investors. It might be more of a concern for longer-term bulls on the dollar.
Active Studies
| Time Frame | Bullish | Bearish | | Short-Term | 0 | 4 | | Medium-Term | 4 | 3 | | Long-Term | 10 | 5 |
|
Indicators at Extremes
Portfolio
| Position | Description | Weight % | Added / Reduced | Date | | Stocks | RSP | 4.1 | Added 4.1% | 2021-05-19 | | Bonds | 23.9% BND, 6.9% SCHP | 30.7 | Reduced 7.1% | 2021-05-19 | | Commodities | GCC | 2.6 | Reduced 2.1%
| 2020-09-04 | | Precious Metals | GDX | 5.6 | Reduced 4.2% | 2021-05-19 | | Special Situations | 4.3% XLE, 2.2% PSCE | 7.6 | Reduced 5.6% | 2021-04-22 | | Cash | | 49.4 | | |
|
Updates (Changes made today are underlined)
Much of our momentum and trend work has remained positive for several months, with some scattered exceptions. Almost all sentiment-related work has shown a poor risk/reward ratio for stocks, especially as speculation drove to record highs in exuberance in February. Much of that has worn off, and most of our models are back toward neutral levels. There isn't much to be excited about here. The same goes for bonds and even gold. Gold has been performing well lately and is back above long-term trend lines. The issue is that it has a poor record of holding onto gains when attempting a long-term trend change like this, so we'll take a wait-and-see approach. RETURN YTD: 9.3% 2020: 8.1%, 2019: 12.6%, 2018: 0.6%, 2017: 3.8%, 2016: 17.1%, 2015: 9.2%, 2014: 14.5%, 2013: 2.2%, 2012: 10.8%, 2011: 16.5%, 2010: 15.3%, 2009: 23.9%, 2008: 16.2%, 2007: 7.8%
|
|
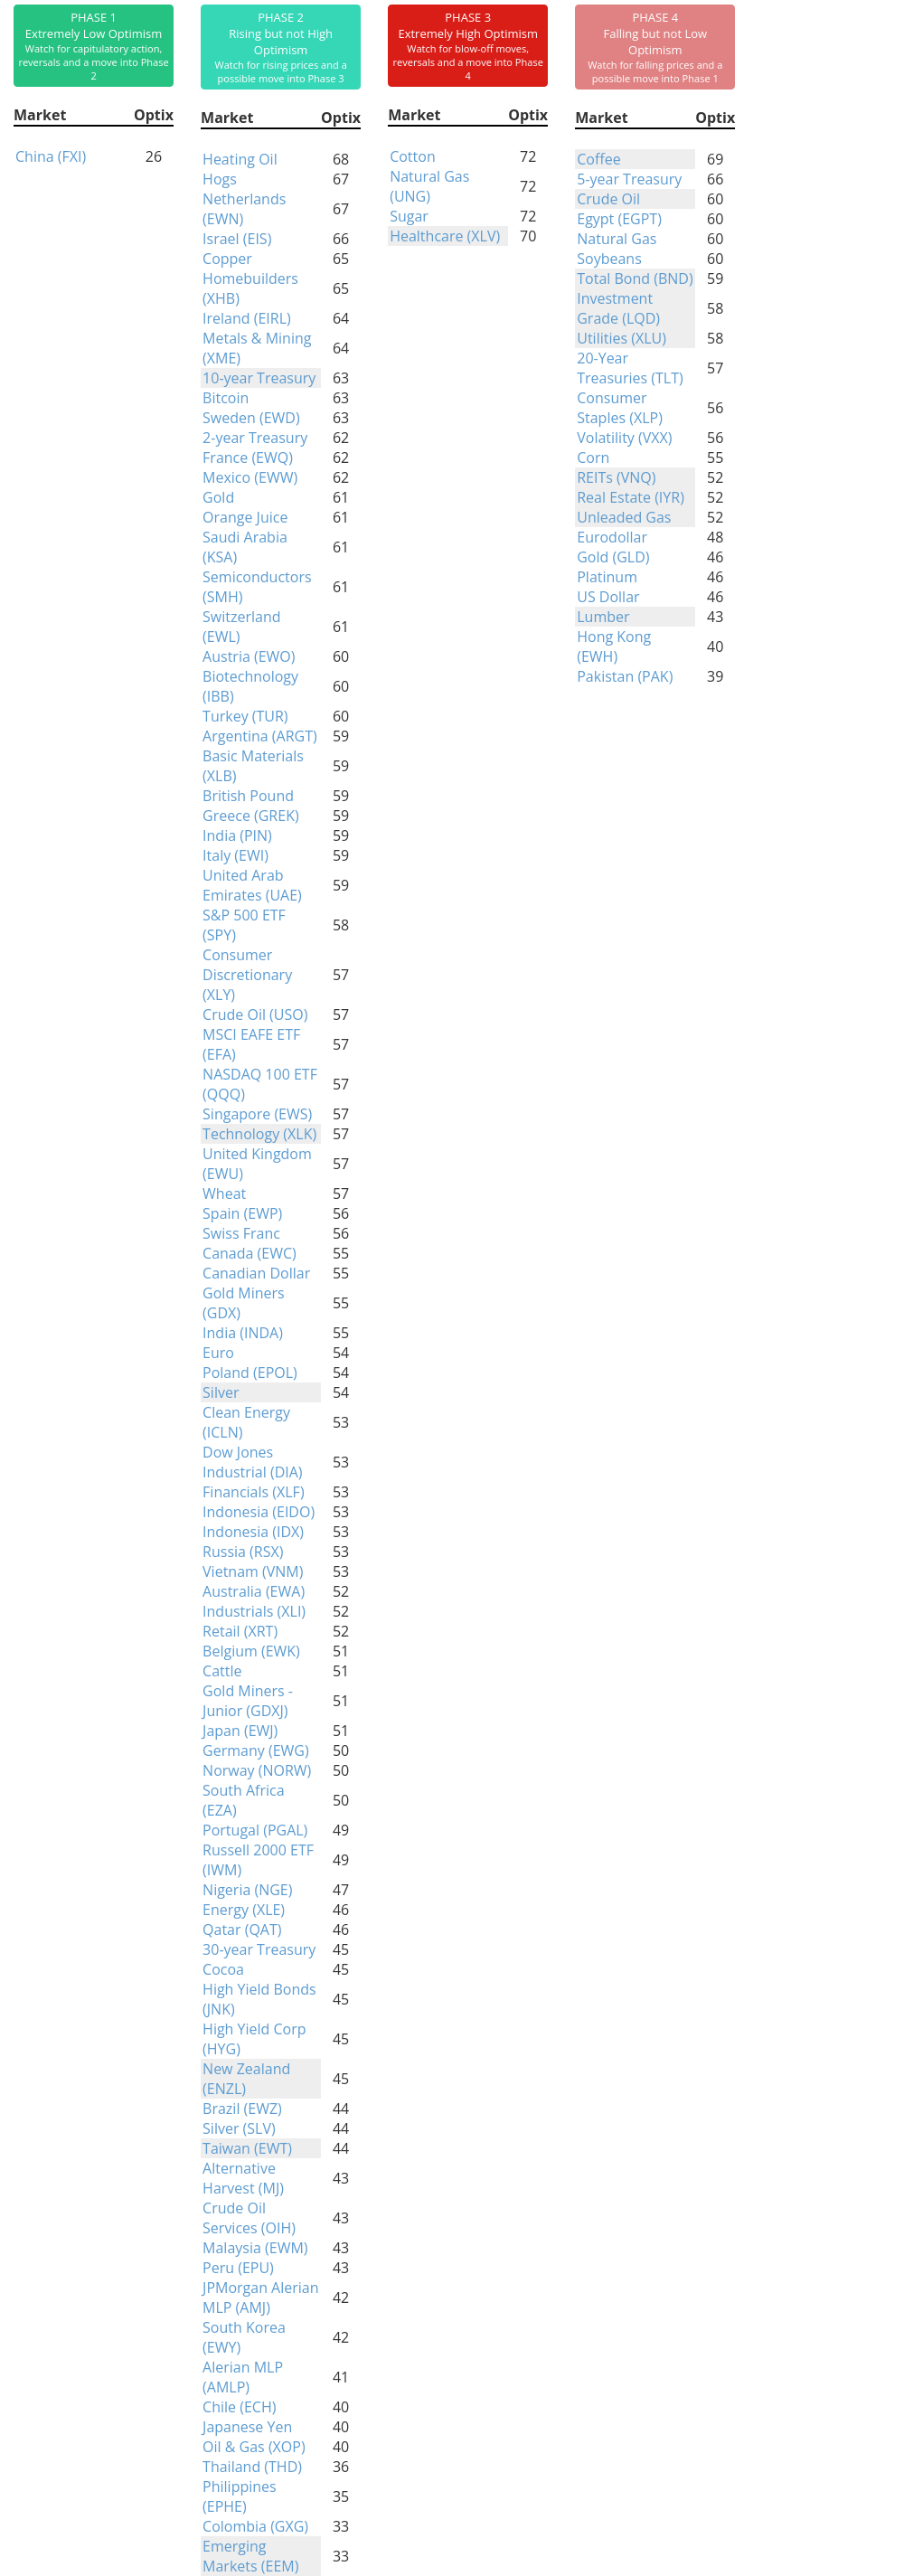
Phase Table
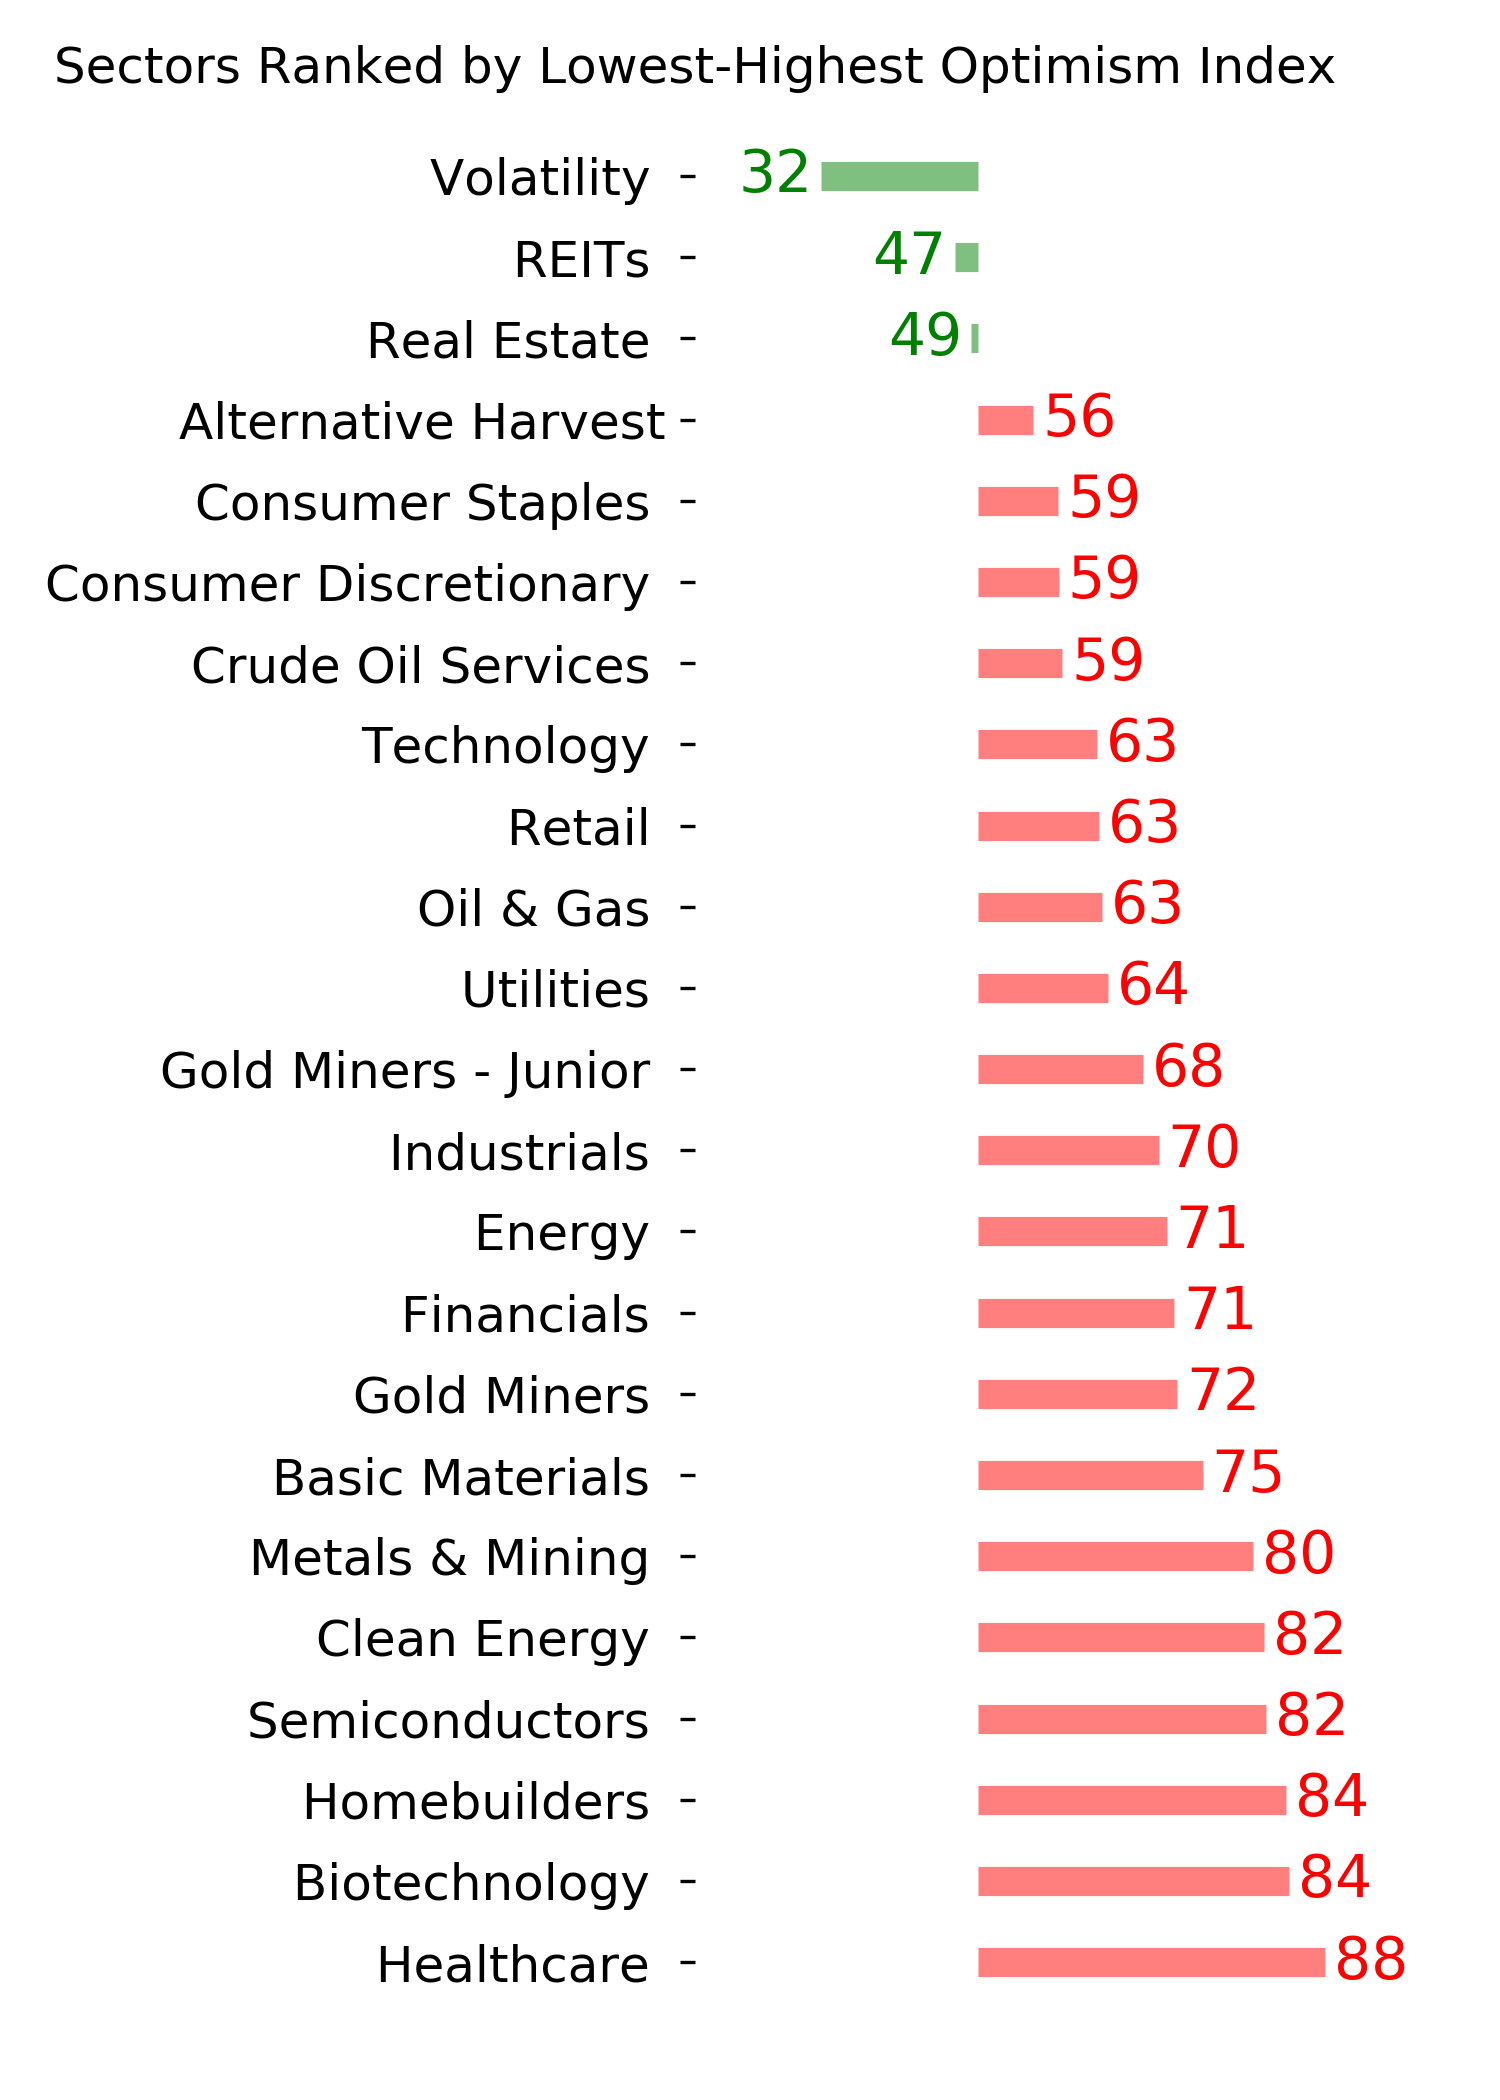
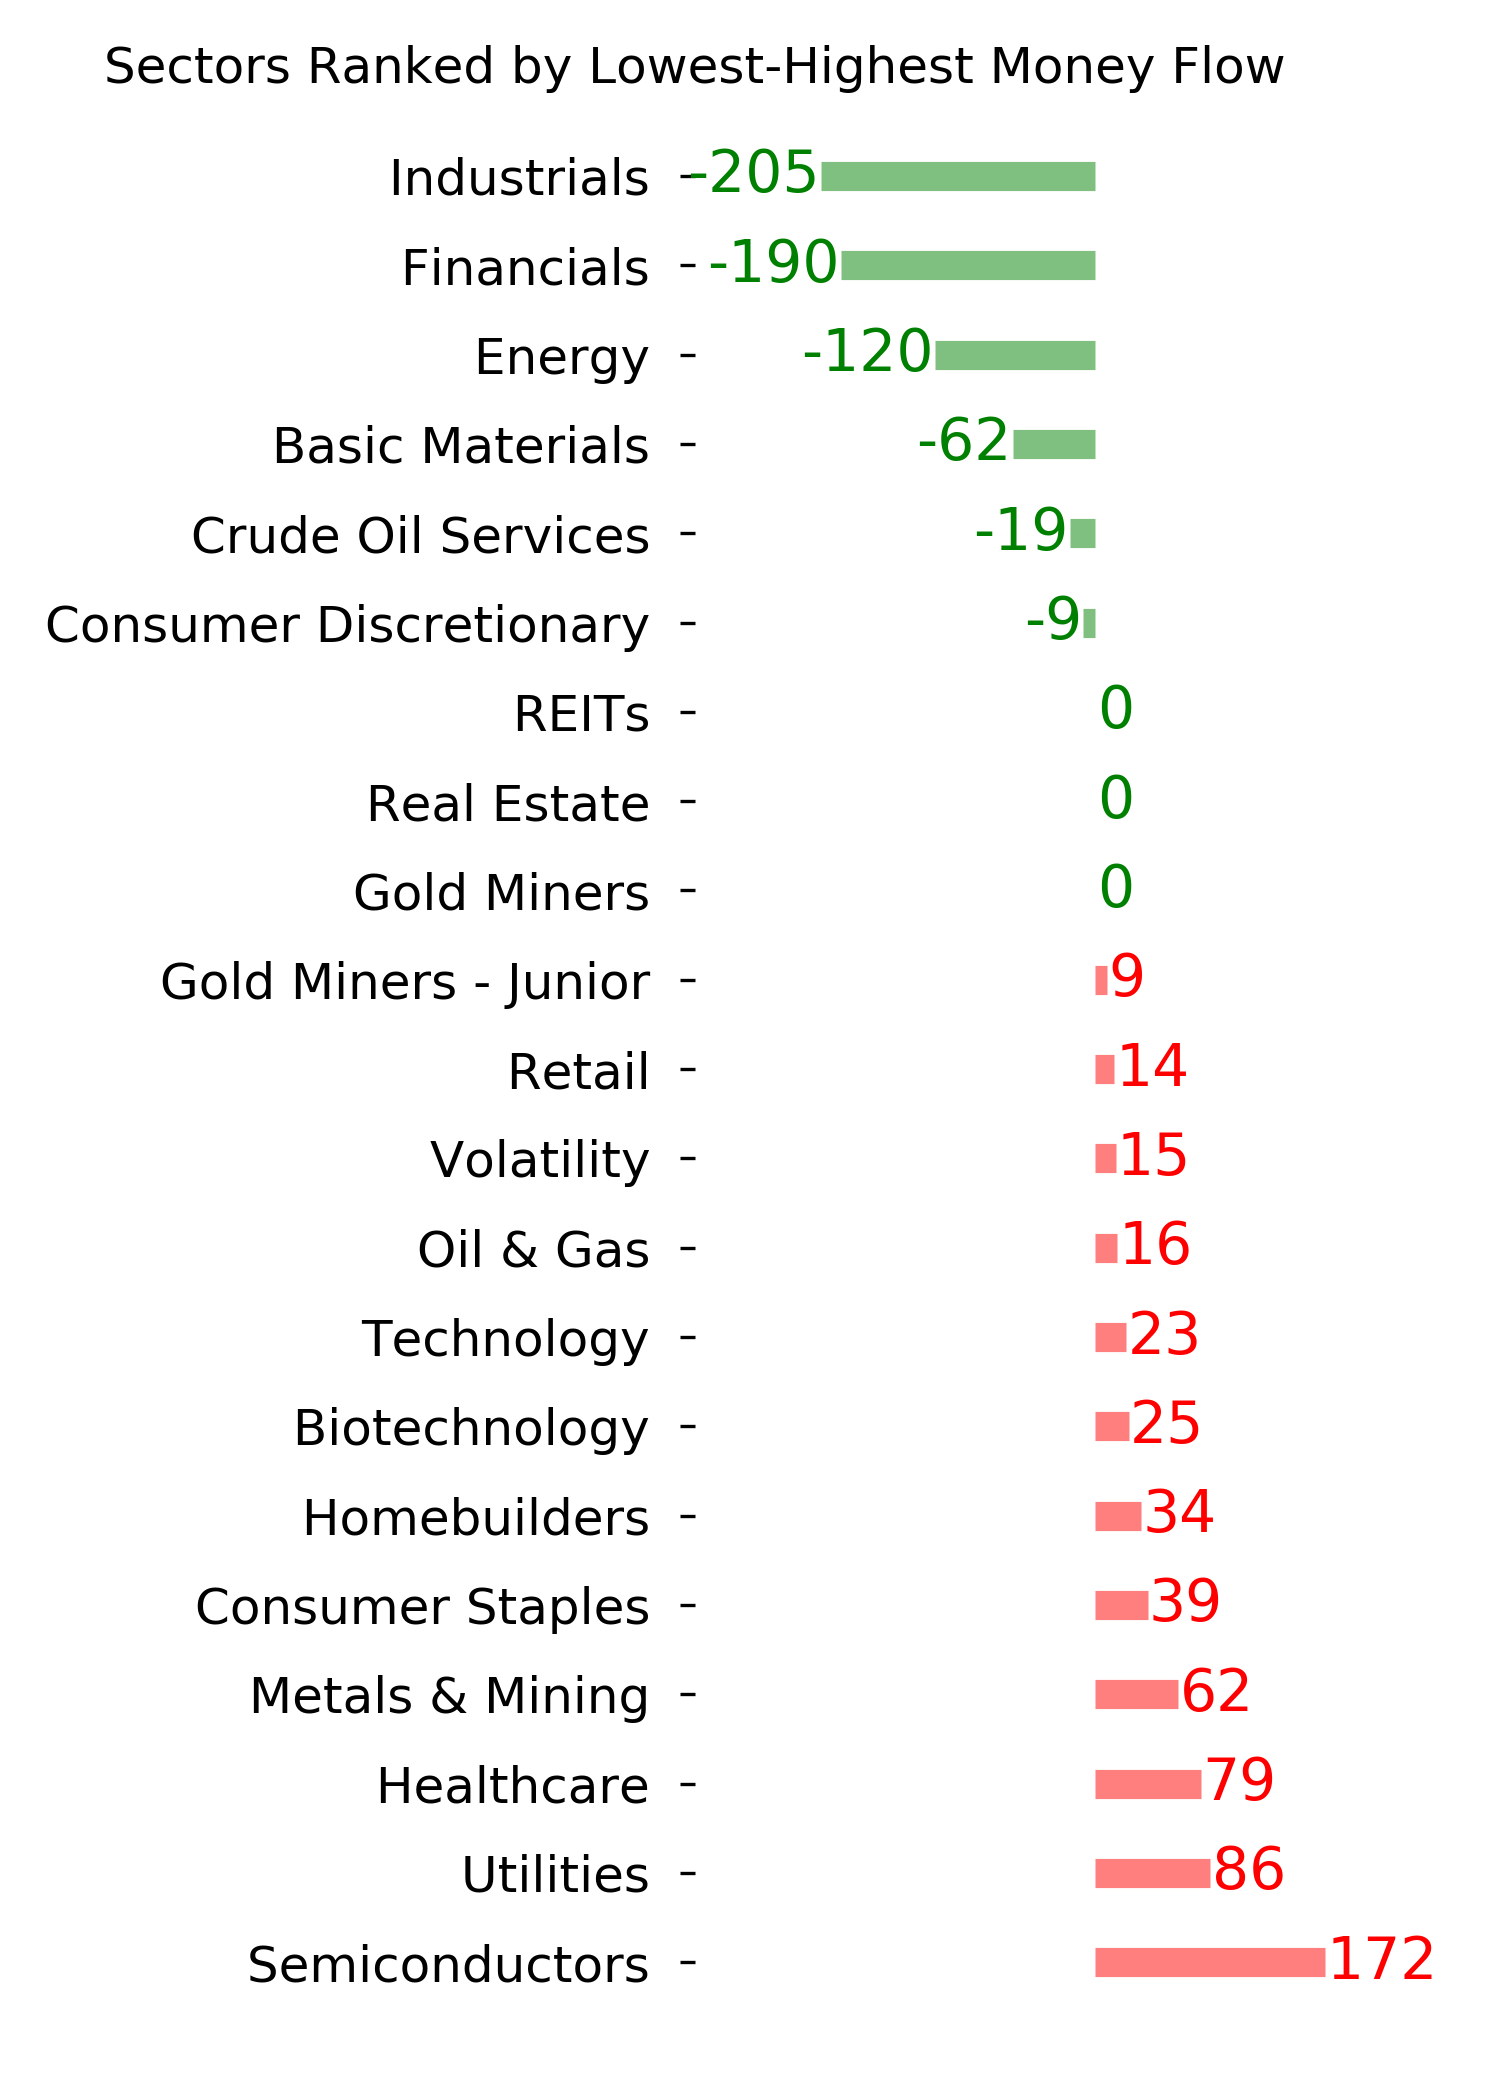
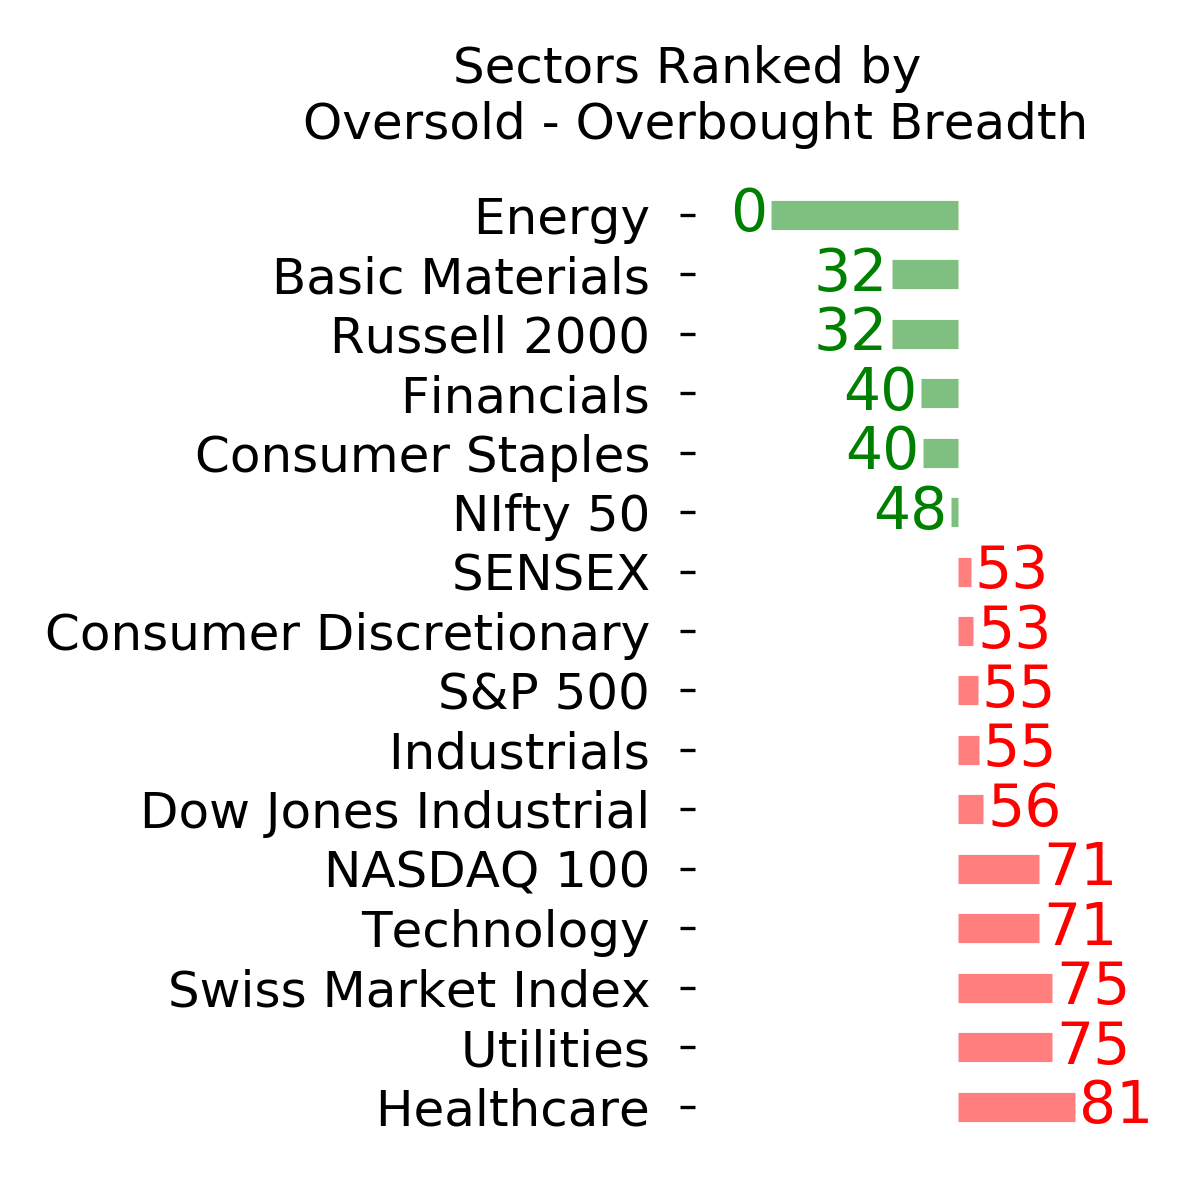
Ranks
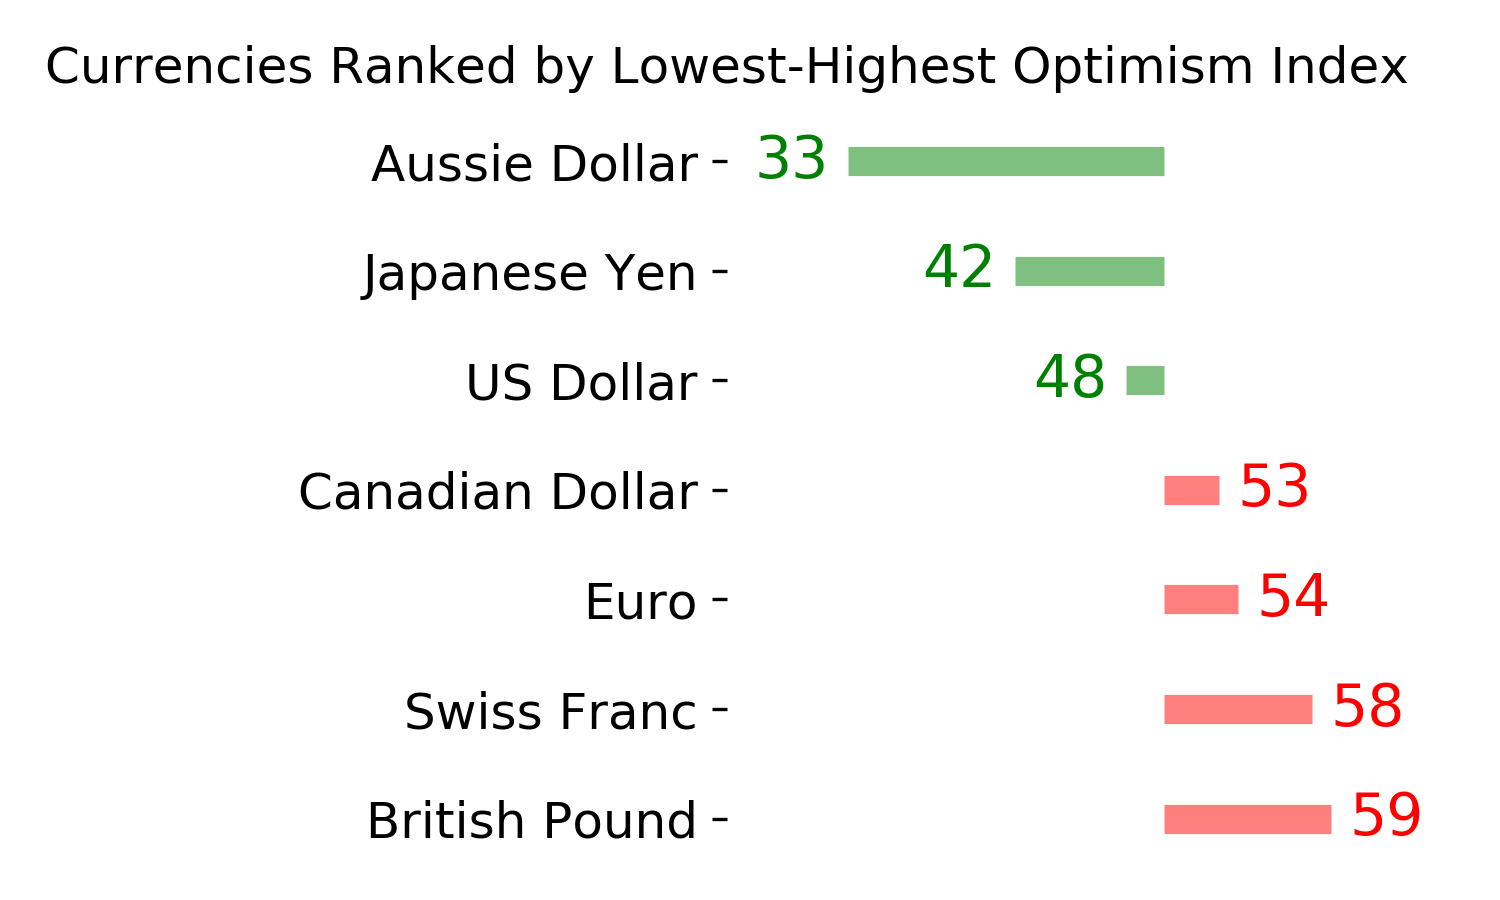
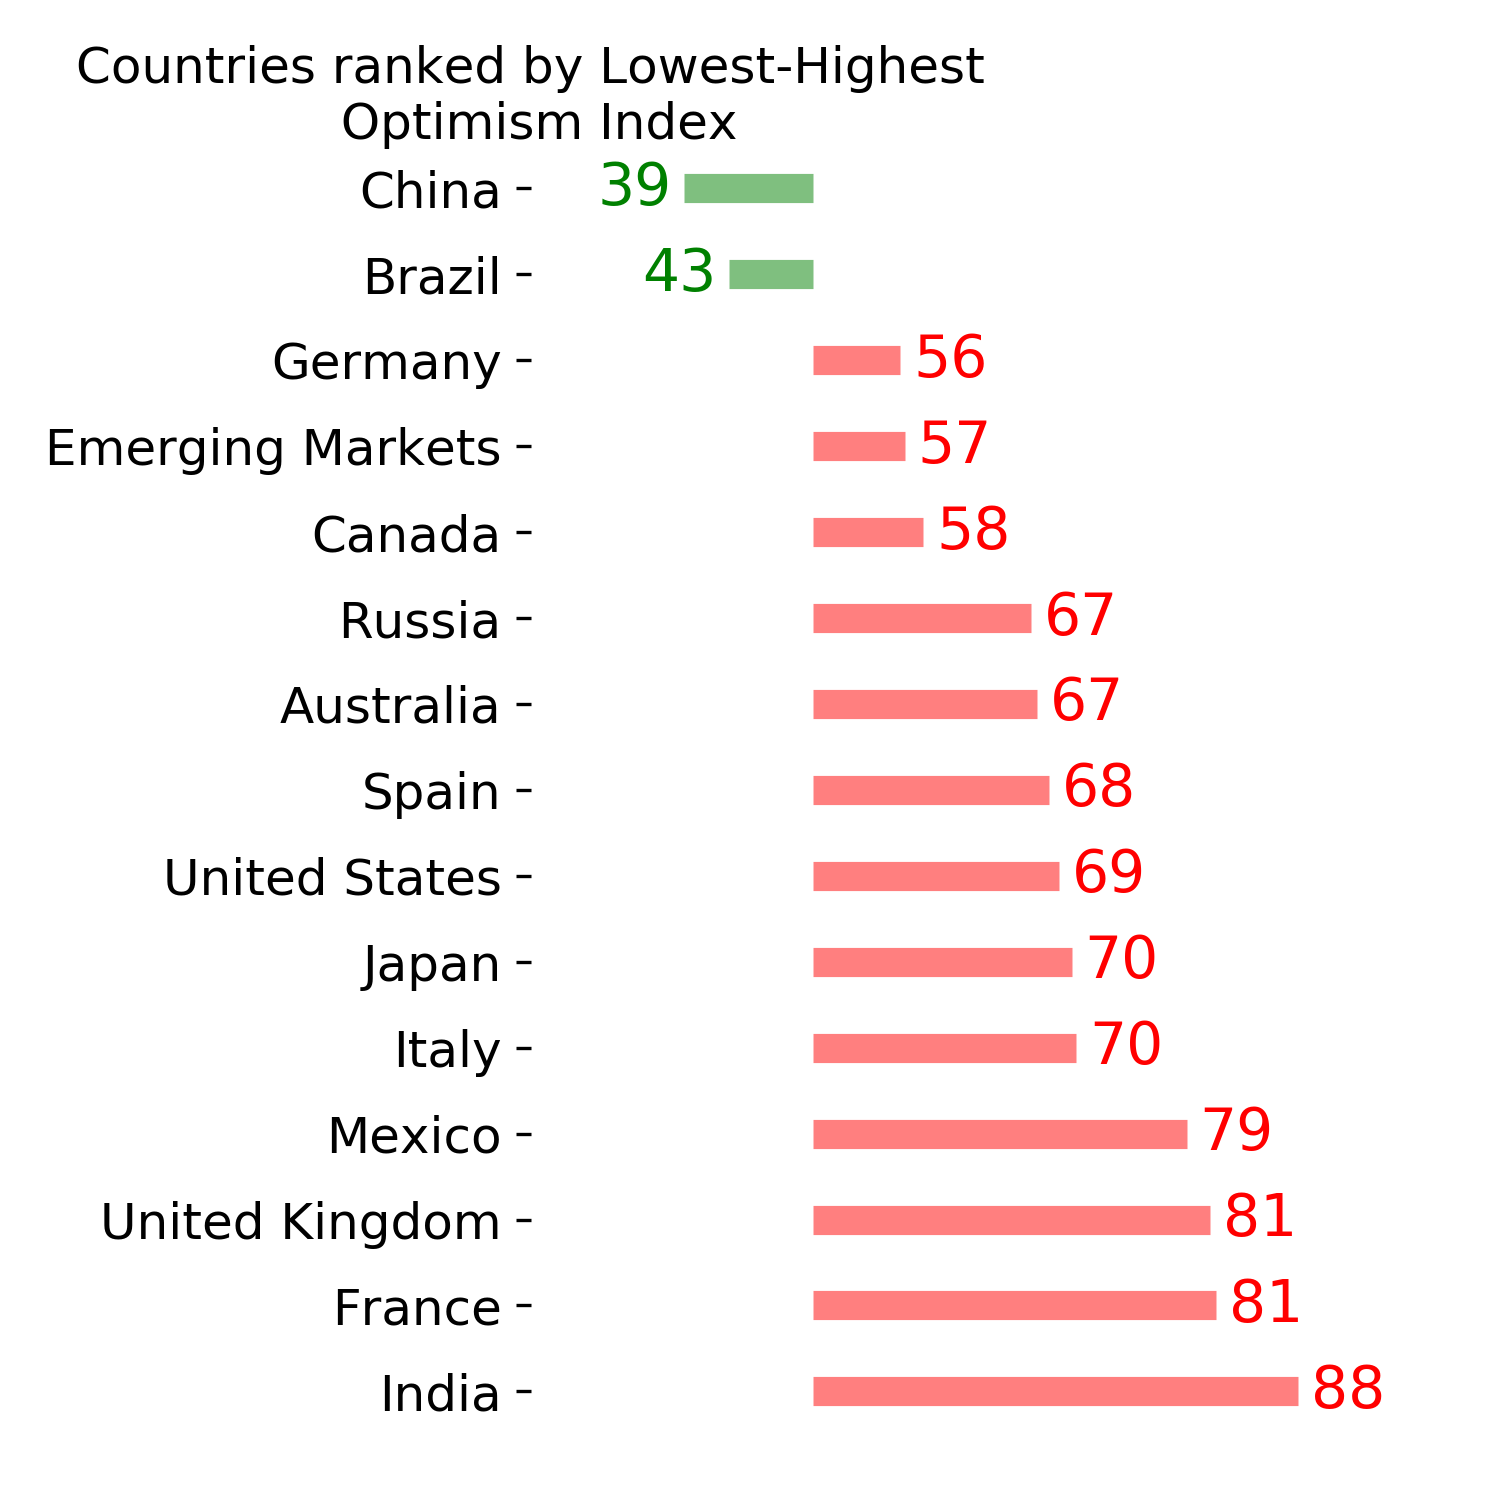
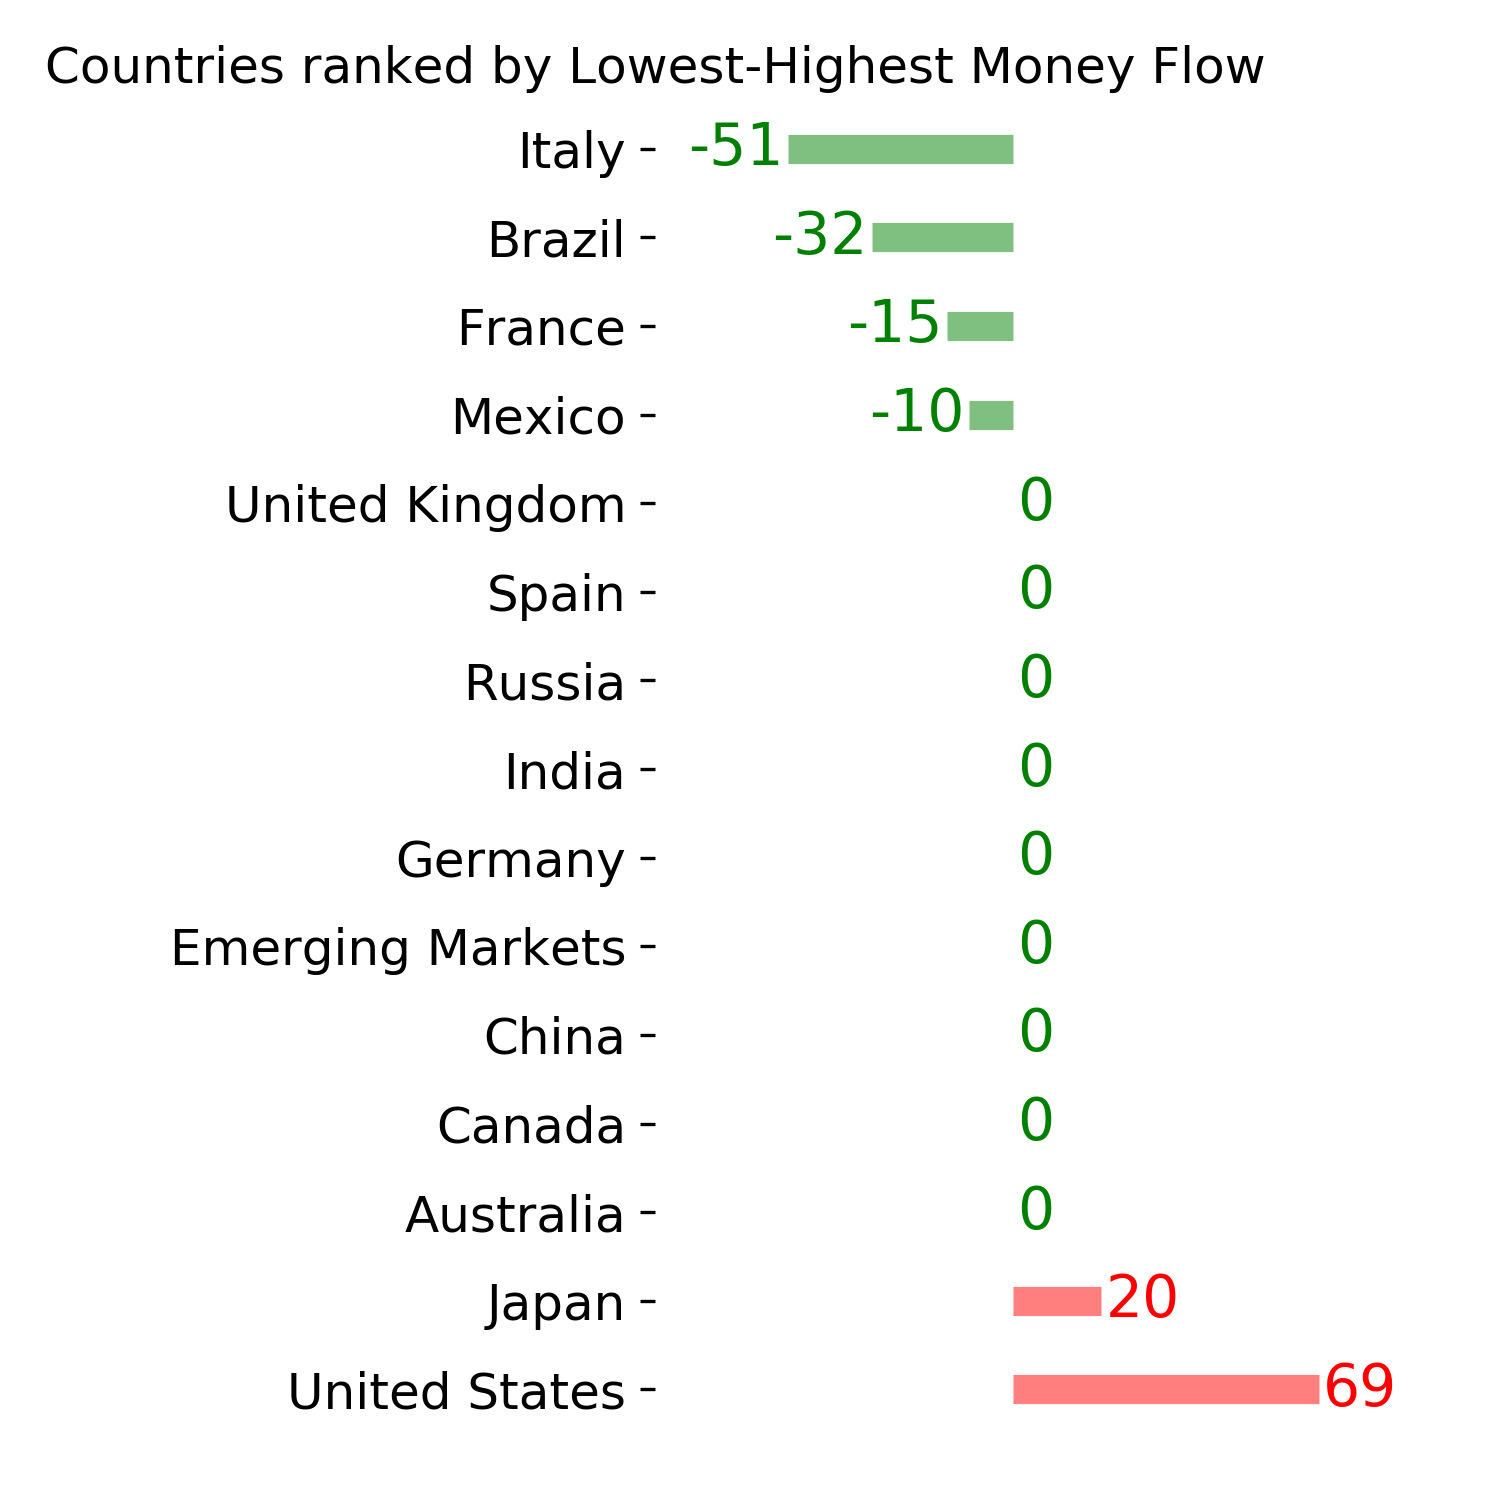
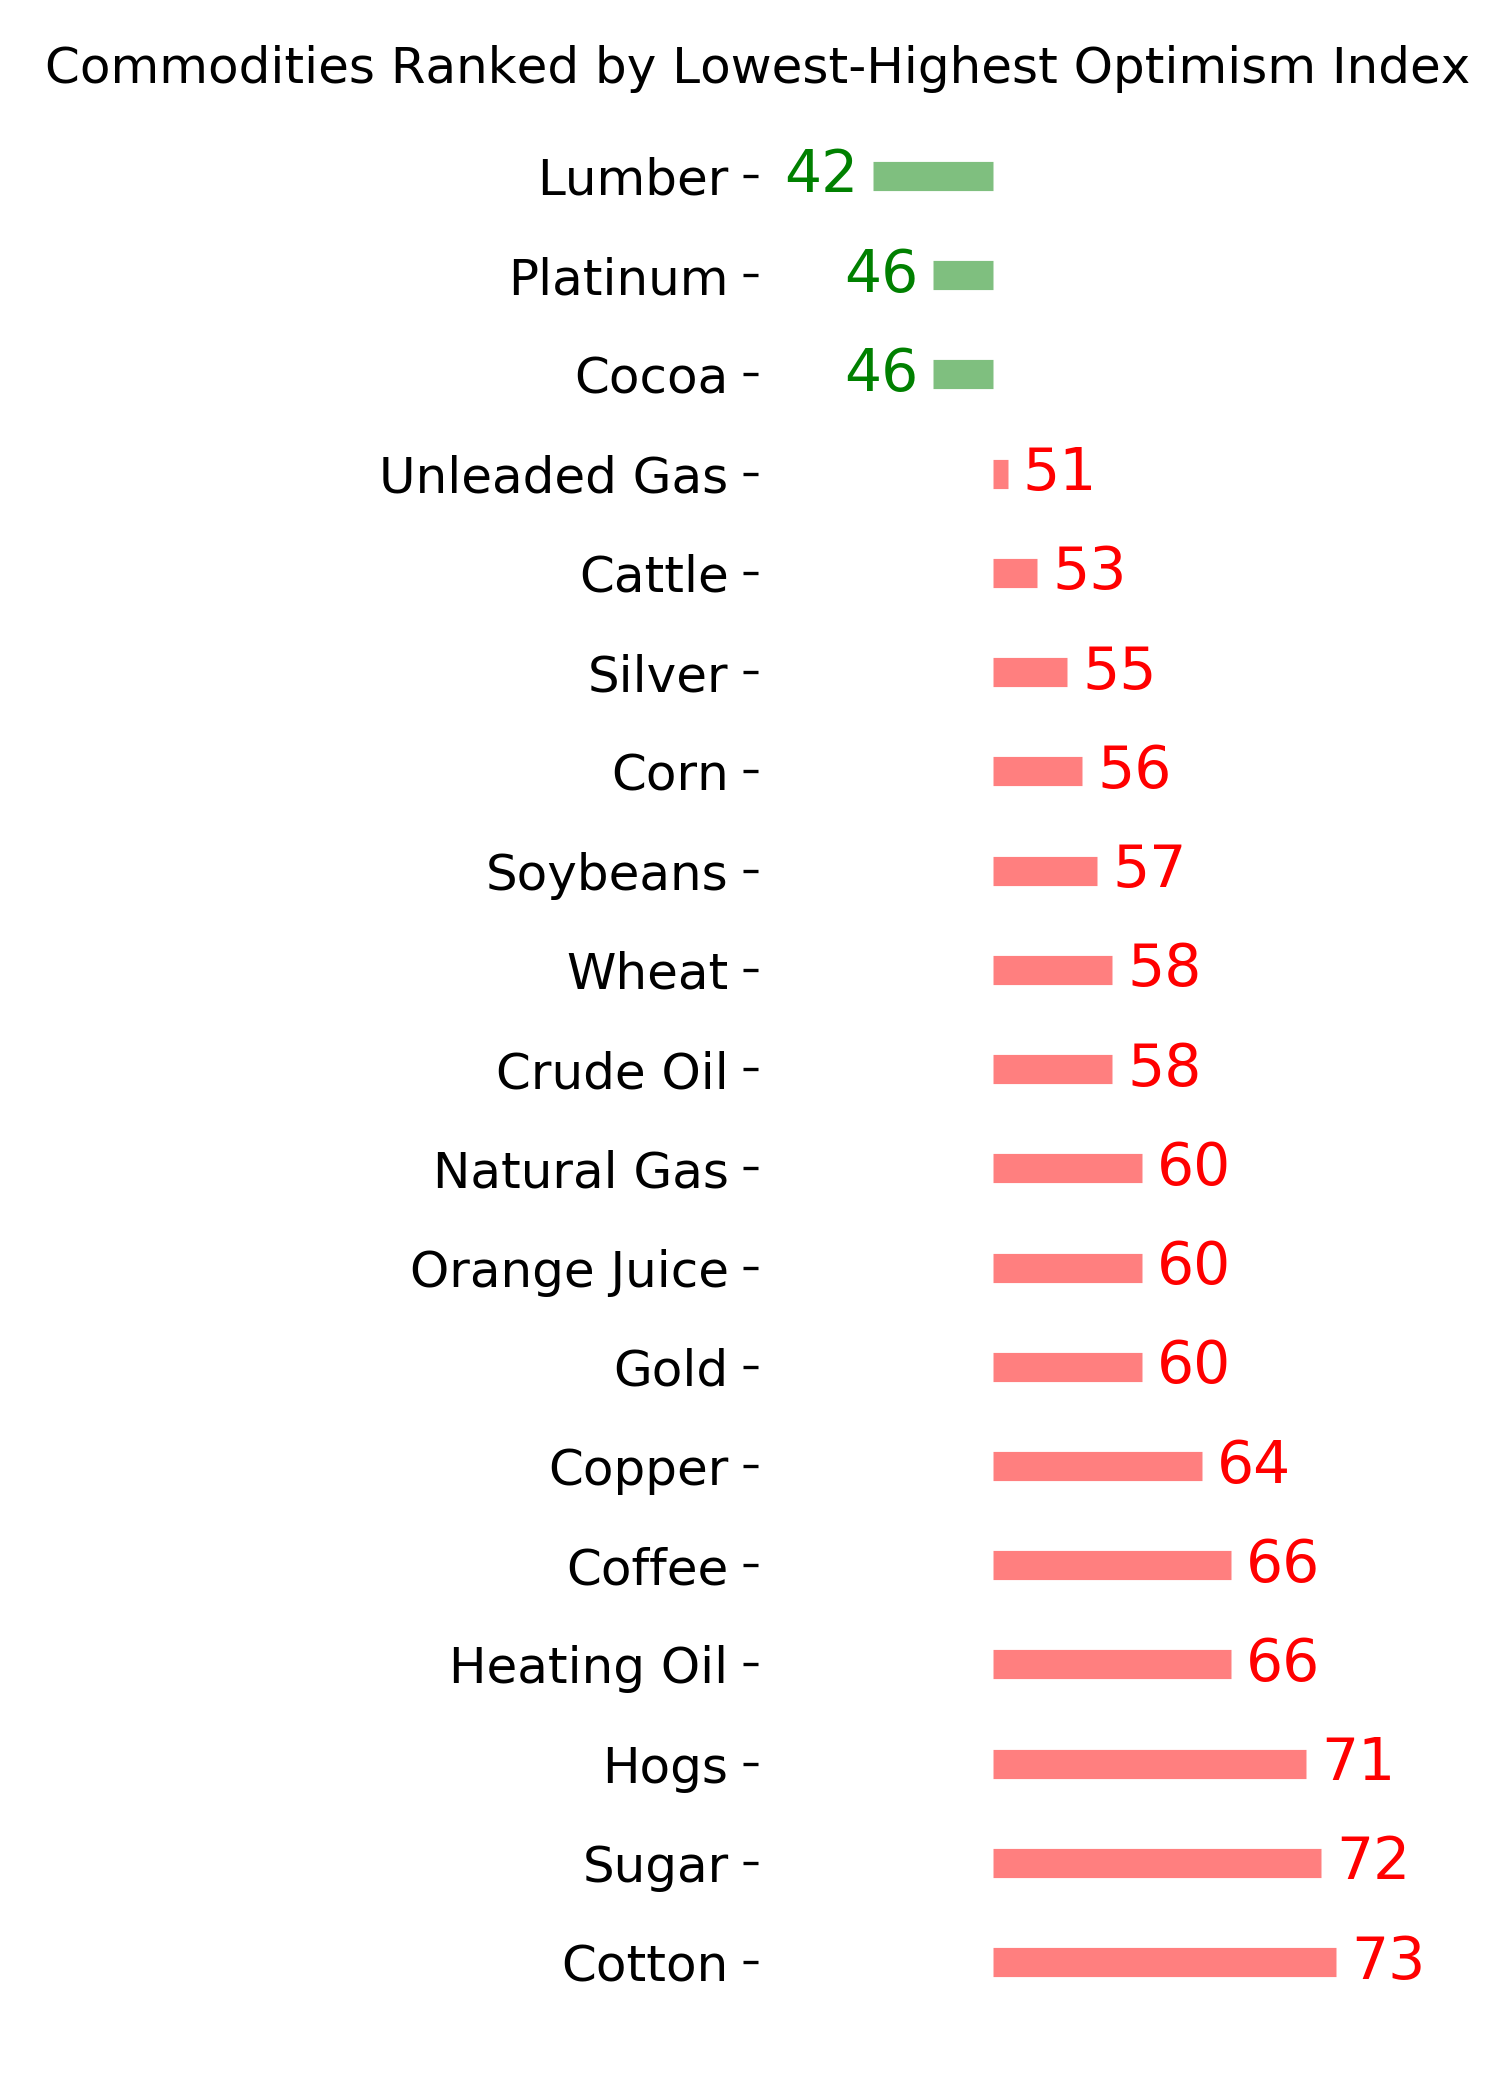
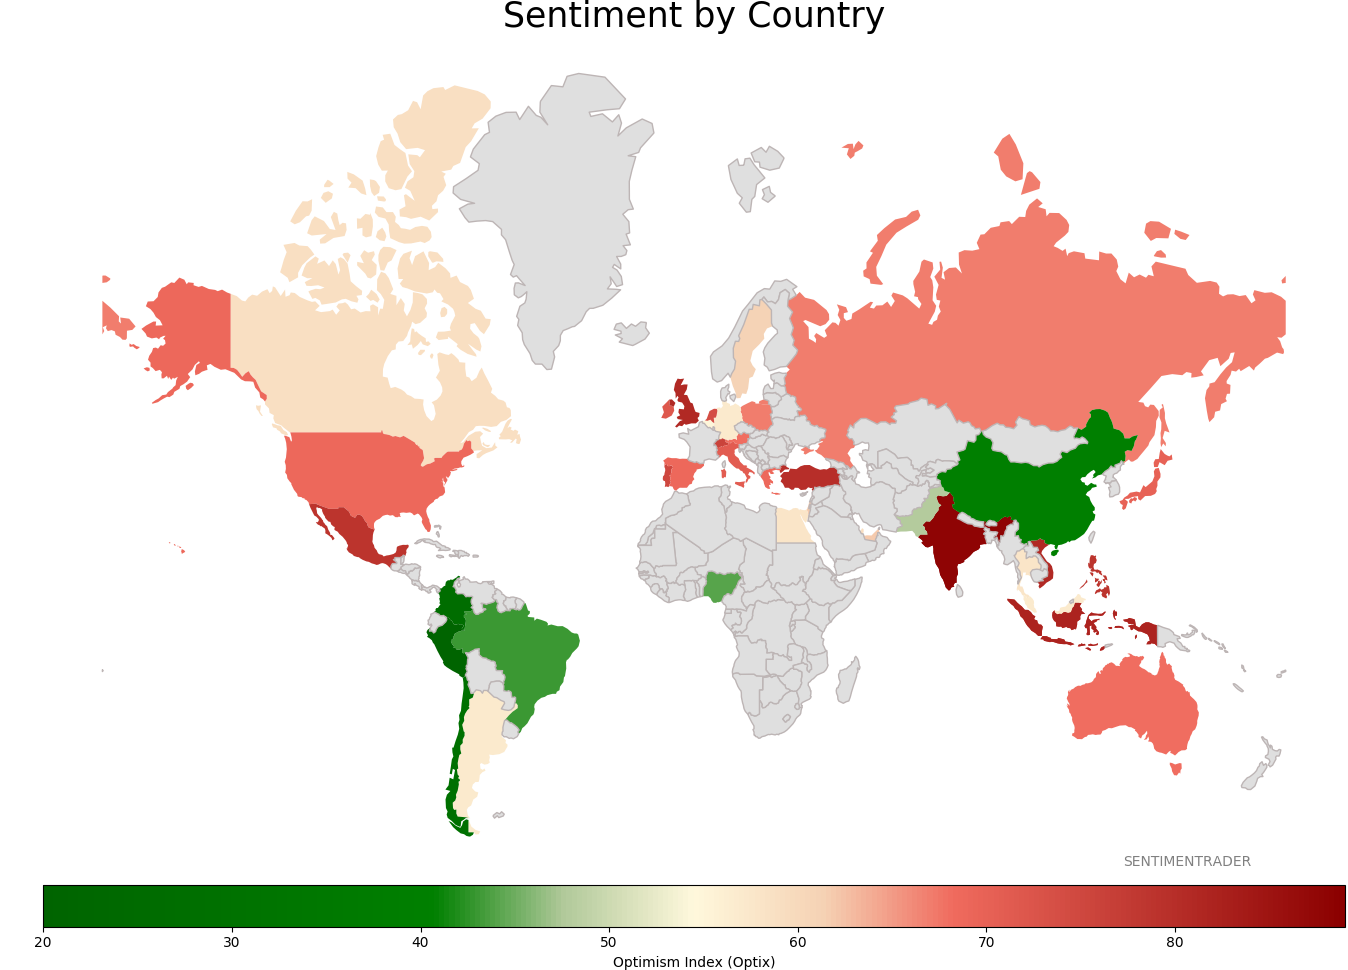
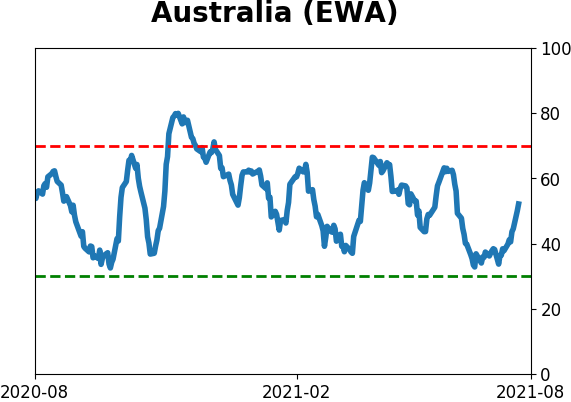
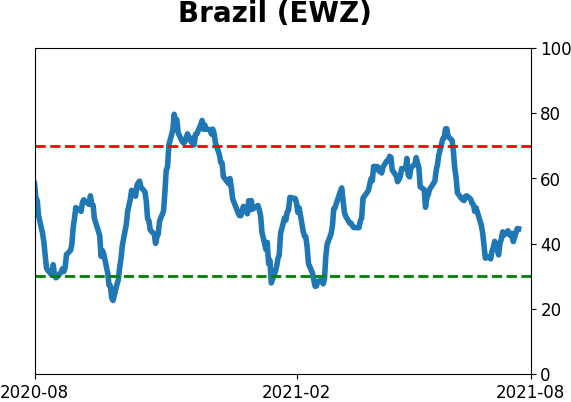
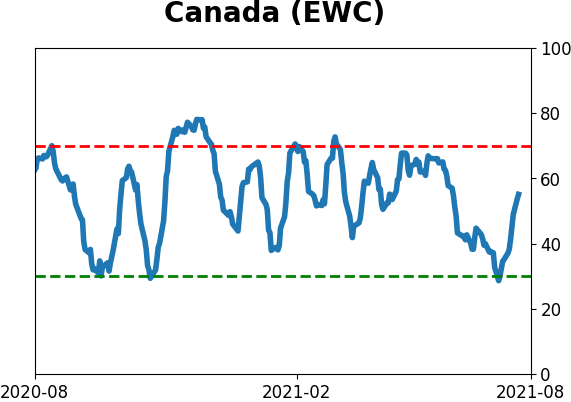
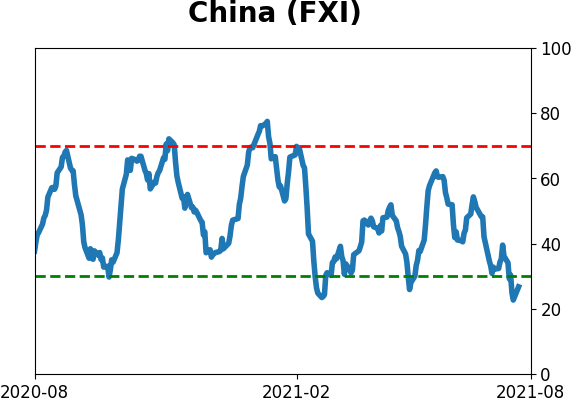
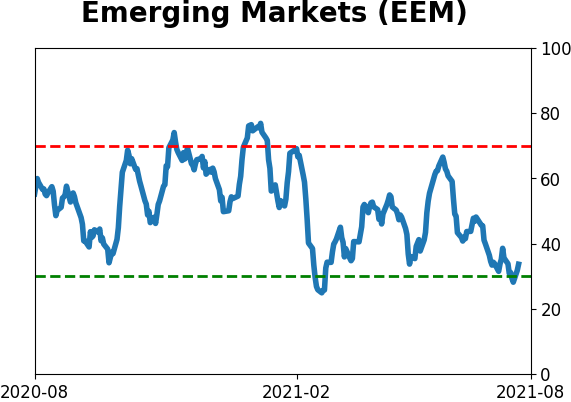
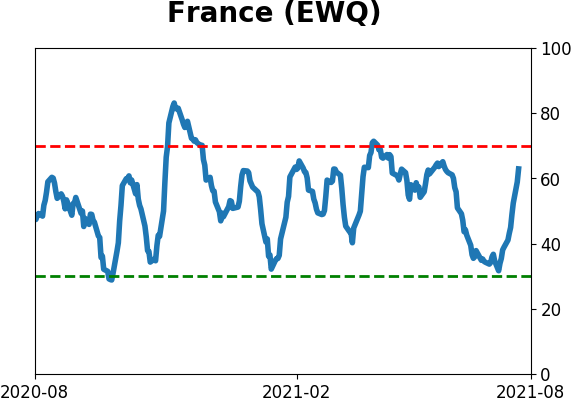
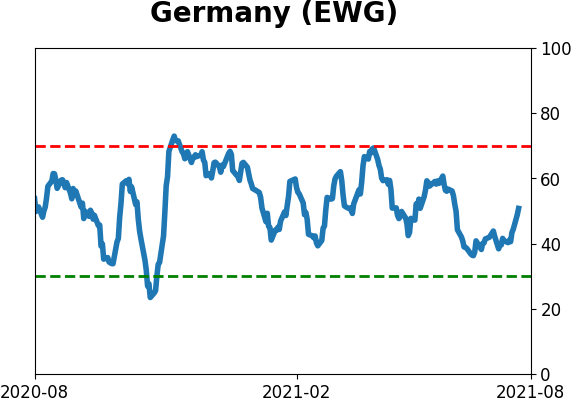
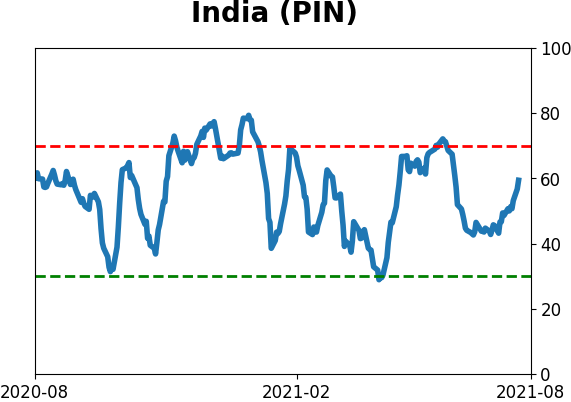
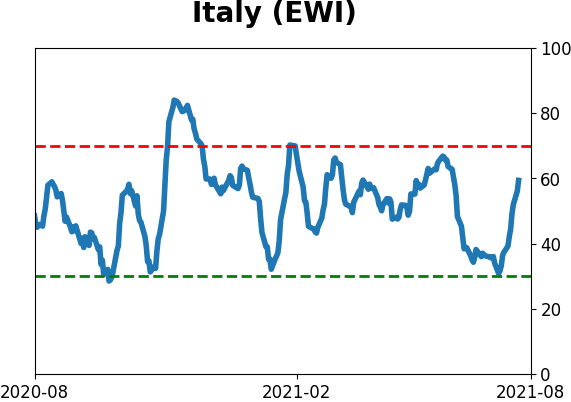
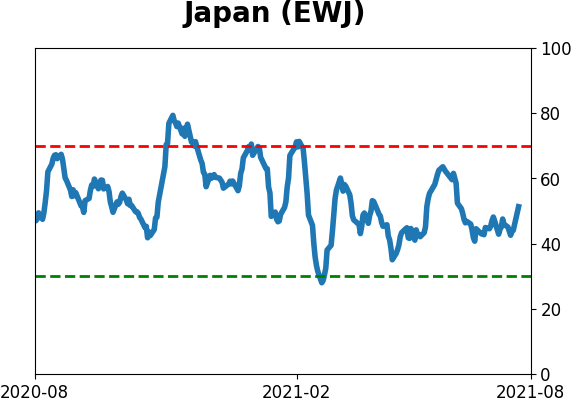
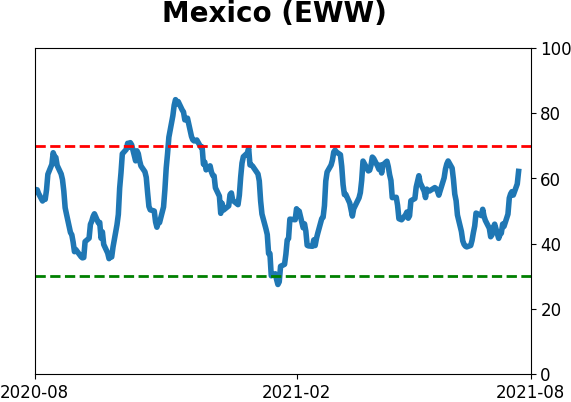
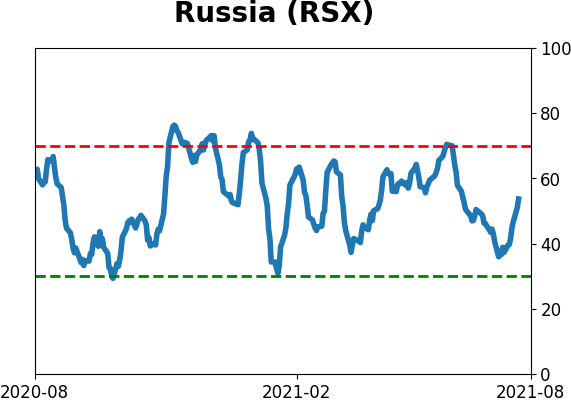
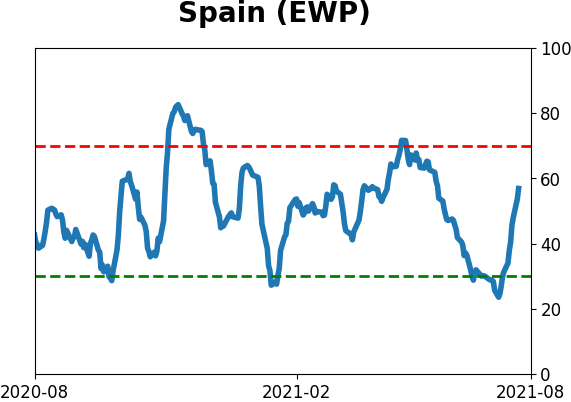
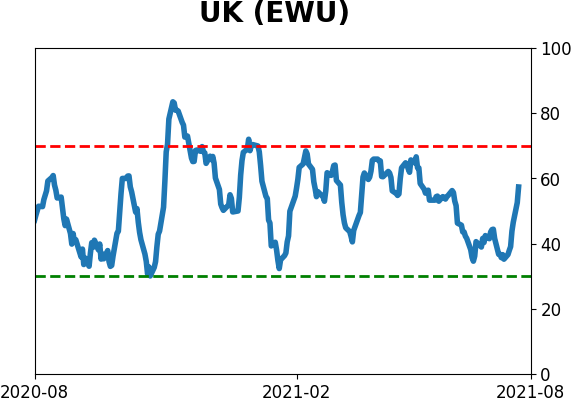
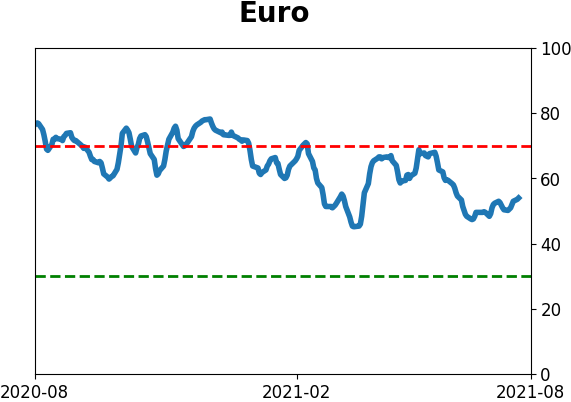
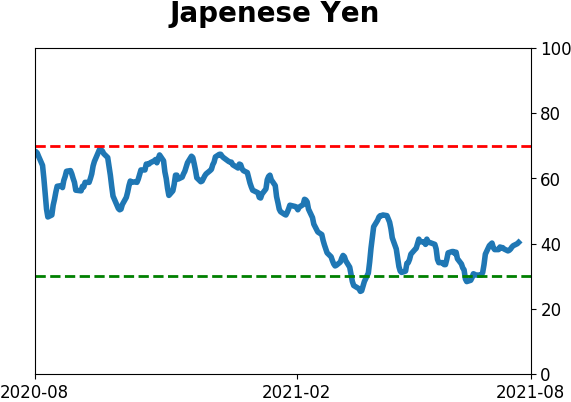
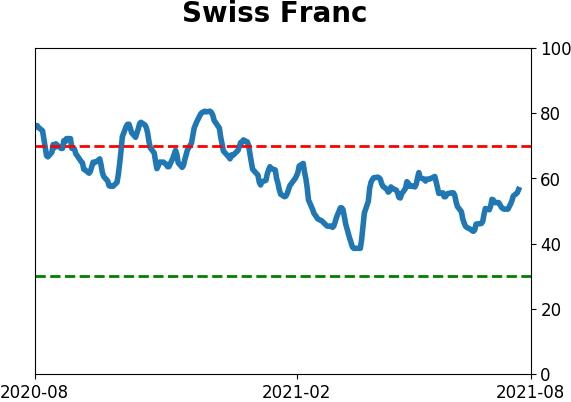
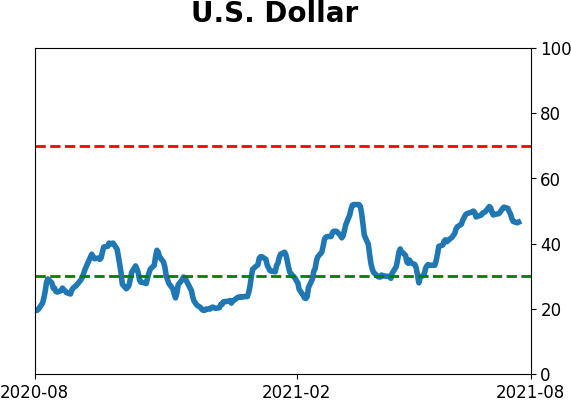
Sentiment Around The World
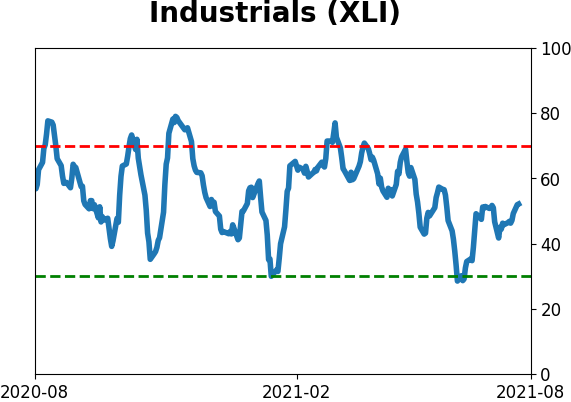
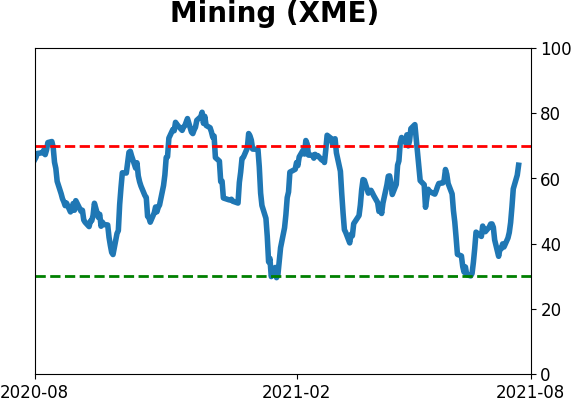
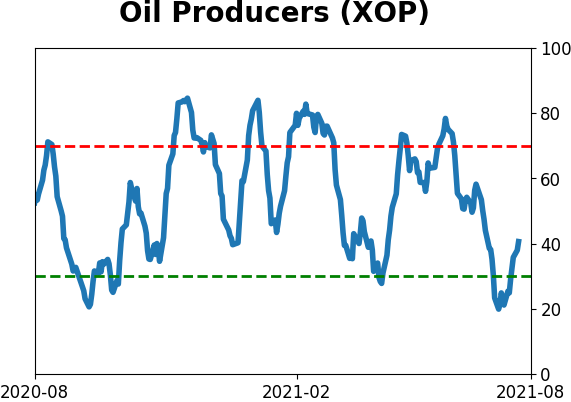
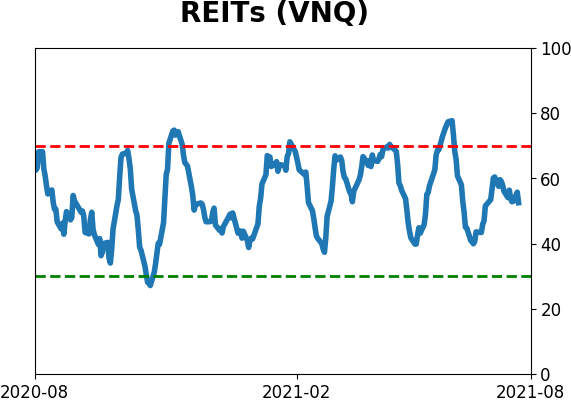
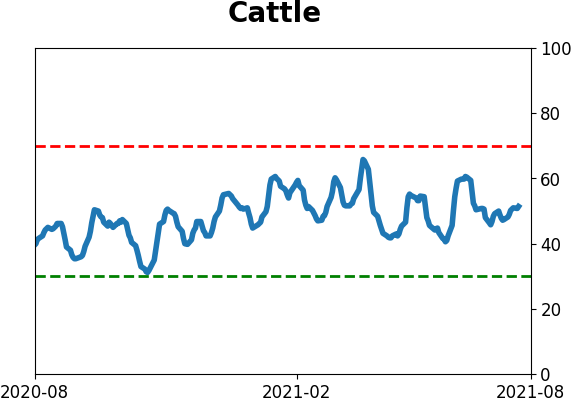
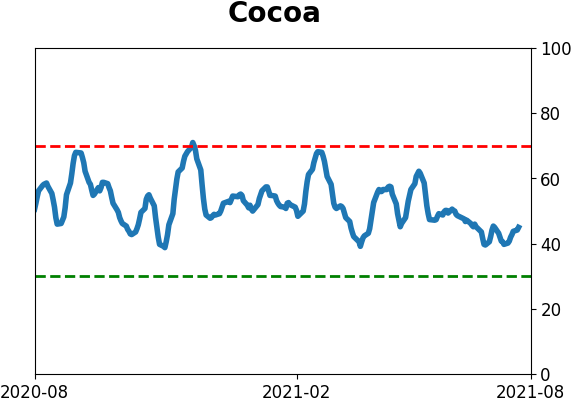
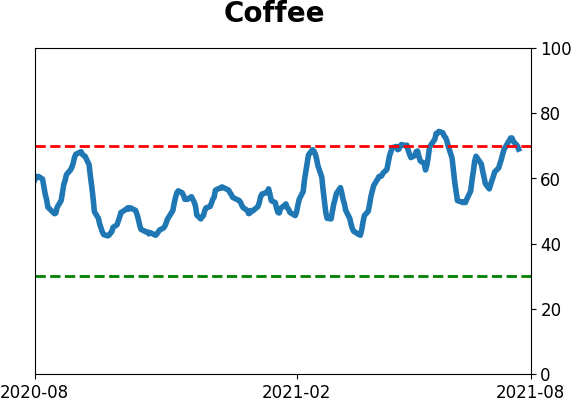
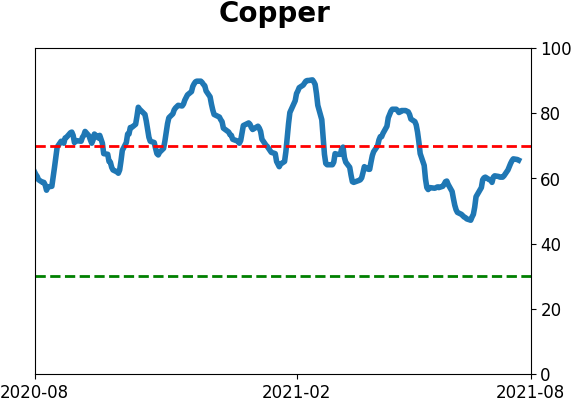
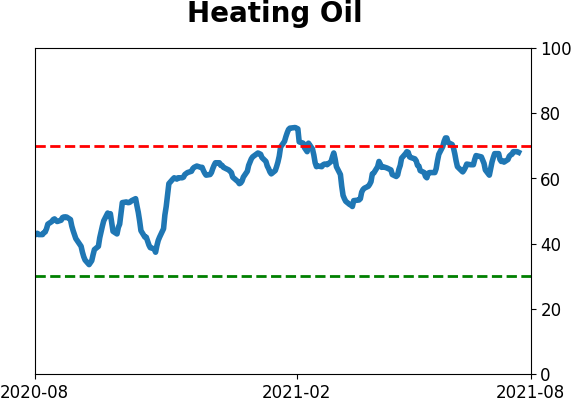
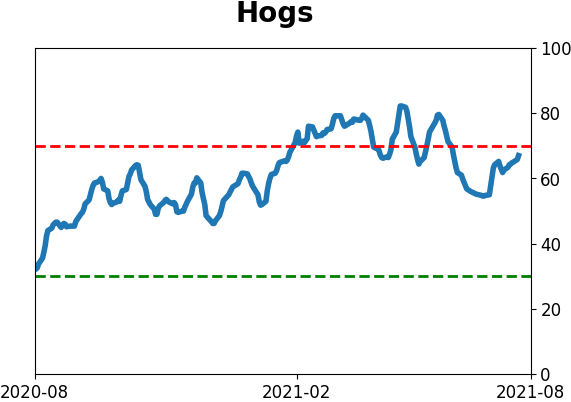
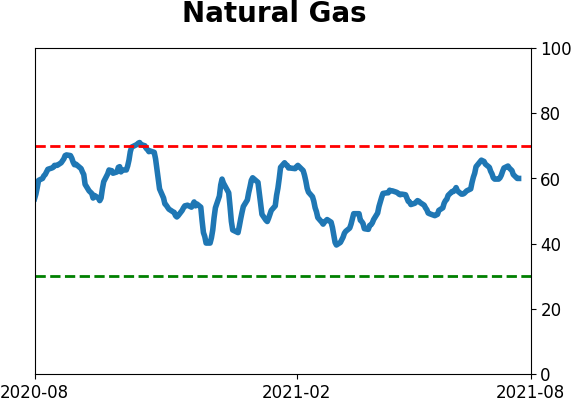
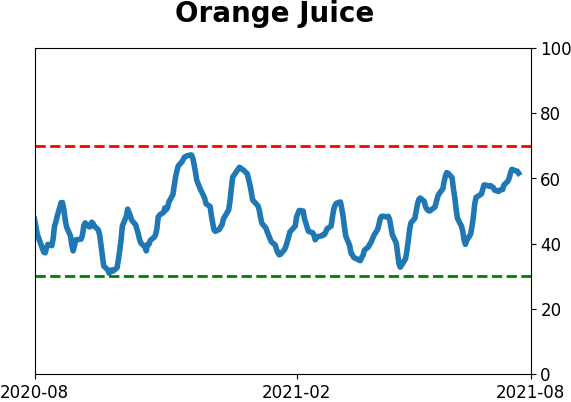
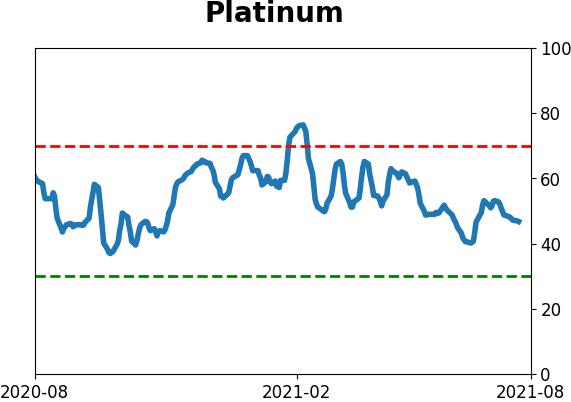
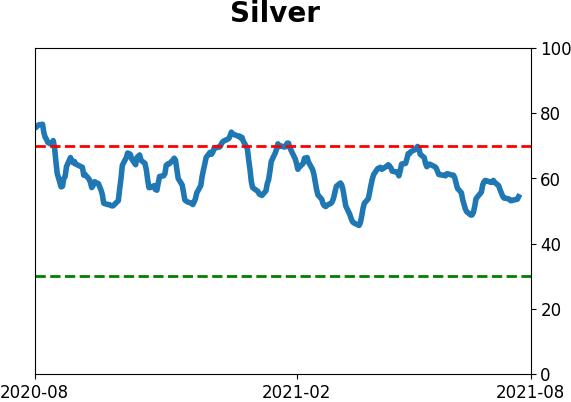
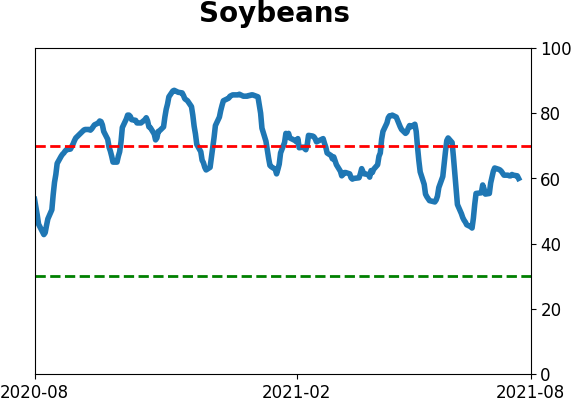
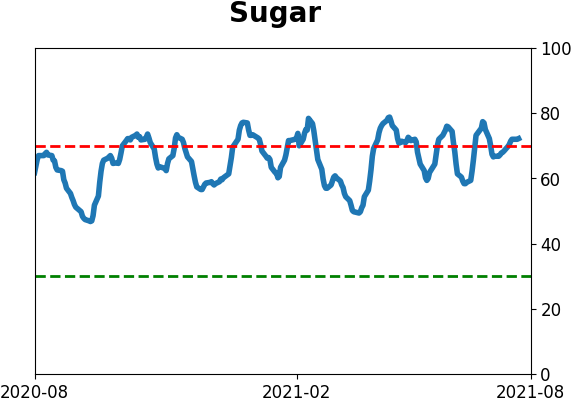
Optimism Index Thumbnails
|
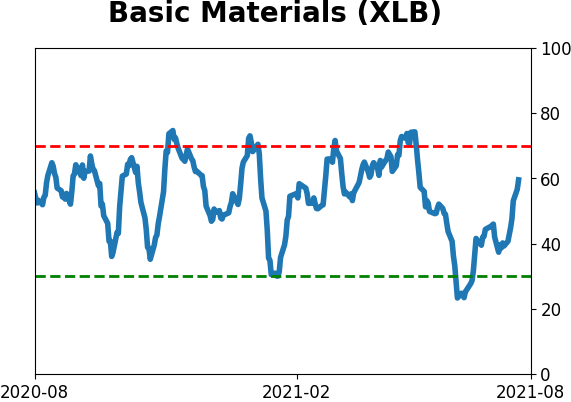
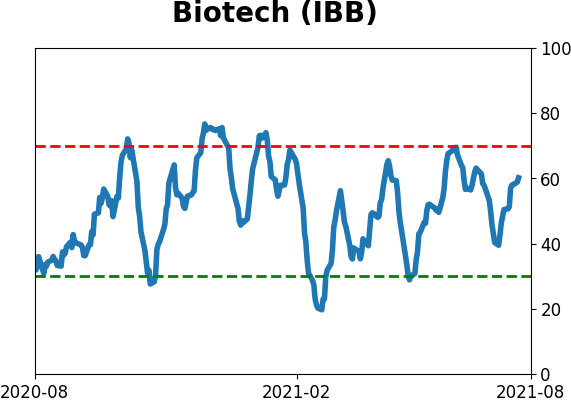
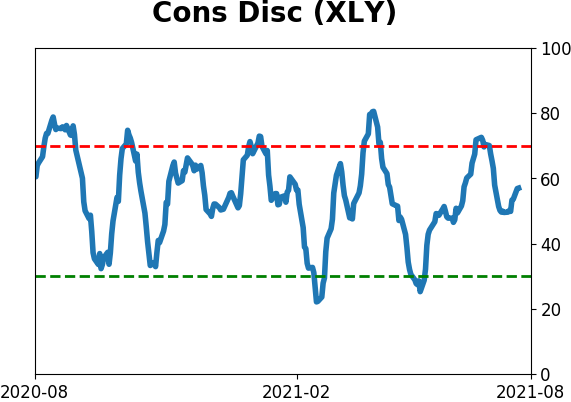
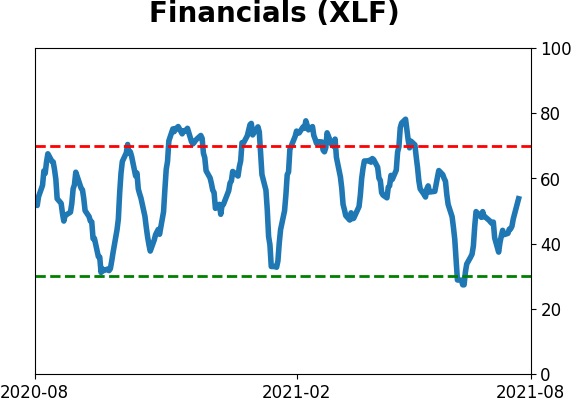
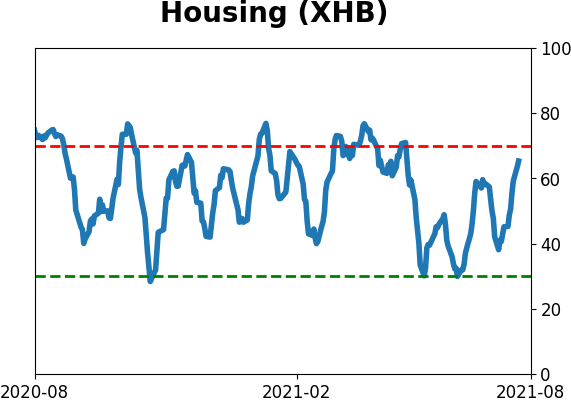
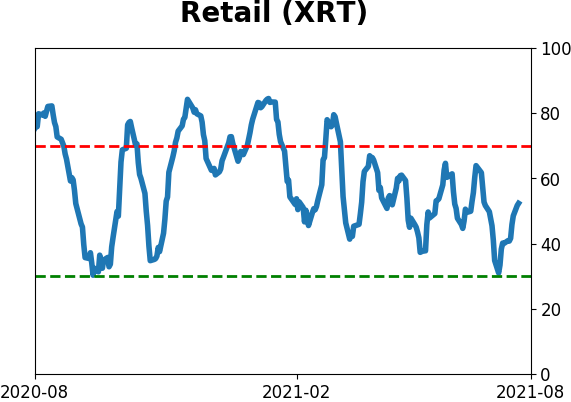
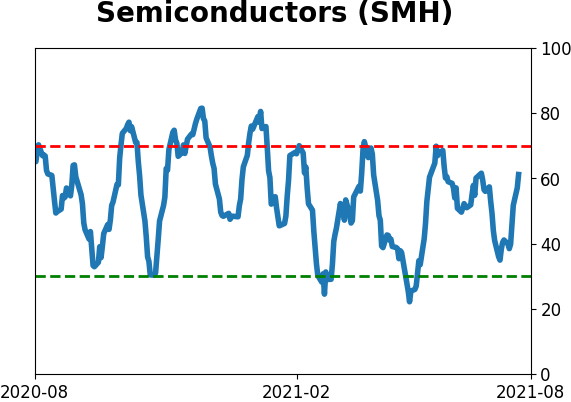
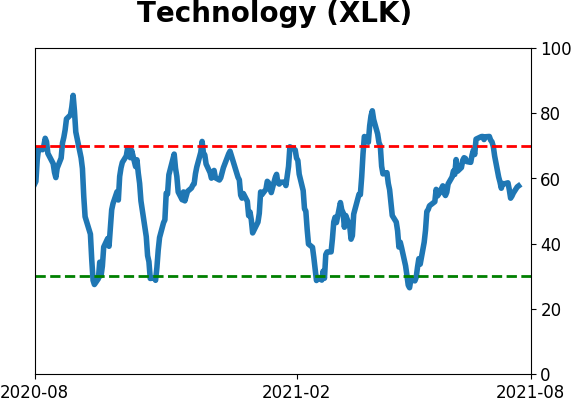
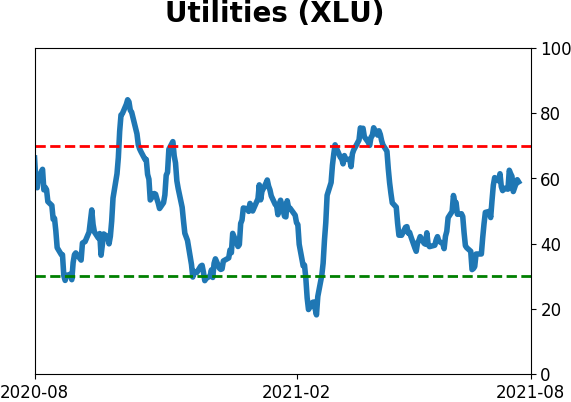
Sector ETF's - 10-Day Moving Average
|
|
|
Country ETF's - 10-Day Moving Average
|
|
|
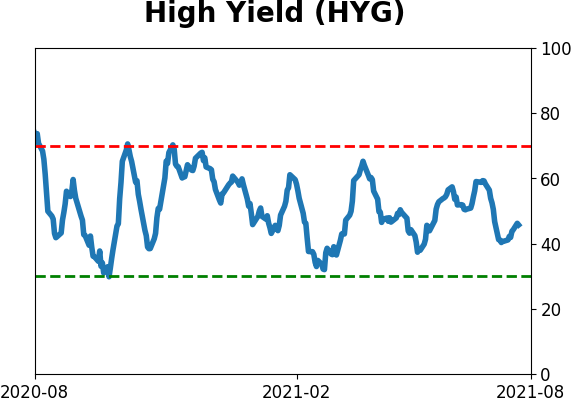
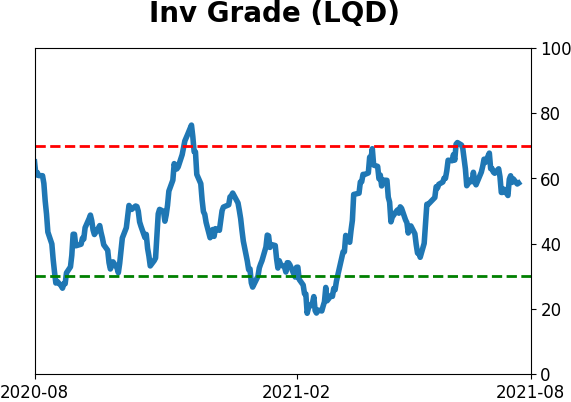
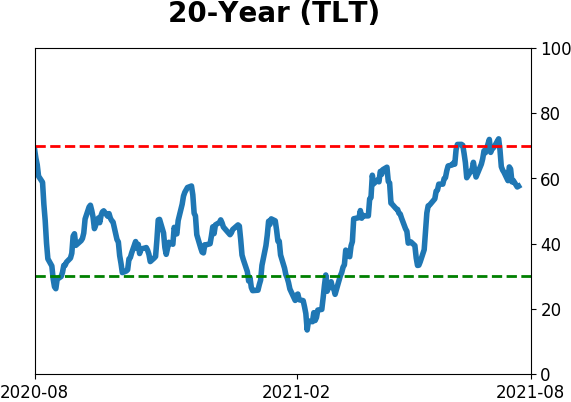
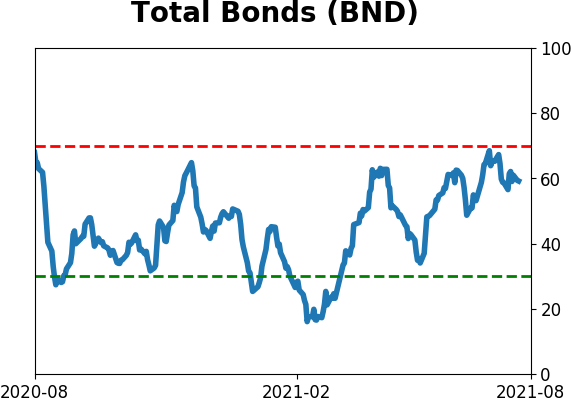
Bond ETF's - 10-Day Moving Average
|
|
|
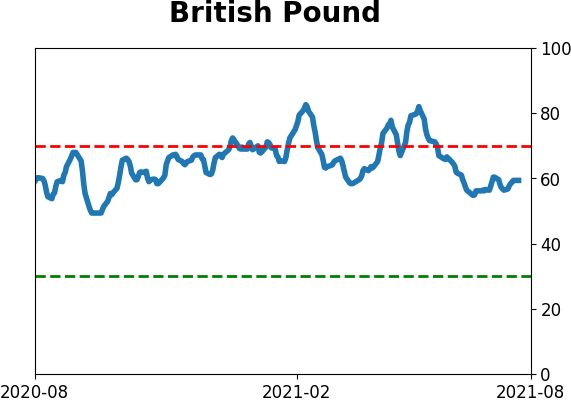
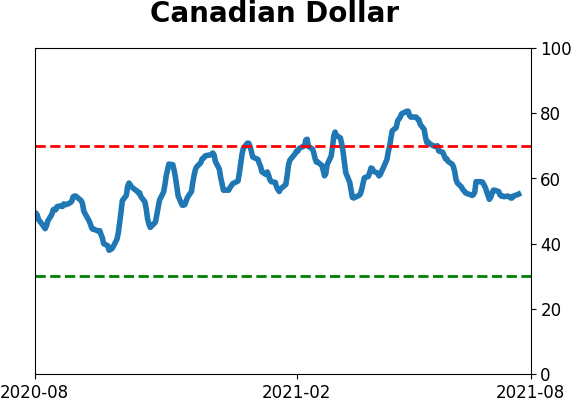
Currency ETF's - 5-Day Moving Average
|
|
|
Commodity ETF's - 5-Day Moving Average
|
|