Headlines
|
|
Uptrends in S&P 500 stocks stage an impressive recovery:
The S&P 500 enjoyed its best monthly gain in over a year after suffering a large drawdown, which is price action typically seen at the ends of bear markets. Within the index, more than 75% of member stocks are in medium-term uptrends, a sharp recovery from what had been fewer than 5% of stocks. That preceded gains 100% of the time.
|
Smart / Dumb Money Confidence
|
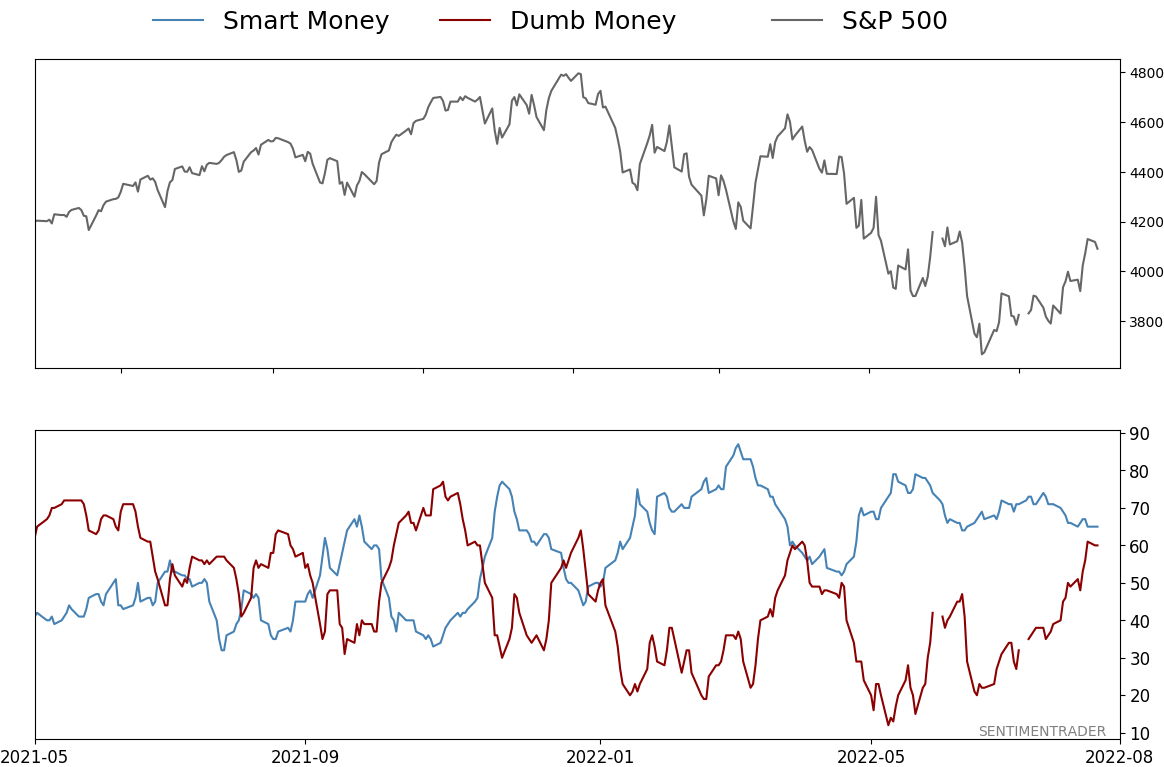
Smart Money Confidence: 65%
Dumb Money Confidence: 60%
|
|
Risk Levels
Stocks Short-Term
|
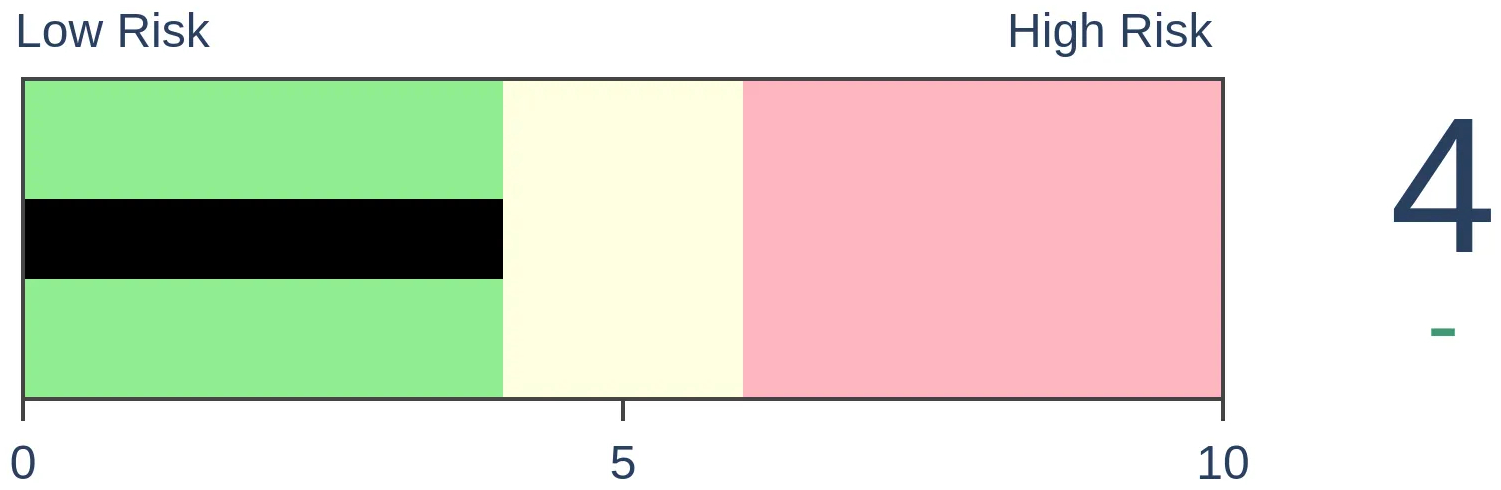
Stocks Medium-Term
|
|
Bonds

|
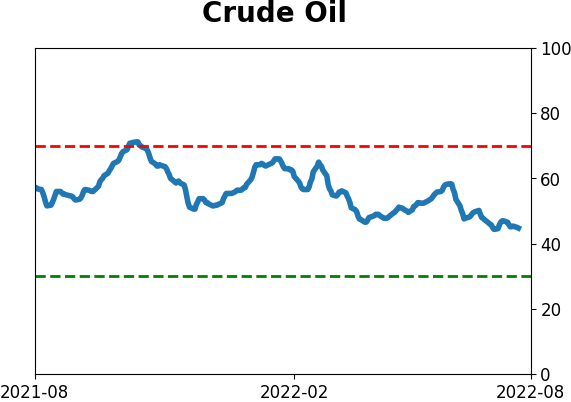
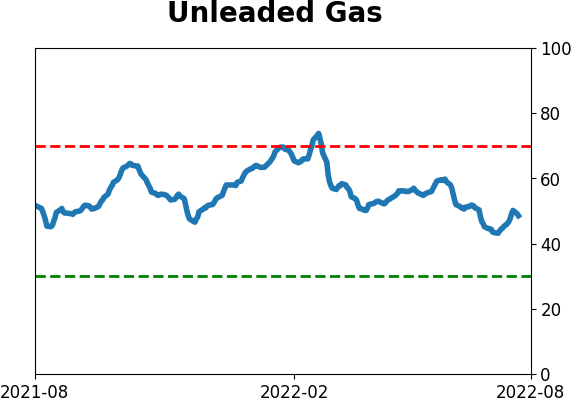
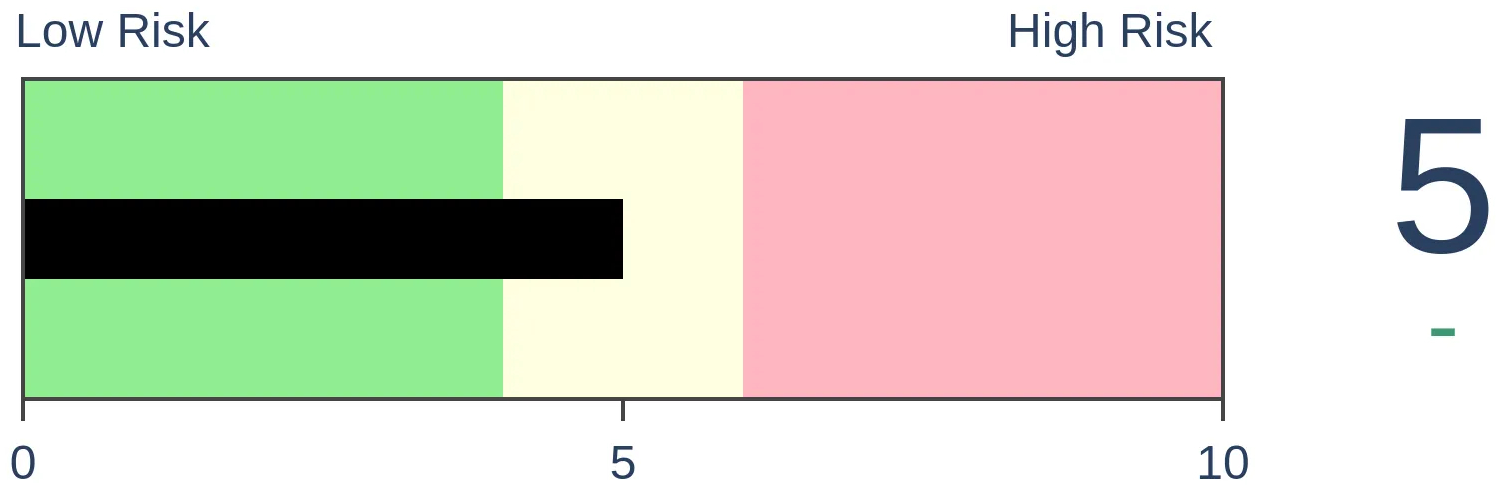
Crude Oil
|
|
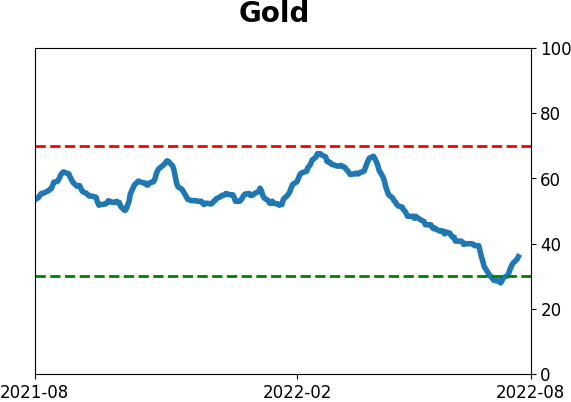
Gold

|
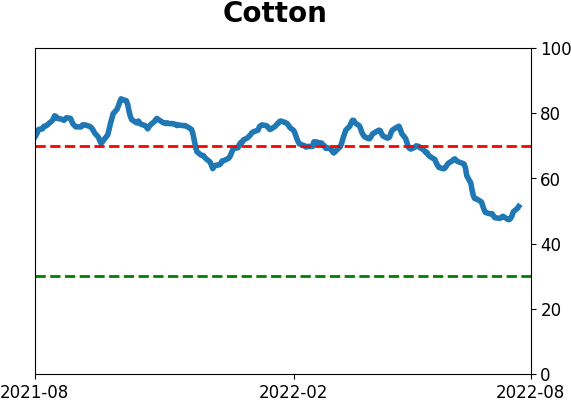
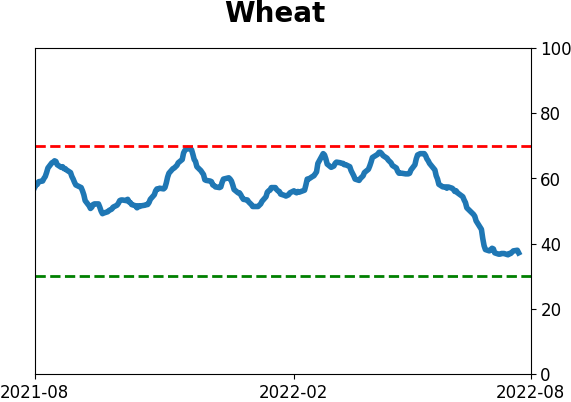
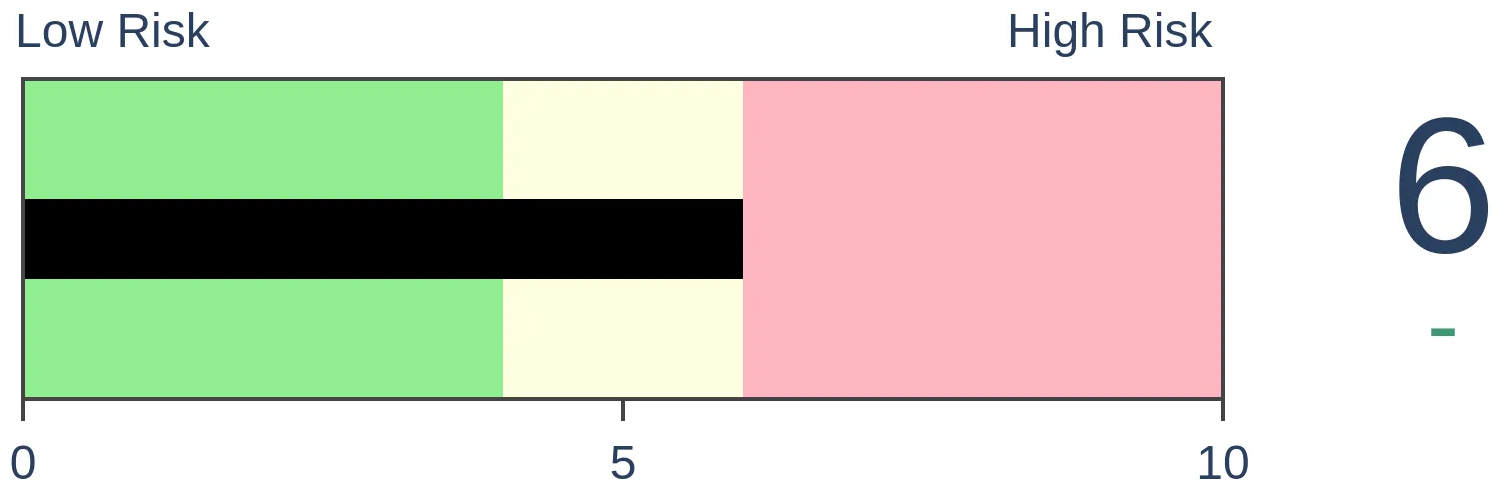
Agriculture

|
|
Research
By Jason Goepfert
BOTTOM LINE
The S&P 500 enjoyed its best monthly gain in over a year after suffering a large drawdown, which is price action typically seen at the ends of bear markets. Within the index, more than 75% of member stocks are in medium-term uptrends, a sharp recovery from what had been fewer than 5% of stocks. That preceded gains 100% of the time.
FORECAST / TIMEFRAME
SPY -- Up, Long-Term
|
Key points:
- Fewer than 5% of stocks in the S&P 500 were in medium-term uptrends in June
- Uptrends have since surged to more than 75% of stocks, a cycle that preceded year-long gains
- The index sported its best monthly gain in over a year after a 20% drawdown, typically seen at the ends of bear markets
From nay to yay
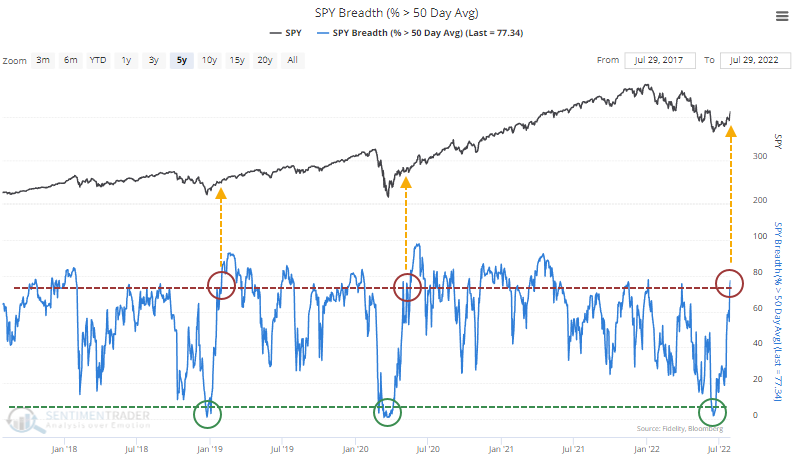
A little over a month ago, we looked at the internal recovery among stocks in the S&P 500 after a string of violent moves. Similar behavior preceded excellent returns. It's only gotten better since then.
With a continued rise last week, more than three out of every four stocks in the index recovered above their 50-day moving averages, the most since the beginning of the year. The other two times in the past five years, when this cycled from fewer than 5% of stocks to more than 75%, it coincided with the kick-off to sustained rises.
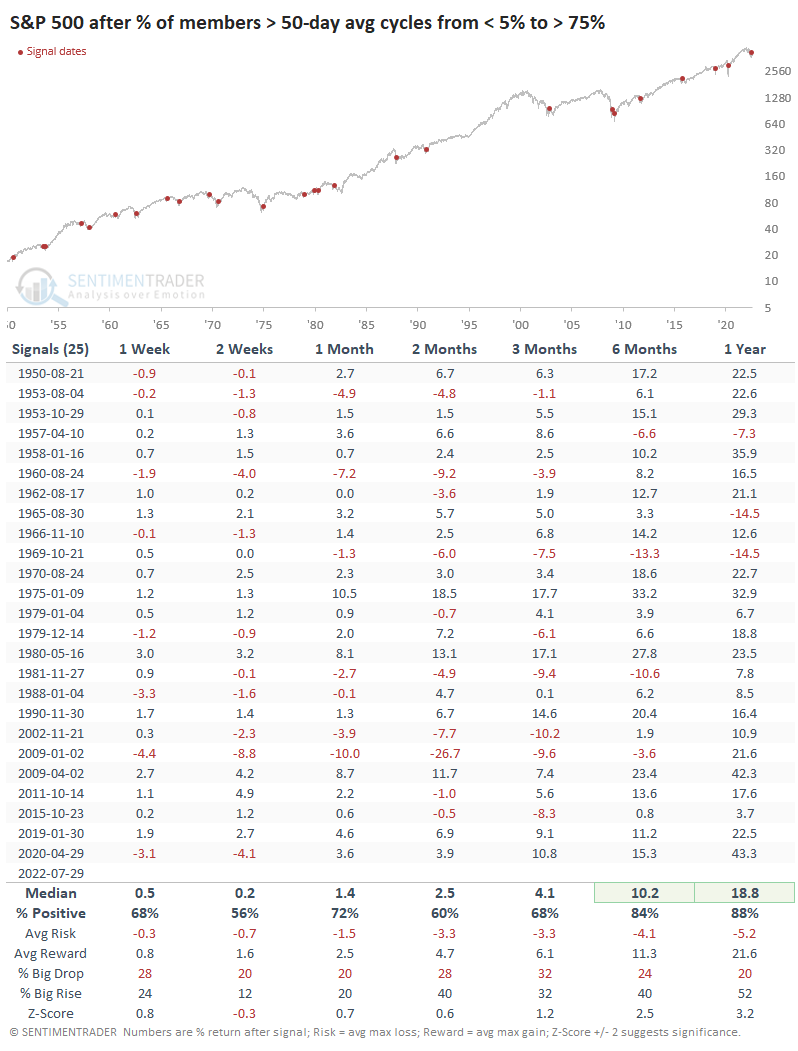
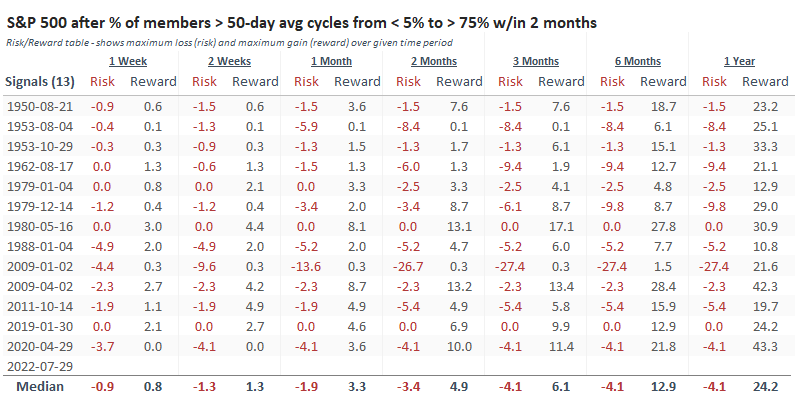
Historically, this was more the rule than the exception. Since 1950, there have been 25 times when medium-term uptrends in S&P 500 stocks plunged to an extremely low level and then recovered to a high level. Over the next 6-12 months, losses were rare, and there was really only one complete failure in 1969.
The current cycle is even more notable because of how quickly it unfolded. It took only 27 trading days for stocks to recover, the 6th-fastest cycle in more than 70 years. The table below filters the cycles to include only those triggered within two months. The following 6-12 months showed excellent returns, with no losses a year later.
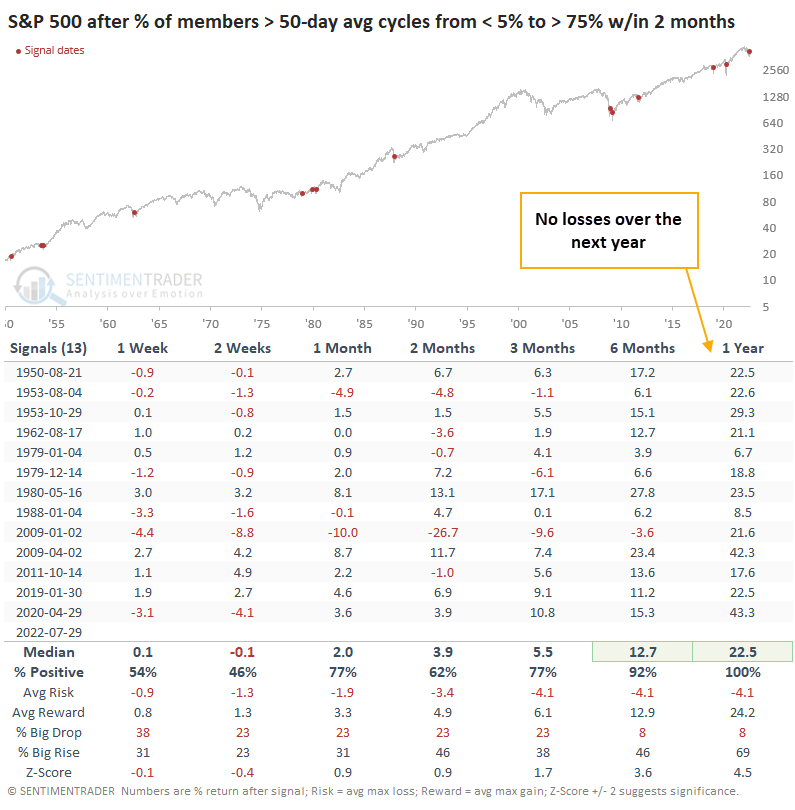
It took some grit for an investor to hold after the January 2009 signal, suffering a nearly 30% drawdown within the first three months. That was the only one that an investor would have hold through a double-digit drawdown. On the flip side, all but two signals enjoyed a gain of 20% or more at the best point during the next year (okay, it was 19.7% in 2011, but close enough).
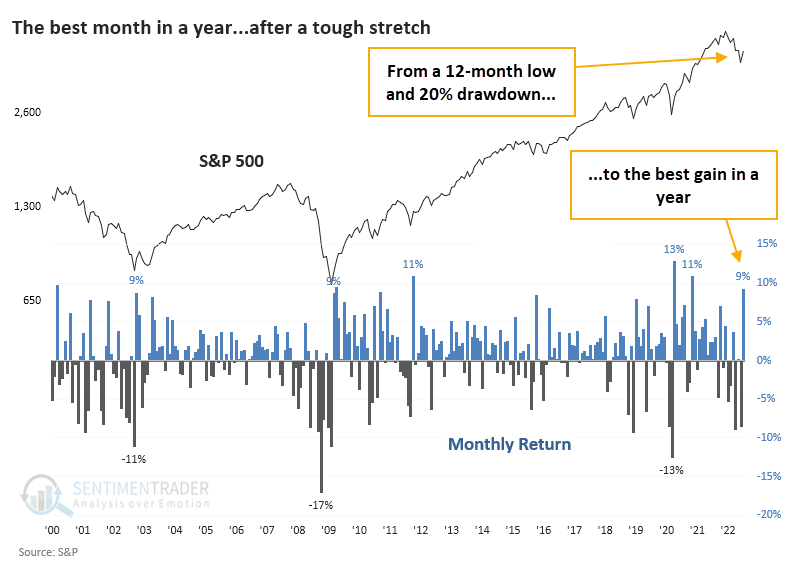
The index made an impressive recovery, too
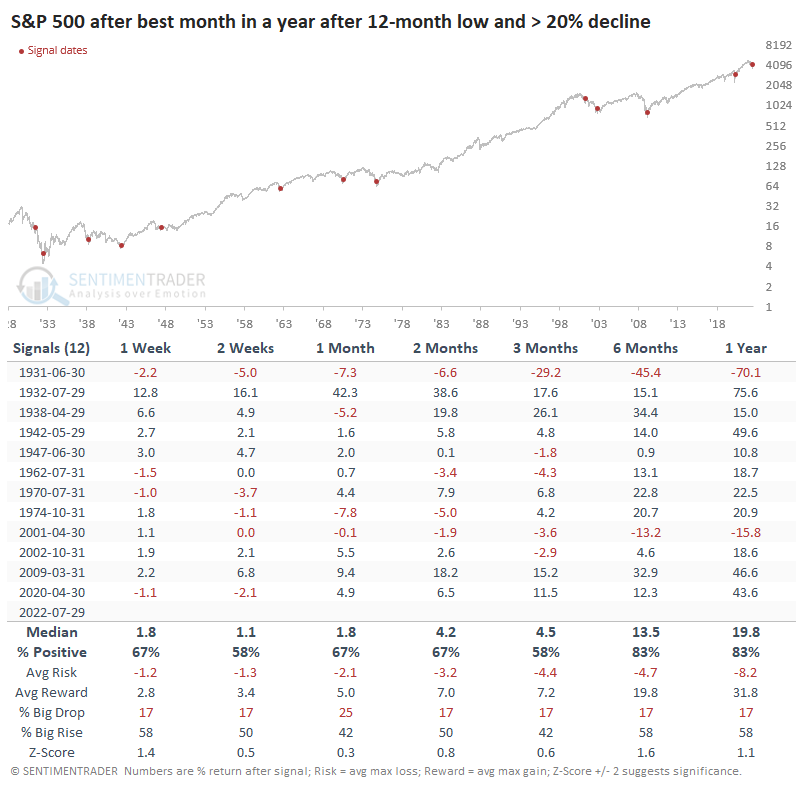
The stock recovery helped propel the index to its best monthly gain in almost two years. That relief was welcome, as it came on the heels of a 12-month low and a 20% drawdown.
Similar behavior mainly occurred at the ends of bear markets. There were two exceptions, in 1931 and 2001, both of which failed almost immediately. The others may have some shorter-term weakness, but the losses tended to be limited. Over the next 6-12 months, returns and maximum gains were excellent.
What the research tells us...
The setup was ripe for at least a bear market rally in late June. Sentiment was about as bad as it gets, for as long as it gets before dip-buyers tend to step in. And they did, aggressively. That triggered some thrust-y signals a month ago, and unlike others over the past six months, buyers persisted and triggered even more compelling signals. It's another sign that this recovery should have legs.
Indicators at Extremes
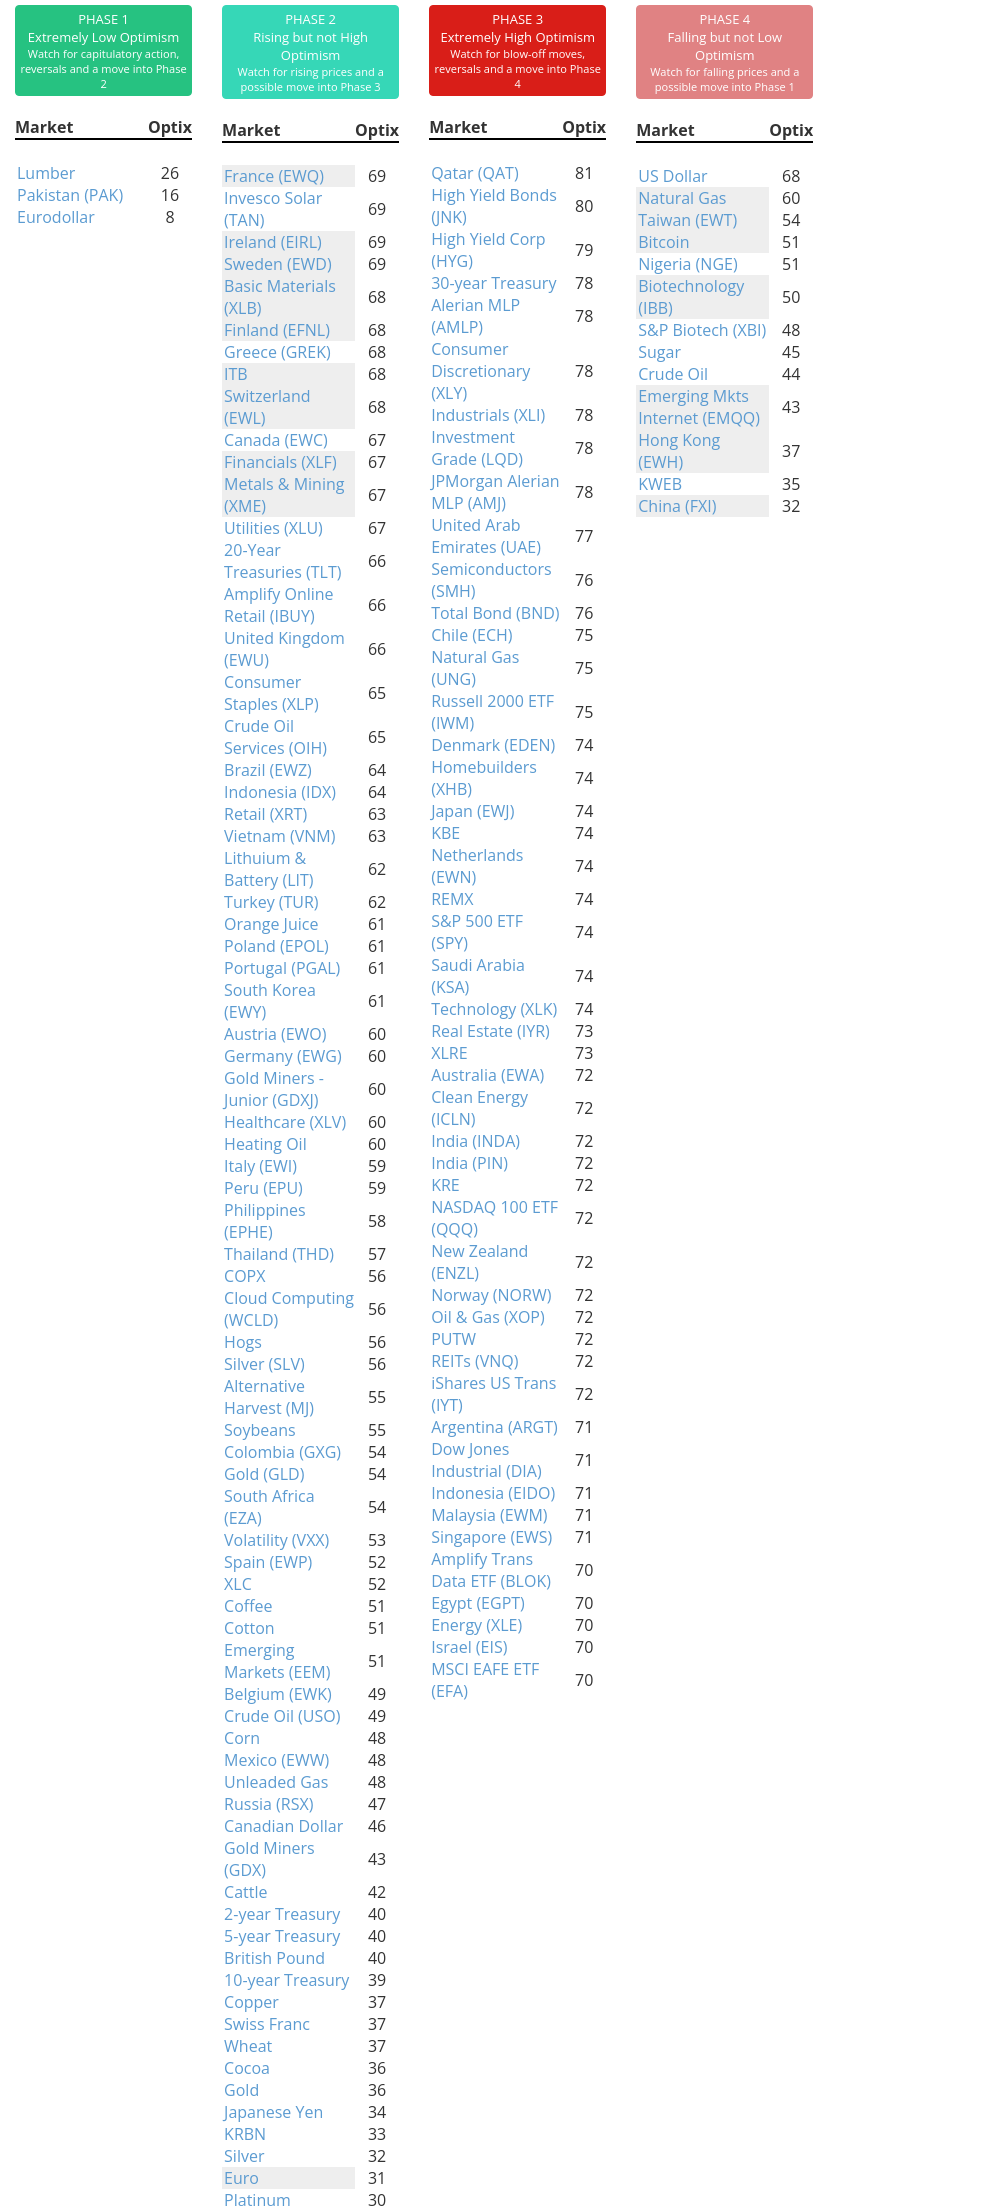
Phase Table
Ranks
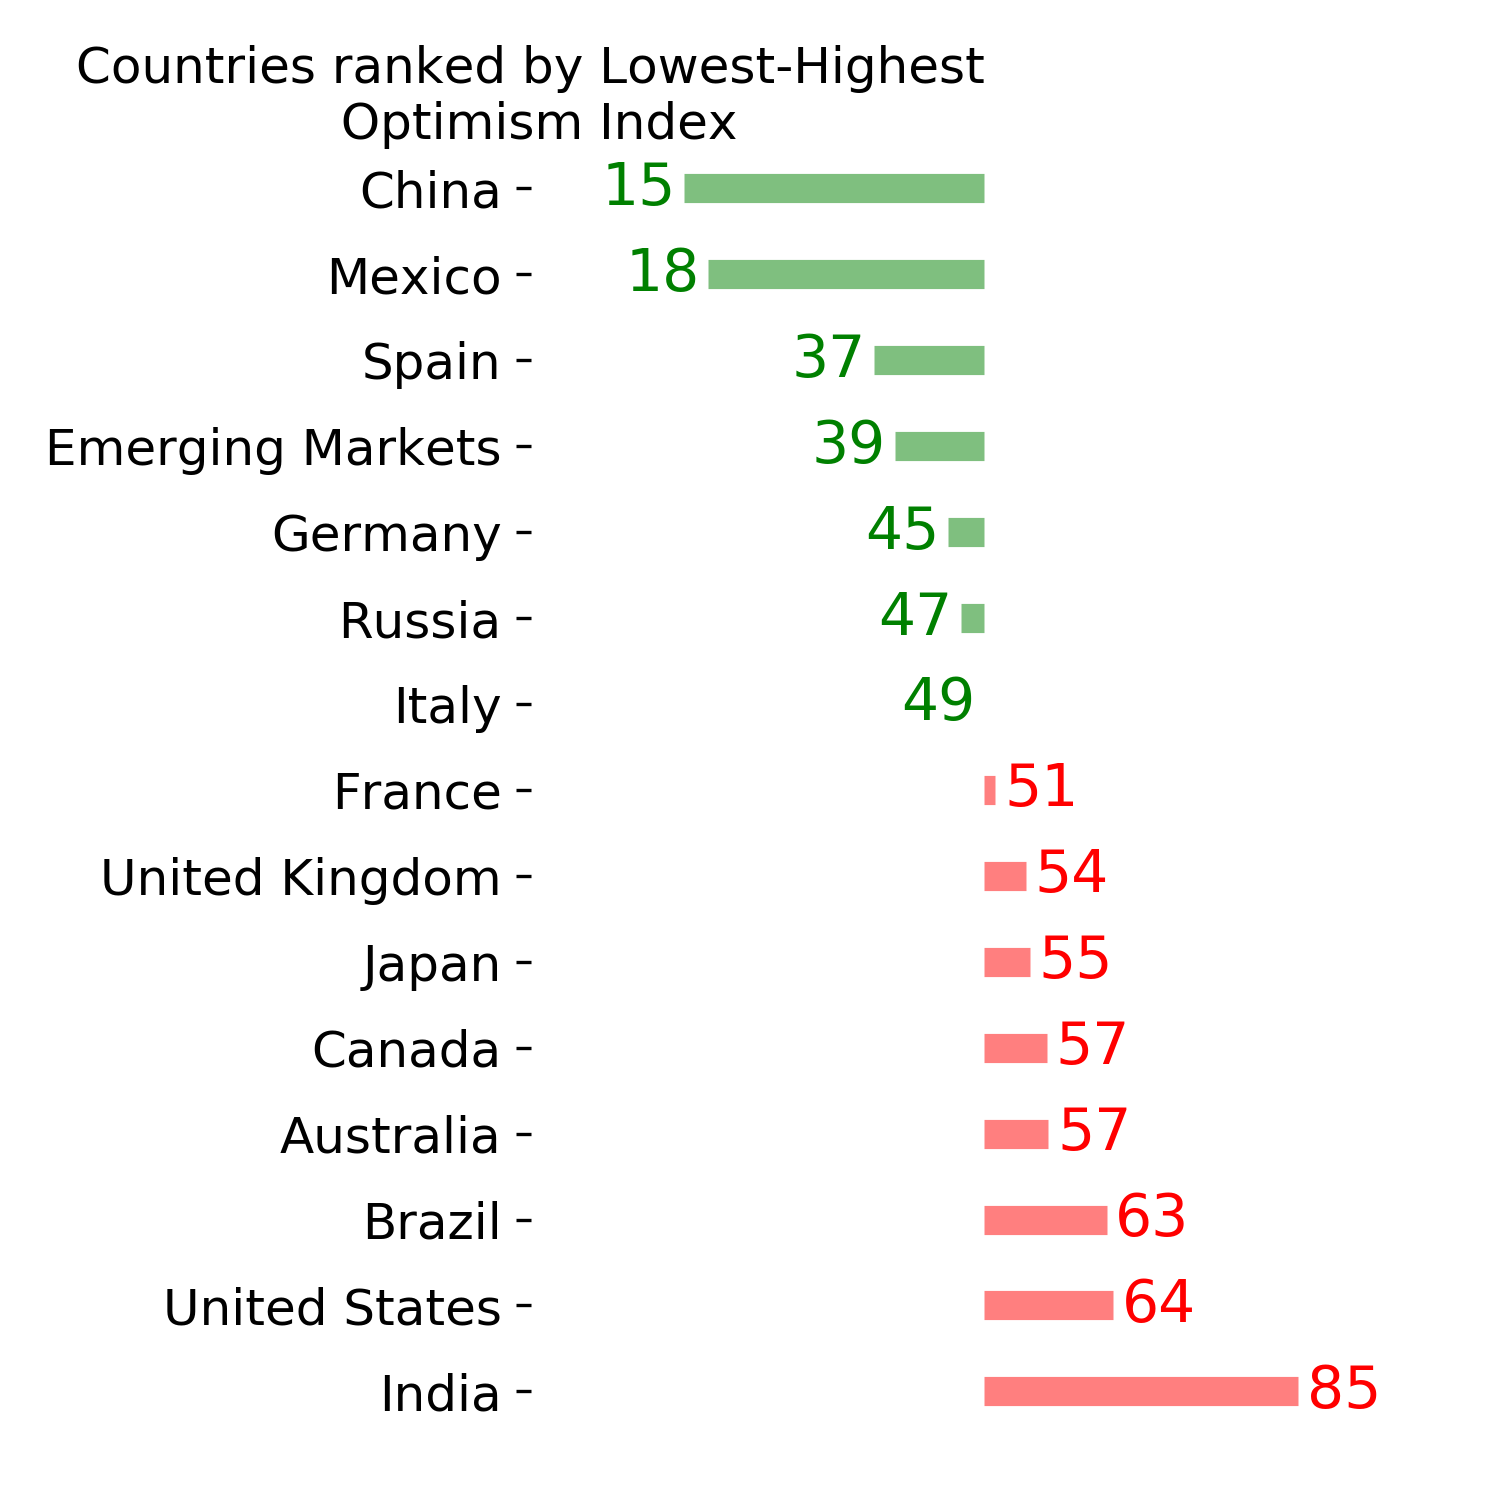
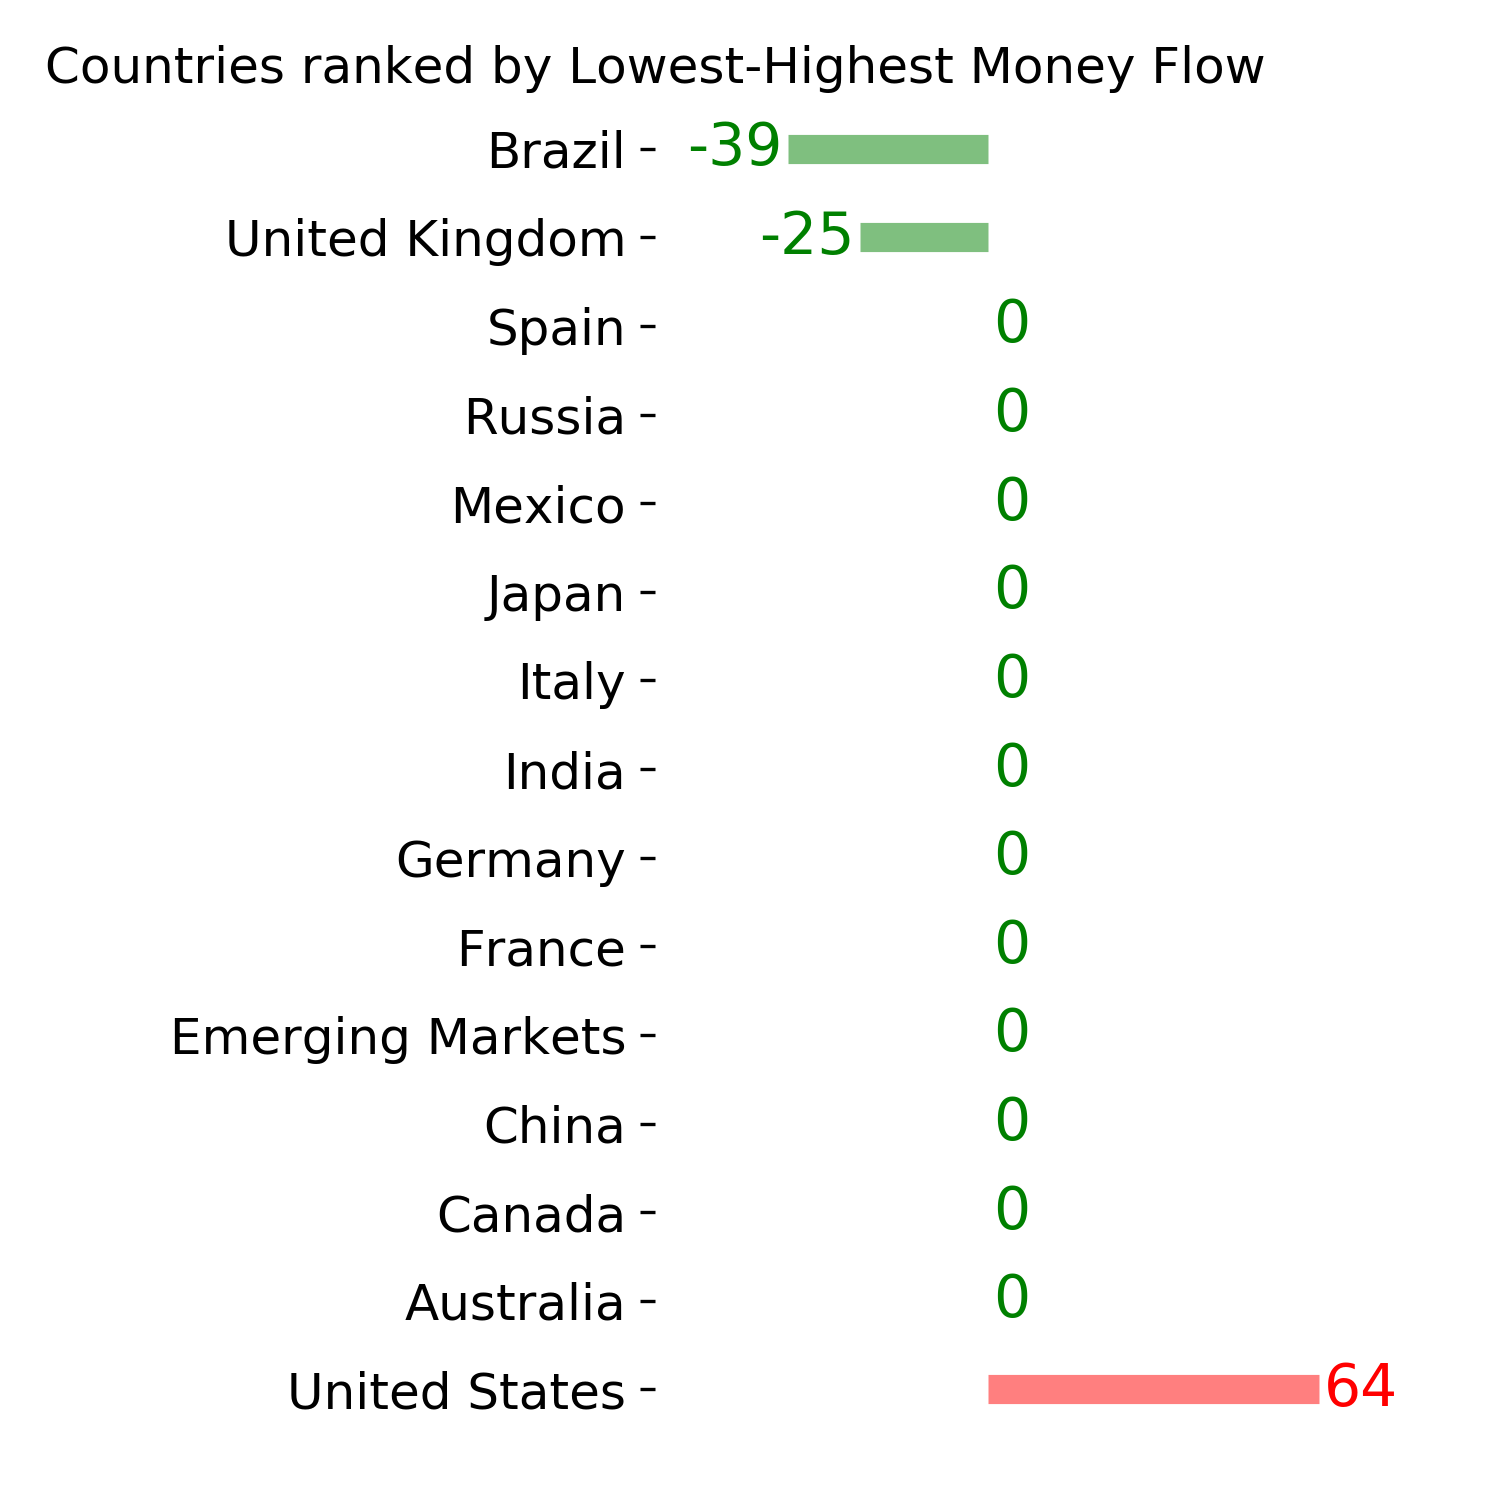
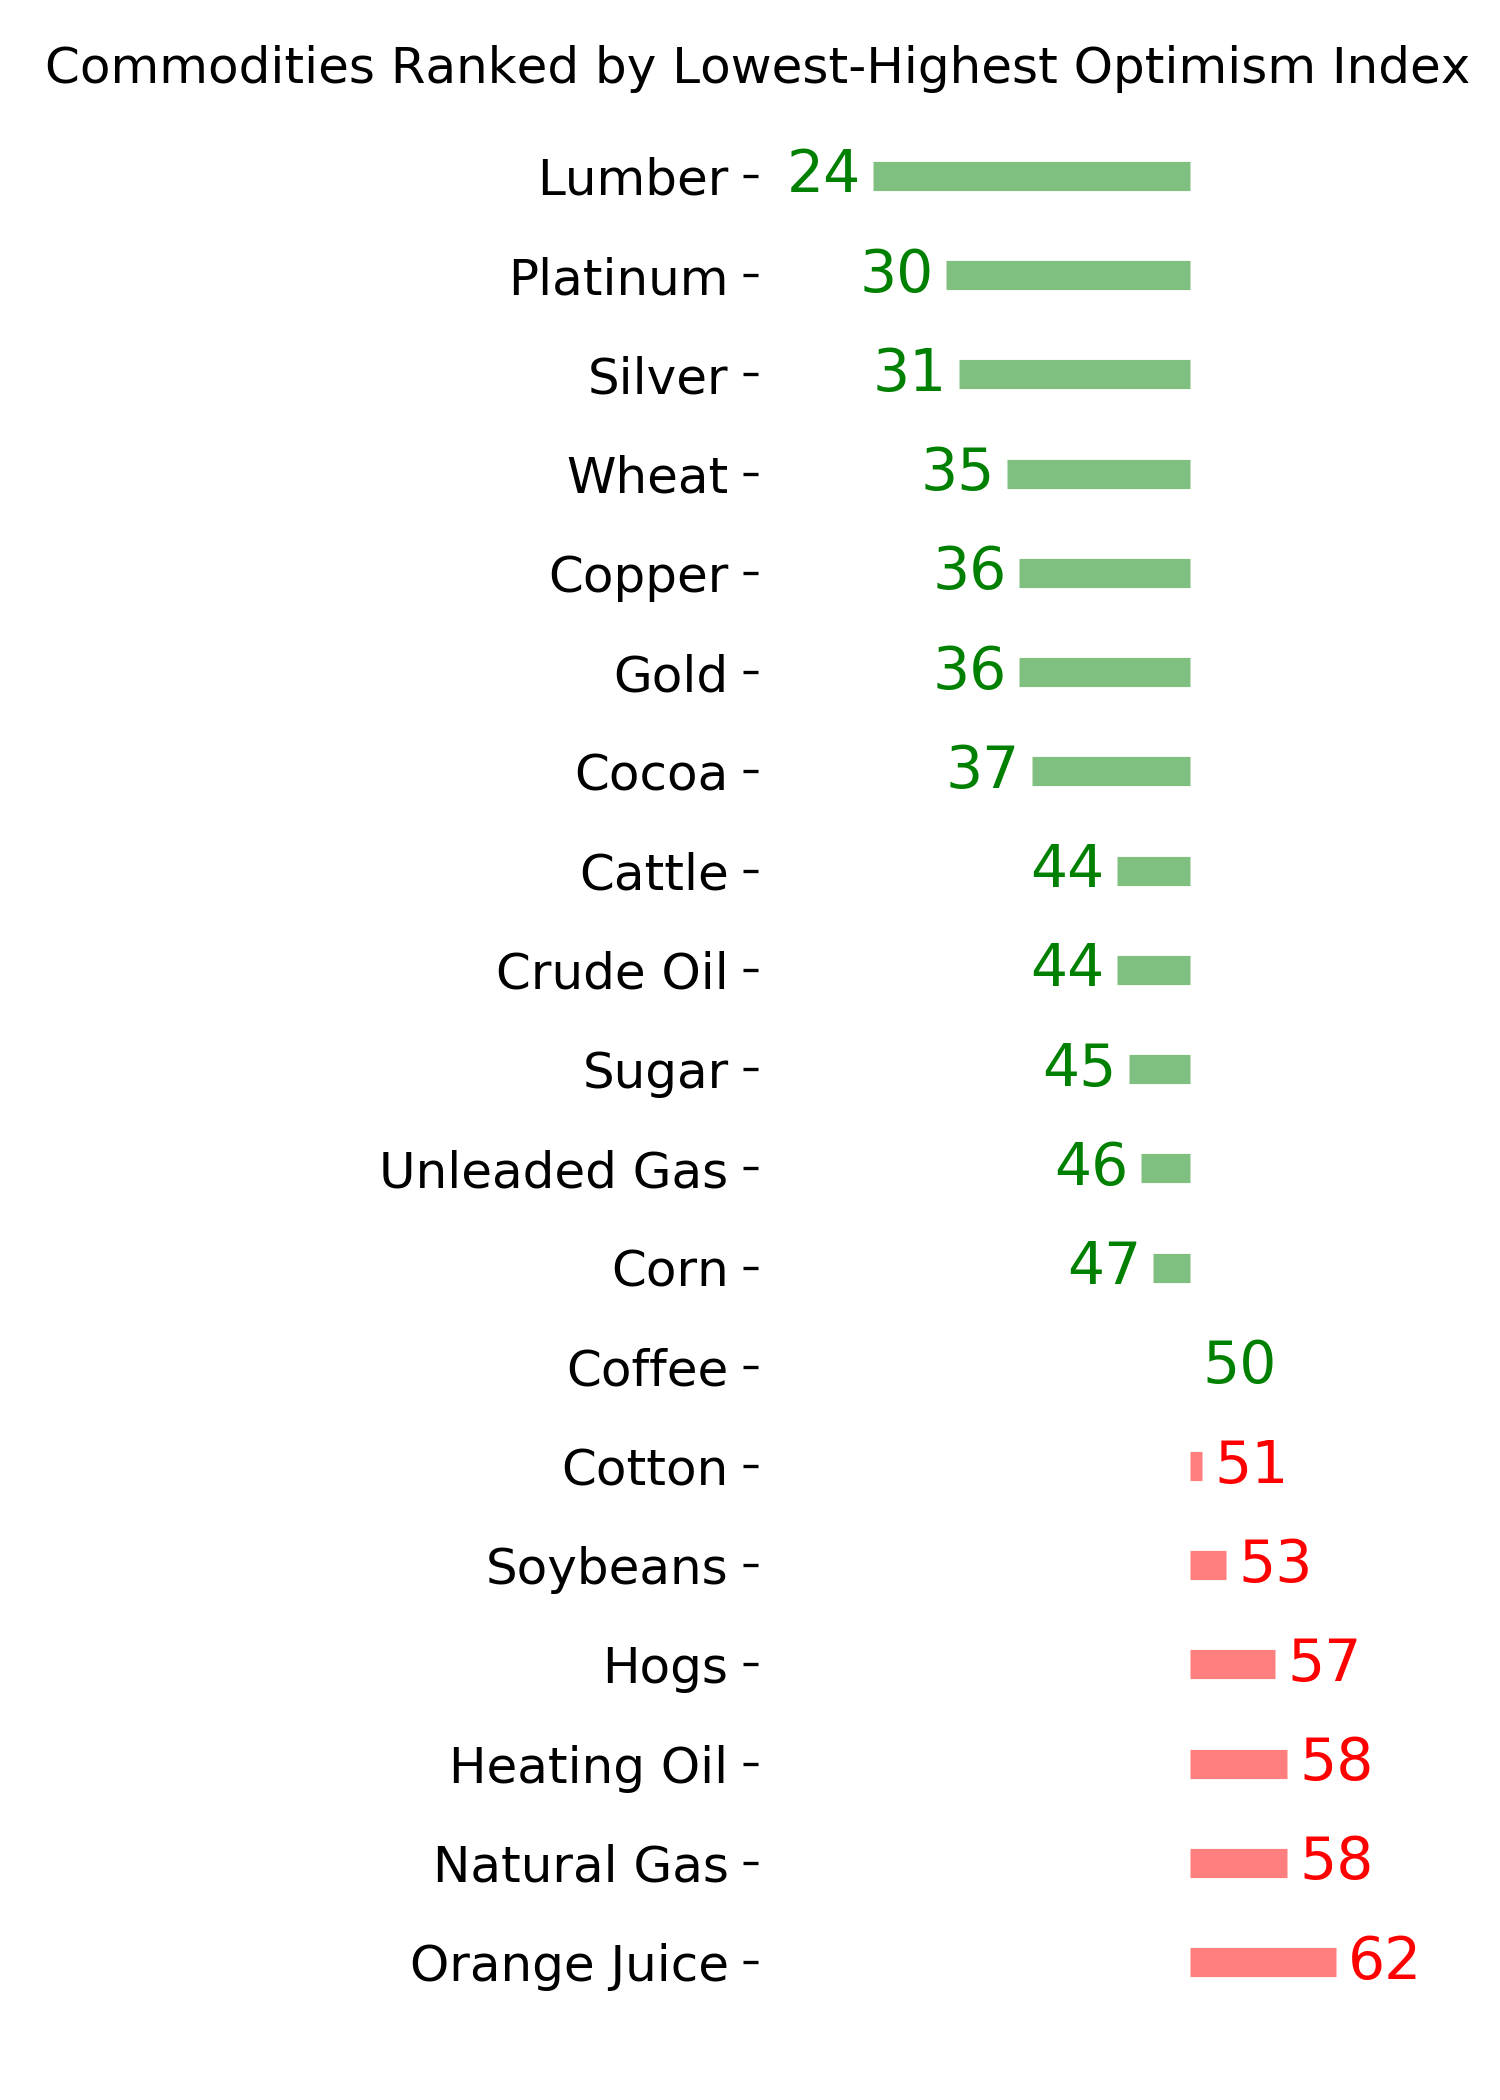
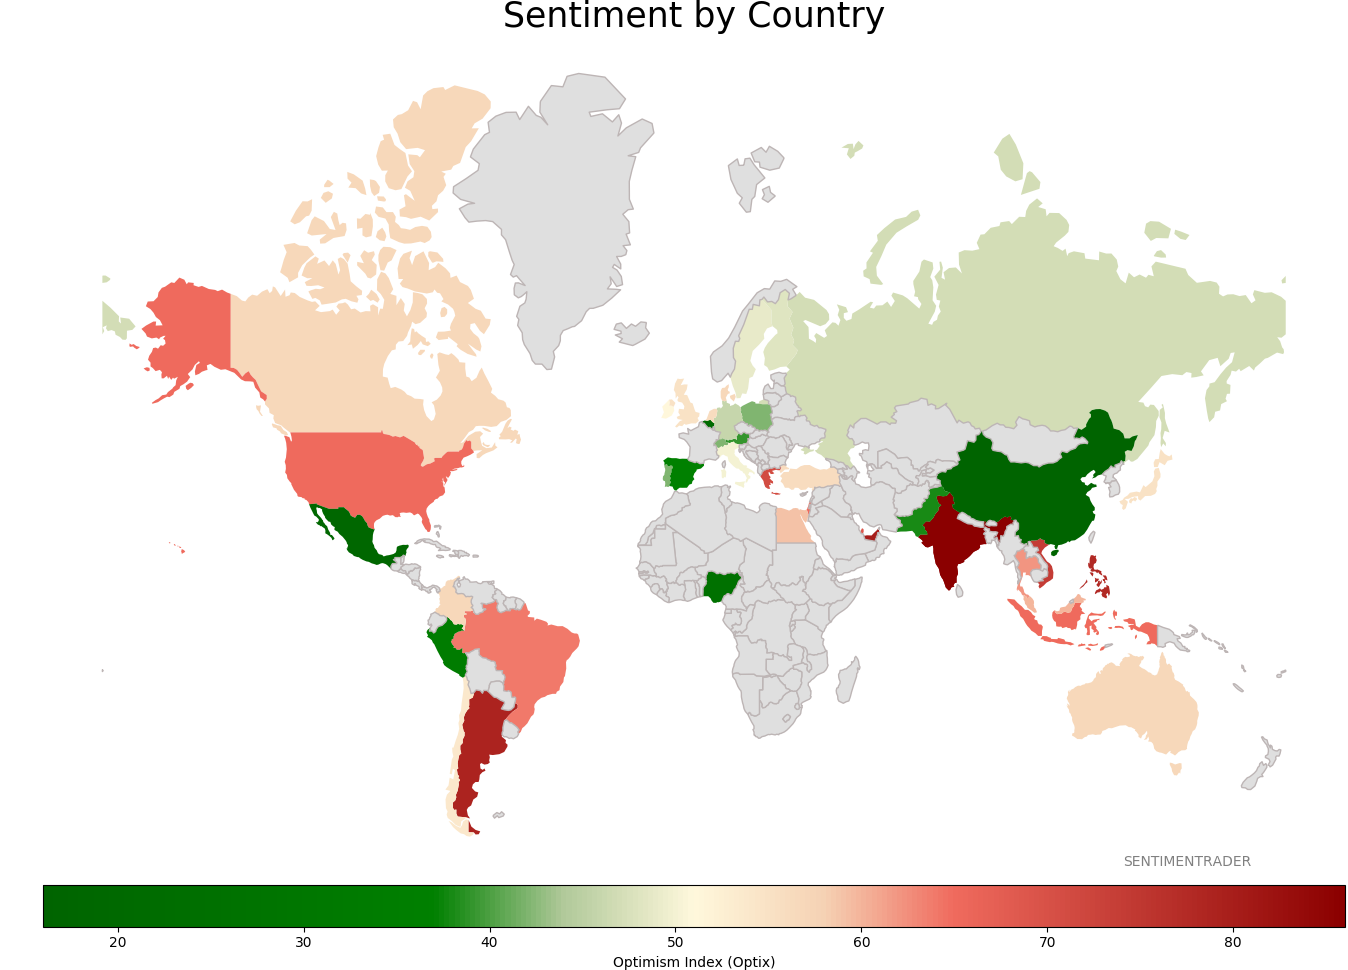
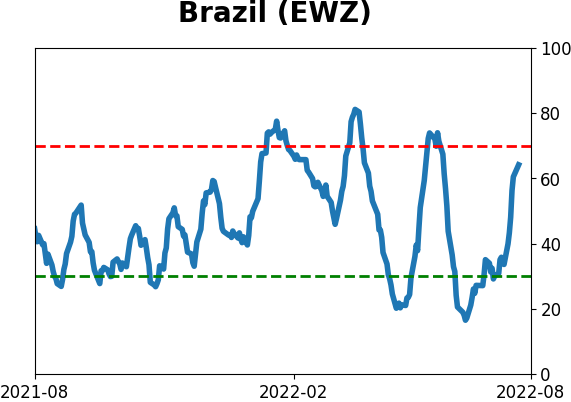
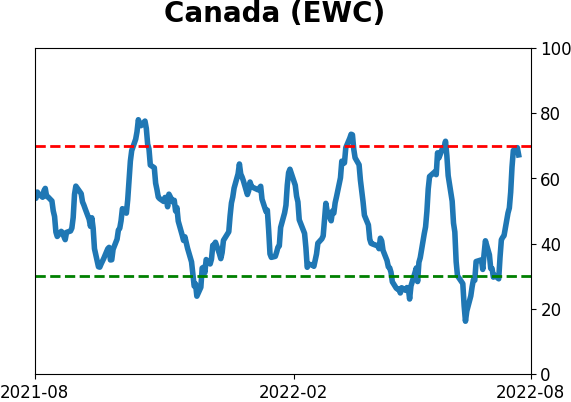
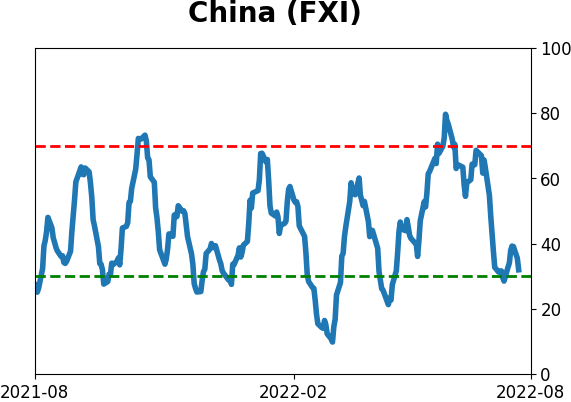
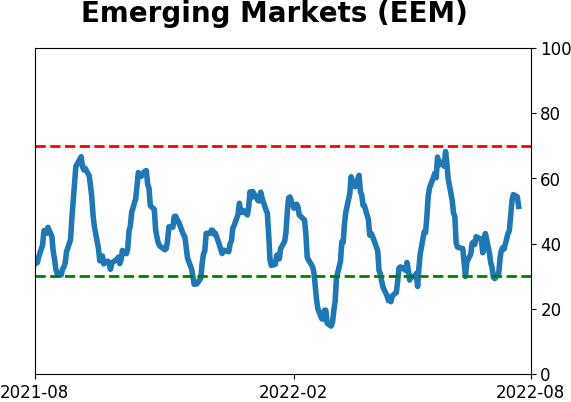
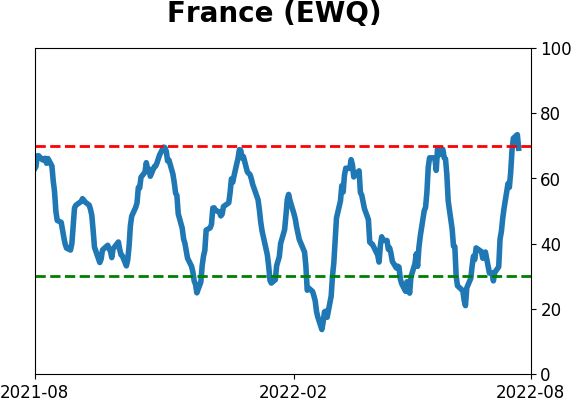
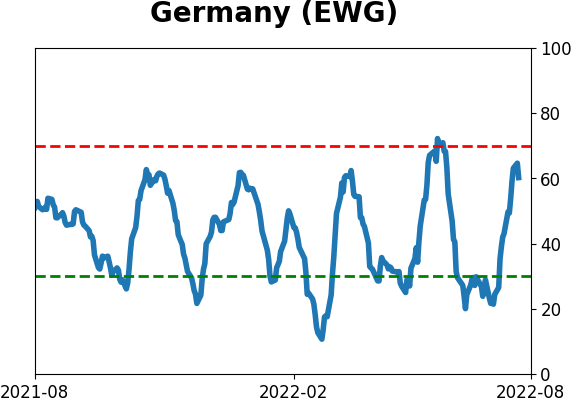
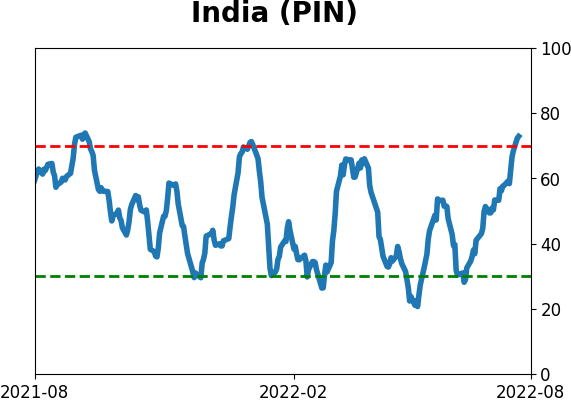
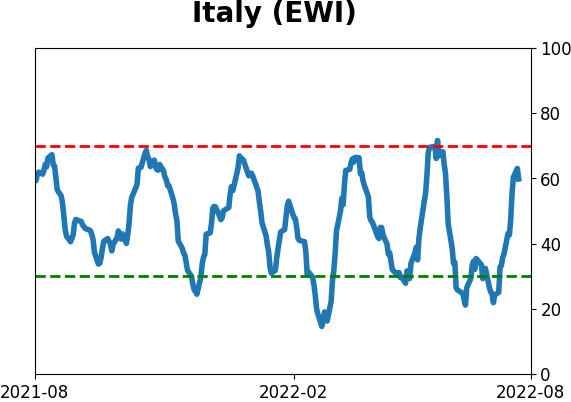
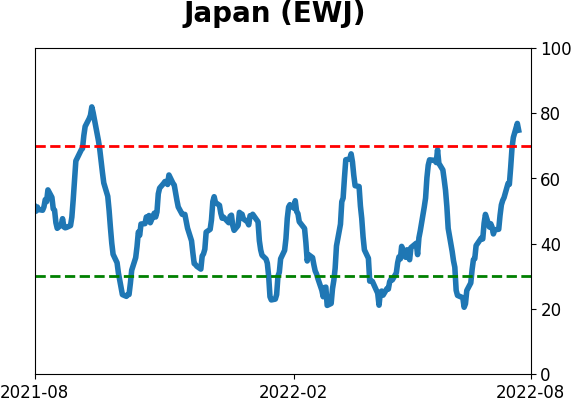
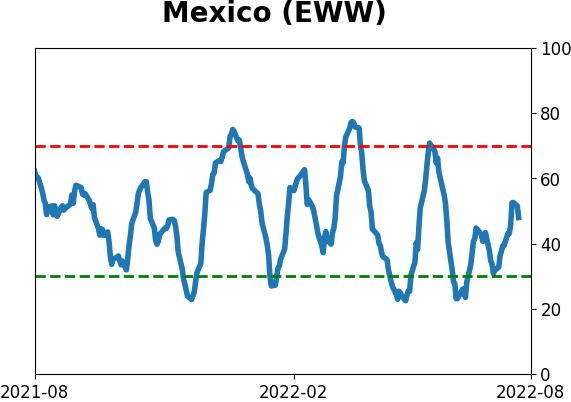
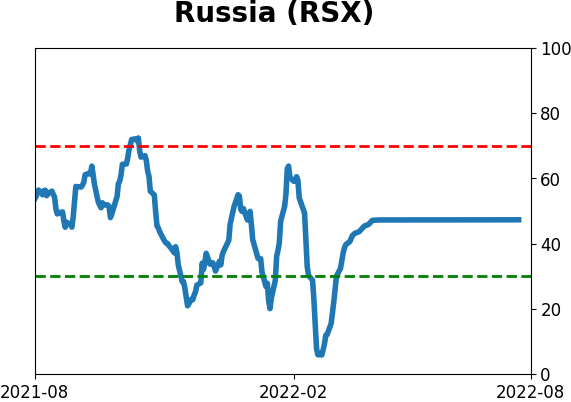
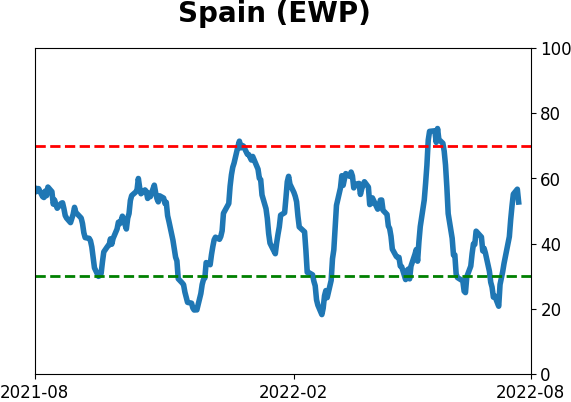
Sentiment Around The World
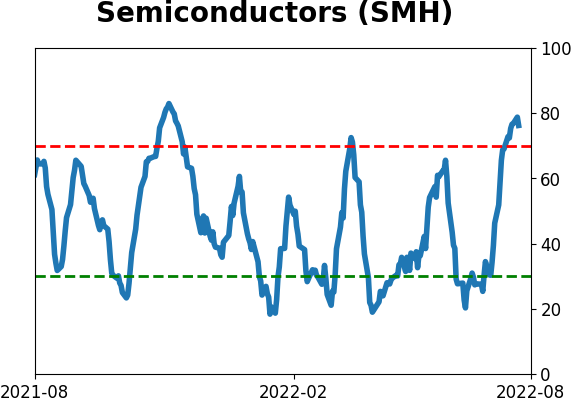
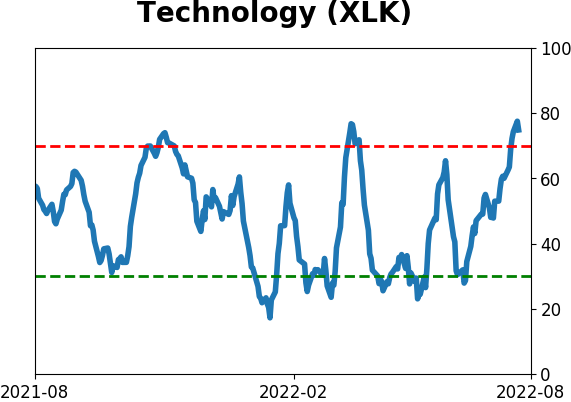
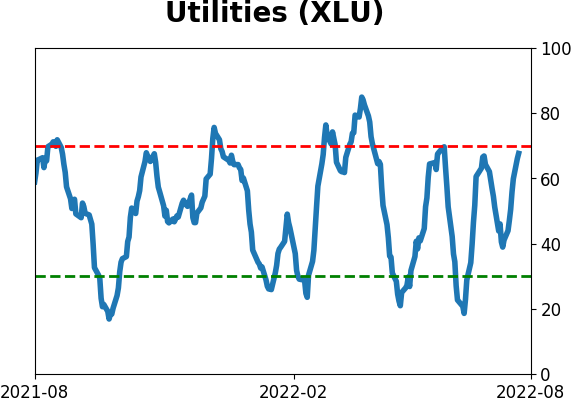
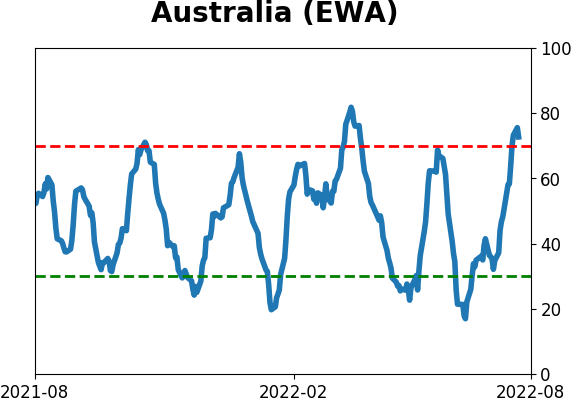
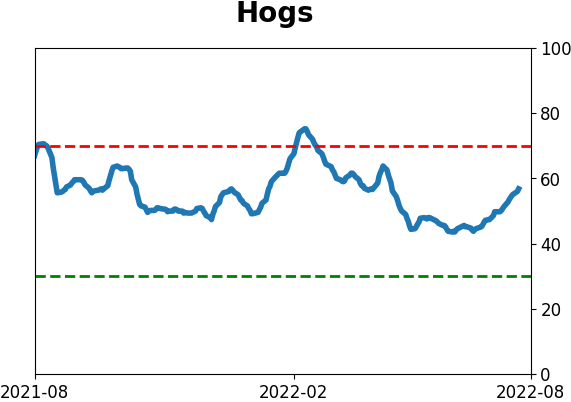
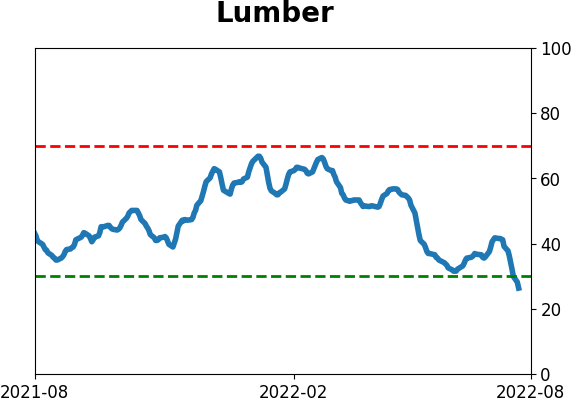
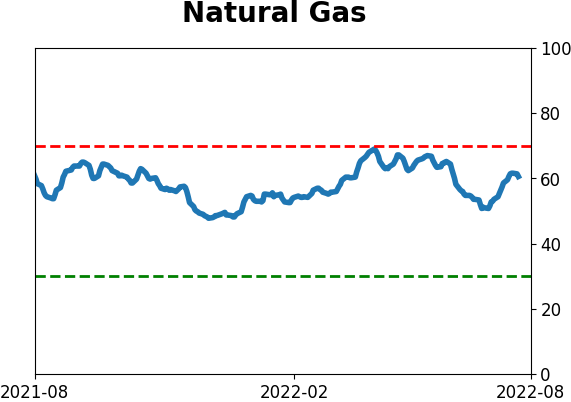
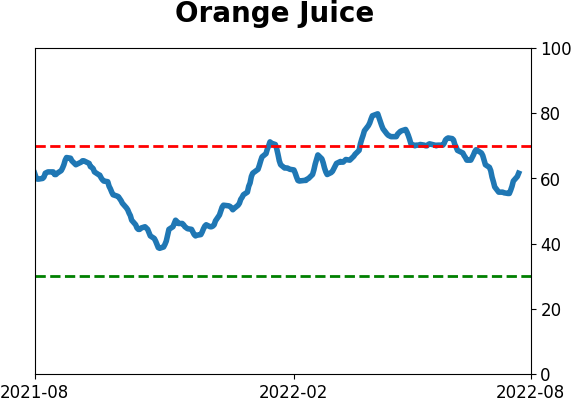
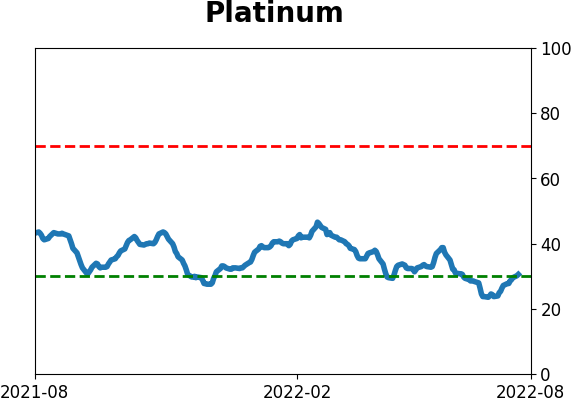
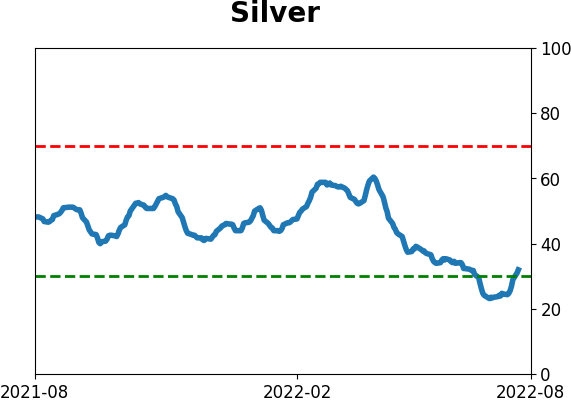
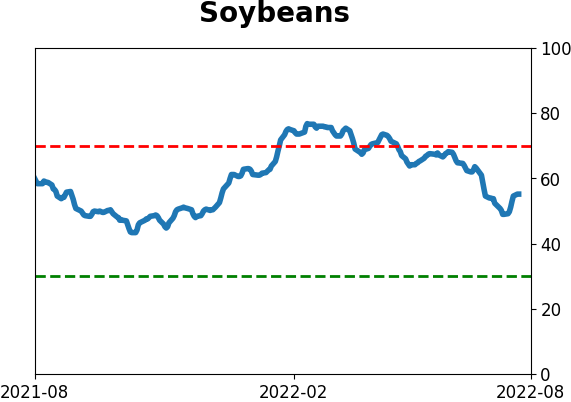
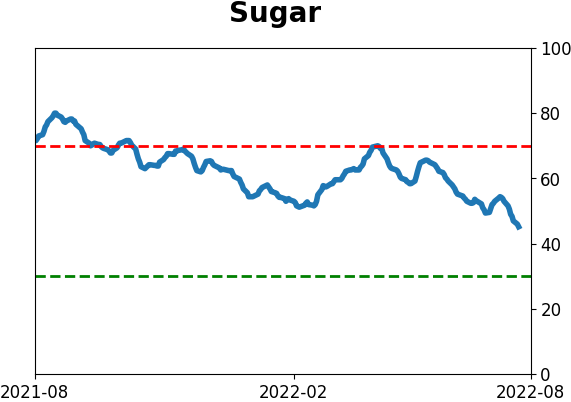
Optimism Index Thumbnails
|
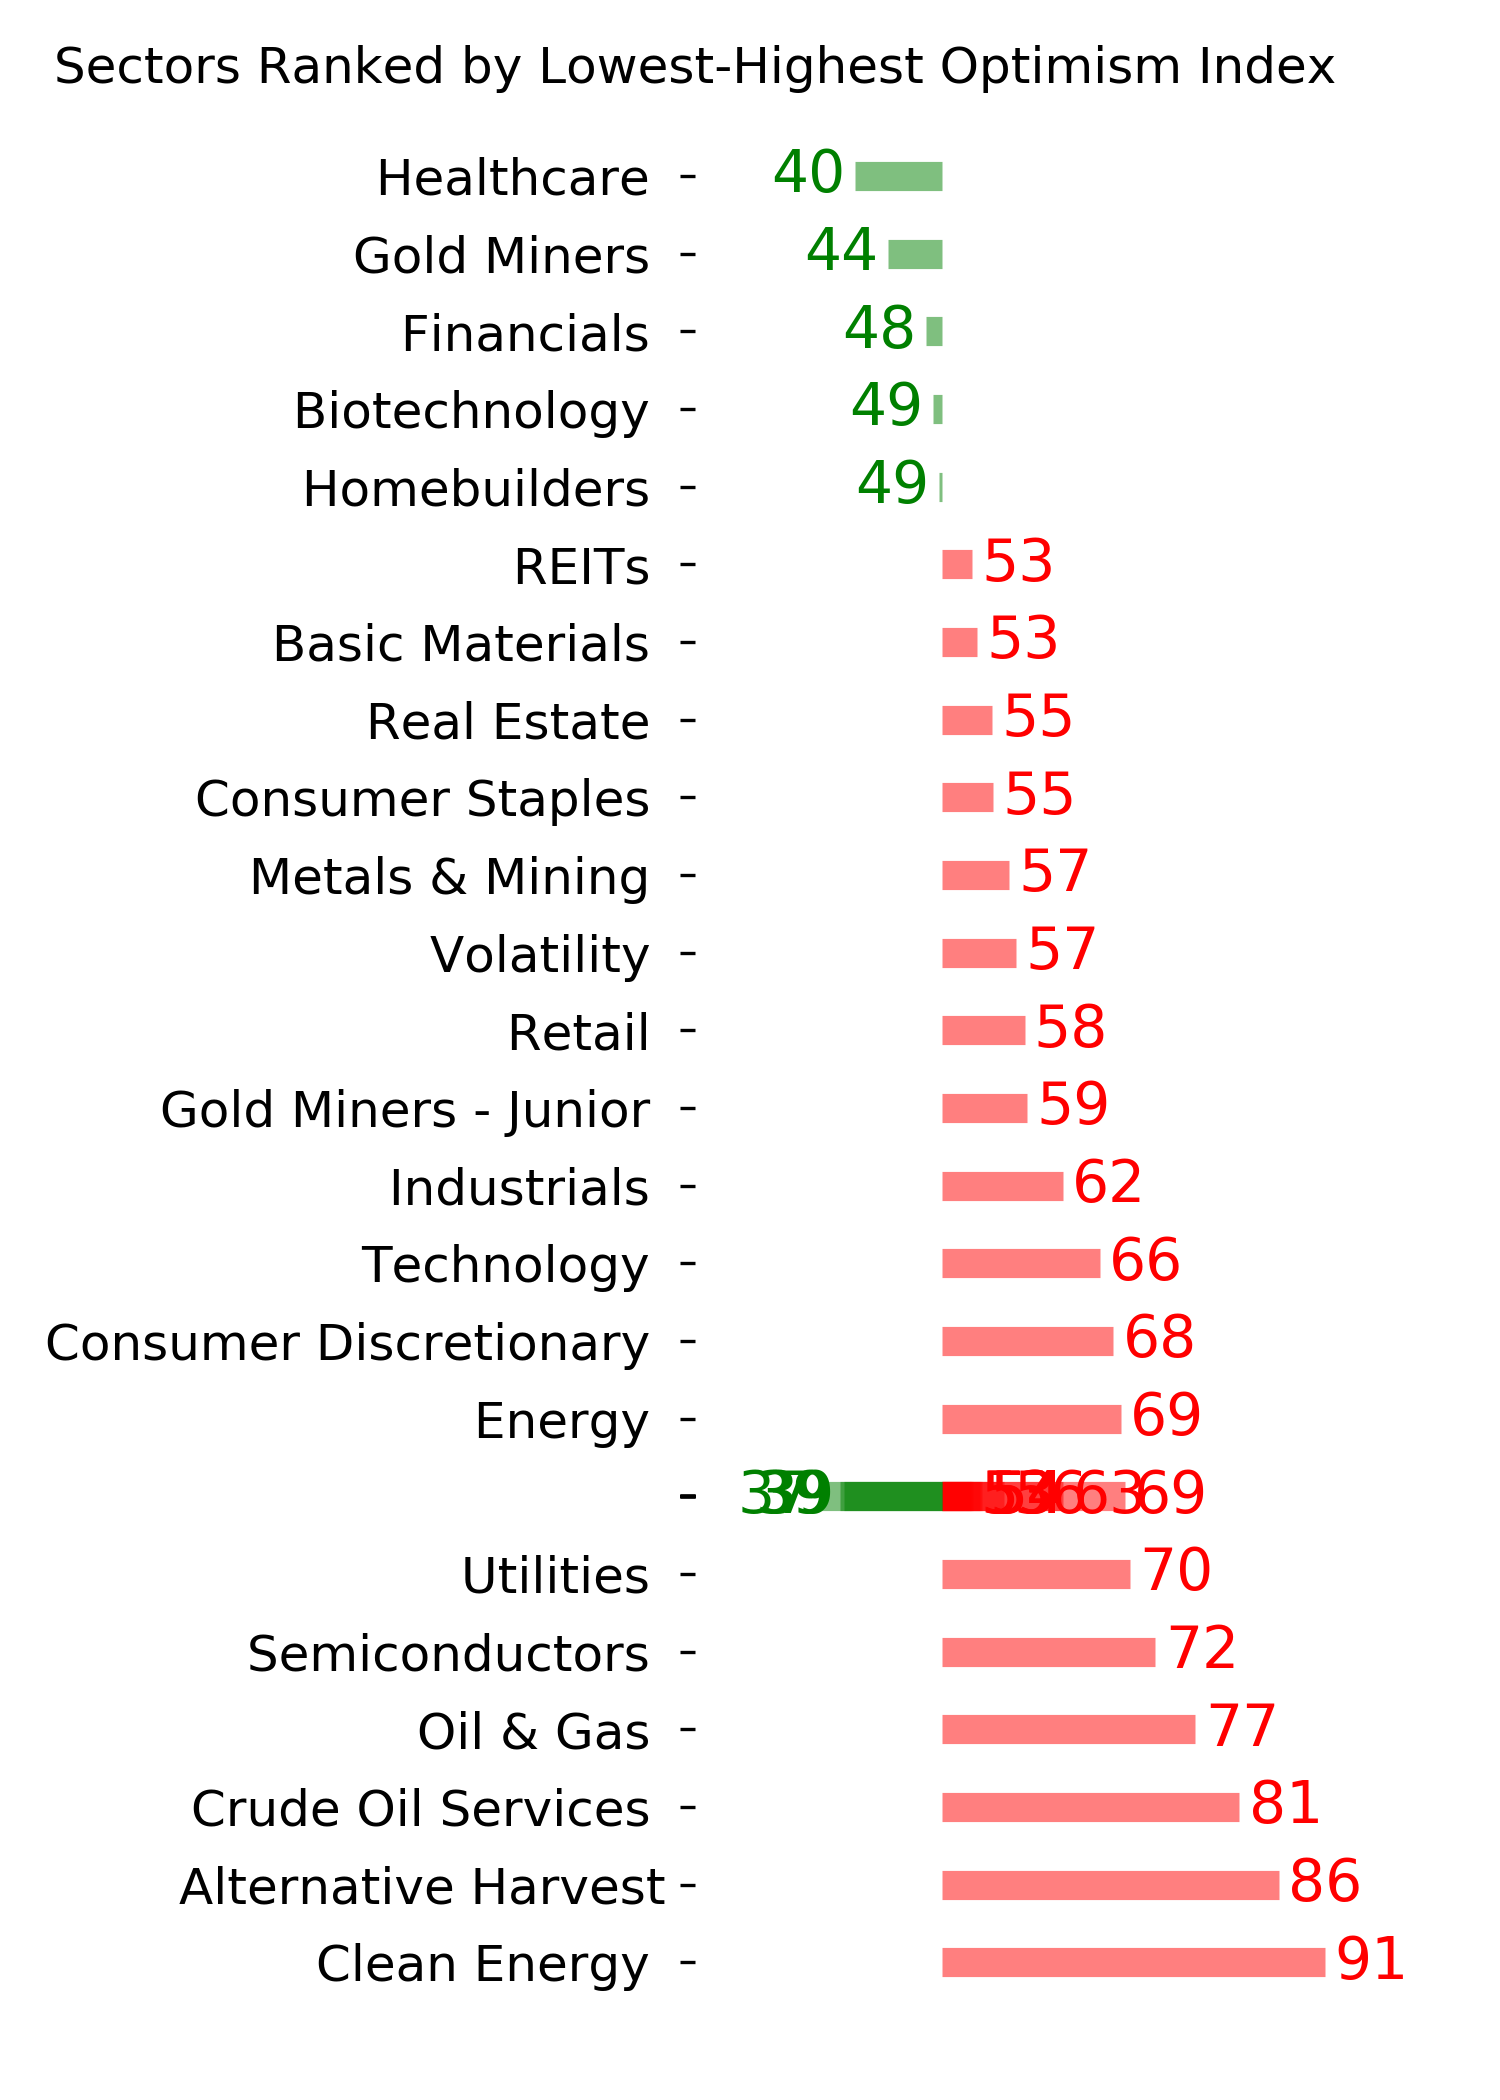
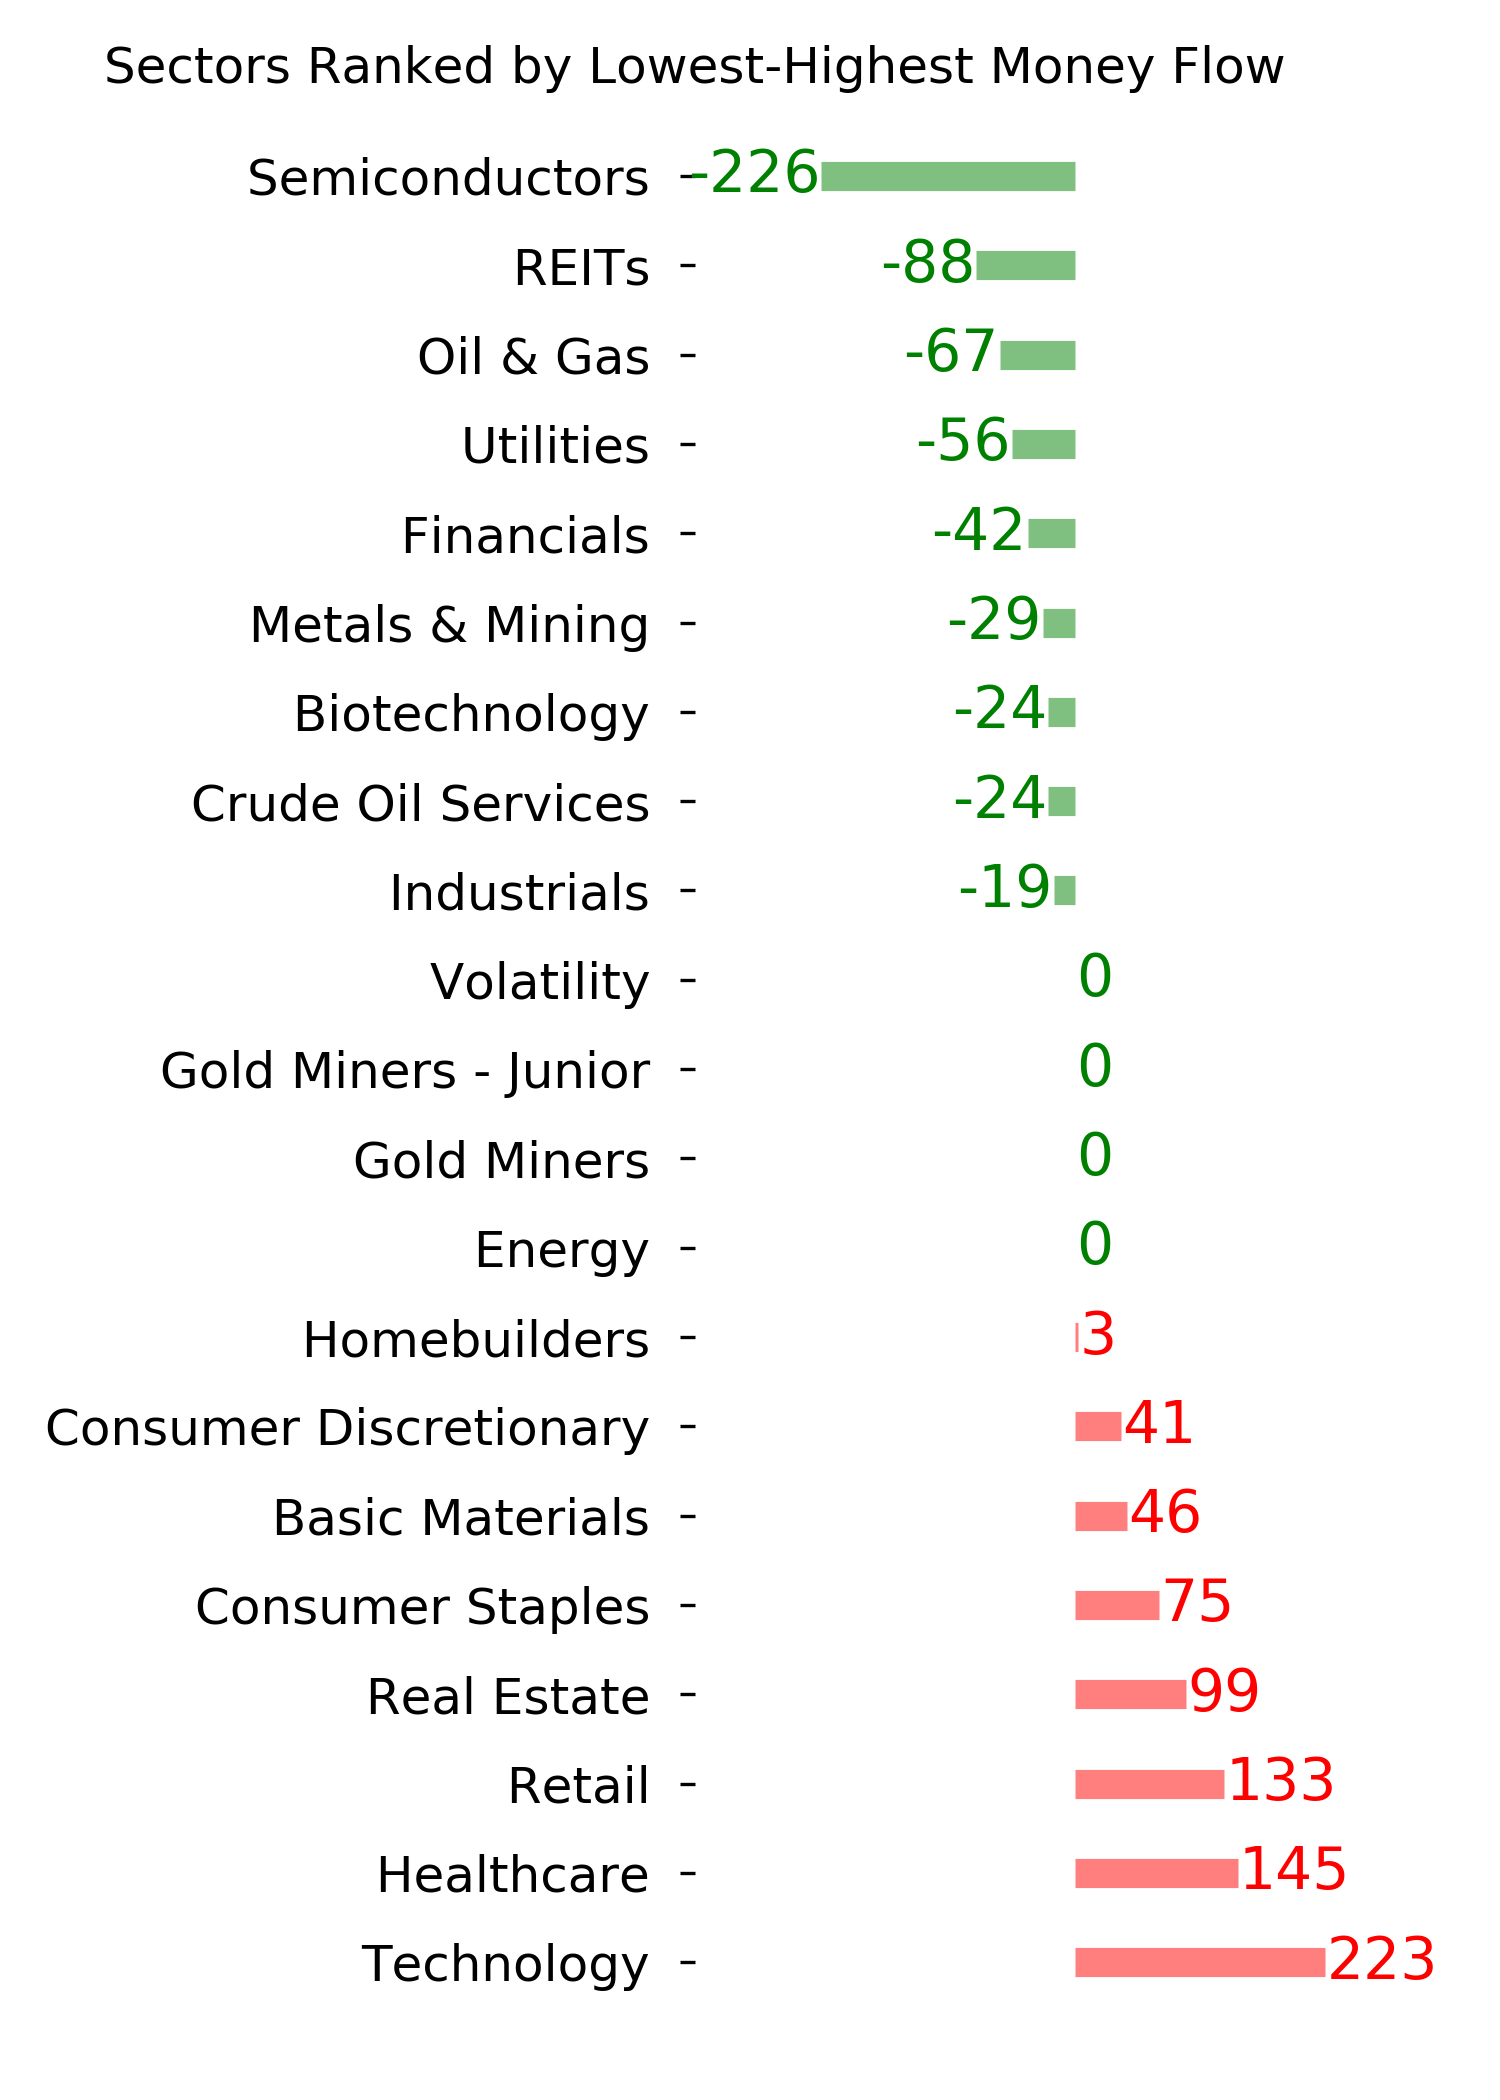
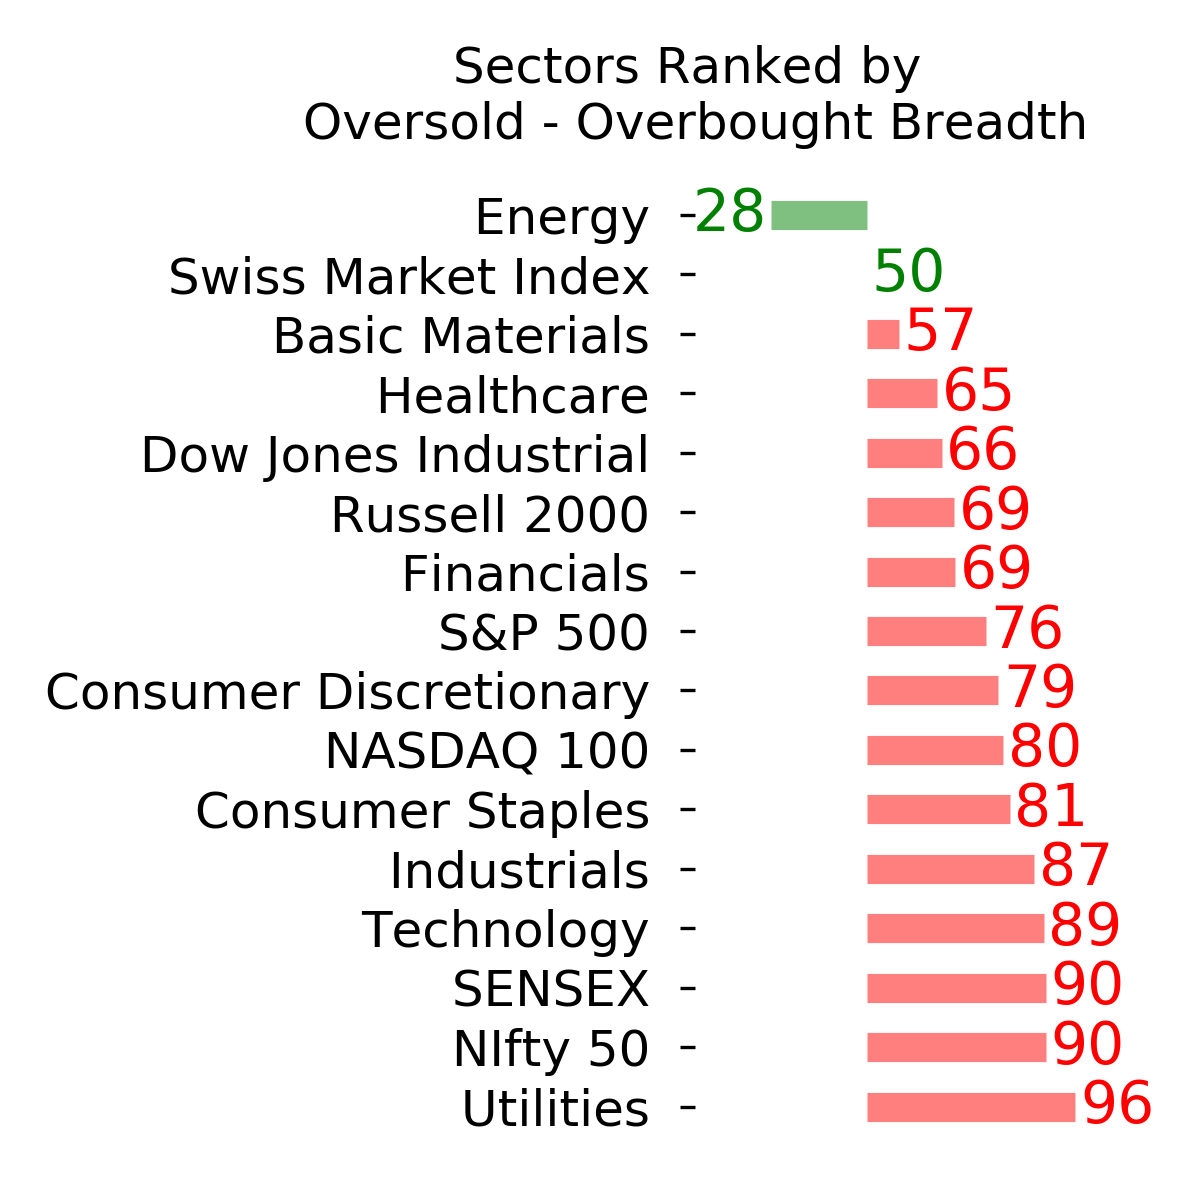
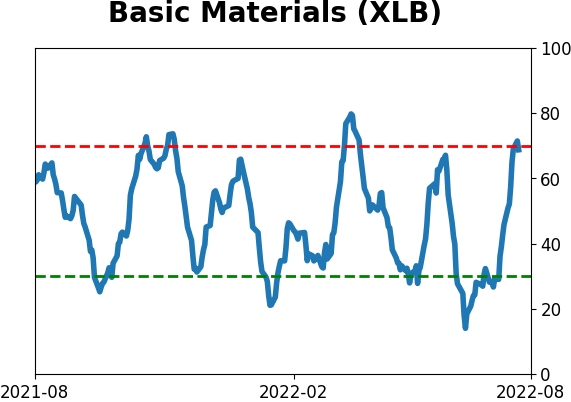
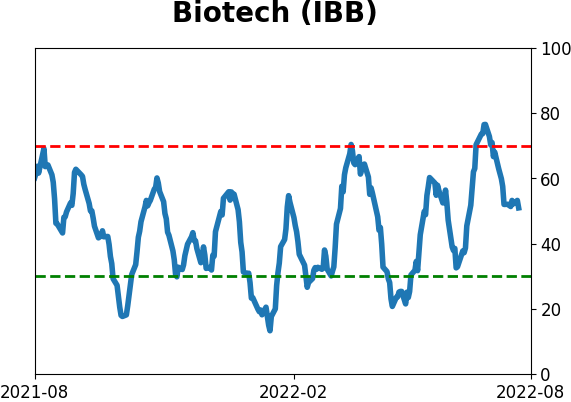
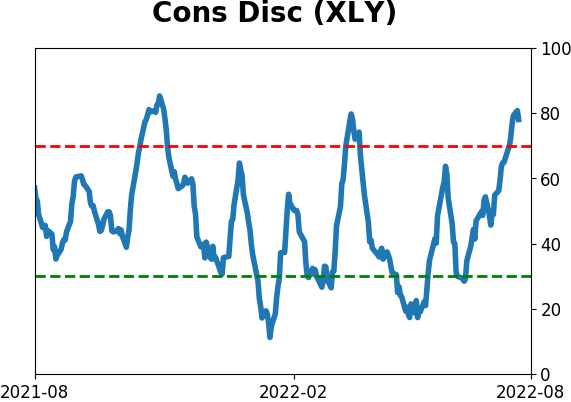
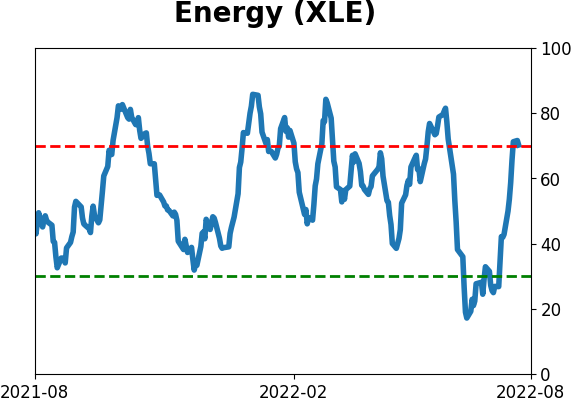
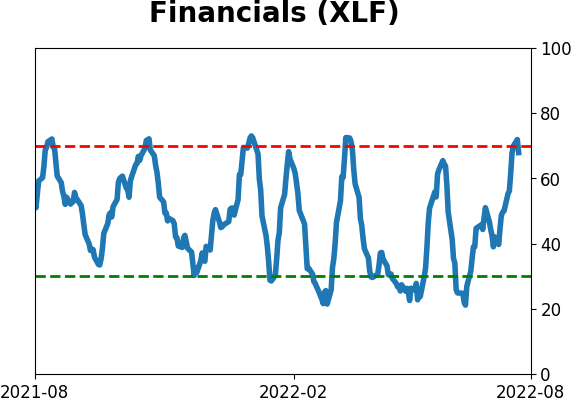
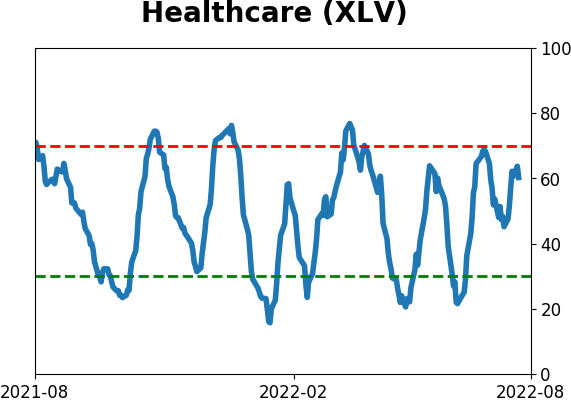
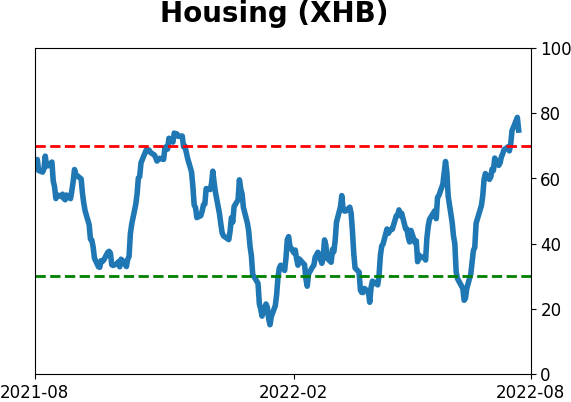
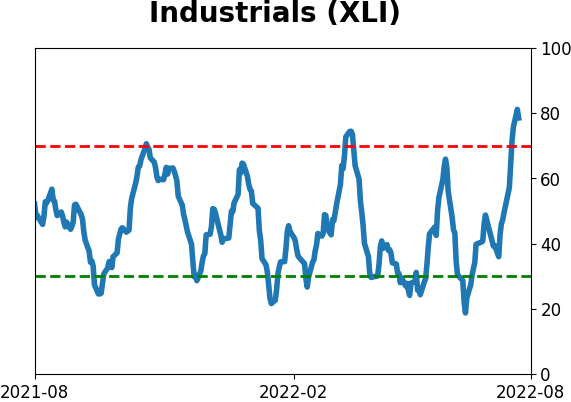
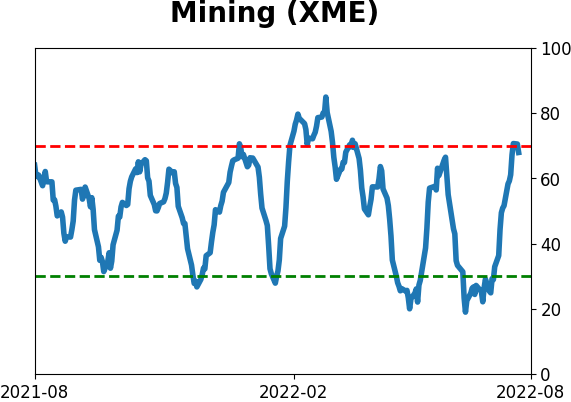
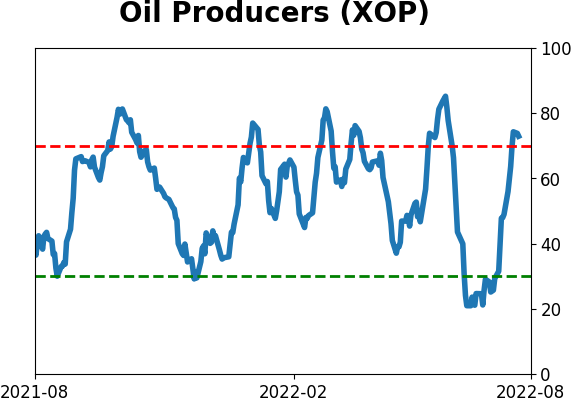
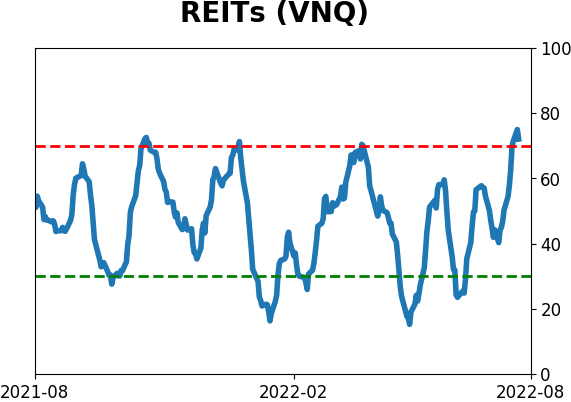
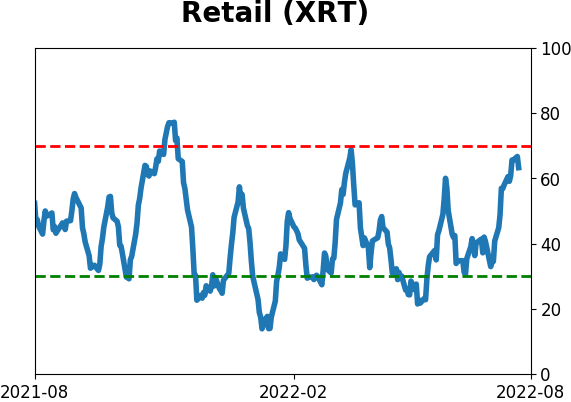
Sector ETF's - 10-Day Moving Average
|
|
|
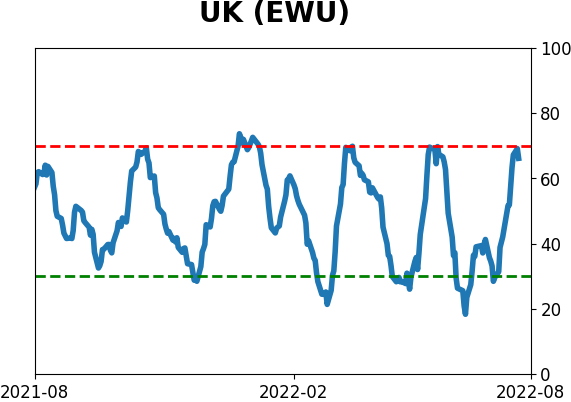
Country ETF's - 10-Day Moving Average
|
|
|
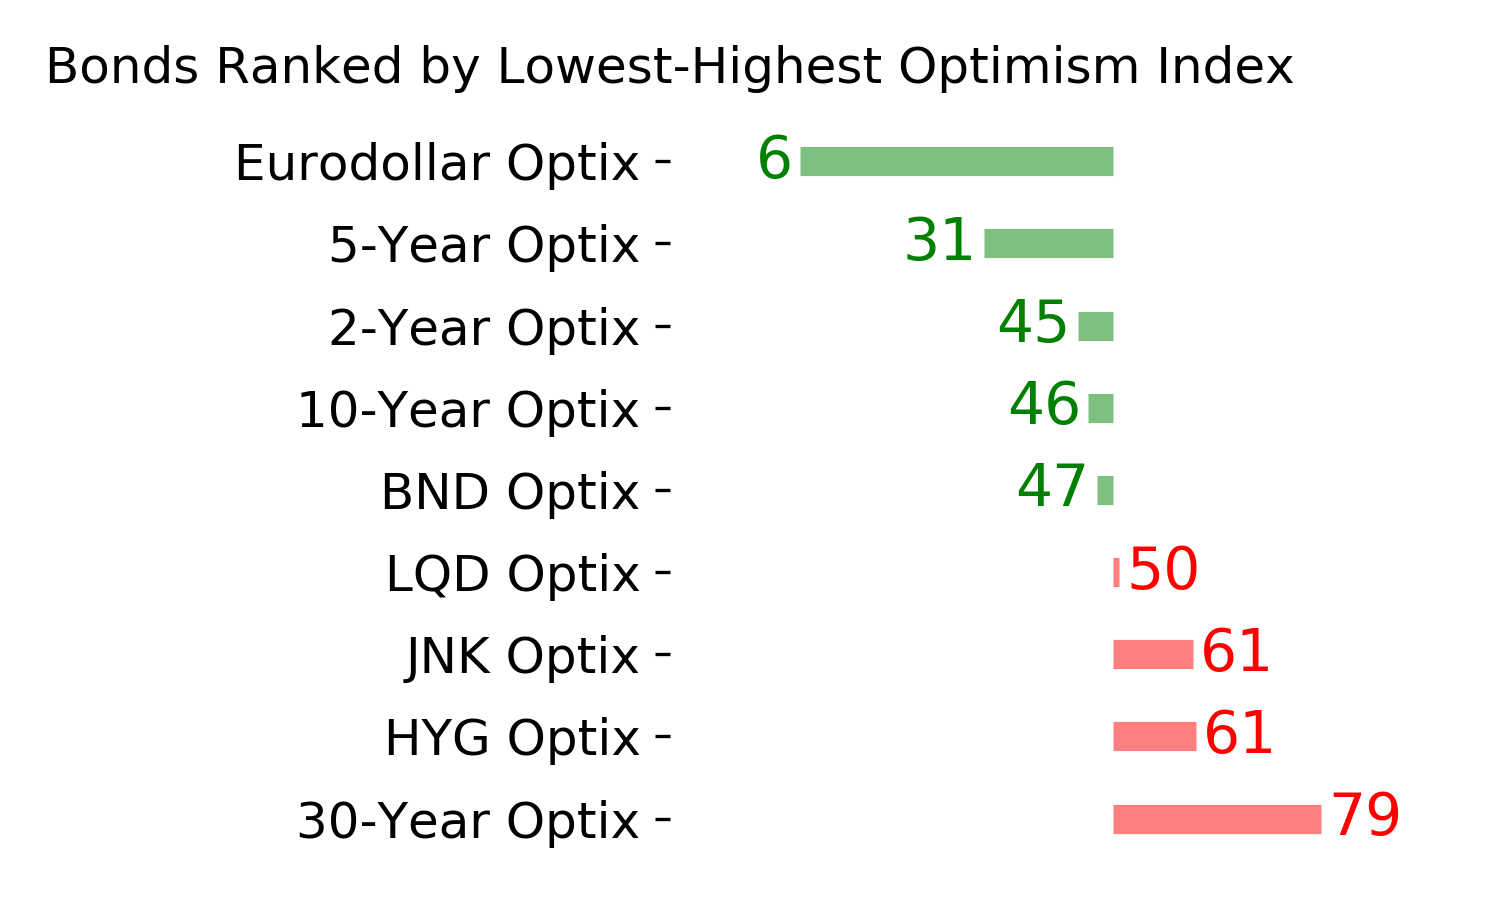
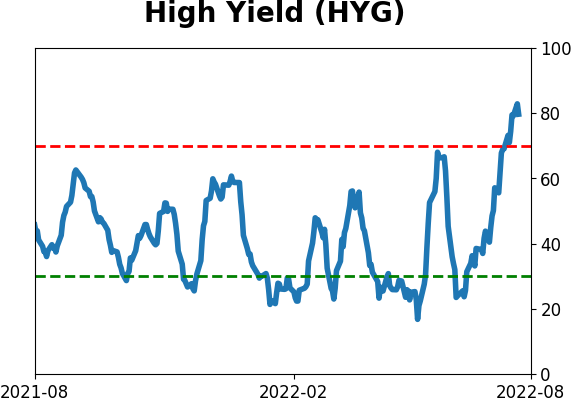
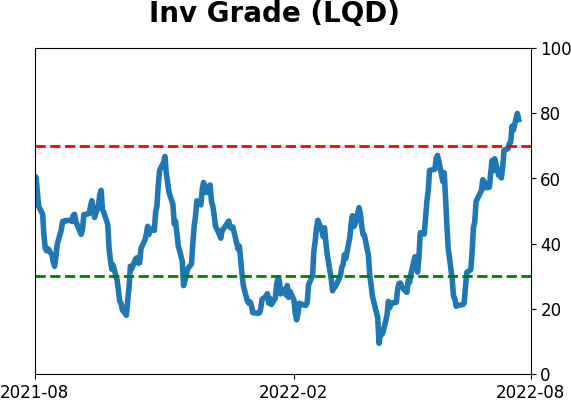
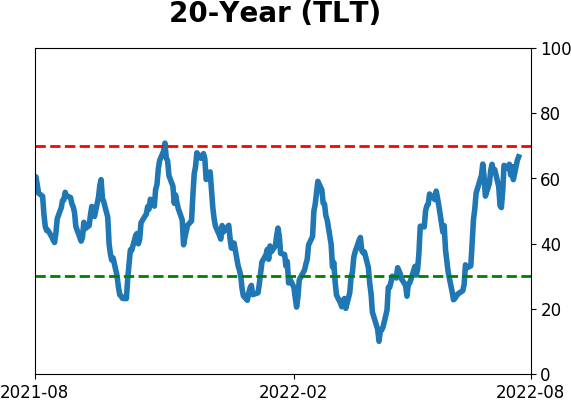
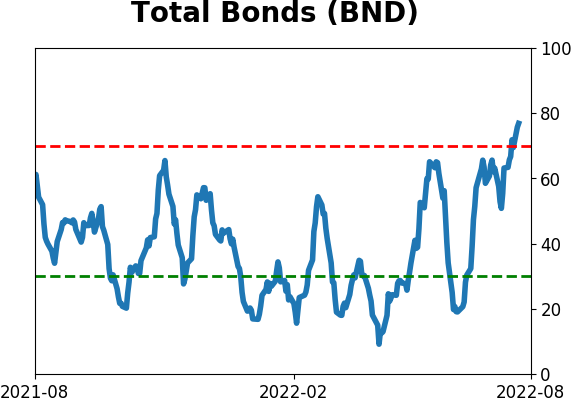
Bond ETF's - 10-Day Moving Average
|
|
|
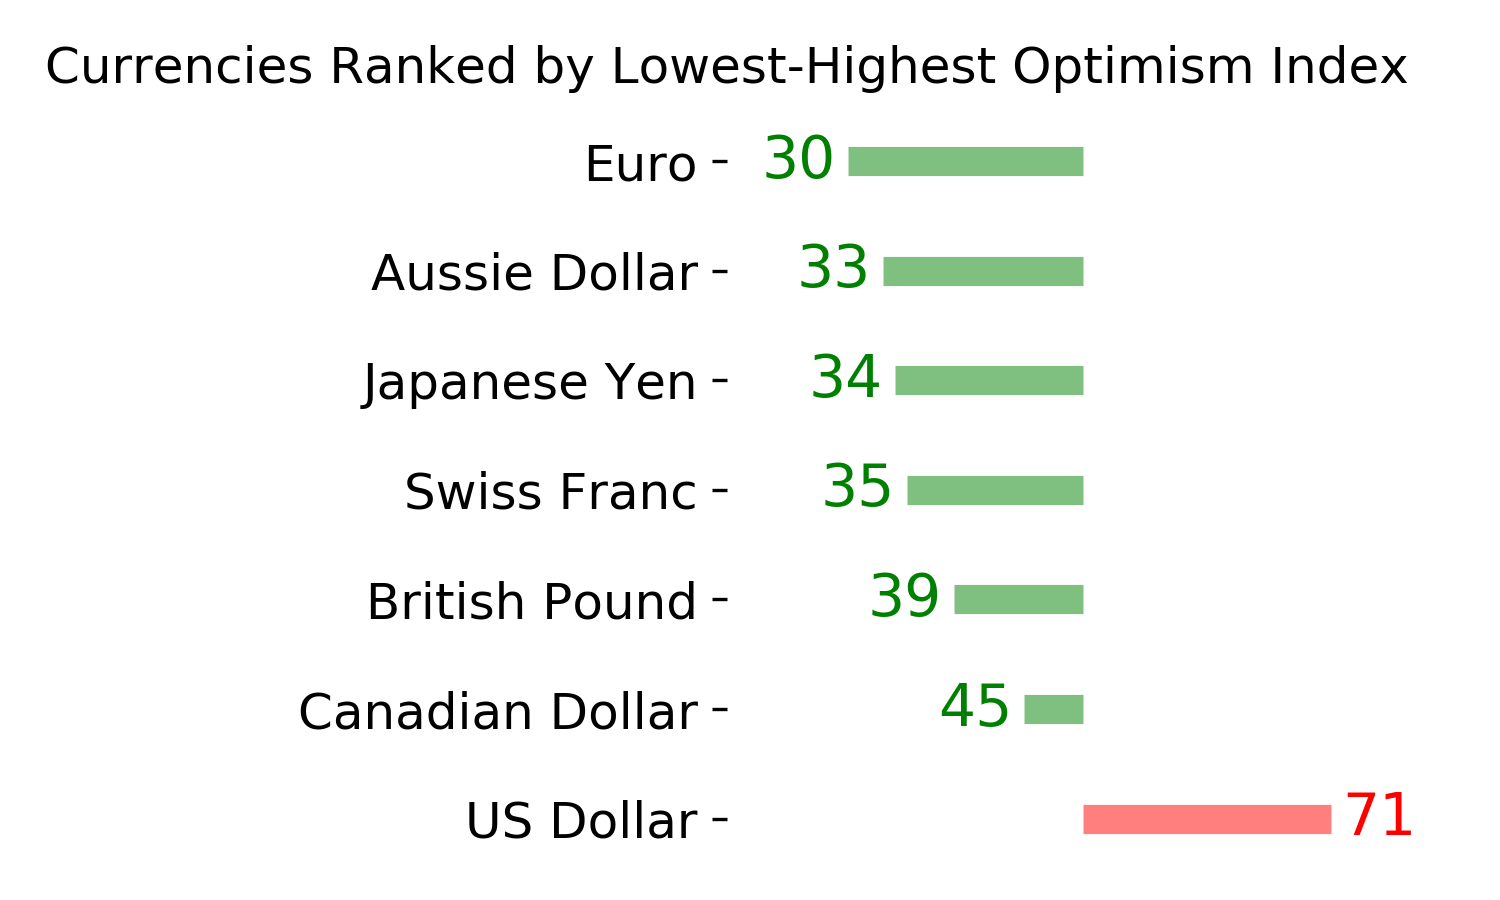
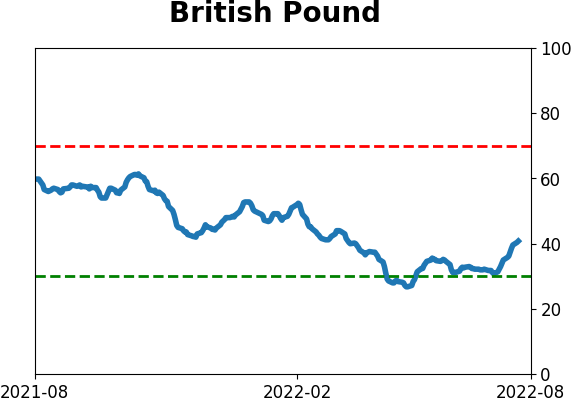
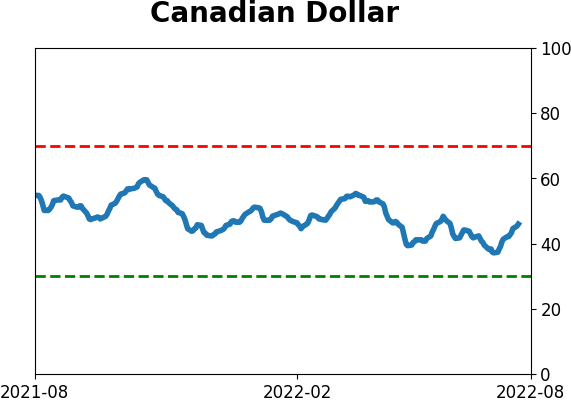
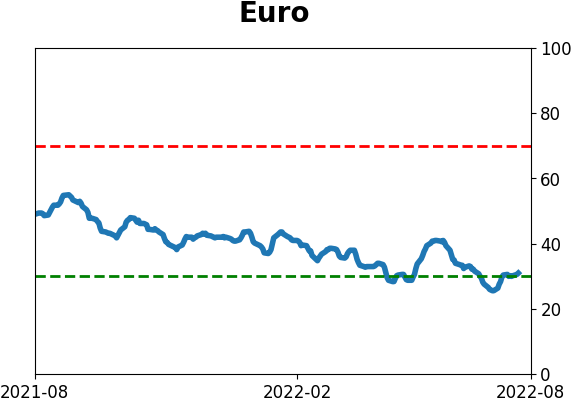
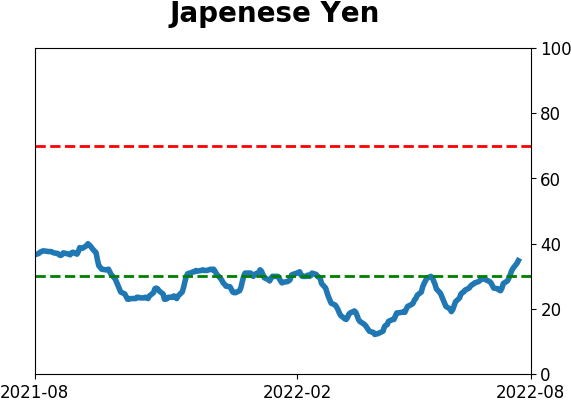
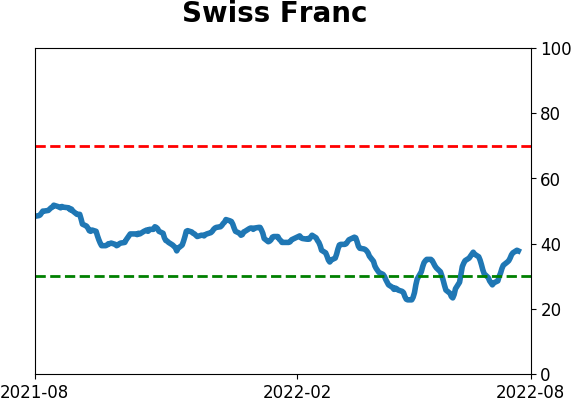
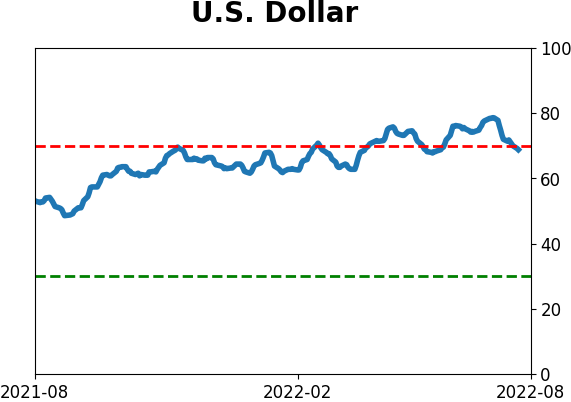
Currency ETF's - 5-Day Moving Average
|
|
|
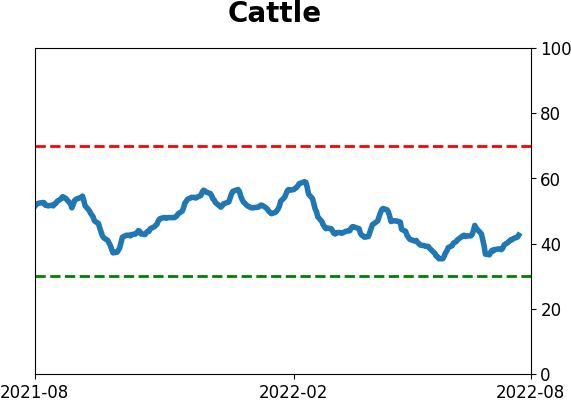
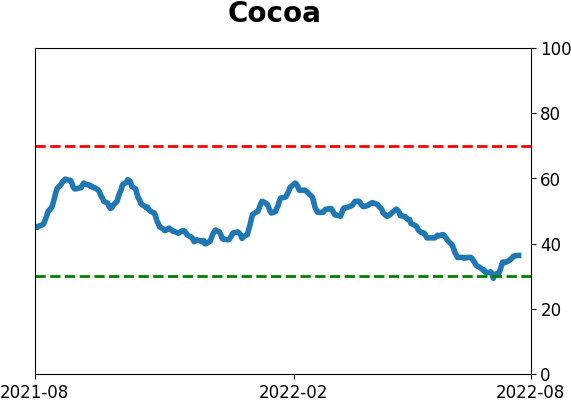
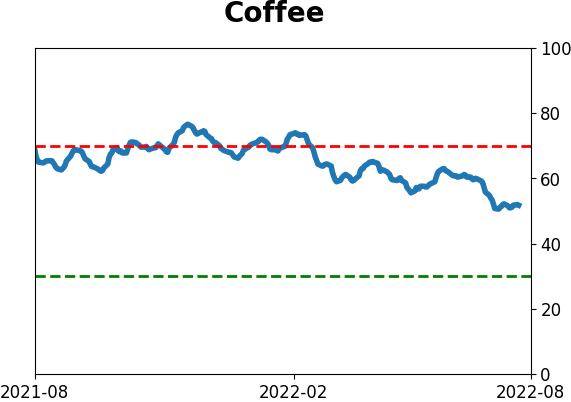
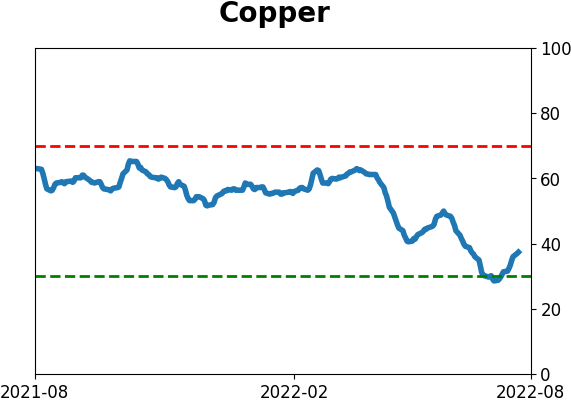
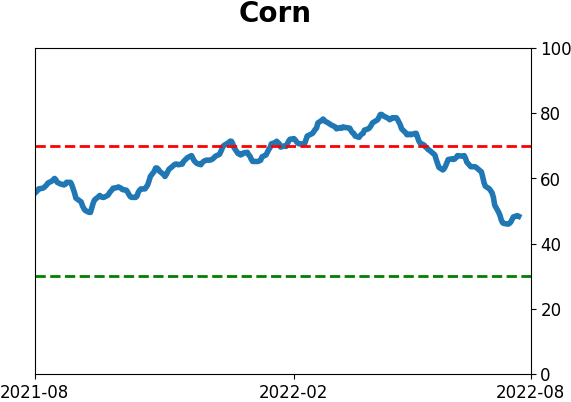
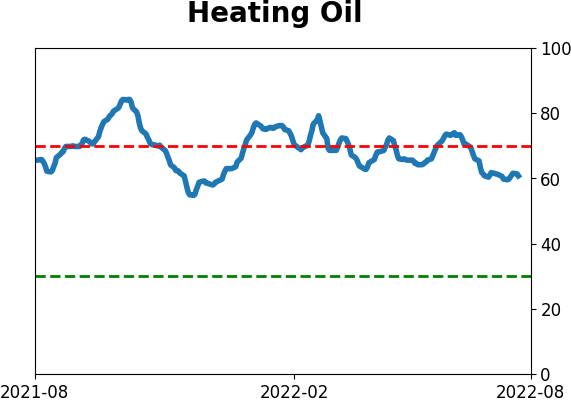
Commodity ETF's - 5-Day Moving Average
|
|