Headlines
|
|
Hard Economic Releases Keep Disappointing the Experts:
For the first time in over a year, hard economic surprises have come in well below economists' expectations. This was not a consistent reason to sell stocks, but bonds did suffer most of the time.
Bottom Line:
See the Outlook & Allocations page for more details on these summaries STOCKS: Hold
The speculative frenzy in February is wrung out. Internal dynamics have mostly held up, with some exceptions. Many of our studies still show a mixed to poor short-term view, with medium- and long-term ones turning more positive. BONDS: Hold
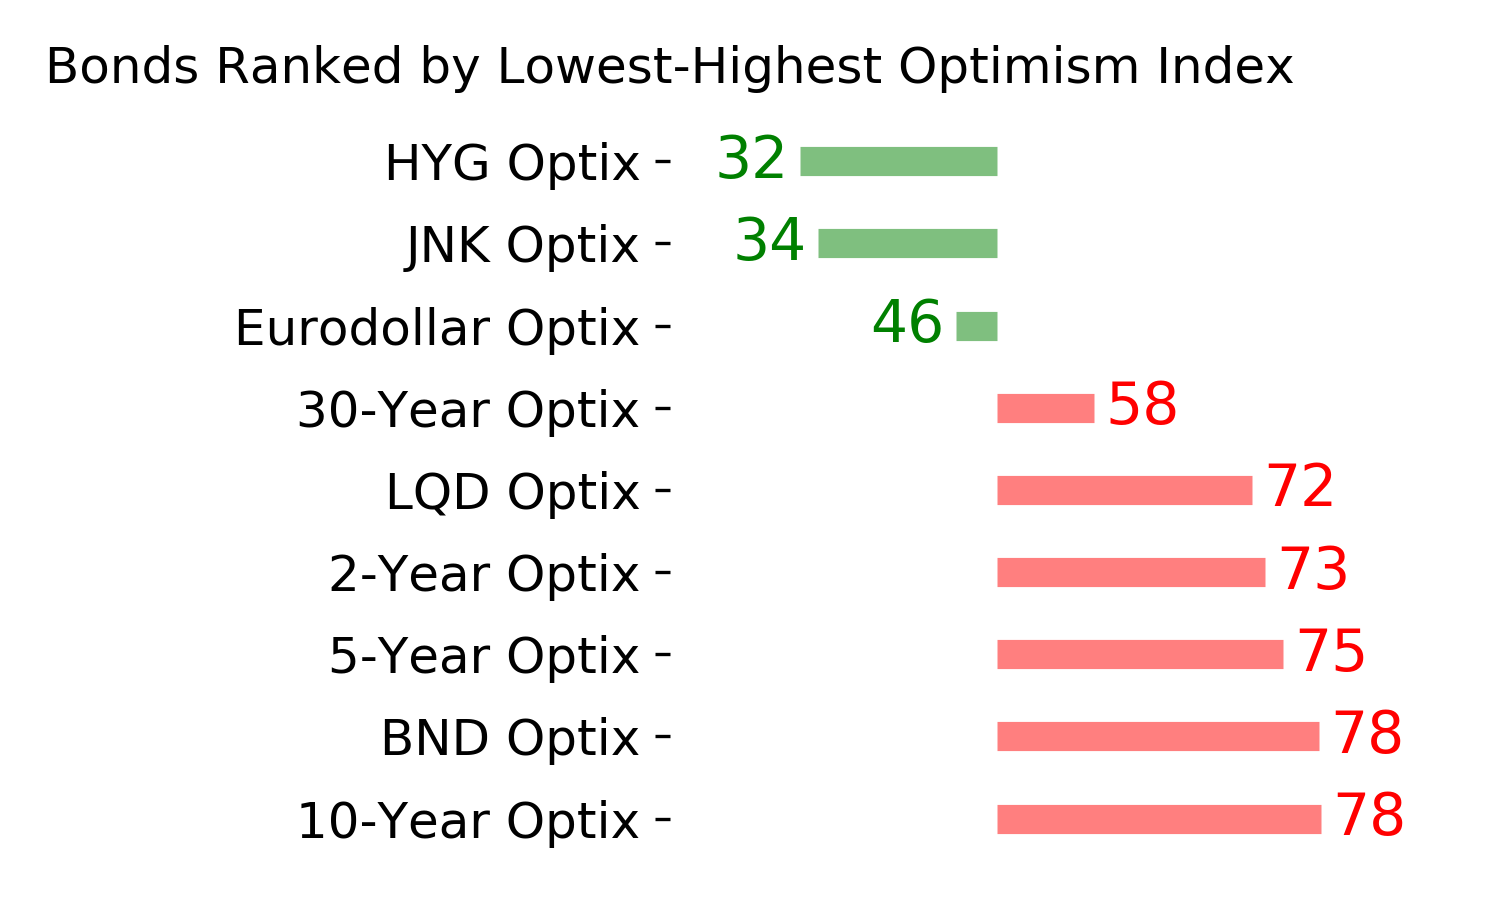
Various parts of the market got hit in March, with the lowest Bond Optimism Index we usually see during healthy environments. After a shaky couple of weeks, the broad bond market has modestly recovered. Not a big edge here either way. GOLD: Hold
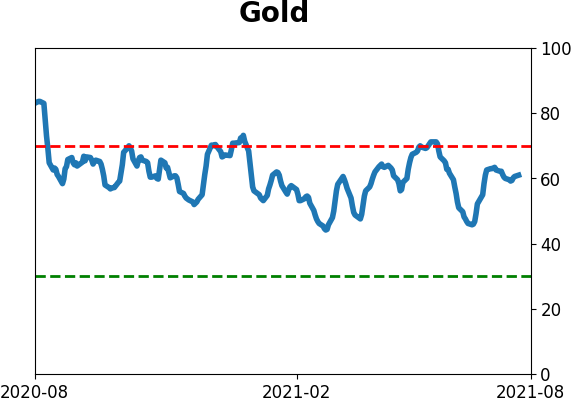
Gold and miners have done very well, recovering above long-term trend lines. The issue is that both have tended to perform poorly after similar situations - will have to wait and see how it plays out.
|
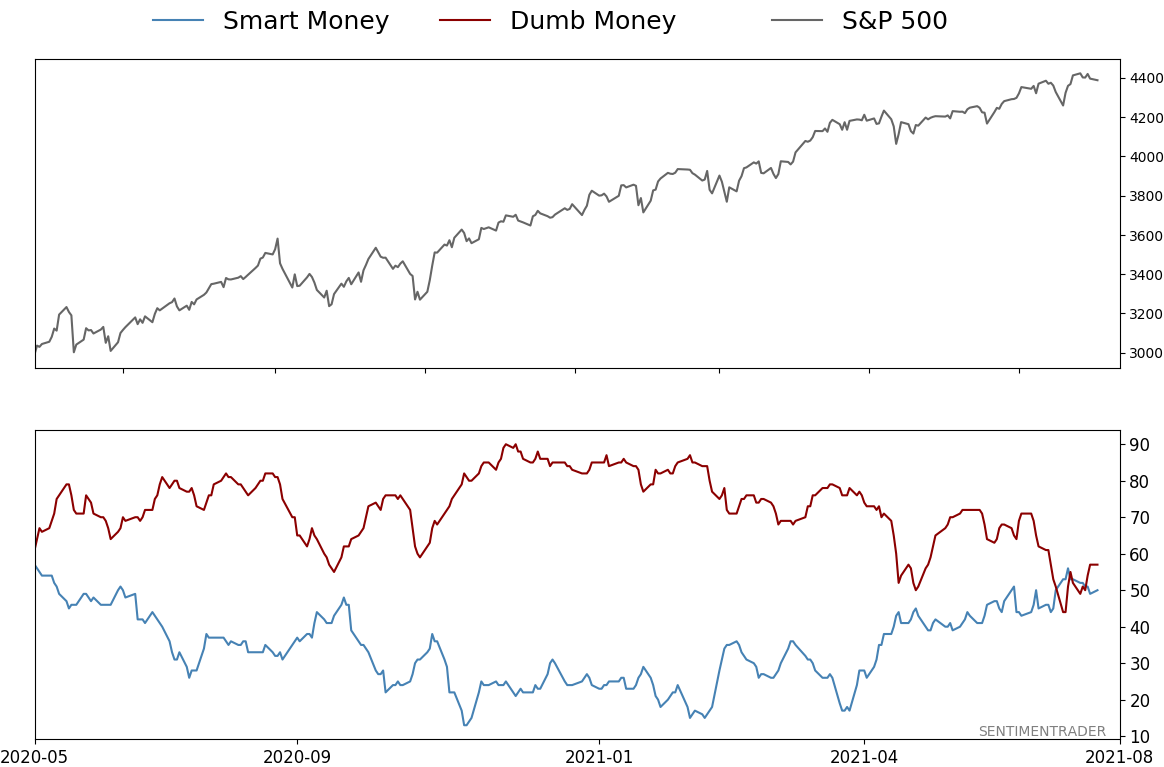
Smart / Dumb Money Confidence
|
Smart Money Confidence: 50%
Dumb Money Confidence: 57%
|
|
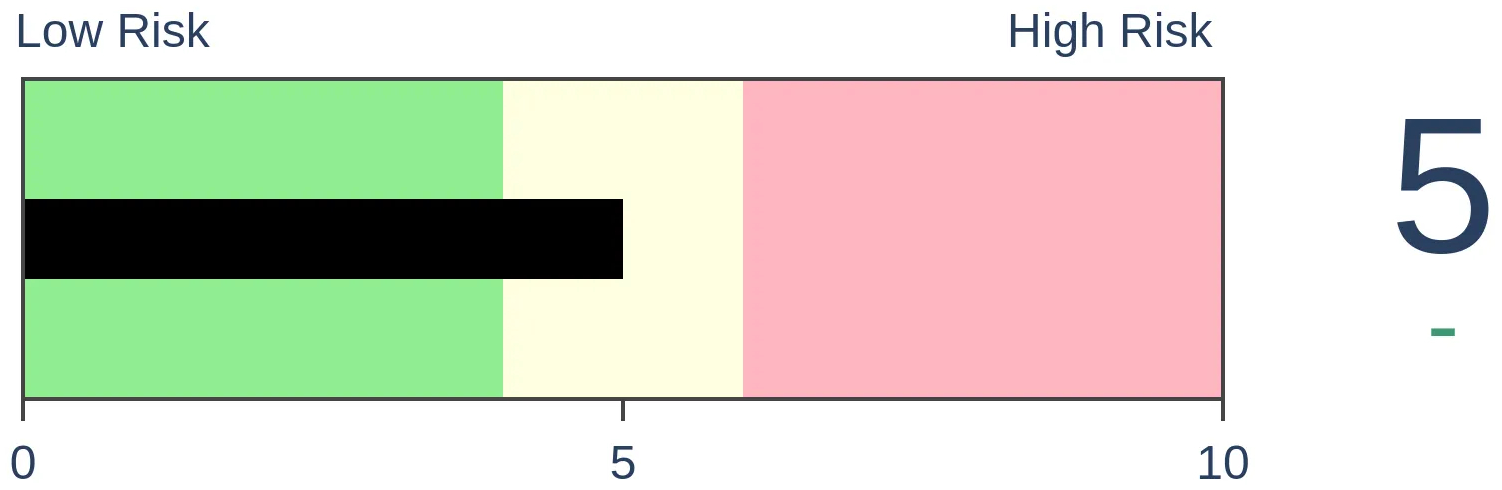
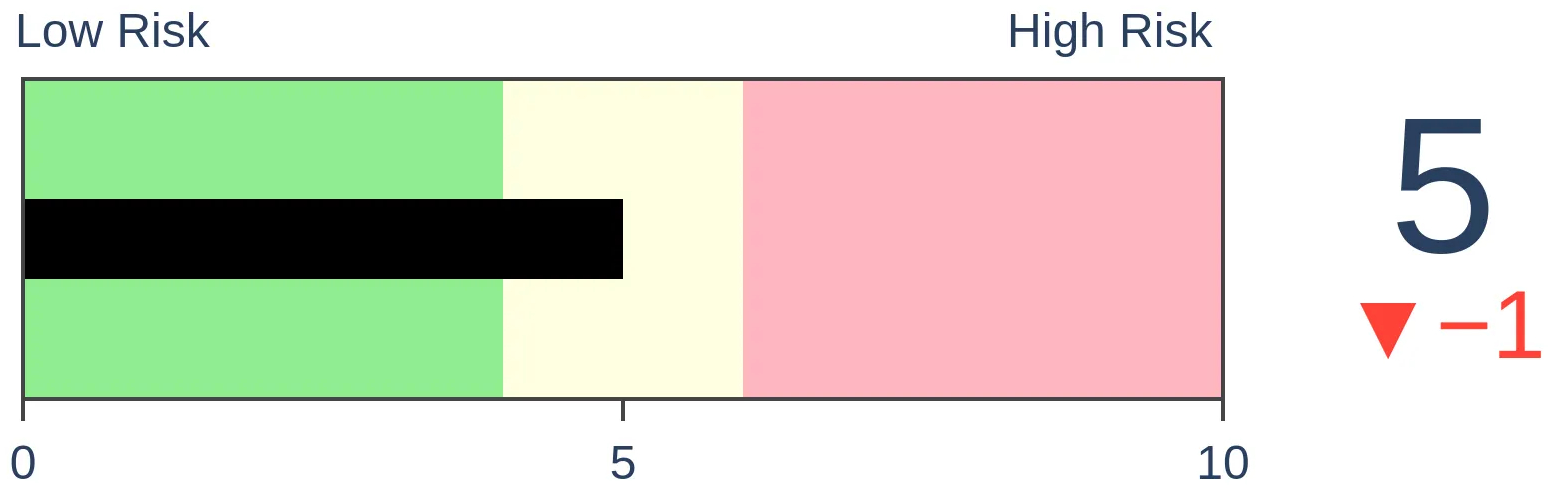
Risk Levels
Stocks Short-Term

|
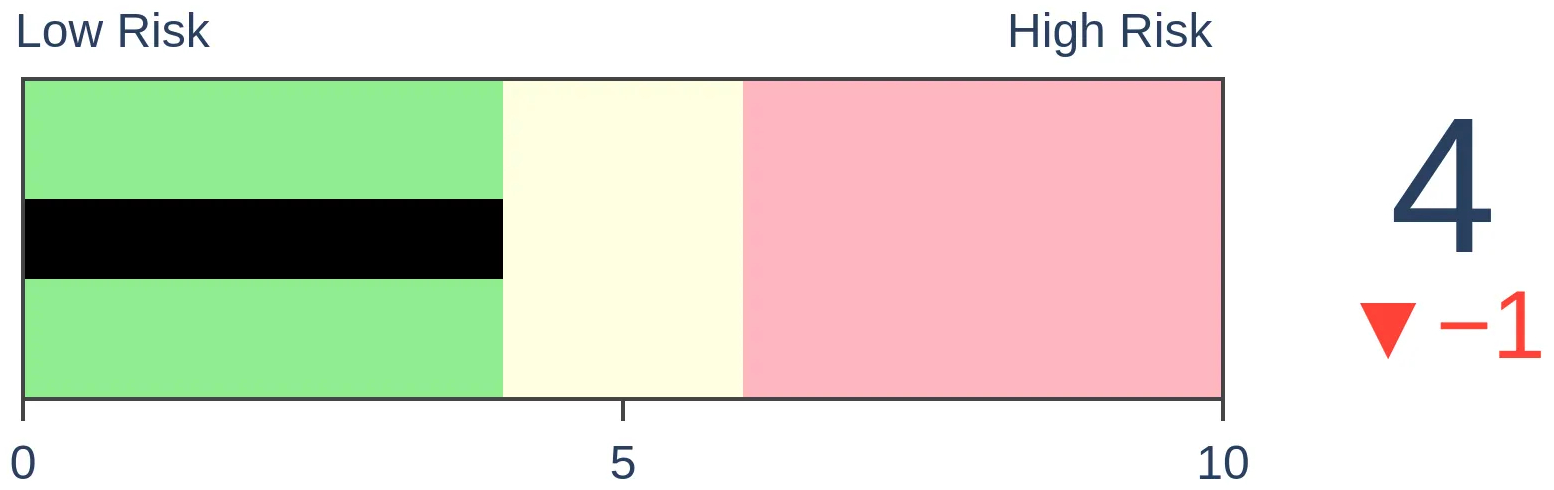
Stocks Medium-Term
|
|
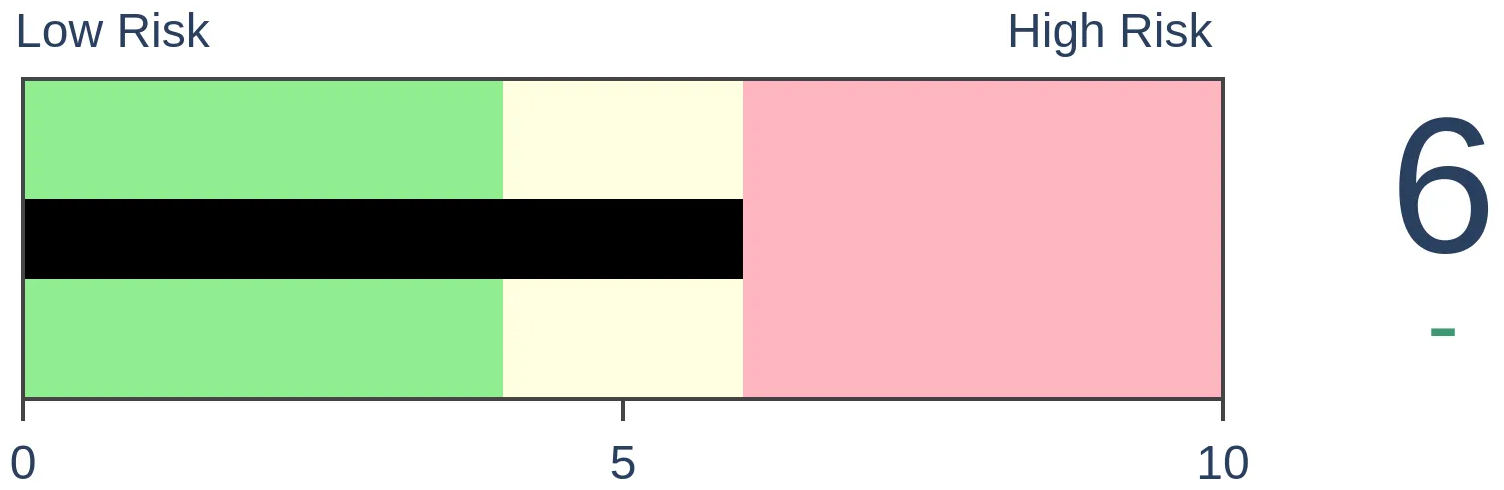
Bonds
|
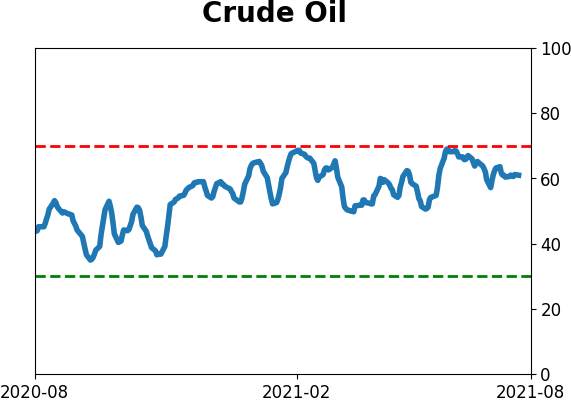
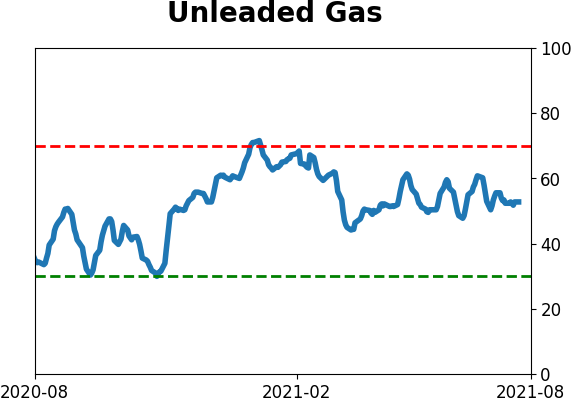
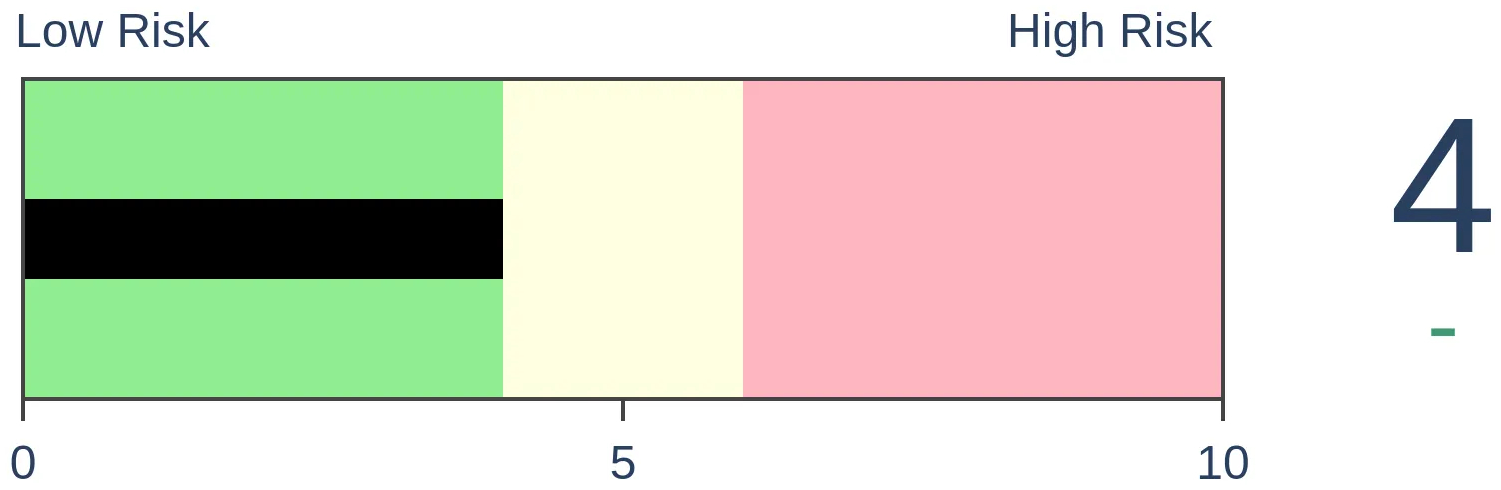
Crude Oil
|
|
Gold
|
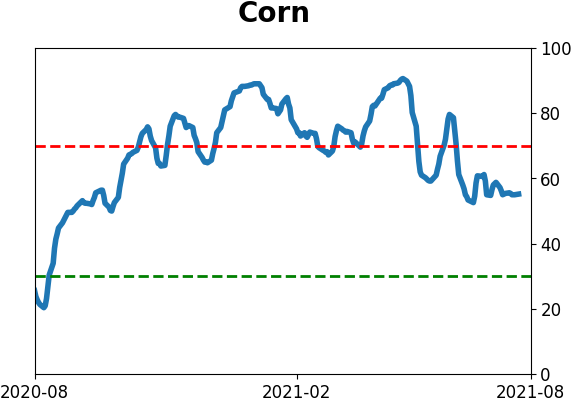
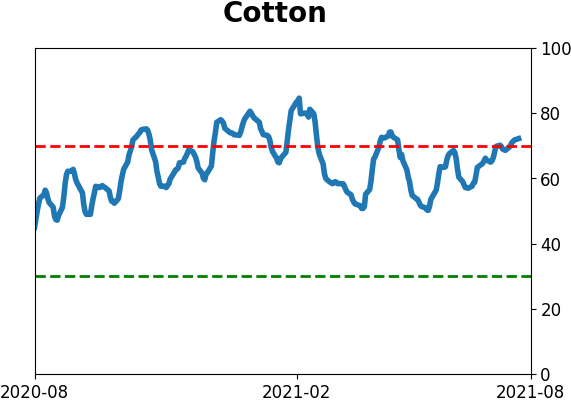
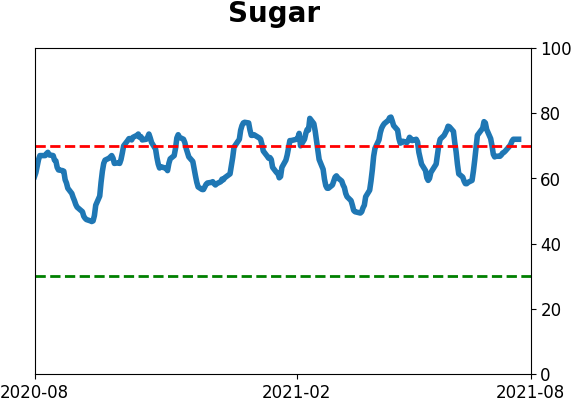
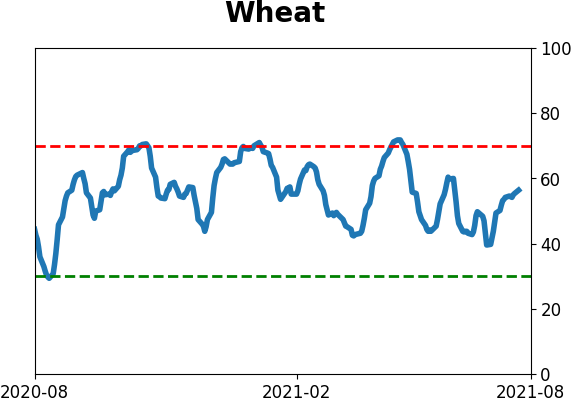
Agriculture
|
|
Research
By Jason Goepfert
BOTTOM LINE
For the first time in over a year, hard economic surprises have come in well below economists' expectations. This was not a consistent reason to sell stocks, but bonds did suffer most of the time.
FORECAST / TIMEFRAME
None
|
When economic releases beat economists' expectations, they raise their forecasts for the next releases. Like investors, economists suffer terribly (in aggregate) from recency bias.
And recently, that bias has been ugly. Hard economic releases covering topics like labor conditions, housing, and industrial performance, have missed expectations by an average of 22%. It's been more than a year since the gauges of the "real" economy have disappointed by so much.
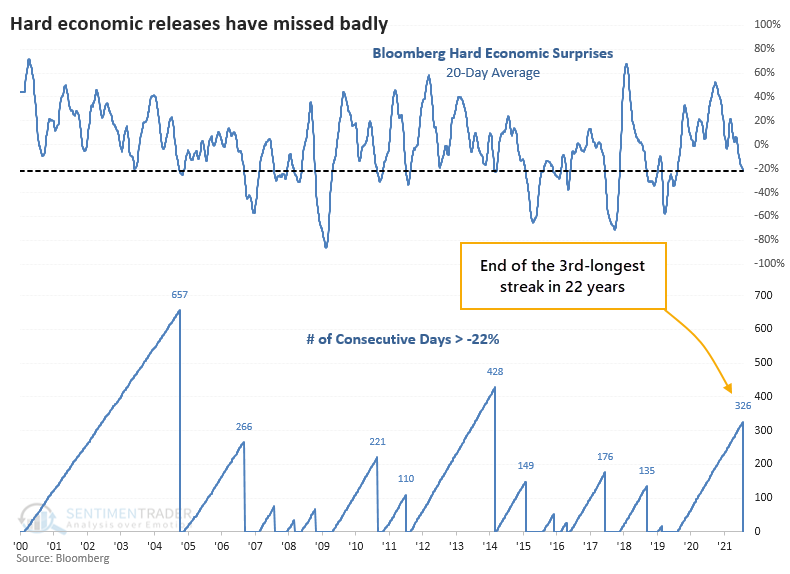
The 20-day average of Bloomberg's real economic surprises has eclipsed -22% for the first time in well over a year. This ends the 3rd-longest streak of "not really bad" surprises in over 20 years.
STOCKS "MEH," BONDS "UGH"
For equity investors, this was not necessarily a good reason to sell.
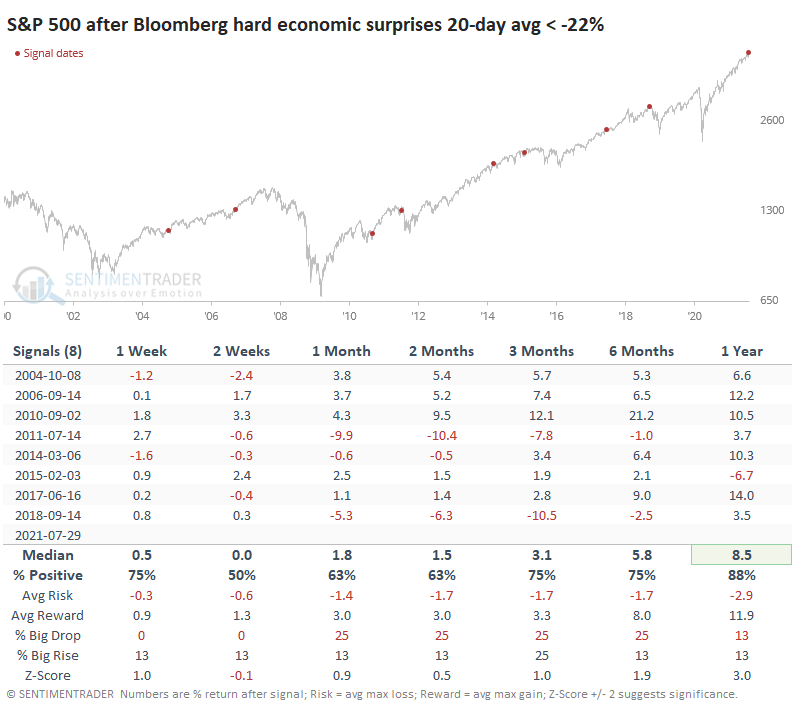
Despite a string of disappointing economic news, the S&P 500 tended to hold together. There were a couple of larger interim losses in the fall of 2011 and winter of 2018, but otherwise, stocks gained by at least a modest amount in the months ahead. Over the past decade, the S&P's returns were only modest at best during the next couple of months, though.
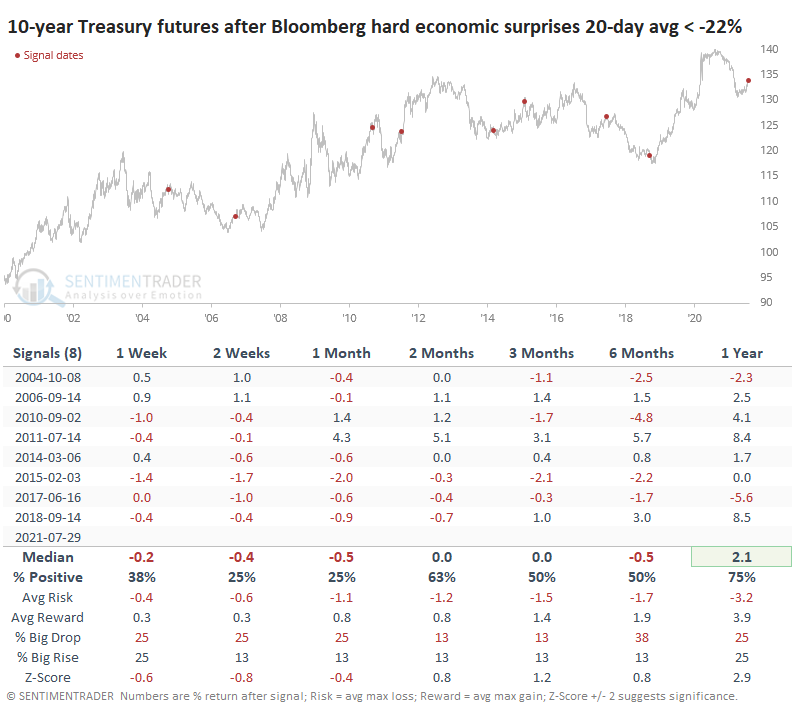
We might expect such soft performance in economic indicators to lead to a bump in bond prices (lower yields), but we would be wrong. The opposite was more the rule than the exception. Prices on 10-year Treasury futures showed a loss every time sometime between 2-4 weeks later.
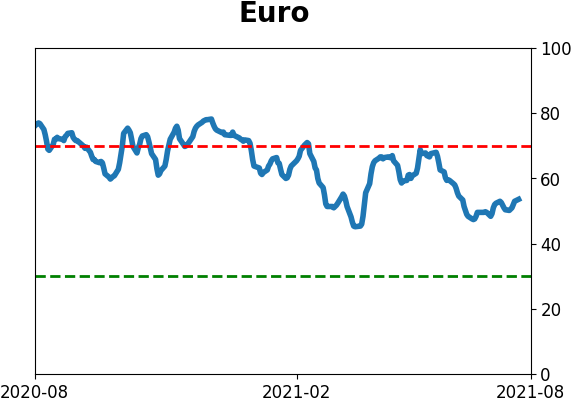
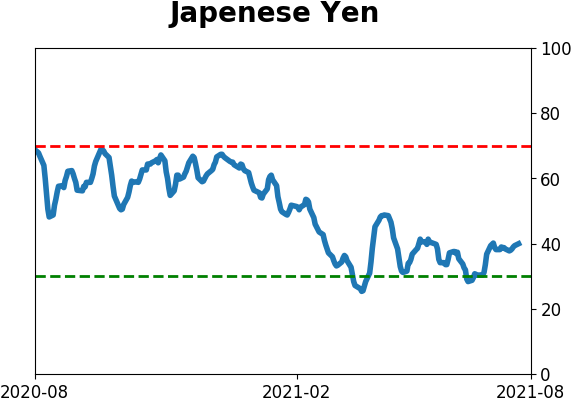
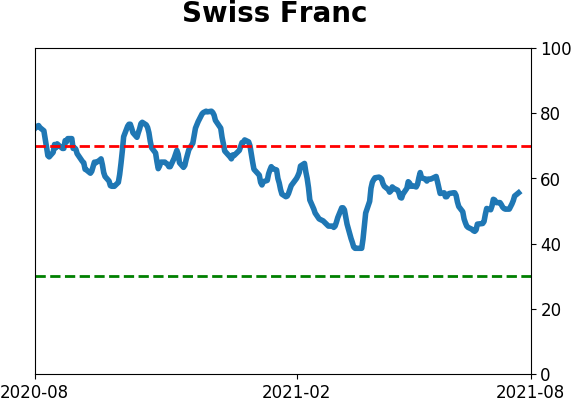
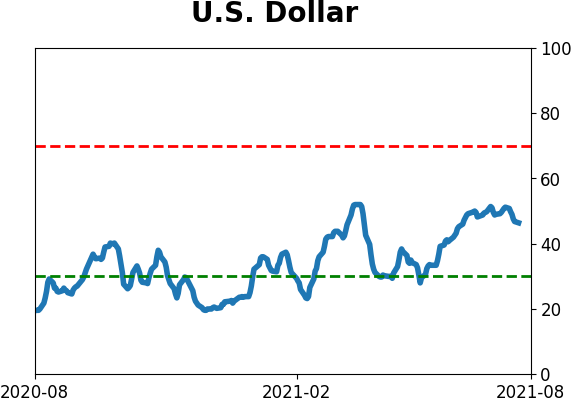
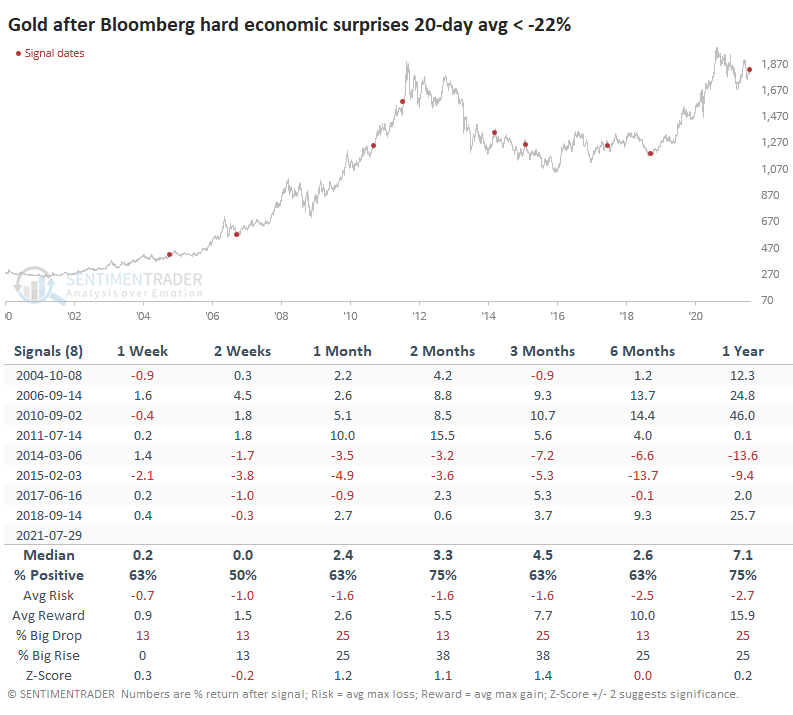
DOLLAR DOWN, GOLD UP (MOSTLY)
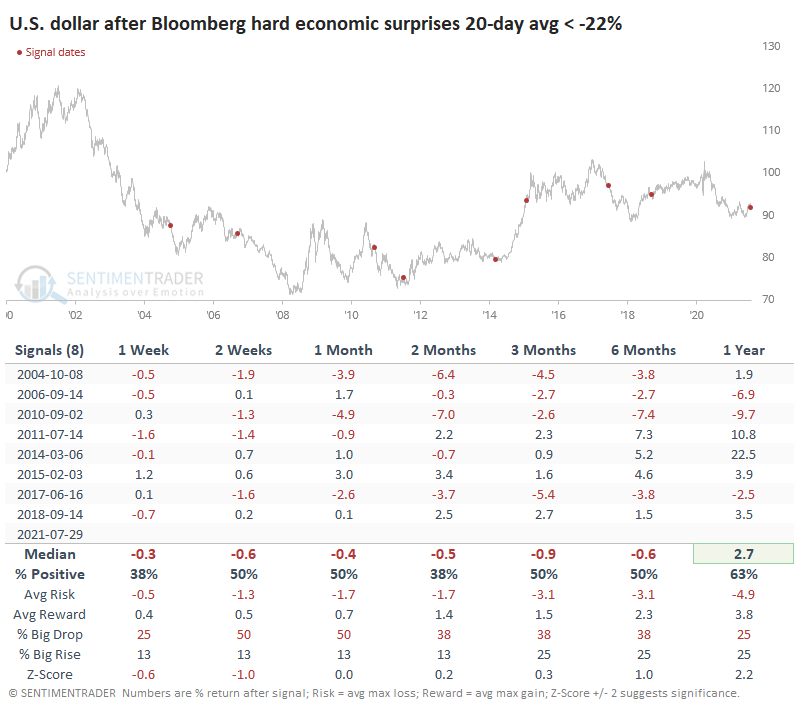
The U.S. dollar tended to weaken in the shorter term, then rally.
Gold did just fine, though the last four signals preceded at least short-term losses.
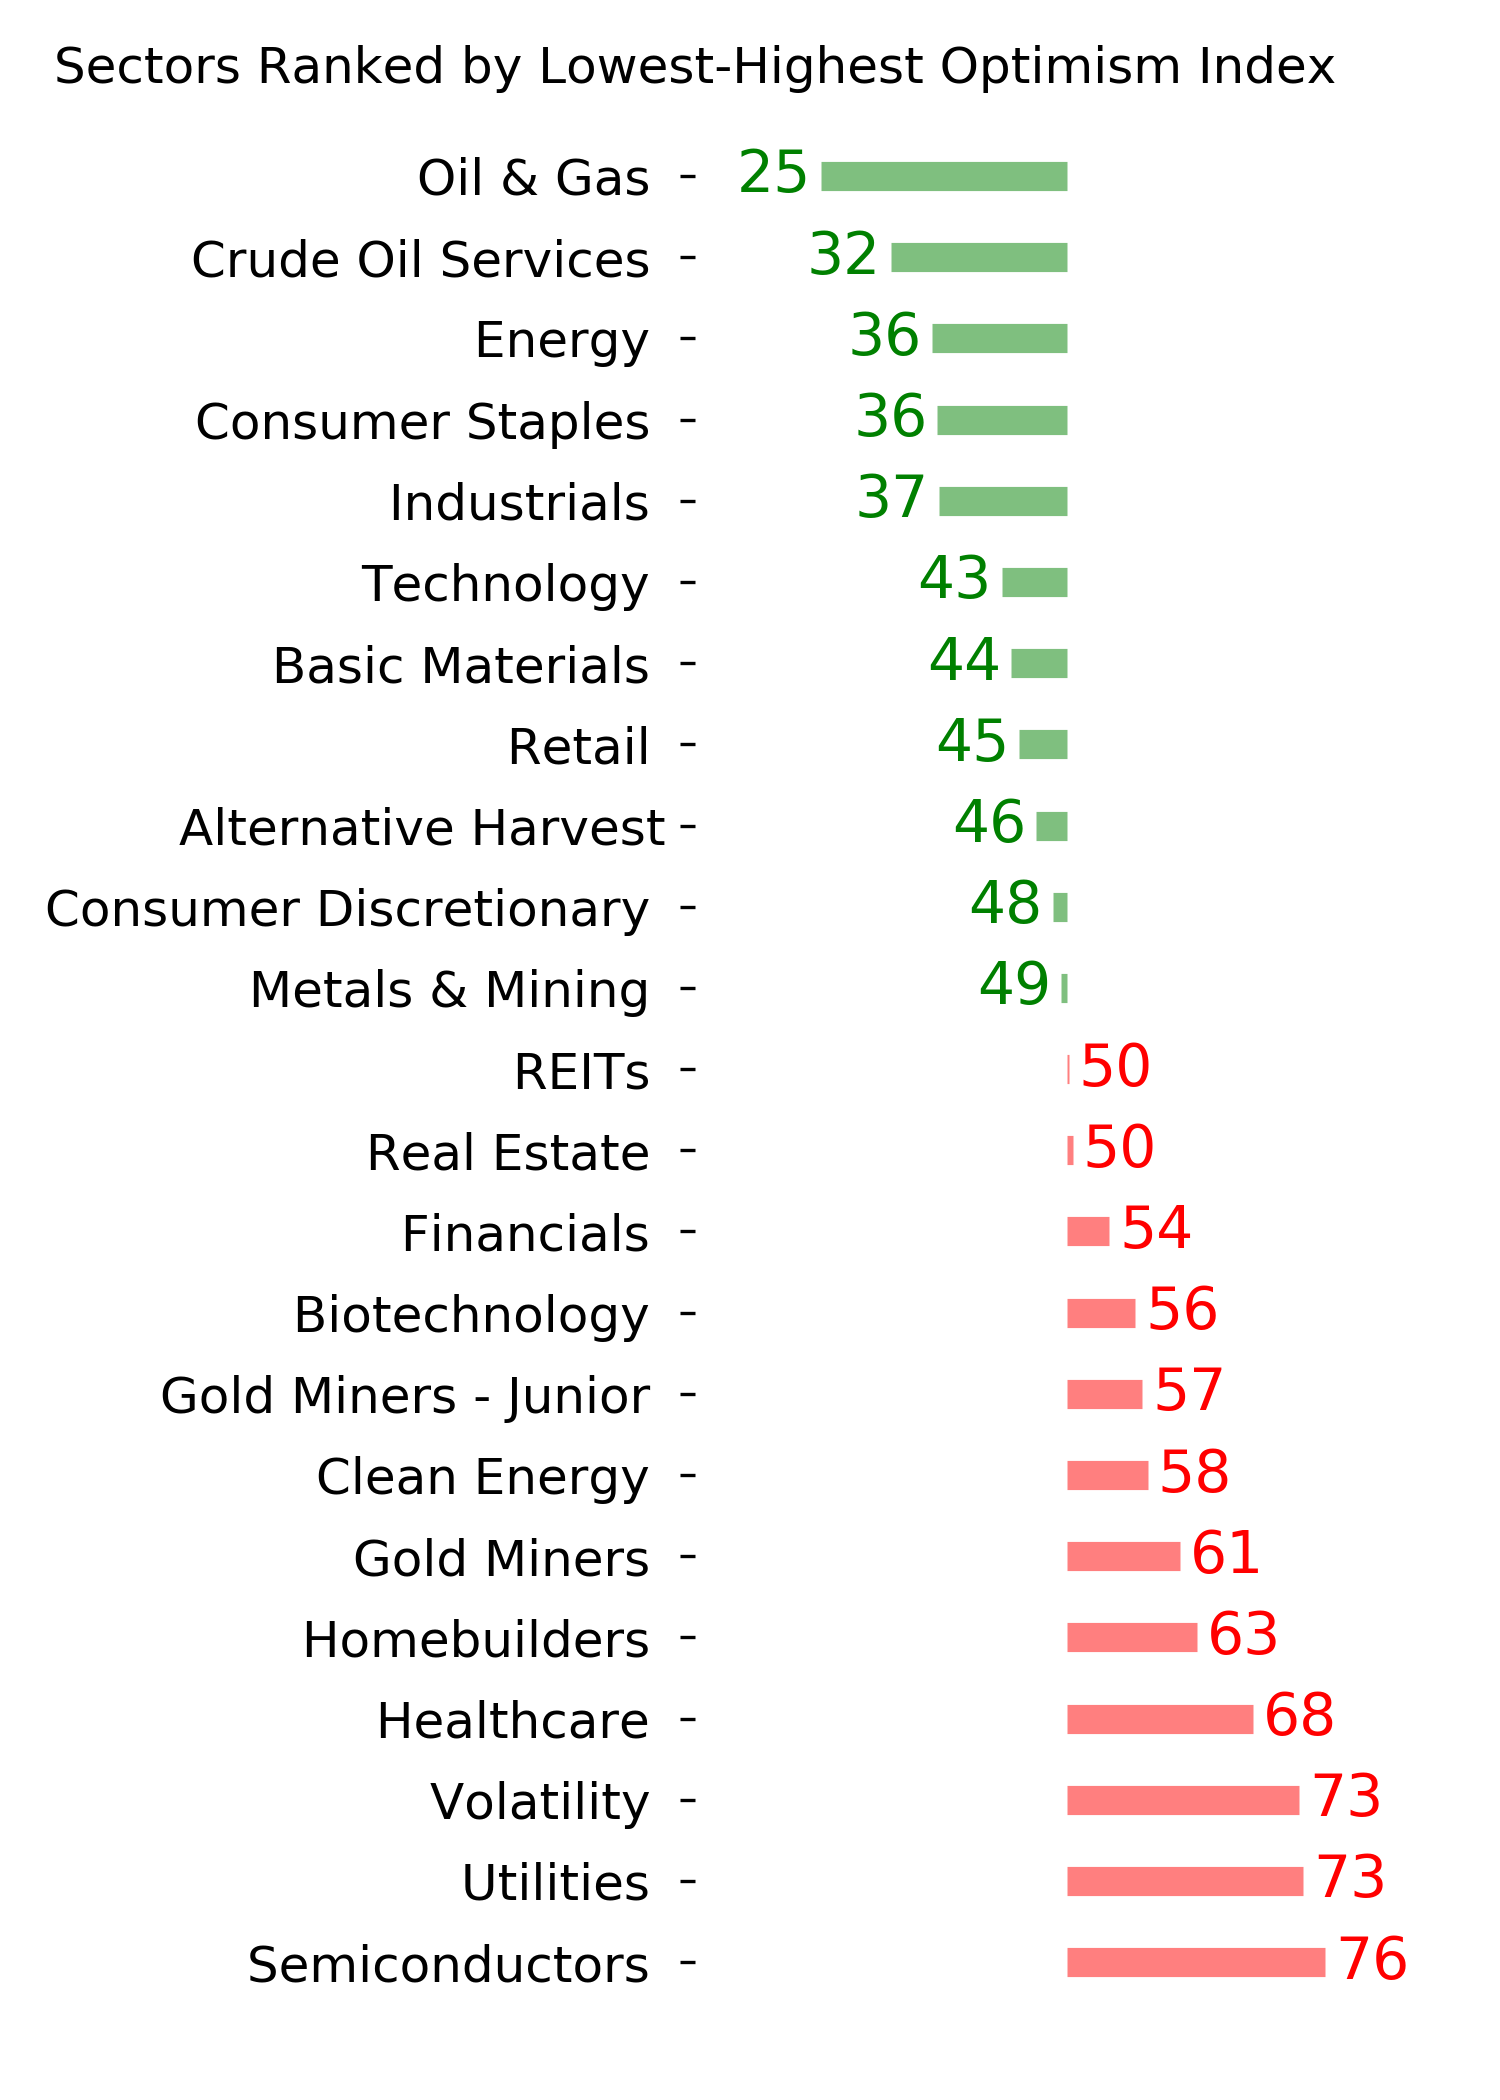
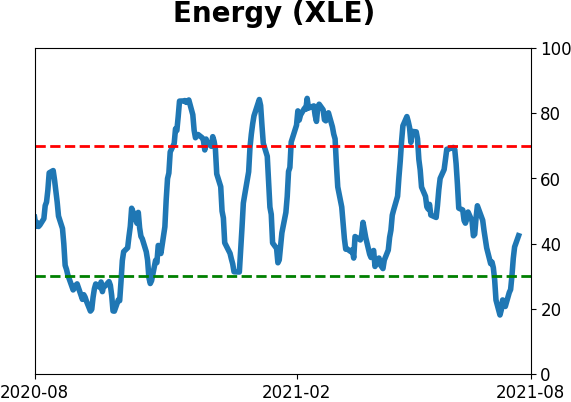
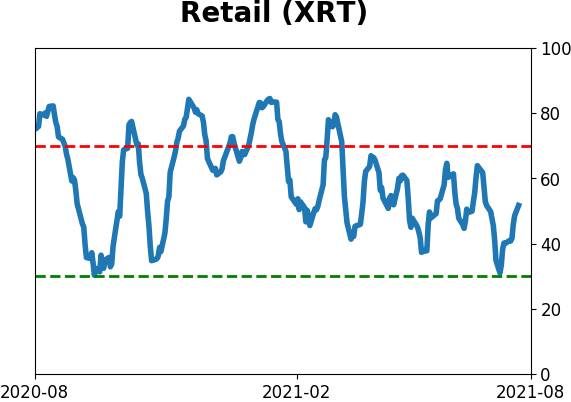
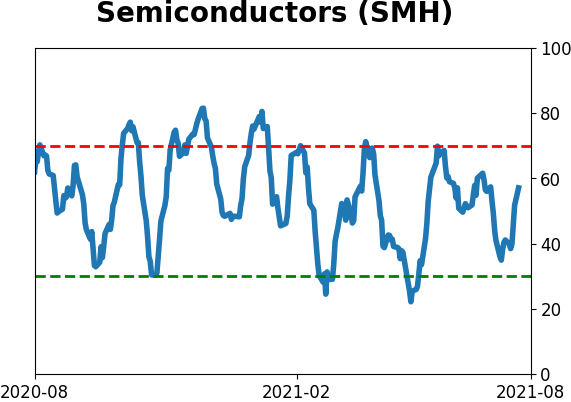
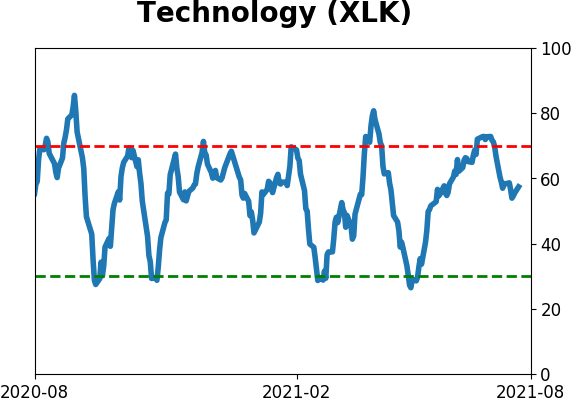
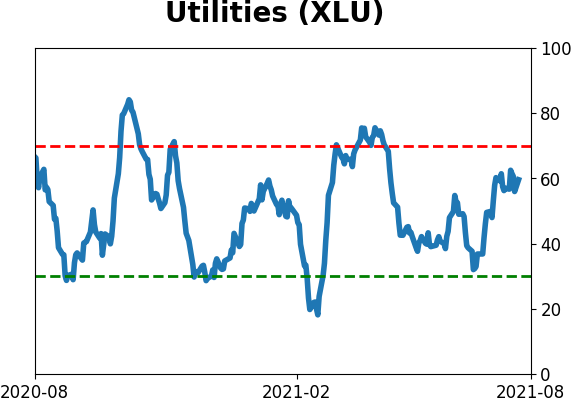
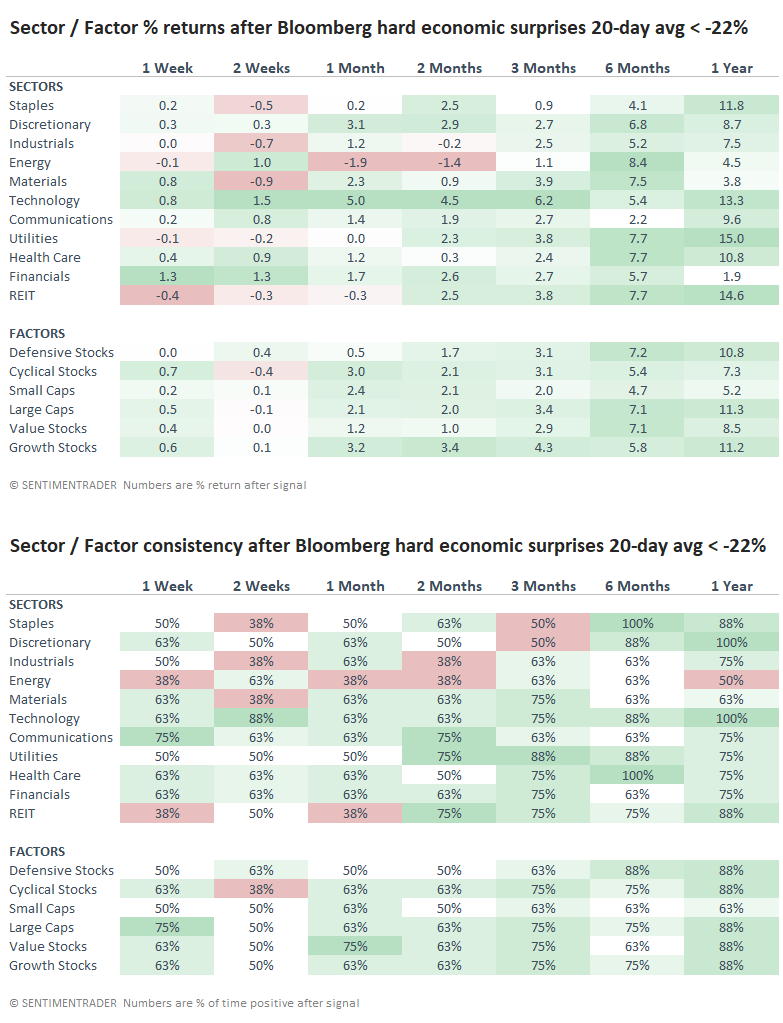
These signals preceded relatively weak returns for Energy stocks, while Technology did well. That doesn't fit very well with some other studies that have triggered lately.
Over the past decade, large disappointments in real economic indicators have served to put a temporary brake on stock prices, so that's a minor concern here. It's not consistent enough to be a solid reason to sell. Ironically, it's been a better sell signal for bond prices.
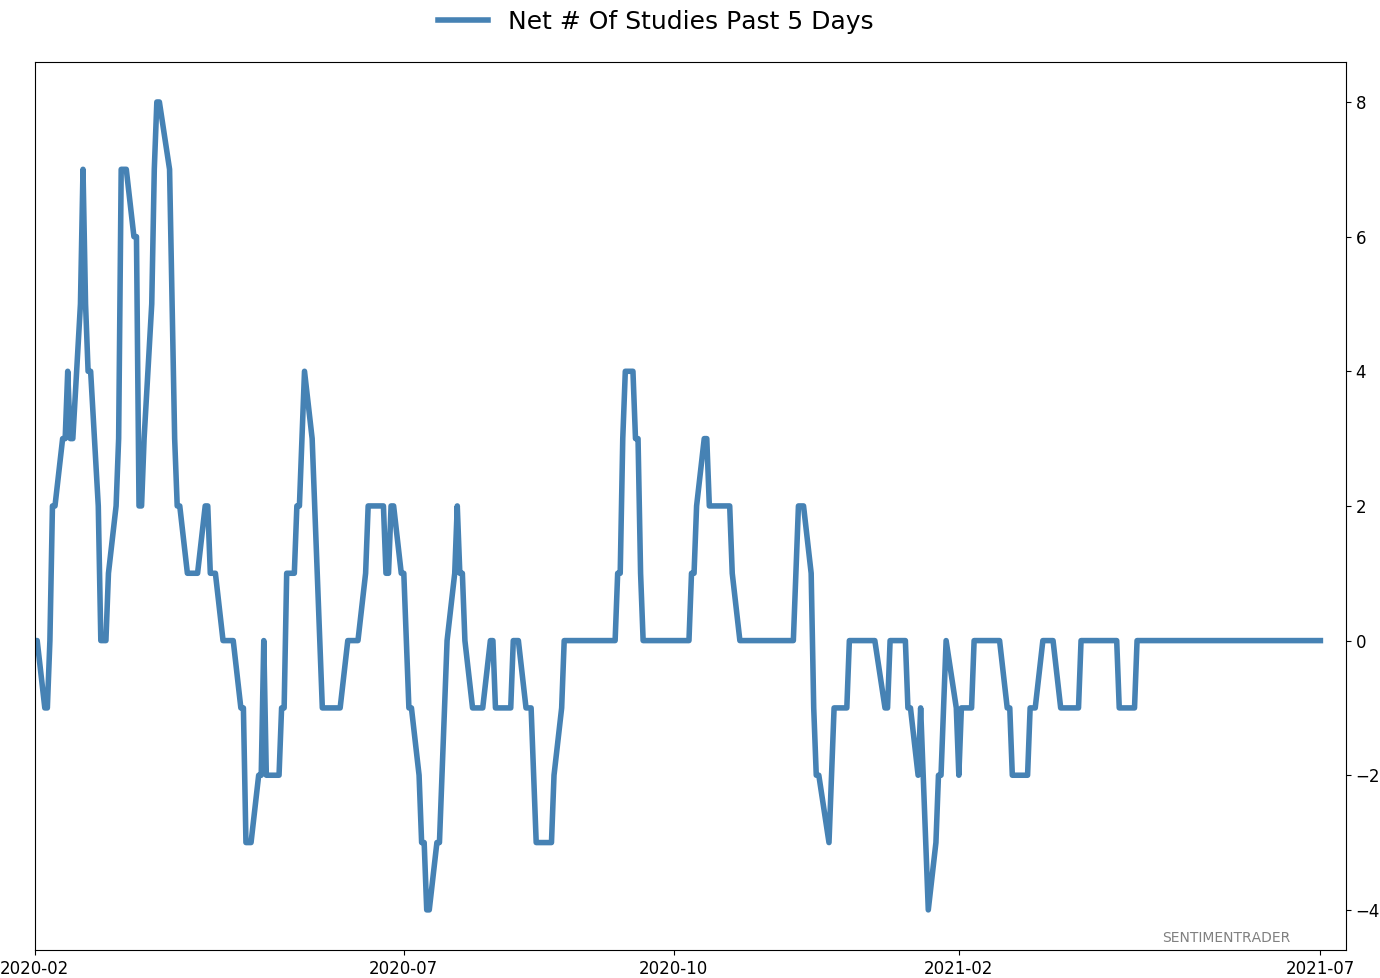
Active Studies
| Time Frame | Bullish | Bearish | | Short-Term | 0 | 4 | | Medium-Term | 4 | 3 | | Long-Term | 10 | 5 |
|
Indicators at Extremes
Portfolio
| Position | Description | Weight % | Added / Reduced | Date | | Stocks | RSP | 4.1 | Added 4.1% | 2021-05-19 | | Bonds | 23.9% BND, 6.9% SCHP | 30.7 | Reduced 7.1% | 2021-05-19 | | Commodities | GCC | 2.6 | Reduced 2.1%
| 2020-09-04 | | Precious Metals | GDX | 5.6 | Reduced 4.2% | 2021-05-19 | | Special Situations | 4.3% XLE, 2.2% PSCE | 7.6 | Reduced 5.6% | 2021-04-22 | | Cash | | 49.4 | | |
|
Updates (Changes made today are underlined)
Much of our momentum and trend work has remained positive for several months, with some scattered exceptions. Almost all sentiment-related work has shown a poor risk/reward ratio for stocks, especially as speculation drove to record highs in exuberance in February. Much of that has worn off, and most of our models are back toward neutral levels. There isn't much to be excited about here. The same goes for bonds and even gold. Gold has been performing well lately and is back above long-term trend lines. The issue is that it has a poor record of holding onto gains when attempting a long-term trend change like this, so we'll take a wait-and-see approach. RETURN YTD: 9.1% 2020: 8.1%, 2019: 12.6%, 2018: 0.6%, 2017: 3.8%, 2016: 17.1%, 2015: 9.2%, 2014: 14.5%, 2013: 2.2%, 2012: 10.8%, 2011: 16.5%, 2010: 15.3%, 2009: 23.9%, 2008: 16.2%, 2007: 7.8%
|
|
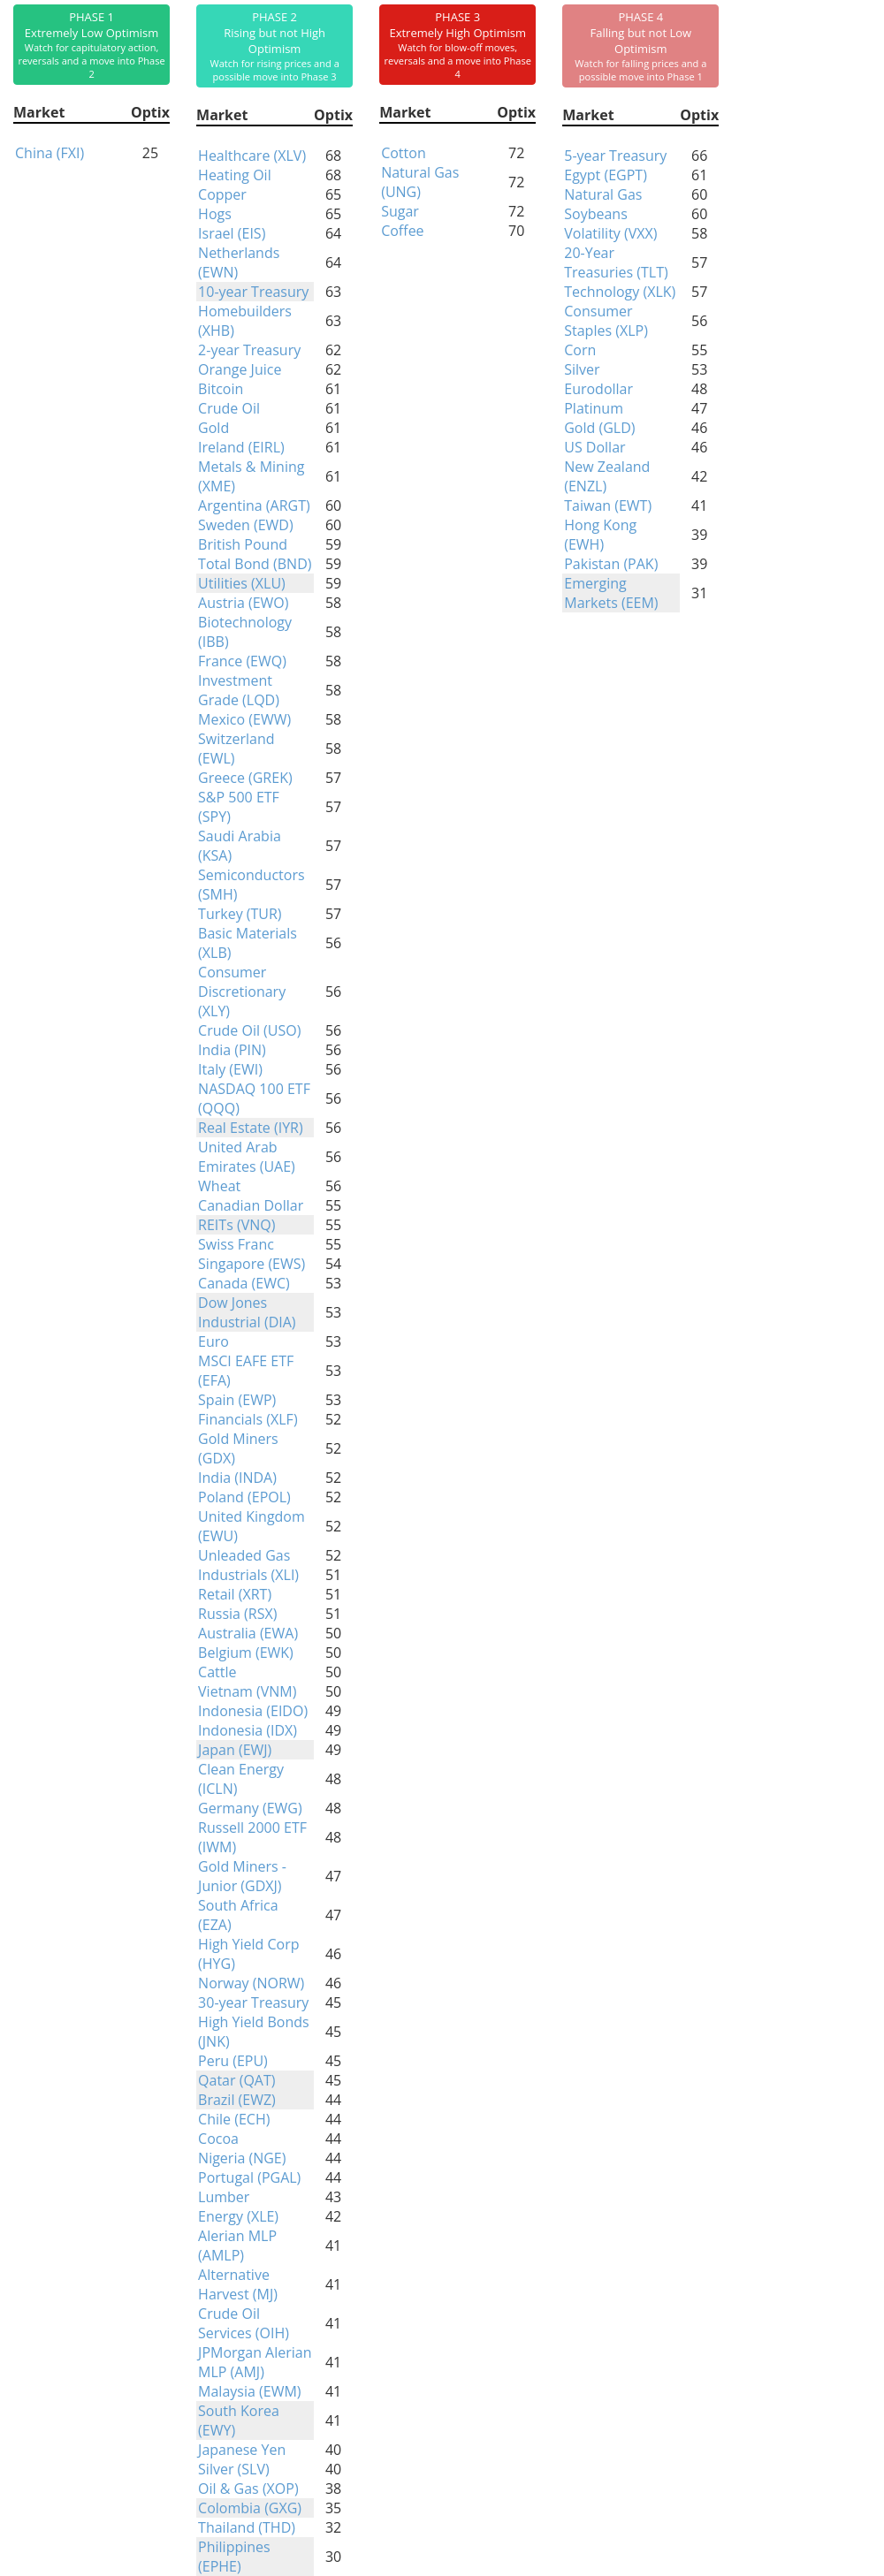
Phase Table
Ranks
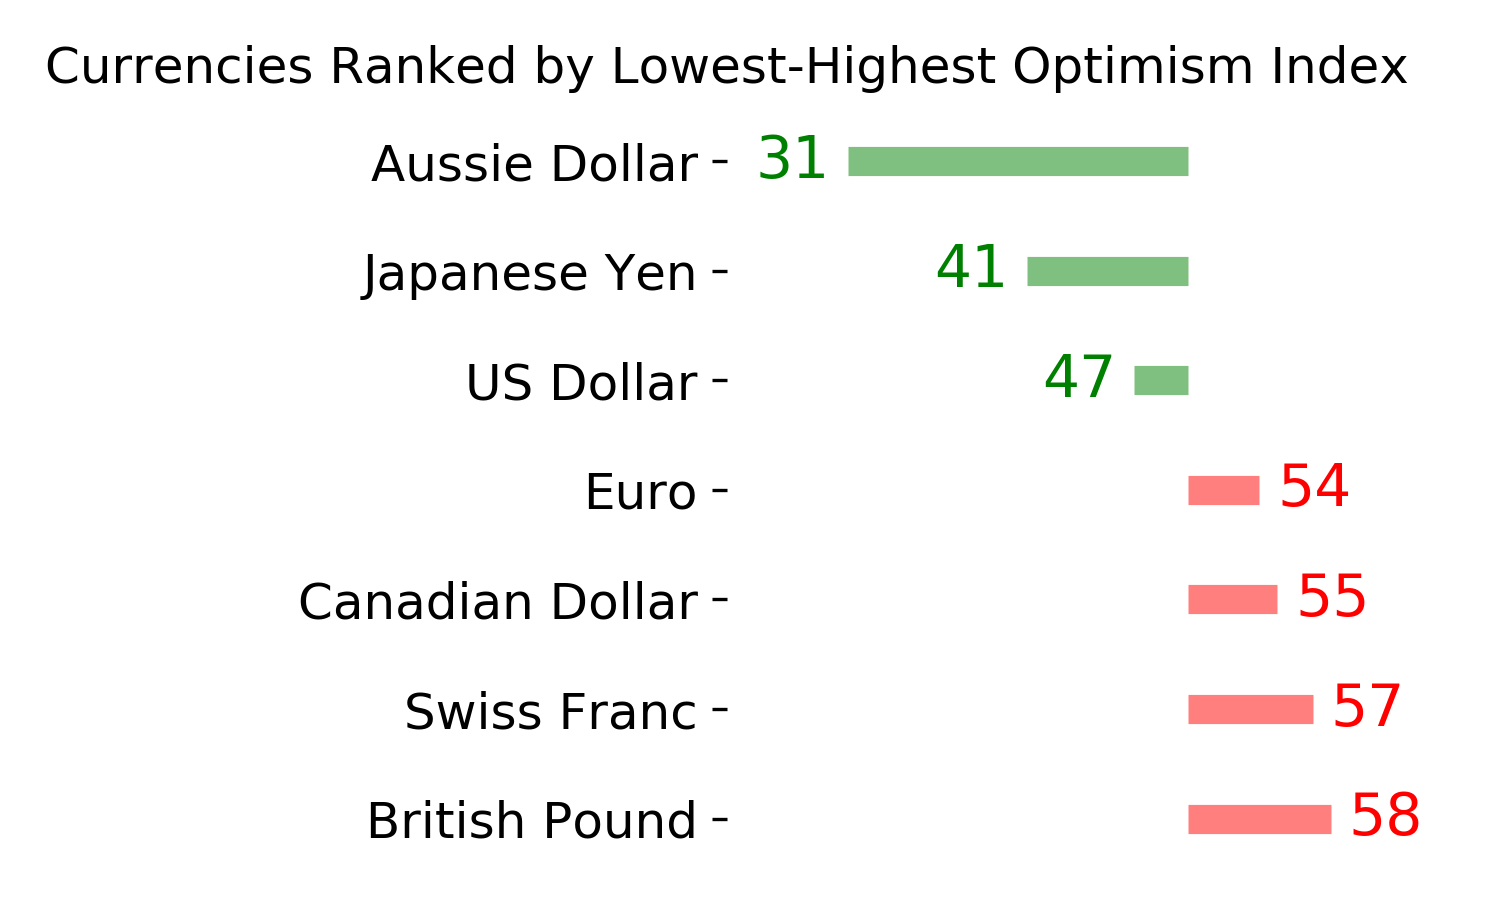
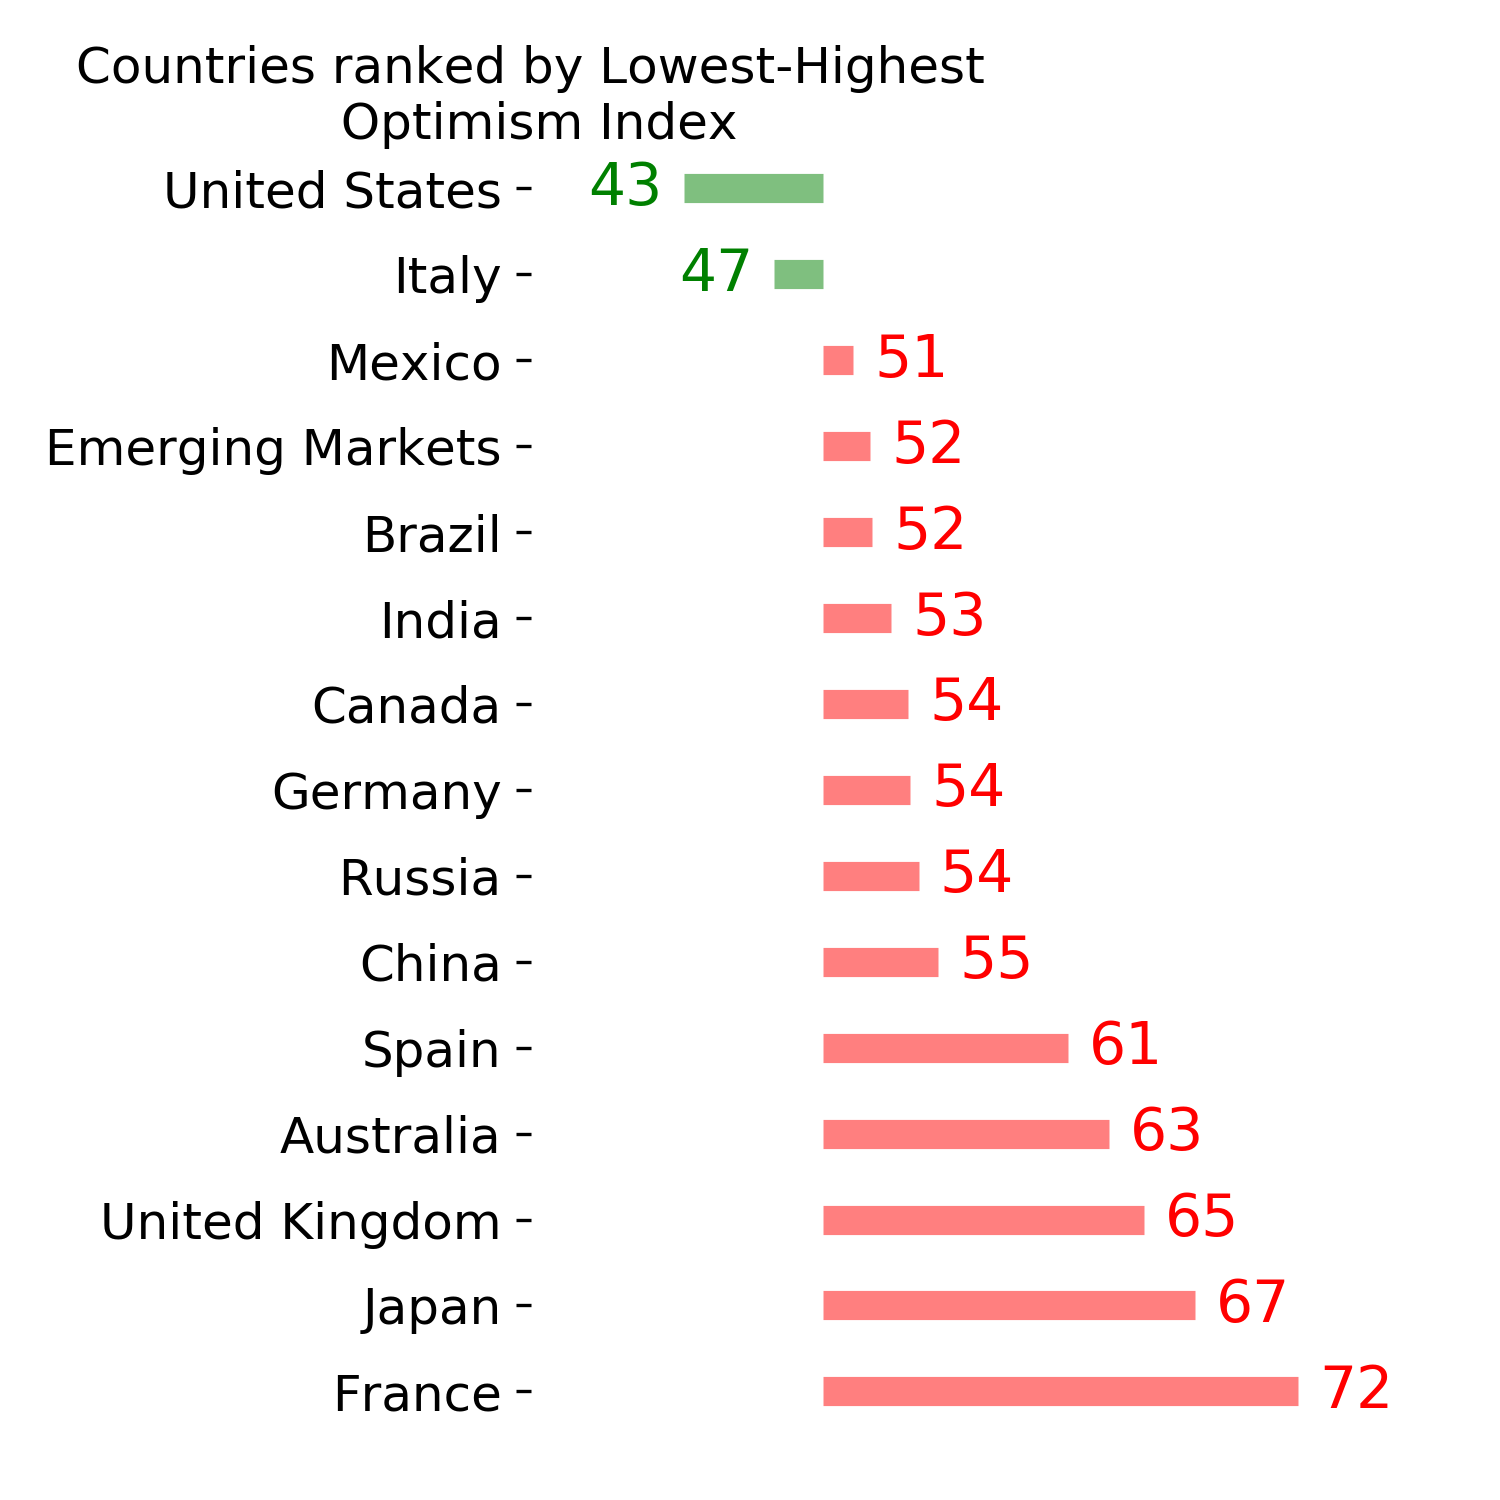
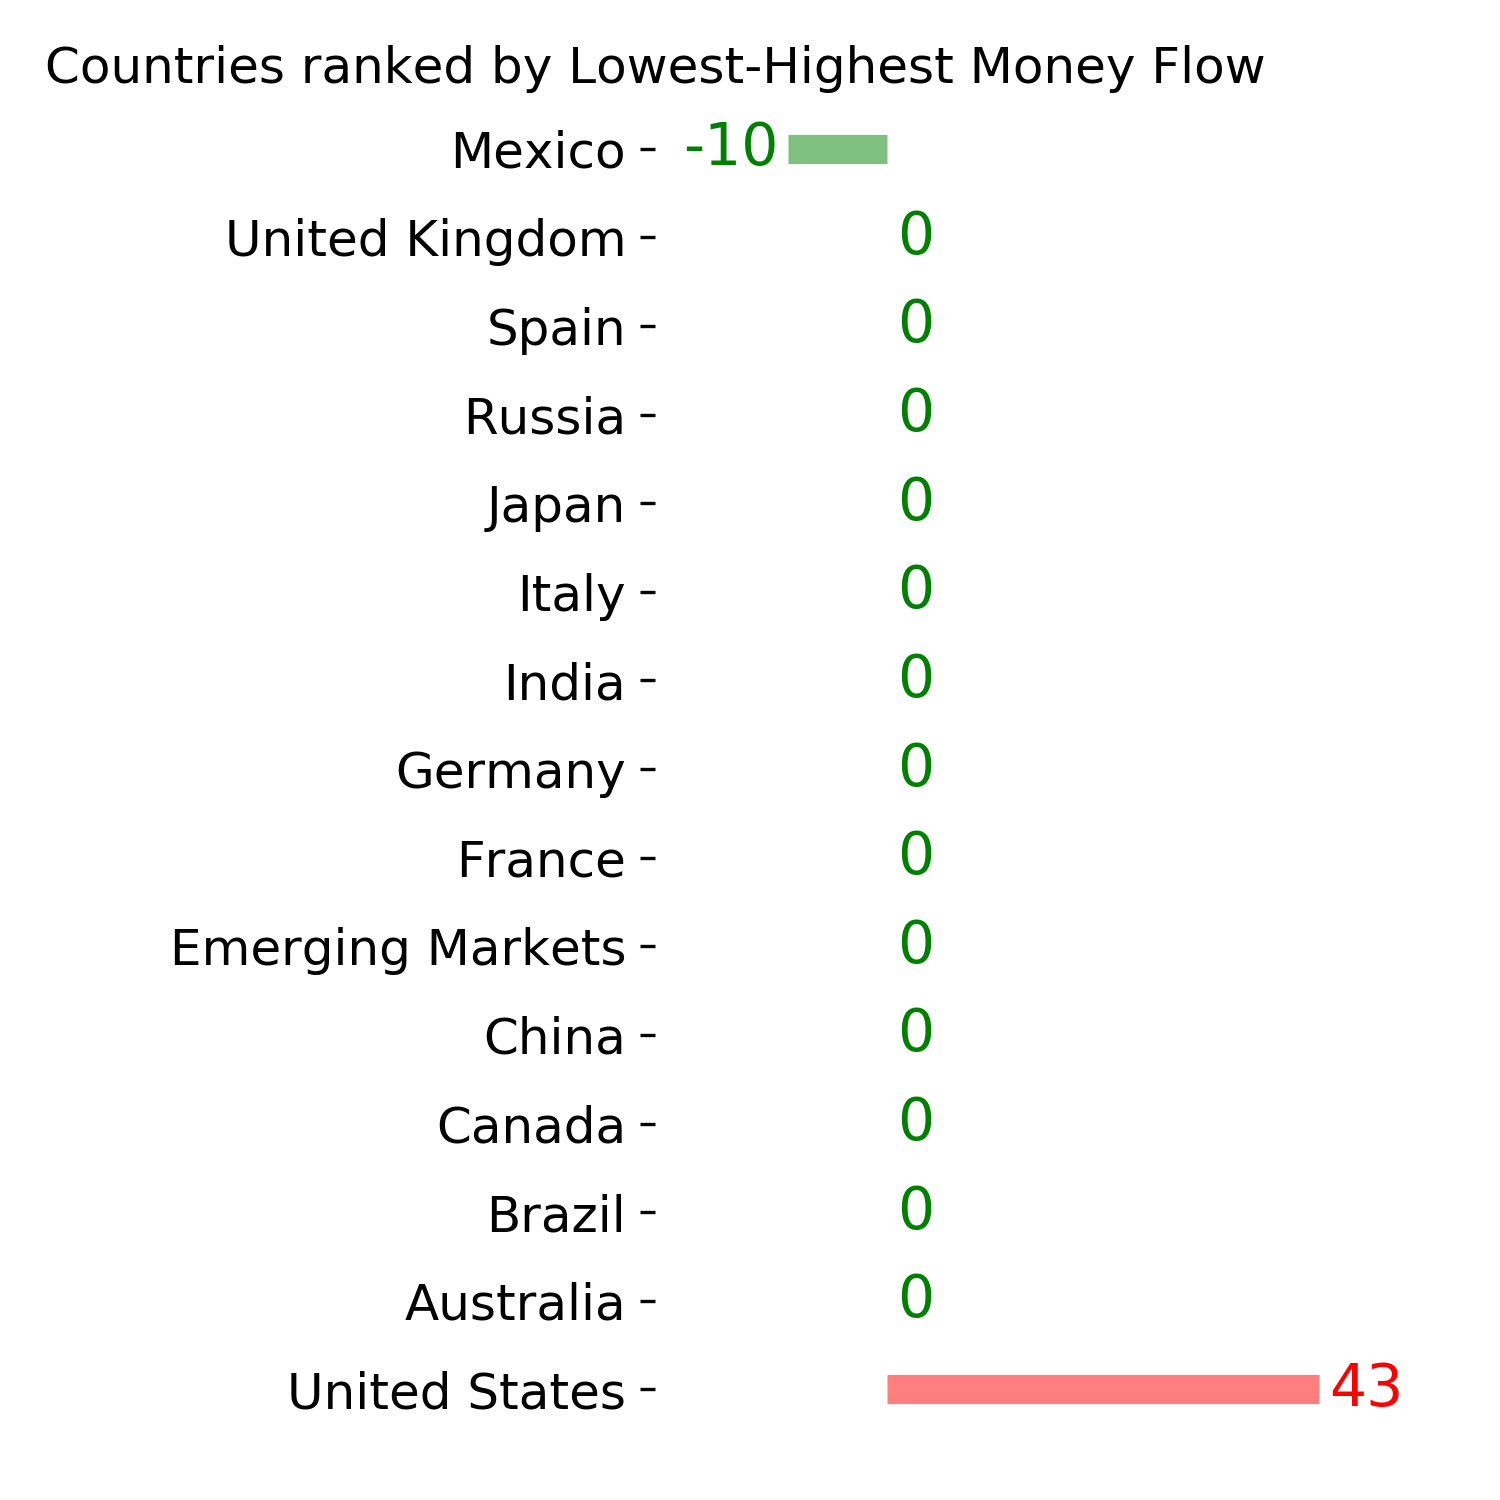
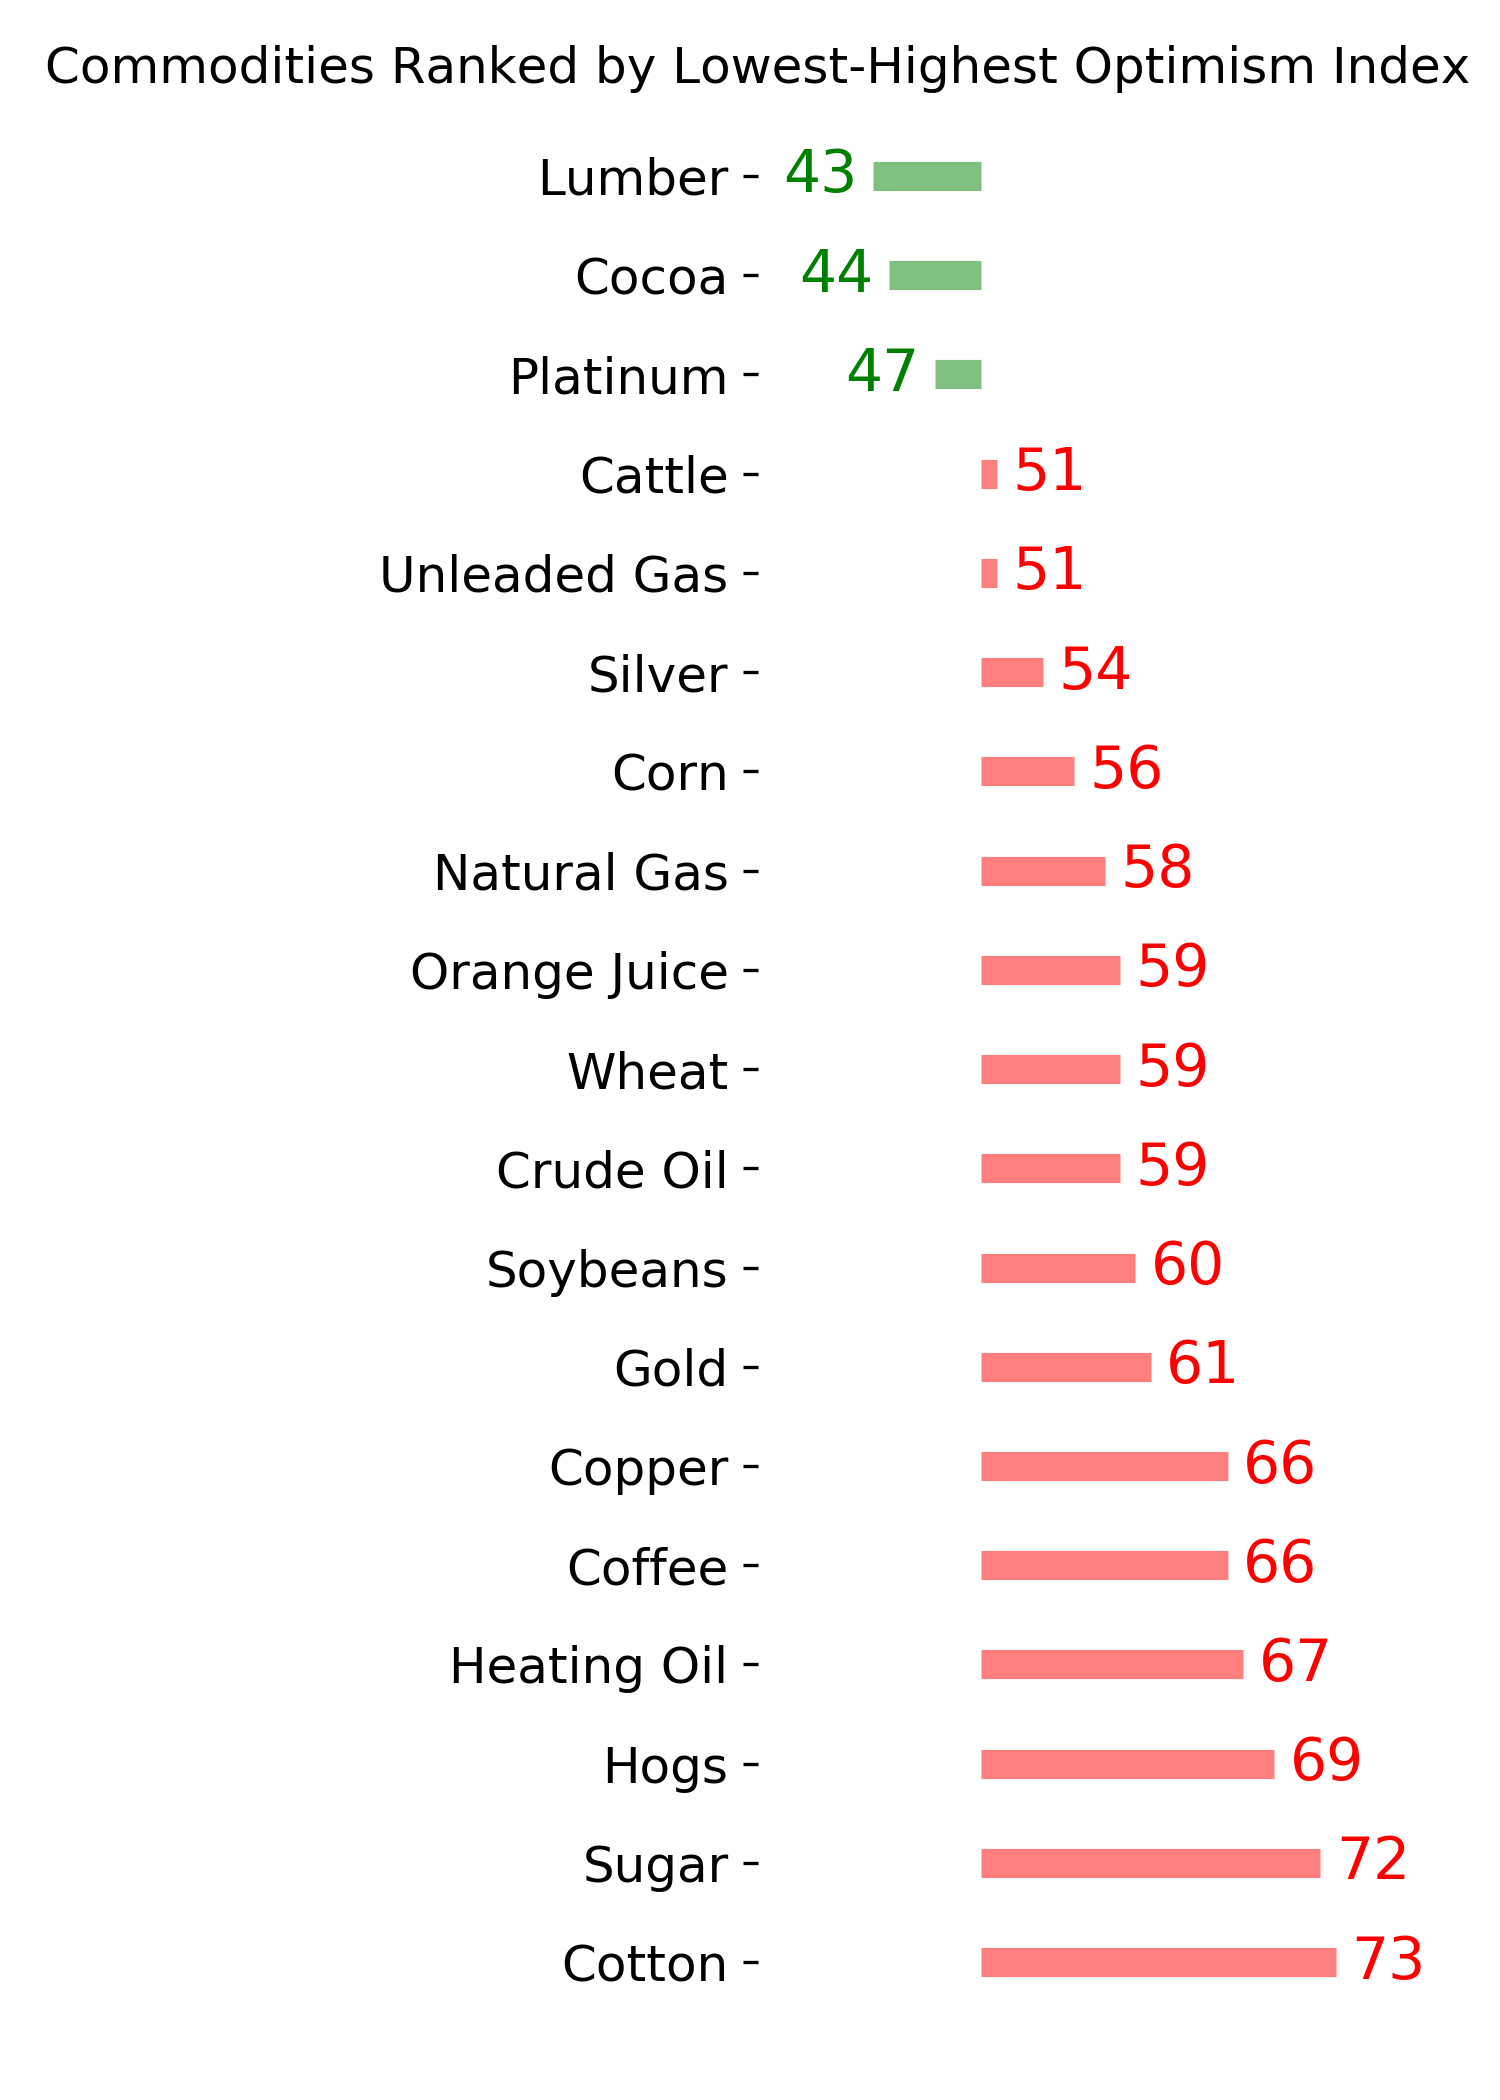
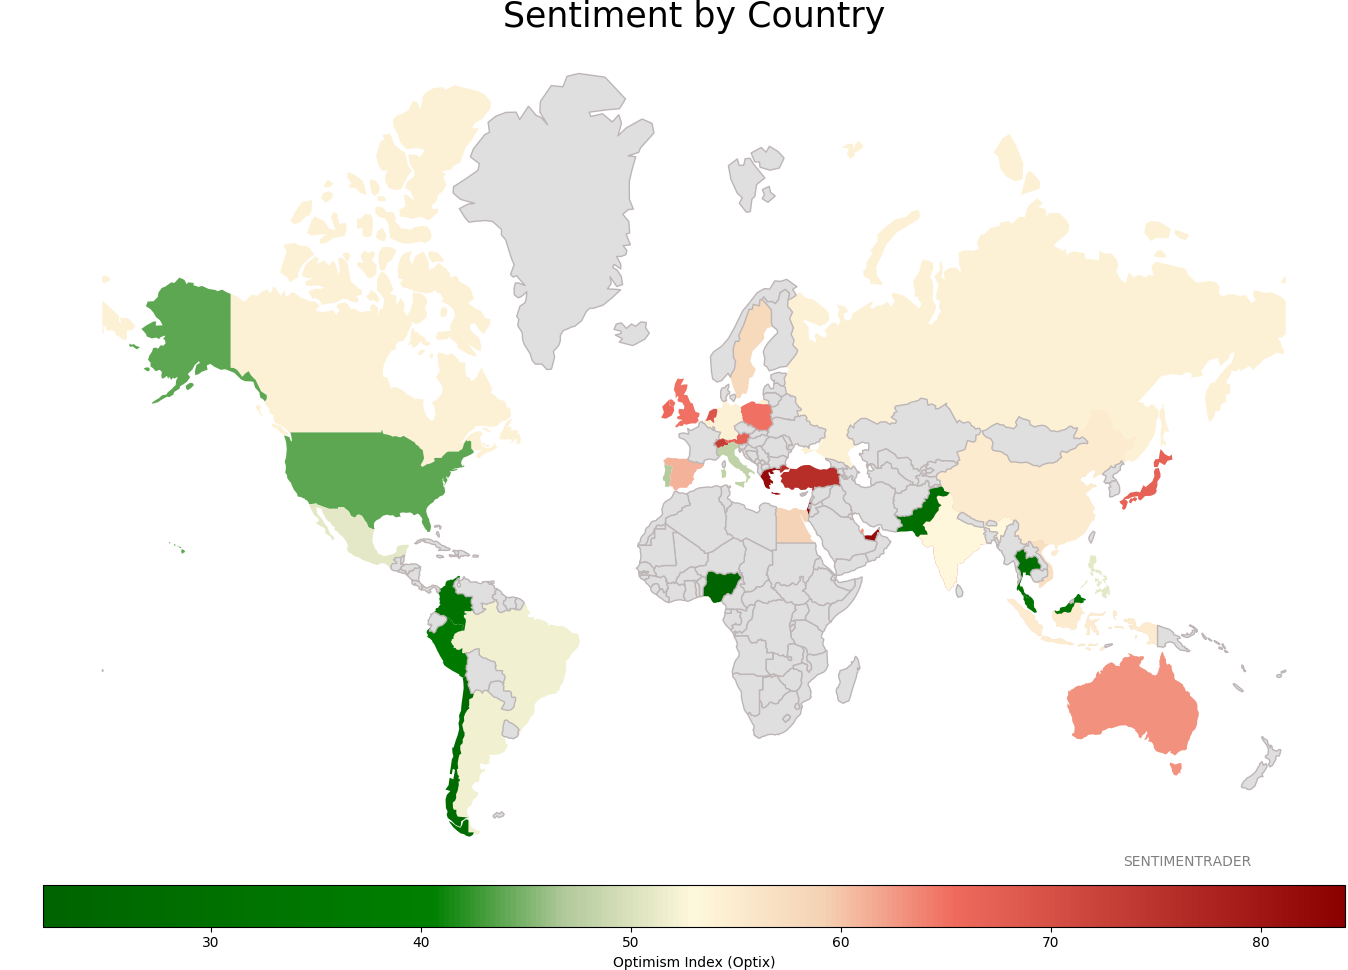
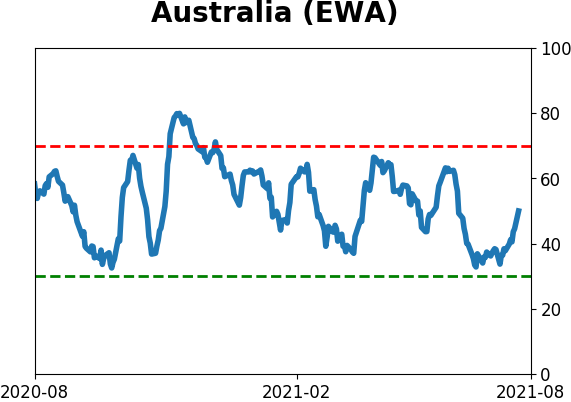
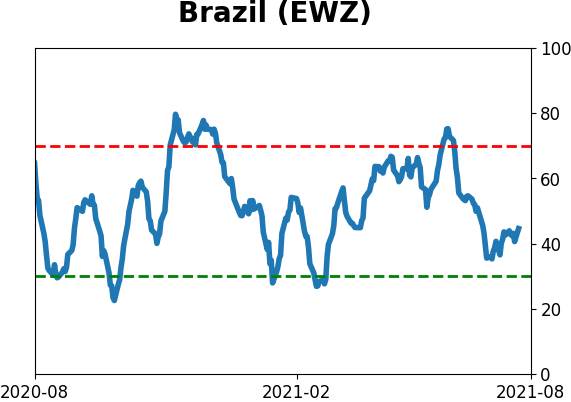
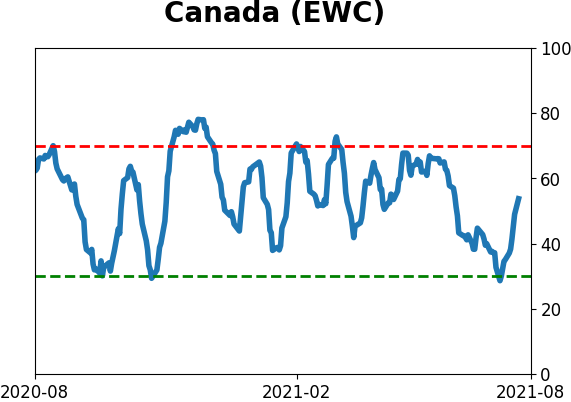
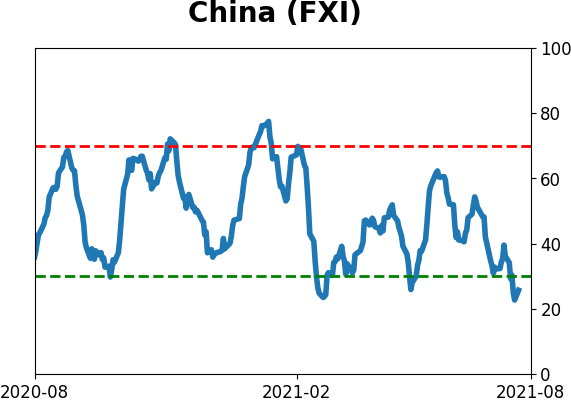
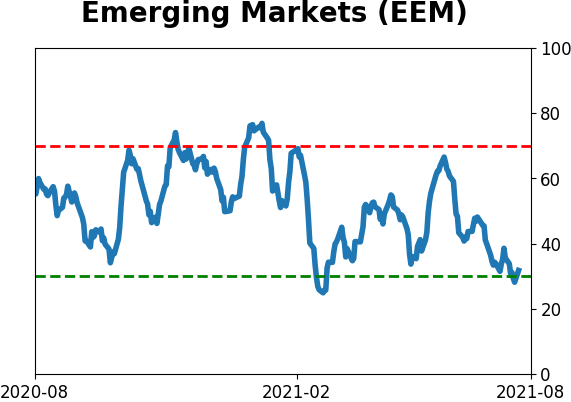
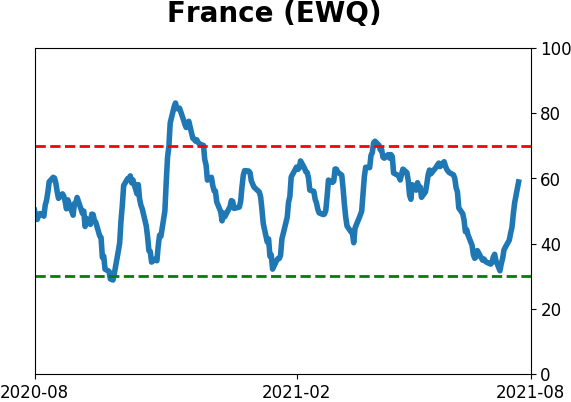
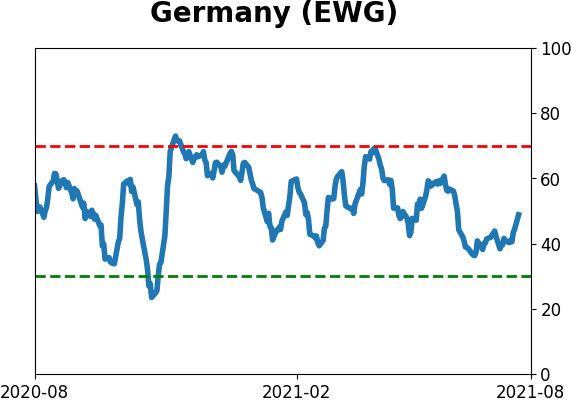
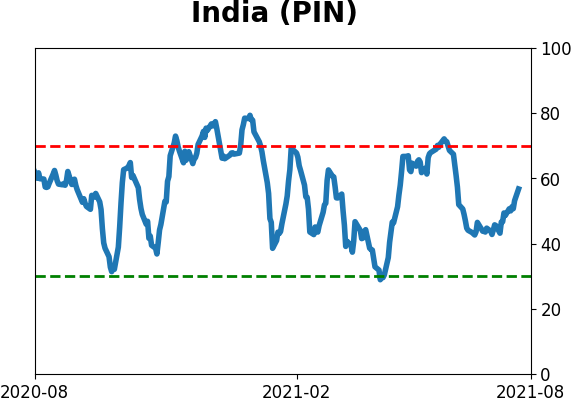
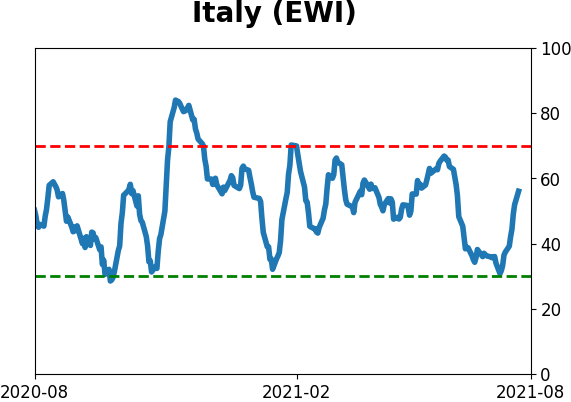
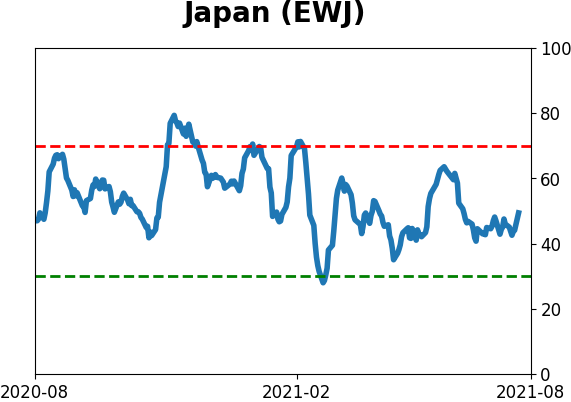
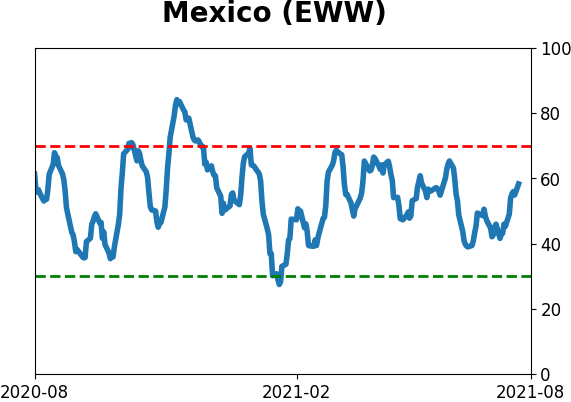
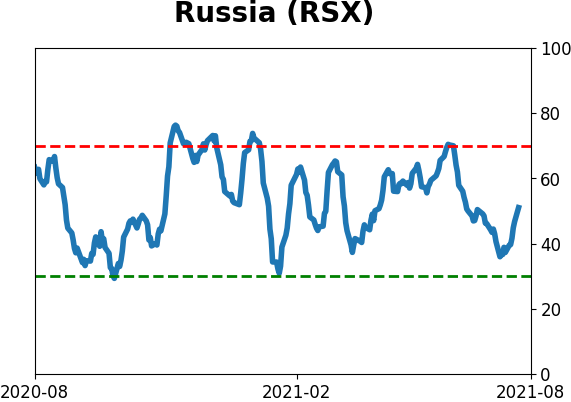
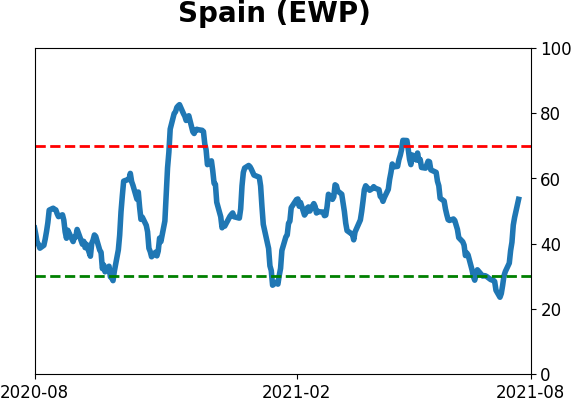
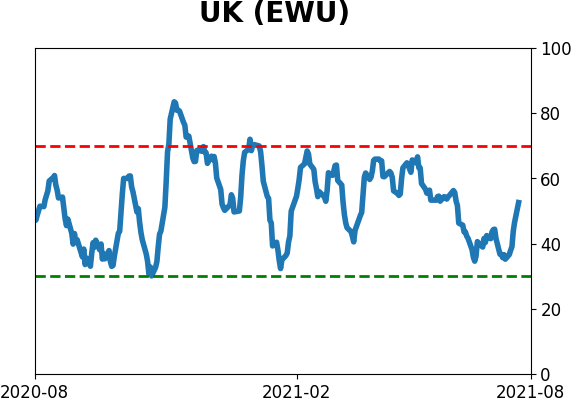
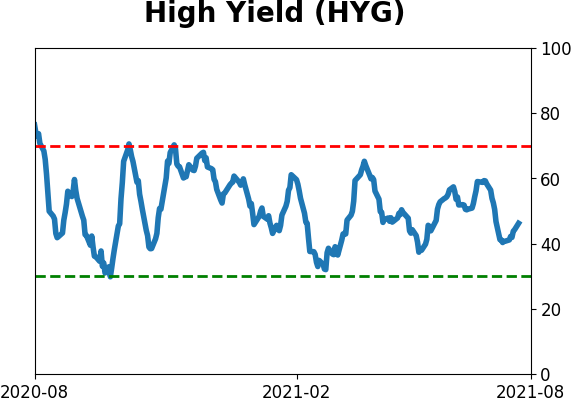
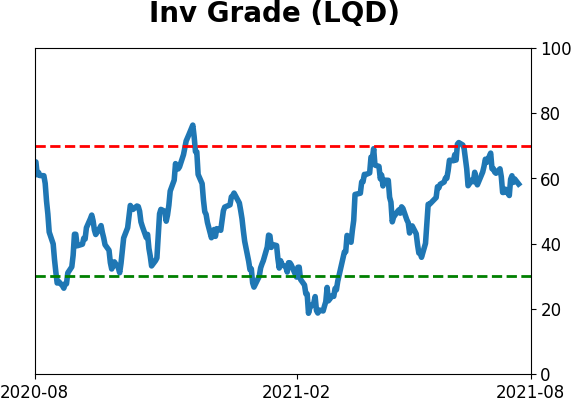
Sentiment Around The World
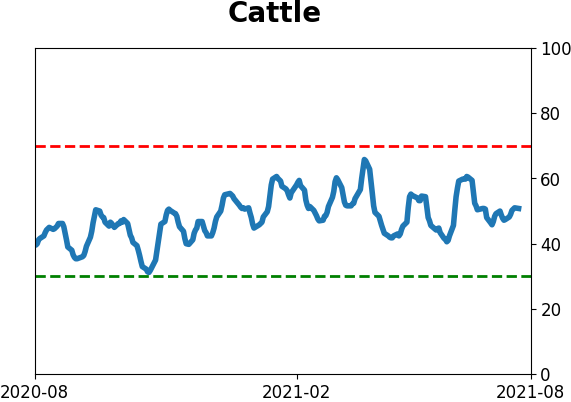
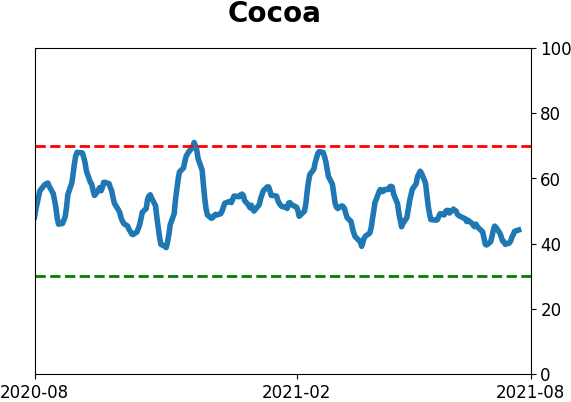
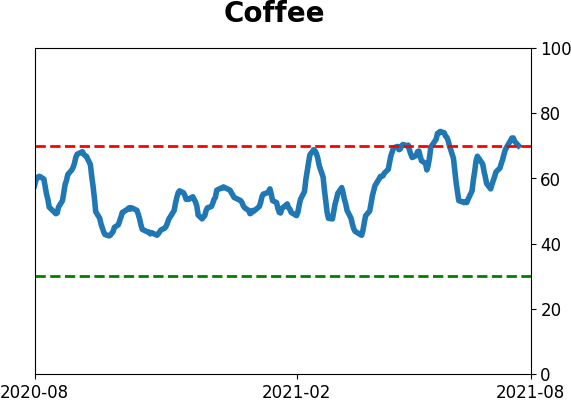
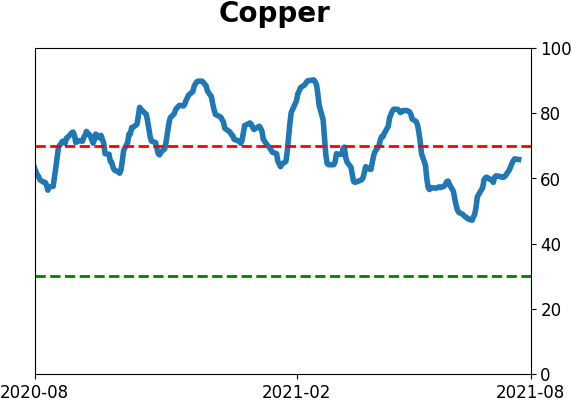
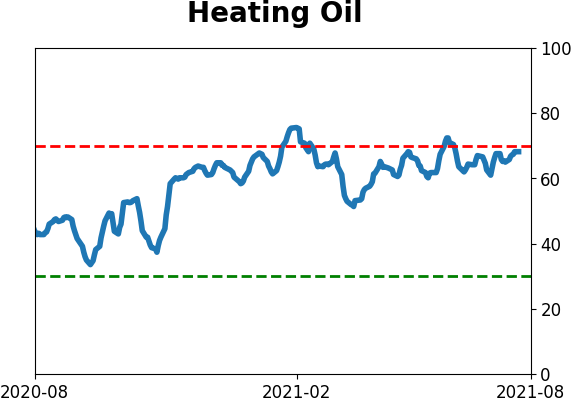
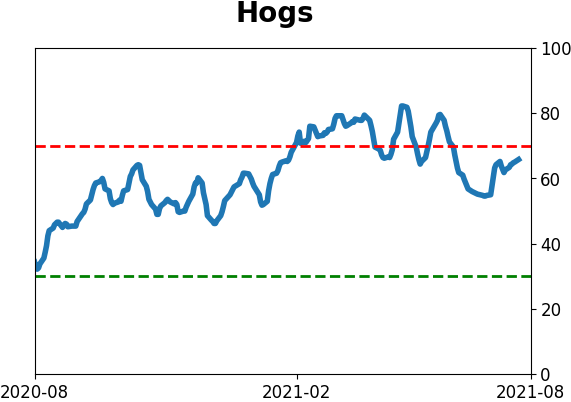
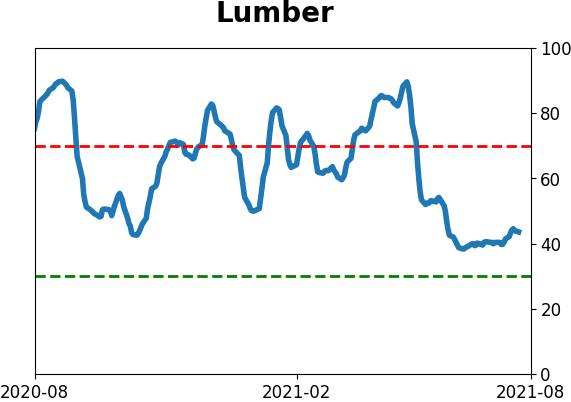
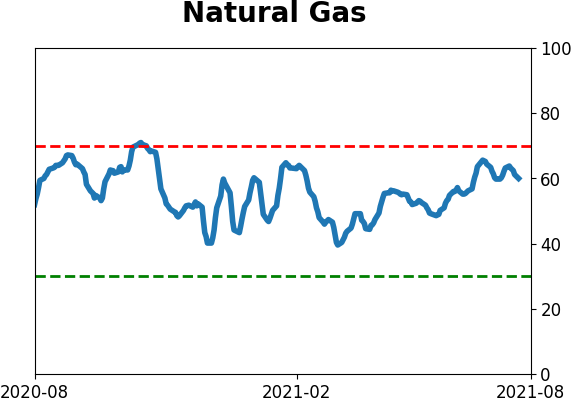
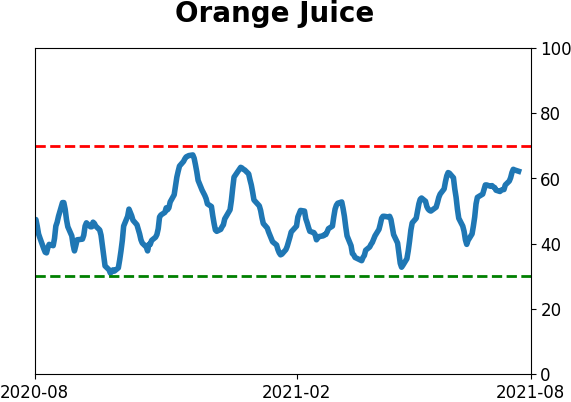
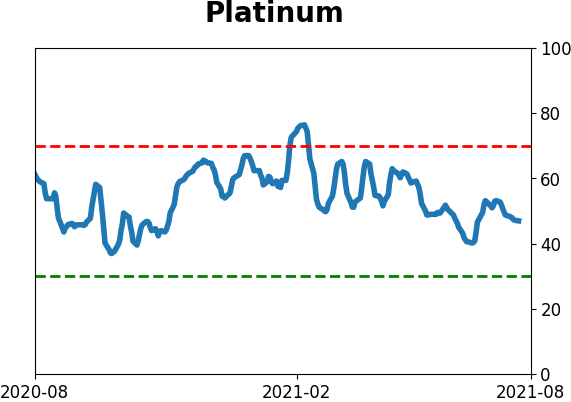
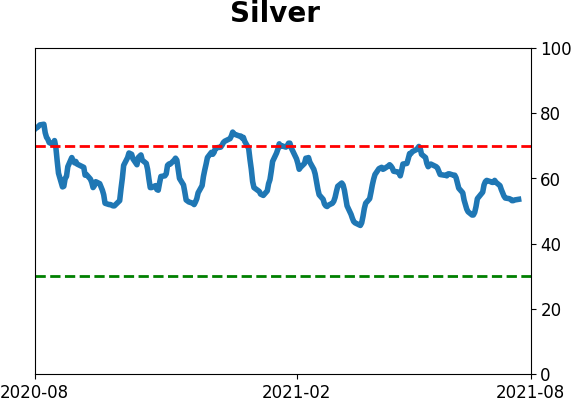
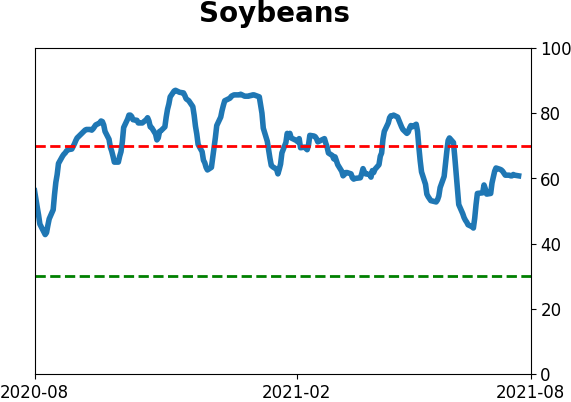
Optimism Index Thumbnails
|
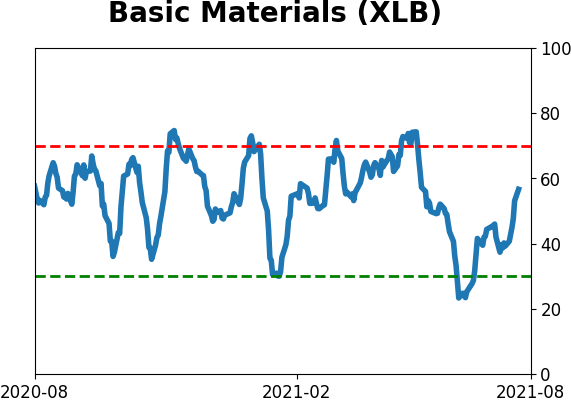
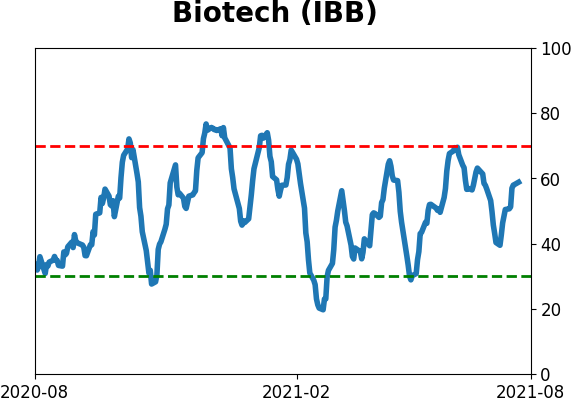
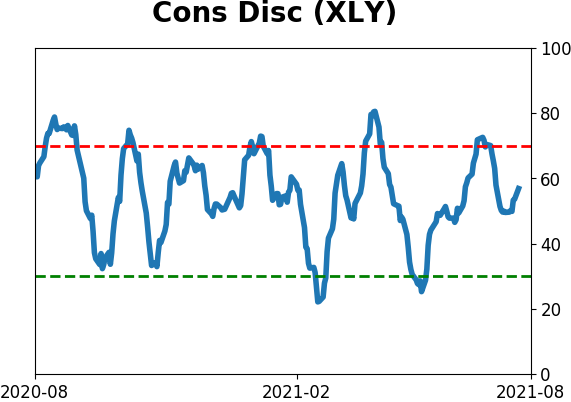
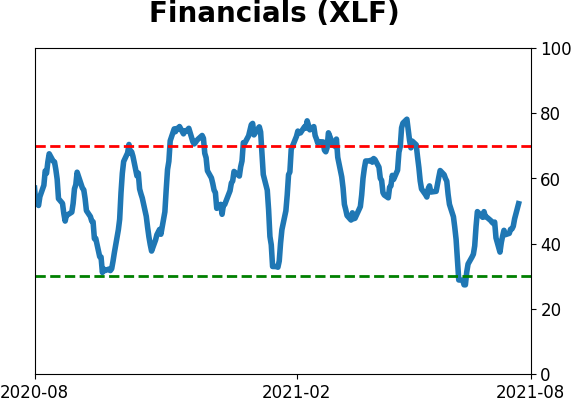
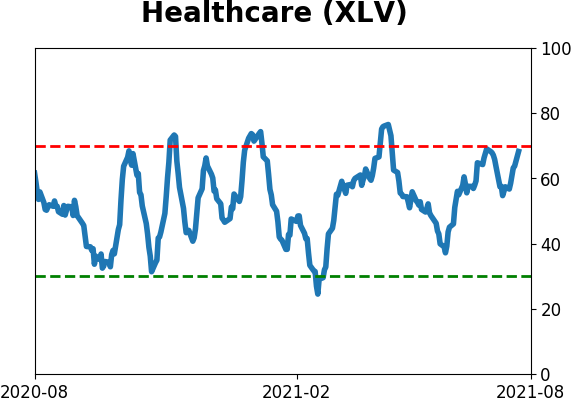
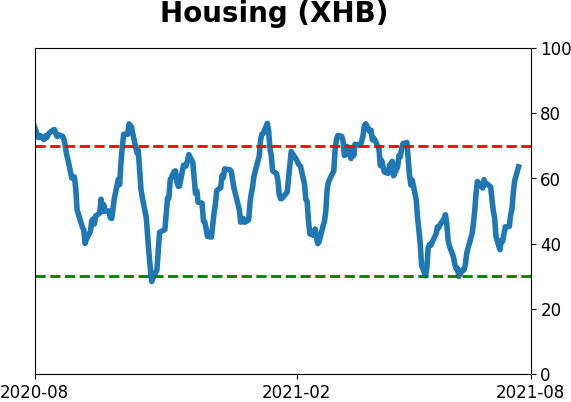
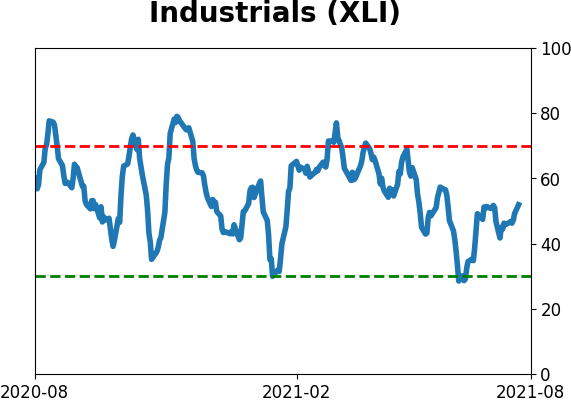
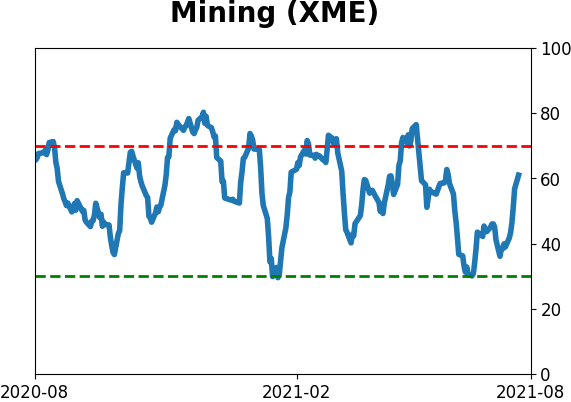
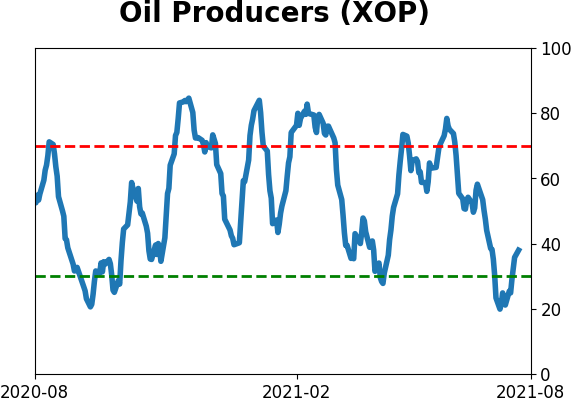
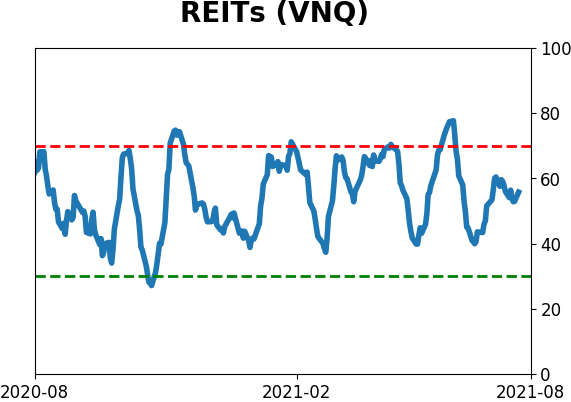
Sector ETF's - 10-Day Moving Average
|
|
|
Country ETF's - 10-Day Moving Average
|
|
|
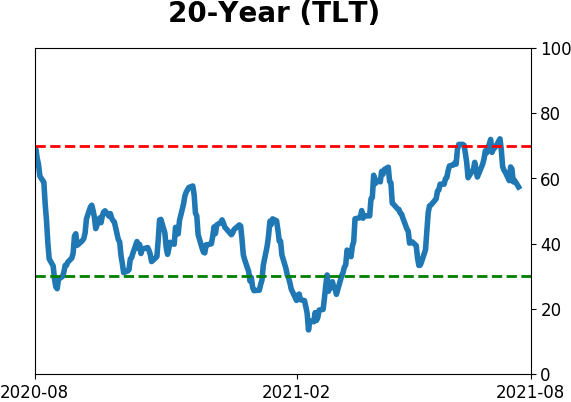
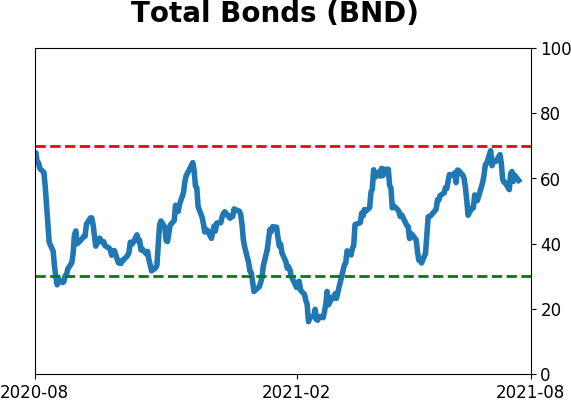
Bond ETF's - 10-Day Moving Average
|
|
|
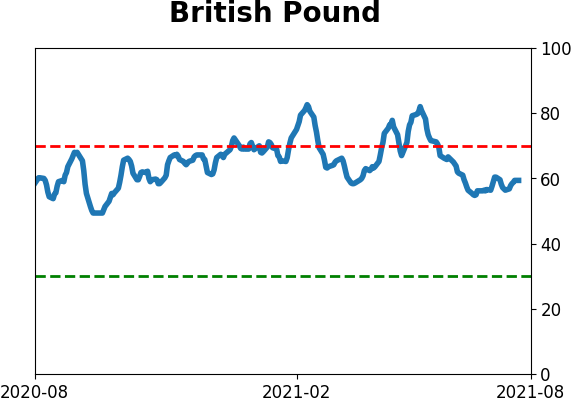
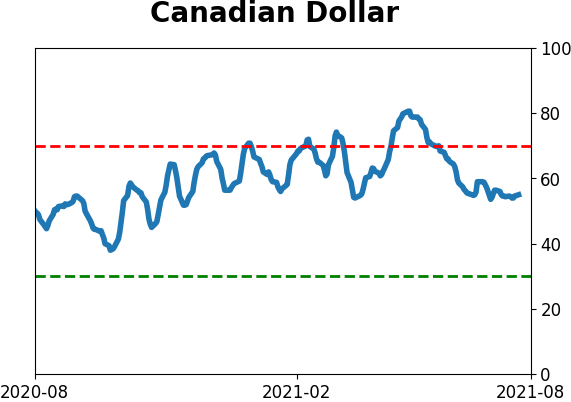
Currency ETF's - 5-Day Moving Average
|
|
|
Commodity ETF's - 5-Day Moving Average
|
|