Headlines
|
|
Individuals are still being left out:
The latest survey of individual investors by AAII showed a continued pattern of historically low optimism. The survey is skewed by an older population, perhaps not as taken by the rally in technology shares. Whatever the reason, it's a historic level of pessimism after such a massive rally in stocks.
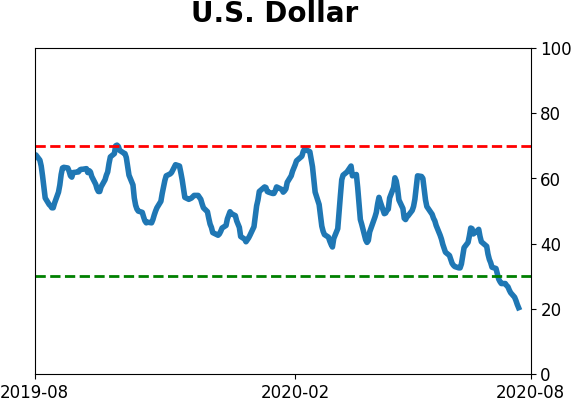
The dollar's largest monthly losses:
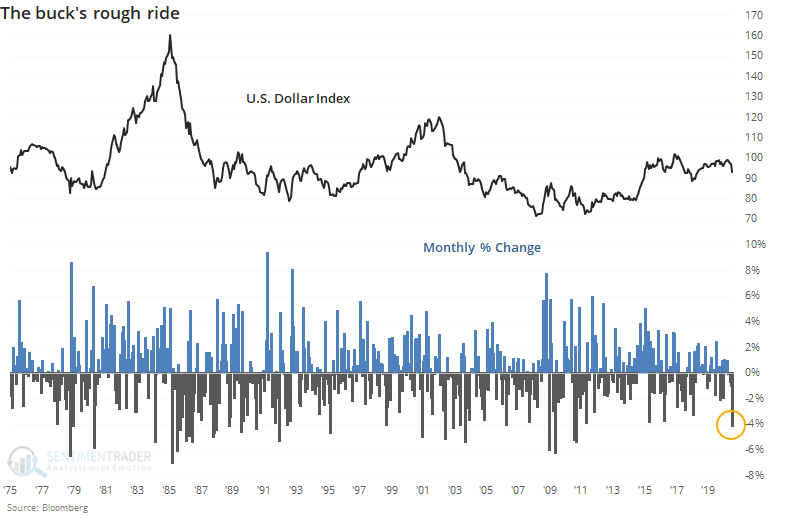
The dollar's on track for its largest monthly loss in a decade, hitting a multi-year low in the process. While many assets tend to show mean-reversion after large monthly moves, the dollar has not, but curiously it didn't often benefit gold, either.
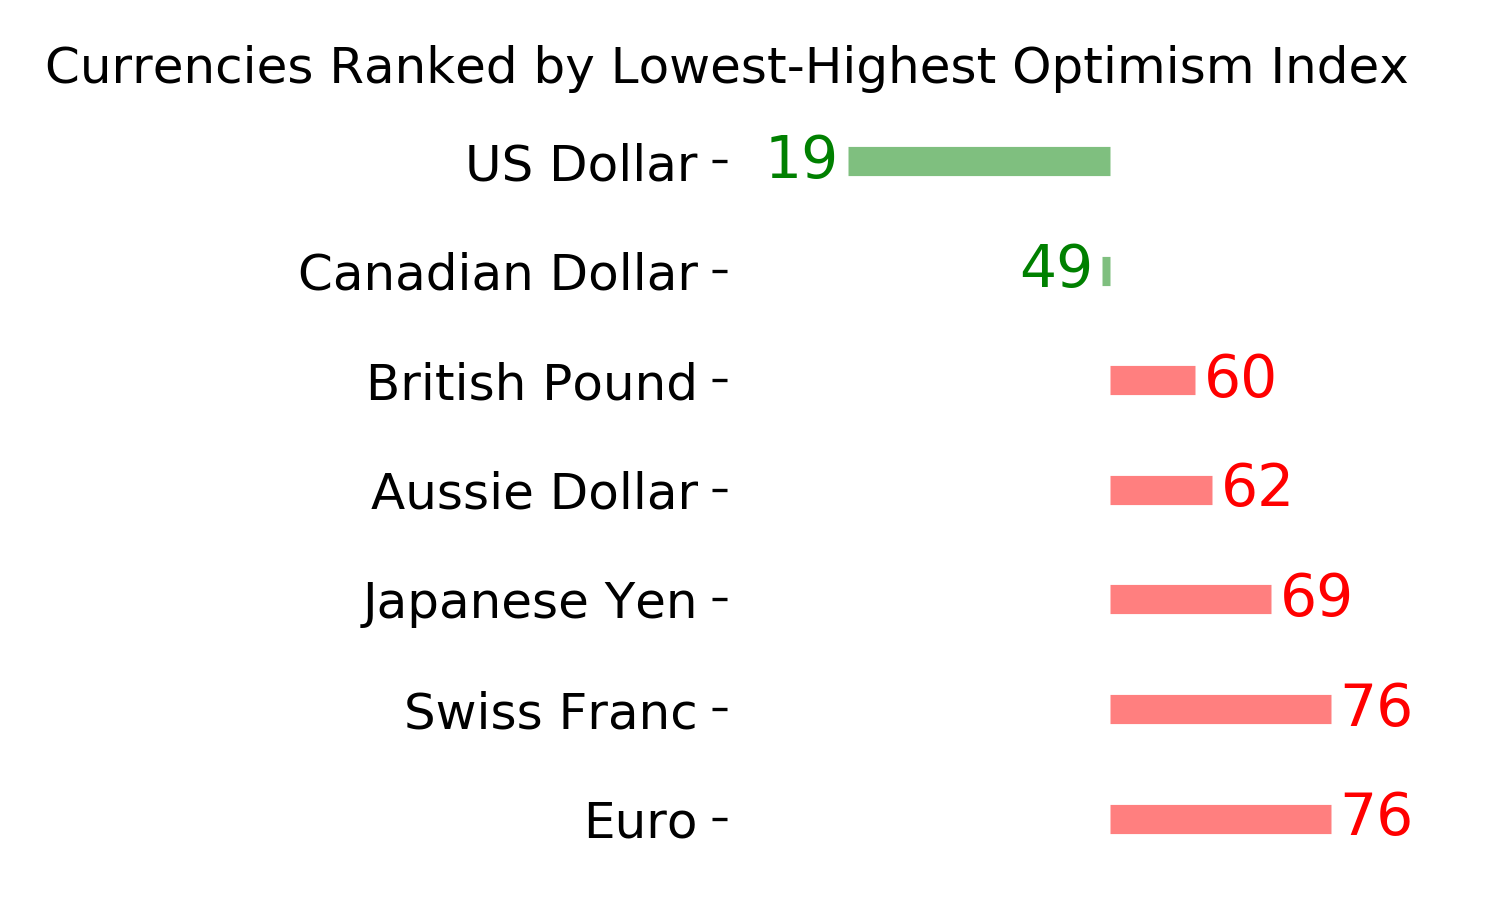
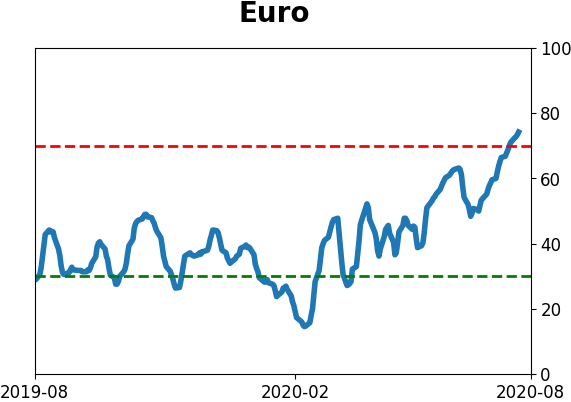
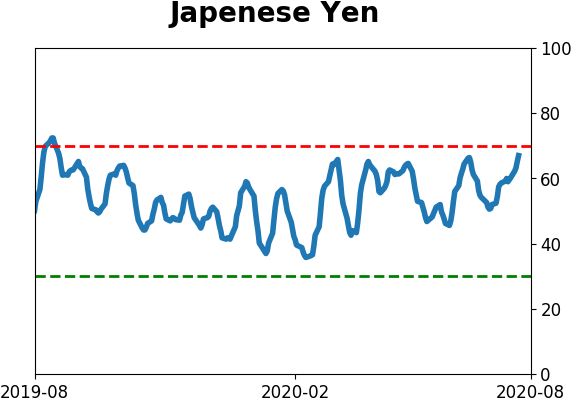
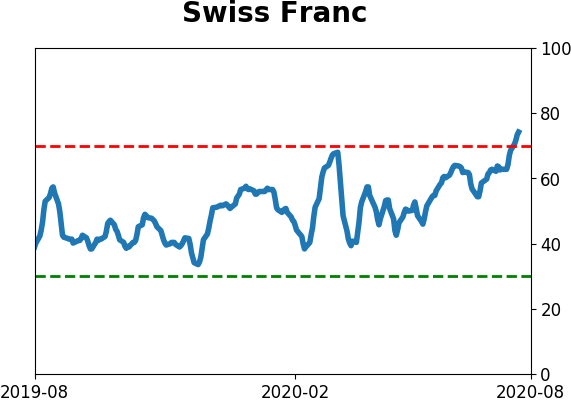
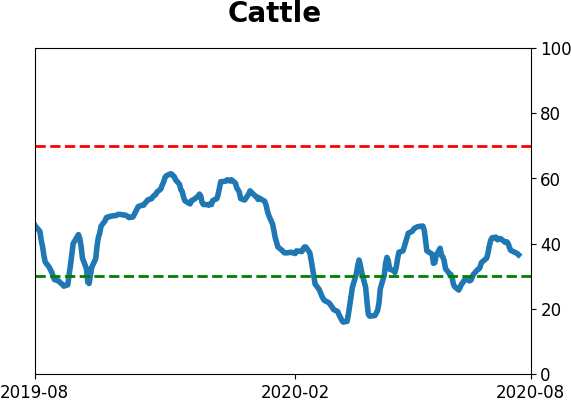
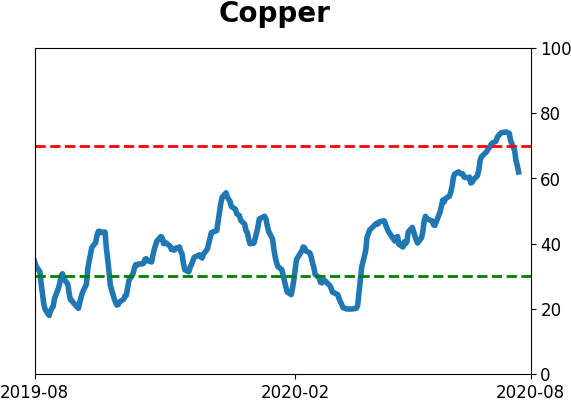
The latest Commitments of Traders report was released, covering positions through Tuesday: The 3-Year Min/Max Screen shows new "smart money" extremes exclusively in currencies. Hedgers bought more of the U.S. dollar, now holding the largest net long position since January 2013. They were shorting the euro, yen, and Swiss franc. It's their largest short ever against the euro, but as a percentage of open interest, it's only the most extreme in a couple of years. They also shorted more copper. Since speculators are on the other side of hedger positions, this means that speculators are heavily net long that metal. The Backtest Engine shows that over the past 15 years, when speculators held more than 18% of open interest in copper net long, it rose over the next 3 months only 37% of the time with an average return of -1.6%.
Bottom Line:
- Weight of the evidence has been suggesting flat/lower stock prices short- to medium-term again; still suggesting higher prices long-term
- Indicators show high optimism, with Dumb Money Confidence recently above 80% with signs of reckless speculation during what appears to be an unhealthy market environment, historically a bad combination
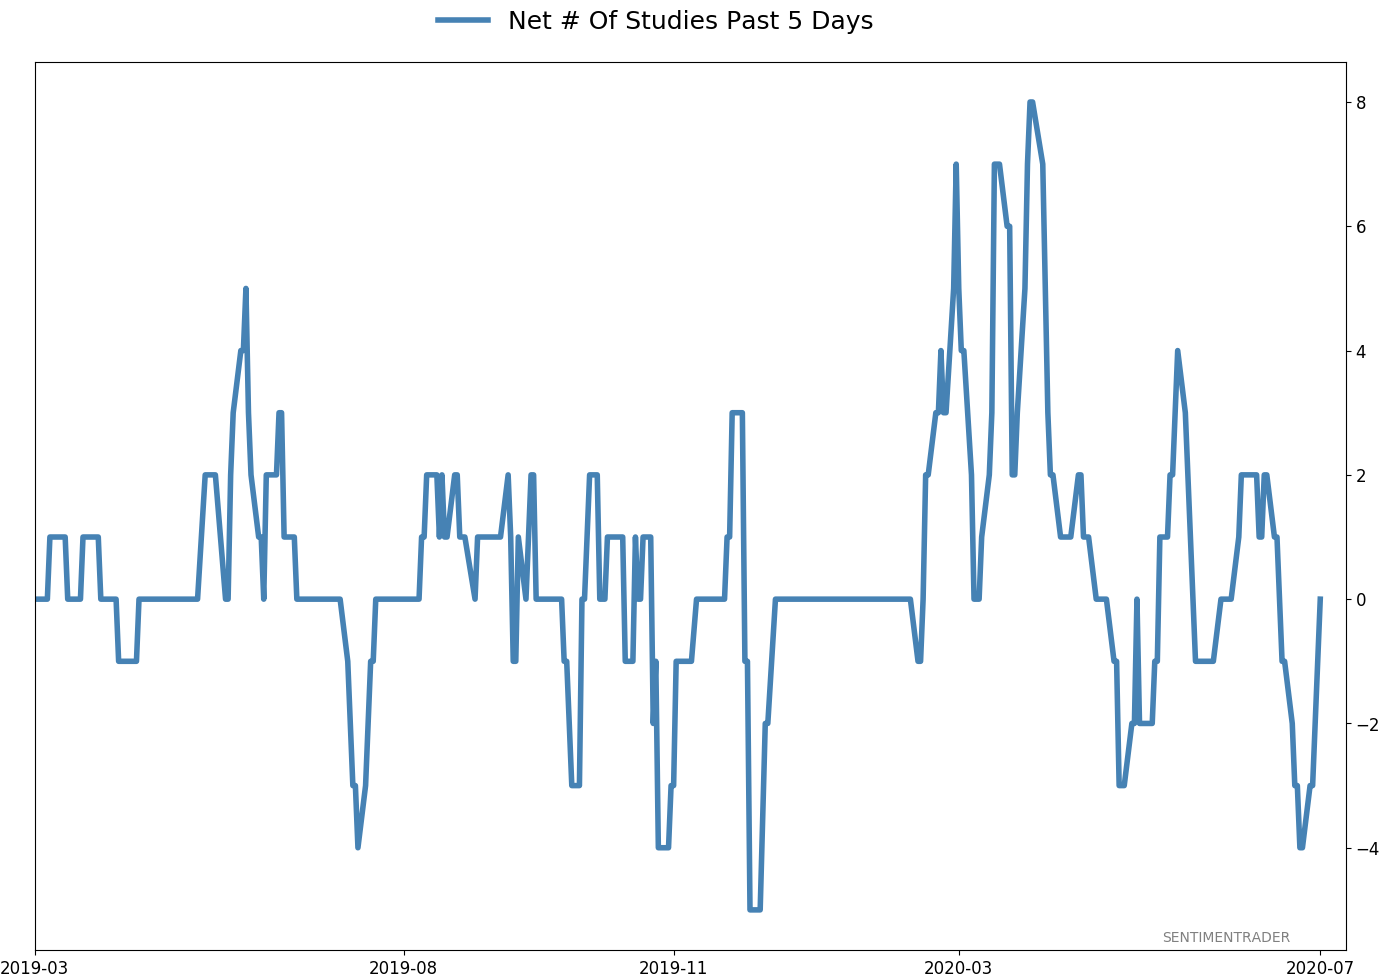
- Active Studies show a heavy positive skew over the medium- to long-term; breadth thrusts, recoveries, and trend changes have an almost unblemished record at preceding higher prices over a 6-12 month time frame
- Signs of extremely skewed preference for tech stocks neared exhaustion by late June, especially relative to industrials and financials (here and here)
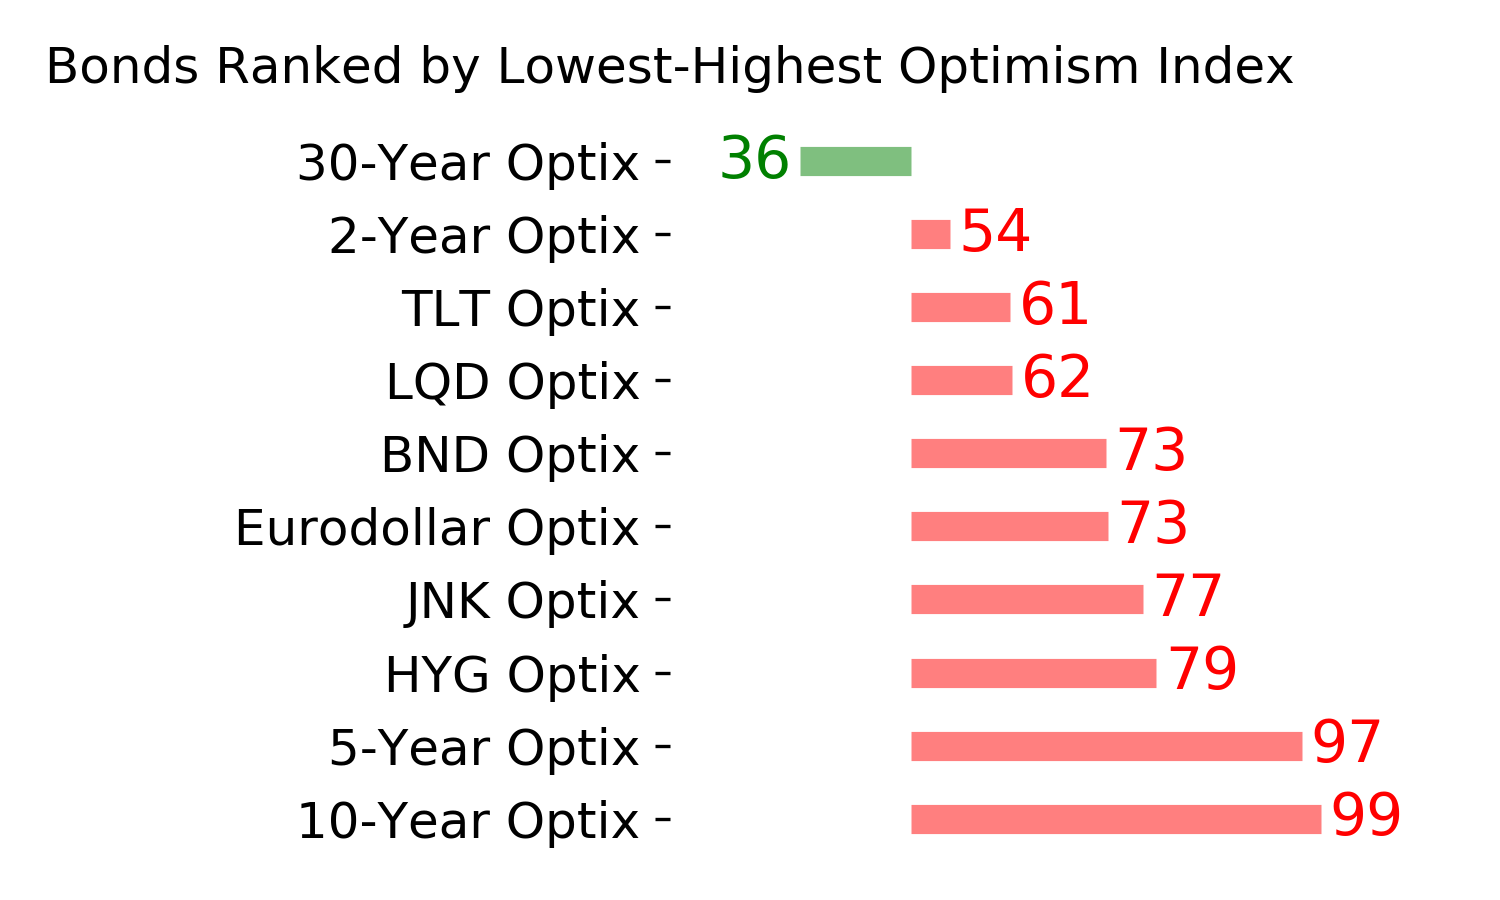
- Indicators and studies for other markets are showing less consistent forward results, though it's not a great sign for Treasuries that hedgers are net short and optimism on metals has become extreme, with "perfect" breadth among miners
|
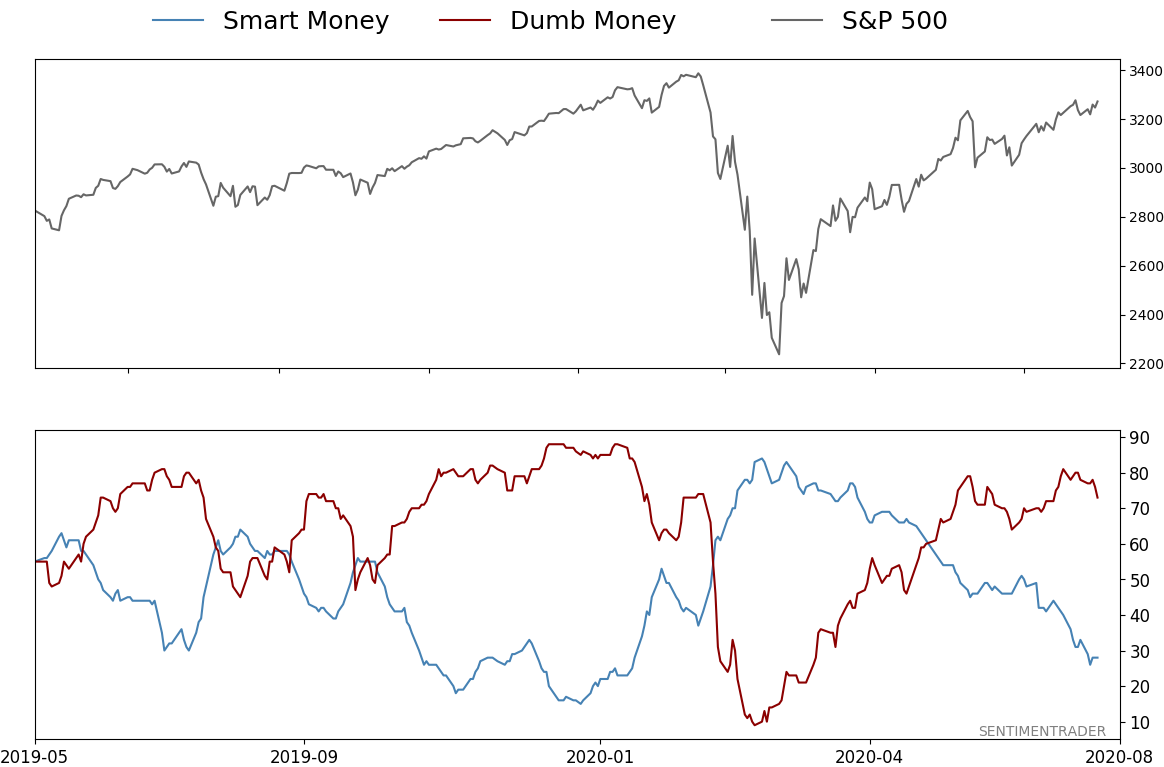
Smart / Dumb Money Confidence
|
Smart Money Confidence: 28%
Dumb Money Confidence: 73%
|
|
Risk Levels
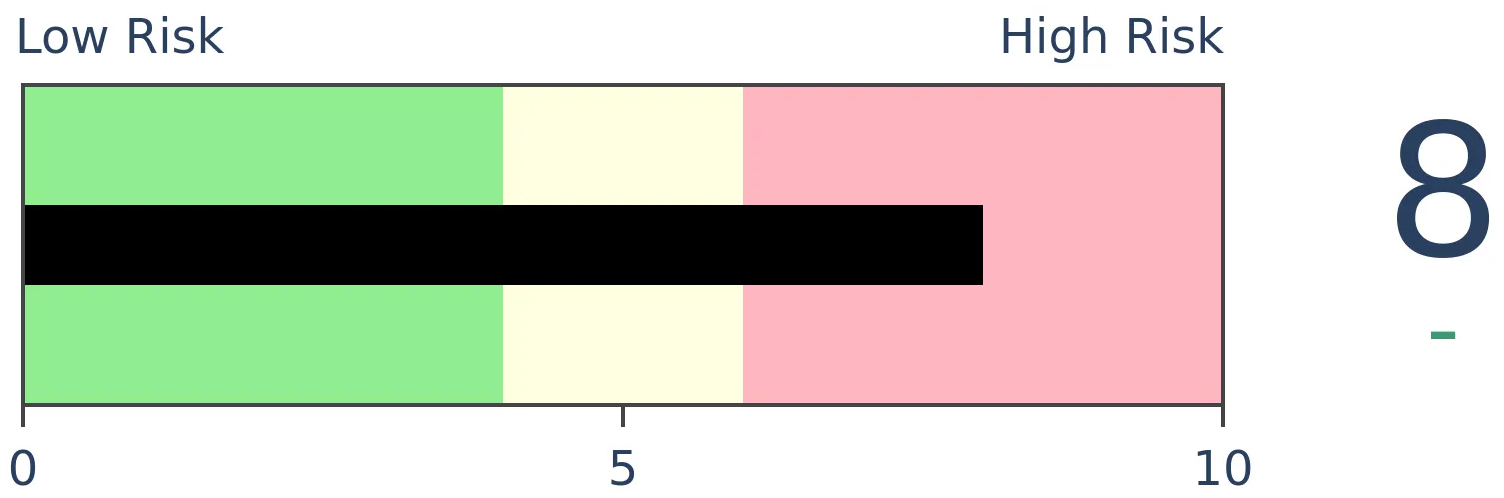
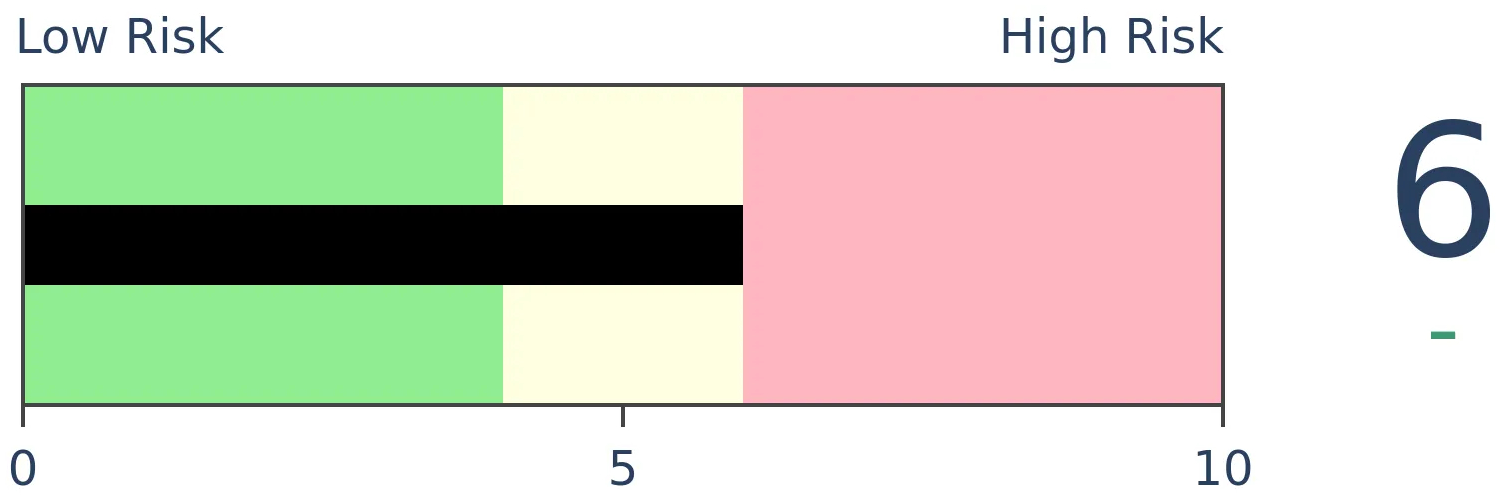
Stocks Short-Term
|
Stocks Medium-Term
|
|
Bonds
|
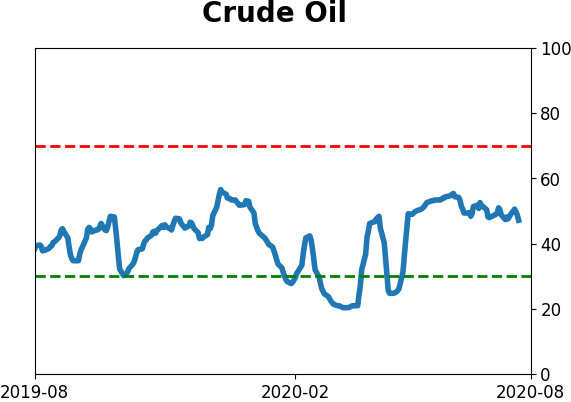
Crude Oil

|
|
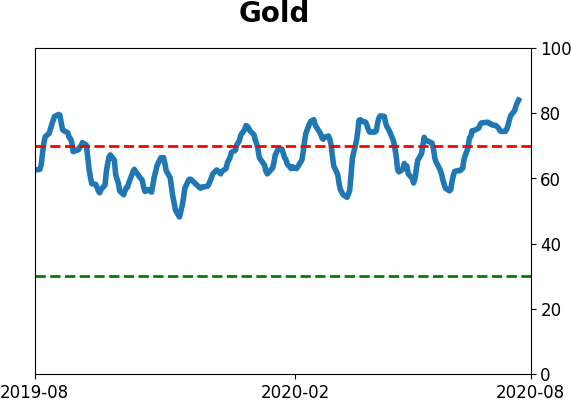
Gold

|
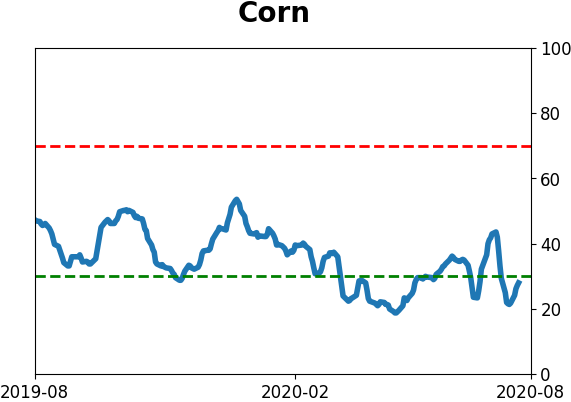
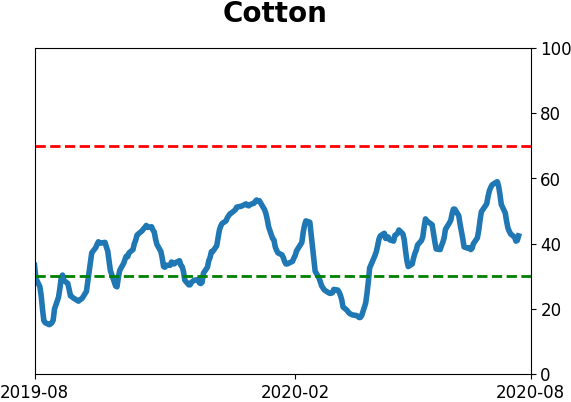
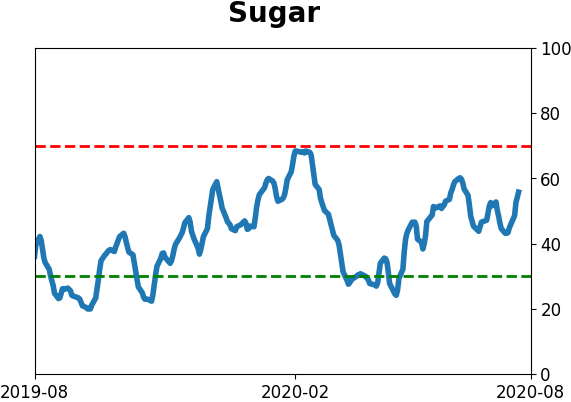
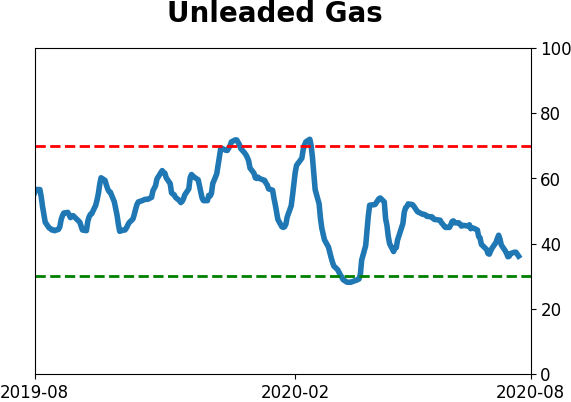
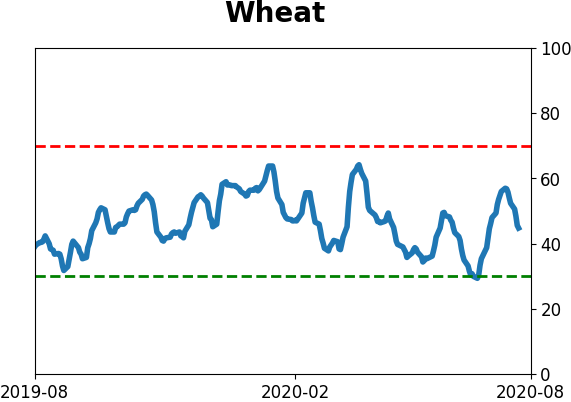
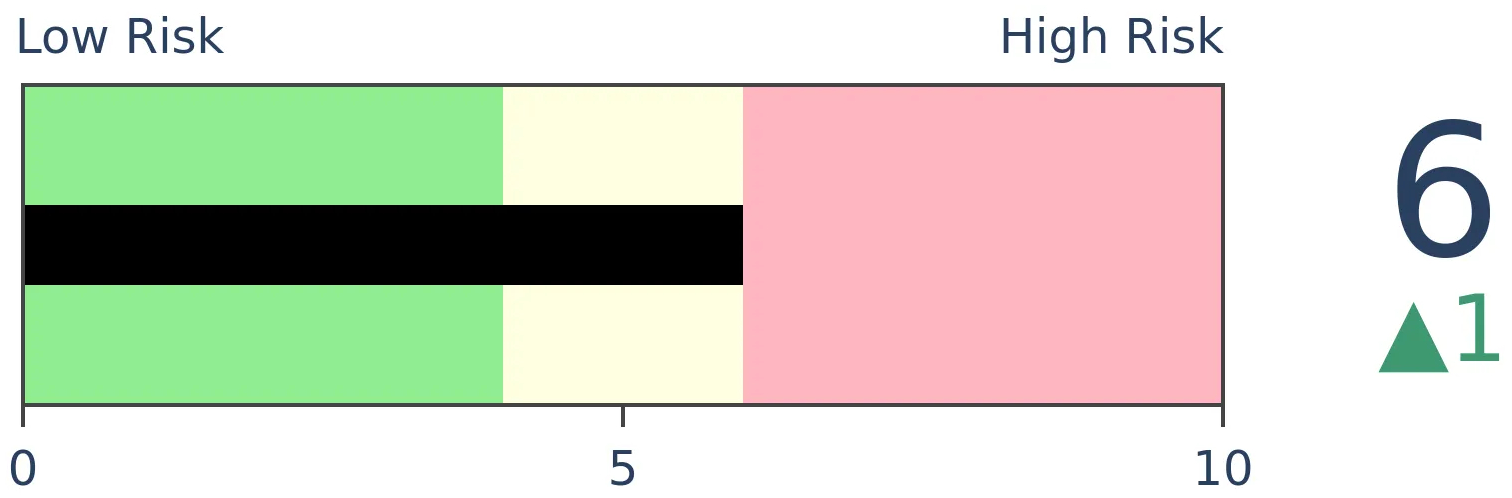
Agriculture

|
|
Research
BOTTOM LINE
The latest survey of individual investors by AAII showed a continued pattern of historically low optimism. The survey is skewed by an older population, perhaps not as taken by the rally in technology shares. Whatever the reason, it's a historic level of pessimism after such a massive rally in stocks.
FORECAST / TIMEFRAME
SPY -- Up, Long-Term
|
We've touched on the AAII survey several times in recent months, noting how these investors were not buying into the rally. Far from it.
In the past, we've looked at the implied demographics of the survey, and it seems pretty clear that they skew heavily to the older end of the population. Maybe that's why a massive tech-led rally hasn't excited them as much as rallies in the past.
Whatever the reason, such a low level of optimism has rarely been to their benefit. The Backtest Engine shows that the S&P 500 has rallied 93% of the time over the next three months when fewer than 20.5% of respondents considered themselves bullish on the market.
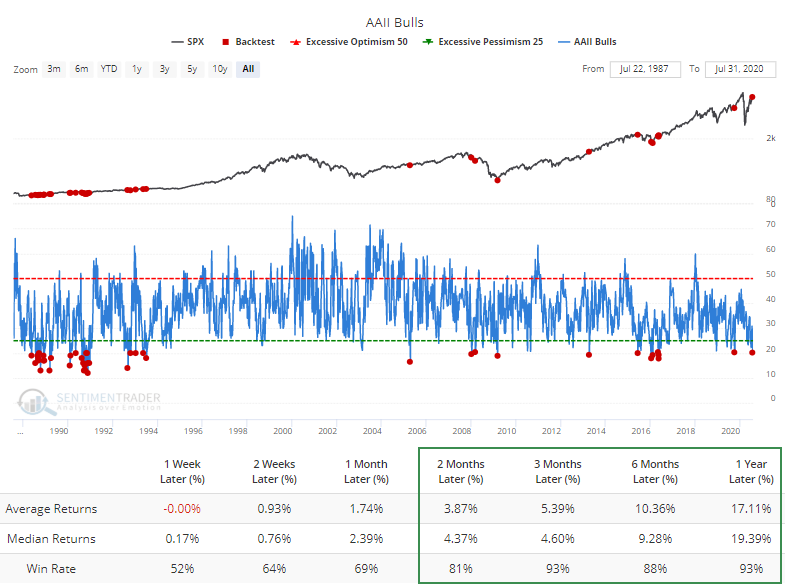
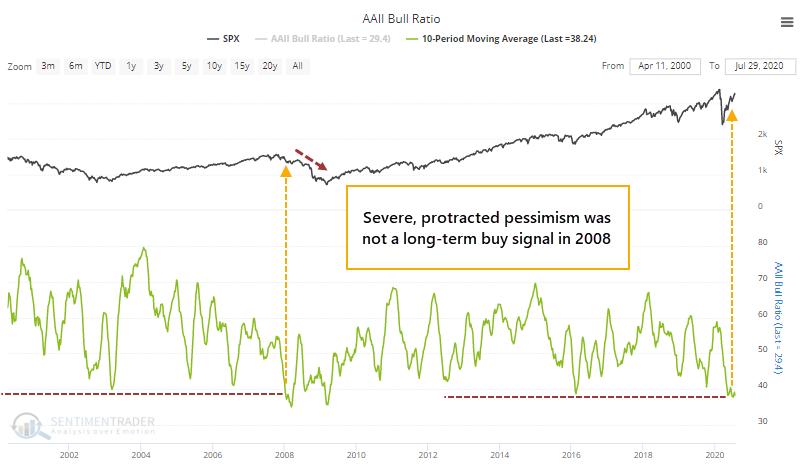
The biggest caveat about this data is that the last time these investors dropped to a decade-long bout of pessimism was in early 2008. While stocks bounced a bit in the shorter-term, it still preceded a loss of nearly 50% within the next year.
What's even more curious about what these folks are saying is we've never seen a rally this large, over this long of a period, and still had so few investors consider themselves bullish.
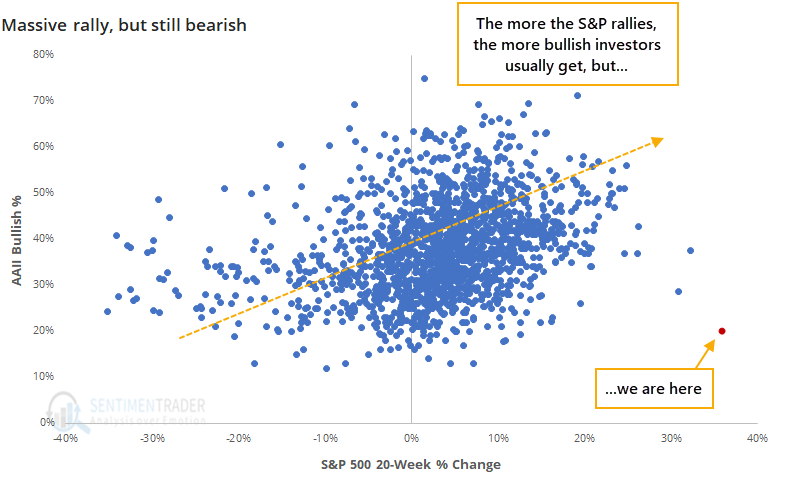
That red dot on the chart shows just how much of an outlier our current situation is. These investors have a strong tendency to become bullish after stocks rally, but they're clearly not doing so this year.
Historically, an unwillingness to buy into a big rally in stocks was a good sign for those rallies to continue.
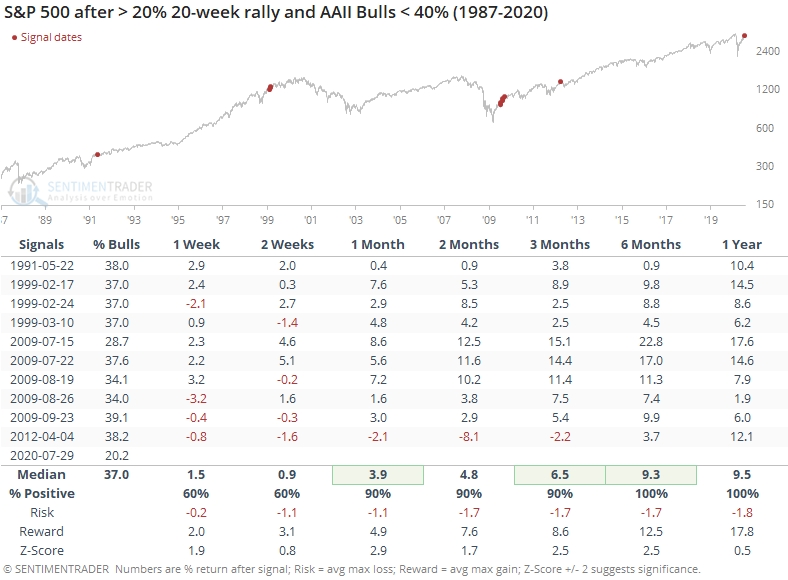
The last time this happened, in early 2012, the S&P faltered over the next couple of months. That was also the worst signal, by far. All of the others showed a gain from one month and beyond, with a ridiculously positive risk/reward ratio. Many of the signals were clustered in the summer of 2009, also the only time when consumers, in general, were also betting that stocks would decline.
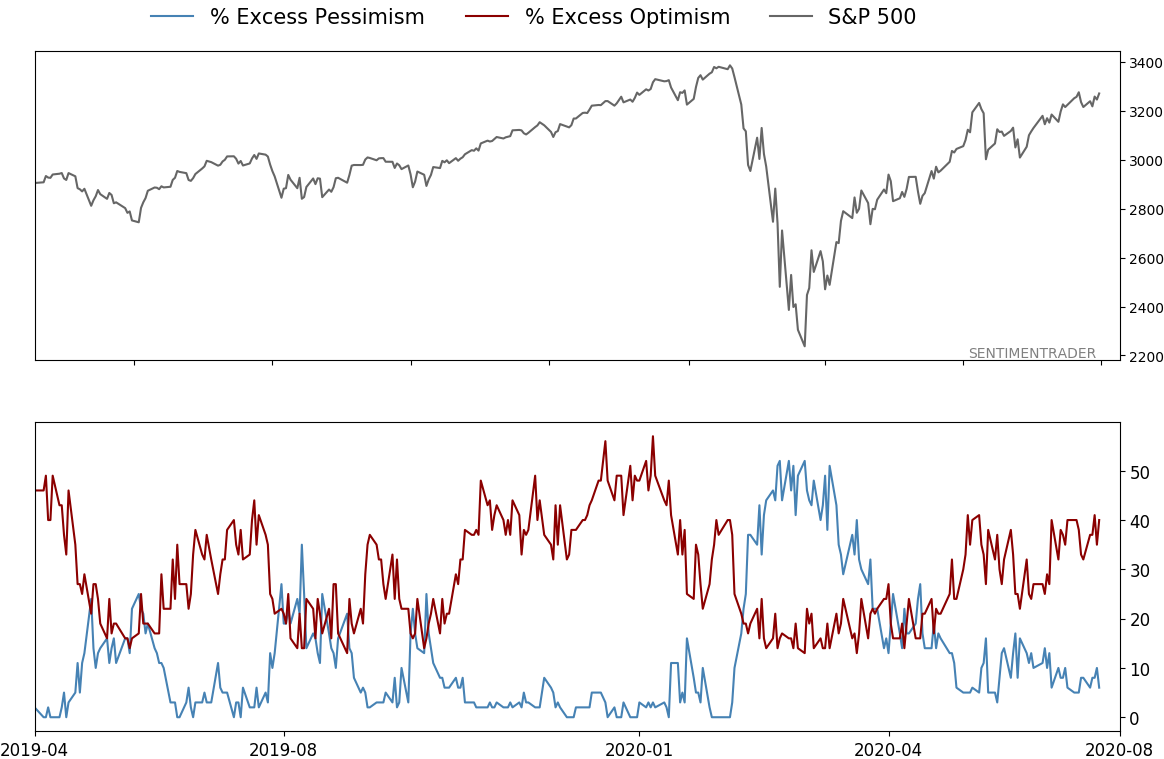
This is not an easy time to define "sentiment". If we use some isolated surveys, equity fund flows, and moves in safe-haven assets, we could assert that investors are overly pessimistic and stocks should keep adding to their gains. But the weight of the evidence would suggest that far more indicators are showing the opposite, and during what is still a prove-it kind of market environment. None of these suggest much about what the next few days could hold, but they do continue to argue that over a medium-term (1-3 month) time frame, risk is high.
BOTTOM LINE
The dollar's on track for its largest monthly loss in a decade, hitting a multi-year low in the process. While many assets tend to show mean-reversion after large monthly moves, the dollar has not, but curiously it didn't often benefit gold, either.
FORECAST / TIMEFRAME
None
|
The dollar has had a really, really bad month.
Unless it makes a stunning reversal on Friday, the buck is on track for one of its largest monthly losses in a decade, amid a drop to at least a two-year low.
At multiple points in recent weeks, Troy has noted that downside momentum in the dollar hasn't necessarily had a tendency to lead to mean-reversion. Unlike what we often see in stocks, extreme moves in one direction aren't a great predictor for contrary moves in the other direction.
That's been the case for large monthly declines, as well.
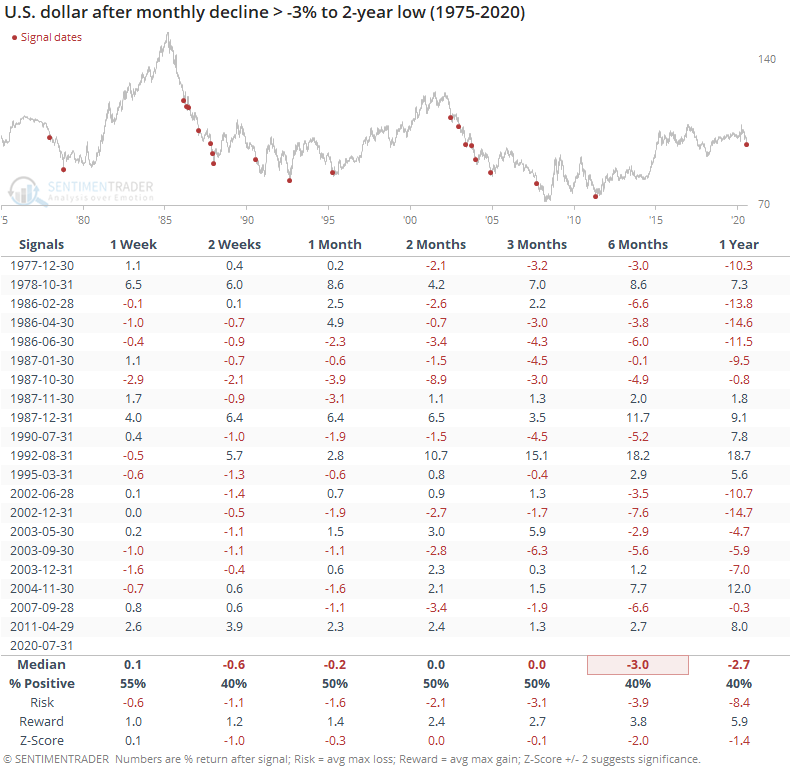
If the dollar tends to decline, and its relationship with gold tends to be inverse, then gold should benefit from this downside momentum in the dollar. That wasn't the case, however.
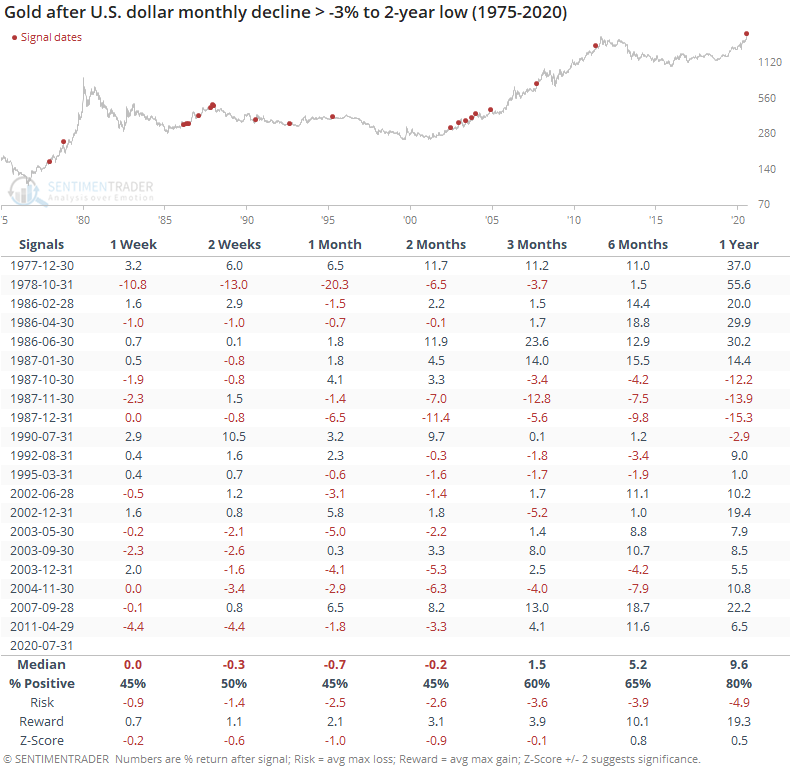
Up to two months later, the median return for gold was negative, with a higher probability for a loss than a gain. The risk/reward was unimpressive up to three months later. Over the past 30 years, 8 out of 11 signals showed a negative return between 1-3 months later.
For stocks, there was no consistent relationship whatsoever.
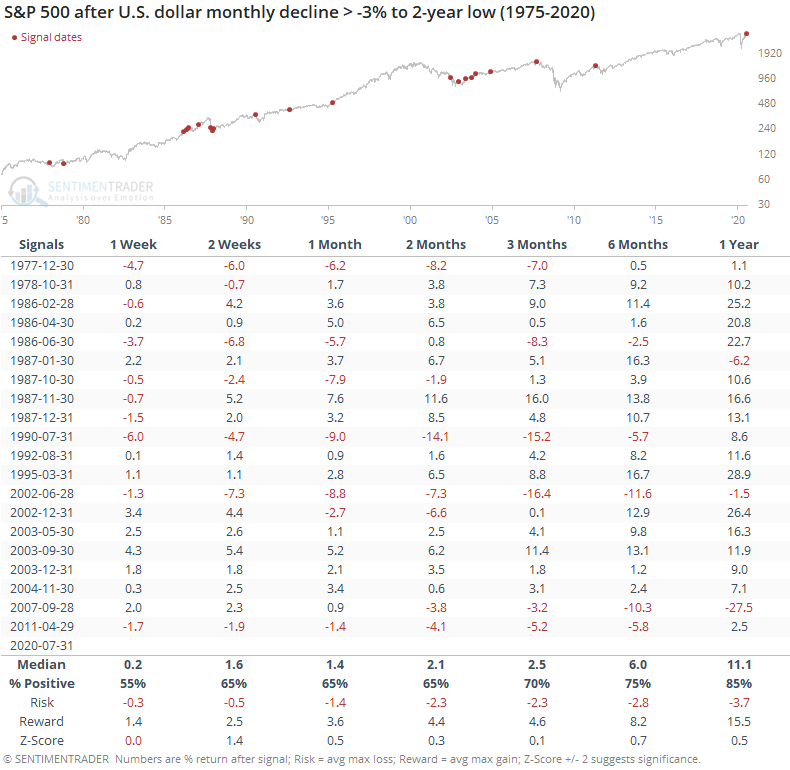
The last couple of signals bode ill for the S&P, but prior to that, there was no consistent positive or negative bias. All the stats are about in line with random over the study period.
If recent correlations hold (always a risky bet), and if the dollar fulfills its historical pattern by continuing to decline after such a large loss (also a risky bet with the current level of extreme pessimism) then this should be a positive for stocks. That's two big "ifs", however, and seems like a shaky input for a bullish bias on stocks.
Active Studies
| Time Frame | Bullish | Bearish | | Short-Term | 0 | 1 | | Medium-Term | 8 | 11 | | Long-Term | 46 | 1 |
|
Indicators at Extremes
Portfolio
| Position | Weight % | Added / Reduced | Date | | Stocks | 29.8 | Reduced 9.1% | 2020-06-11 | | Bonds | 0.0 | Reduced 6.7% | 2020-02-28 | | Commodities | 5.2 | Added 2.4%
| 2020-02-28 | | Precious Metals | 0.0 | Reduced 3.6% | 2020-02-28 | | Special Situations | 0.0 | Reduced 31.9% | 2020-03-17 | | Cash | 65.0 | | |
|
Updates (Changes made today are underlined)
After stocks bottomed on March 23rd, they enjoyed a historic buying thrust and retraced a larger amount of the decline than "just a bear market rally" tends to. Through June, there were signs of breadth thrusts, recoveries, and trend changes that have an almost unblemished record at preceding higher prices over a 6-12 month time frame. On a shorter-term basis, our indicators have been showing high optimism, with Dumb Money Confidence recently above 80%, along with signs of reckless speculation during what appears to be an unhealthy market environment, historically a bad combination. While there are certainly some outlier indicators that are showing apathy or even outright pessimism, a weight-of-the-evidence approach suggests high risk over a multi-week to multi-month time frame. I've been carrying a low (too low) level of exposure to stocks, as well as bonds and gold. I don't see a good opportunity to add to any of those currently, with poor prospects pretty much all the way around. As worried as I am over the medium-term, I would only grudgingly reduce my exposure even further, given the longer-term positives we spent so much time discussing in the spring.
RETURN YTD: -3.7% 2019: 12.6%, 2018: 0.6%, 2017: 3.8%, 2016: 17.1%, 2015: 9.2%, 2014: 14.5%, 2013: 2.2%, 2012: 10.8%, 2011: 16.5%, 2010: 15.3%, 2009: 23.9%, 2008: 16.2%, 2007: 7.8%
|
|
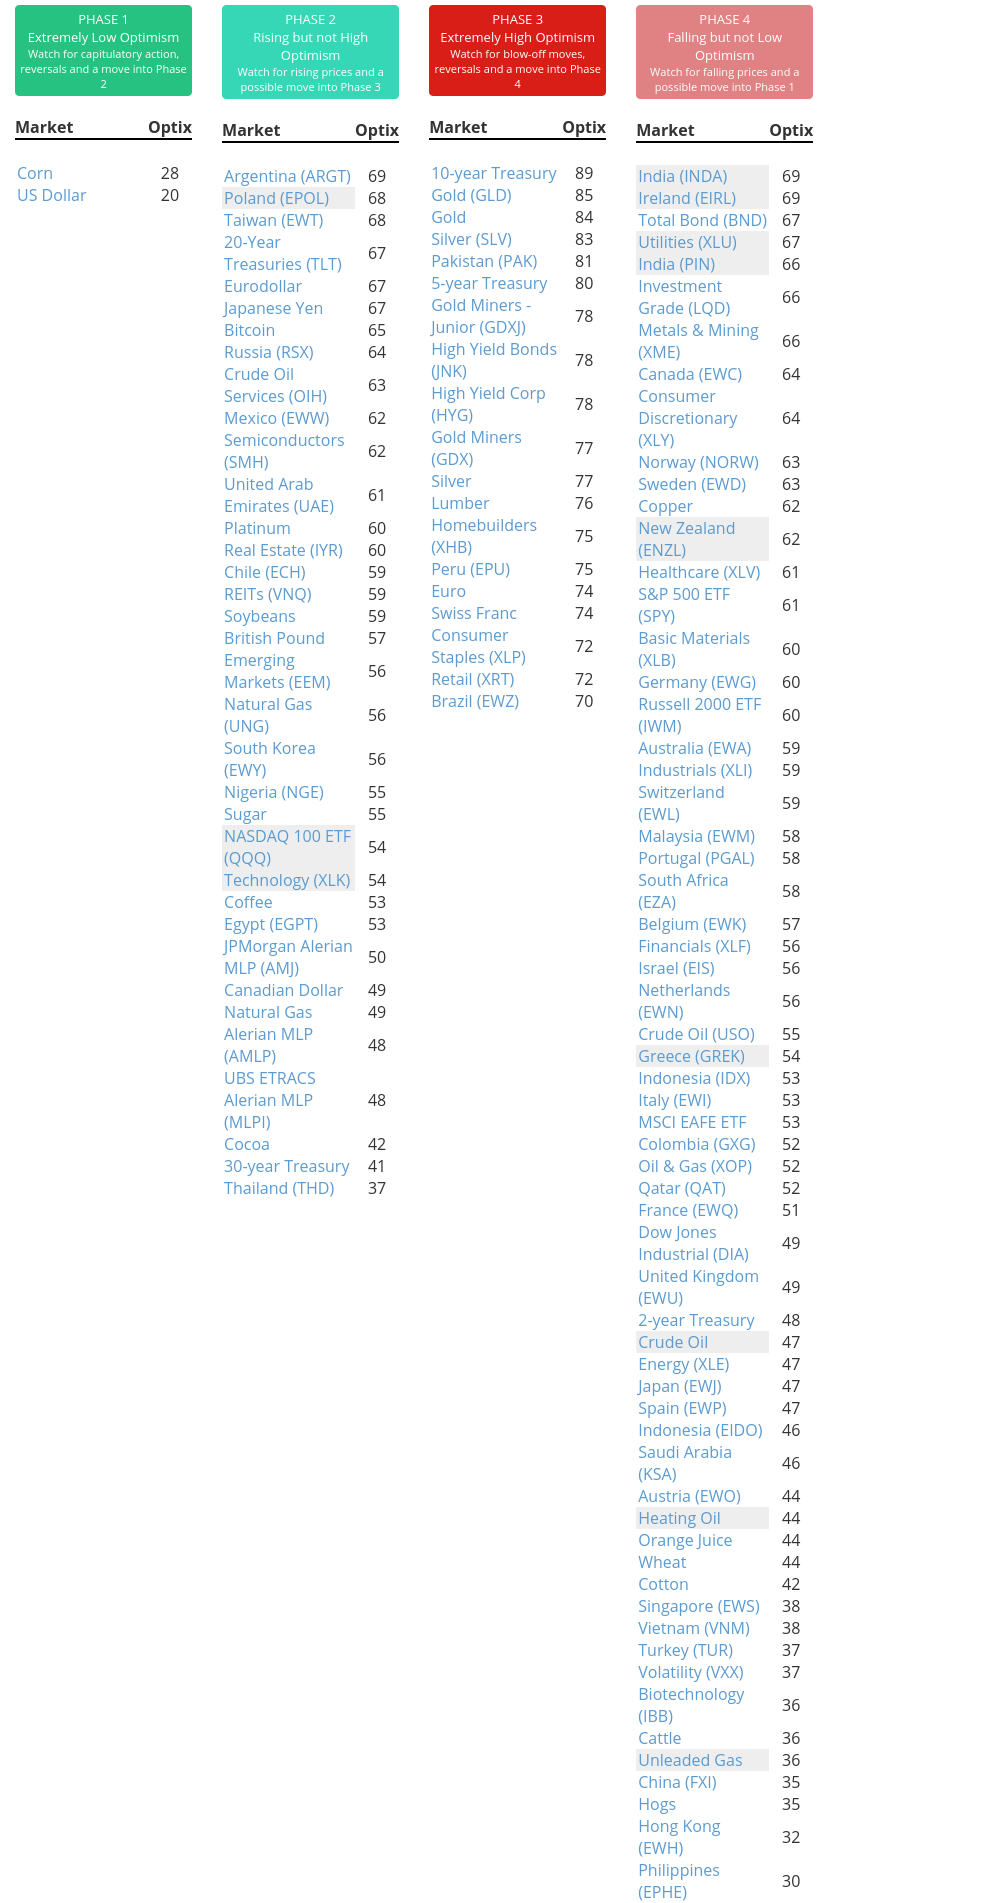
Phase Table
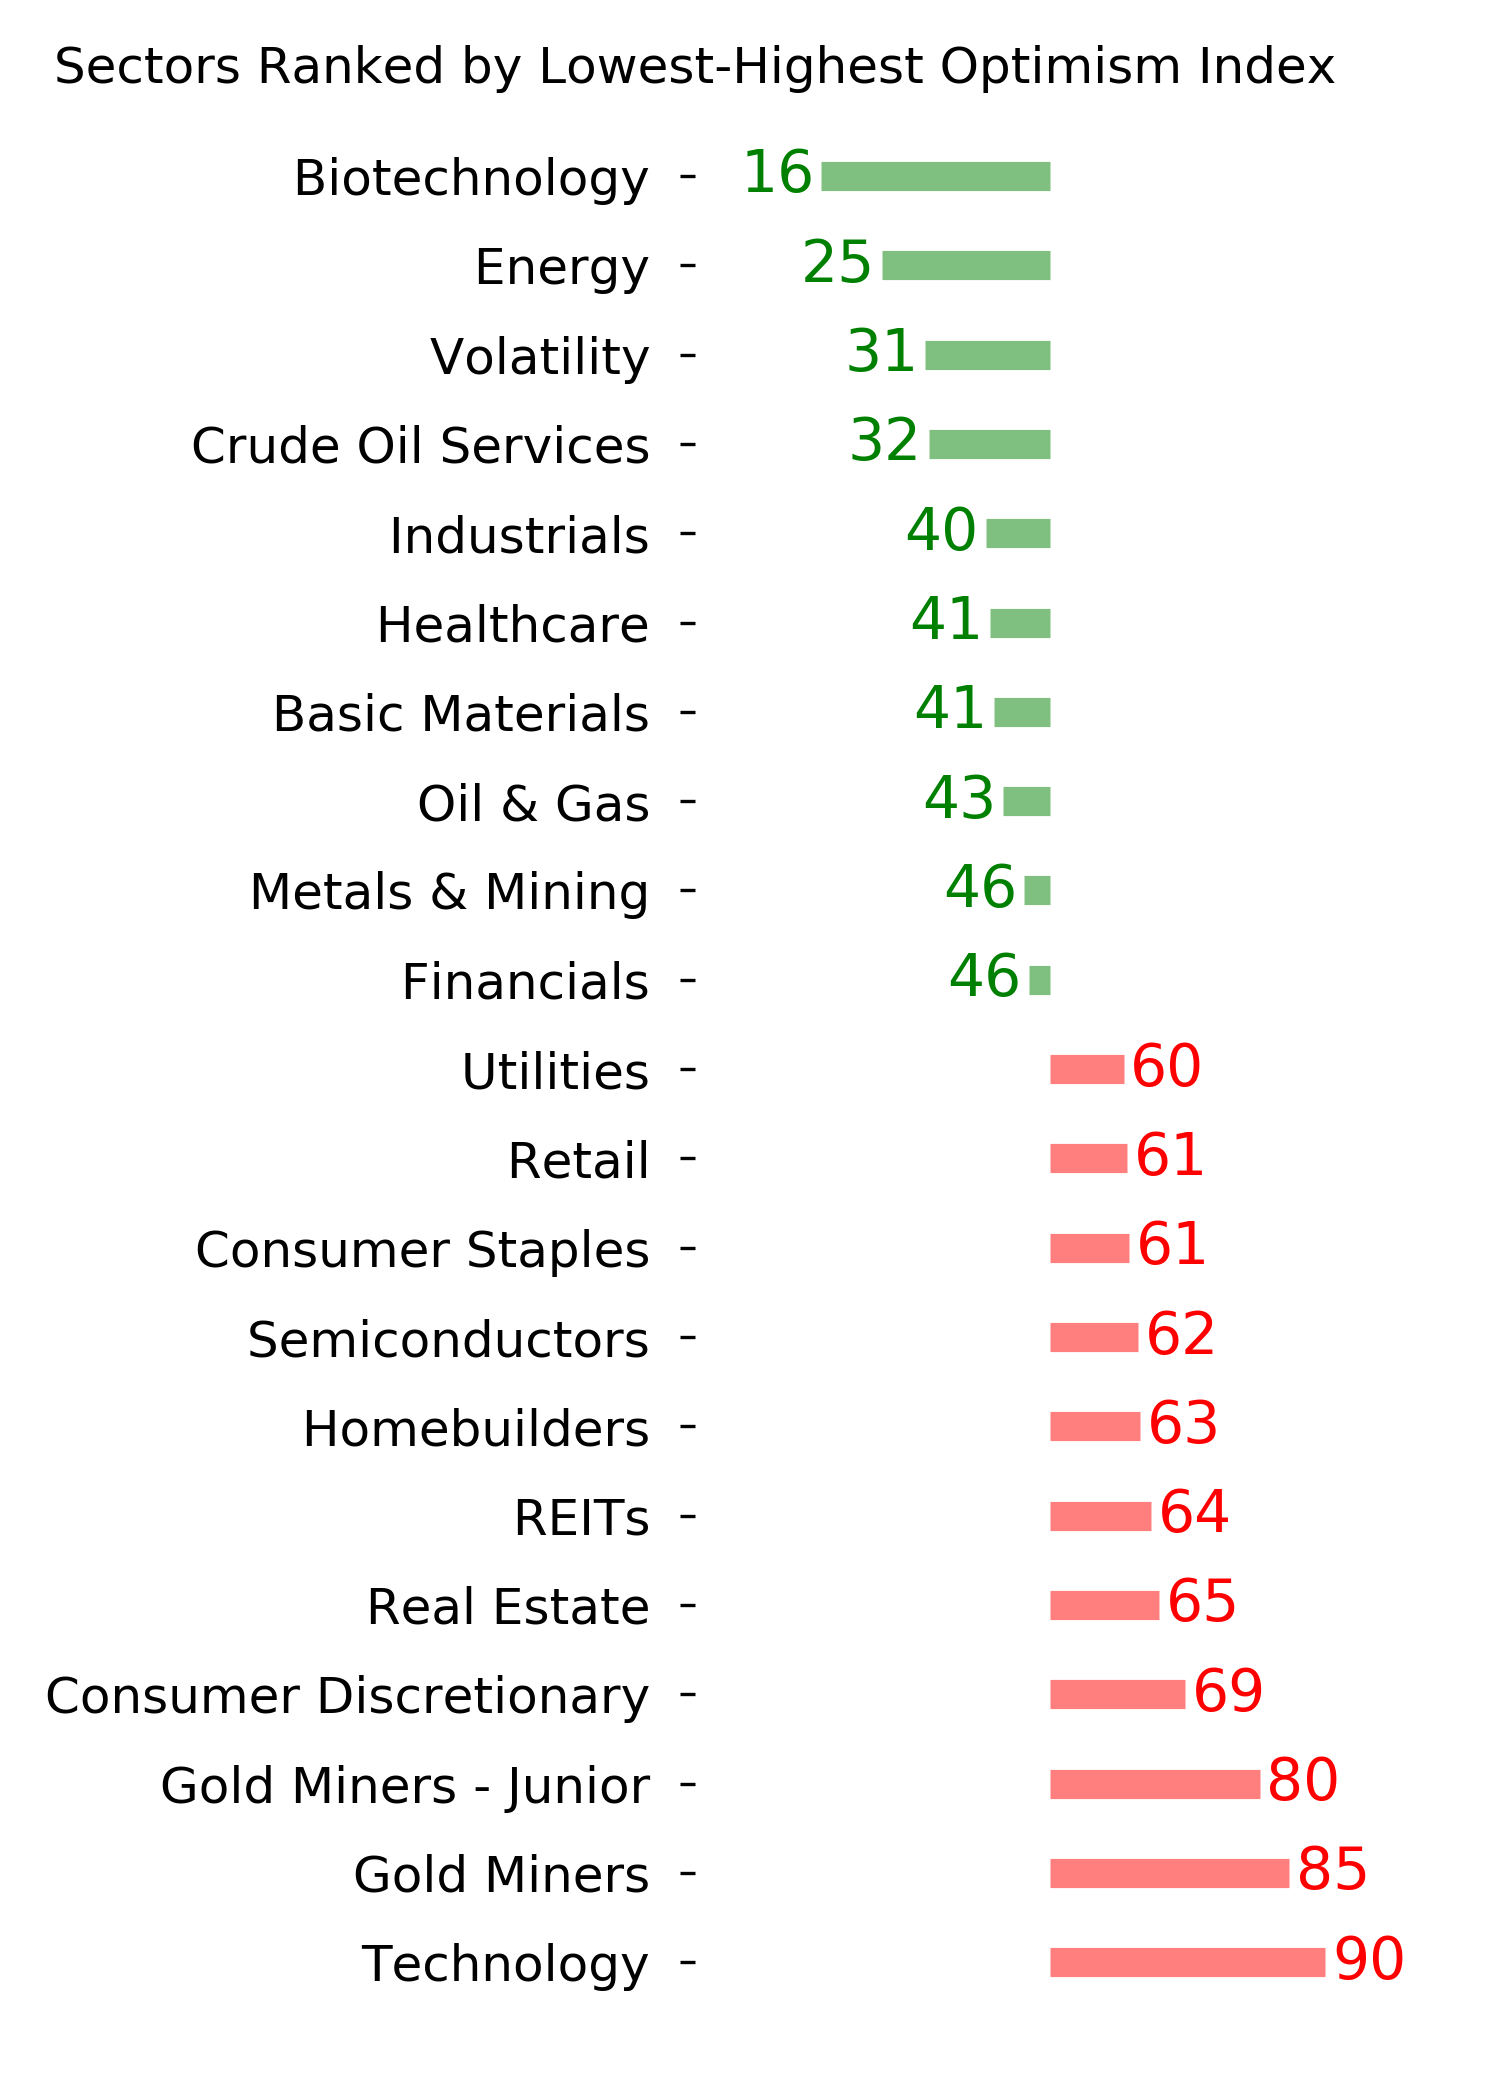
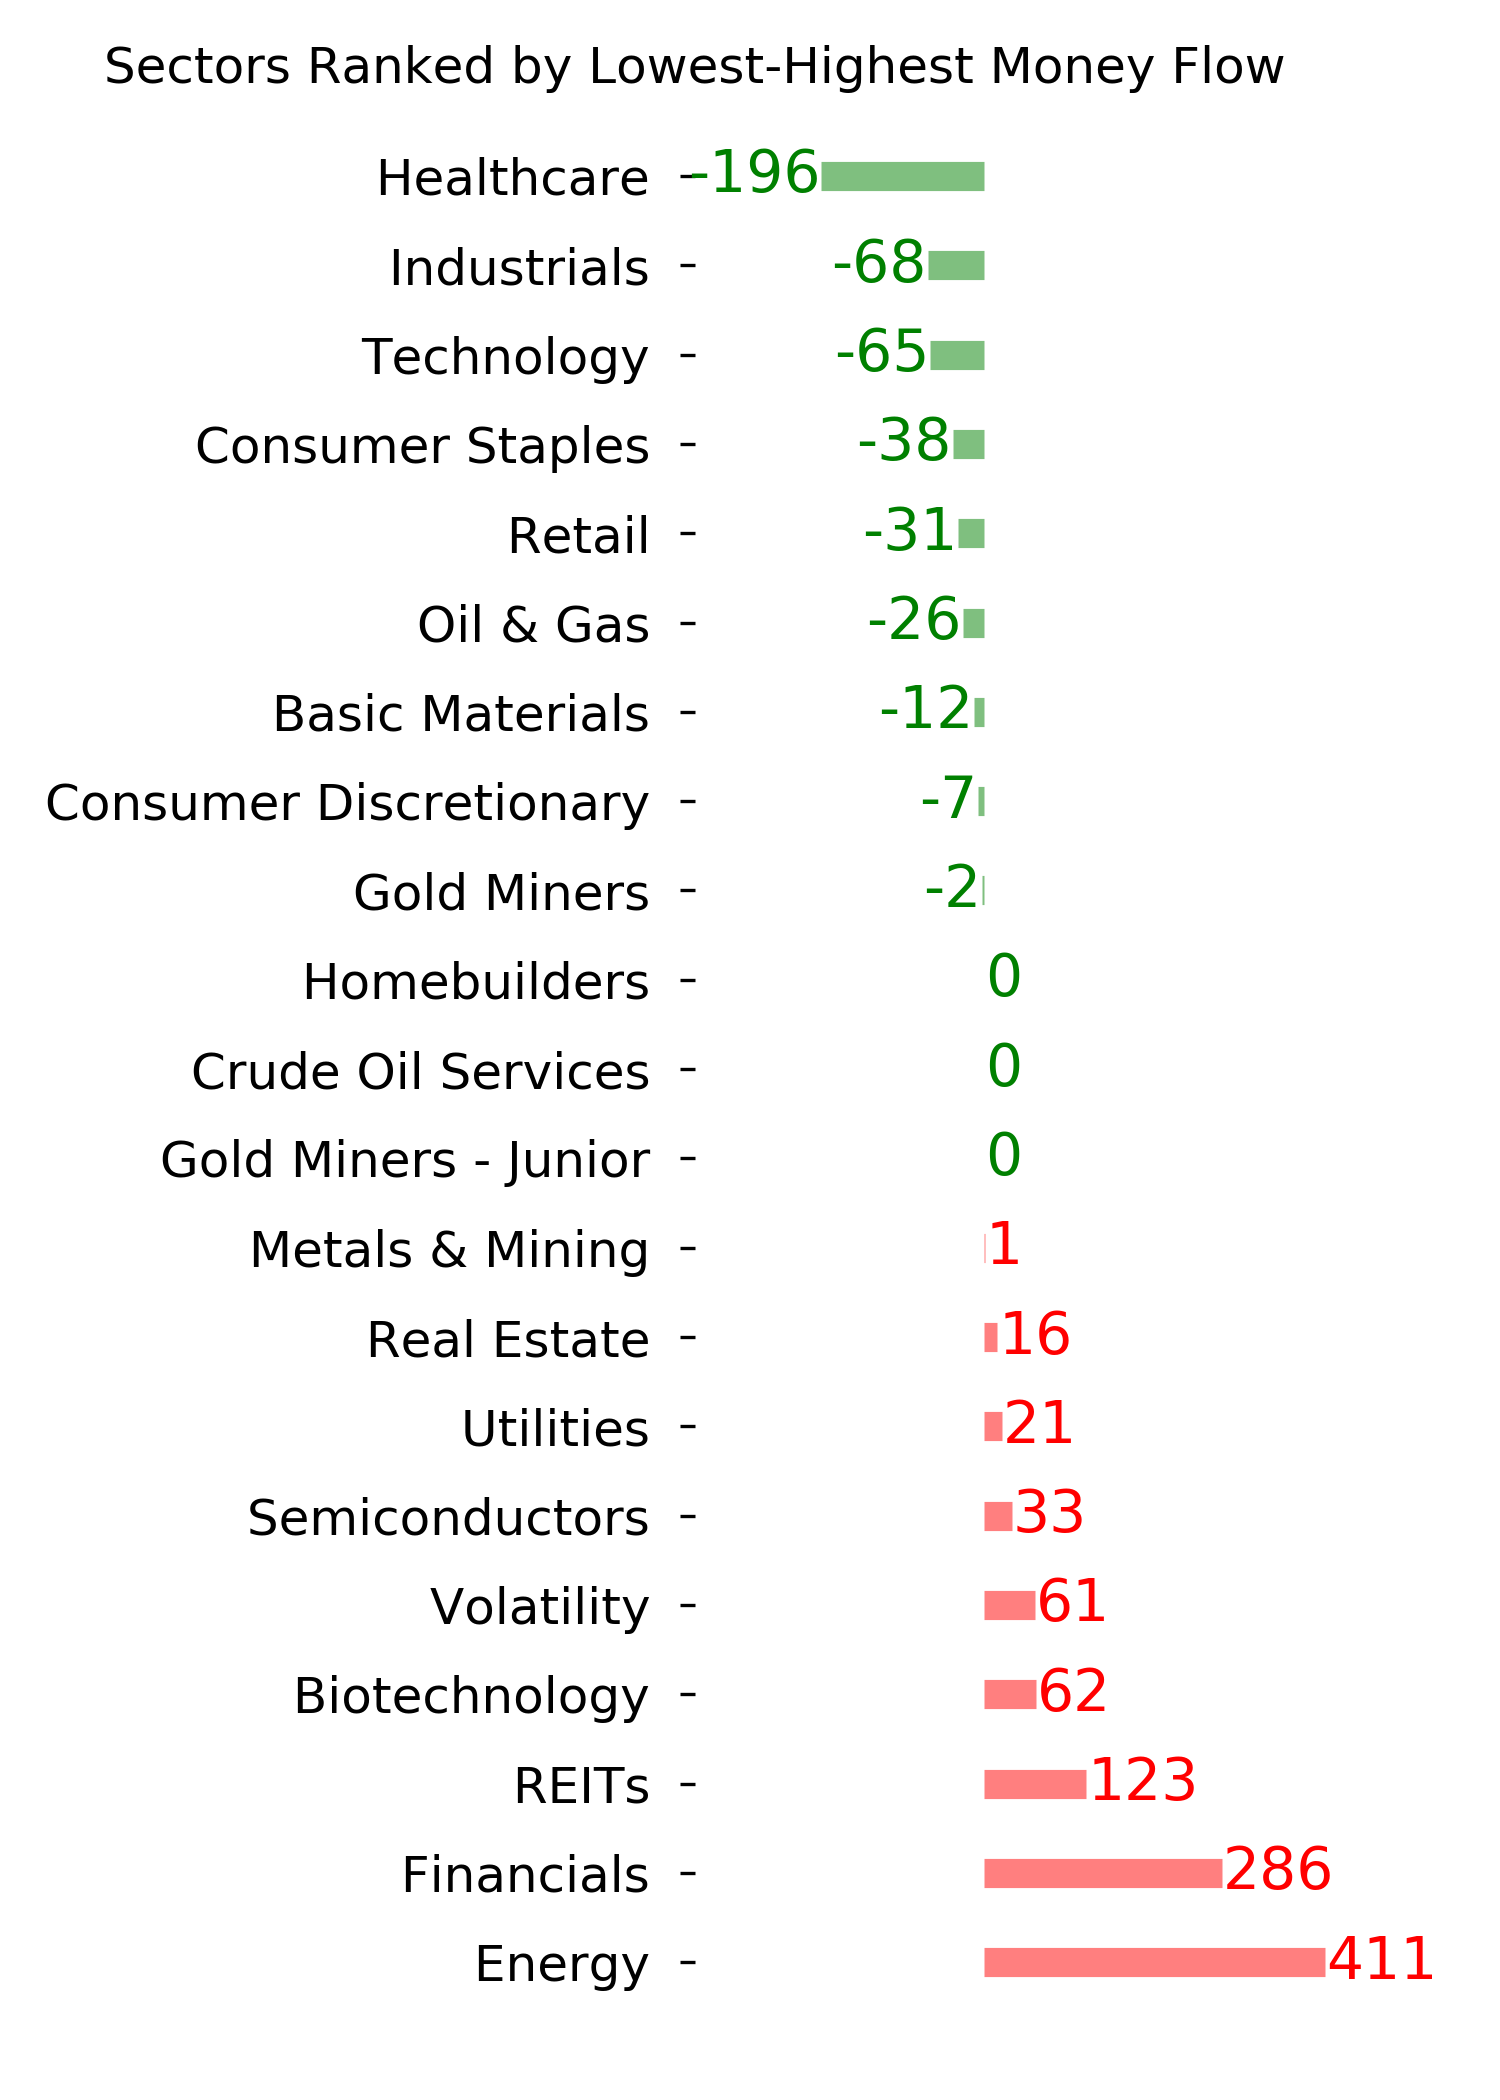
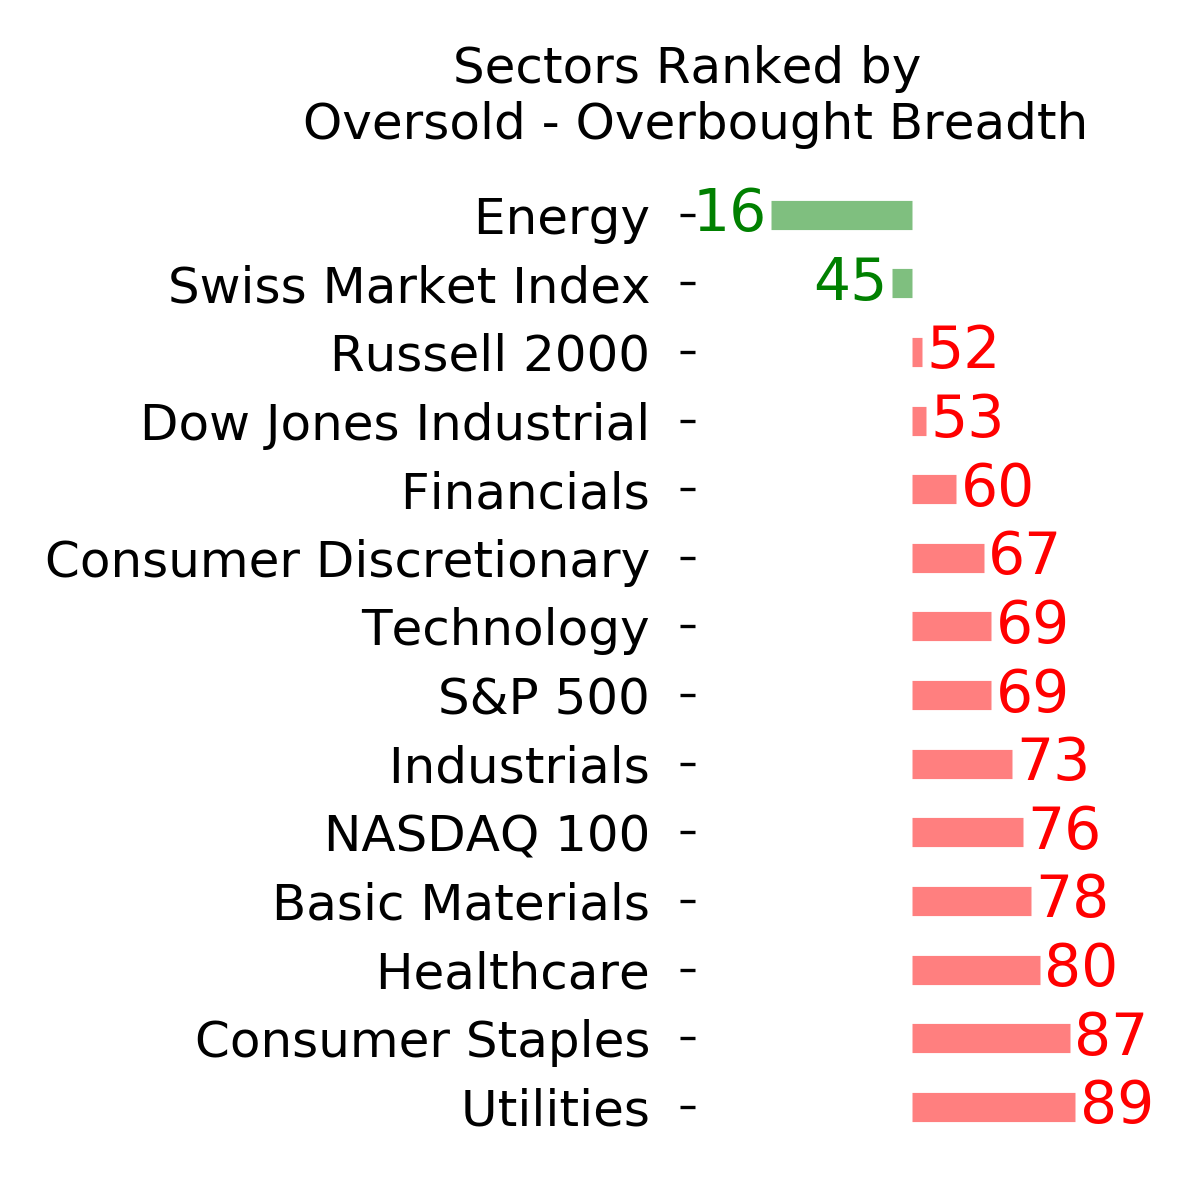
Ranks
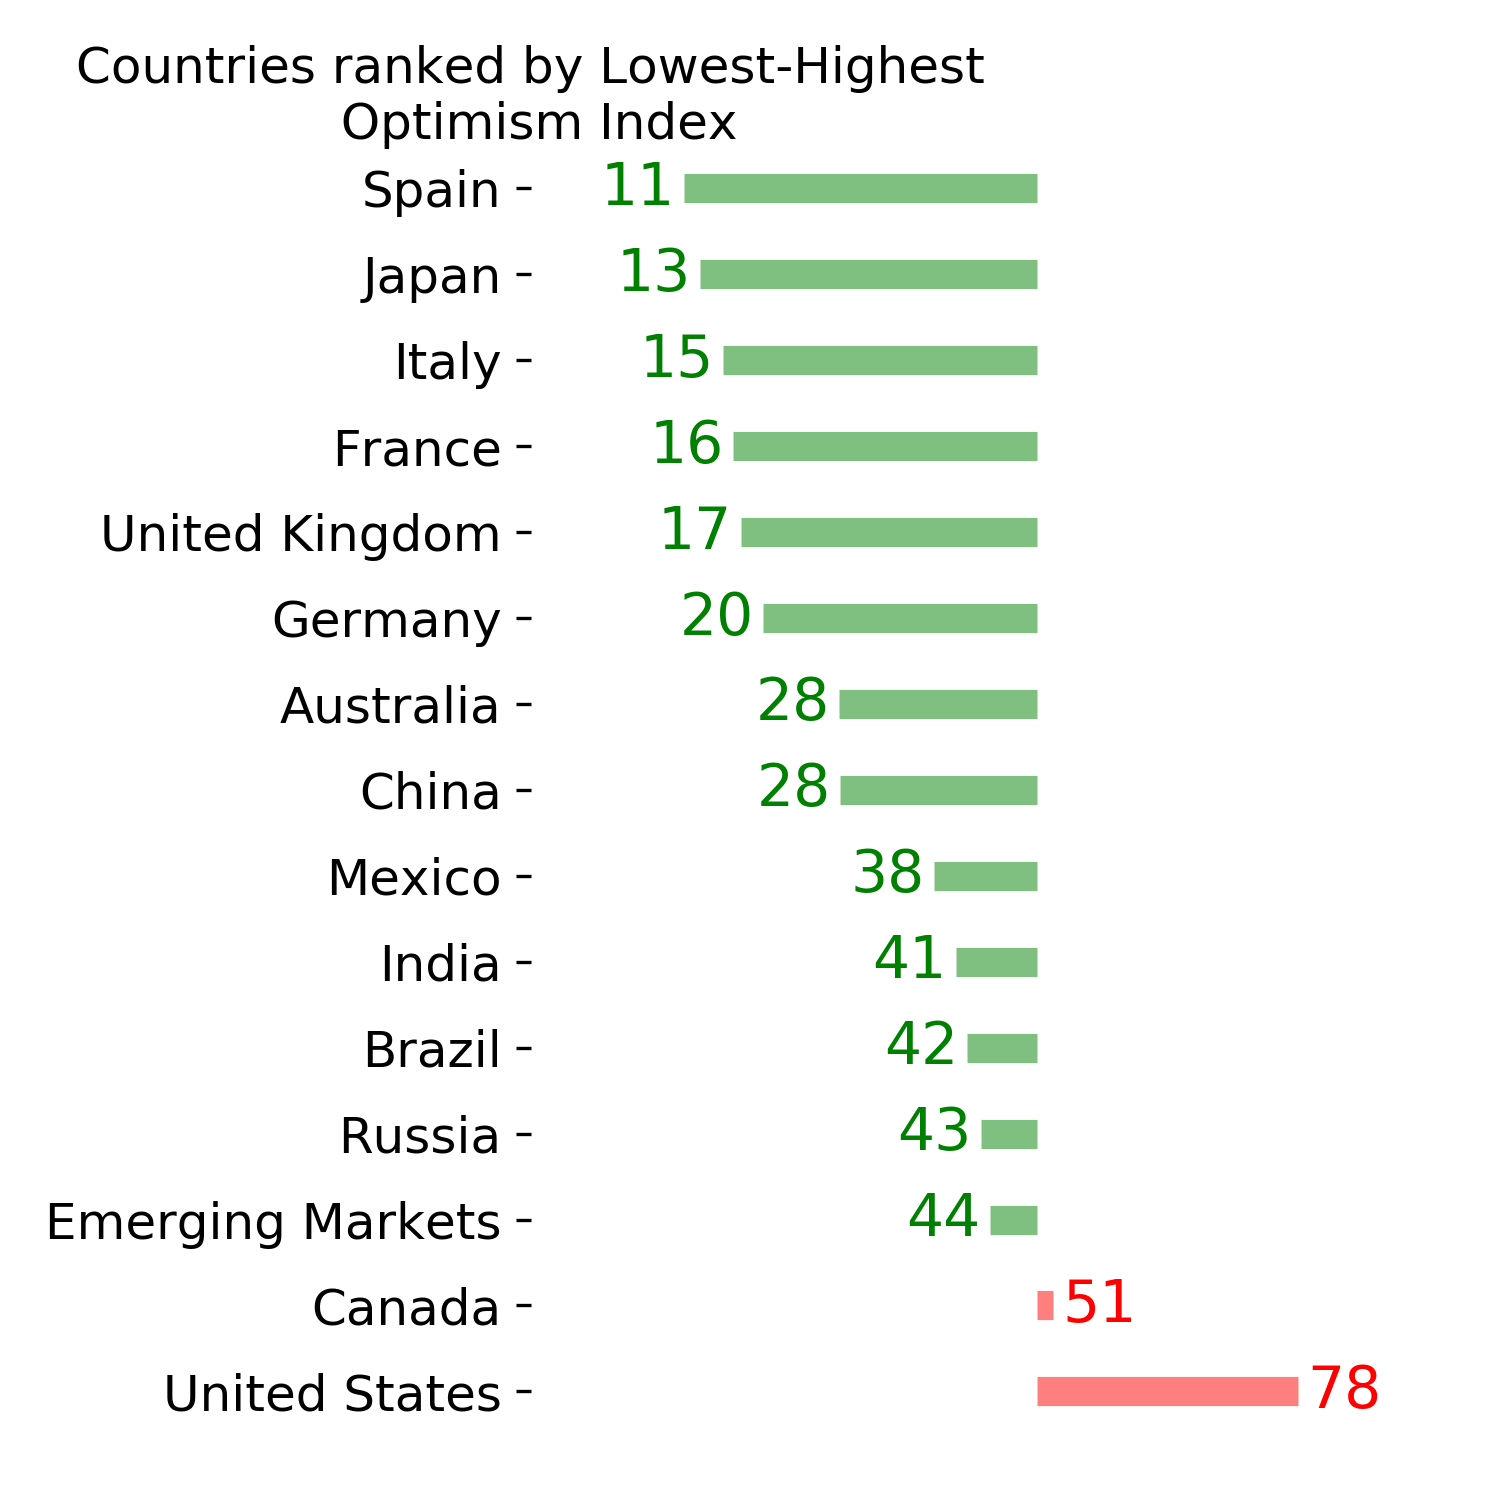
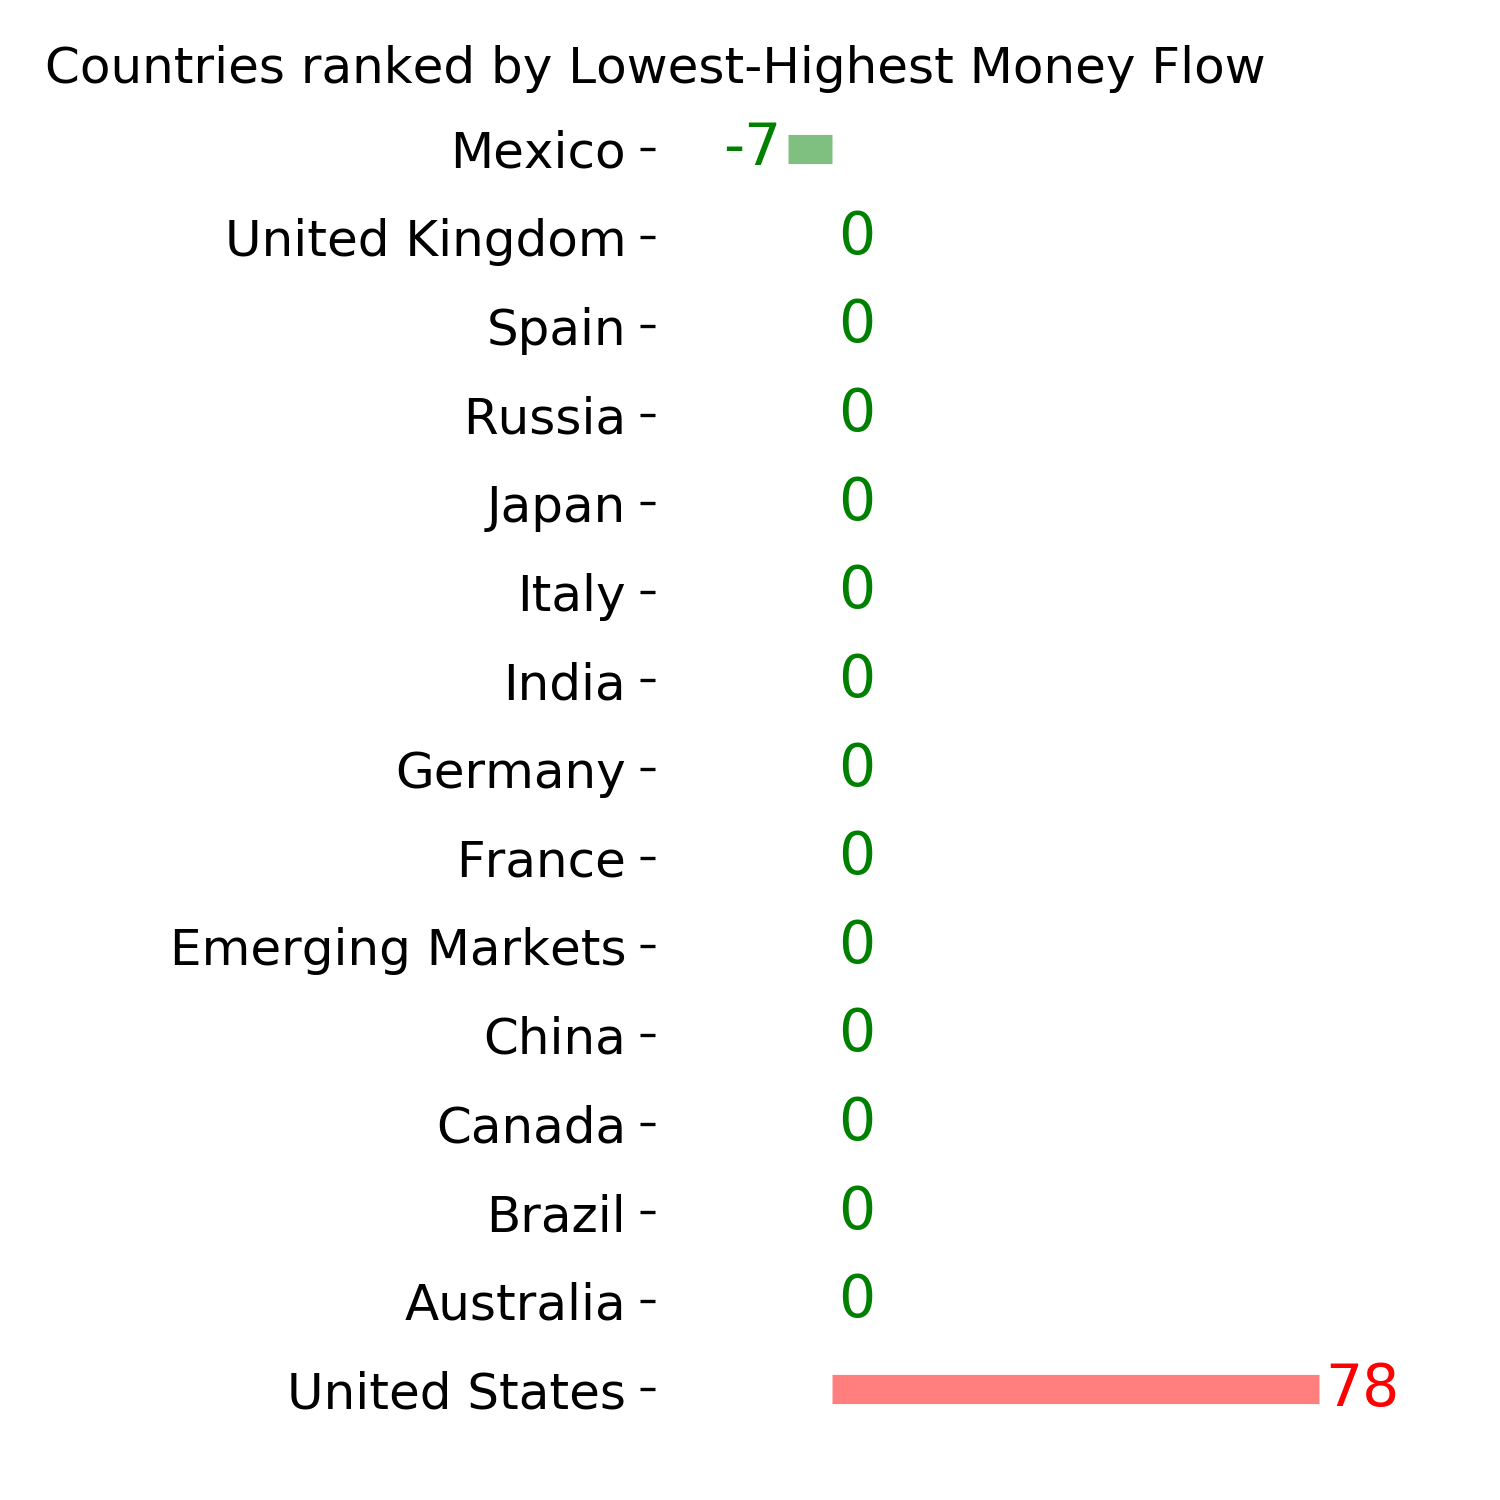
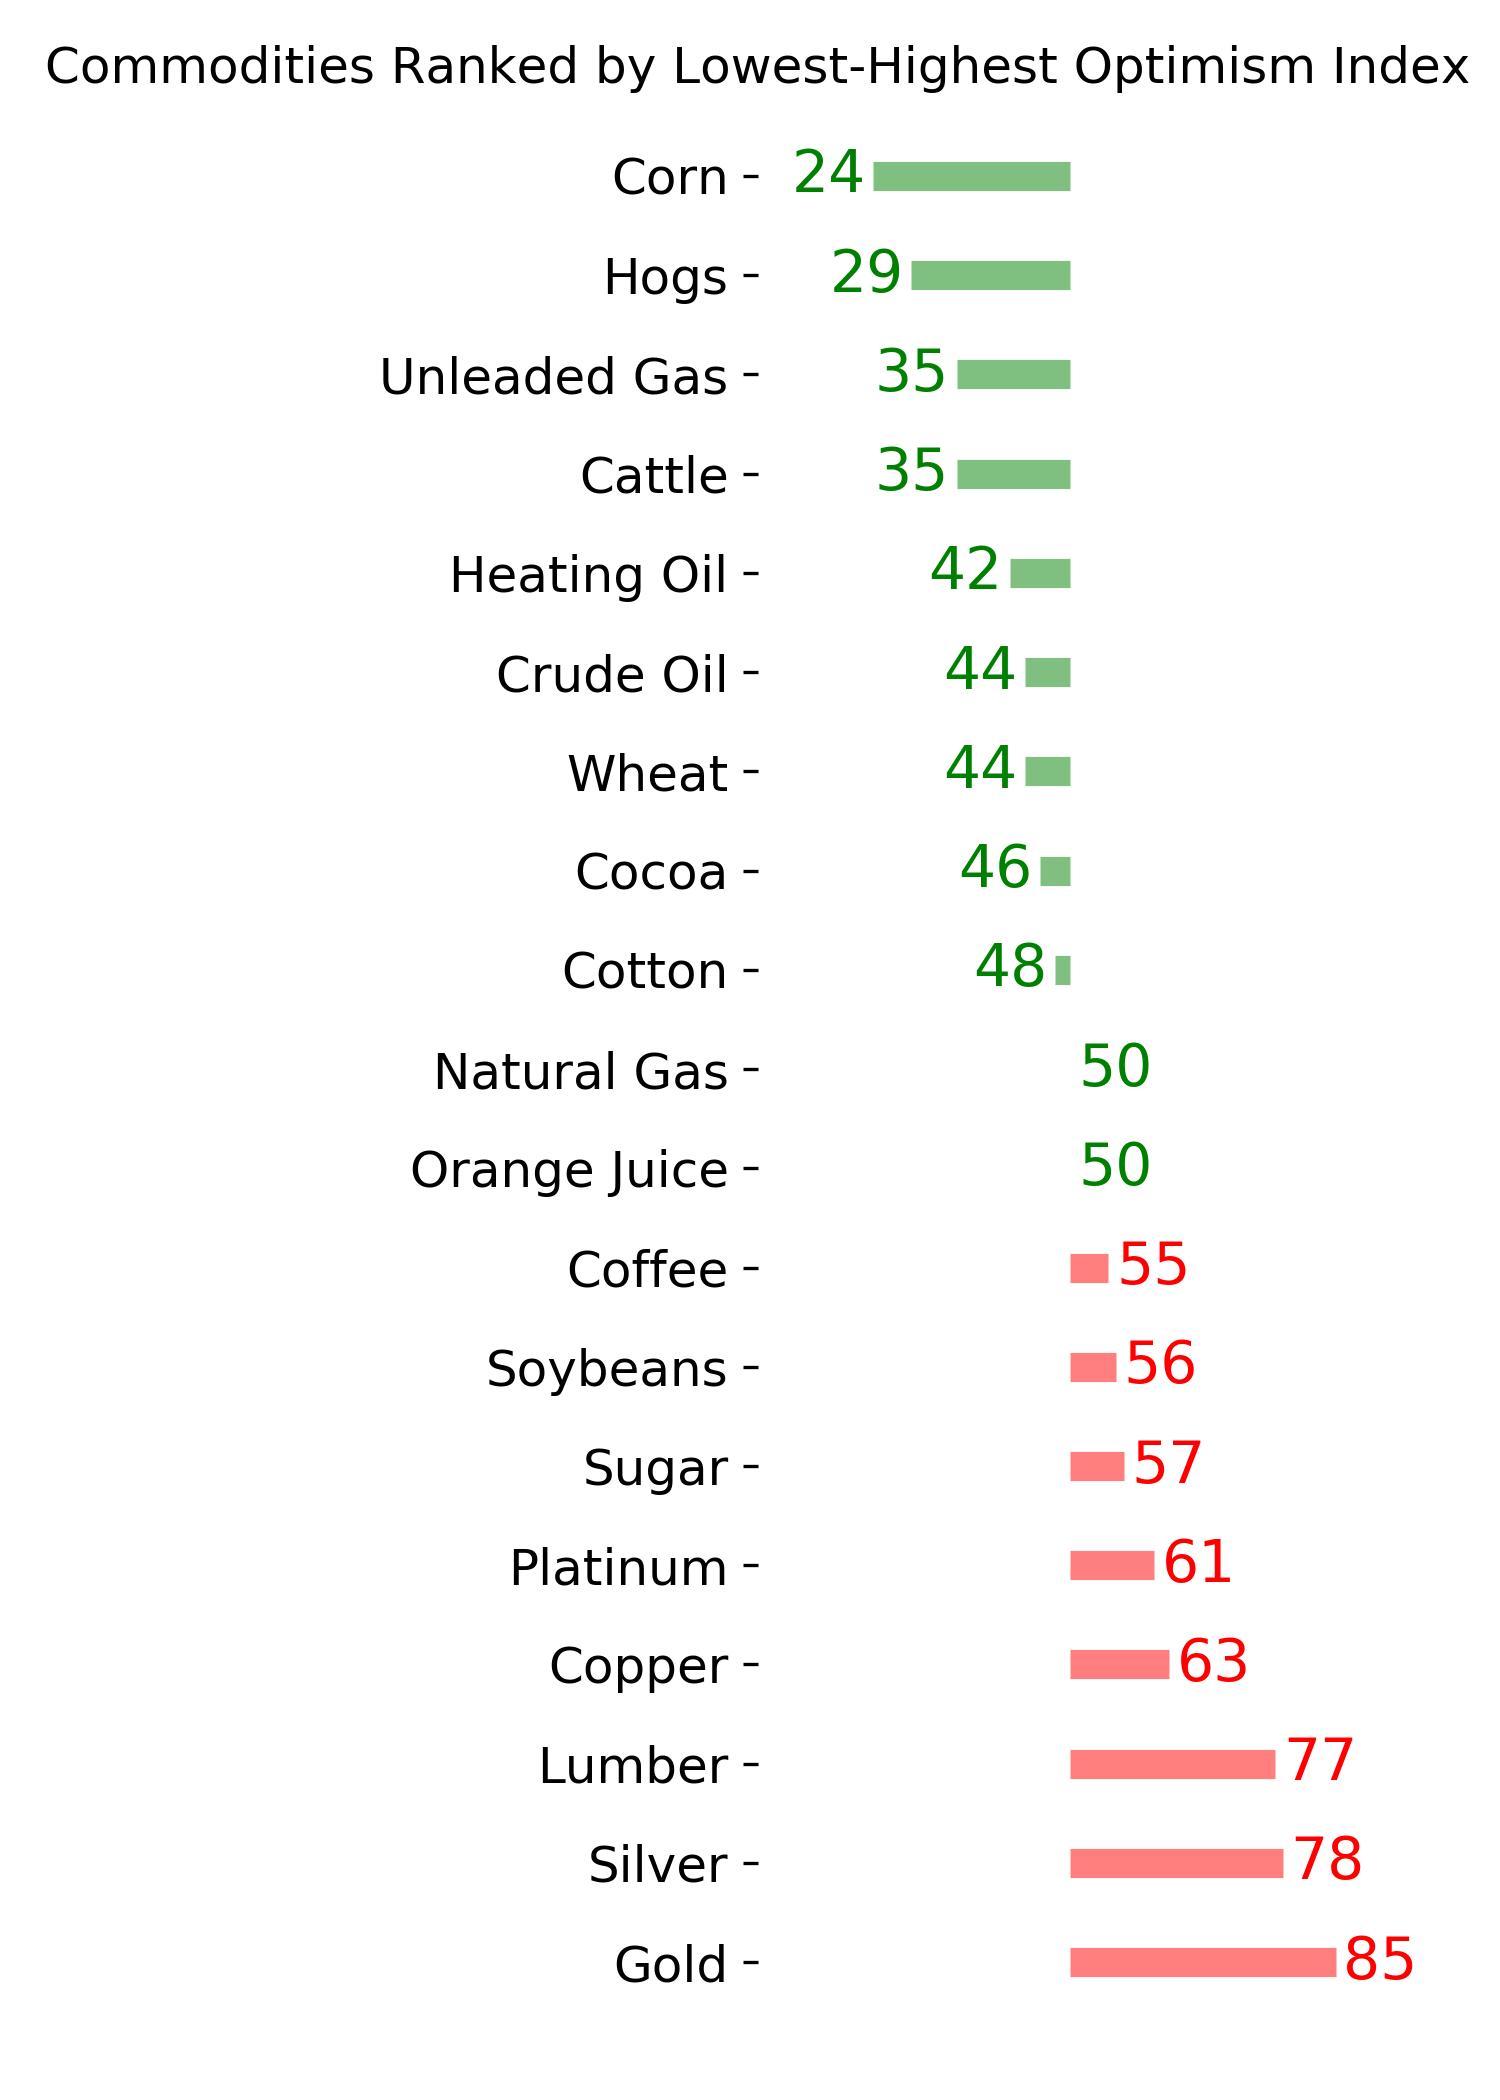
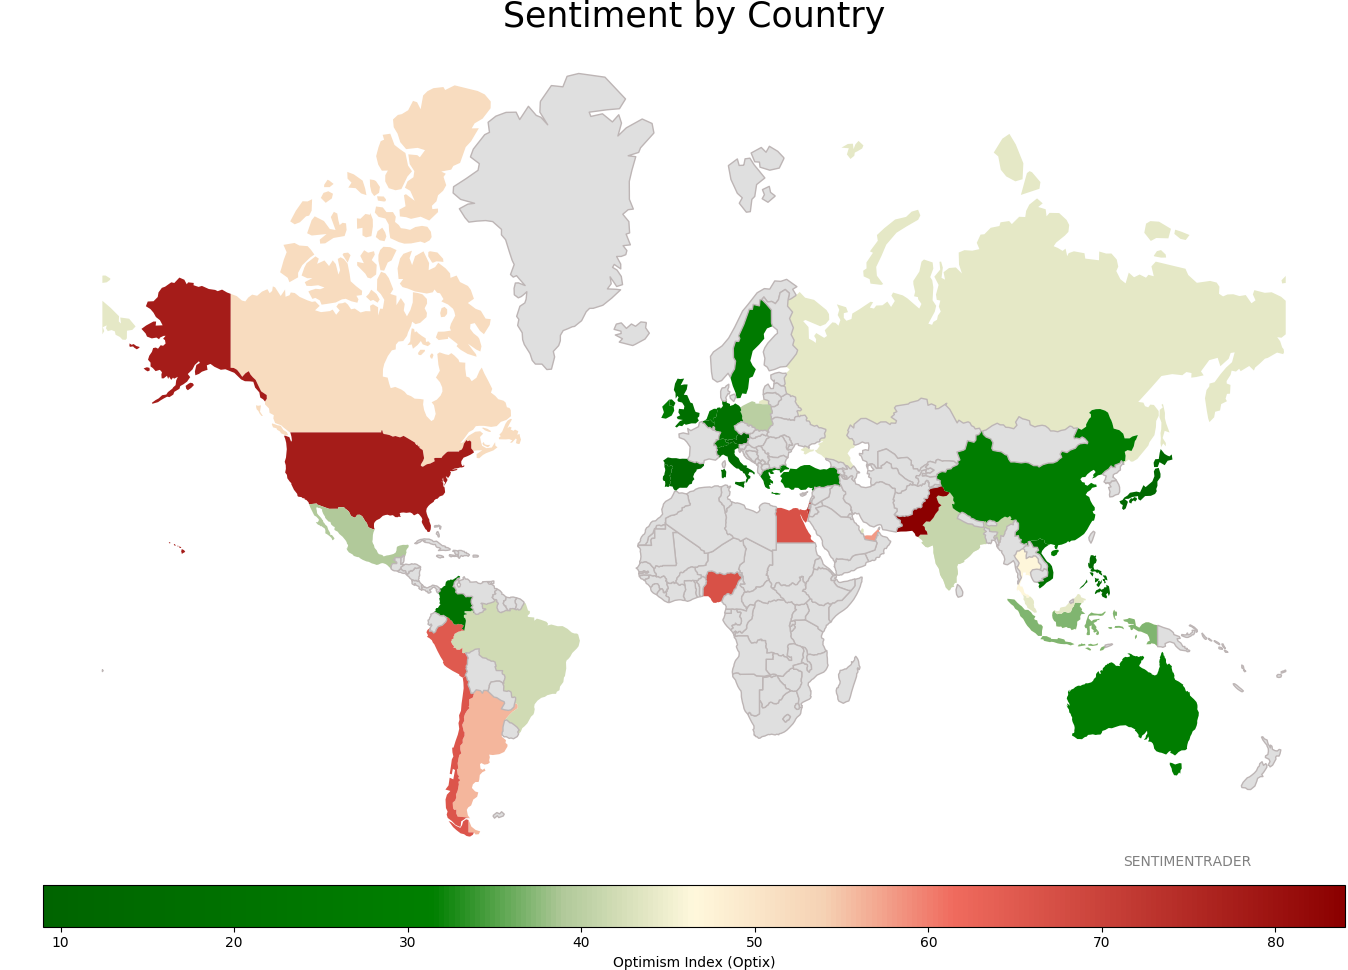
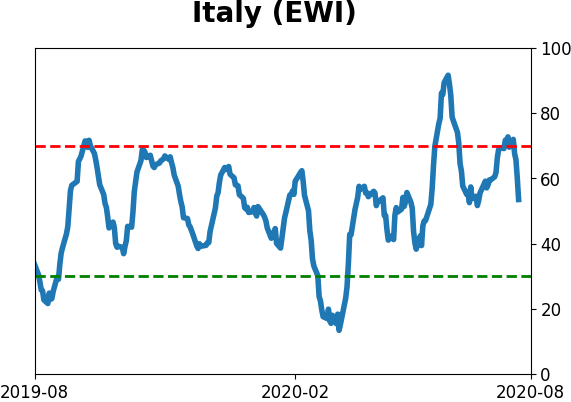
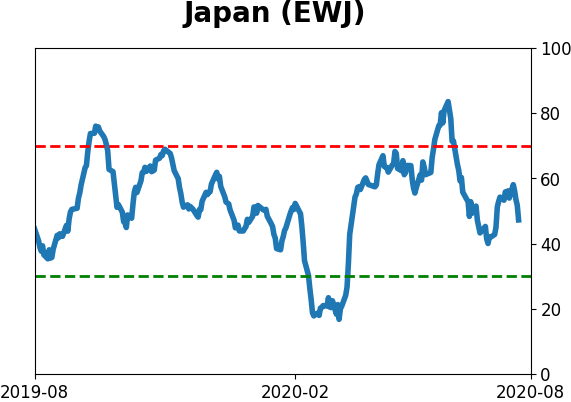
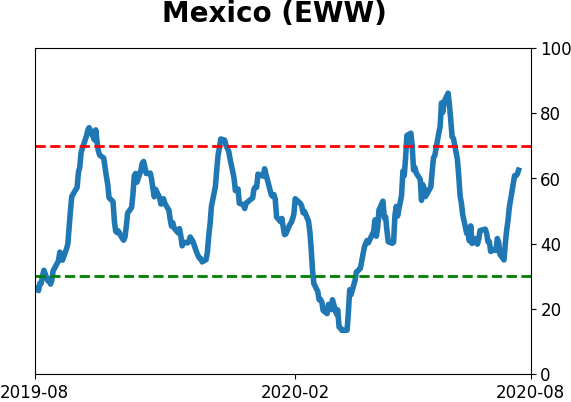
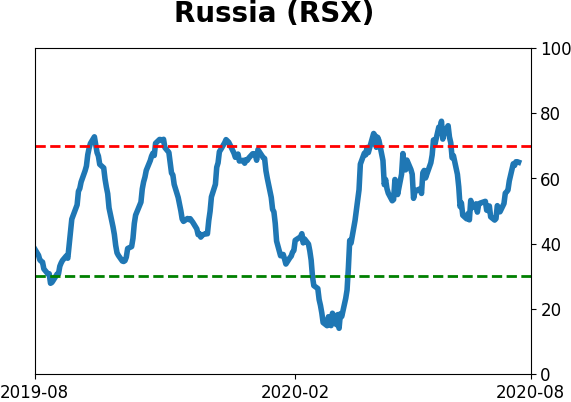
Sentiment Around The World
Optimism Index Thumbnails
|
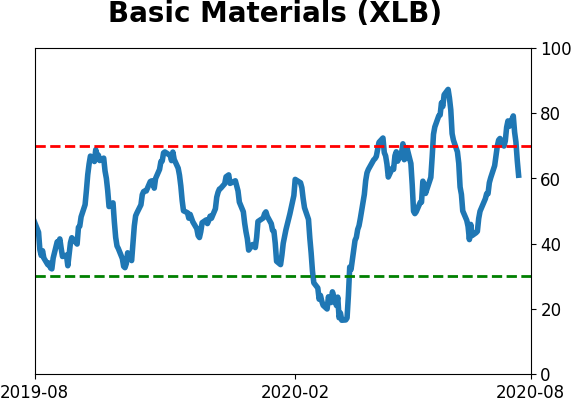
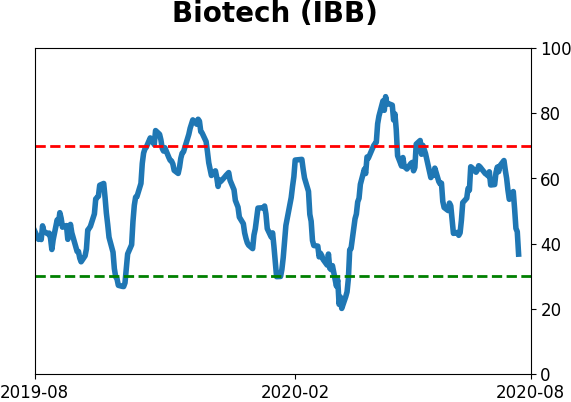
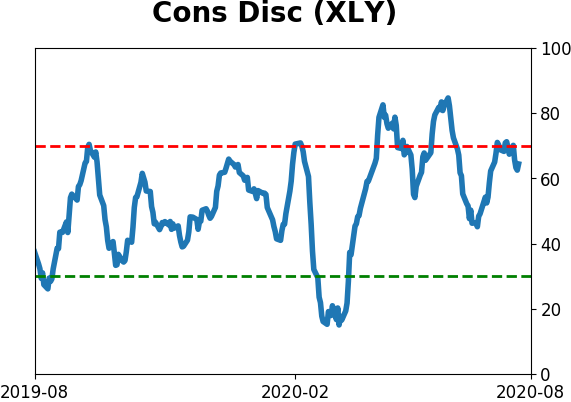
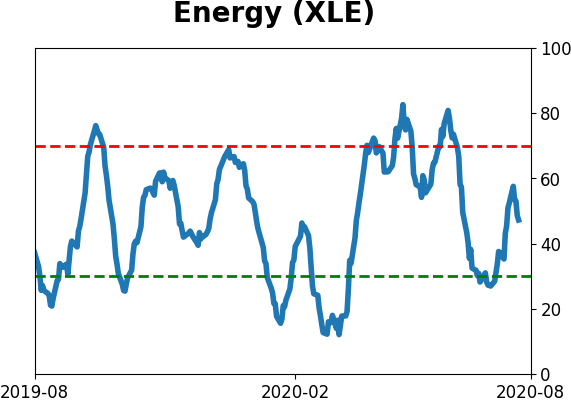
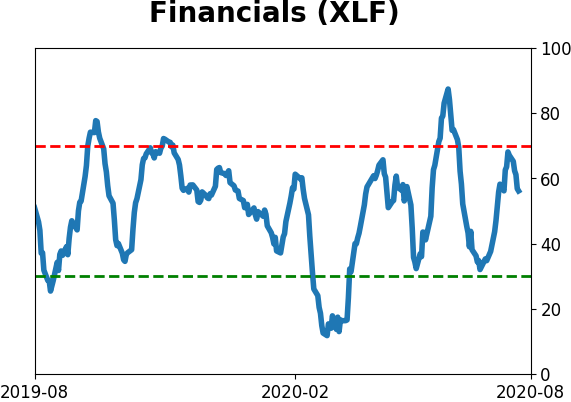
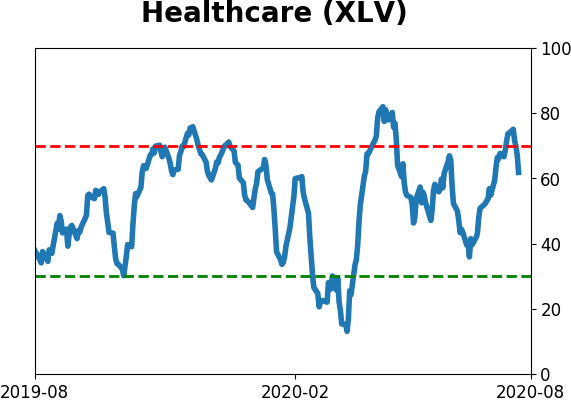
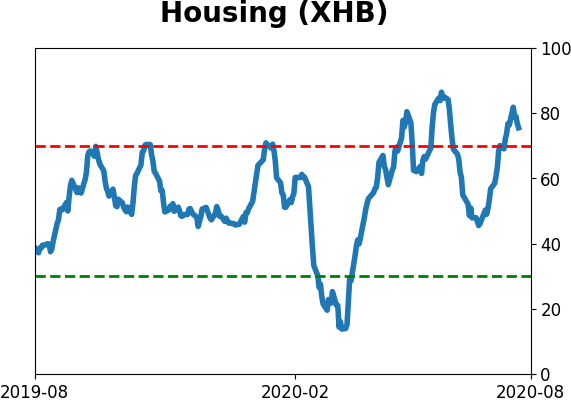
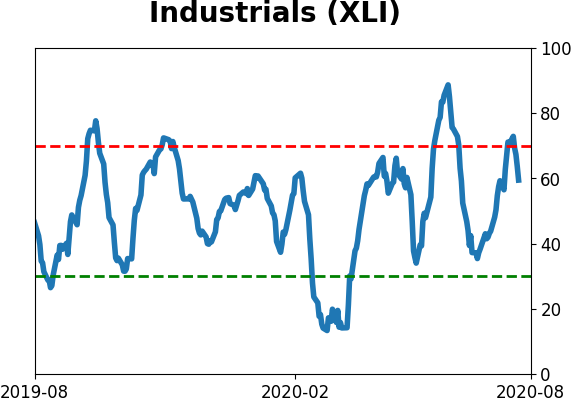
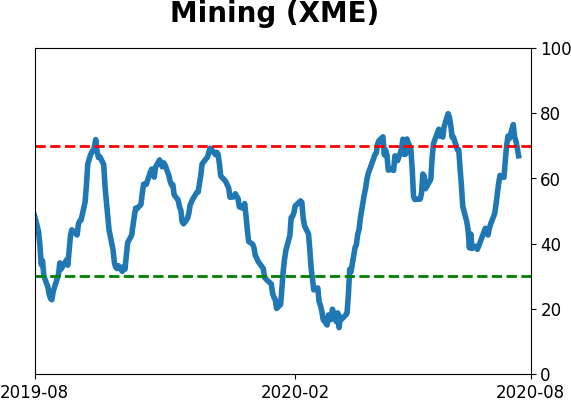
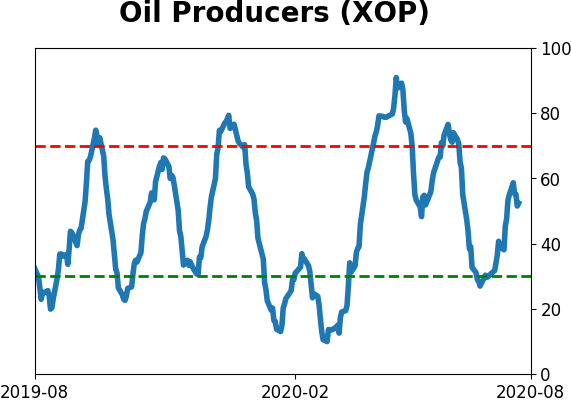
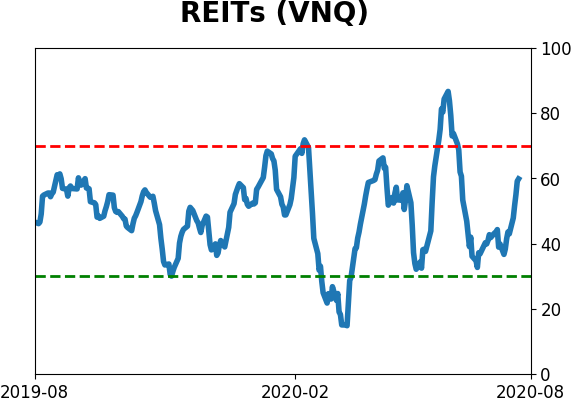
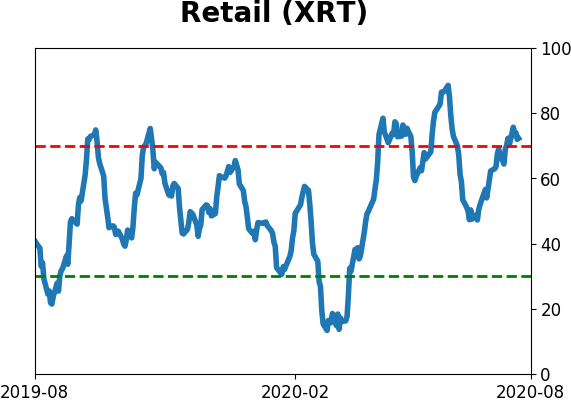
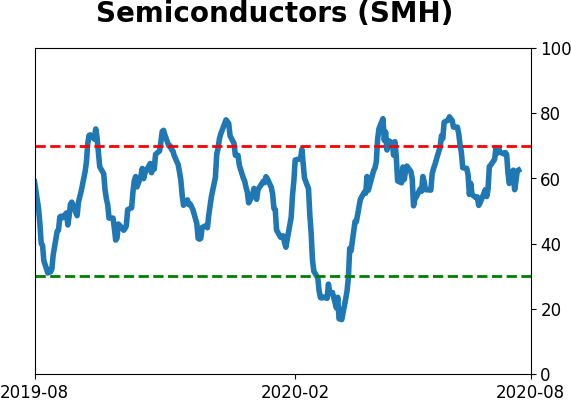
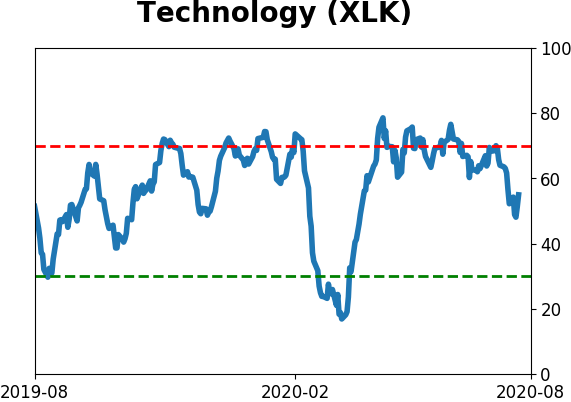
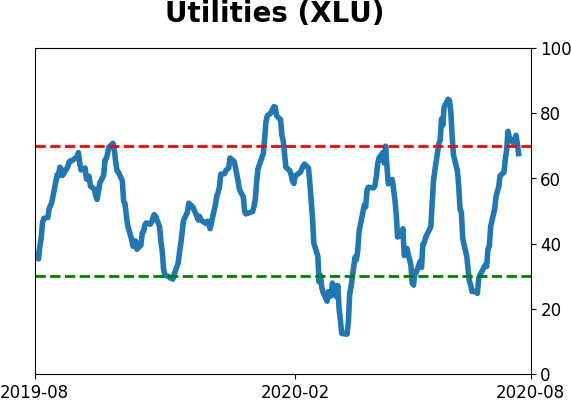
Sector ETF's - 10-Day Moving Average
|
|
|
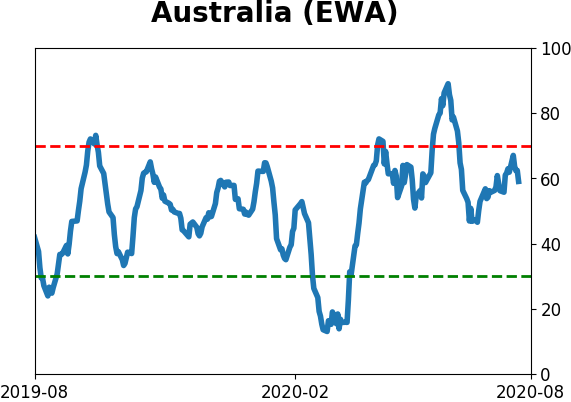
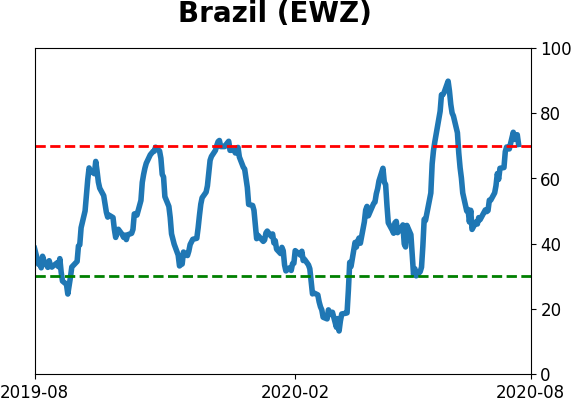
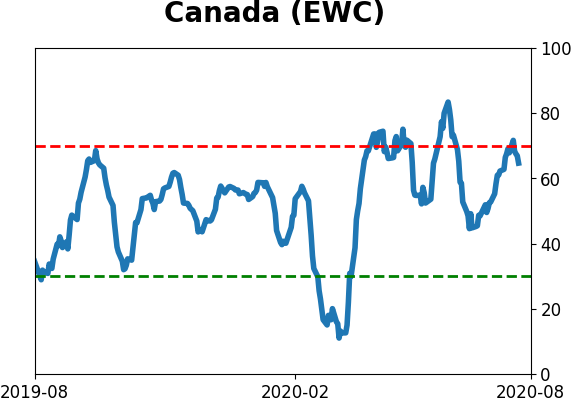
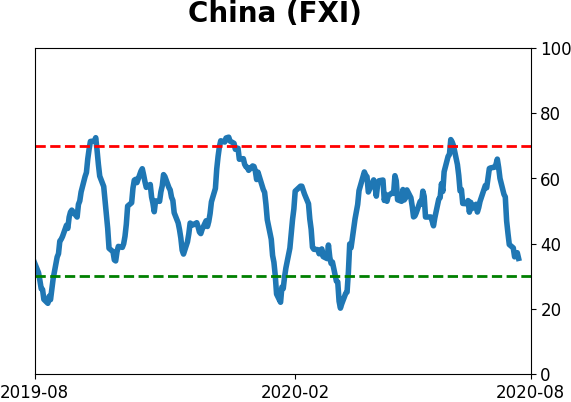
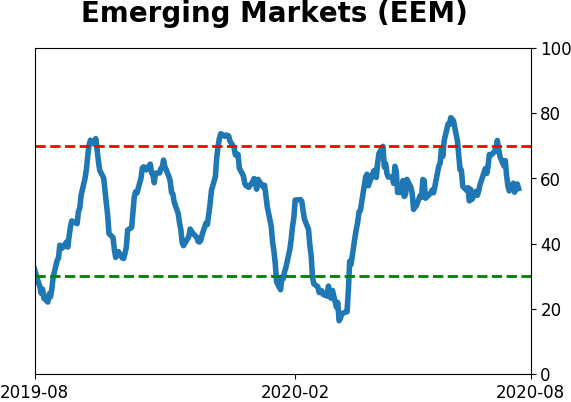
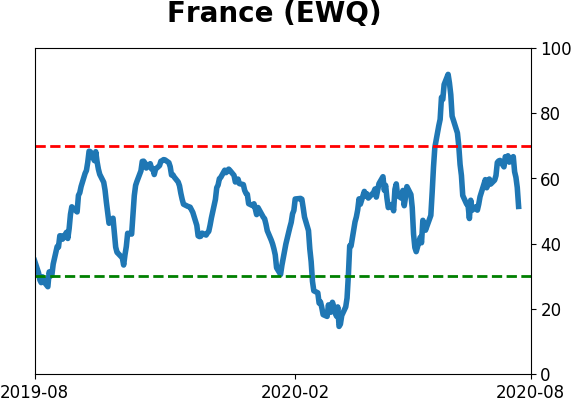
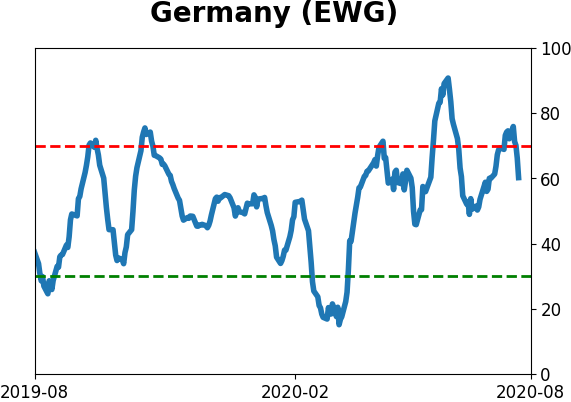
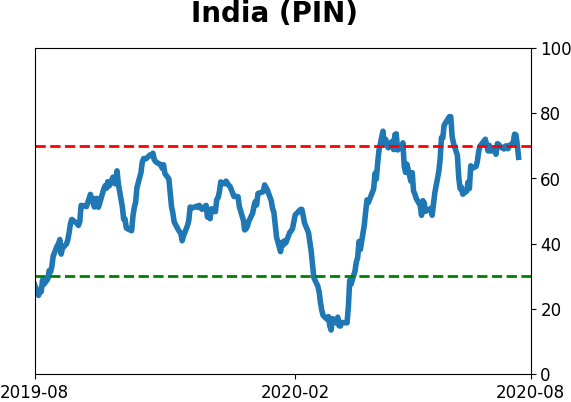
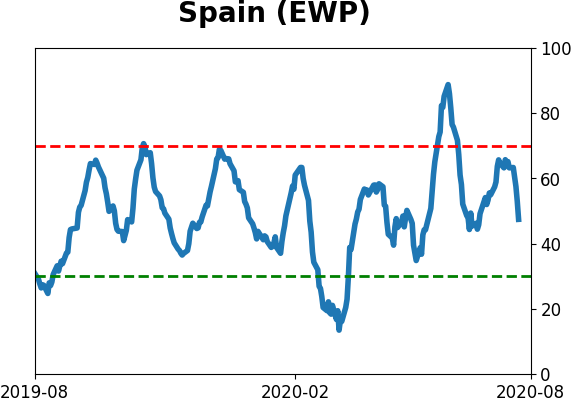
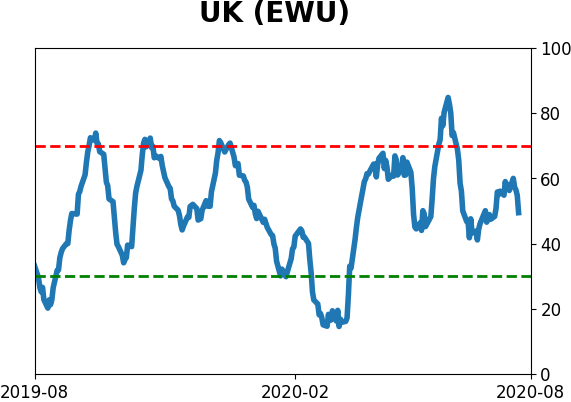
Country ETF's - 10-Day Moving Average
|
|
|
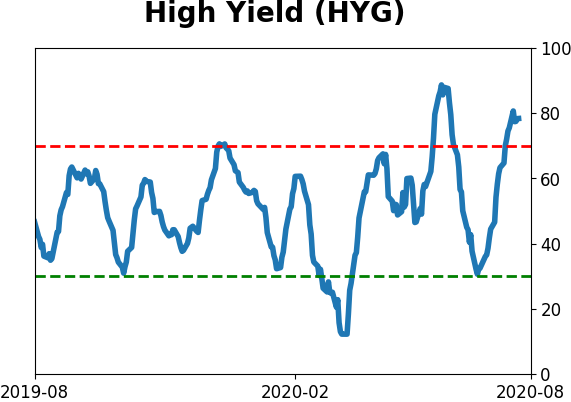
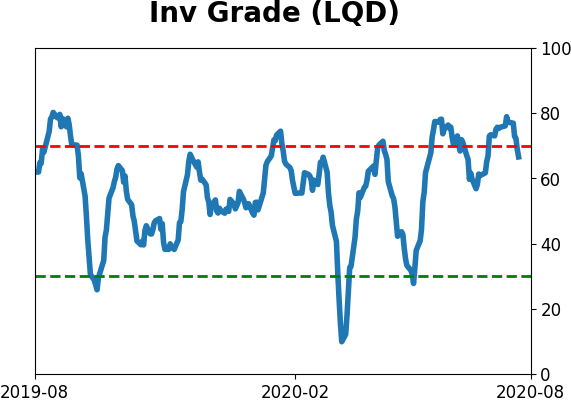
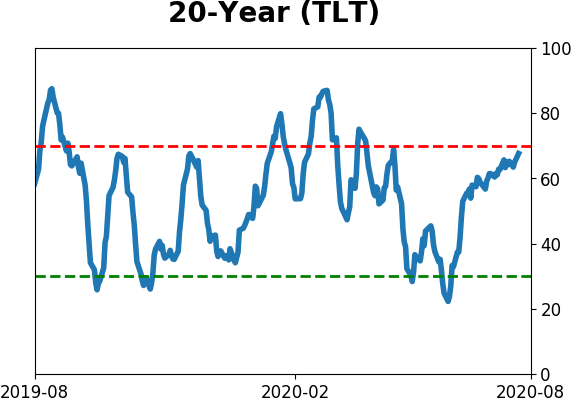
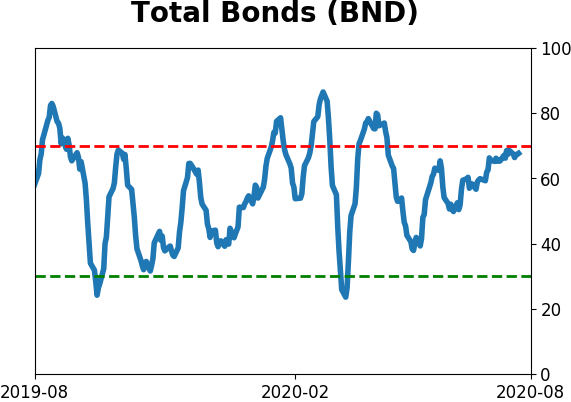
Bond ETF's - 10-Day Moving Average
|
|
|
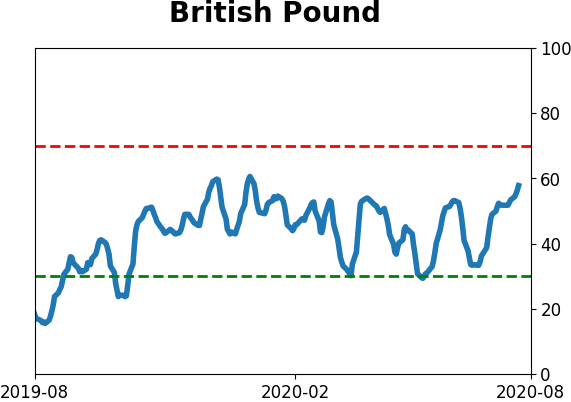
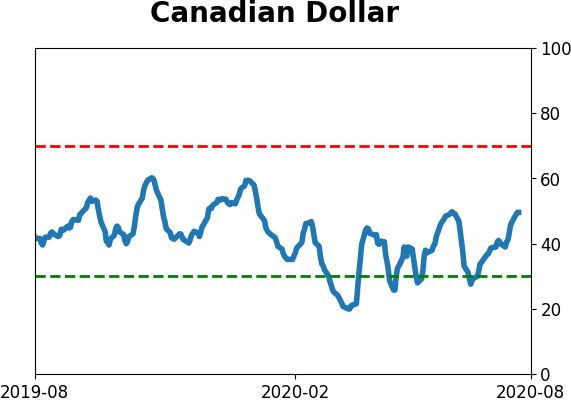
Currency ETF's - 5-Day Moving Average
|
|
|
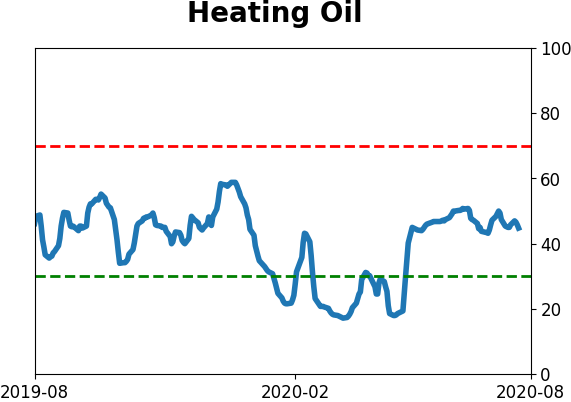
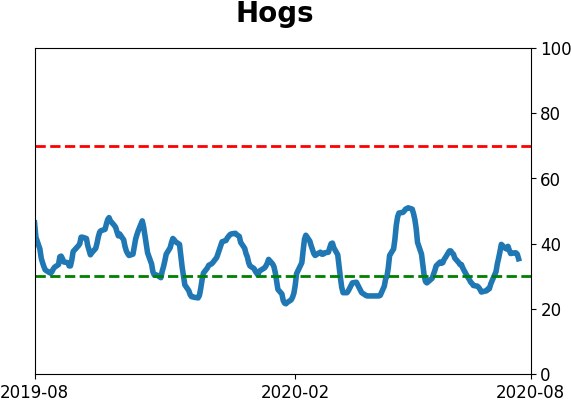
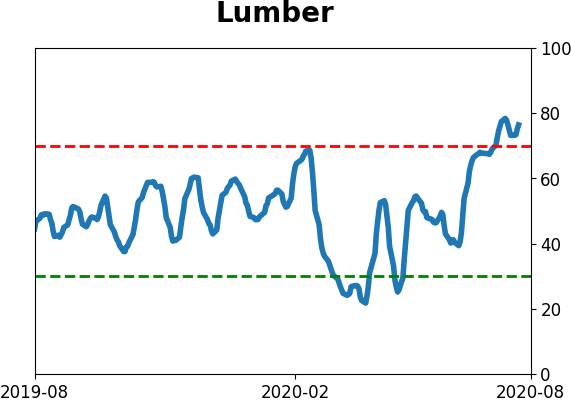
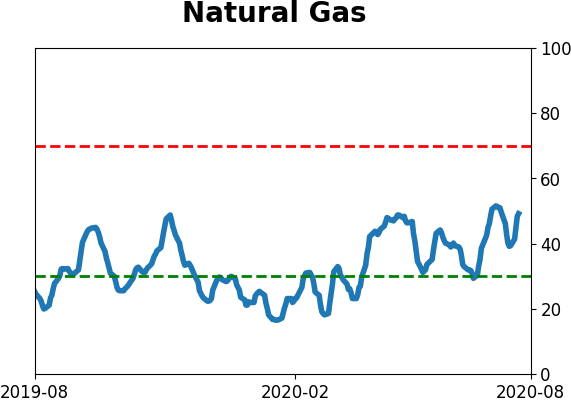
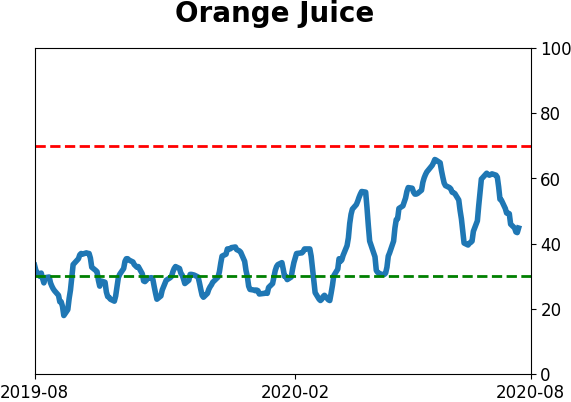
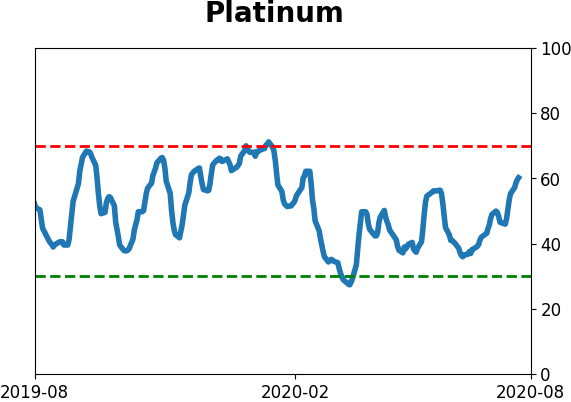
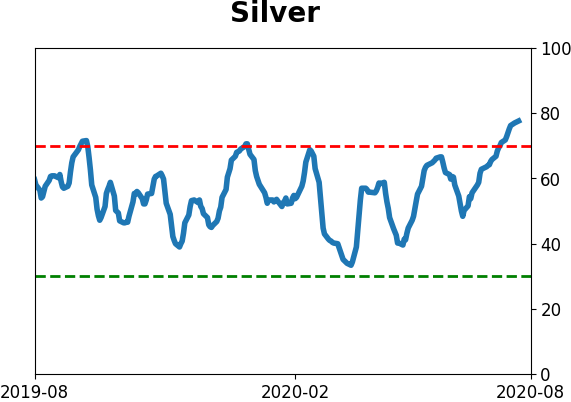
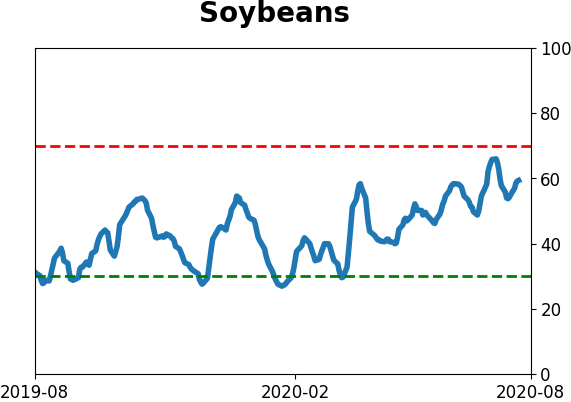
Commodity ETF's - 5-Day Moving Average
|
|