Headlines
|
|
The 4th Widest Spread Against Emerging Markets:
Emerging market stocks have greatly underperformed those in the U.S. Through late July, this is the 4th-widest amount that emerging markets stocks have trailed domestic ones, and the precedents all led to even more underperformance.
Bottom Line:
See the Outlook & Allocations page for more details on these summaries STOCKS: Hold
The speculative frenzy in February is wrung out. Internal dynamics have mostly held up, with some exceptions. Many of our studies still show a mixed to poor short-term view, with medium- and long-term ones turning more positive. BONDS: Hold
Various parts of the market got hit in March, with the lowest Bond Optimism Index we usually see during healthy environments. After a shaky couple of weeks, the broad bond market has modestly recovered. Not a big edge here either way. GOLD: Hold
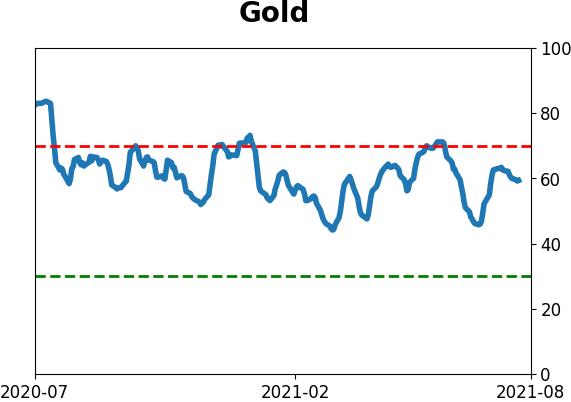
Gold and miners have done very well, recovering above long-term trend lines. The issue is that both have tended to perform poorly after similar situations - will have to wait and see how it plays out.
|
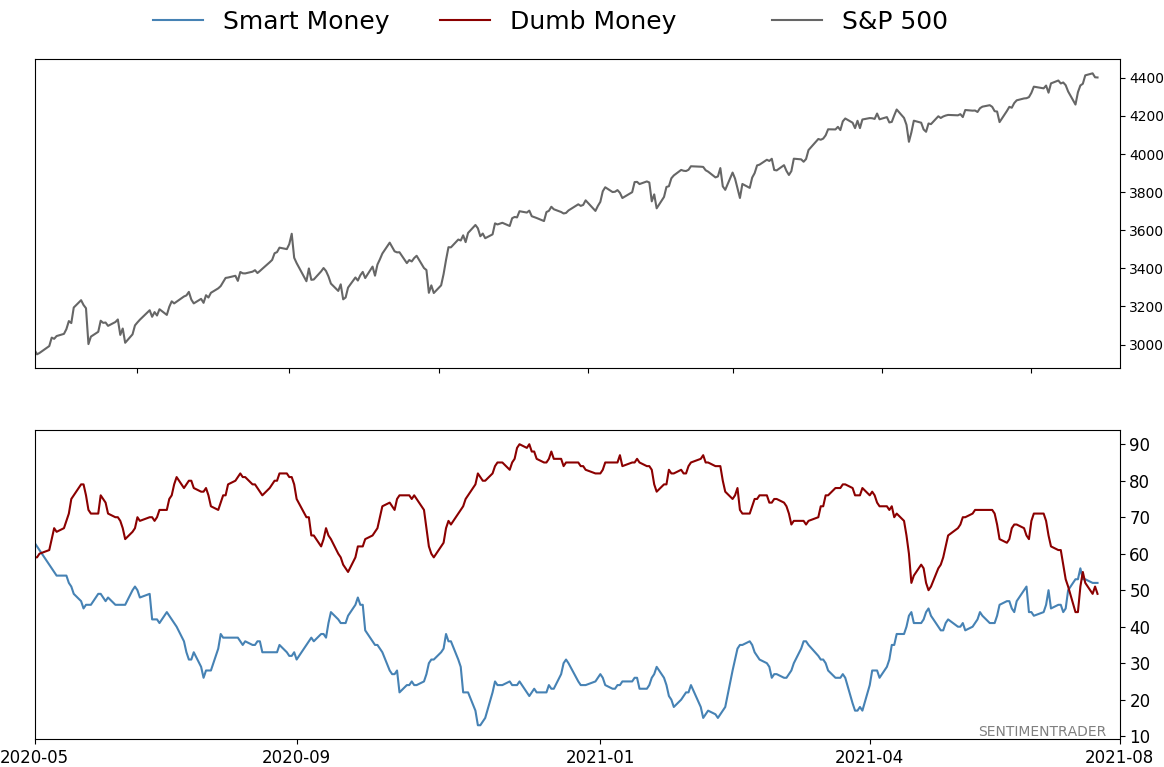
Smart / Dumb Money Confidence
|
Smart Money Confidence: 52%
Dumb Money Confidence: 49%
|
|
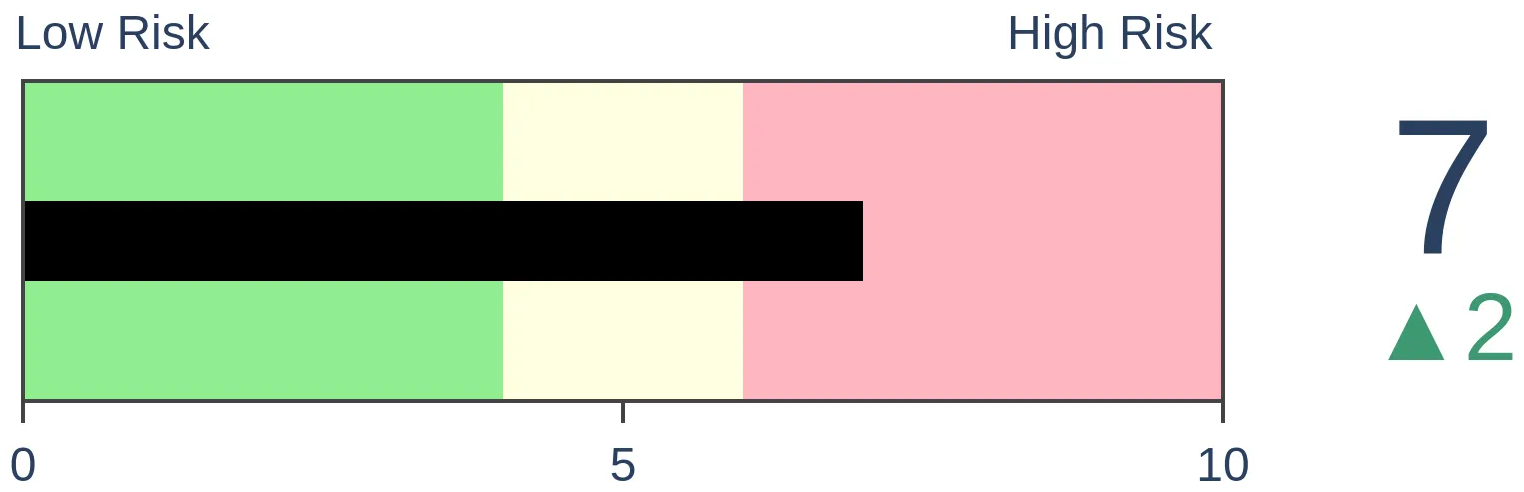
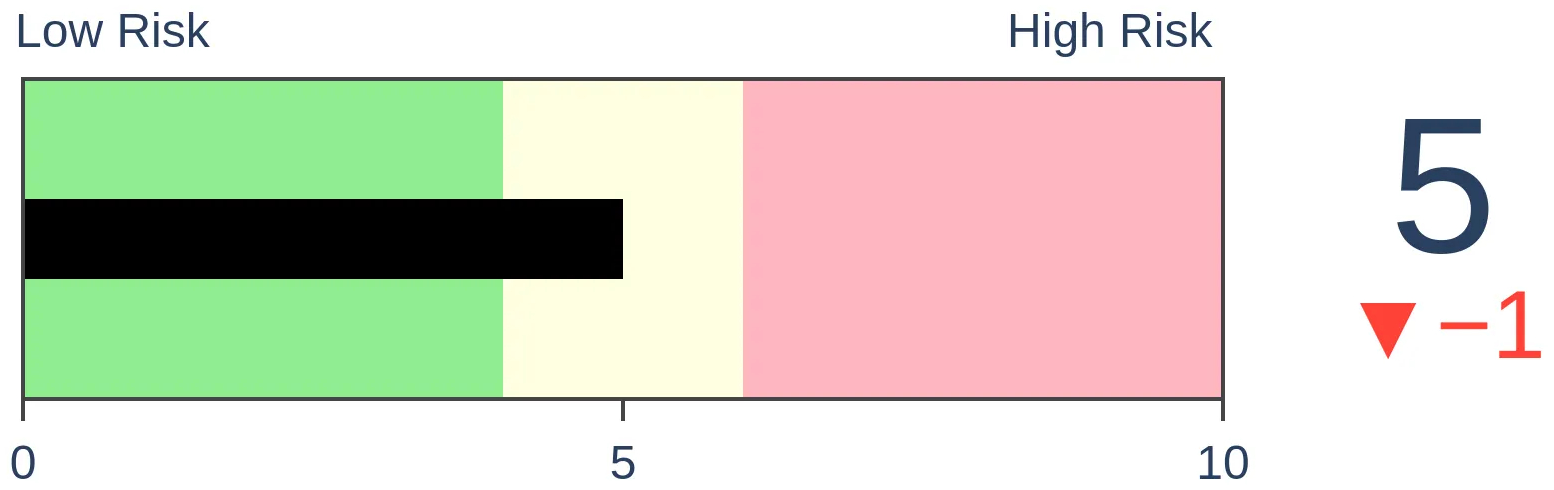
Risk Levels
Stocks Short-Term
|
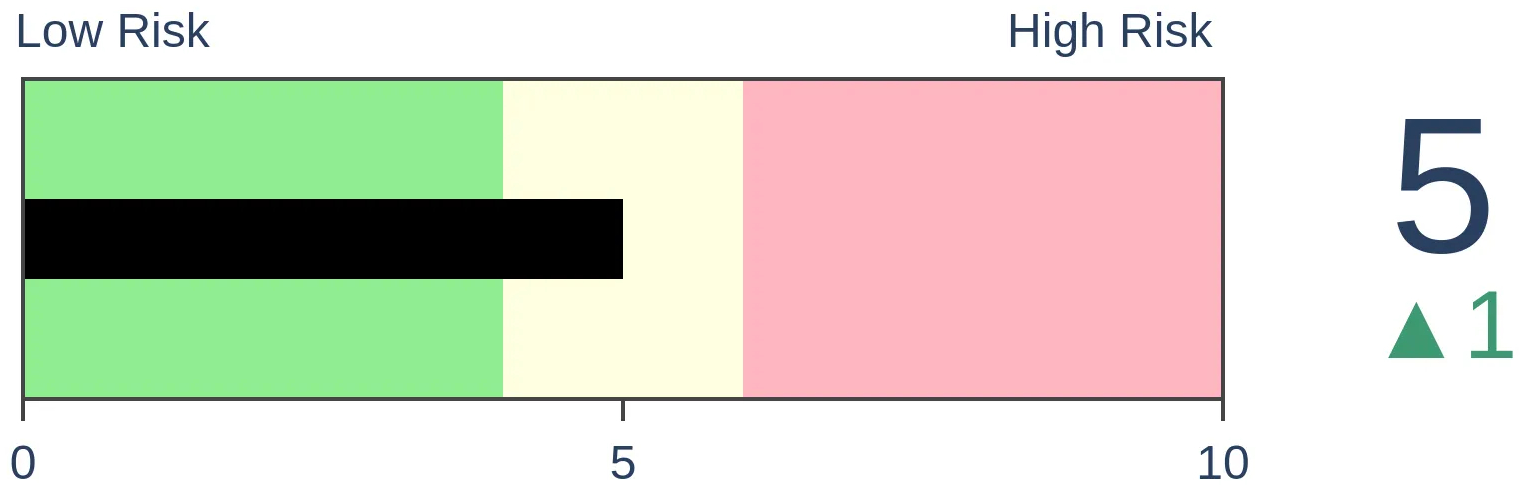
Stocks Medium-Term

|
|
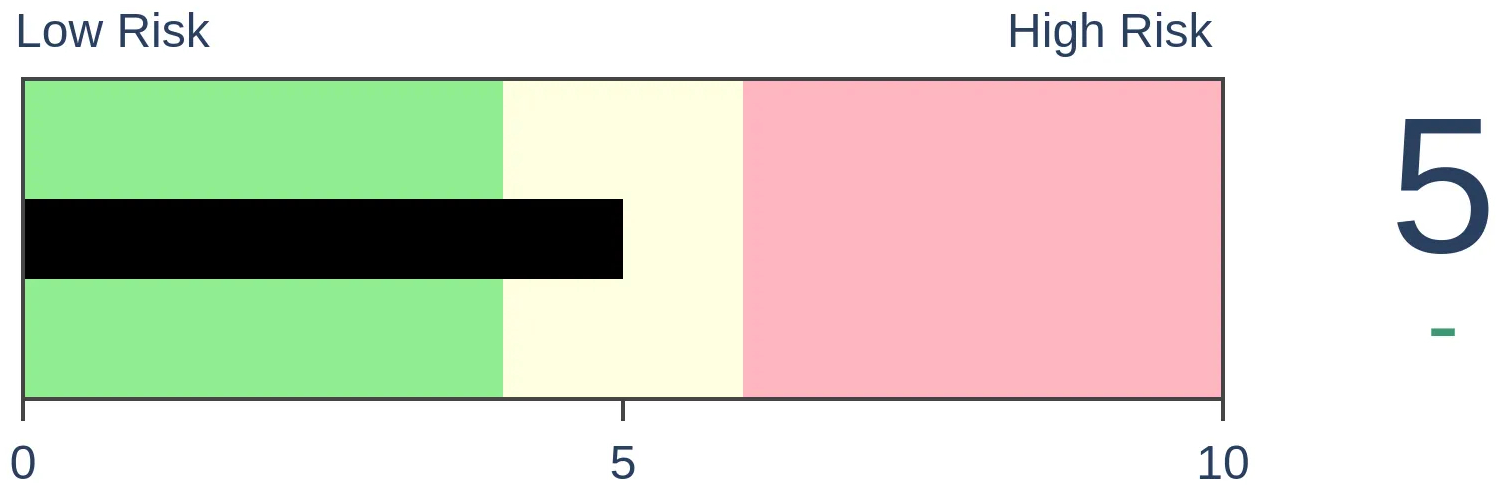
Bonds
|
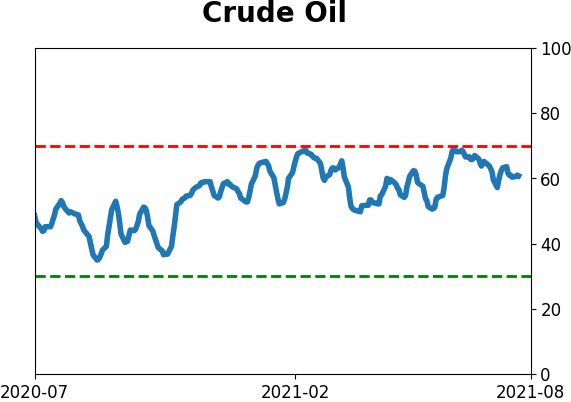
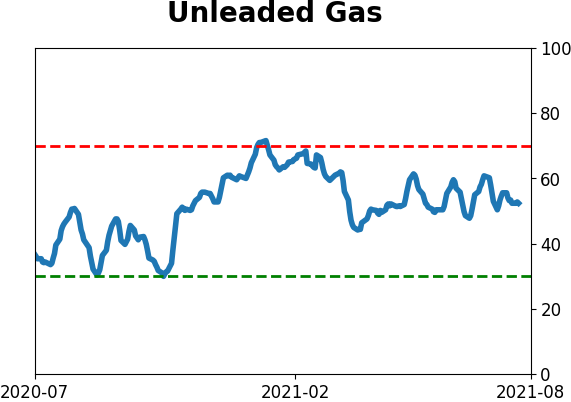
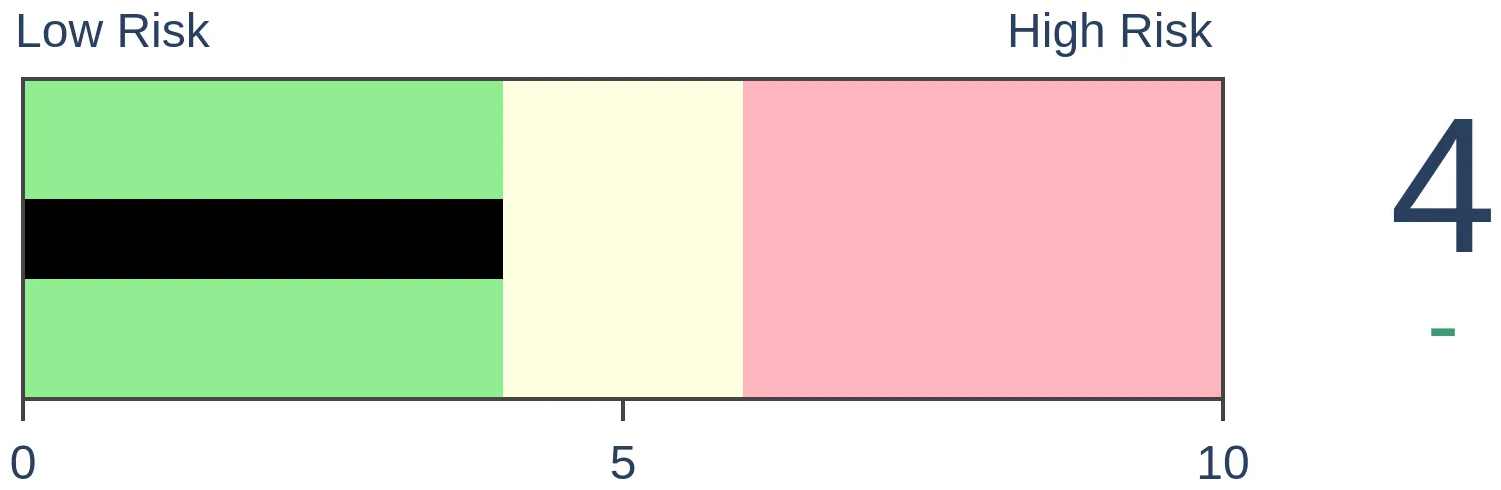
Crude Oil
|
|
Gold
|
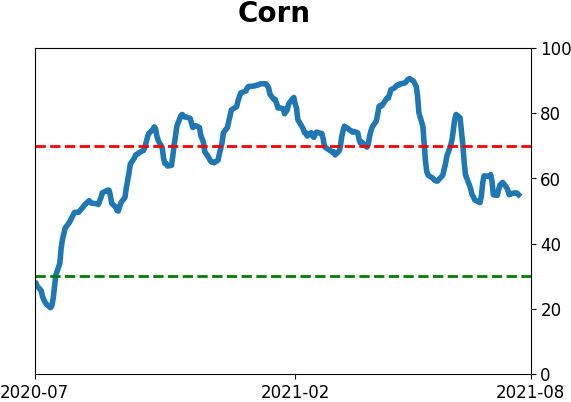
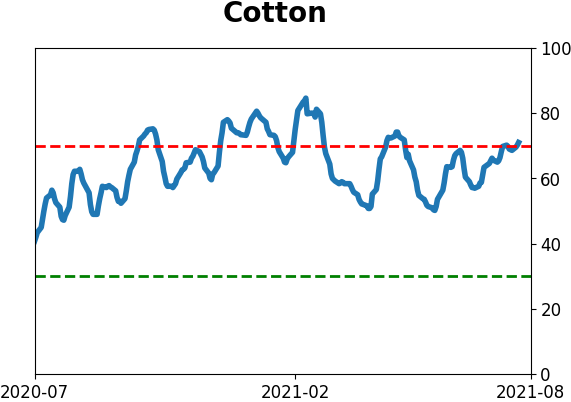
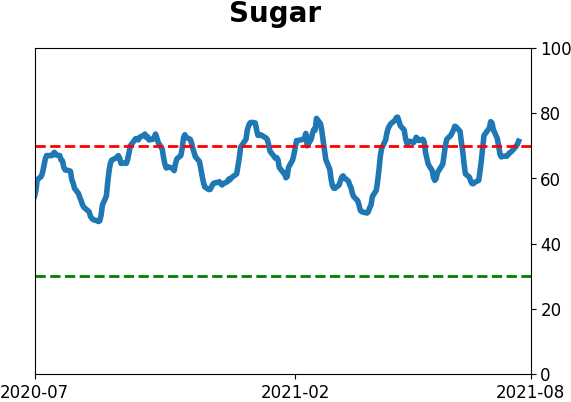
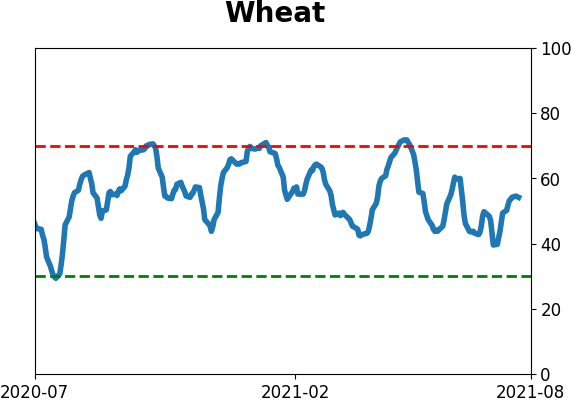
Agriculture
|
|
Research
By Jason Goepfert
BOTTOM LINE
Emerging market stocks have greatly underperformed those in the U.S. Through late July, this is the 4th-widest amount that emerging markets stocks have trailed domestic ones, and the precedents all led to even more underperformance.
FORECAST / TIMEFRAME
None
|
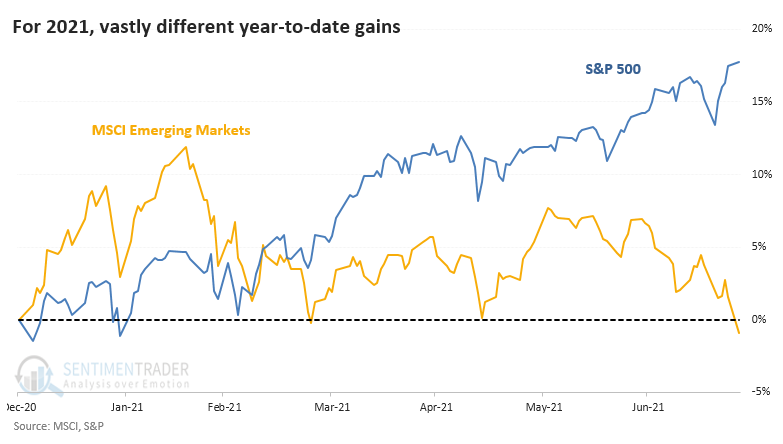
The most widely benchmarked index in the world has enjoyed a historically consistent and persistent rally in 2021. For many of its stocks, and especially for stocks outside the U.S., it's been a much different story.
Even while the S&P 500 has set record after record, stumbles in some Chinese stocks have helped to drag down emerging market indexes. The MSCI Emerging Markets Index has now turned negative for the year.
Through the end of July (or close to it, anyway), this is the 4th-widest difference in returns between the S&P and emerging markets.
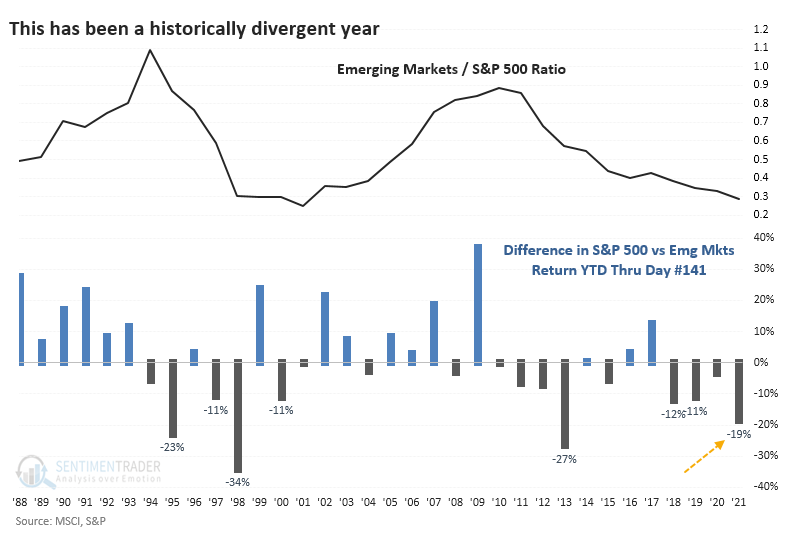
There is a tendency to think that we should see some mean reversion through the end of the year. Bulls outside of the U.S. would want to think that impressive returns in the S&P would prompt investors to re-allocate to lagging markets. It wasn't to be.
EMERGING MARKETS HAVE TENDED TO KEEP STRUGGLING
The table below shows the few other times when the S&P 500 was up by double digits through late July while emerging markets were in negative territory for the year. All three times, emerging markets fell further in the month(s) ahead.
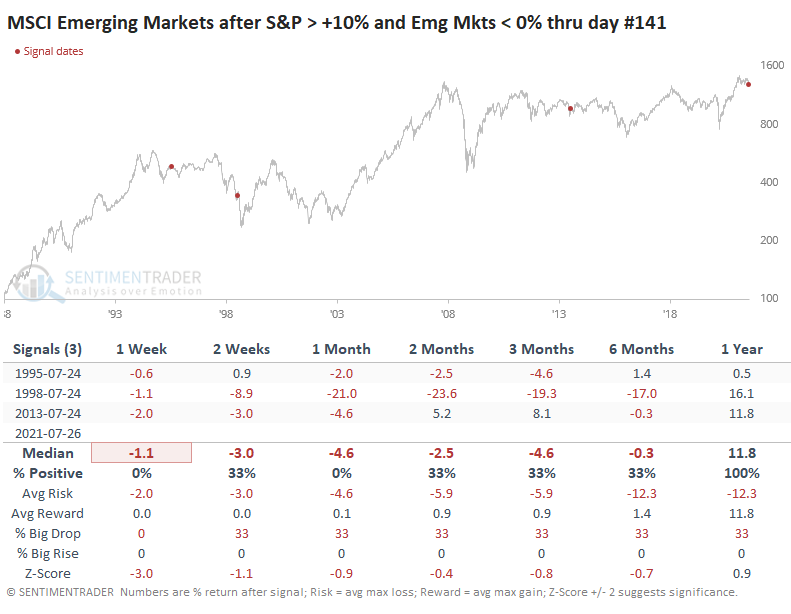
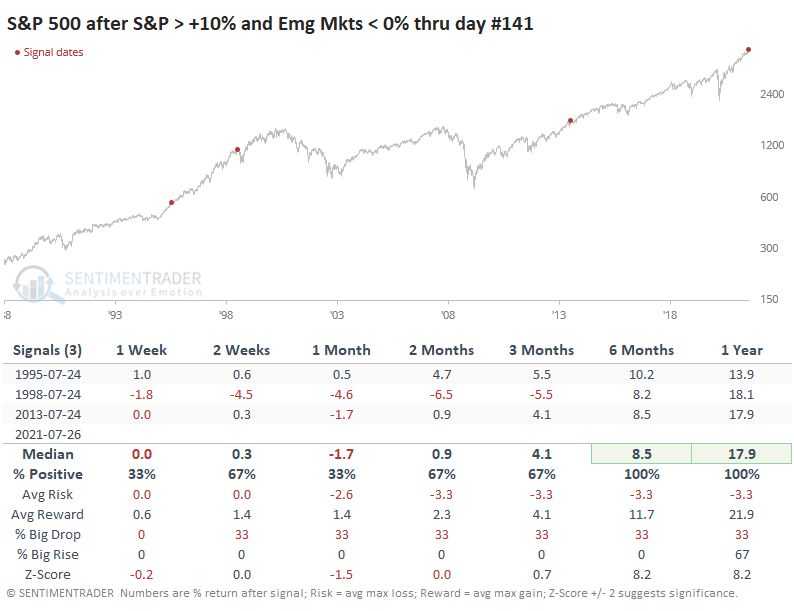
The S&P kept plugging away. It suffered a big dip in 1998 during the fall crash but quickly made back lost ground.
This means that the ratio between emerging markets and the S&P kept slipping.
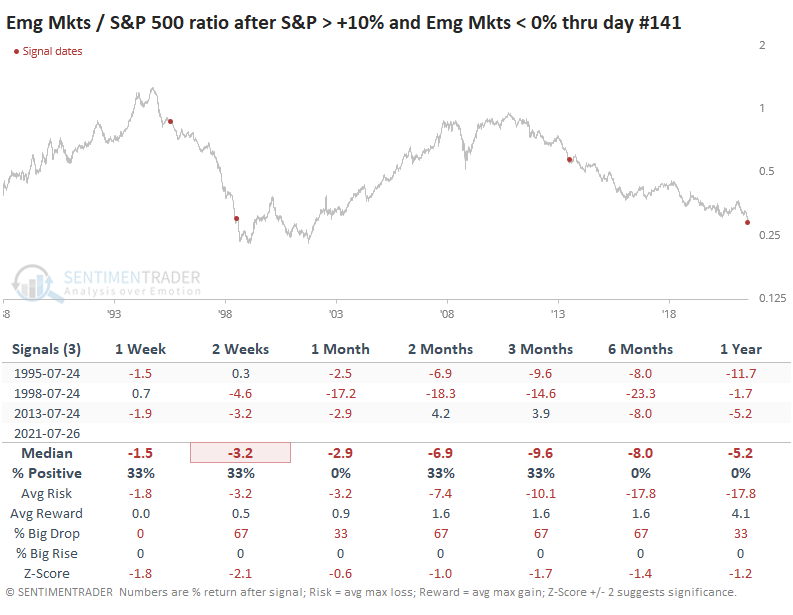
Across all time frames, the three precedents underperformed random returns for the ratio between the two markets with a risk / reward that was heavily skewed to the "risk" side.
EXPANDED SAMPLE SIZE, SAME CONCLUSION
It's really had to put much weight on a sample size of three, so if we expand the sample by looking at 5% or larger YTD gains in the S&P while emerging markets showed losses, we do generate more signals, but the sample is still tiny. And the conclusion was the same.
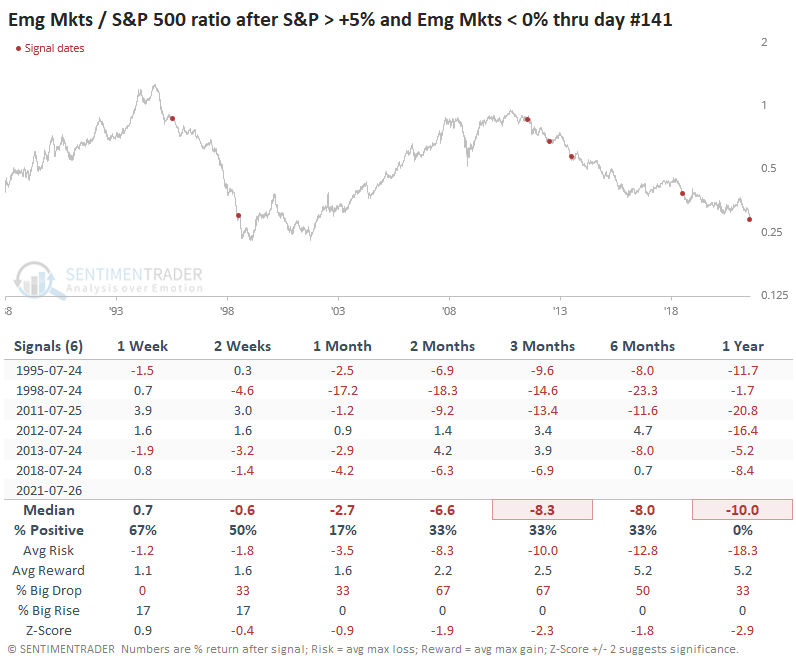
None of these years saw emerging markets suddenly, and sustainably, turn around their relative underperformance. While they made a concerted effort in 2012 and 2013, ultimately the trend continued to favor the dominance of the U.S. markets.
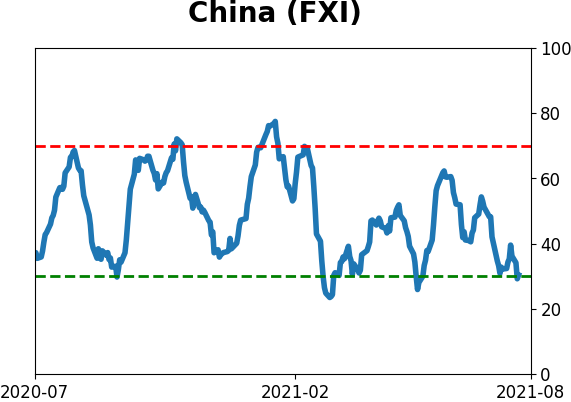
Pessimism is building in emerging markets, and Chinese stocks in particular. It may soon reach capitulative levels, which may help turn the current trend favoring the U.S. Until we see more signs of that, however, this momentum and seasonal bias toward the U.S. has a solid historical backing.
Active Studies
| Time Frame | Bullish | Bearish | | Short-Term | 0 | 4 | | Medium-Term | 4 | 3 | | Long-Term | 10 | 5 |
|
Indicators at Extremes
Portfolio
| Position | Description | Weight % | Added / Reduced | Date | | Stocks | RSP | 4.1 | Added 4.1% | 2021-05-19 | | Bonds | 23.9% BND, 6.9% SCHP | 30.7 | Reduced 7.1% | 2021-05-19 | | Commodities | GCC | 2.6 | Reduced 2.1%
| 2020-09-04 | | Precious Metals | GDX | 5.6 | Reduced 4.2% | 2021-05-19 | | Special Situations | 4.3% XLE, 2.2% PSCE | 7.6 | Reduced 5.6% | 2021-04-22 | | Cash | | 49.4 | | |
|
Updates (Changes made today are underlined)
Much of our momentum and trend work has remained positive for several months, with some scattered exceptions. Almost all sentiment-related work has shown a poor risk/reward ratio for stocks, especially as speculation drove to record highs in exuberance in February. Much of that has worn off, and most of our models are back toward neutral levels. There isn't much to be excited about here. The same goes for bonds and even gold. Gold has been performing well lately and is back above long-term trend lines. The issue is that it has a poor record of holding onto gains when attempting a long-term trend change like this, so we'll take a wait-and-see approach. RETURN YTD: 9.1% 2020: 8.1%, 2019: 12.6%, 2018: 0.6%, 2017: 3.8%, 2016: 17.1%, 2015: 9.2%, 2014: 14.5%, 2013: 2.2%, 2012: 10.8%, 2011: 16.5%, 2010: 15.3%, 2009: 23.9%, 2008: 16.2%, 2007: 7.8%
|
|
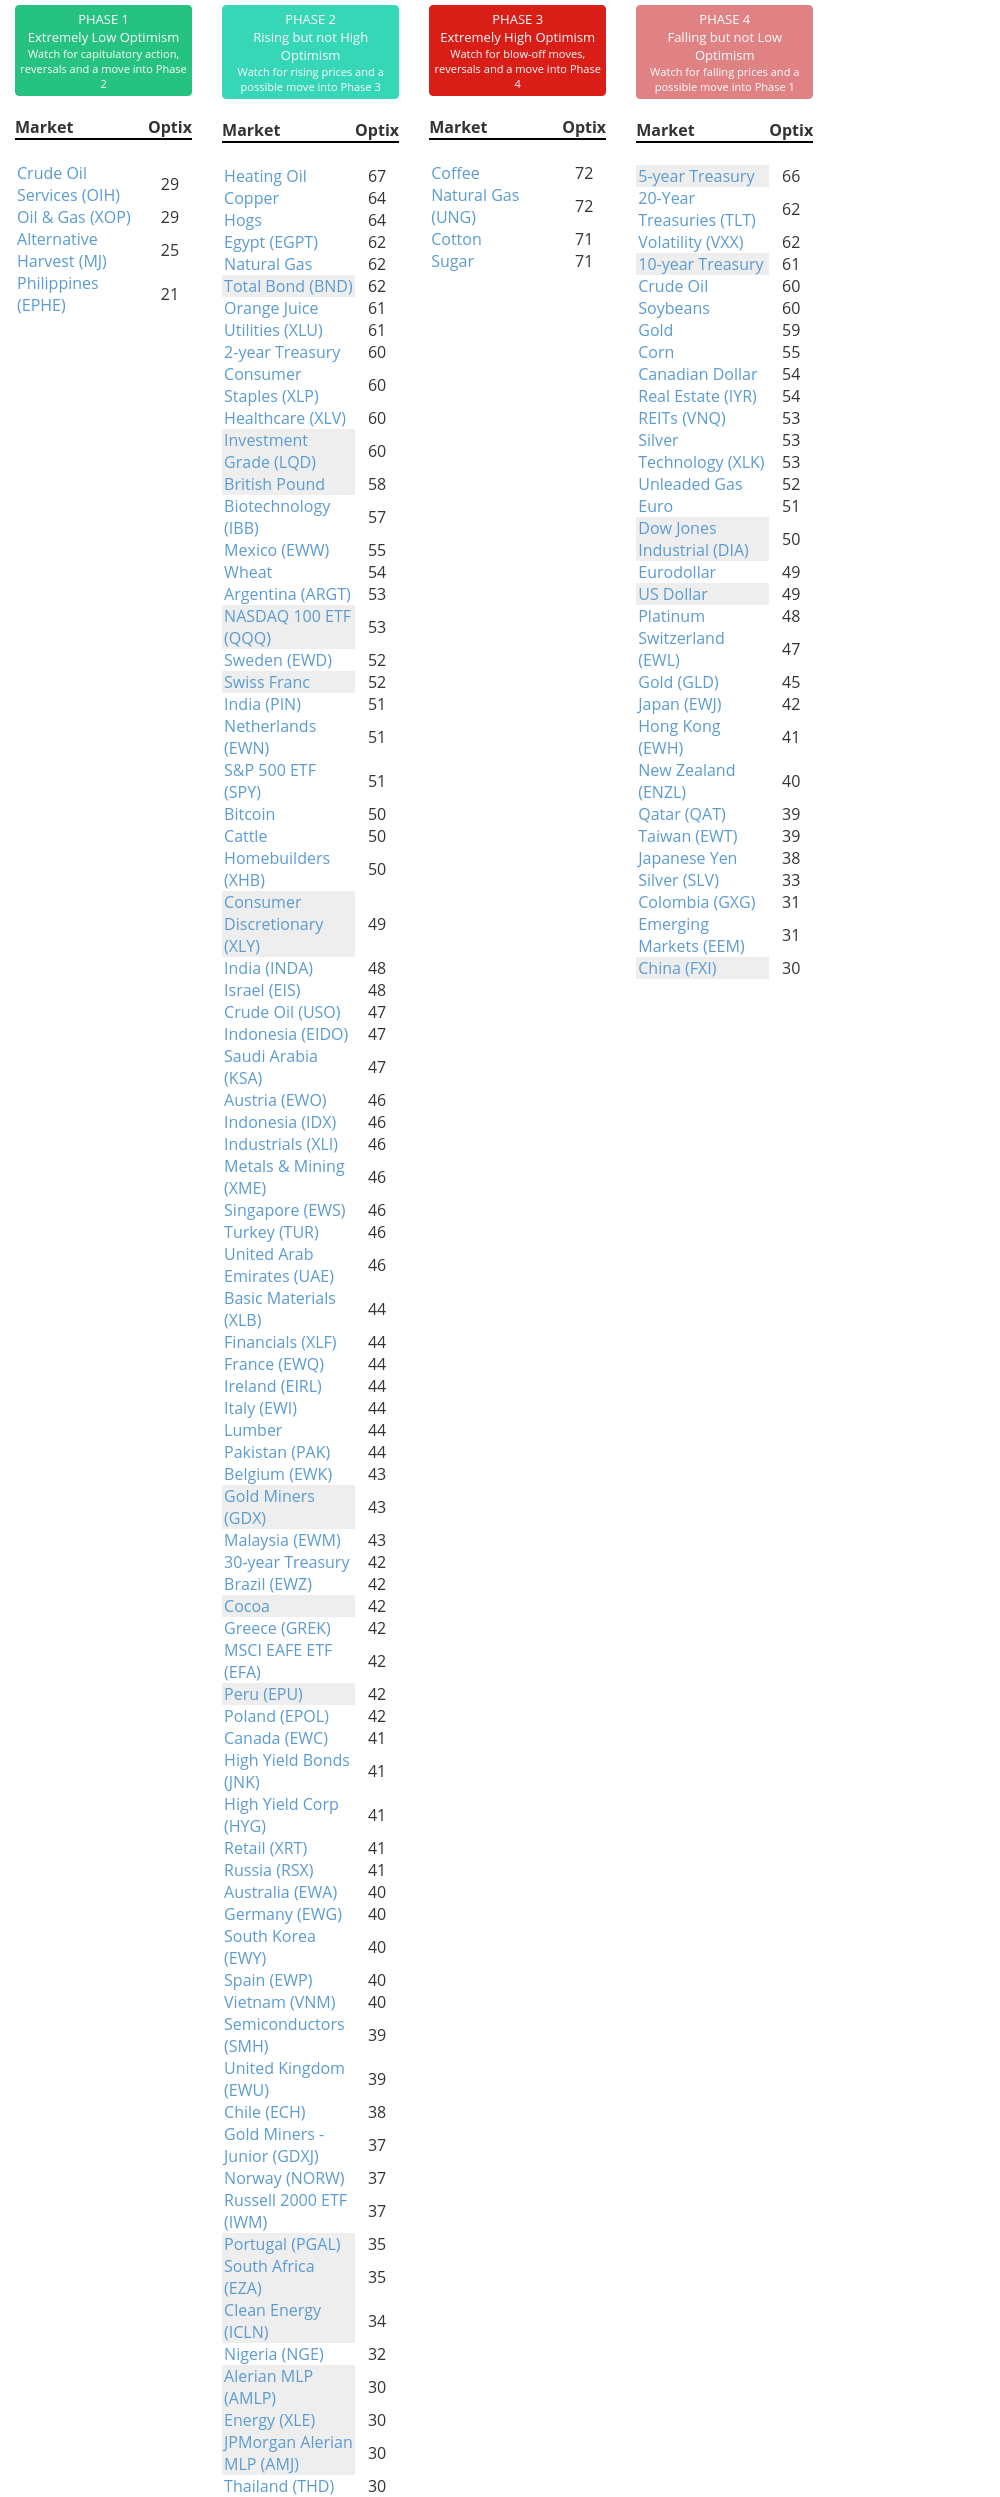
Phase Table
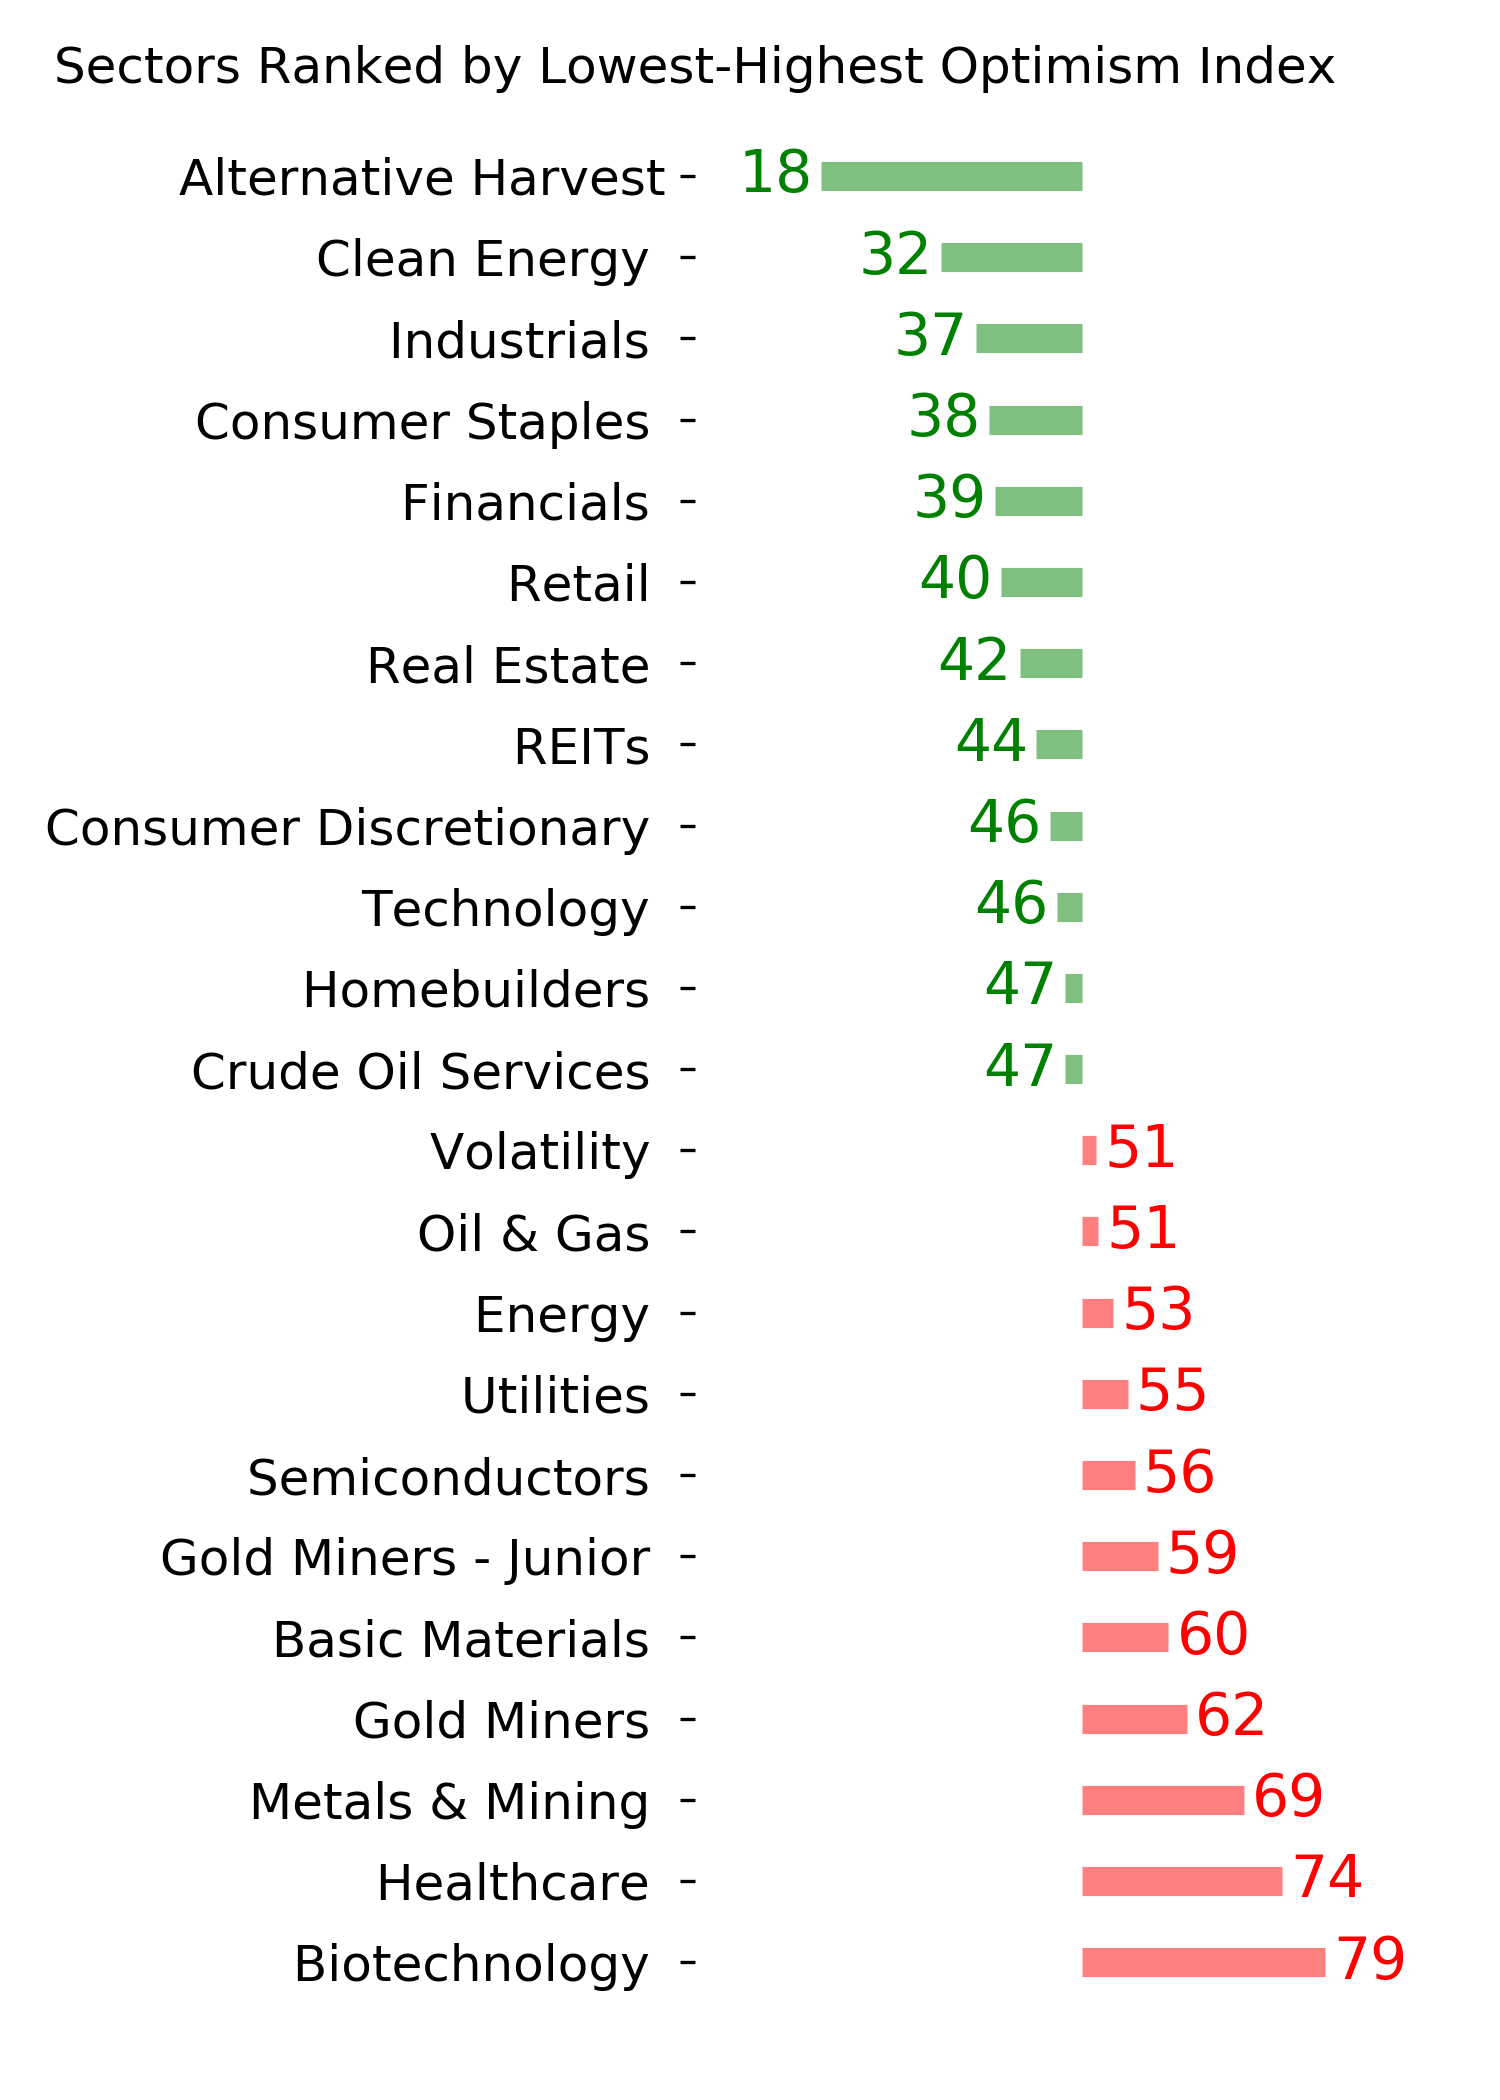
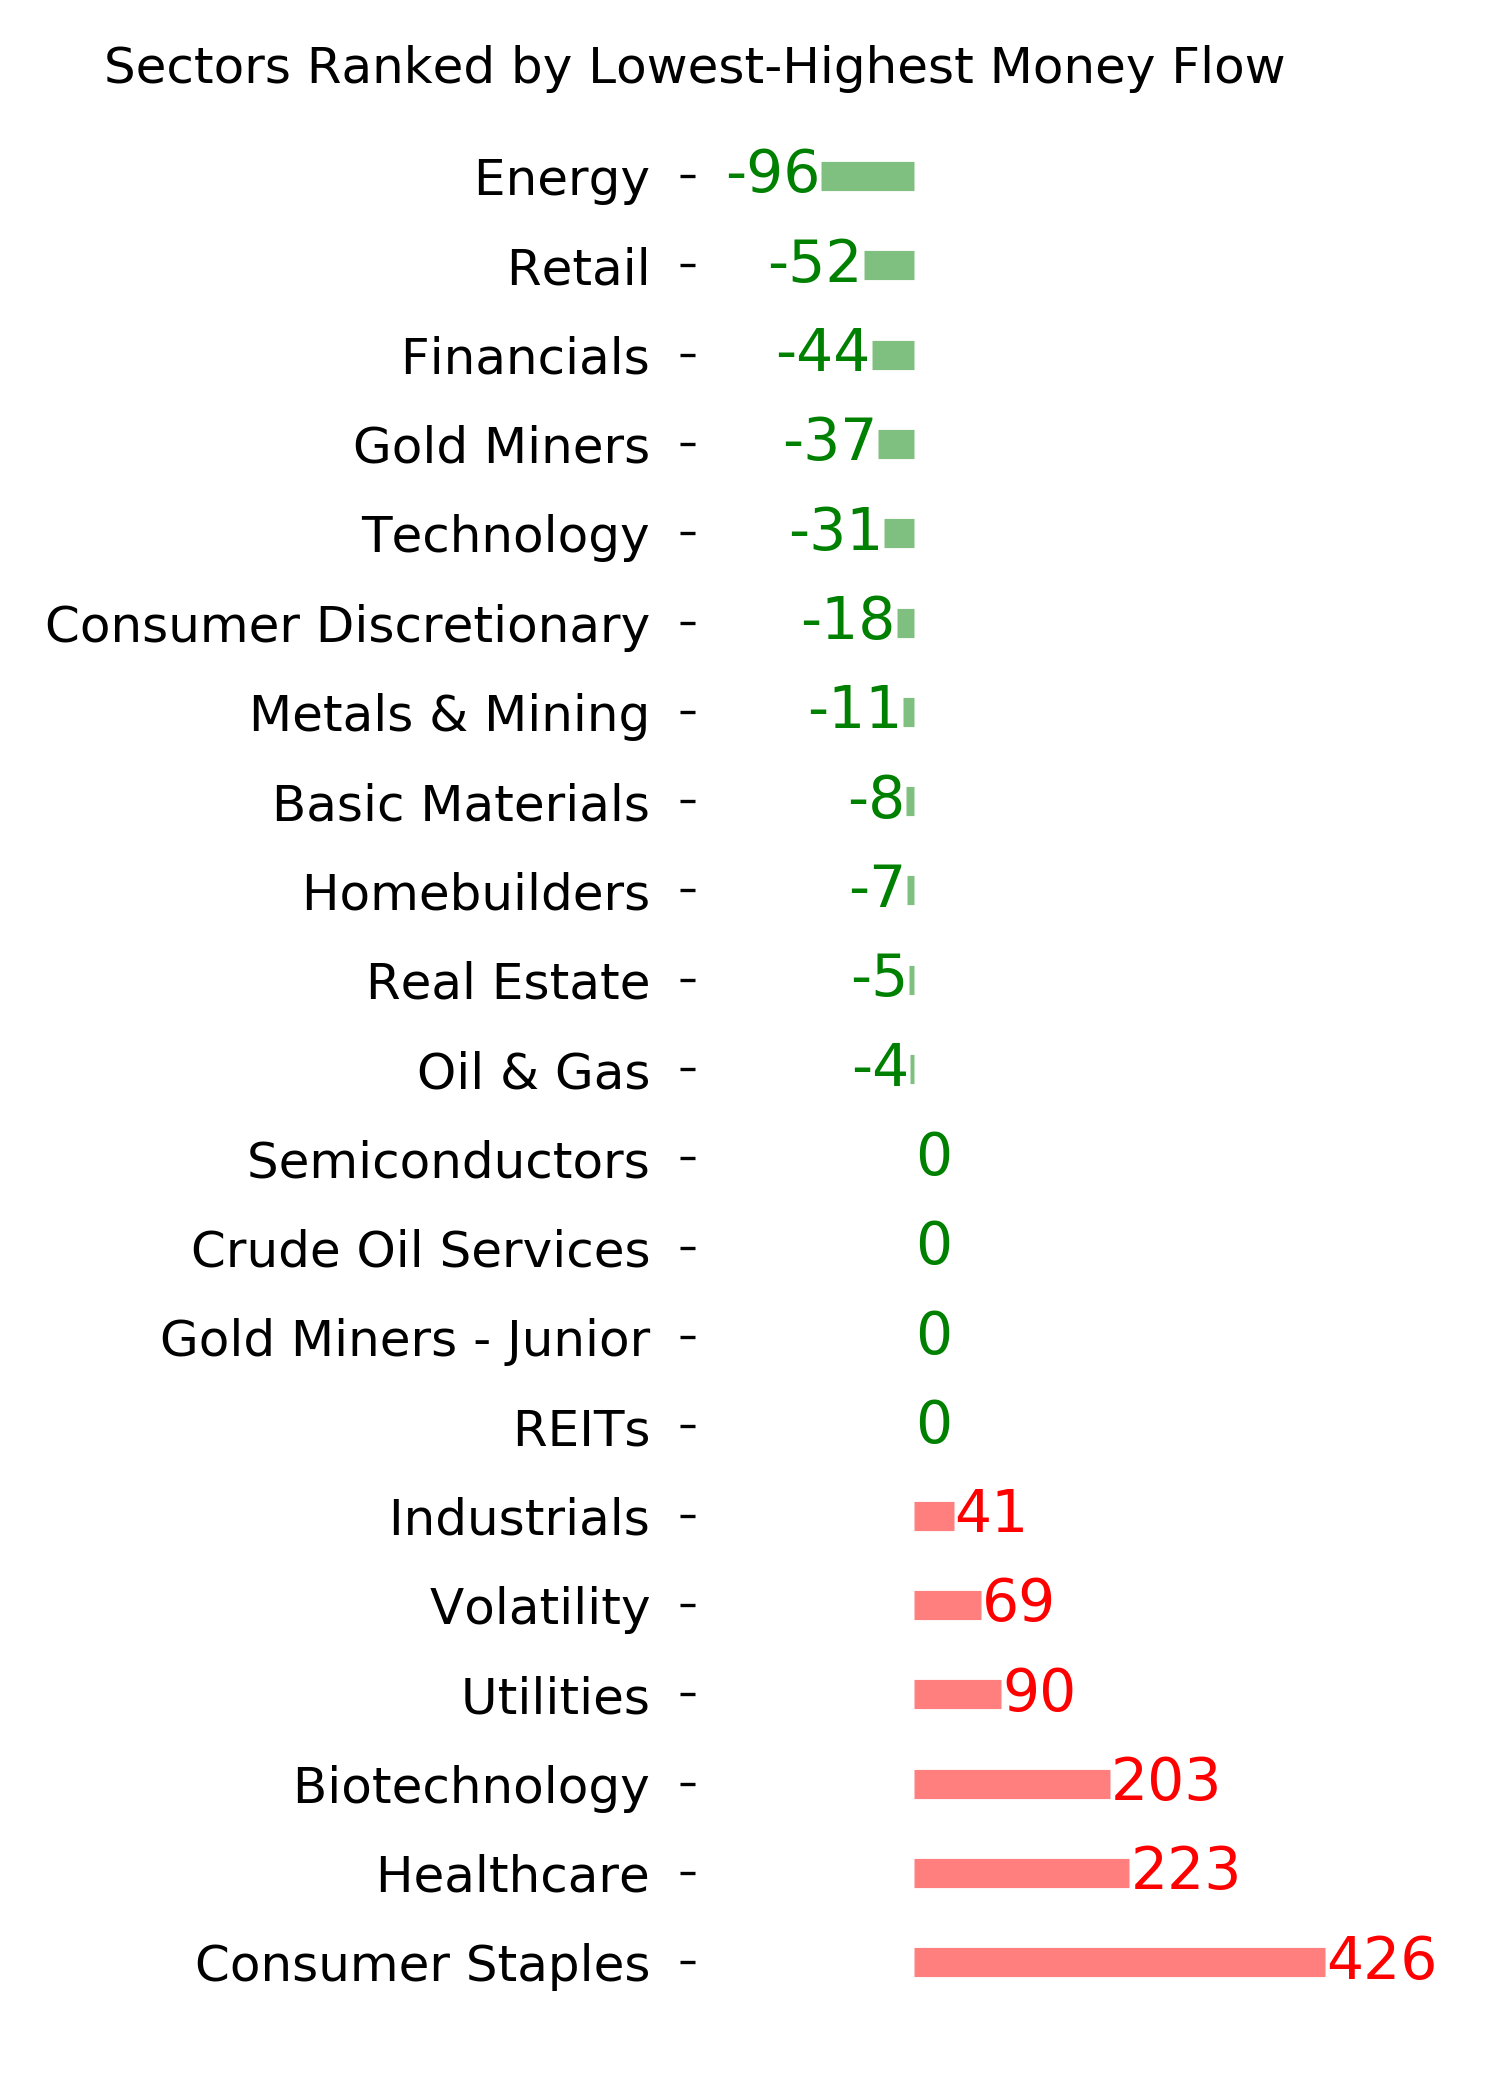
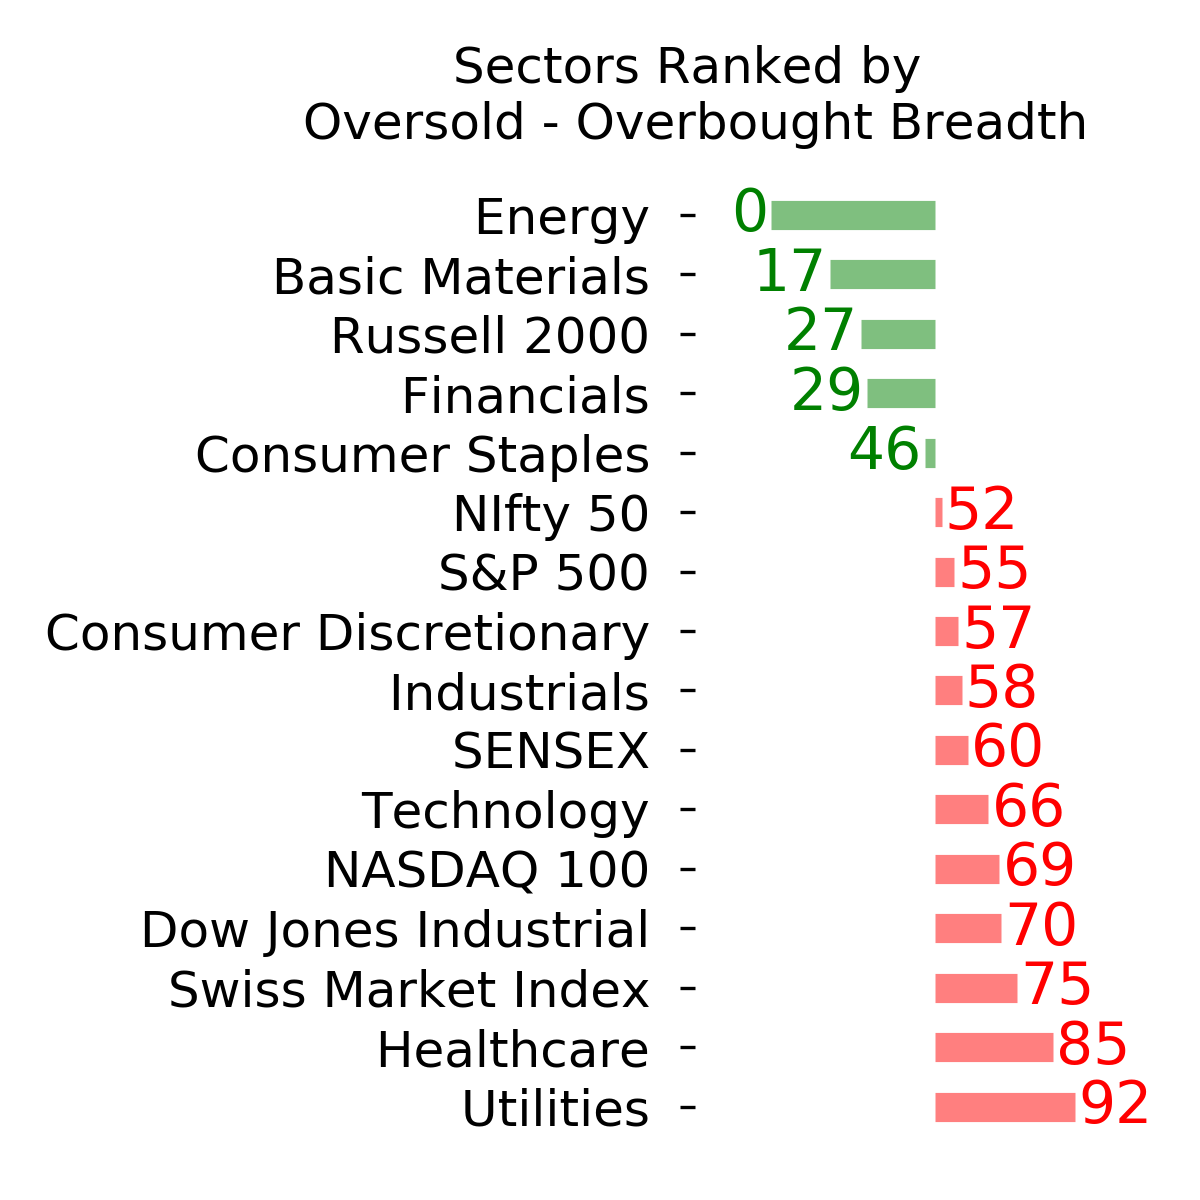
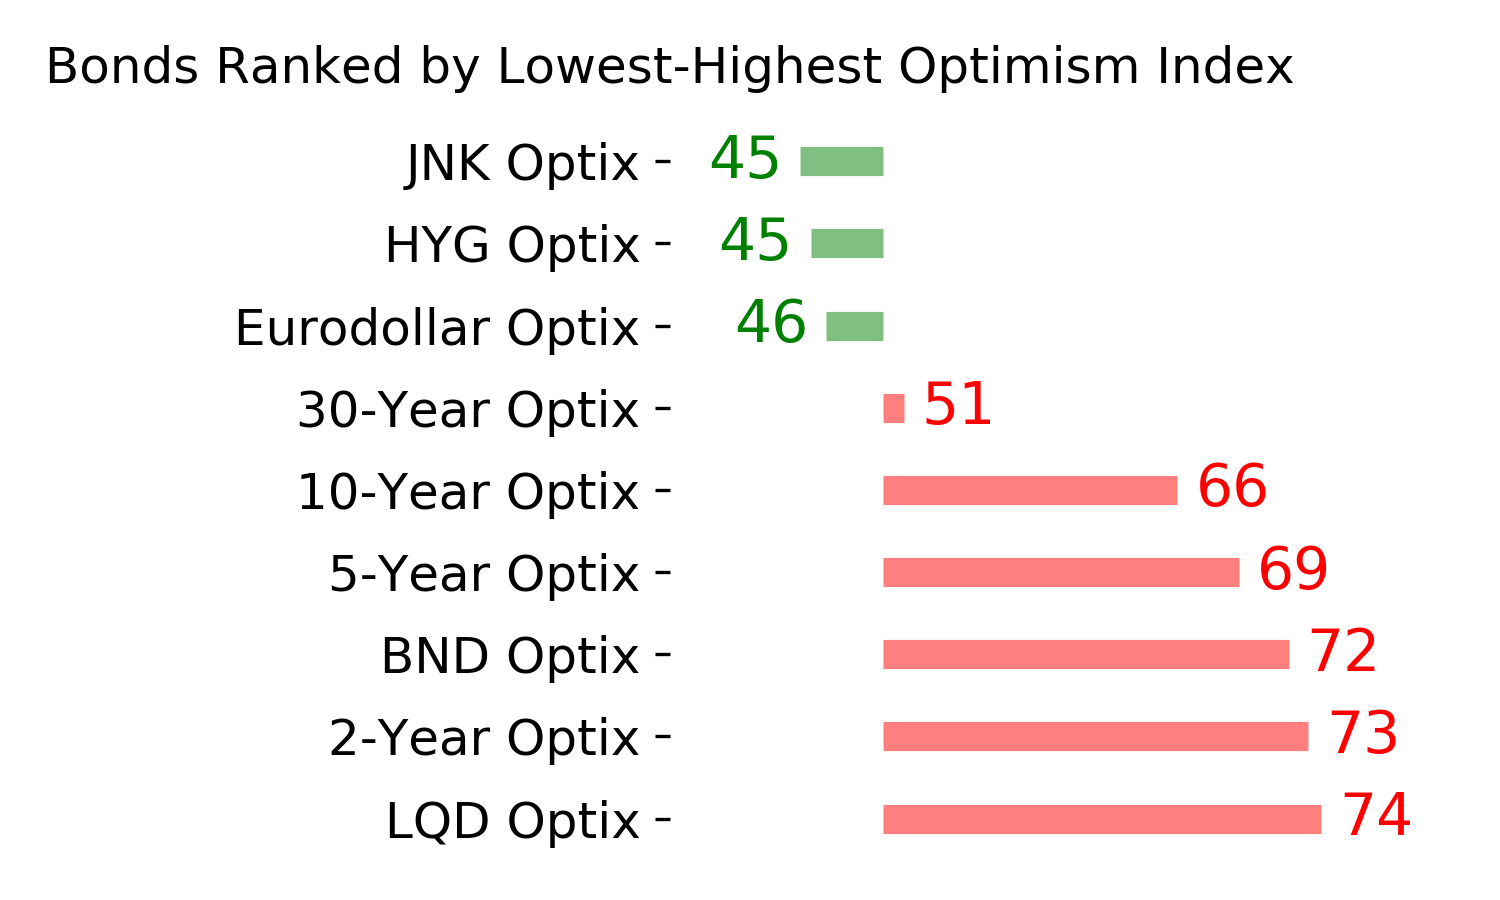
Ranks
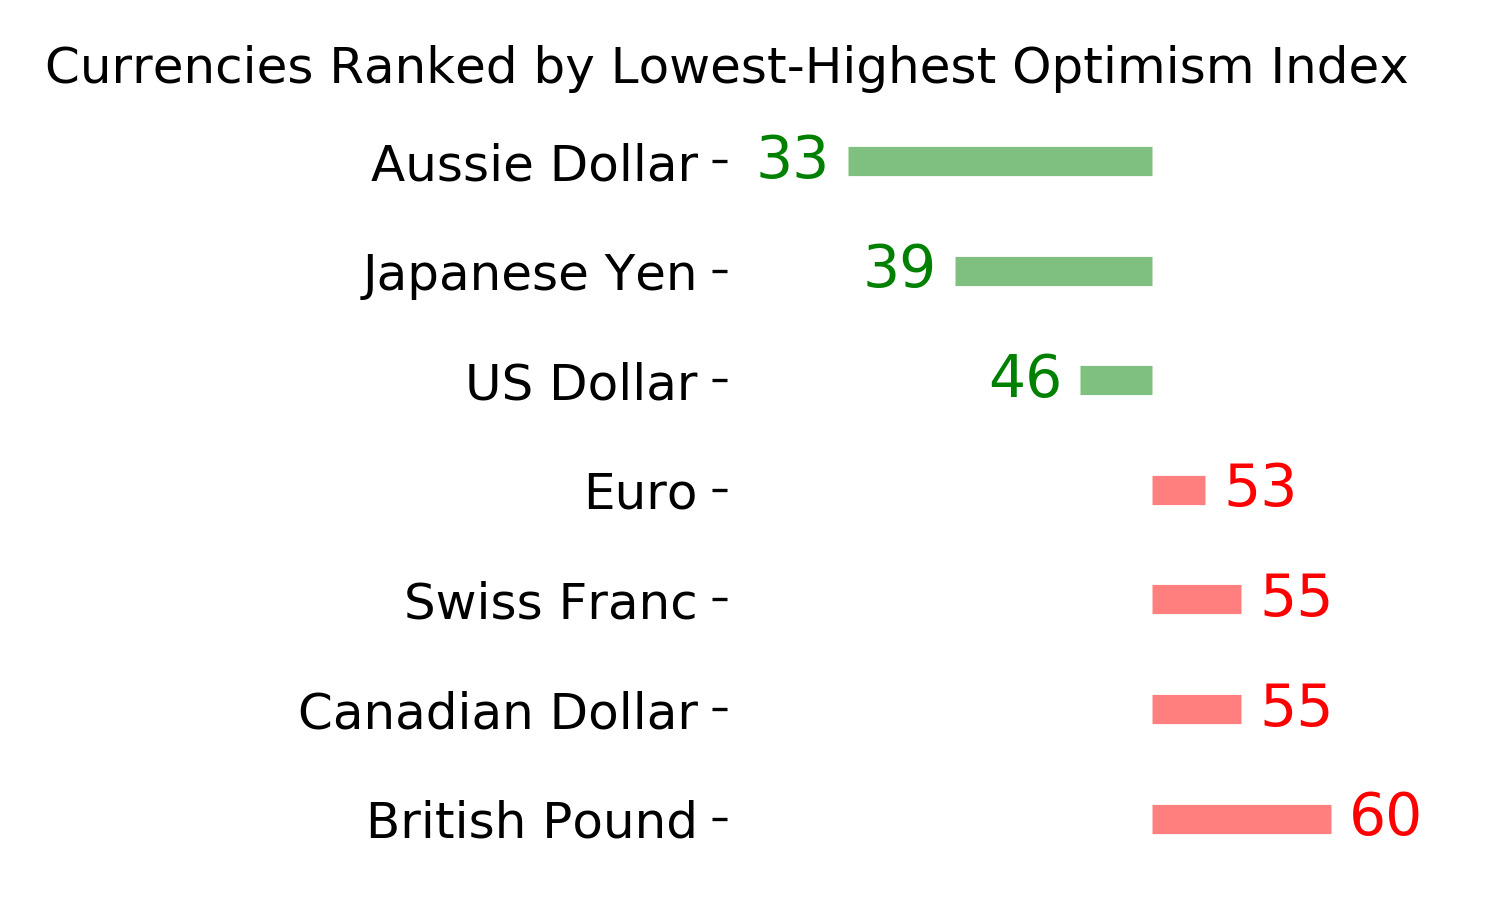
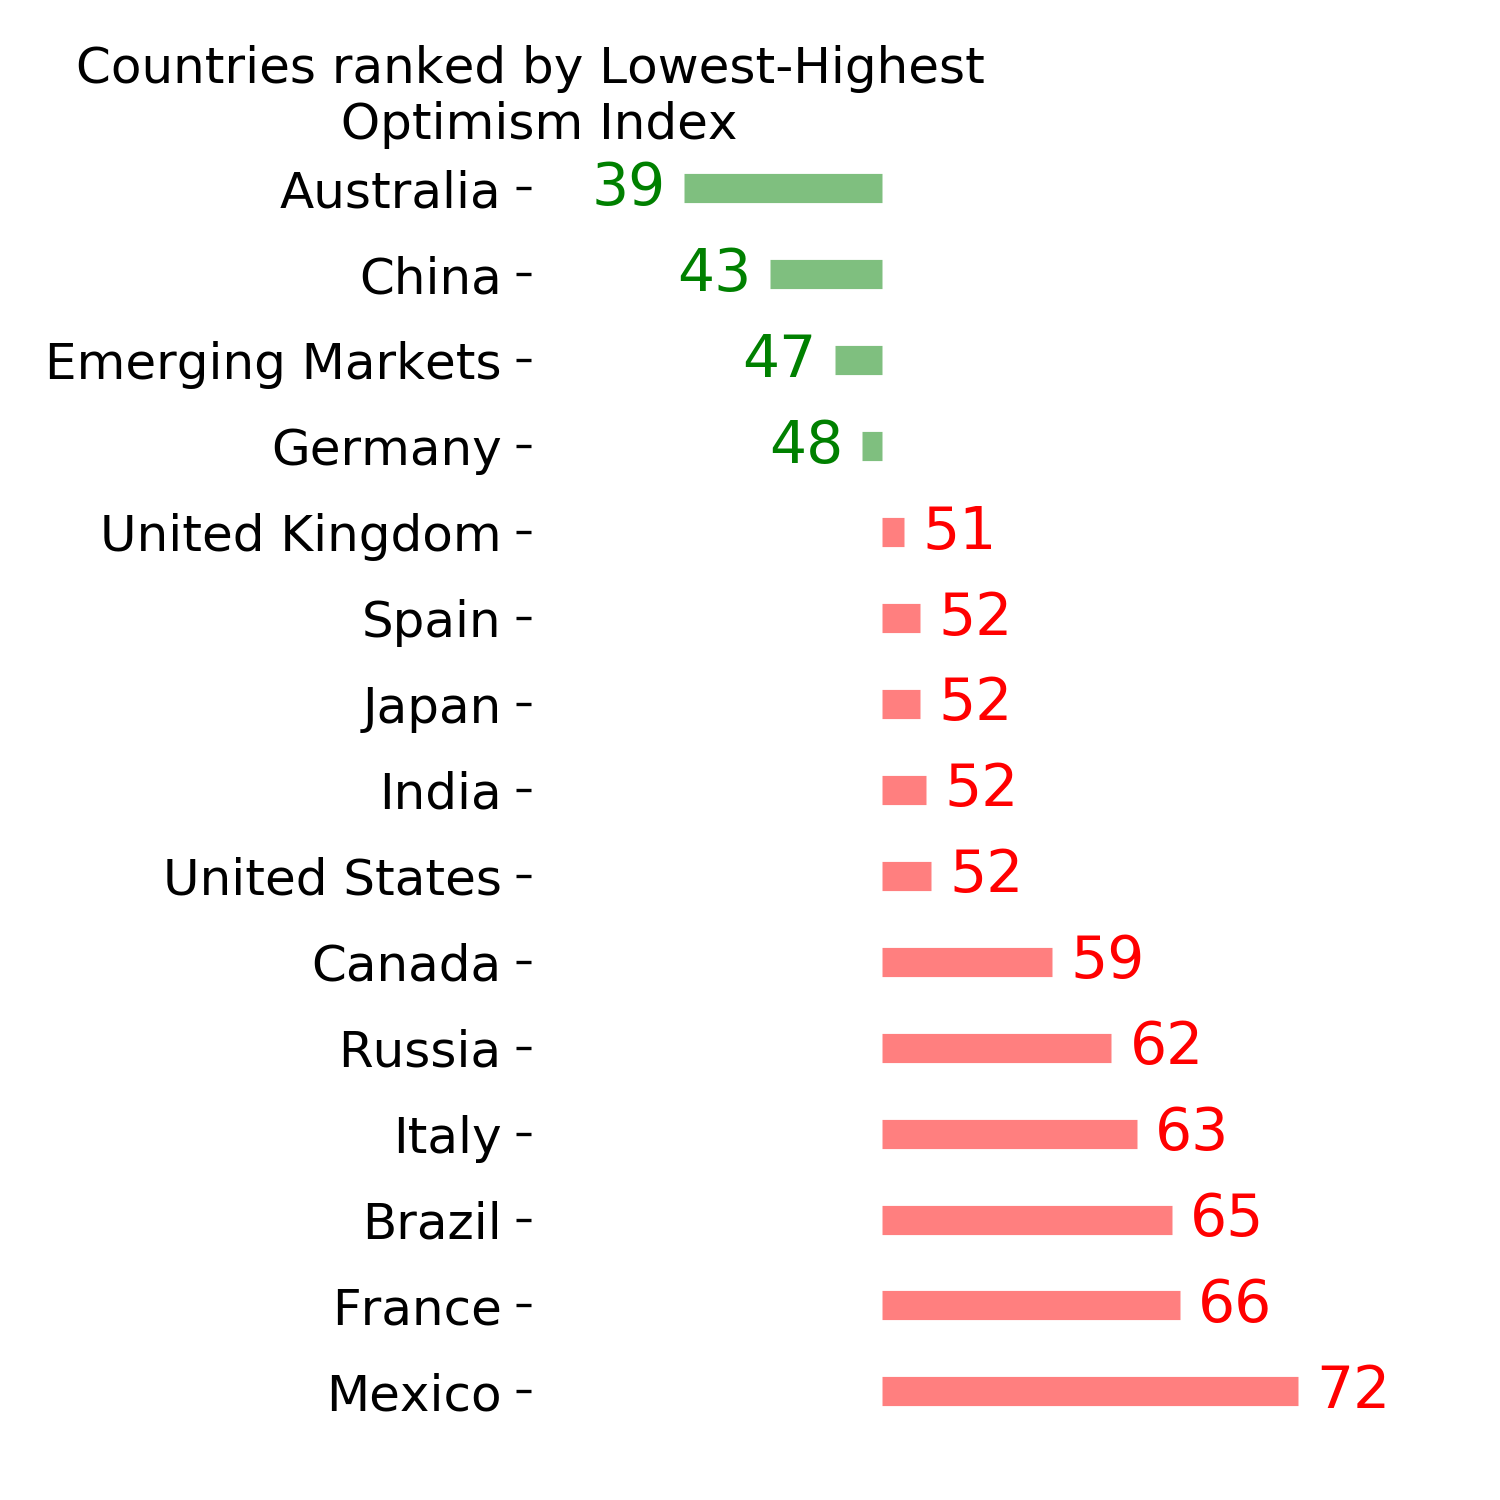
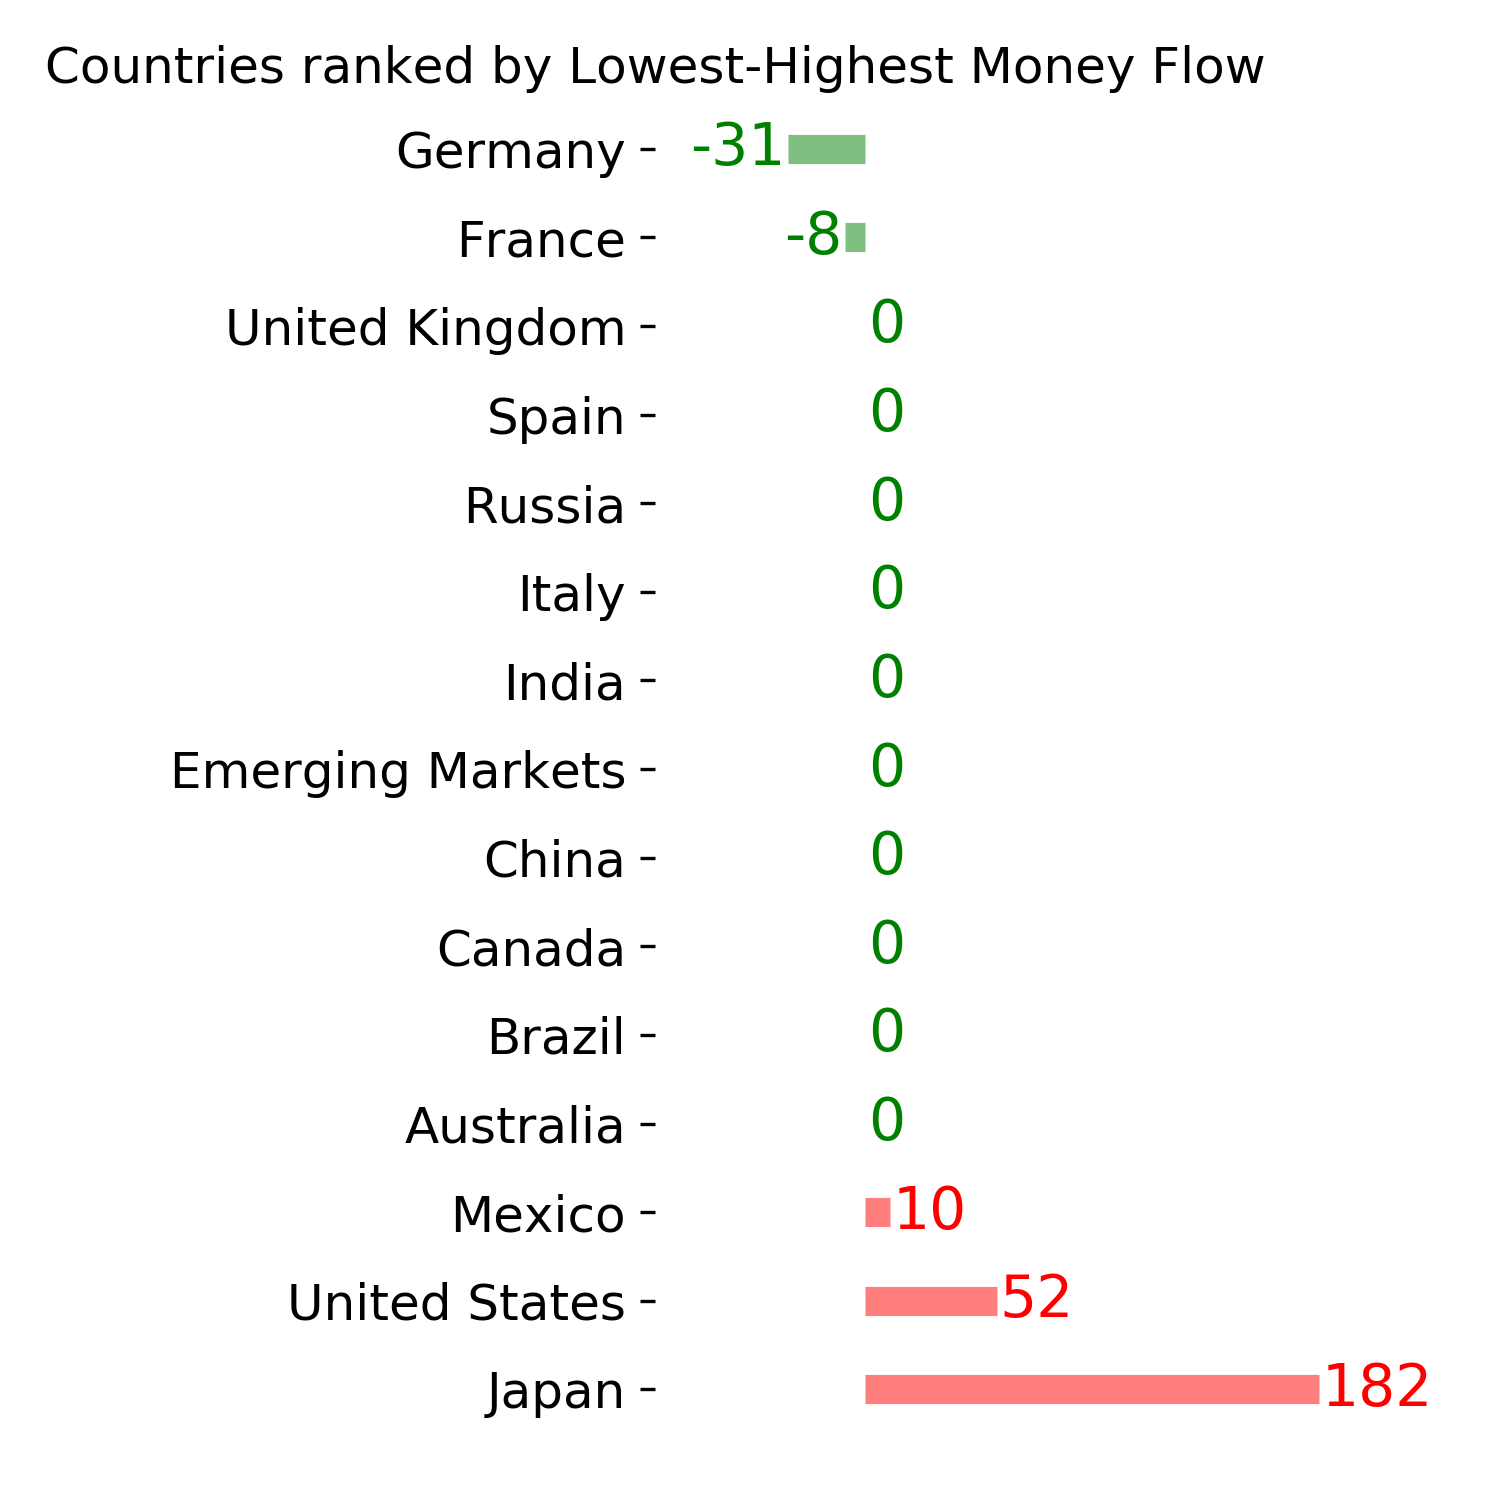
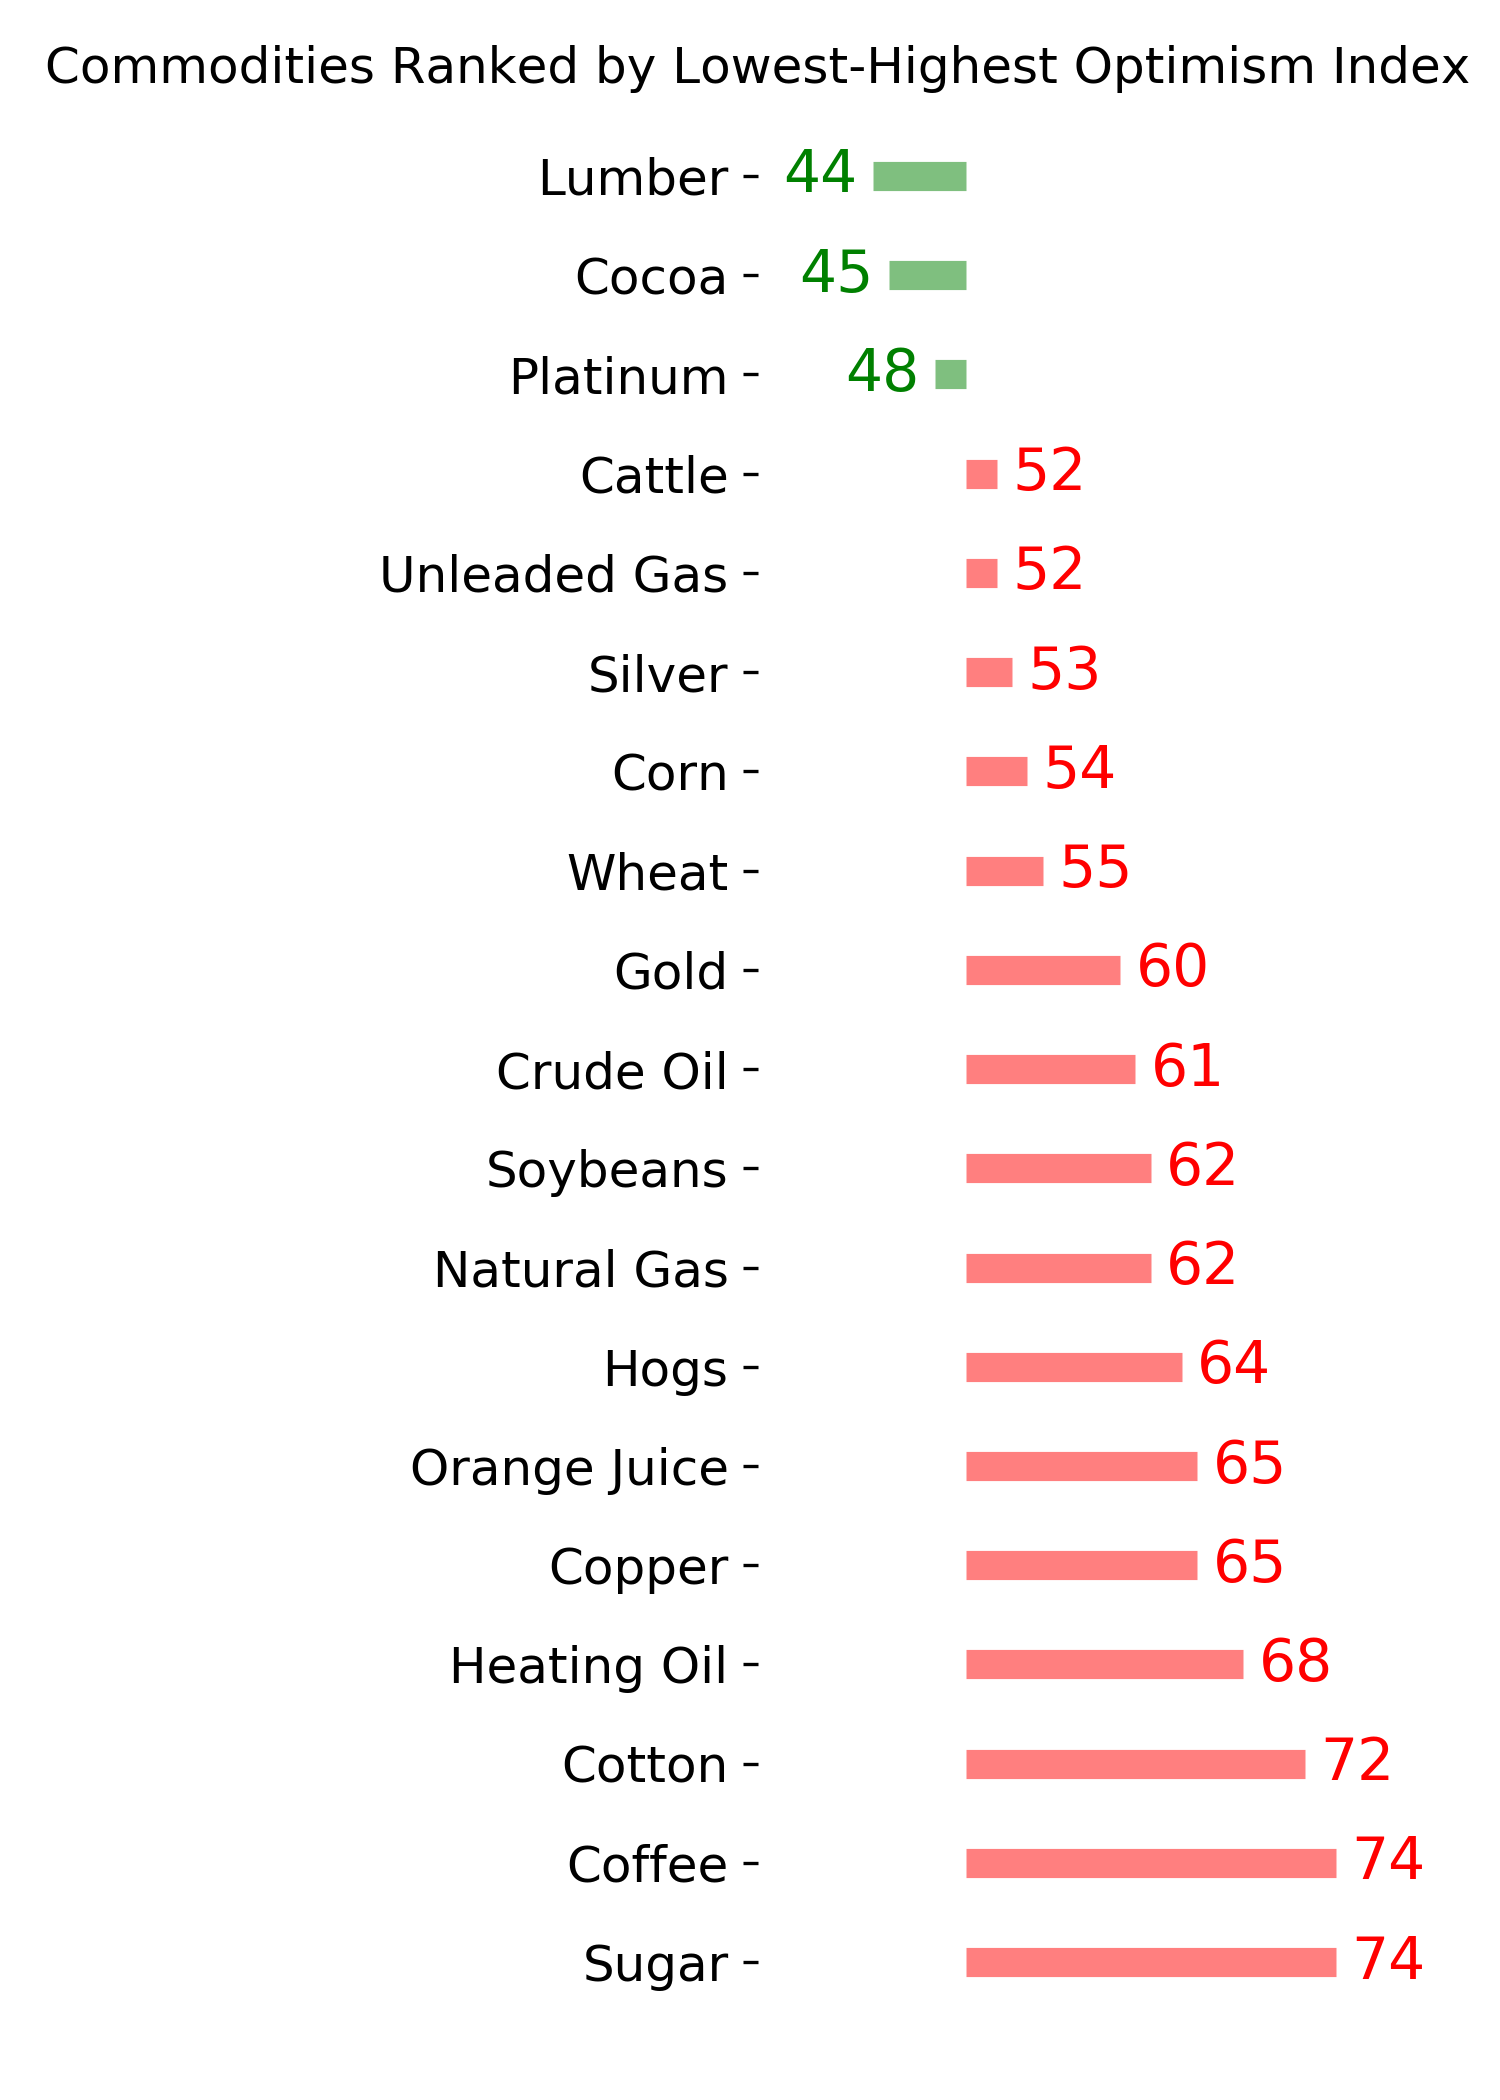
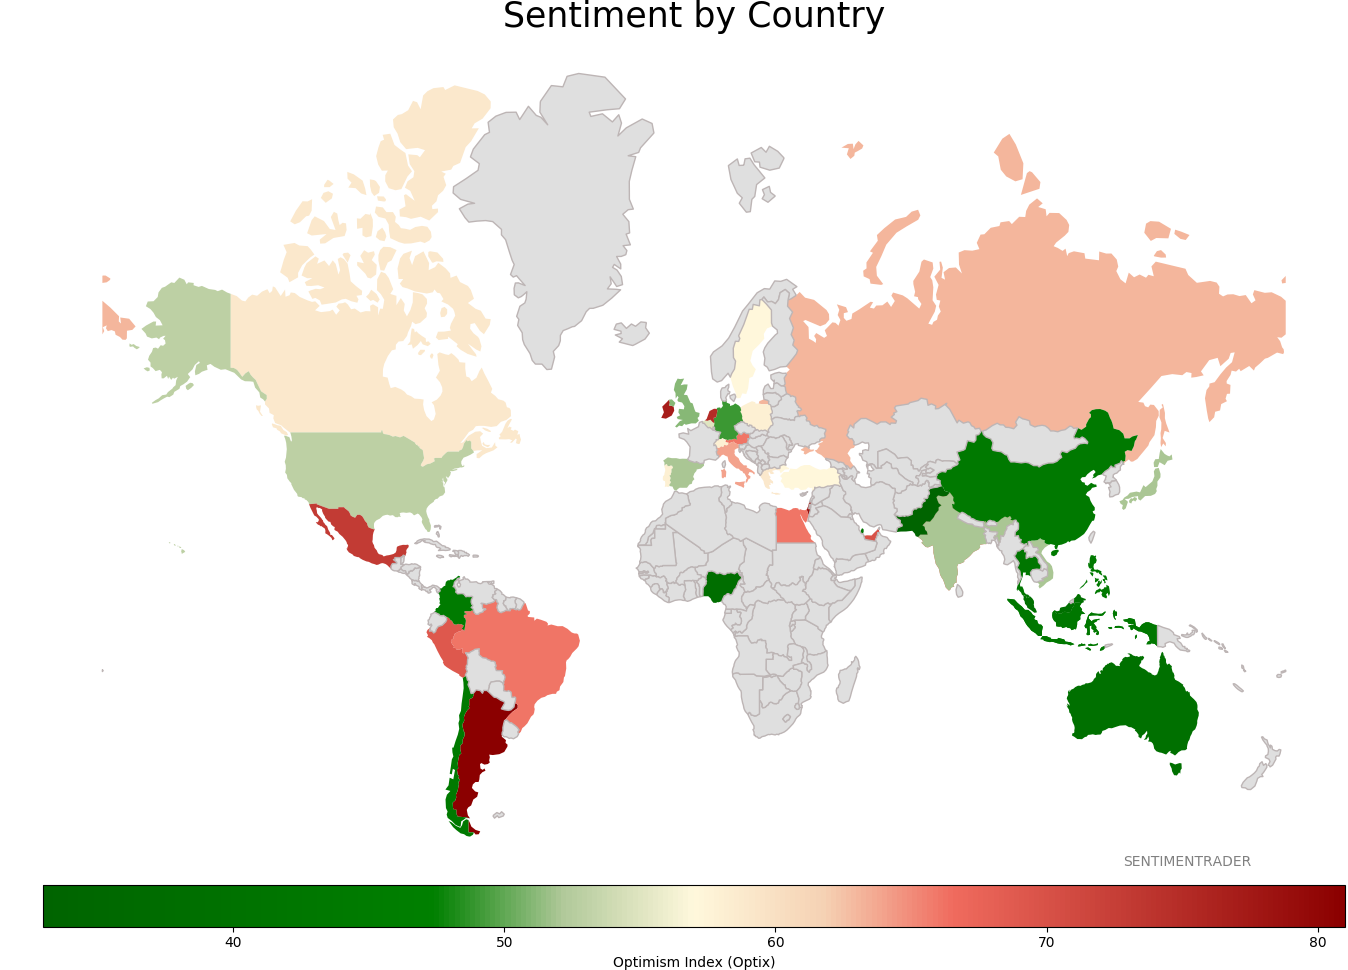
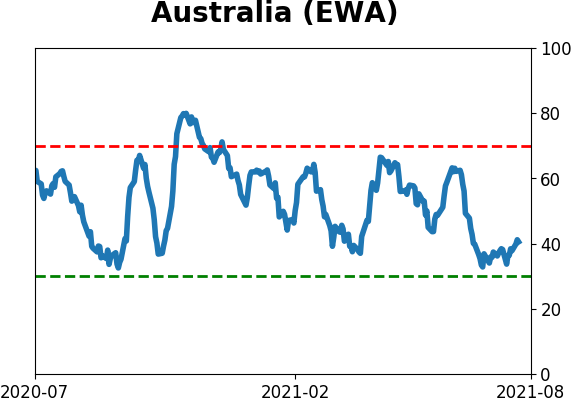
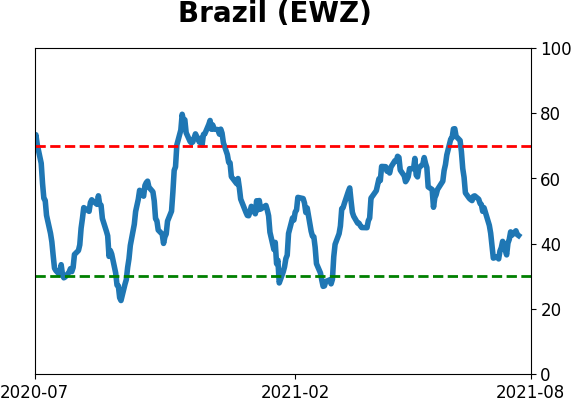
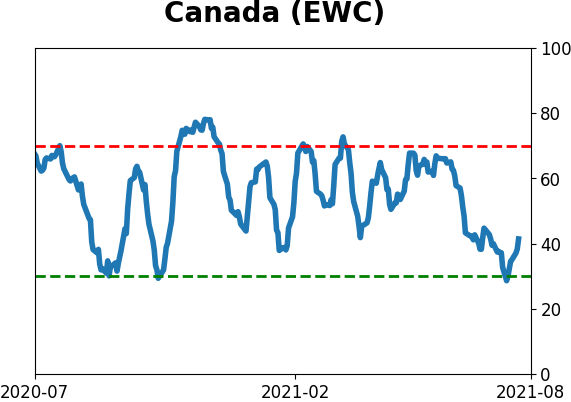
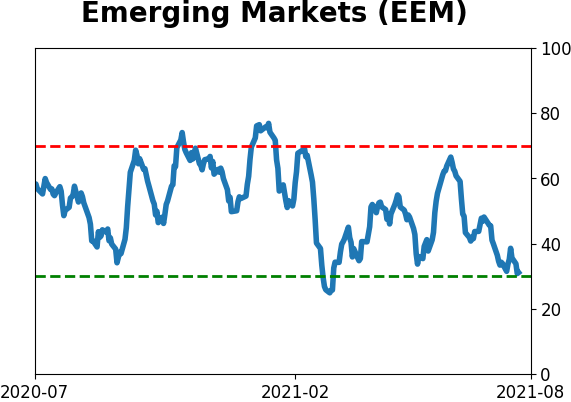
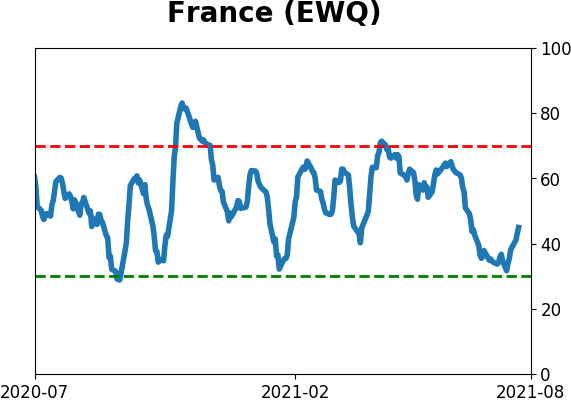
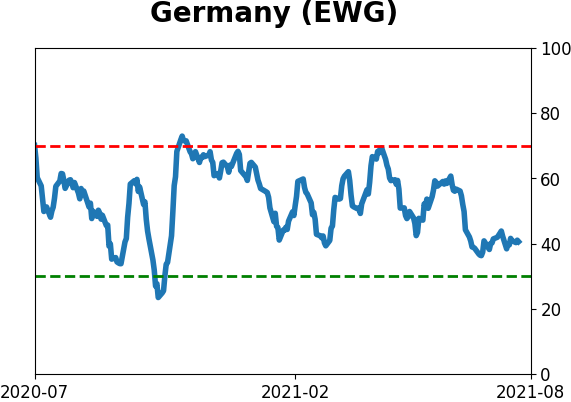
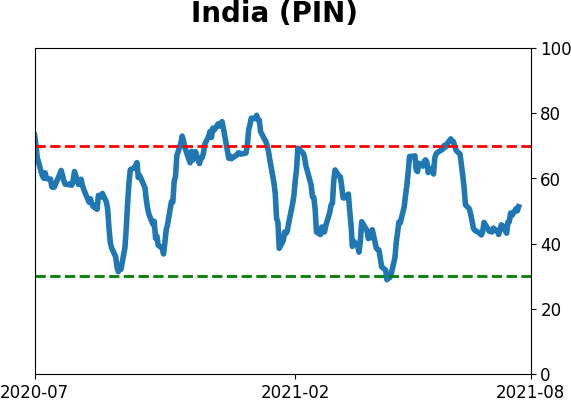
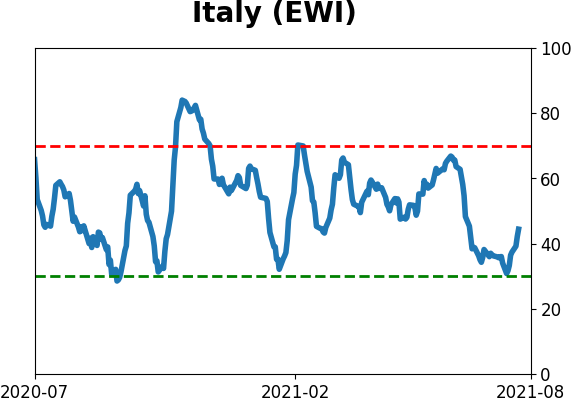
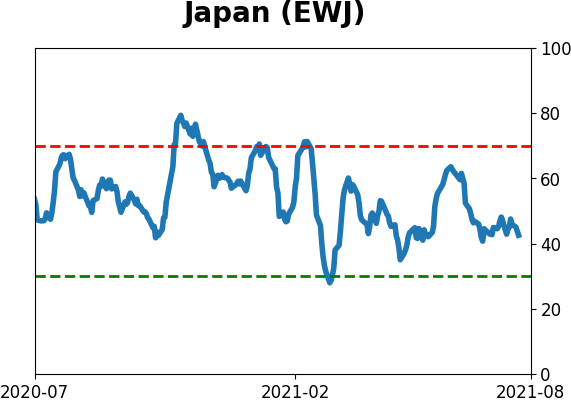
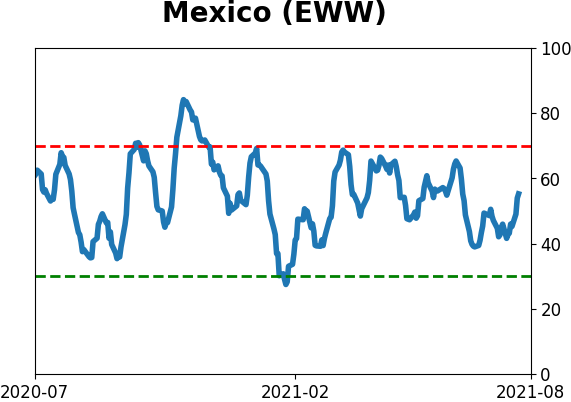
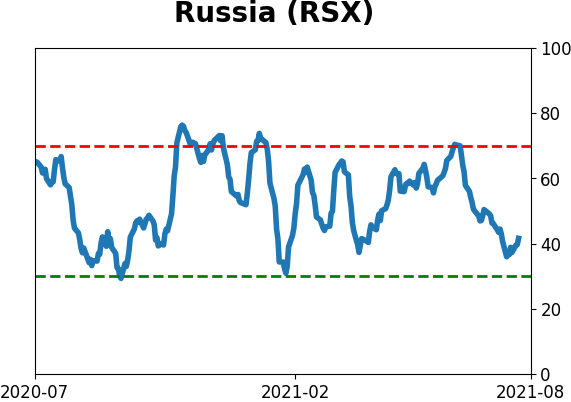
Sentiment Around The World
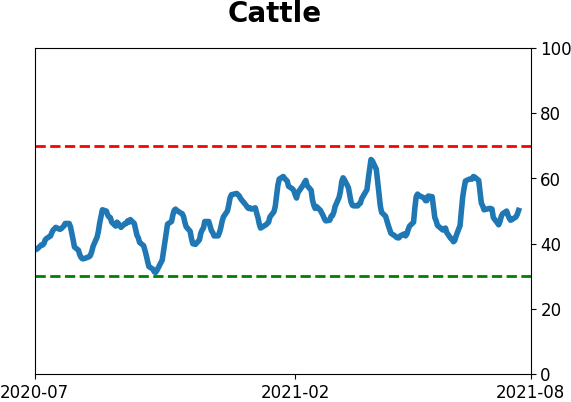
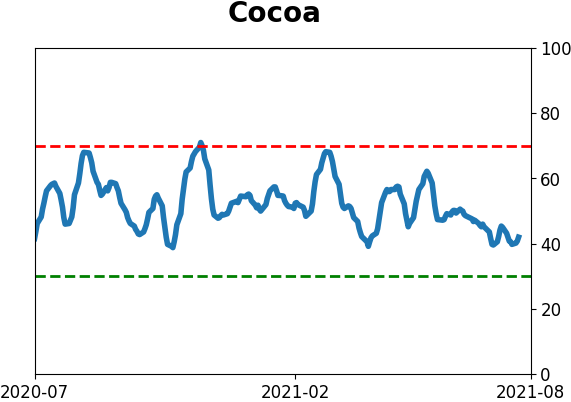
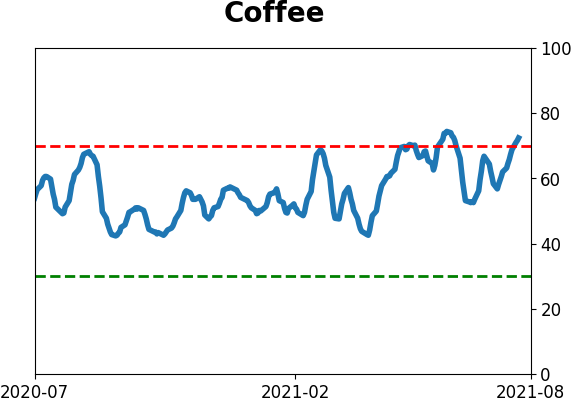
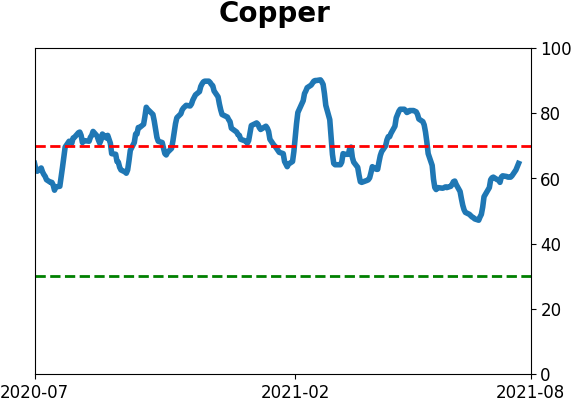
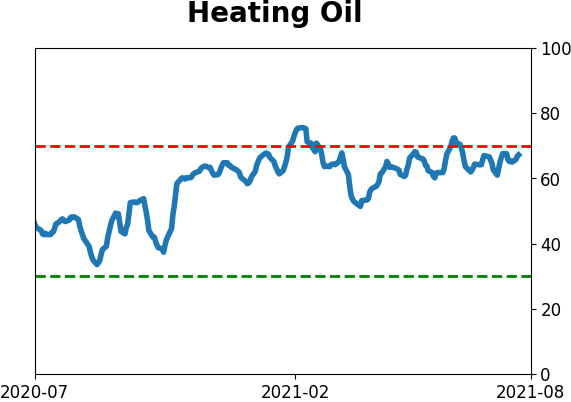
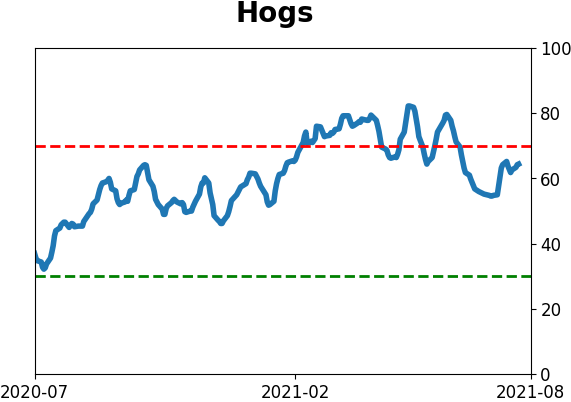
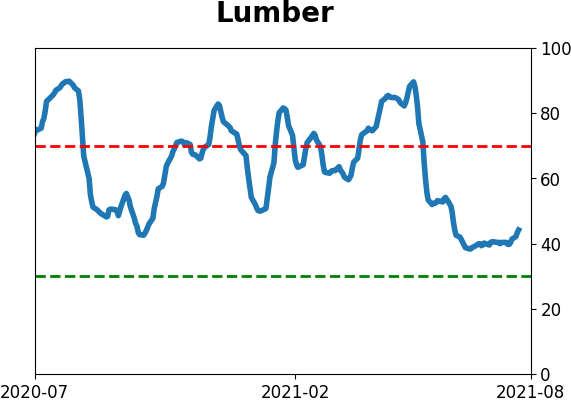
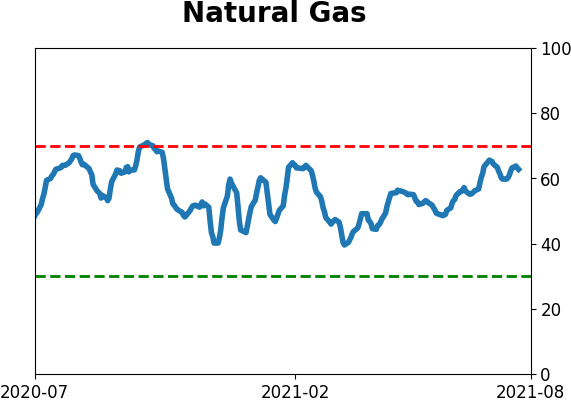
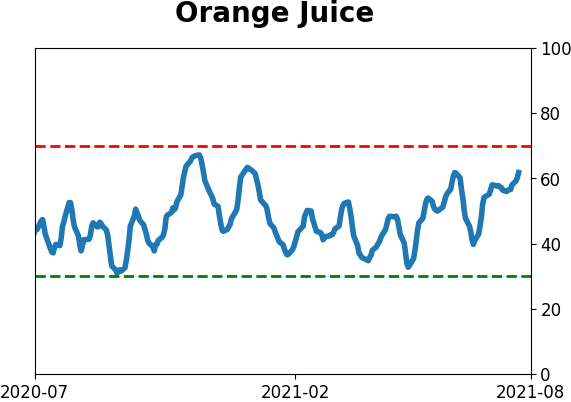
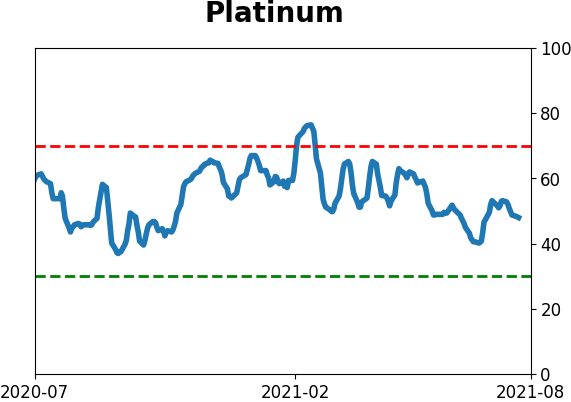
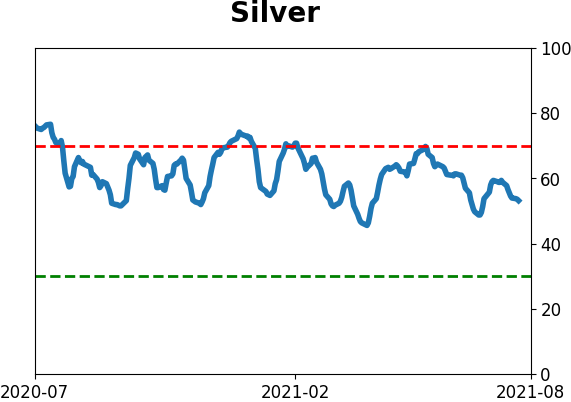
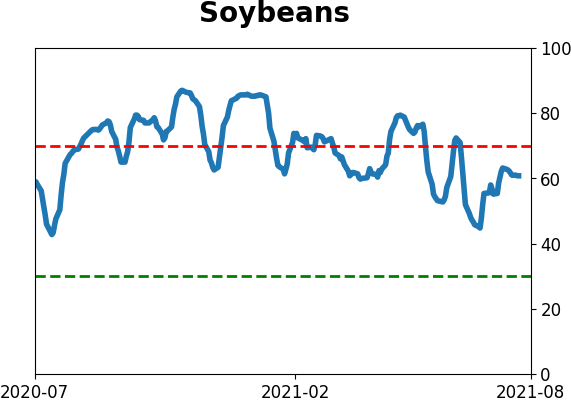
Optimism Index Thumbnails
|
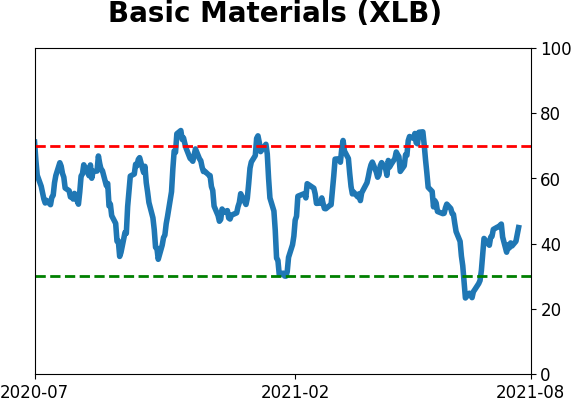
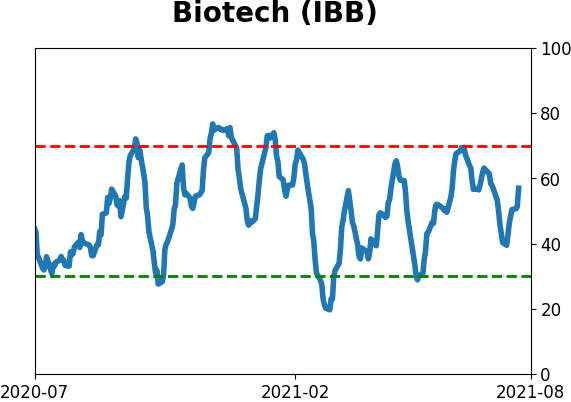
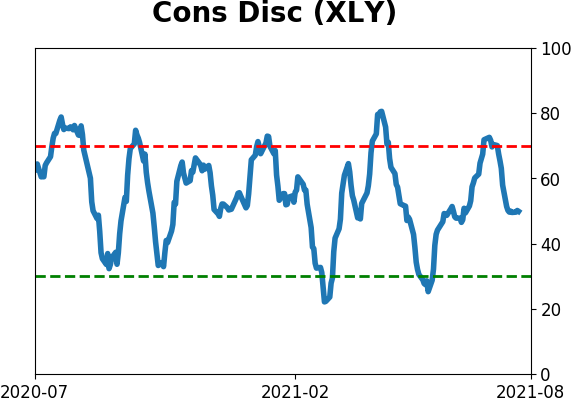
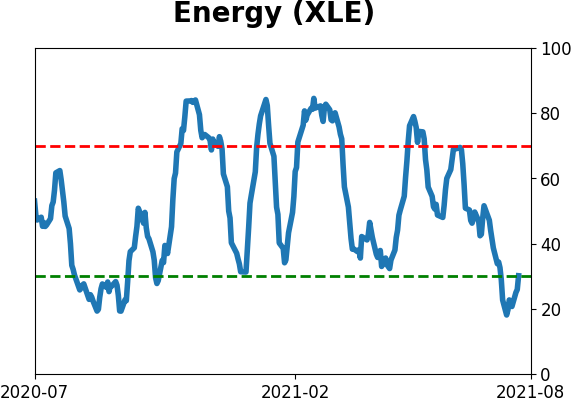
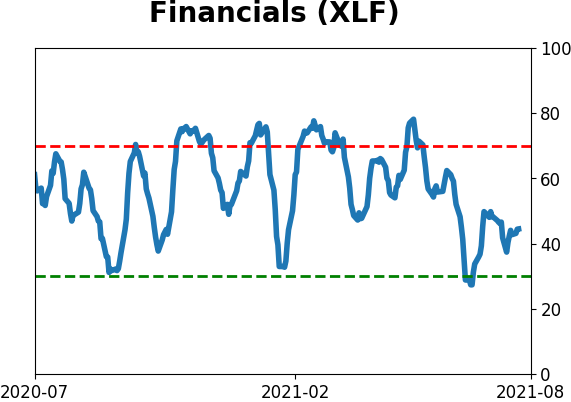
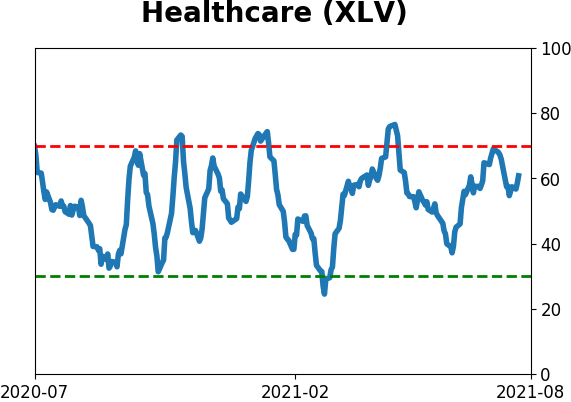
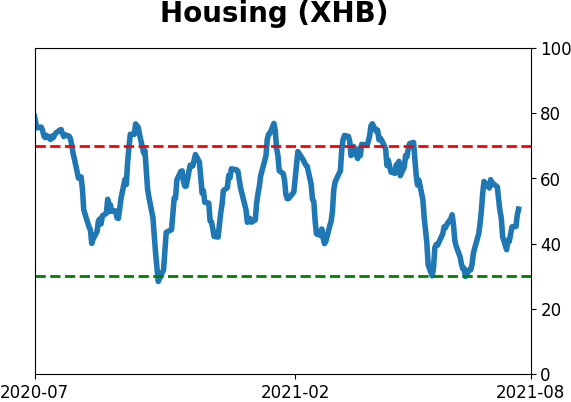
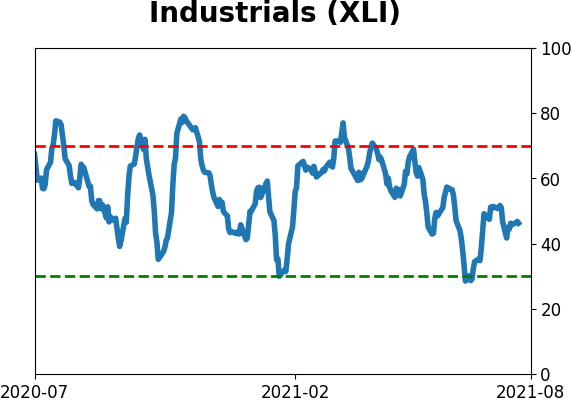
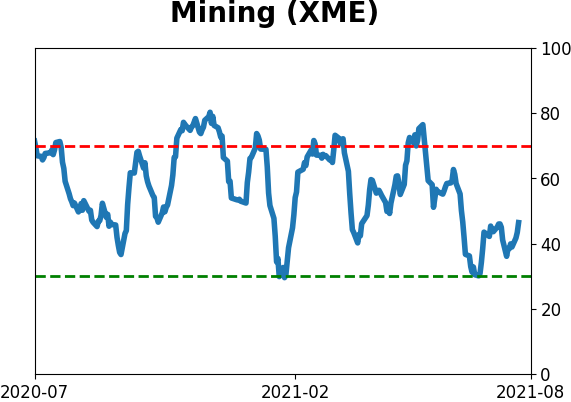
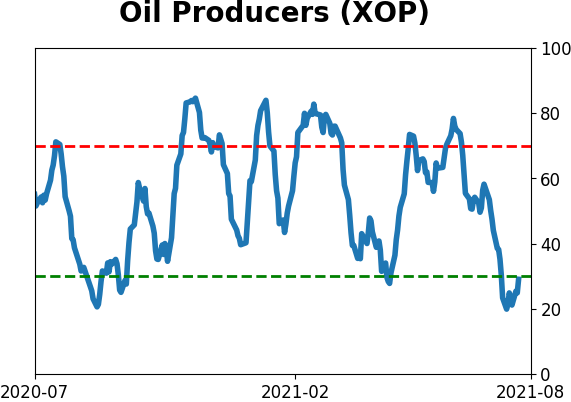
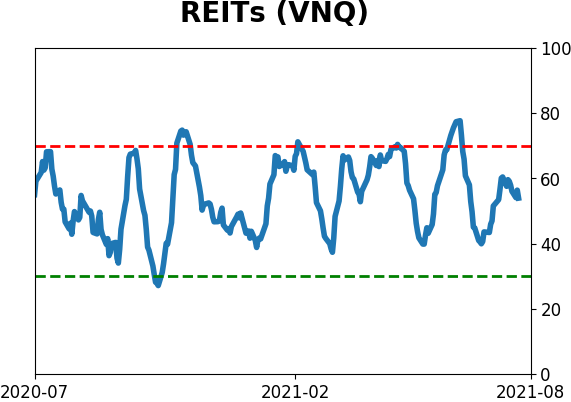
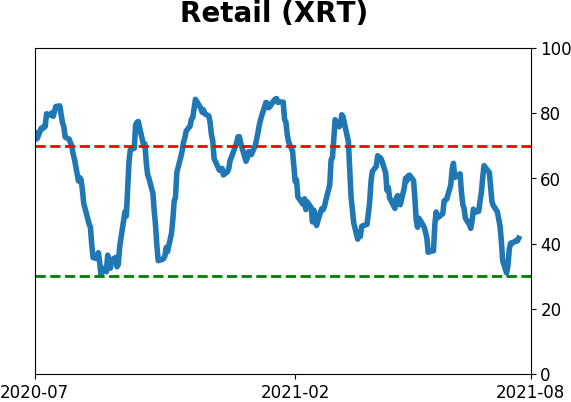
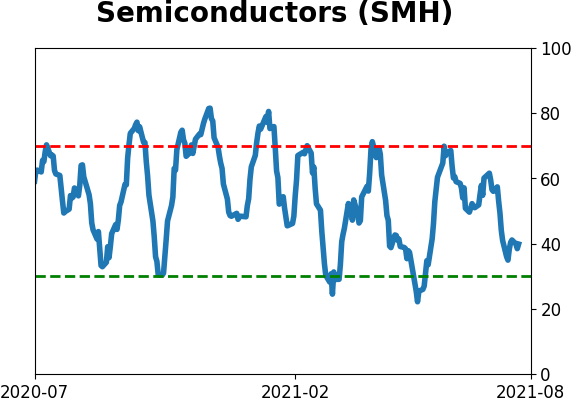
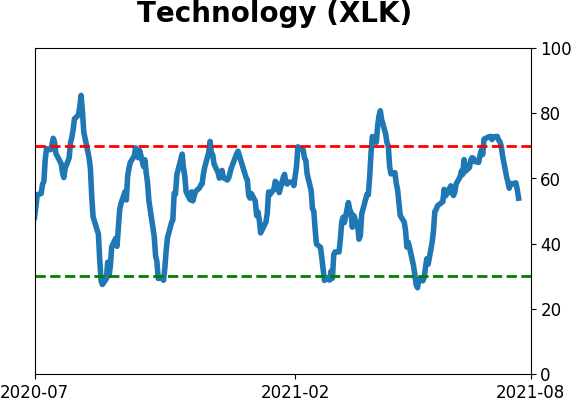
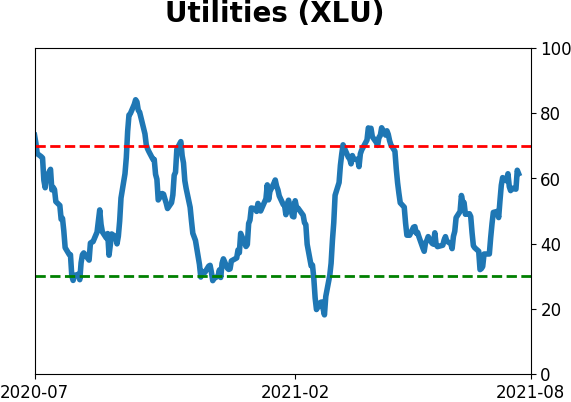
Sector ETF's - 10-Day Moving Average
|
|
|
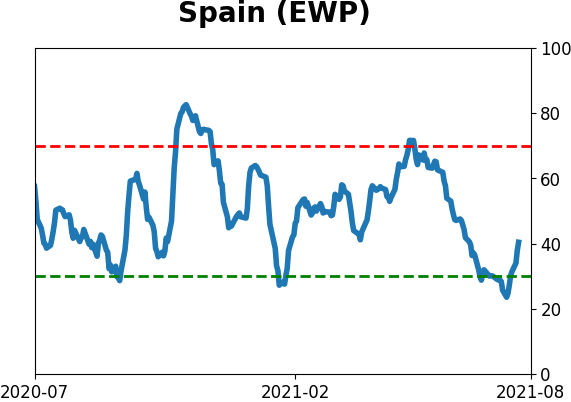
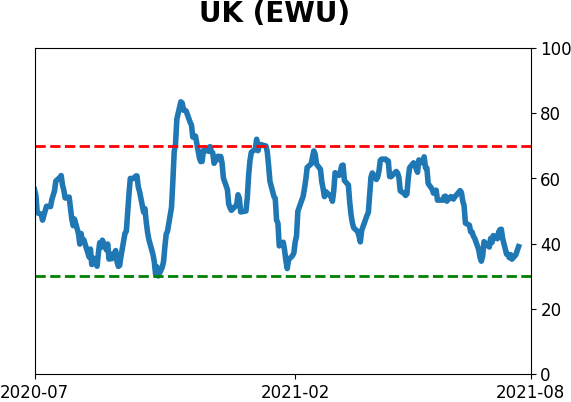
Country ETF's - 10-Day Moving Average
|
|
|
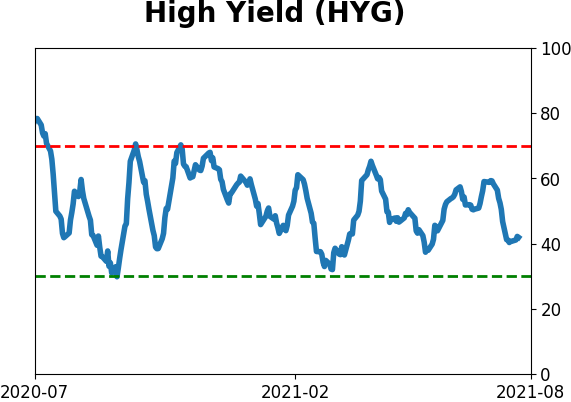
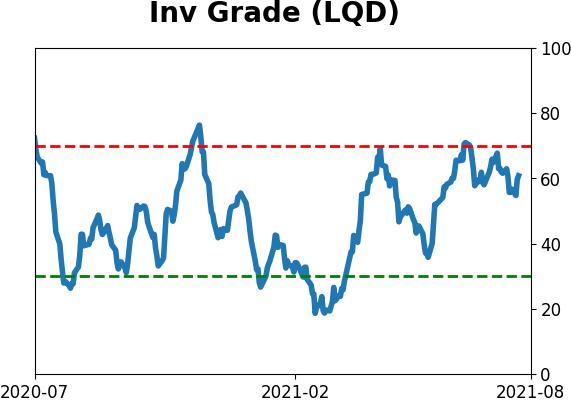
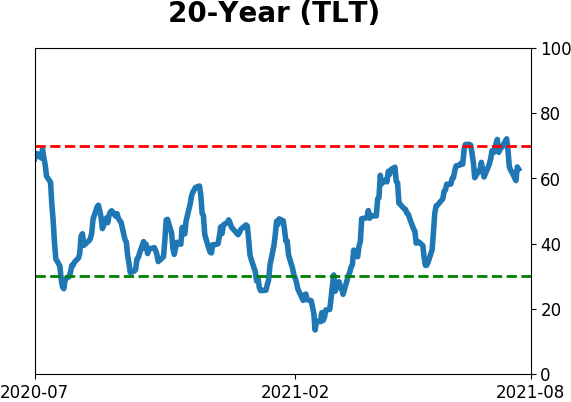
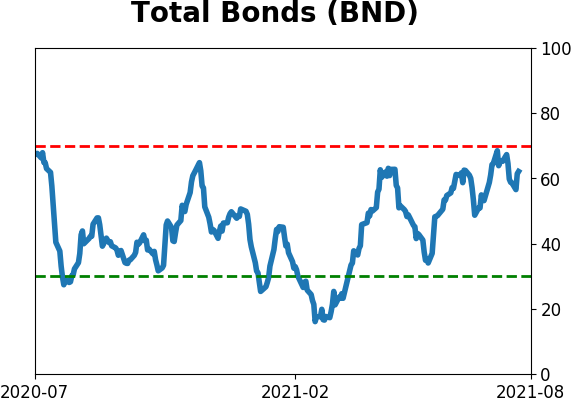
Bond ETF's - 10-Day Moving Average
|
|
|
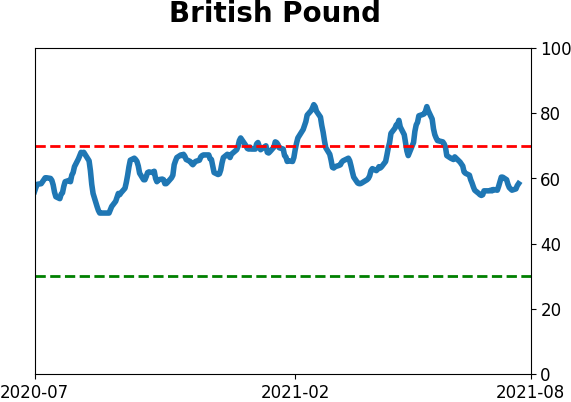
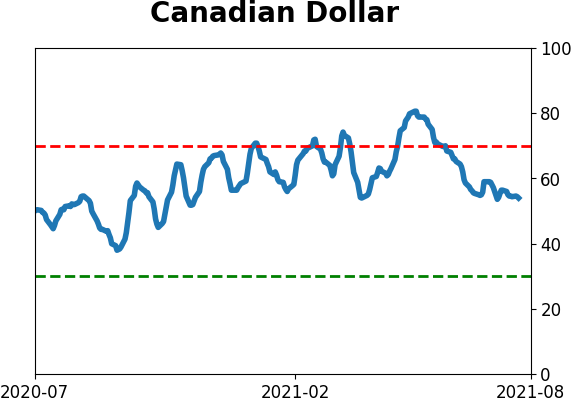
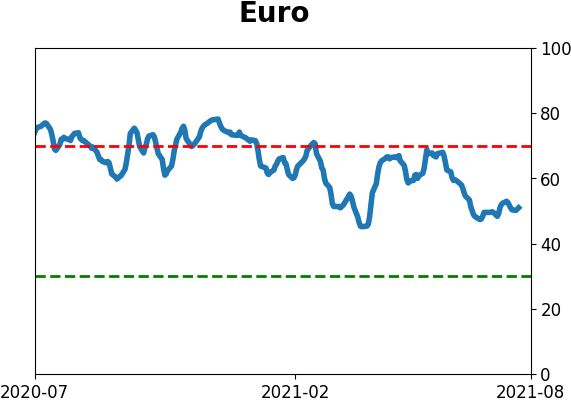
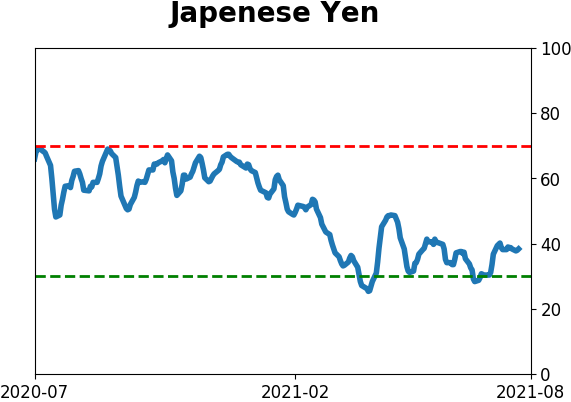
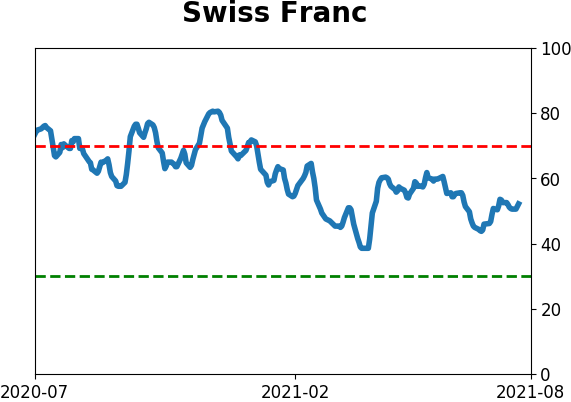
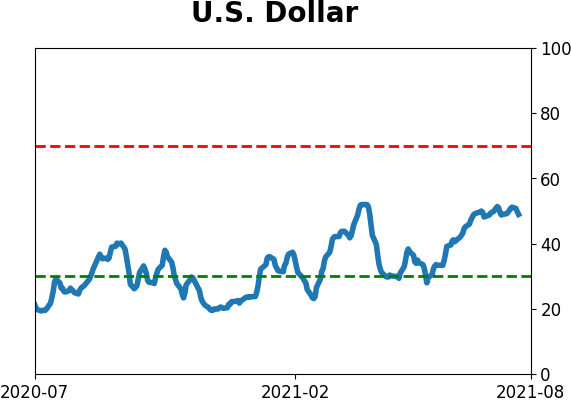
Currency ETF's - 5-Day Moving Average
|
|
|
Commodity ETF's - 5-Day Moving Average
|
|