Headlines
|
|
Gold miners show perfect breadth:
Every gold mining stock is trading above its 50- and 200-day moving averages and a near-record percentage of them have hit a 52-week high. Even though it might be having a speculative moment with a high correlation to bitcoin, this kind of buying pressure has mostly preceded limited sustained upside for miners.
The past 3 months' "everything rally":
Over the past 3 months, stocks, bonds, commodities, and gold have all rallied strongly. This is unusual due to shifting correlations over the years. When other widespread buying spurts got this extreme, all the assets typically settled back over the ensuing months.
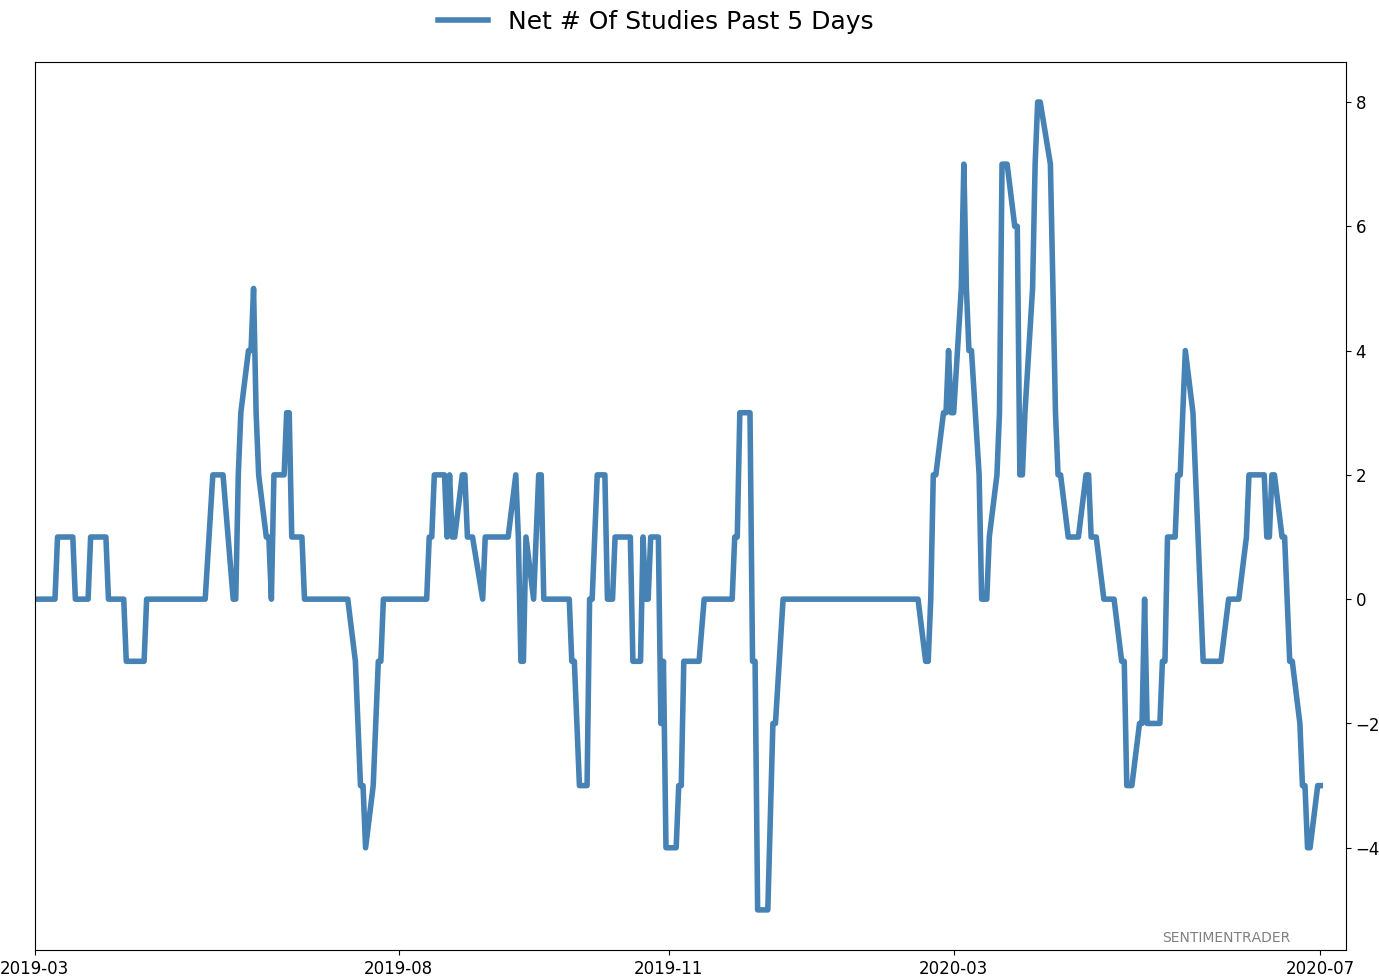
Corporate insider velocity: When we looked at "smart money" corporate insider buying and selling last week, one of the ways we looked at it was the velocity of buying and selling pressure over a 4-week period. Eric has now added that to the premium charts, for the S&P 500 as well as major sectors. The Backtest Engine shows that when the growth in buyers is more than 20% above sellers, the S&P 500 had an almost perfect record of rallying over the next three months, with a median gain of more than 7%. When selling velocity was more than 20% higher than buying, its average return was nearly -3% with only a 20% win rate.
Bottom Line:
- Weight of the evidence has been suggesting flat/lower stock prices short- to medium-term again; still suggesting higher prices long-term
- Indicators show high optimism, with Dumb Money Confidence recently above 80% with signs of reckless speculation during what appears to be an unhealthy market environment, historically a bad combination
- Active Studies show a heavy positive skew over the medium- to long-term; breadth thrusts, recoveries, and trend changes have an almost unblemished record at preceding higher prices over a 6-12 month time frame
- Signs of extremely skewed preference for tech stocks neared exhaustion by late June, especially relative to industrials and financials (here and here)
- Indicators and studies for other markets are showing less consistent forward results, though it's not a great sign for Treasuries that hedgers are net short and optimism on metals has become extreme, with "perfect" breadth among miners
|
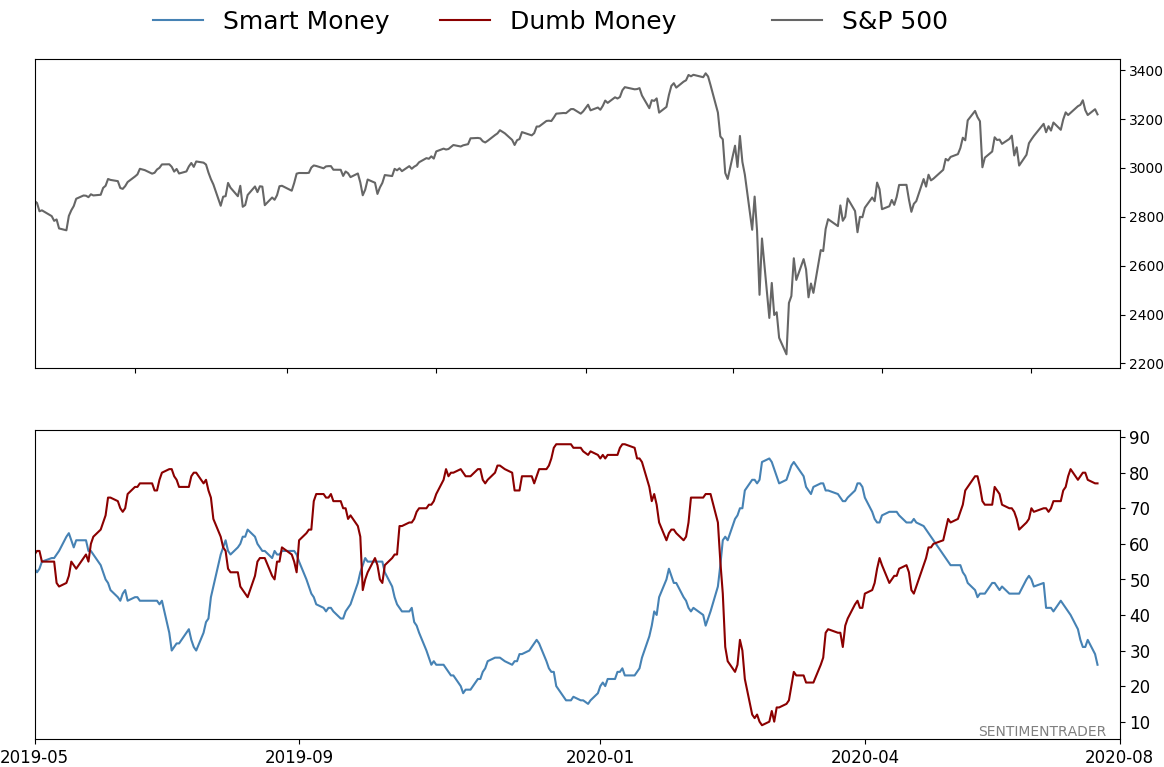
Smart / Dumb Money Confidence
|
Smart Money Confidence: 26%
Dumb Money Confidence: 77%
|
|
Risk Levels
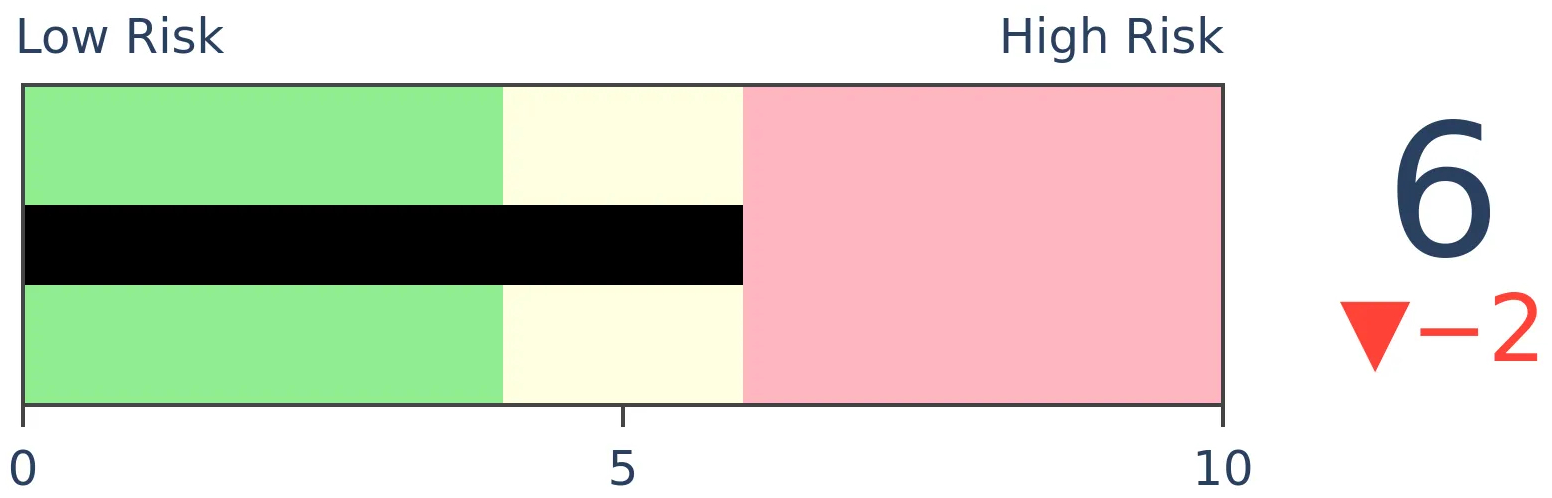
Stocks Short-Term
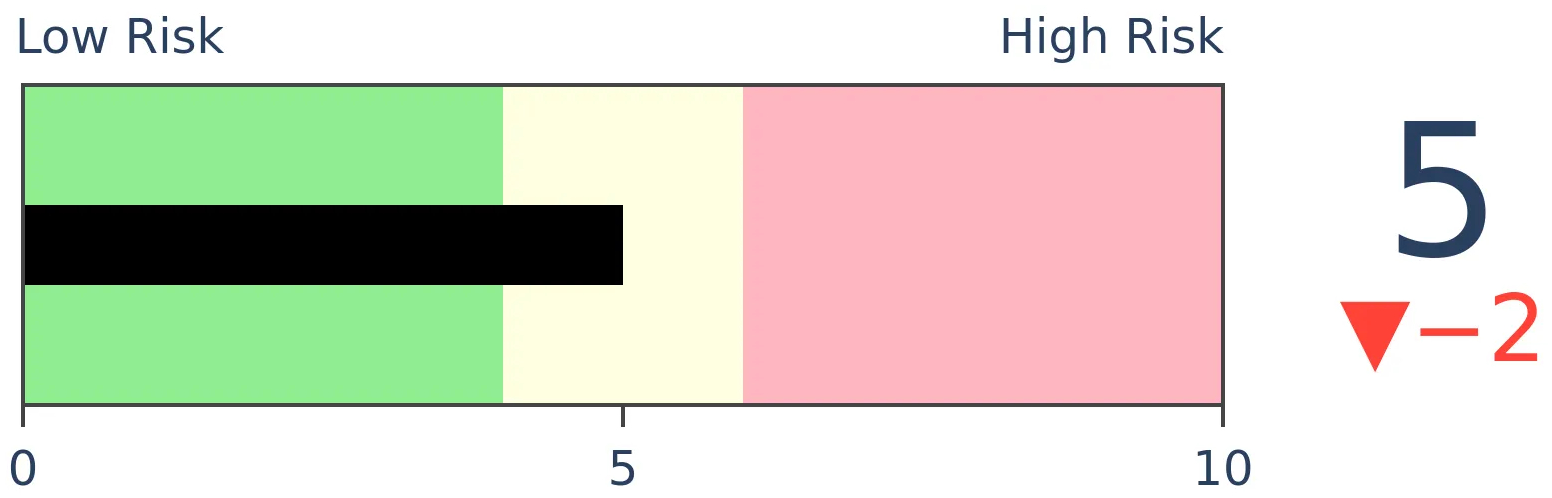
|
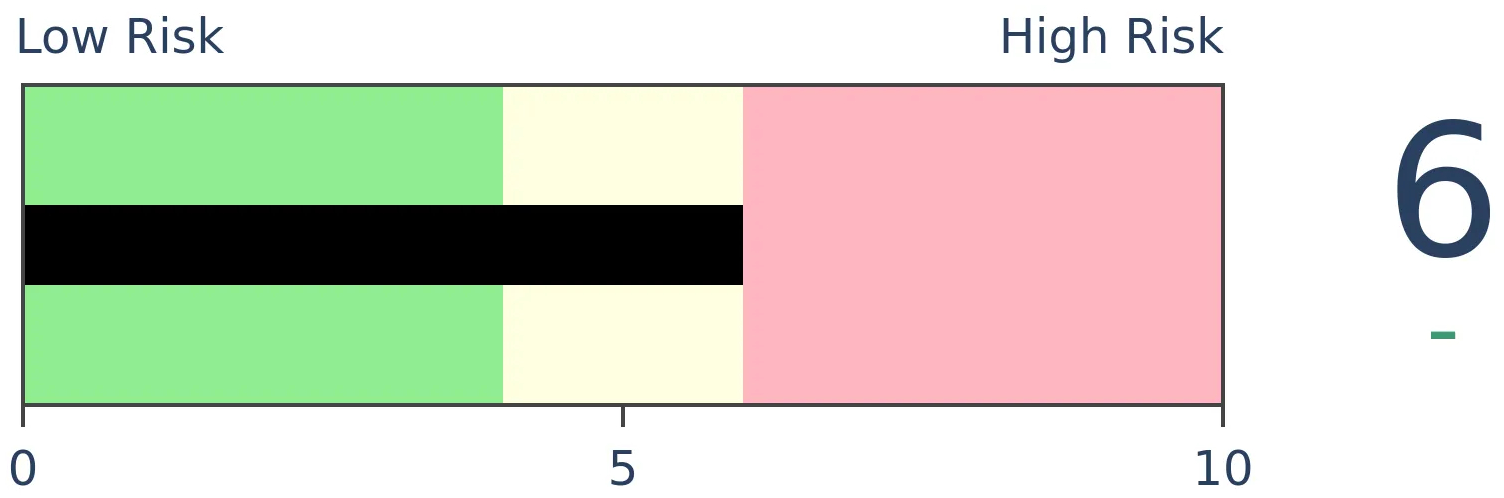
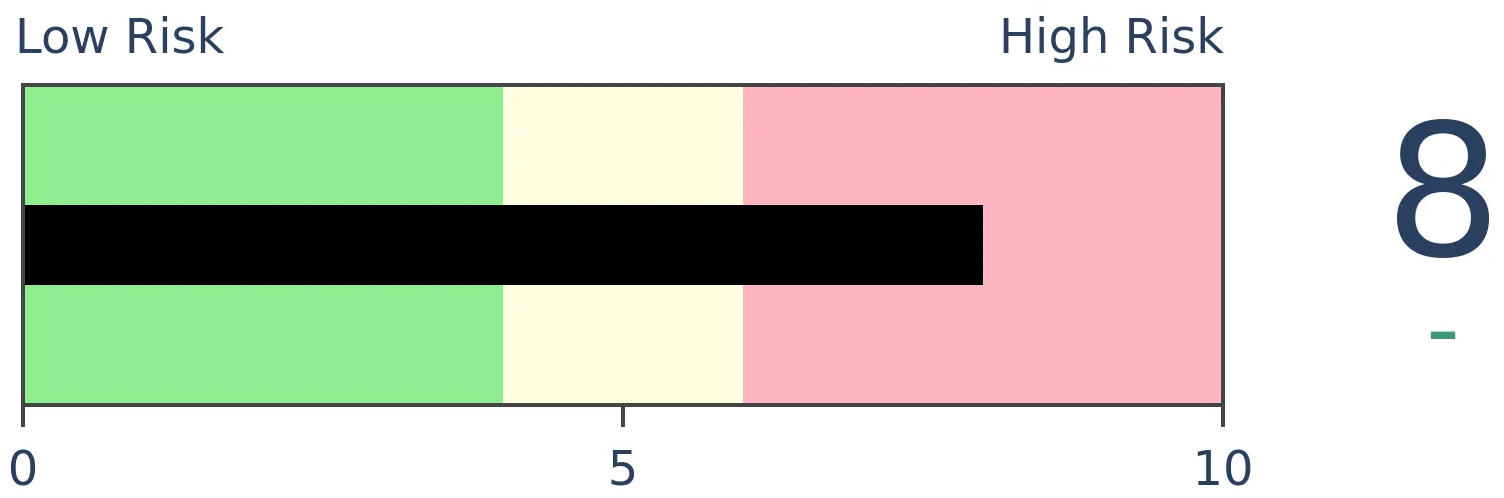
Stocks Medium-Term

|
|
Bonds
|
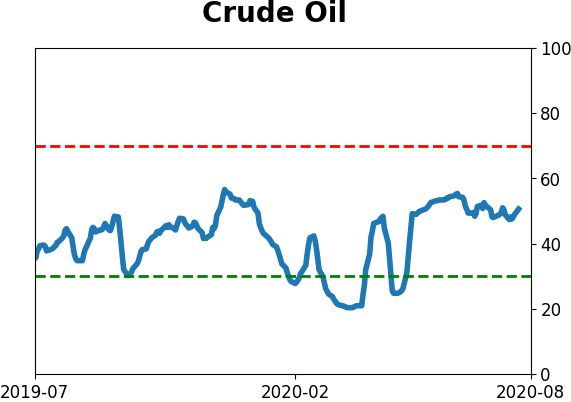
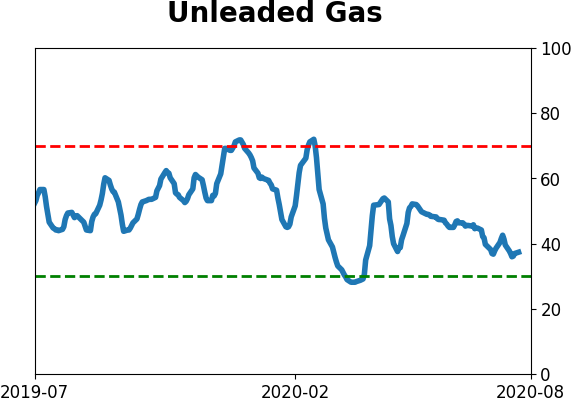
Crude Oil
|
|
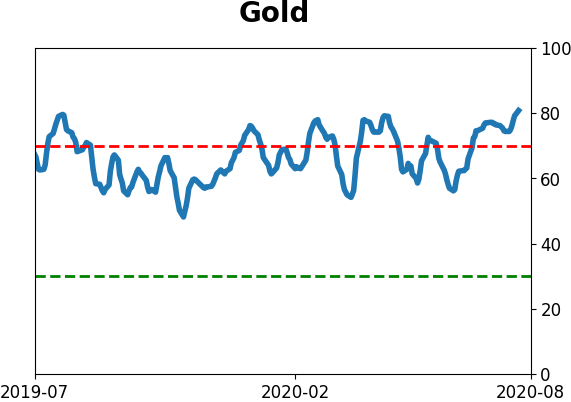
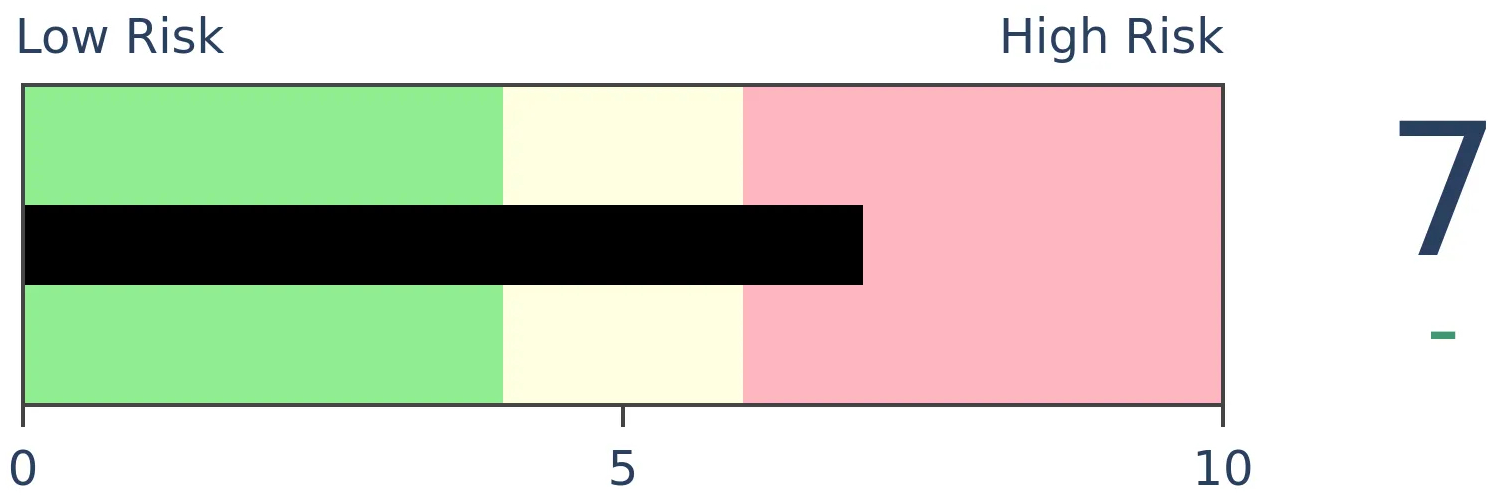
Gold
|
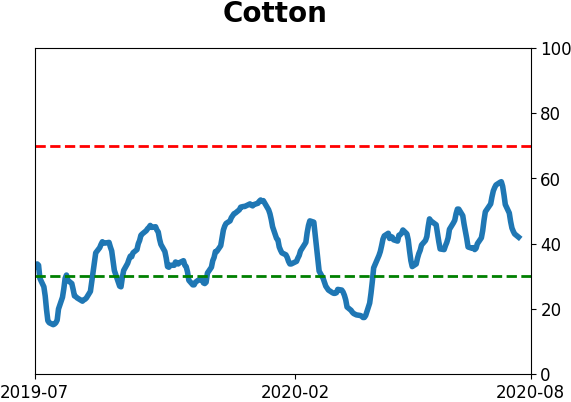
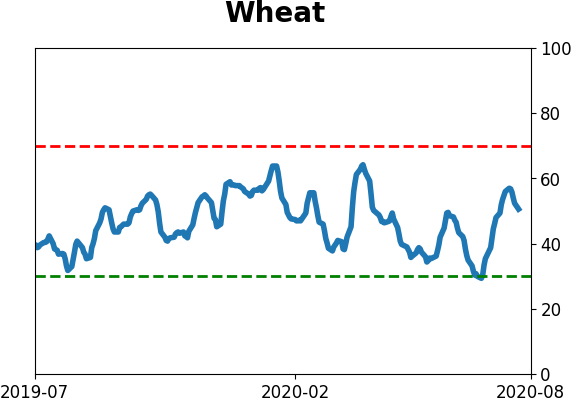
Agriculture
|
|
Research
BOTTOM LINE
Every gold mining stock is trading above its 50- and 200-day moving averages and a near-record percentage of them have hit a 52-week high. Even though it might be having a speculative moment with a high correlation to bitcoin, this kind of buying pressure has mostly preceded limited sustained upside for miners.
FORECAST / TIMEFRAME
GDX -- Down, Medium-Term
|
Even as "everything" rallies, the biggest standout is gold. Whatever the reasons behind the move, it has been stunning.
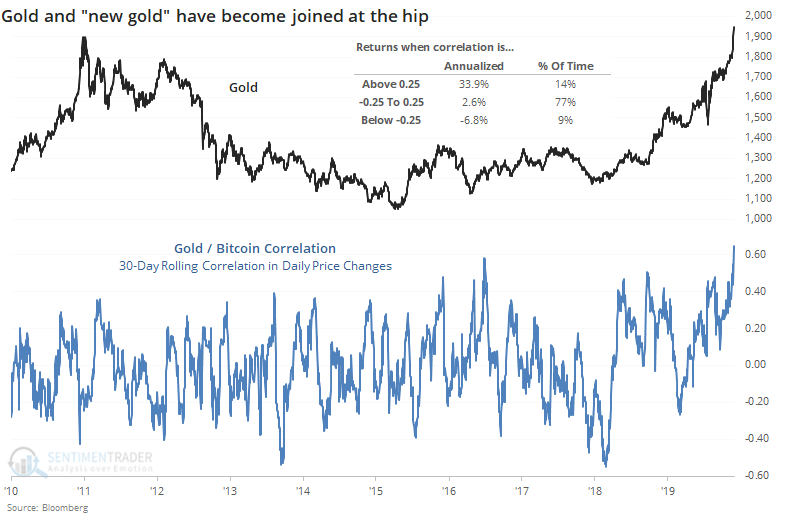
The worry among some is that it's only speculative activity, as judged by the fact that bitcoin, dubbed the "new gold", has also started to spike. As the Daily Shot notes, the correlation between the two alternative stores of value has jumped.
In the relatively short history of bitcoin, high correlations between it and gold haven't been a bad sign for the latter, as its annualized returns were significantly higher during regimes of high positive correlation than high negative correlation.
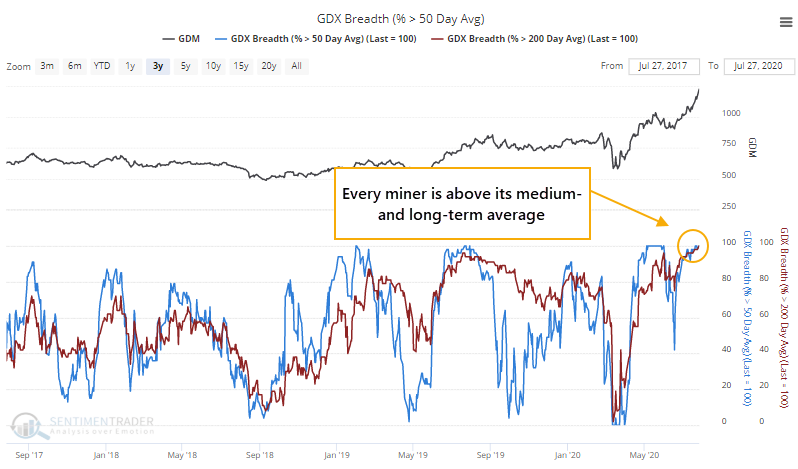
Because of the surge in gold, gold mining companies have taken off as well. The NYSE Arca Gold Miners Index (GDM), the basis for popular exchange-traded funds like GDX, has skyrocketed 34% in just the past 30 days.
That has helped to push every gold mining stock above their 50- and 200-day moving averages, a feat rarely achieved. Almost all of them are even above their shortest-term averages, and a near-record percentage of them have ticked at a 52-week high. That's astoundingly widespread buying interest in this group.
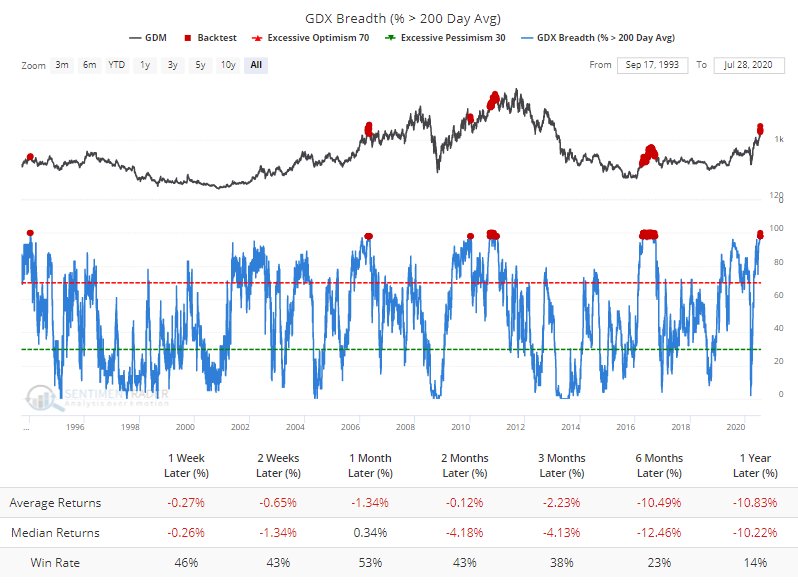
When all but a few of the stocks were above even just their 200-day averages, the index had trouble holding onto its gains per the Backtest Engine.
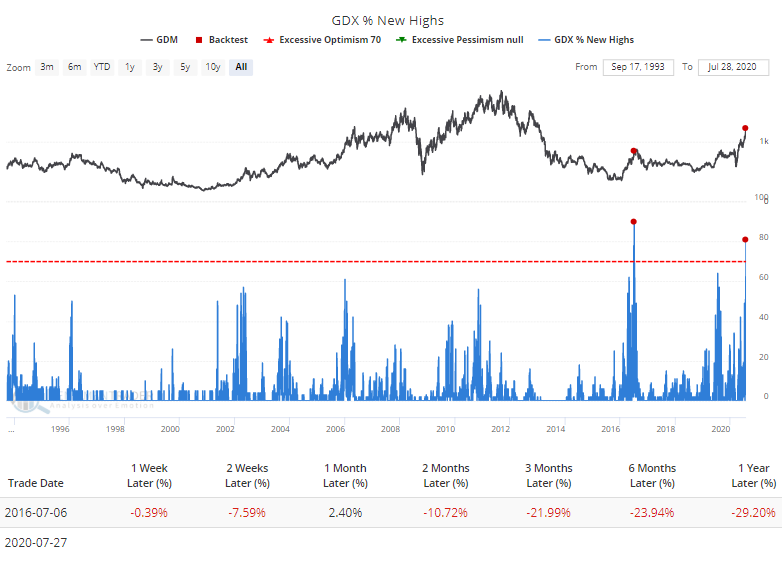
The Backest Engine also shows that there has only been one other day with more of these stocks hitting a 52-week high at the same time.
Below, we can see every time since the inception of GDM when more than 90% of the stocks were above all three moving averages, and more than half of them were at a 52-week high.
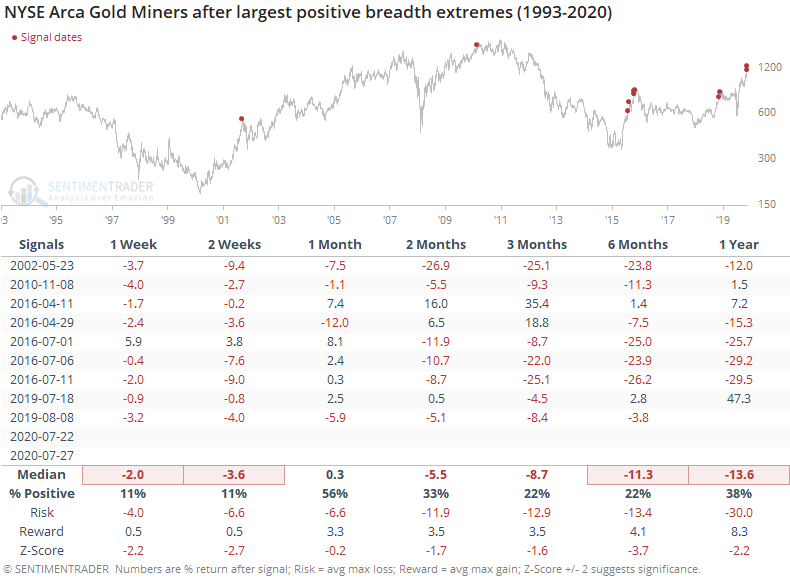
Only one date showed a gain over the next couple of weeks, and that one ended up giving those gains back. All but one of the signals showed a loss between 1-3 months after these breadth surges.
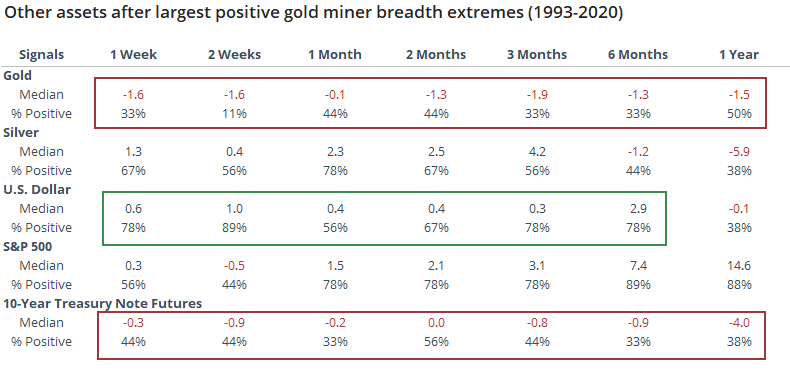
For other assets, there was less of a pattern. Weakness in miners tended to coincide with a drop in gold and a bounce in the buck, neither one being a big surprise given the returns in the table above.
We'd rate this kind of push as a fairly strong negative for gold miners here.
BOTTOM LINE
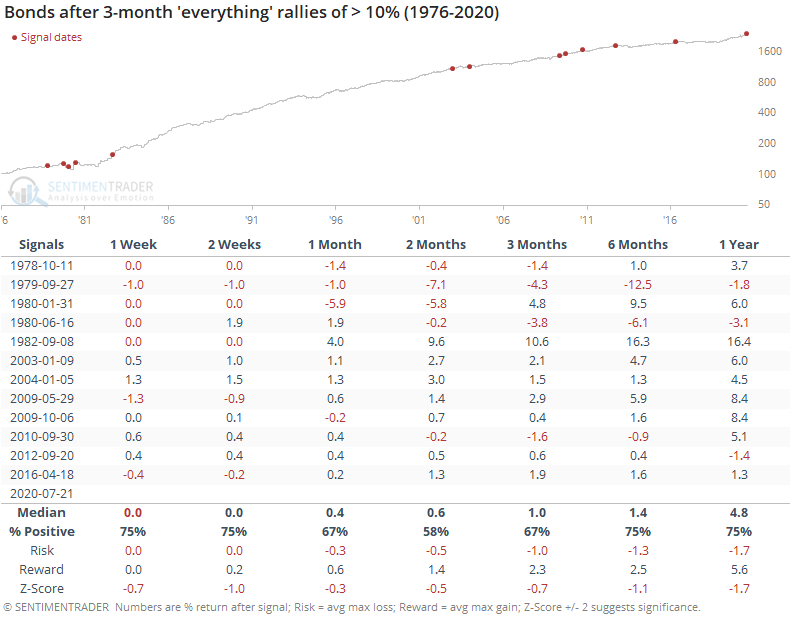
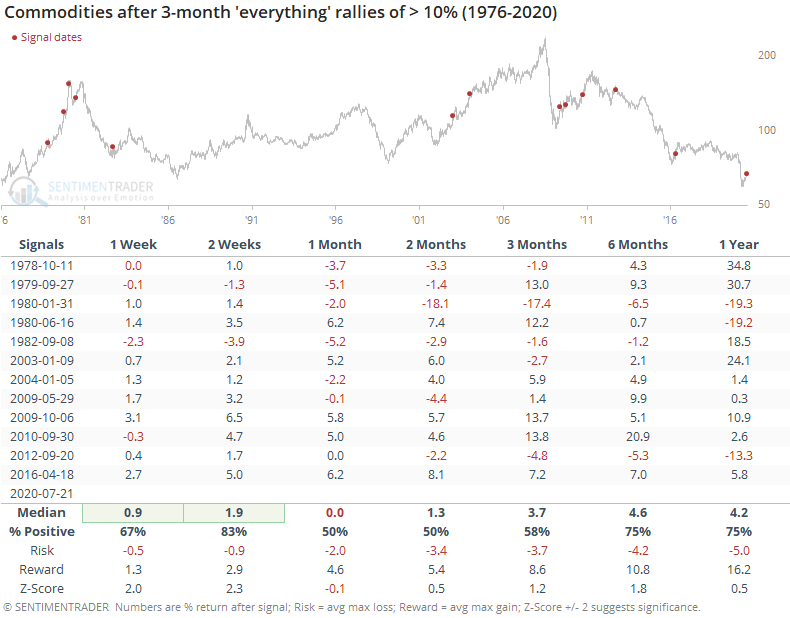
Over the past 3 months, stocks, bonds, commodities, and gold have all rallied strongly. This is unusual due to shifting correlations over the years. When other widespread buying spurts got this extreme, all the assets typically settled back over the ensuing months.
FORECAST / TIMEFRAME
None
|
It's been a monster few months for stocks and just about every other financial asset.
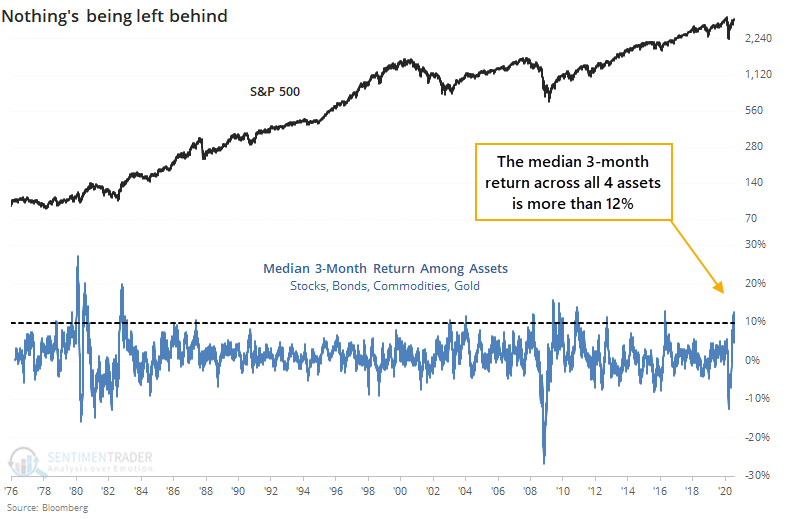
As the WSJ noted, this is one of the few times in history when it seems like everything is rallying, and rallying hard. Stocks, bonds, commodities, and gold have all rallied strongly over the past three months, even though their historical relationships are not often positively correlated.
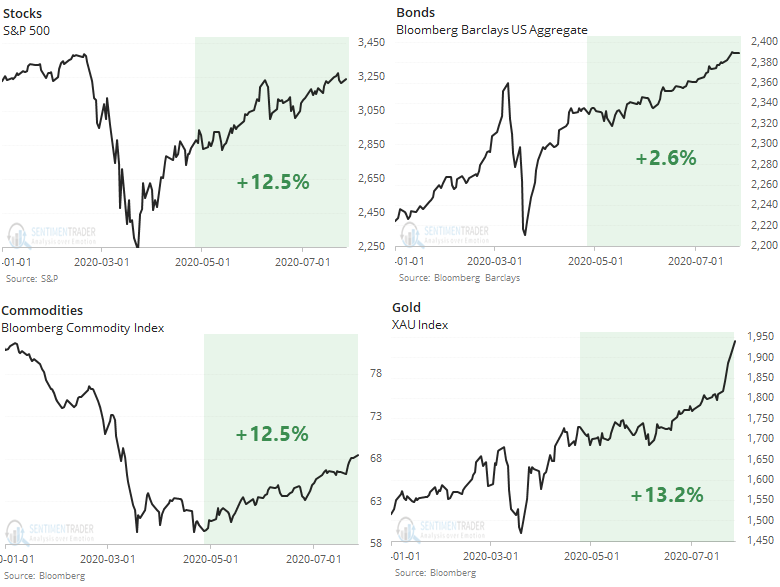
Every one of the assets has rallied over a 3-month span, and their median return is a whopping 12%. That ranks among the highest in nearly 45 years.
When this happens, it is typically touted as a sign that "something" structural is driving all assets higher (usually the Federal Reserve, for better or worse). Opinions always vary widely whether this kind of activity is sustainable.
At the risk of relying on historical precedents during an unprecedented time, for stocks, this kind of behavior was a medium-term issue, but longer-term positive.
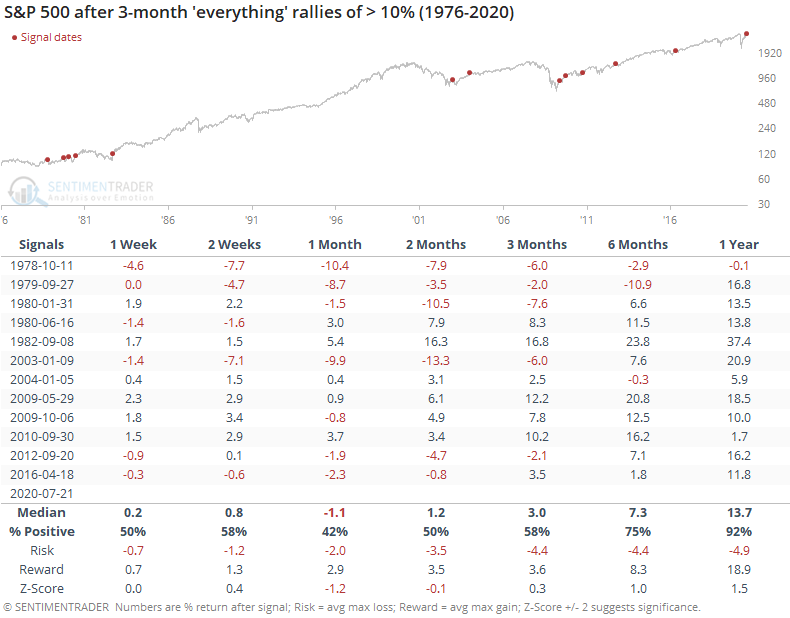
Over the following 1-2 months, the S&P tended to decline or tread water, with a couple of breakout gains at the starts of major bull markets like 1982 and 2009. Otherwise, investors took a slight breather, and the risk/reward was negative up to three months later.
Bonds struggled during the early precedents but the unrelenting bull market since then led to positive returns (note that this is total return and not just price gains).
The broad-based buying momentum across assets tended to carry commodities further short-term, and while there were some wobbles, longer-term returns were positive as well. Signals near peaks in 1980 and 2012 were the biggest outliers.
The most consistent asset going forward was gold, and not in a good way. The metal struggled to hold its gains over the medium-term, with well-below-average returns up to six months later. The most notable exceptions were in 2009-10 as it embarked on the 2nd half of its decade-long bull market.
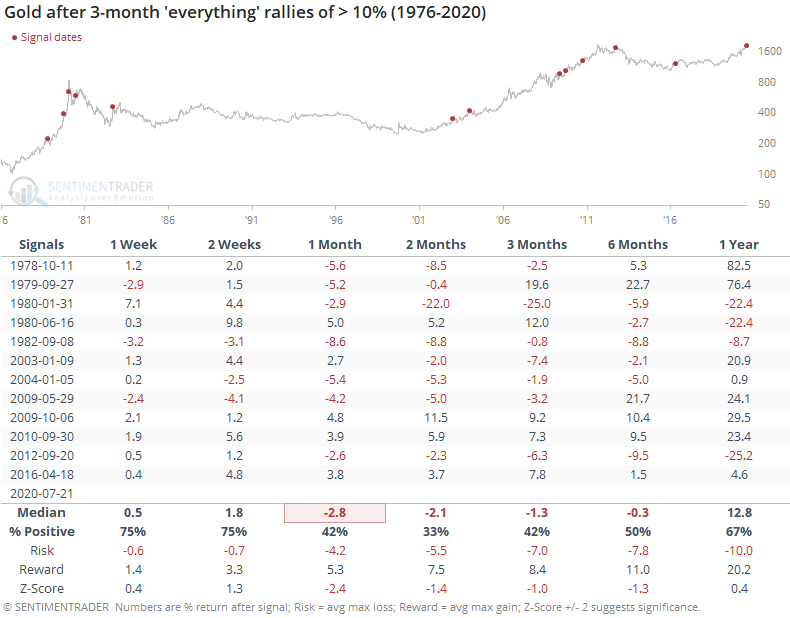
The factors that have contributed to the intense and widespread buying interest over the past three months are still largely intact, so maybe these assets can keep going. Historically, that would be unusual, especially during the next several months. The assets all saw relatively poor medium-term returns after spurts like this, none more so than gold.
Active Studies
| Time Frame | Bullish | Bearish | | Short-Term | 0 | 1 | | Medium-Term | 8 | 11 | | Long-Term | 44 | 1 |
|
Indicators at Extremes
Portfolio
| Position | Weight % | Added / Reduced | Date | | Stocks | 29.8 | Reduced 9.1% | 2020-06-11 | | Bonds | 0.0 | Reduced 6.7% | 2020-02-28 | | Commodities | 5.2 | Added 2.4%
| 2020-02-28 | | Precious Metals | 0.0 | Reduced 3.6% | 2020-02-28 | | Special Situations | 0.0 | Reduced 31.9% | 2020-03-17 | | Cash | 65.0 | | |
|
Updates (Changes made today are underlined)
After stocks bottomed on March 23rd, they enjoyed a historic buying thrust and retraced a larger amount of the decline than "just a bear market rally" tends to. Through June, there were signs of breadth thrusts, recoveries, and trend changes that have an almost unblemished record at preceding higher prices over a 6-12 month time frame. On a shorter-term basis, our indicators have been showing high optimism, with Dumb Money Confidence recently above 80%, along with signs of reckless speculation during what appears to be an unhealthy market environment, historically a bad combination. While there are certainly some outlier indicators that are showing apathy or even outright pessimism, a weight-of-the-evidence approach suggests high risk over a multi-week to multi-month time frame. I've been carrying a low (too low) level of exposure to stocks, as well as bonds and gold. I don't see a good opportunity to add to any of those currently, with poor prospects pretty much all the way around. As worried as I am over the medium-term, I would only grudgingly reduce my exposure even further, given the longer-term positives we spent so much time discussing in the spring.
RETURN YTD: -4.1% 2019: 12.6%, 2018: 0.6%, 2017: 3.8%, 2016: 17.1%, 2015: 9.2%, 2014: 14.5%, 2013: 2.2%, 2012: 10.8%, 2011: 16.5%, 2010: 15.3%, 2009: 23.9%, 2008: 16.2%, 2007: 7.8%
|
|
Phase Table
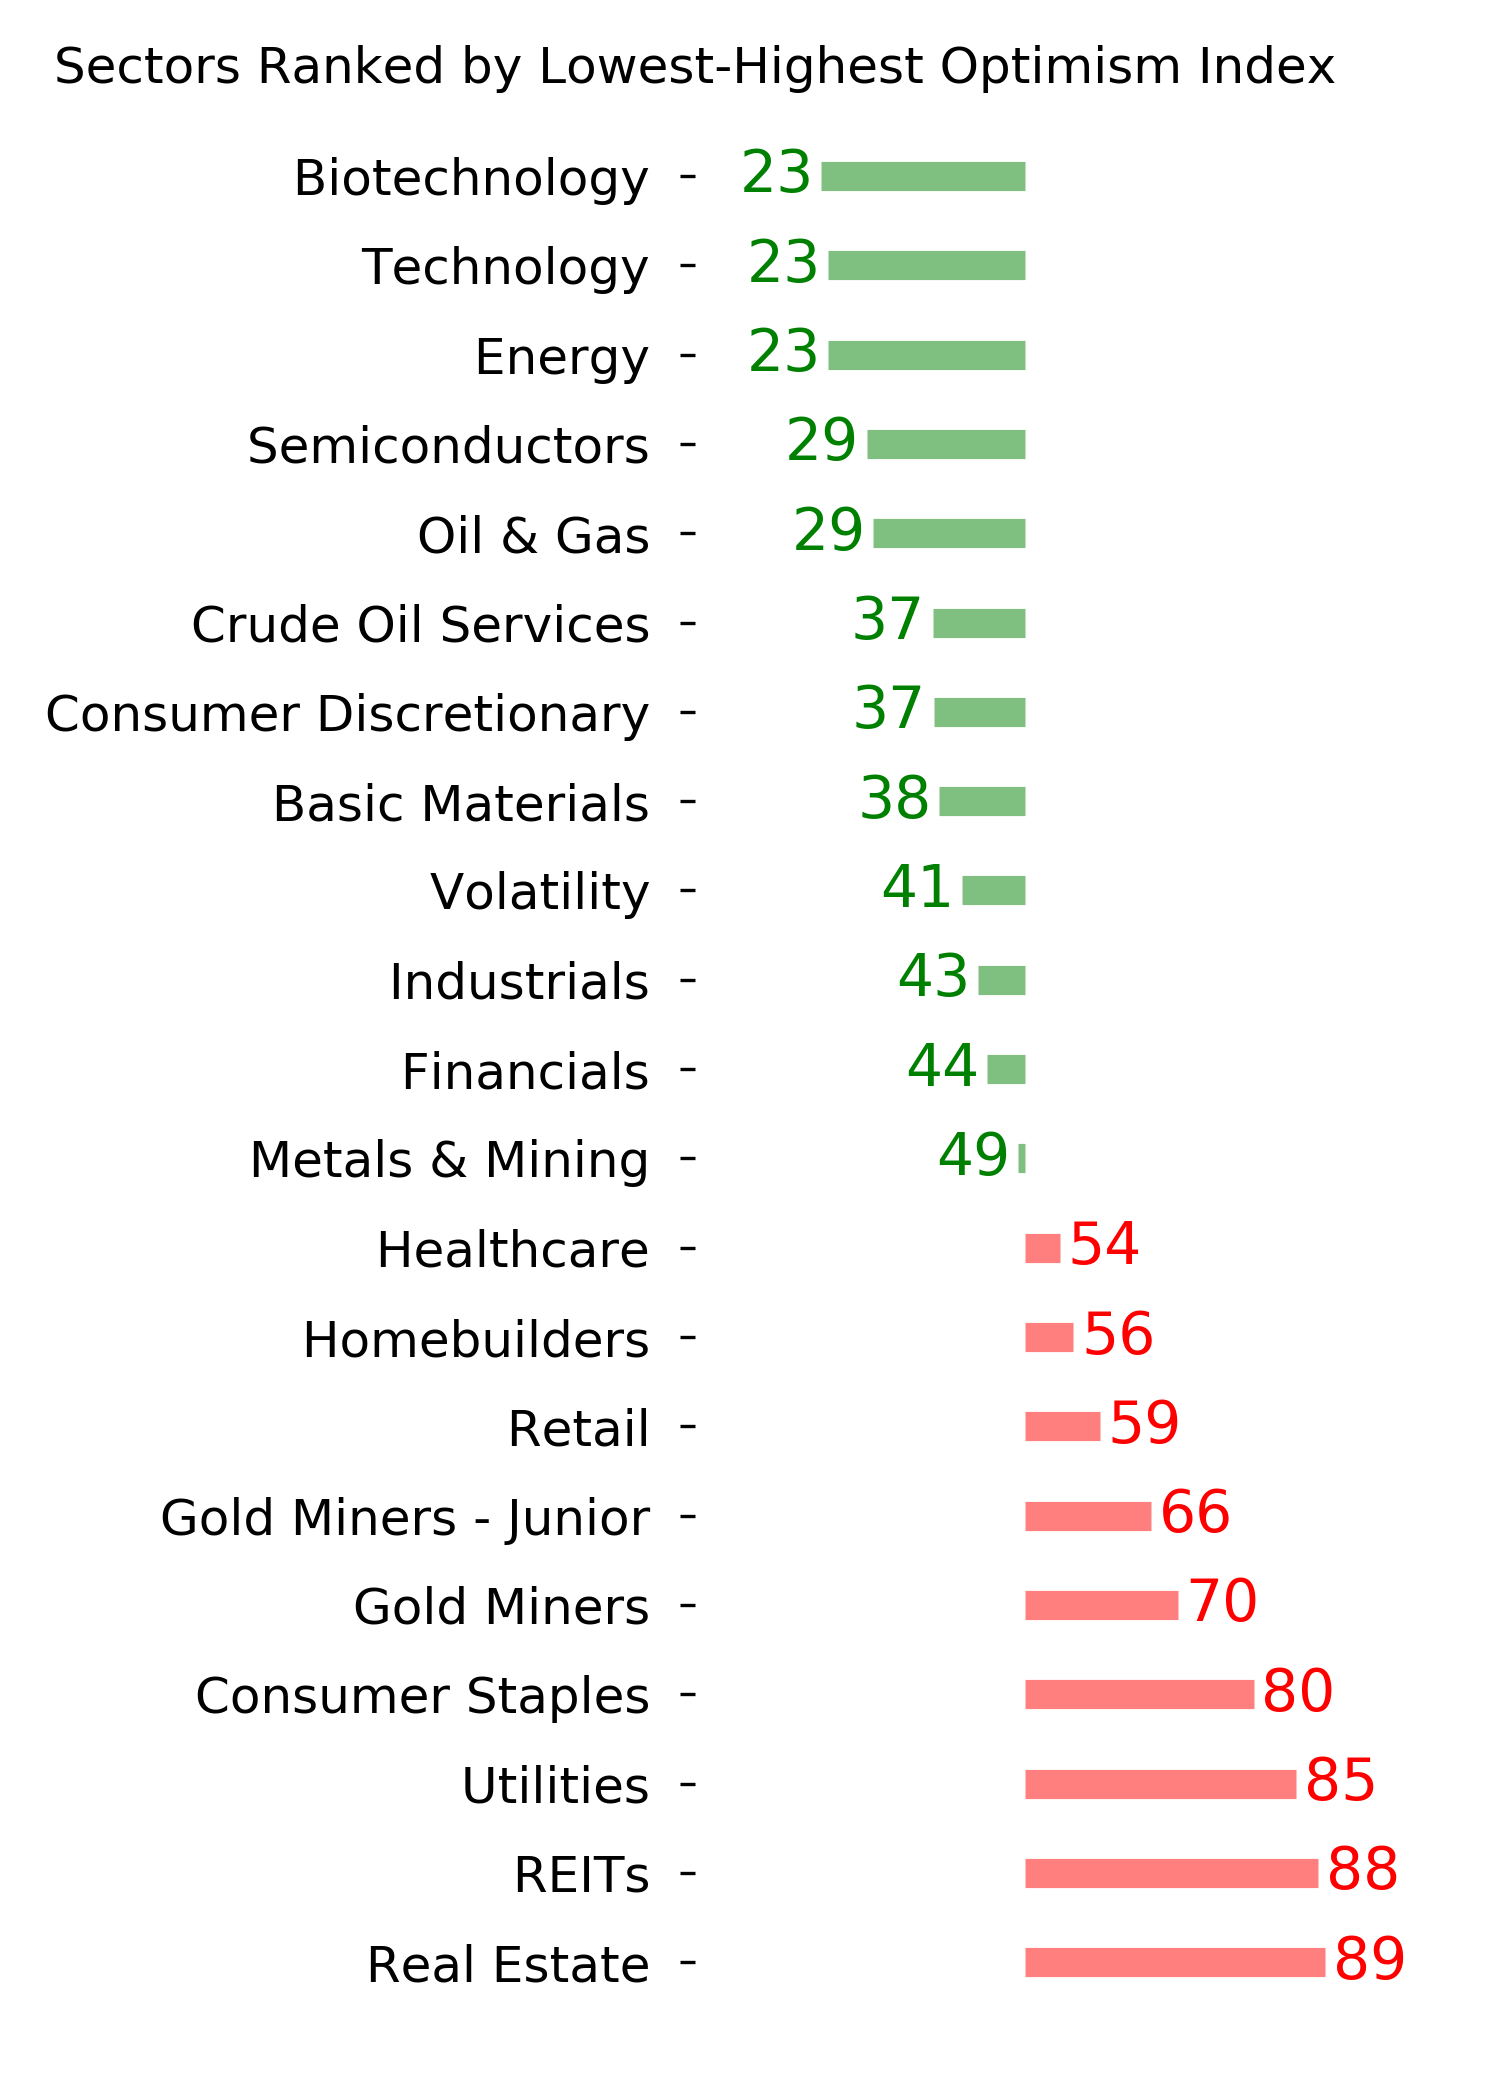
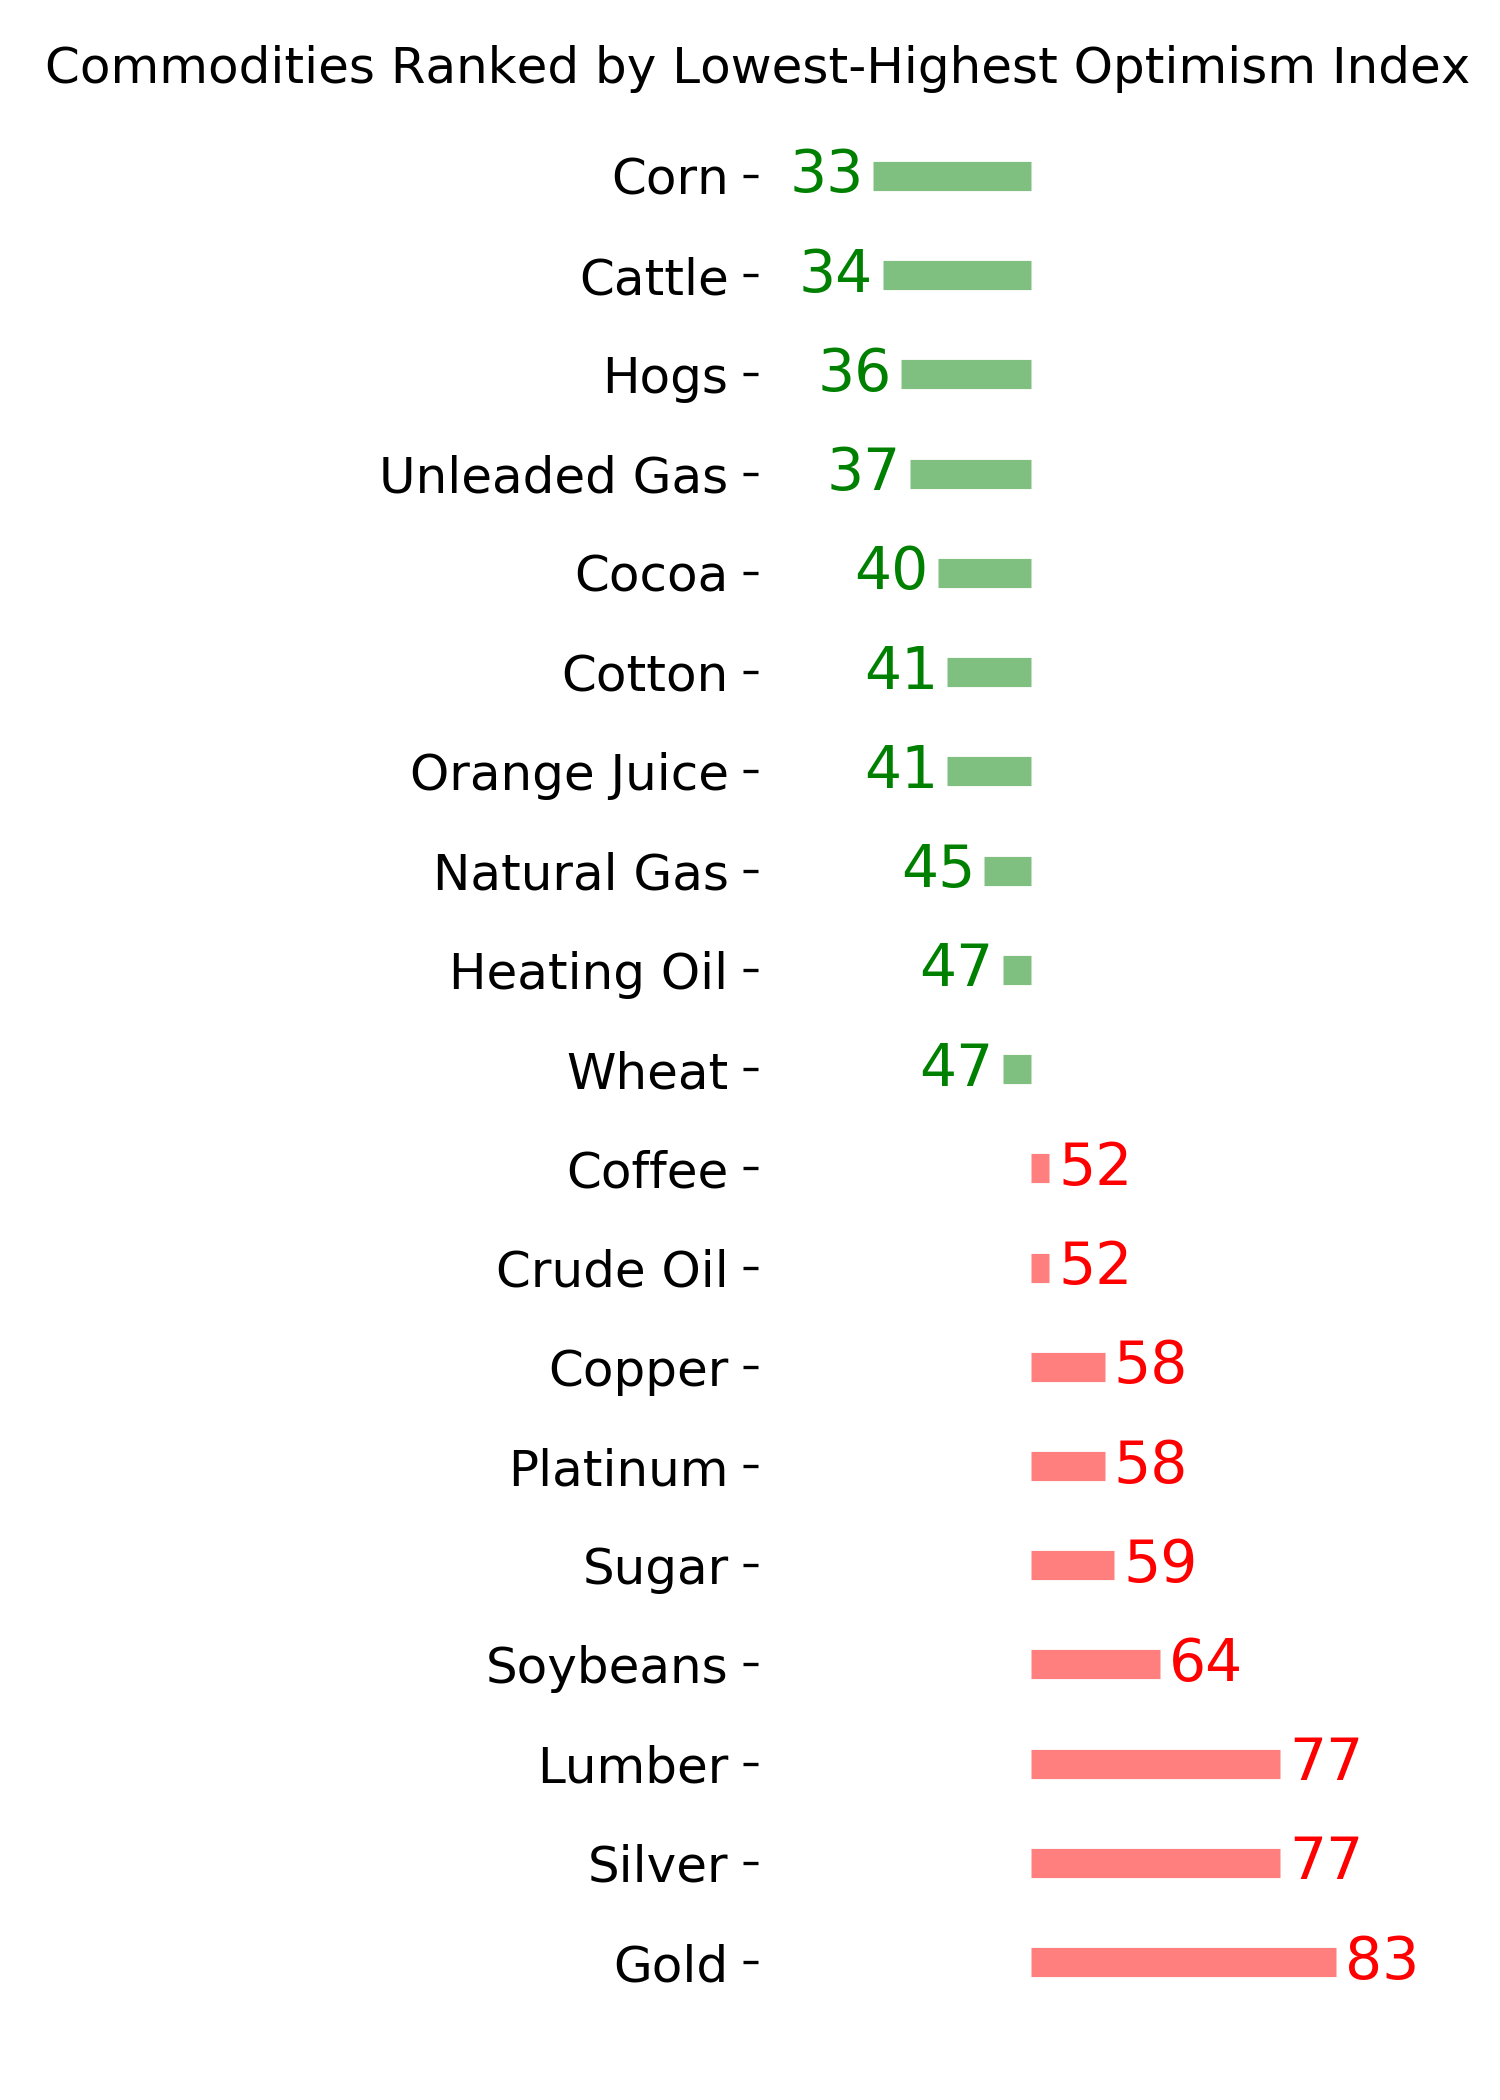
Ranks
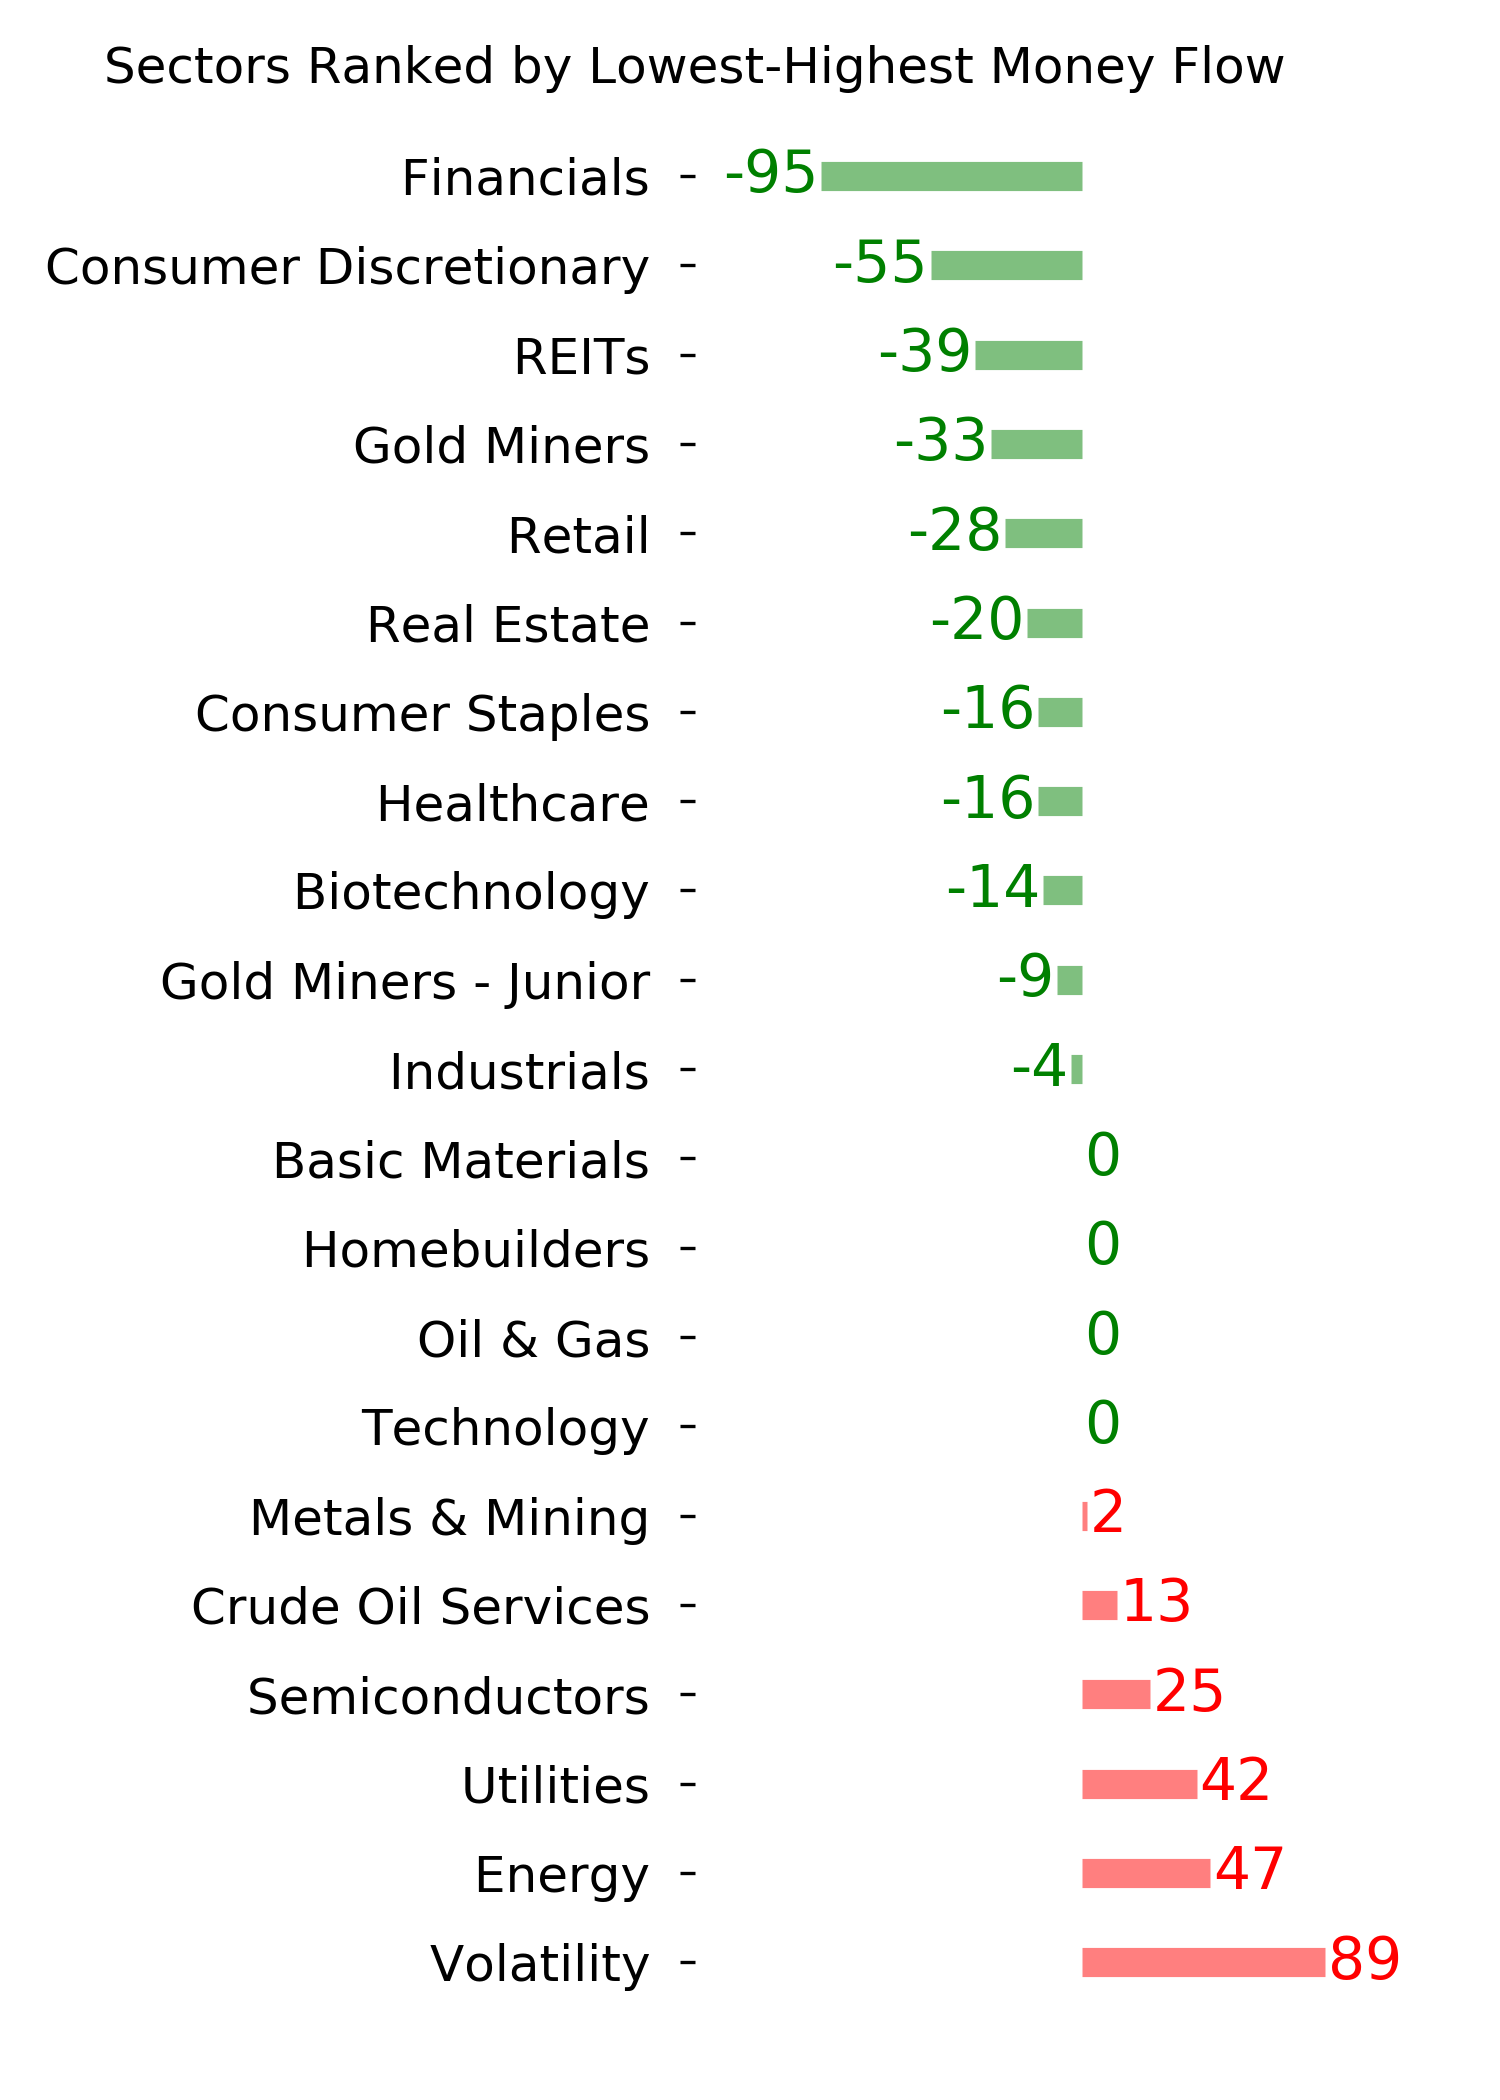
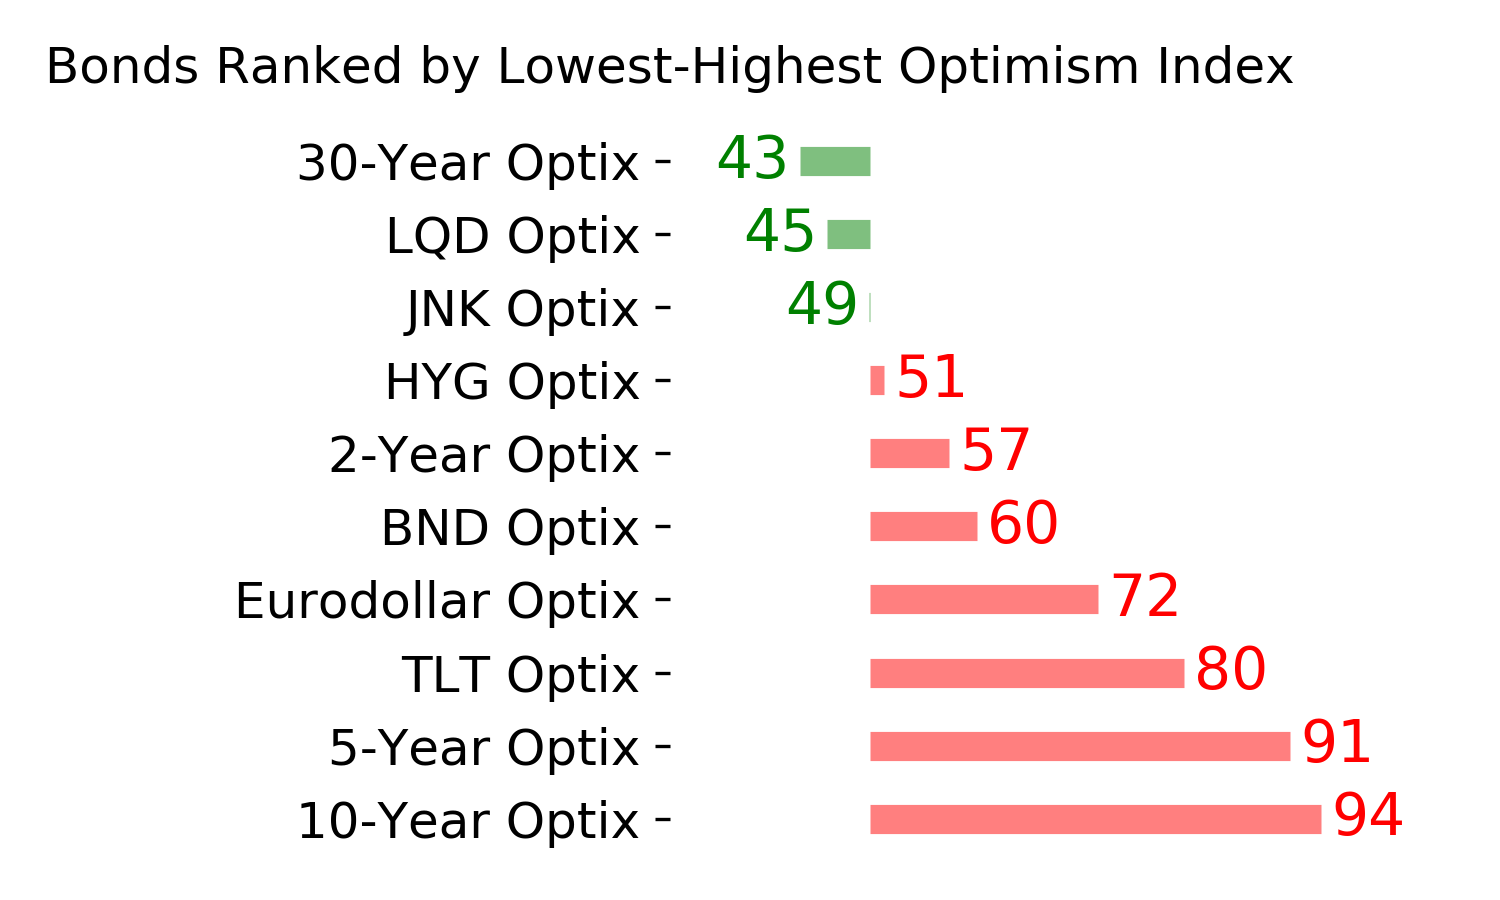
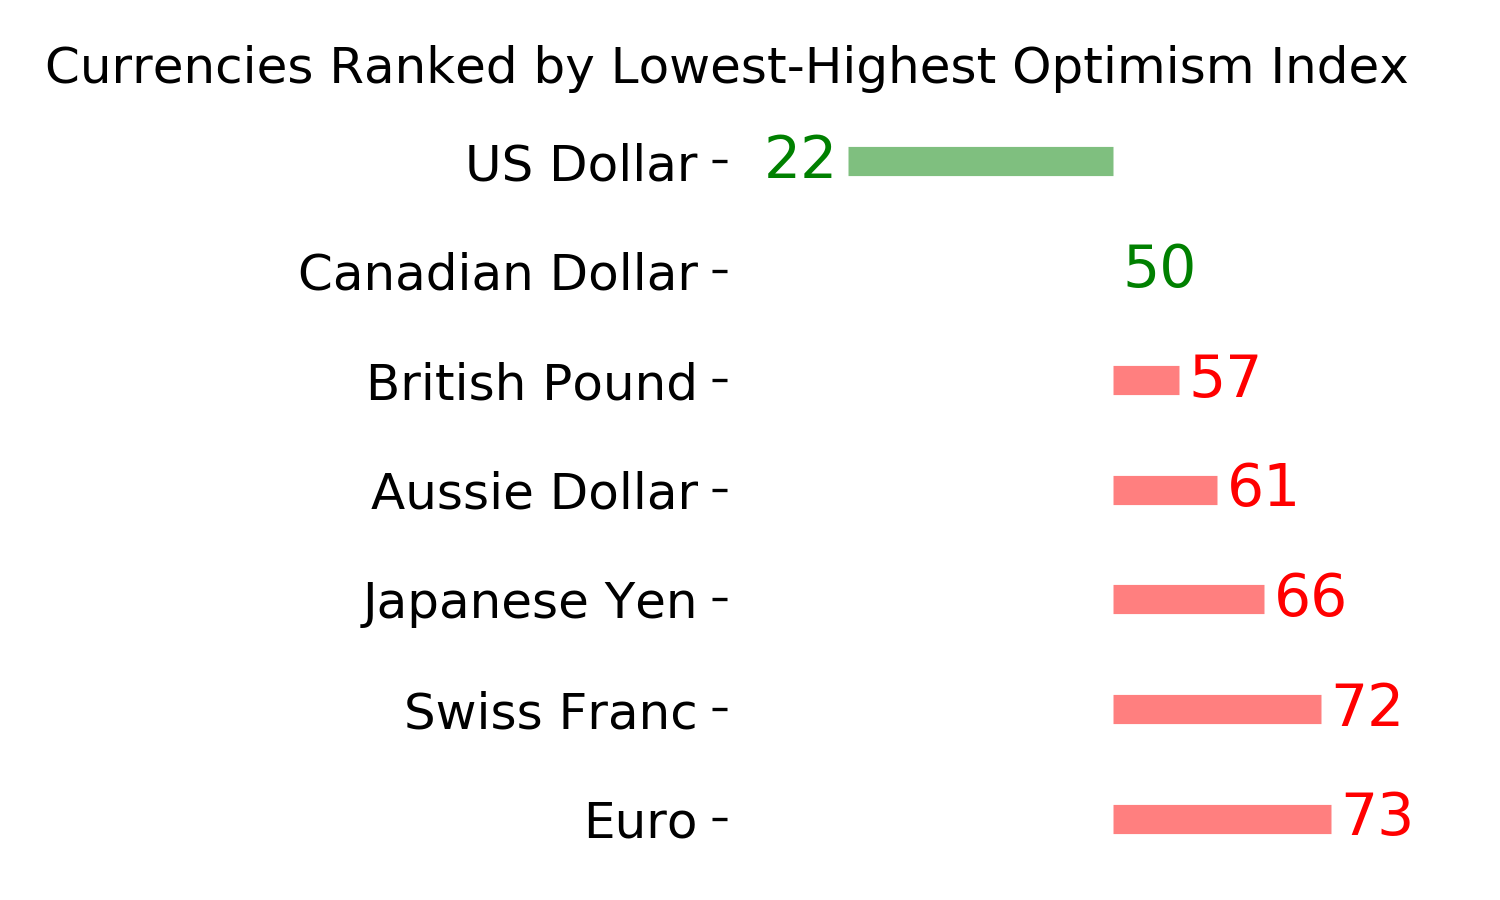
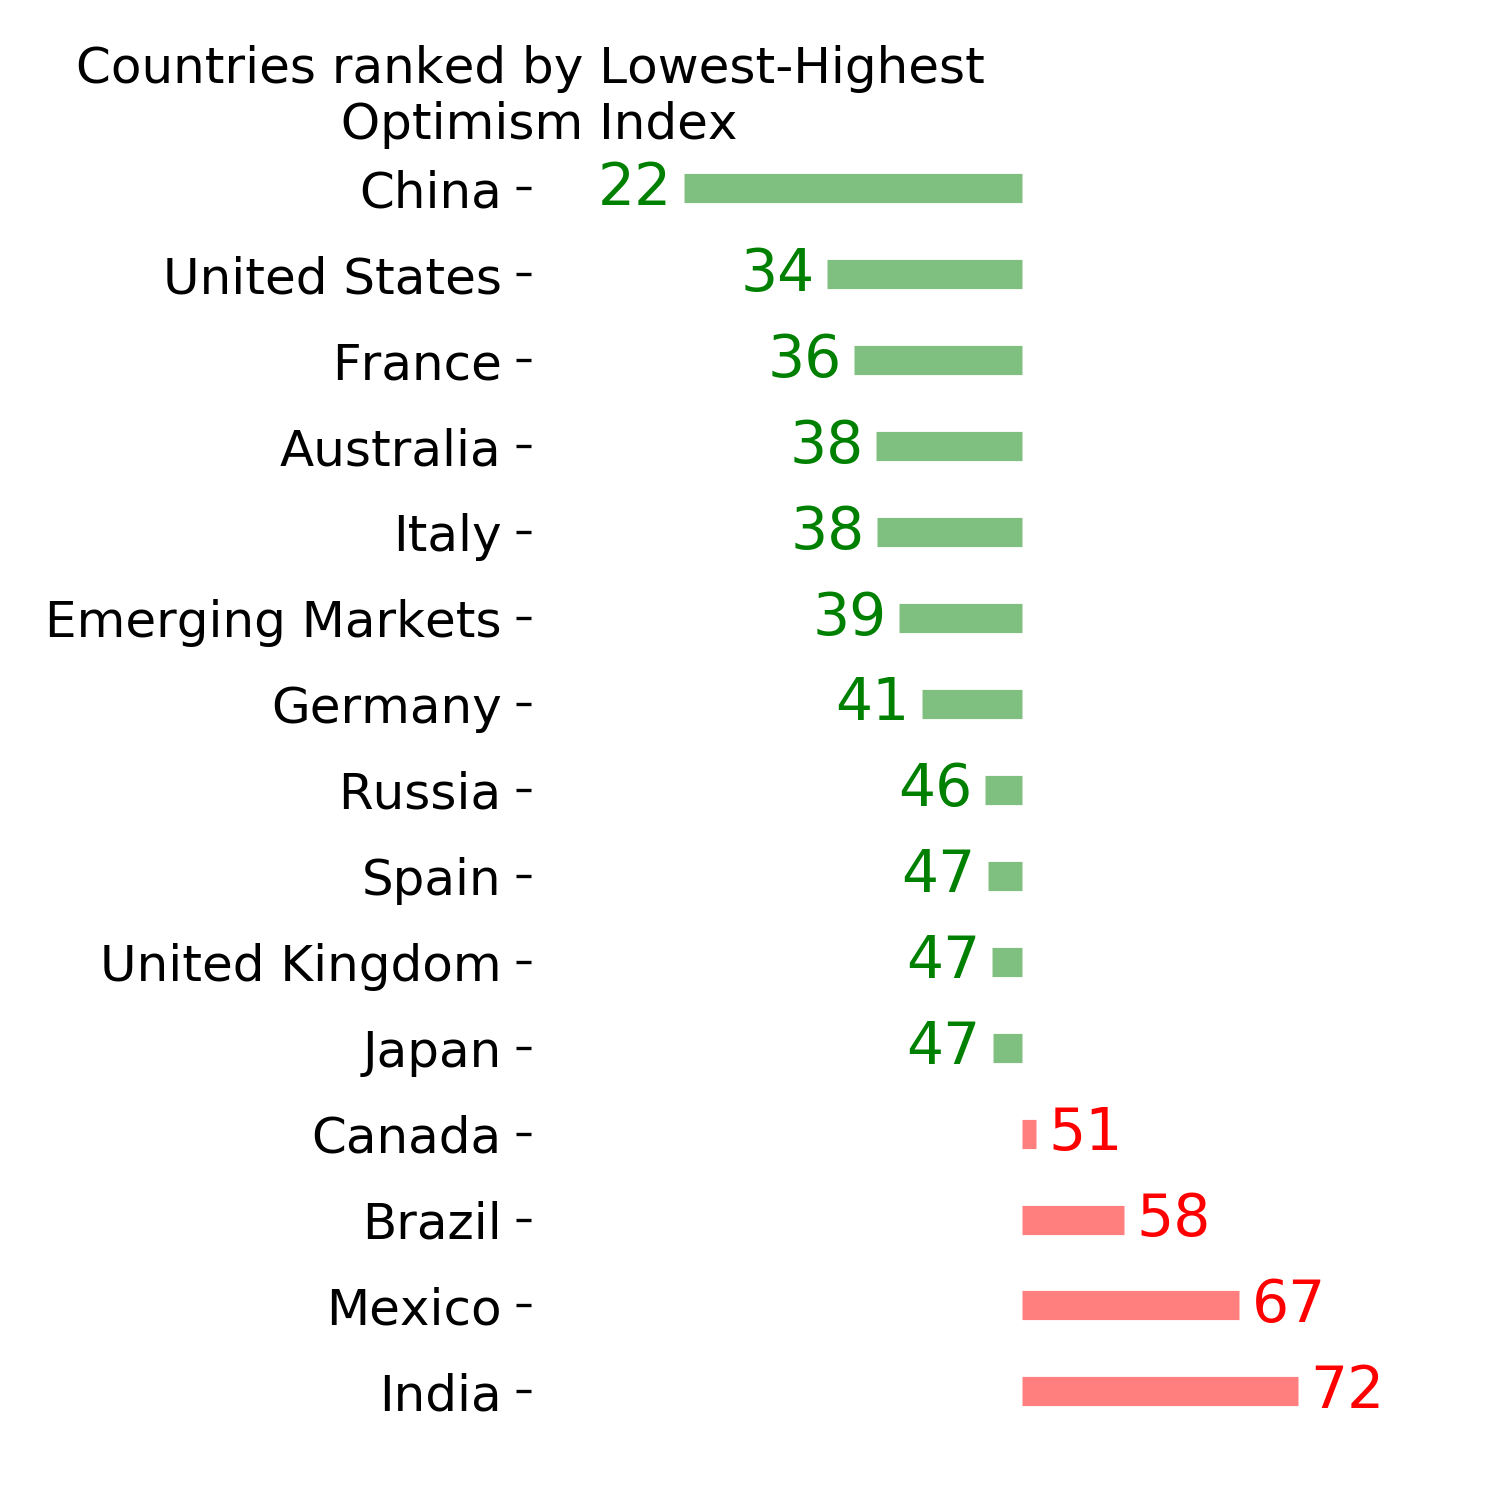
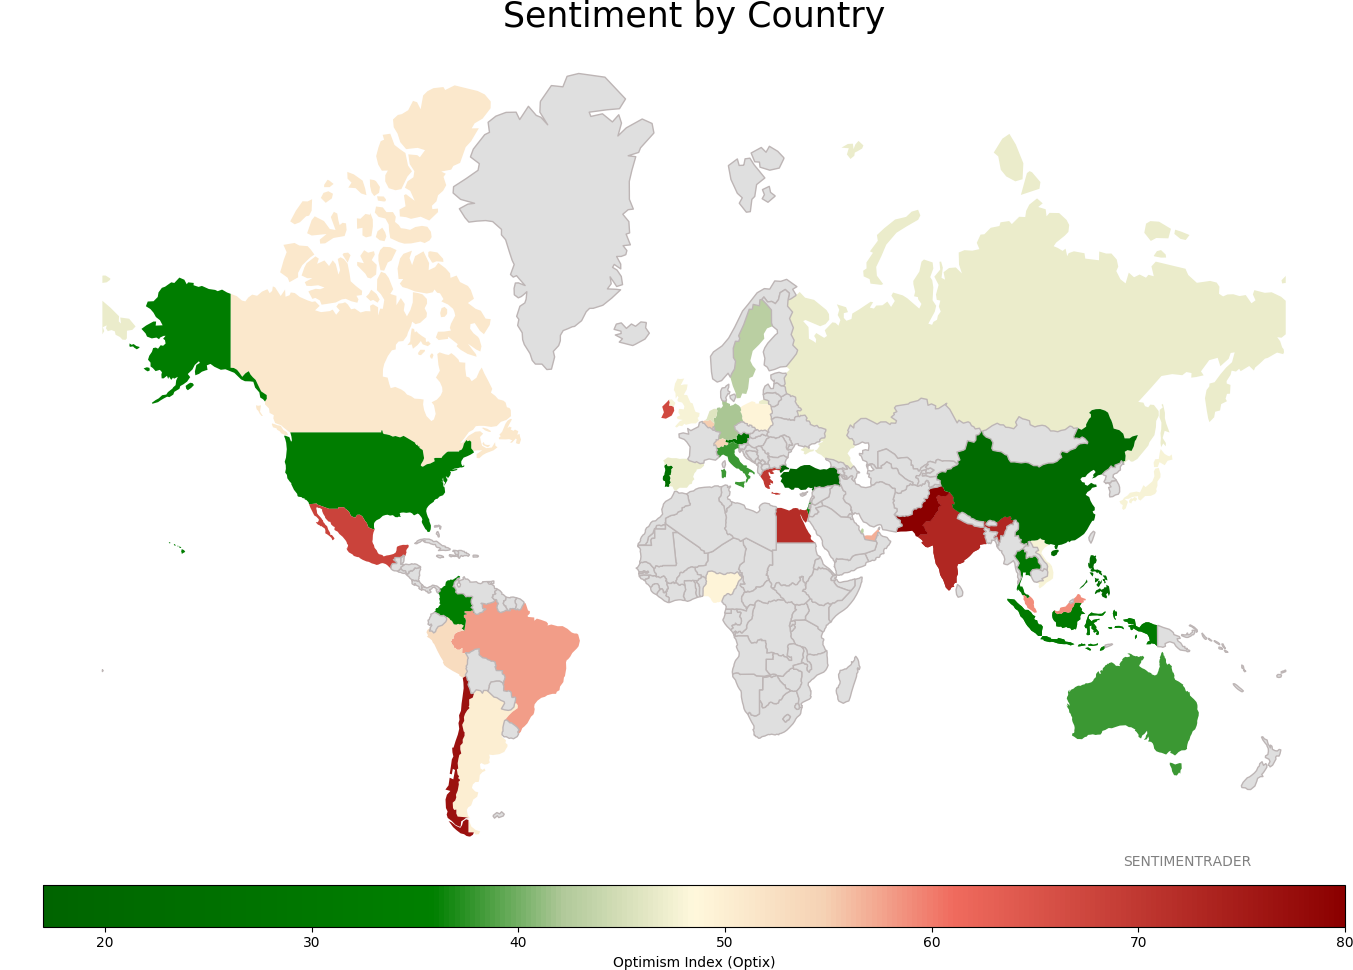
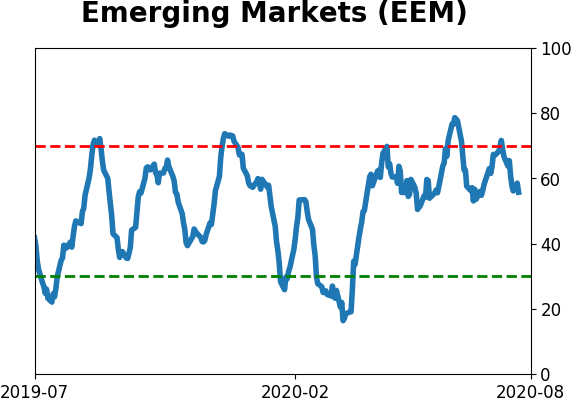
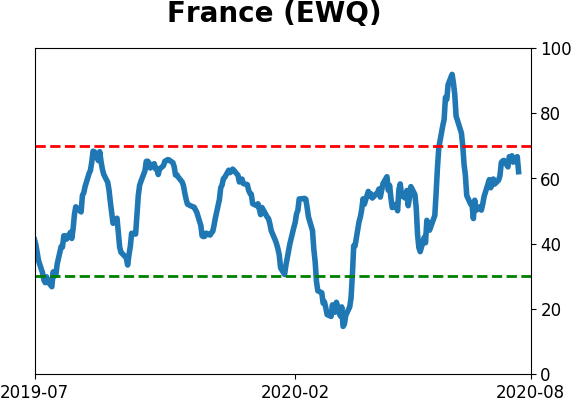
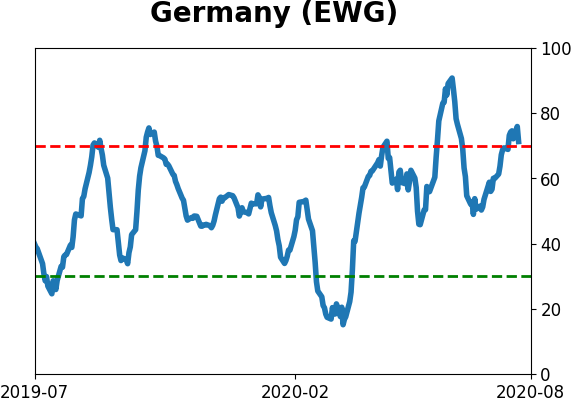
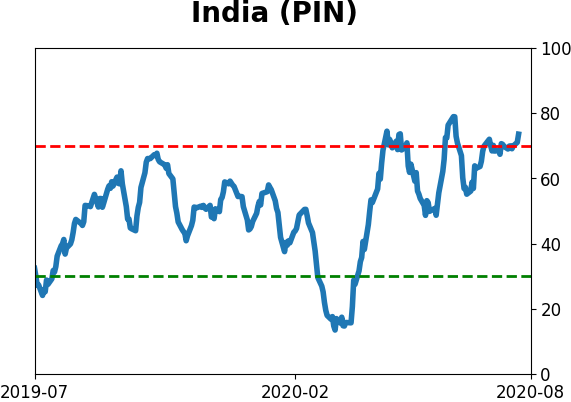
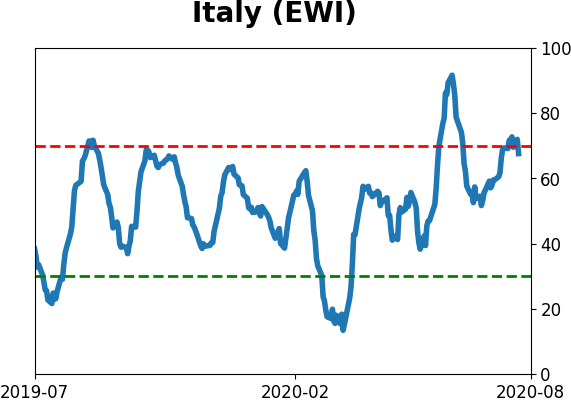
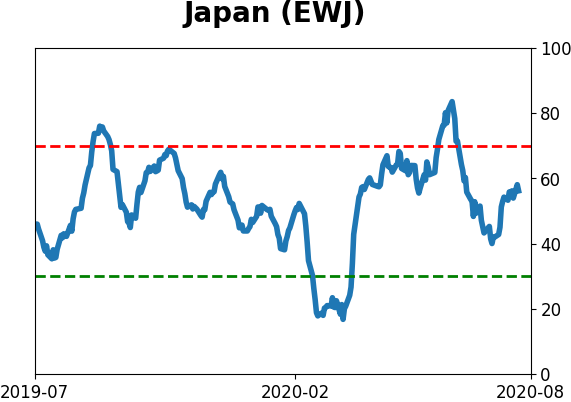
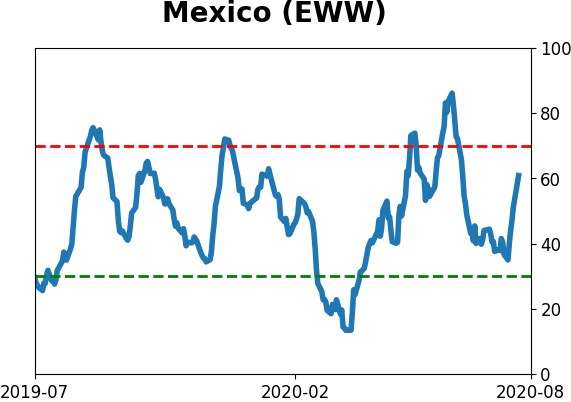
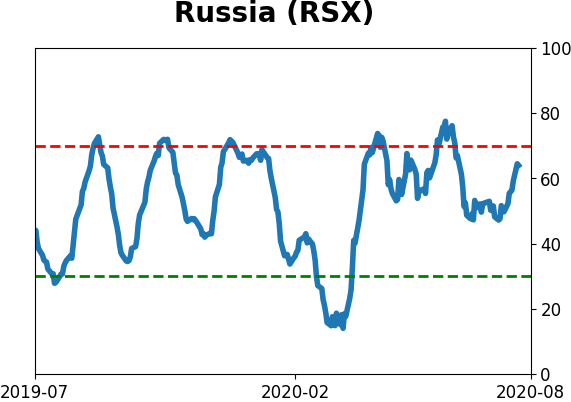
Sentiment Around The World
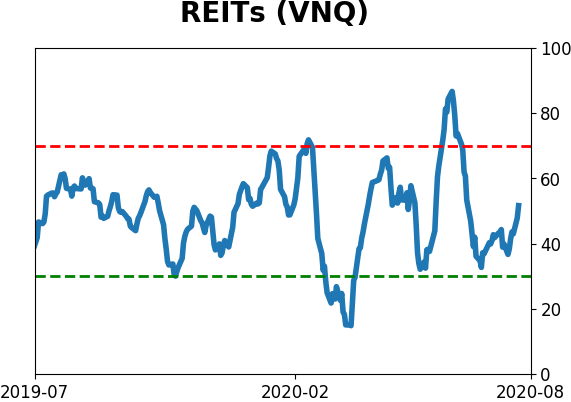
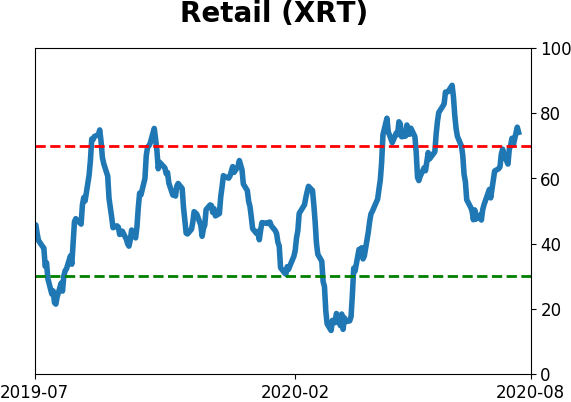
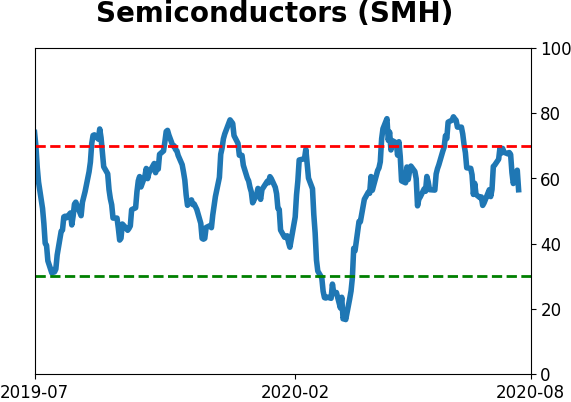
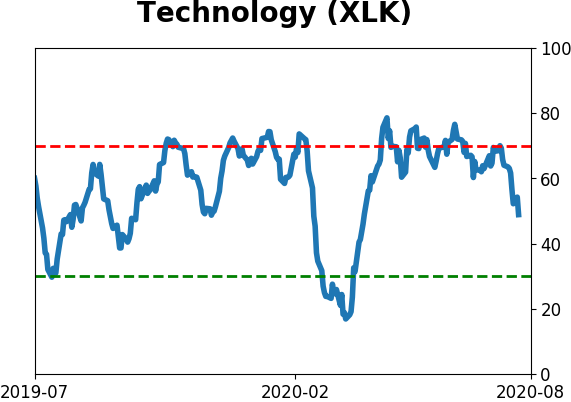
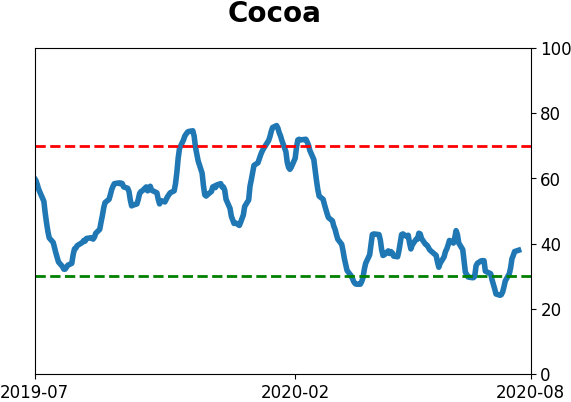
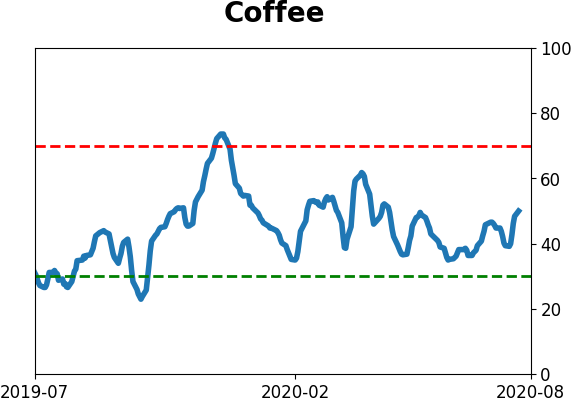
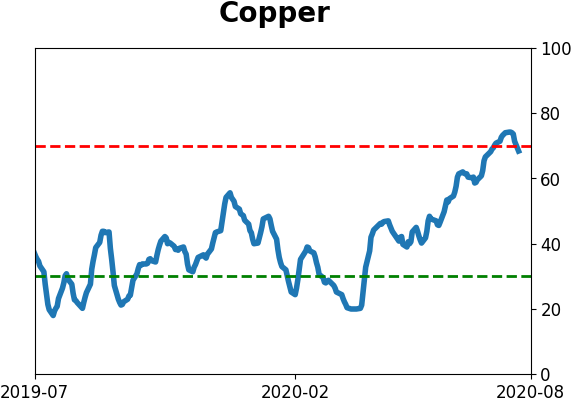
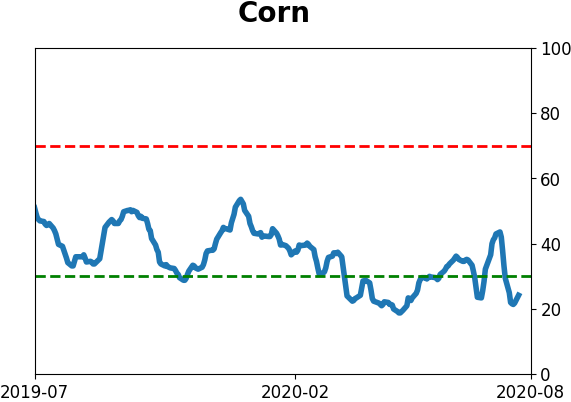
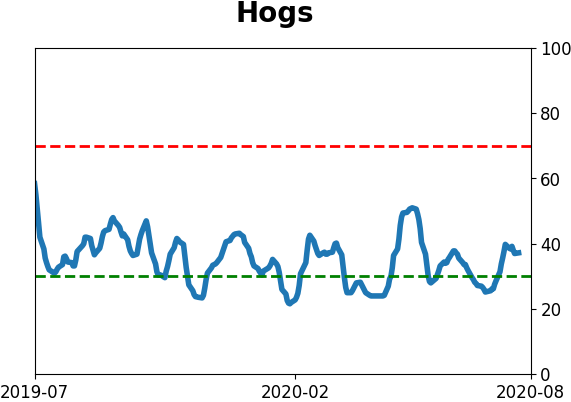
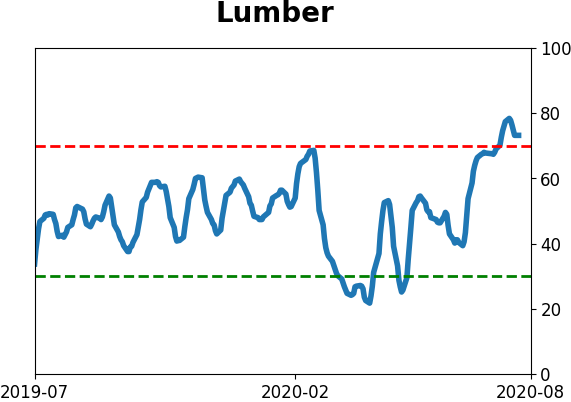
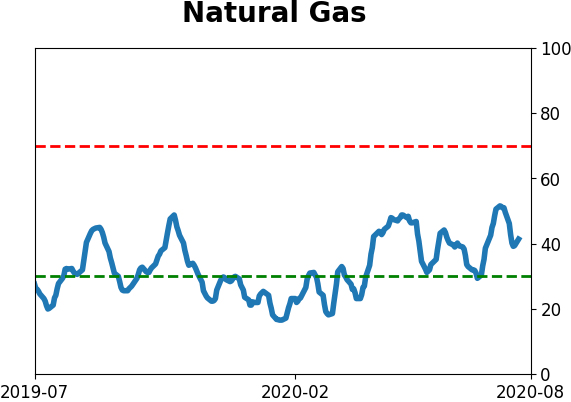
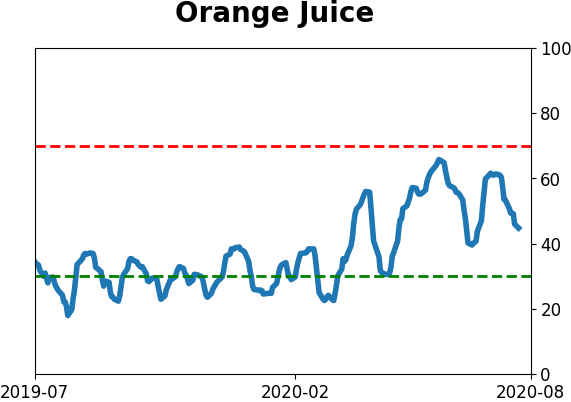
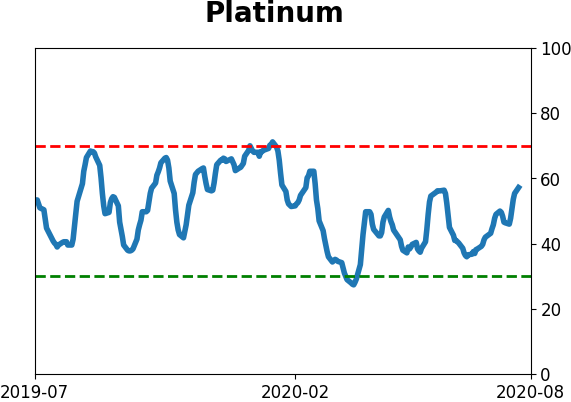
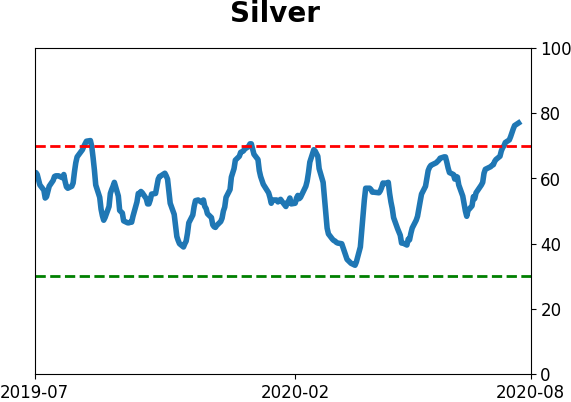
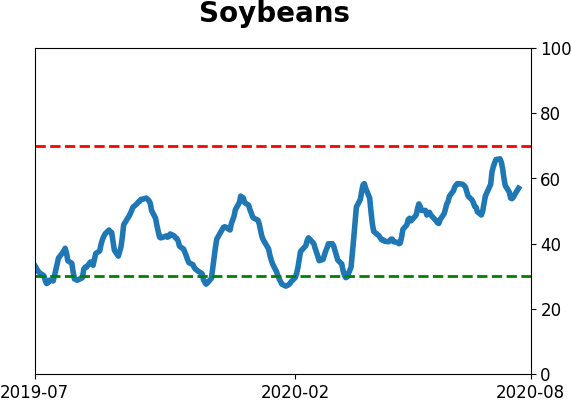
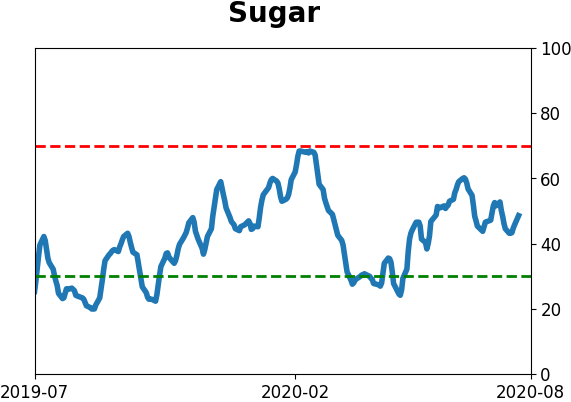
Optimism Index Thumbnails
|
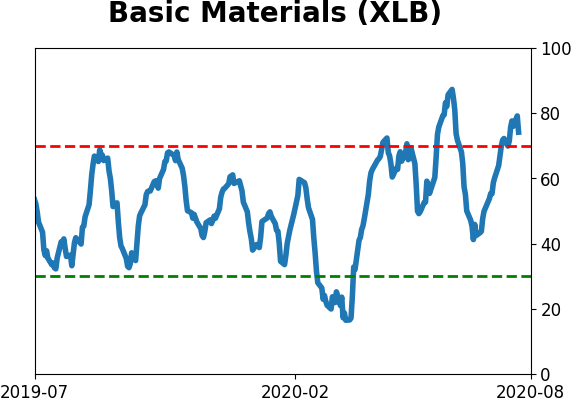
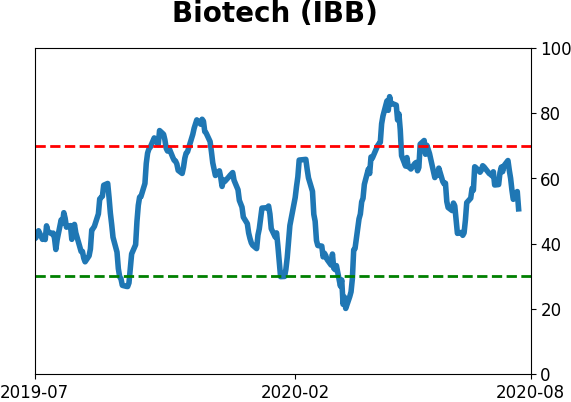
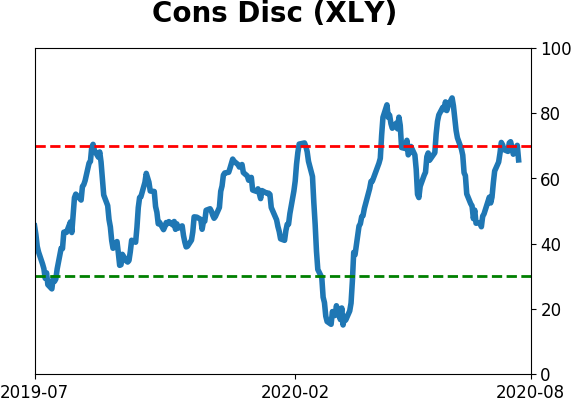
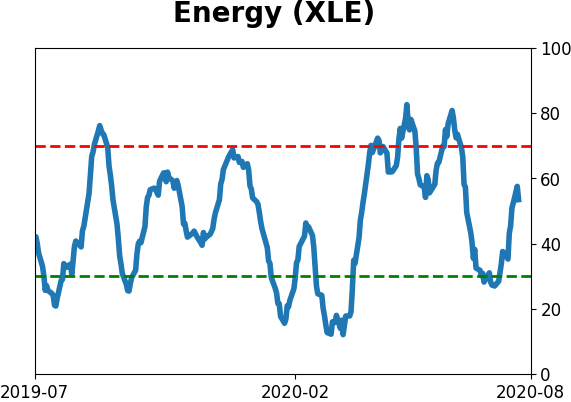
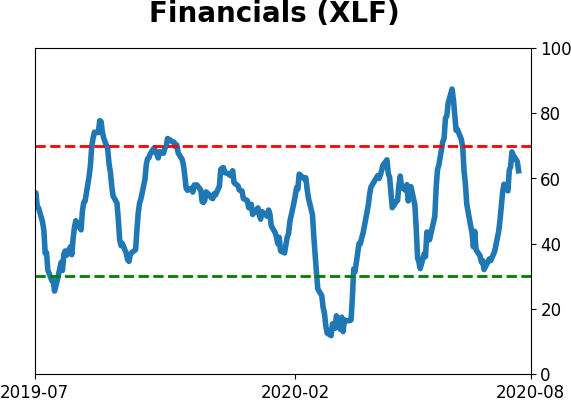
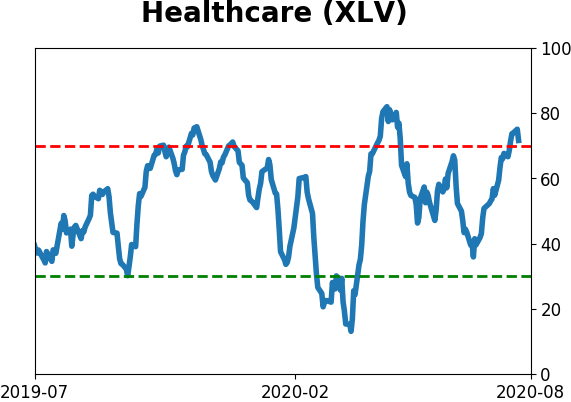
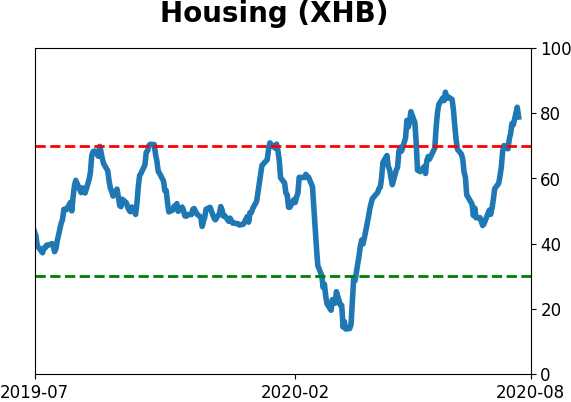
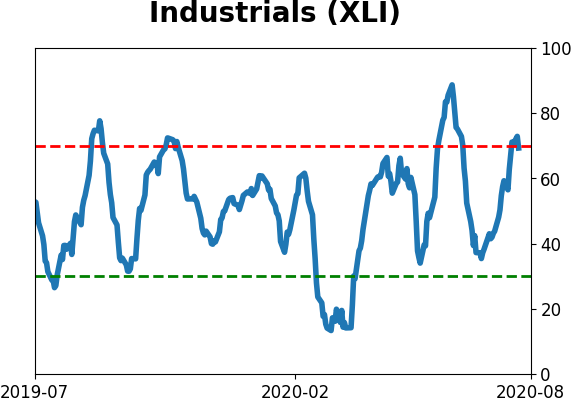
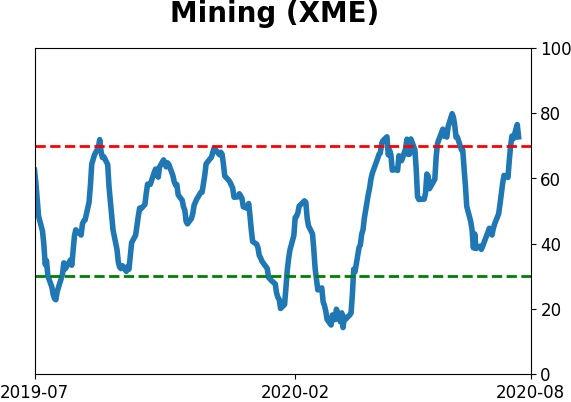
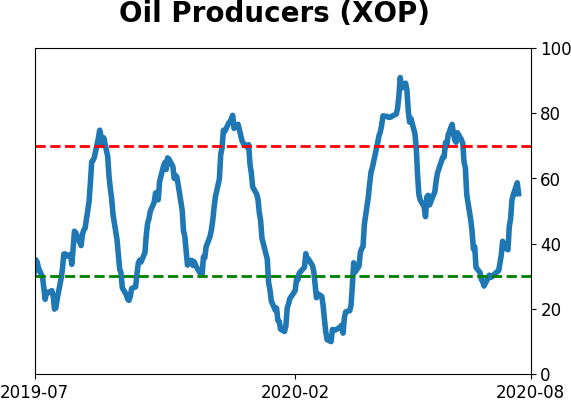
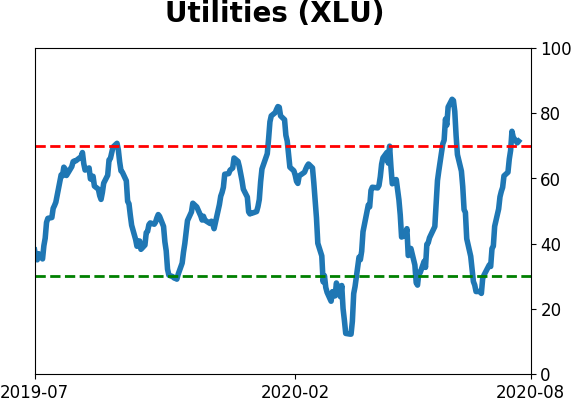
Sector ETF's - 10-Day Moving Average
|
|
|
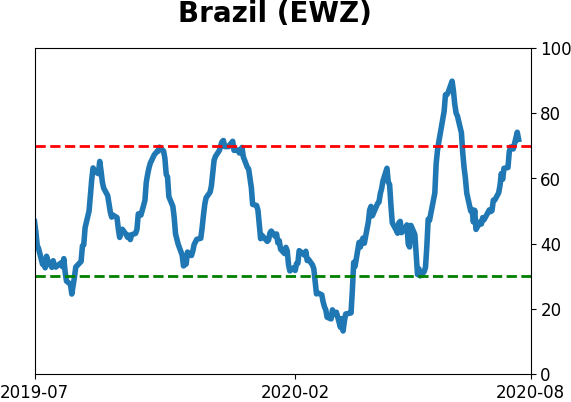
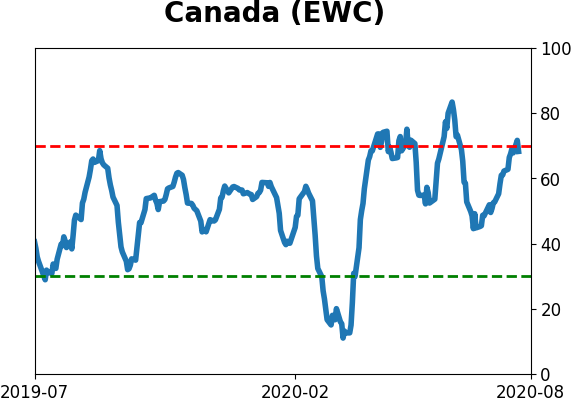
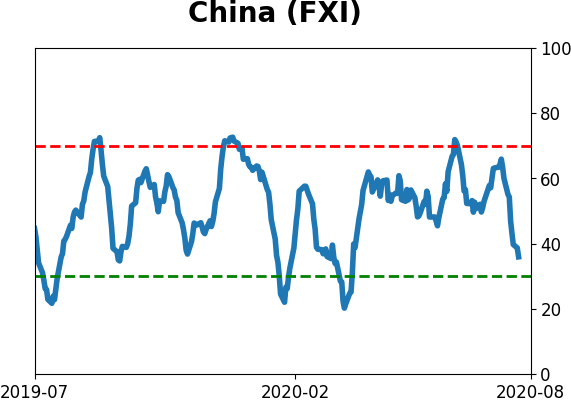
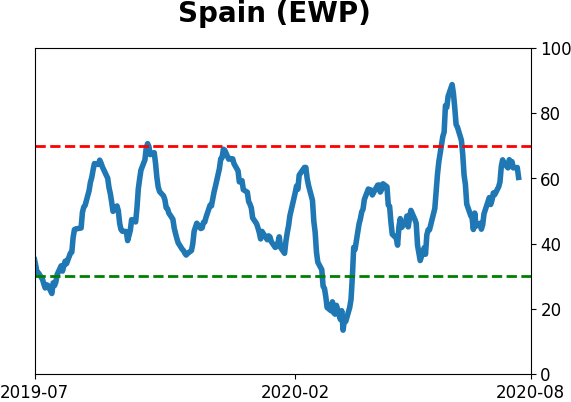
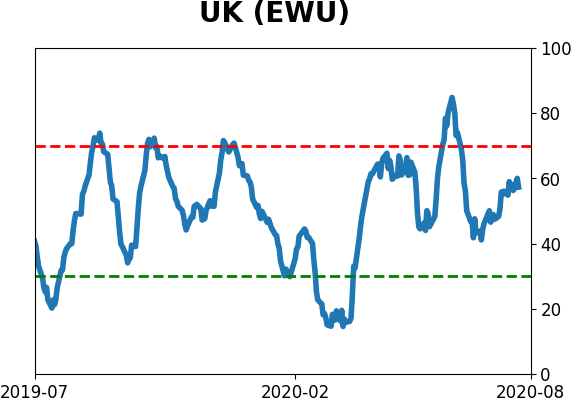
Country ETF's - 10-Day Moving Average
|
|
|
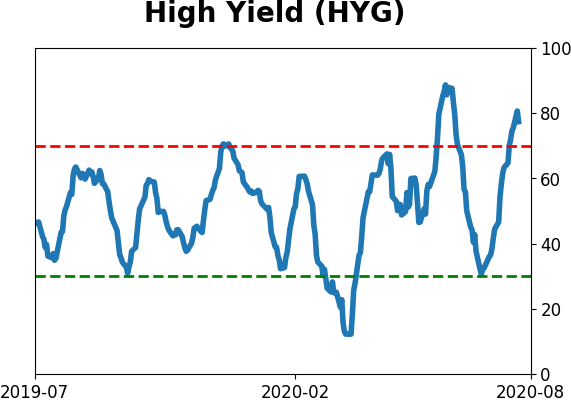
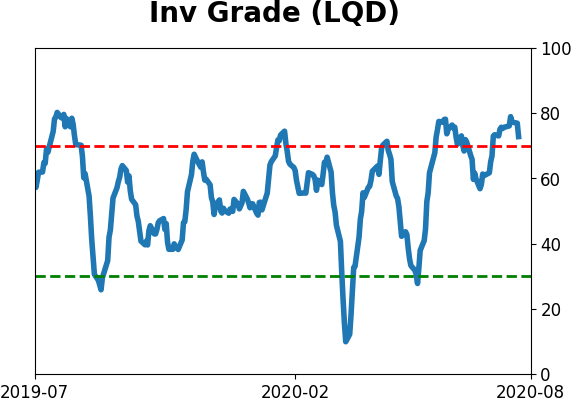
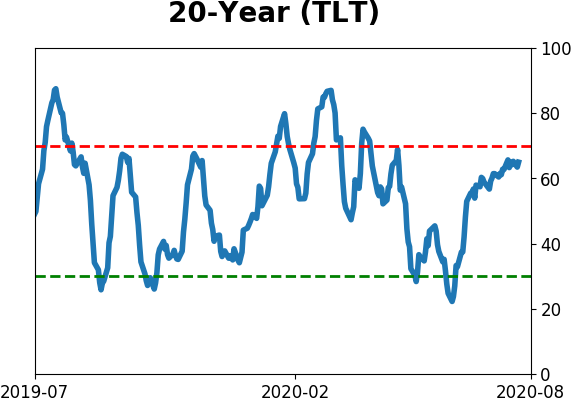
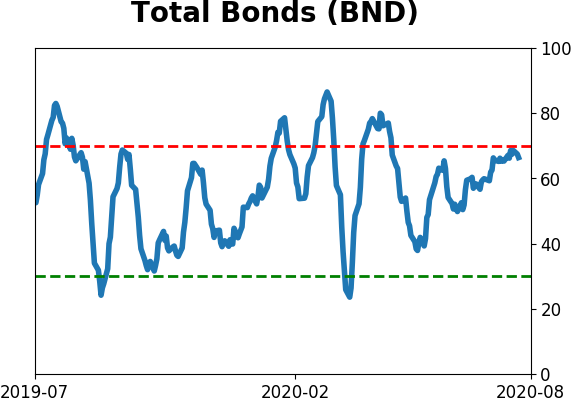
Bond ETF's - 10-Day Moving Average
|
|
|
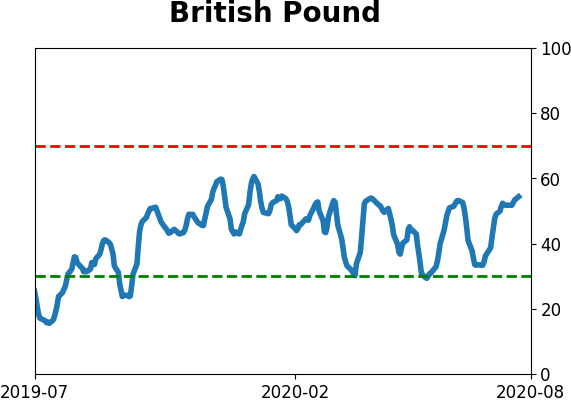
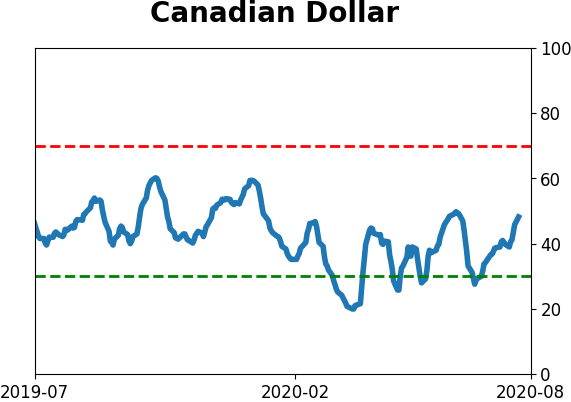
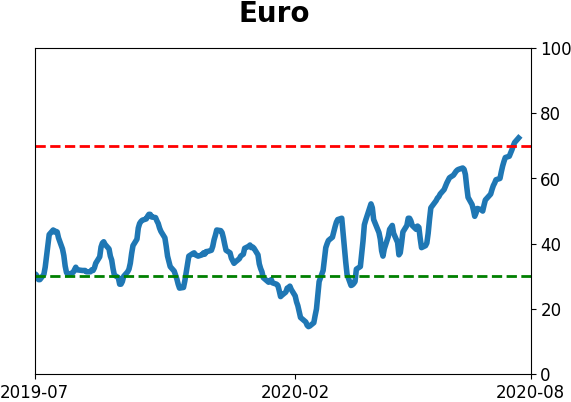
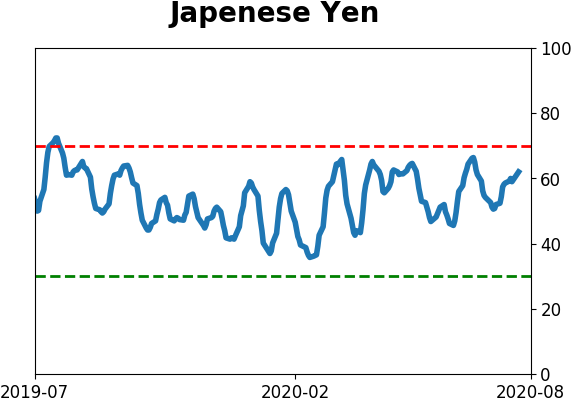
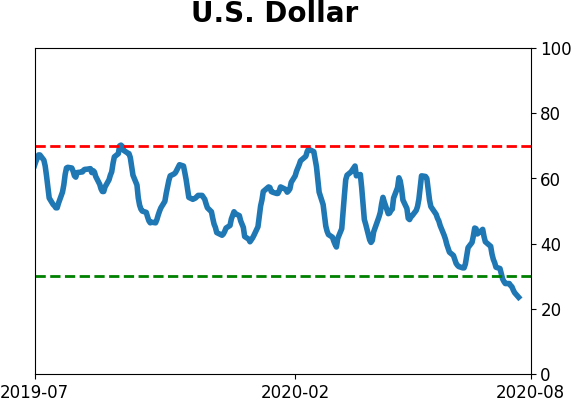
Currency ETF's - 5-Day Moving Average
|
|
|
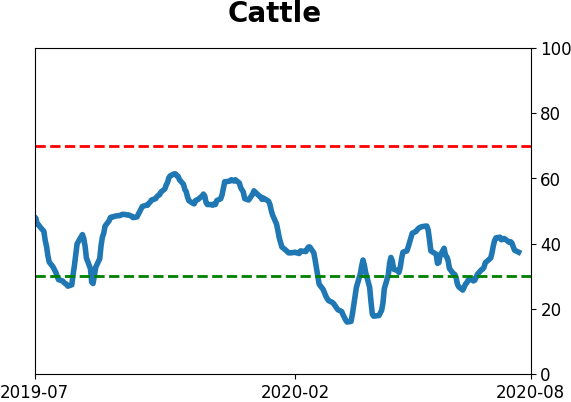
Commodity ETF's - 5-Day Moving Average
|
|