Headlines
|
|
Financials Just Slumped to a 90-Day Relative Low:
Even as the S&P 500 marched to new highs in recent days, Financial stocks have been relatively weak. A ratio of Financials to the S&P just slipped to a 90-day low. In recent years, the sector has typically made up for lost ground.
Bottom Line:
See the Outlook & Allocations page for more details on these summaries STOCKS: Hold
The speculative frenzy in February is wrung out. Internal dynamics have mostly held up, with some exceptions. Many of our studies still show a mixed to poor short-term view, with medium- and long-term ones turning more positive. BONDS: Hold
Various parts of the market got hit in March, with the lowest Bond Optimism Index we usually see during healthy environments. After a shaky couple of weeks, the broad bond market has modestly recovered. Not a big edge here either way. GOLD: Hold
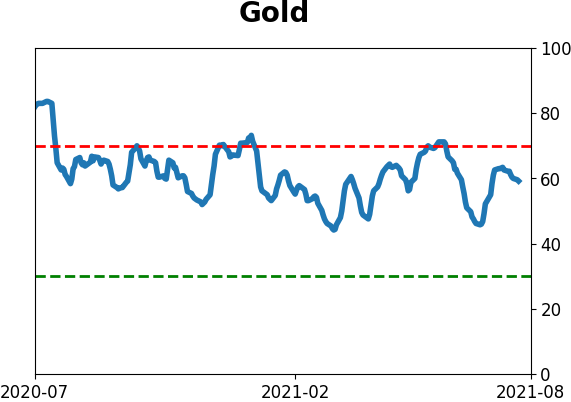
Gold and miners have done very well, recovering above long-term trend lines. The issue is that both have tended to perform poorly after similar situations - will have to wait and see how it plays out.
|
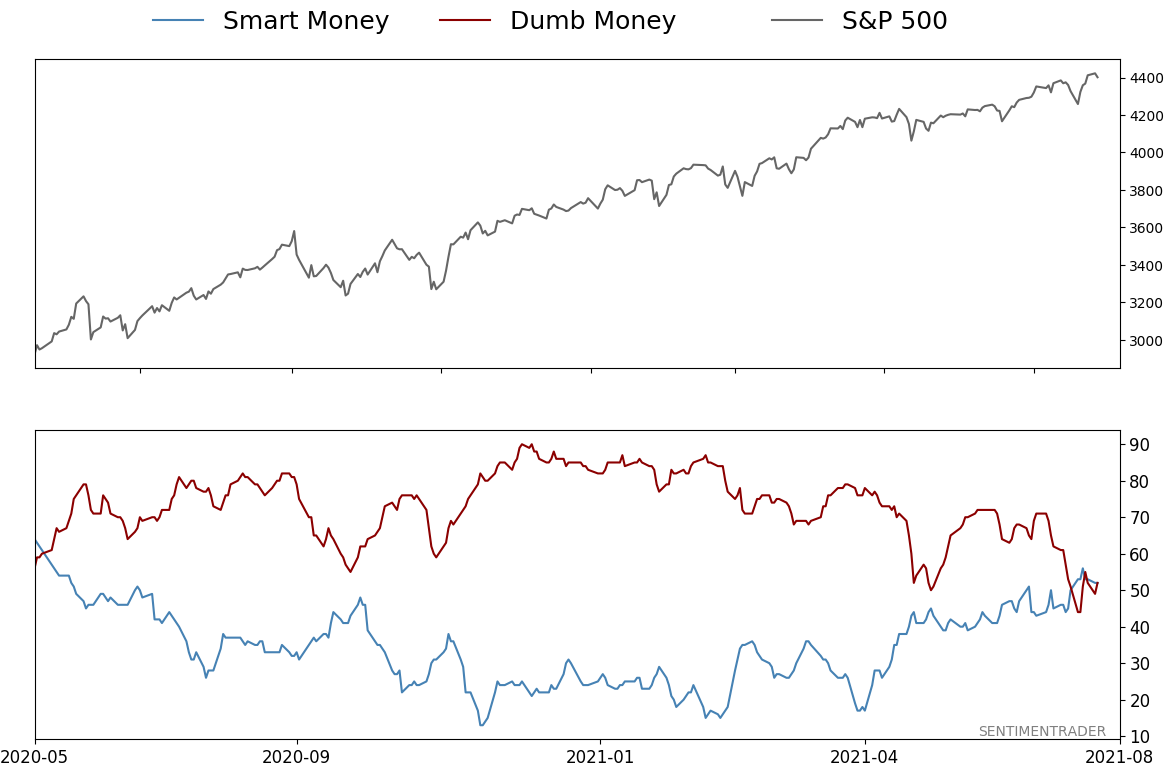
Smart / Dumb Money Confidence
|
Smart Money Confidence: 52%
Dumb Money Confidence: 52%
|
|
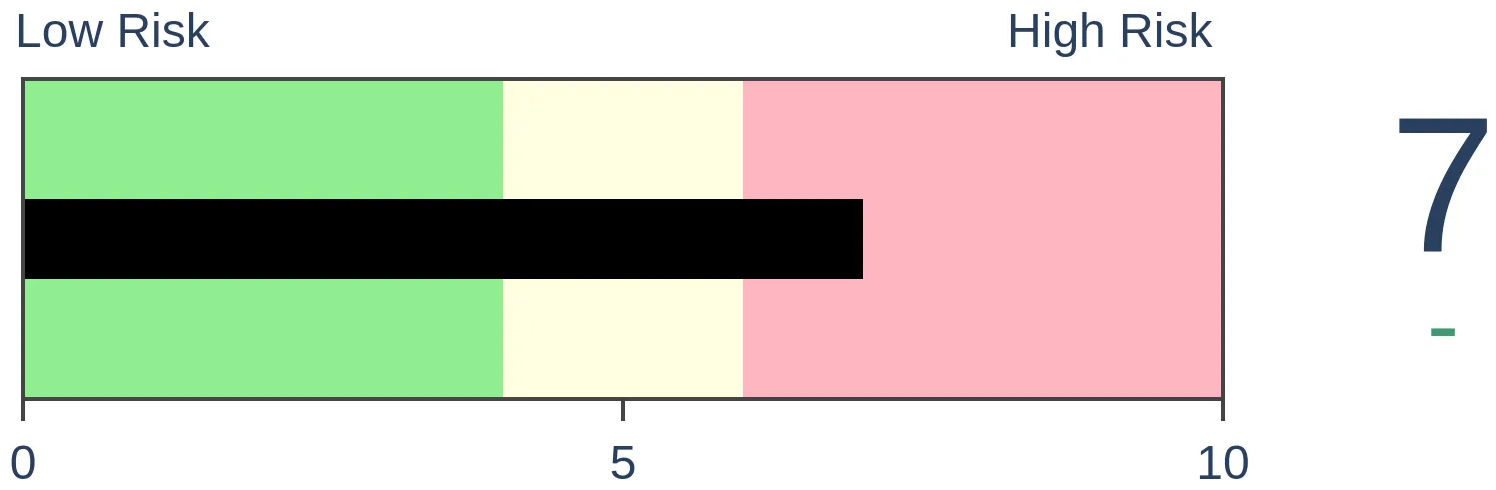
Risk Levels
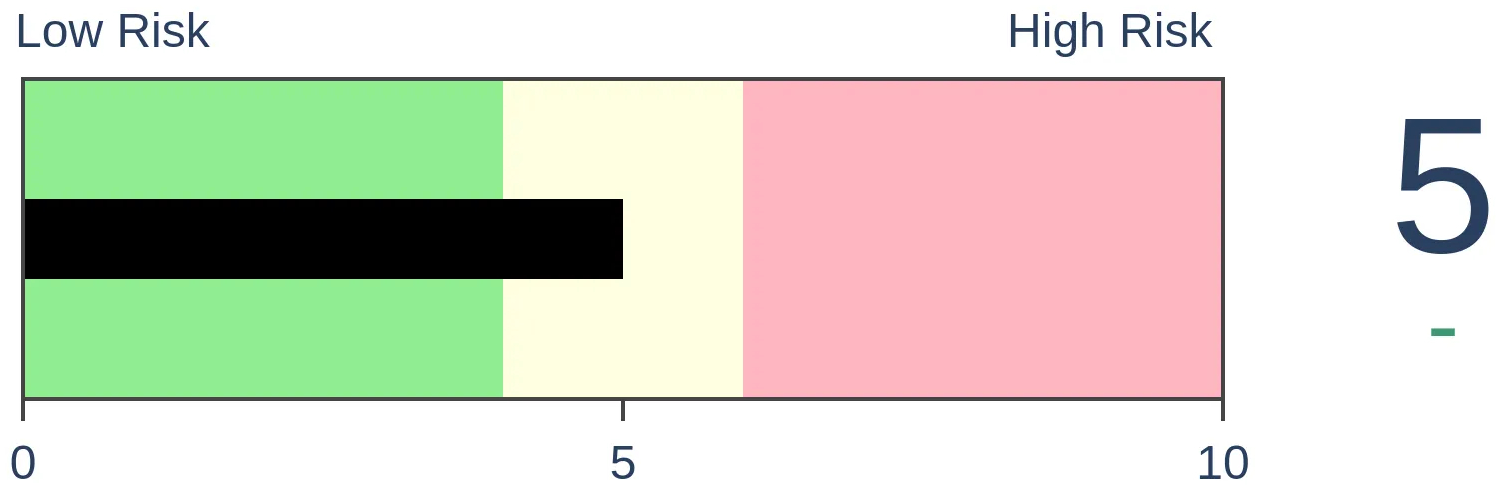
Stocks Short-Term
|
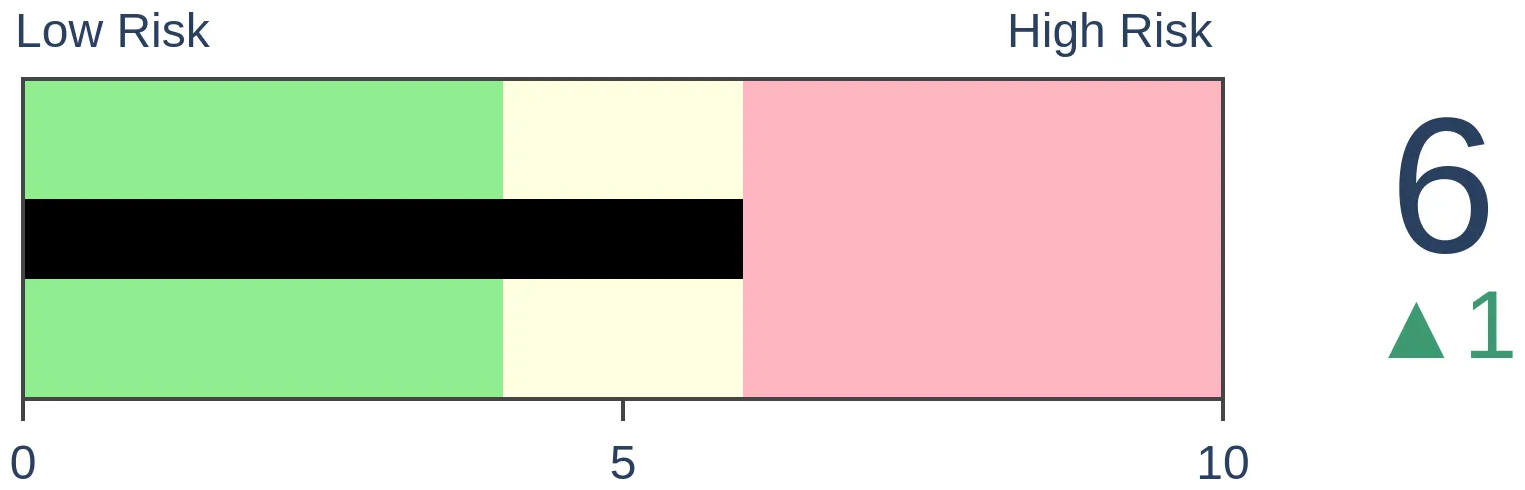
Stocks Medium-Term
|
|
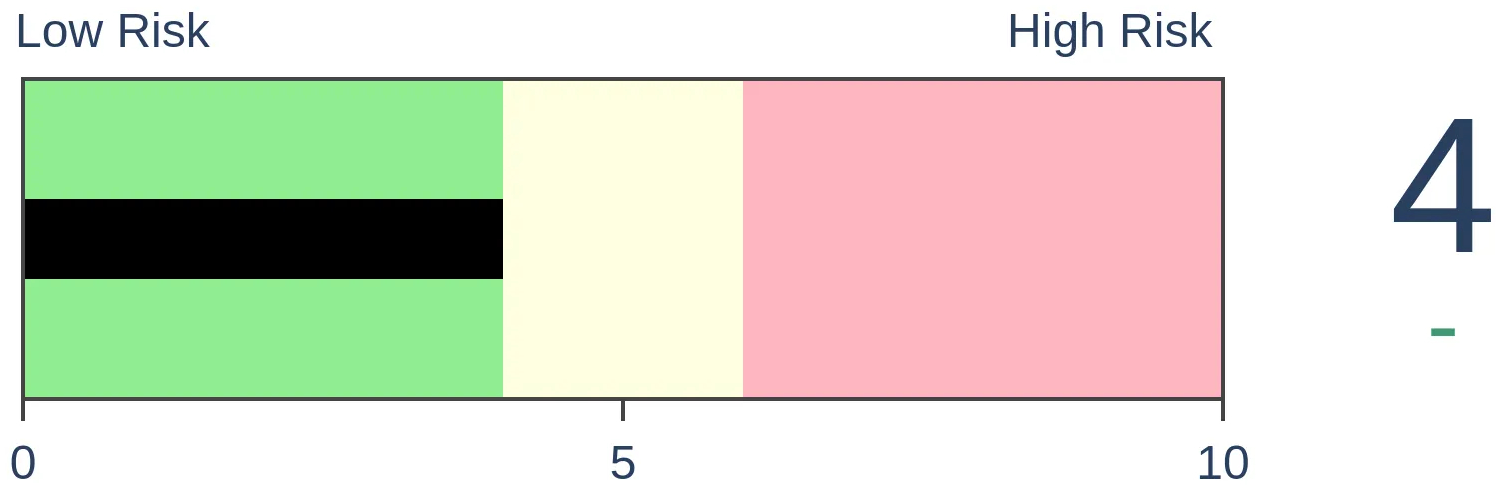
Bonds
|
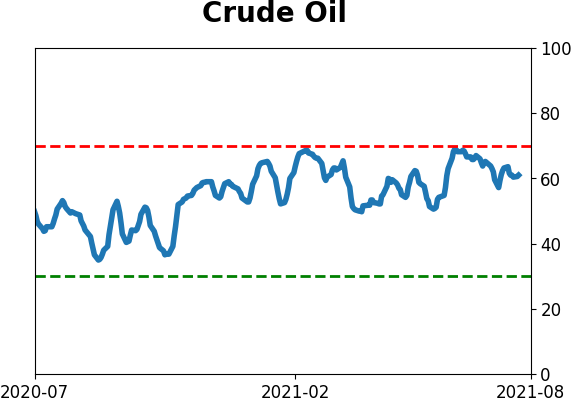
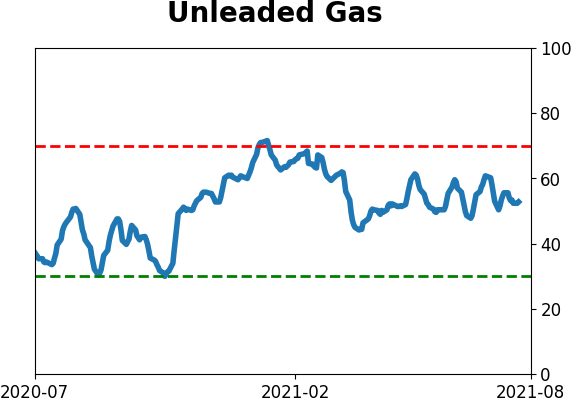
Crude Oil

|
|
Gold

|
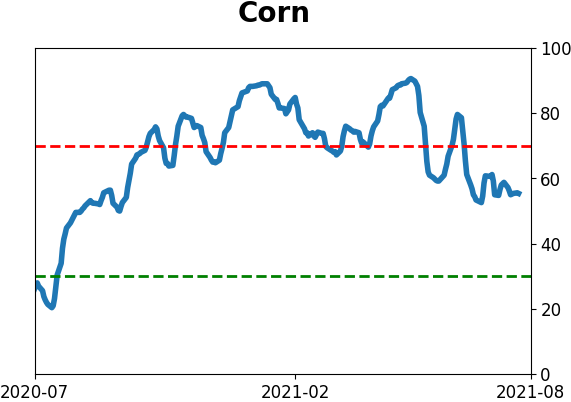
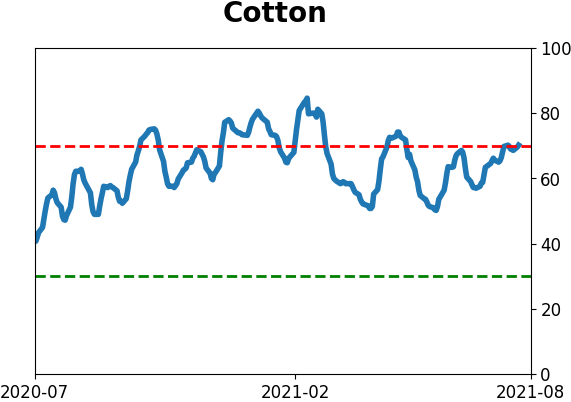
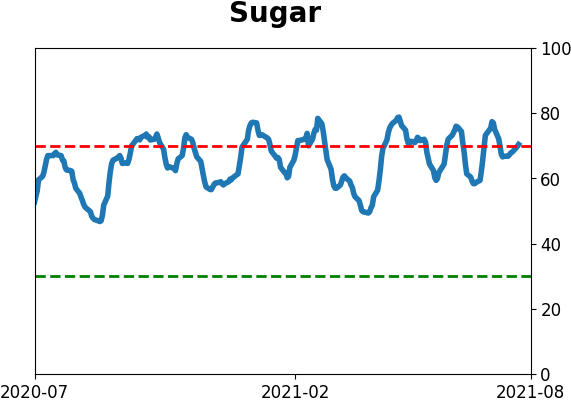
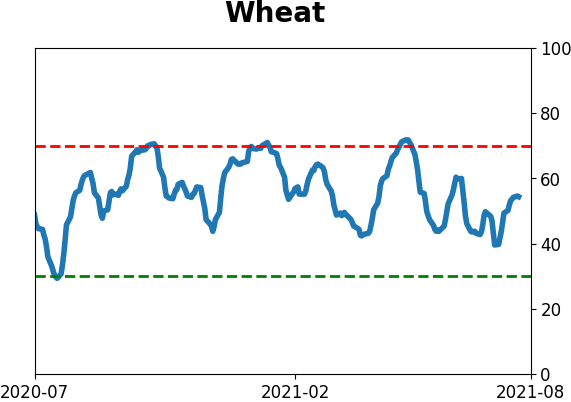
Agriculture
|
|
Research
By Jason Goepfert
BOTTOM LINE
Even as the S&P 500 marched to new highs in recent days, Financial stocks have been relatively weak. A ratio of Financials to the S&P just slipped to a 90-day low. In recent years, the sector has typically made up for lost ground.
FORECAST / TIMEFRAME
None
|
Small-Cap stocks aren't the only ones struggling to keep up with the S&P 500's torrid pace.
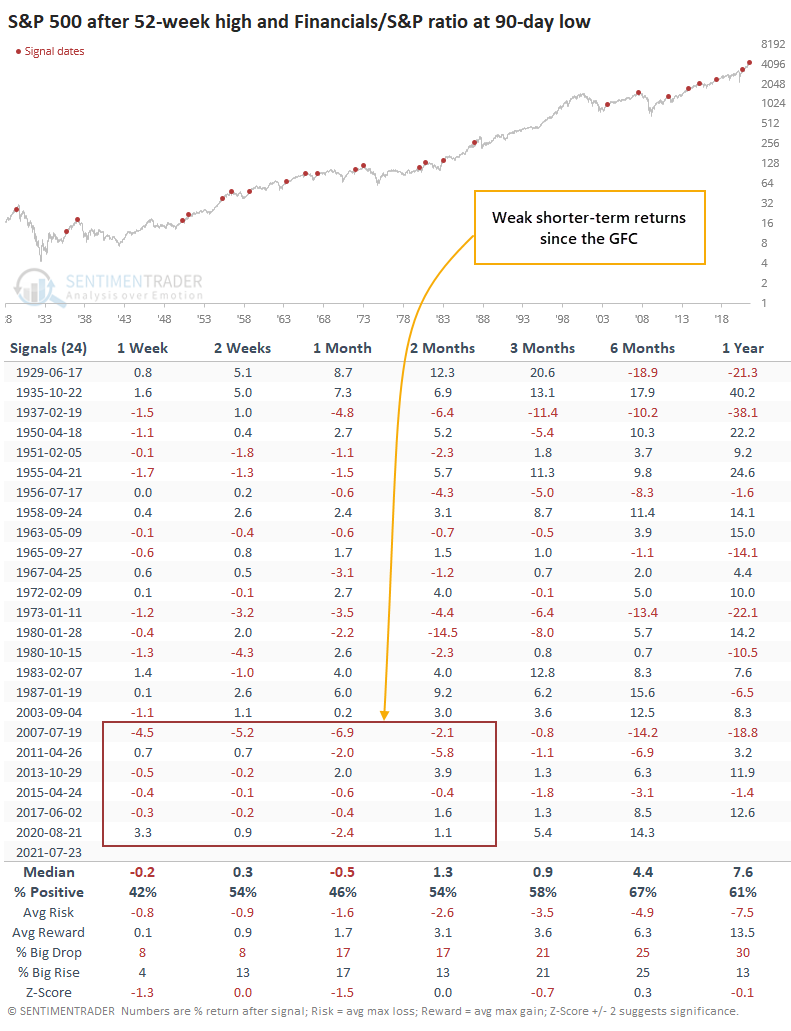
Financial stocks have been lagging, too, going more than 30 days without setting a fresh high. Even more notably, the ratio of Financials to the S&P 500 just sagged to its lowest point in more than 90 days. The last time the two diverged to this wide of a degree was last August.
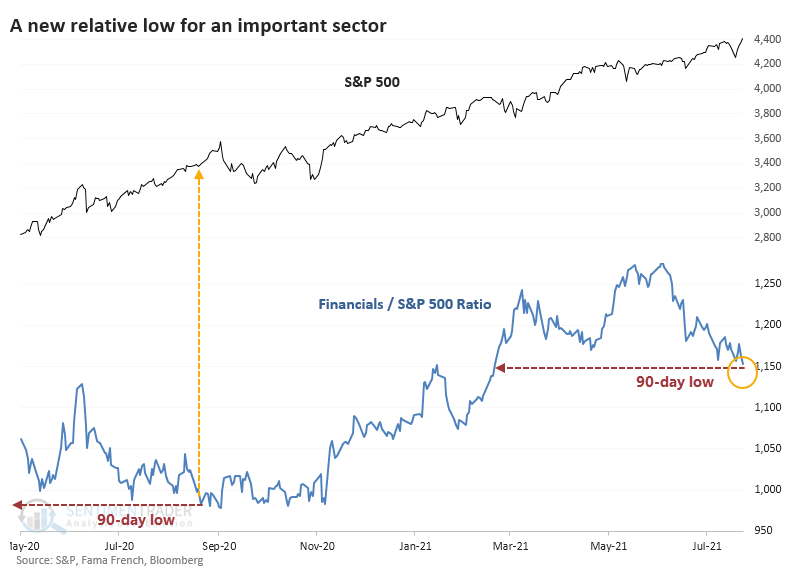
After that bout of relative weakness, it bled into the broader market, and the S&P ended up following Financials lower. Since the Great Financial Crisis in 2007-08, this kind of relative divergence has preceded weakness in the S&P each time over the next 2-4 weeks.
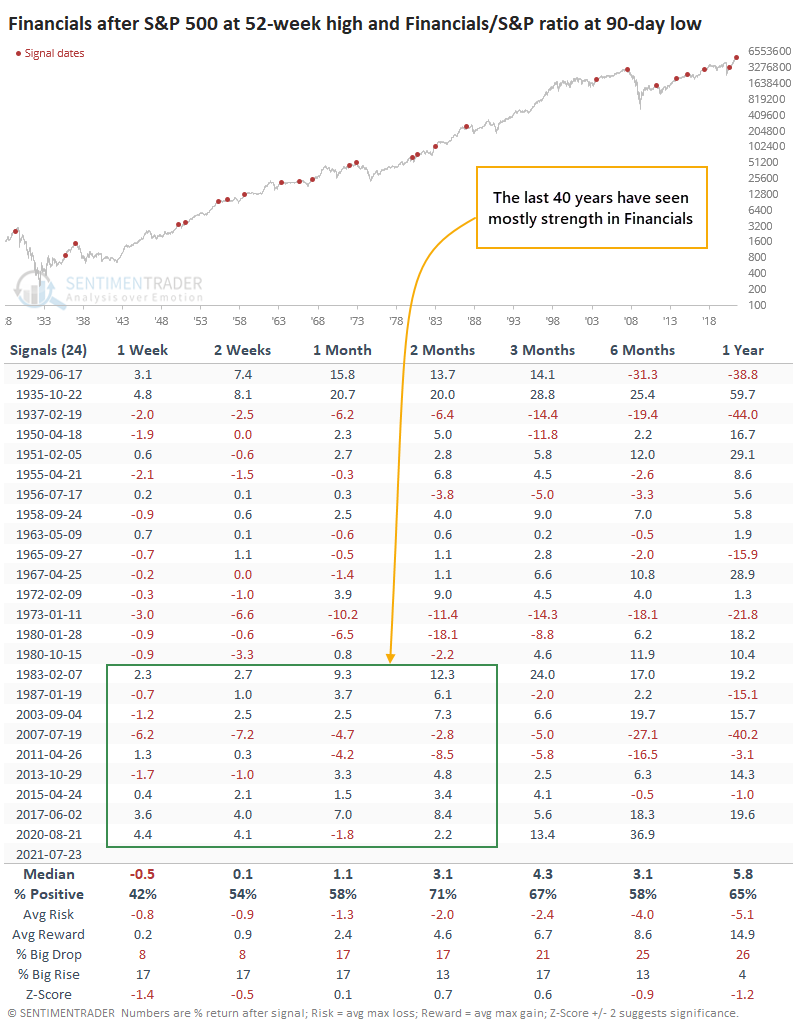
We've all been taught to buy the strongest groups and sell the weakest ones, and generally, that's probably good advice. In this particular situation, though, Financials tended to rebound quite strongly during the past four decades.
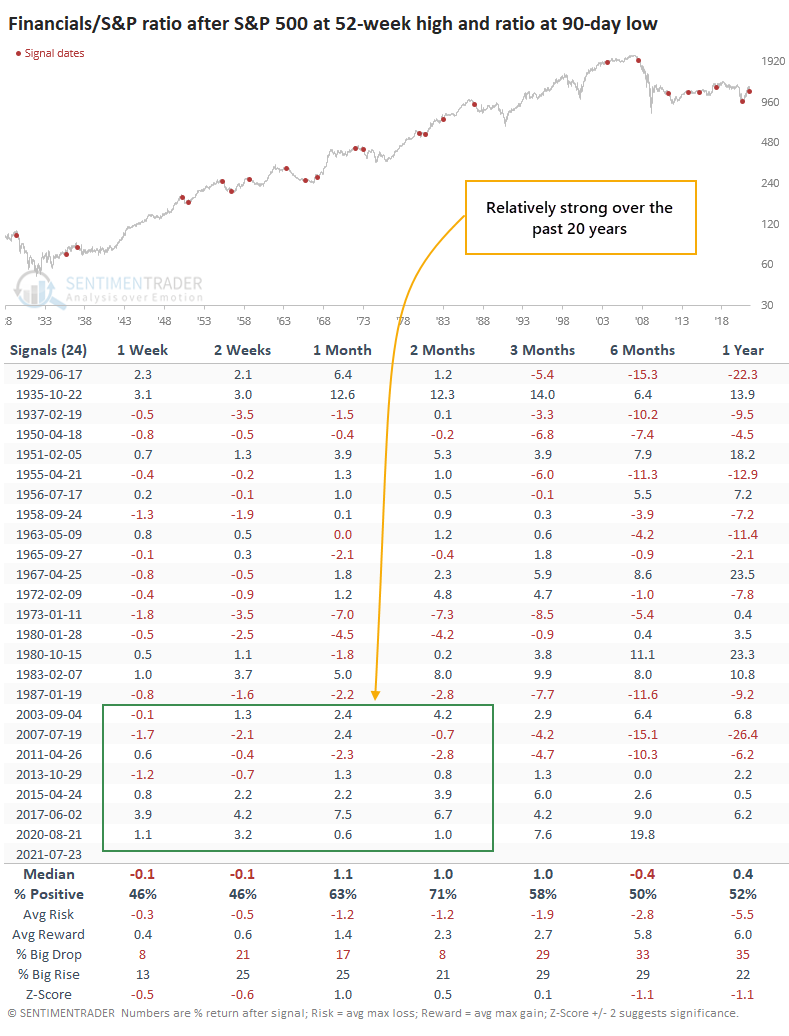
Relative to one another, Financials mostly outperformed after the very short-term. During the past 20 years, Financials outpaced the S&P during the next month after 6 out of 7 signals. The medium-term time frame of 1-3 months saw the biggest outperformance.
Ideally, bulls would see sectors, industries, and individual stocks mostly trading in line with major indexes like the S&P 500. That has been shaky in recent weeks, and that's a warning, though the overwhelming buying pressure mid-week last week alleviates some of that concern. If we focus specifically on the relative weakness in Financials, it has been a worry for the broader market over the past decade, but wasn't consistent prior to that. For Financials specifically, it has been more of a good sign than bad for the current generation of investors.
Active Studies
| Time Frame | Bullish | Bearish | | Short-Term | 0 | 4 | | Medium-Term | 4 | 3 | | Long-Term | 10 | 5 |
|
Indicators at Extremes
Portfolio
| Position | Description | Weight % | Added / Reduced | Date | | Stocks | RSP | 4.1 | Added 4.1% | 2021-05-19 | | Bonds | 23.9% BND, 6.9% SCHP | 30.7 | Reduced 7.1% | 2021-05-19 | | Commodities | GCC | 2.6 | Reduced 2.1%
| 2020-09-04 | | Precious Metals | GDX | 5.6 | Reduced 4.2% | 2021-05-19 | | Special Situations | 4.3% XLE, 2.2% PSCE | 7.6 | Reduced 5.6% | 2021-04-22 | | Cash | | 49.4 | | |
|
Updates (Changes made today are underlined)
Much of our momentum and trend work has remained positive for several months, with some scattered exceptions. Almost all sentiment-related work has shown a poor risk/reward ratio for stocks, especially as speculation drove to record highs in exuberance in February. Much of that has worn off, and most of our models are back toward neutral levels. There isn't much to be excited about here. The same goes for bonds and even gold. Gold has been performing well lately and is back above long-term trend lines. The issue is that it has a poor record of holding onto gains when attempting a long-term trend change like this, so we'll take a wait-and-see approach. RETURN YTD: 9.1% 2020: 8.1%, 2019: 12.6%, 2018: 0.6%, 2017: 3.8%, 2016: 17.1%, 2015: 9.2%, 2014: 14.5%, 2013: 2.2%, 2012: 10.8%, 2011: 16.5%, 2010: 15.3%, 2009: 23.9%, 2008: 16.2%, 2007: 7.8%
|
|
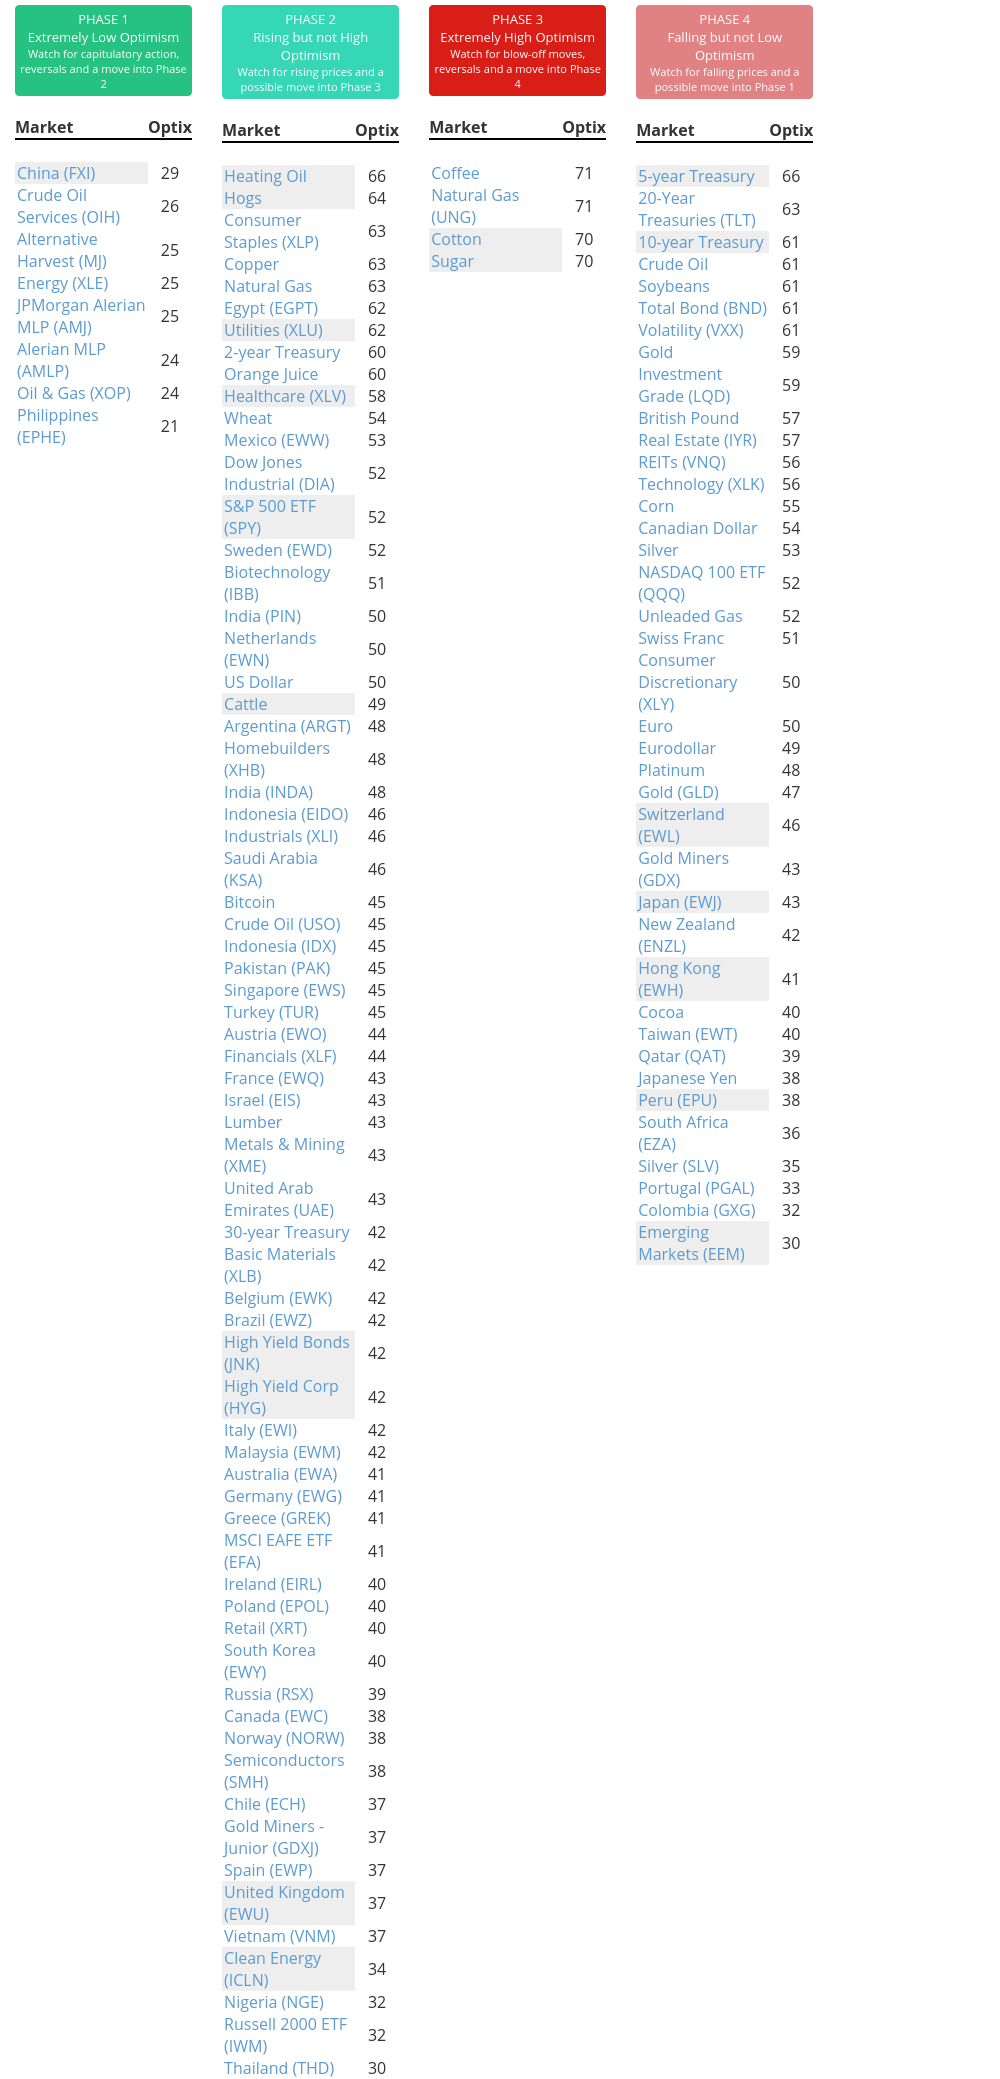
Phase Table
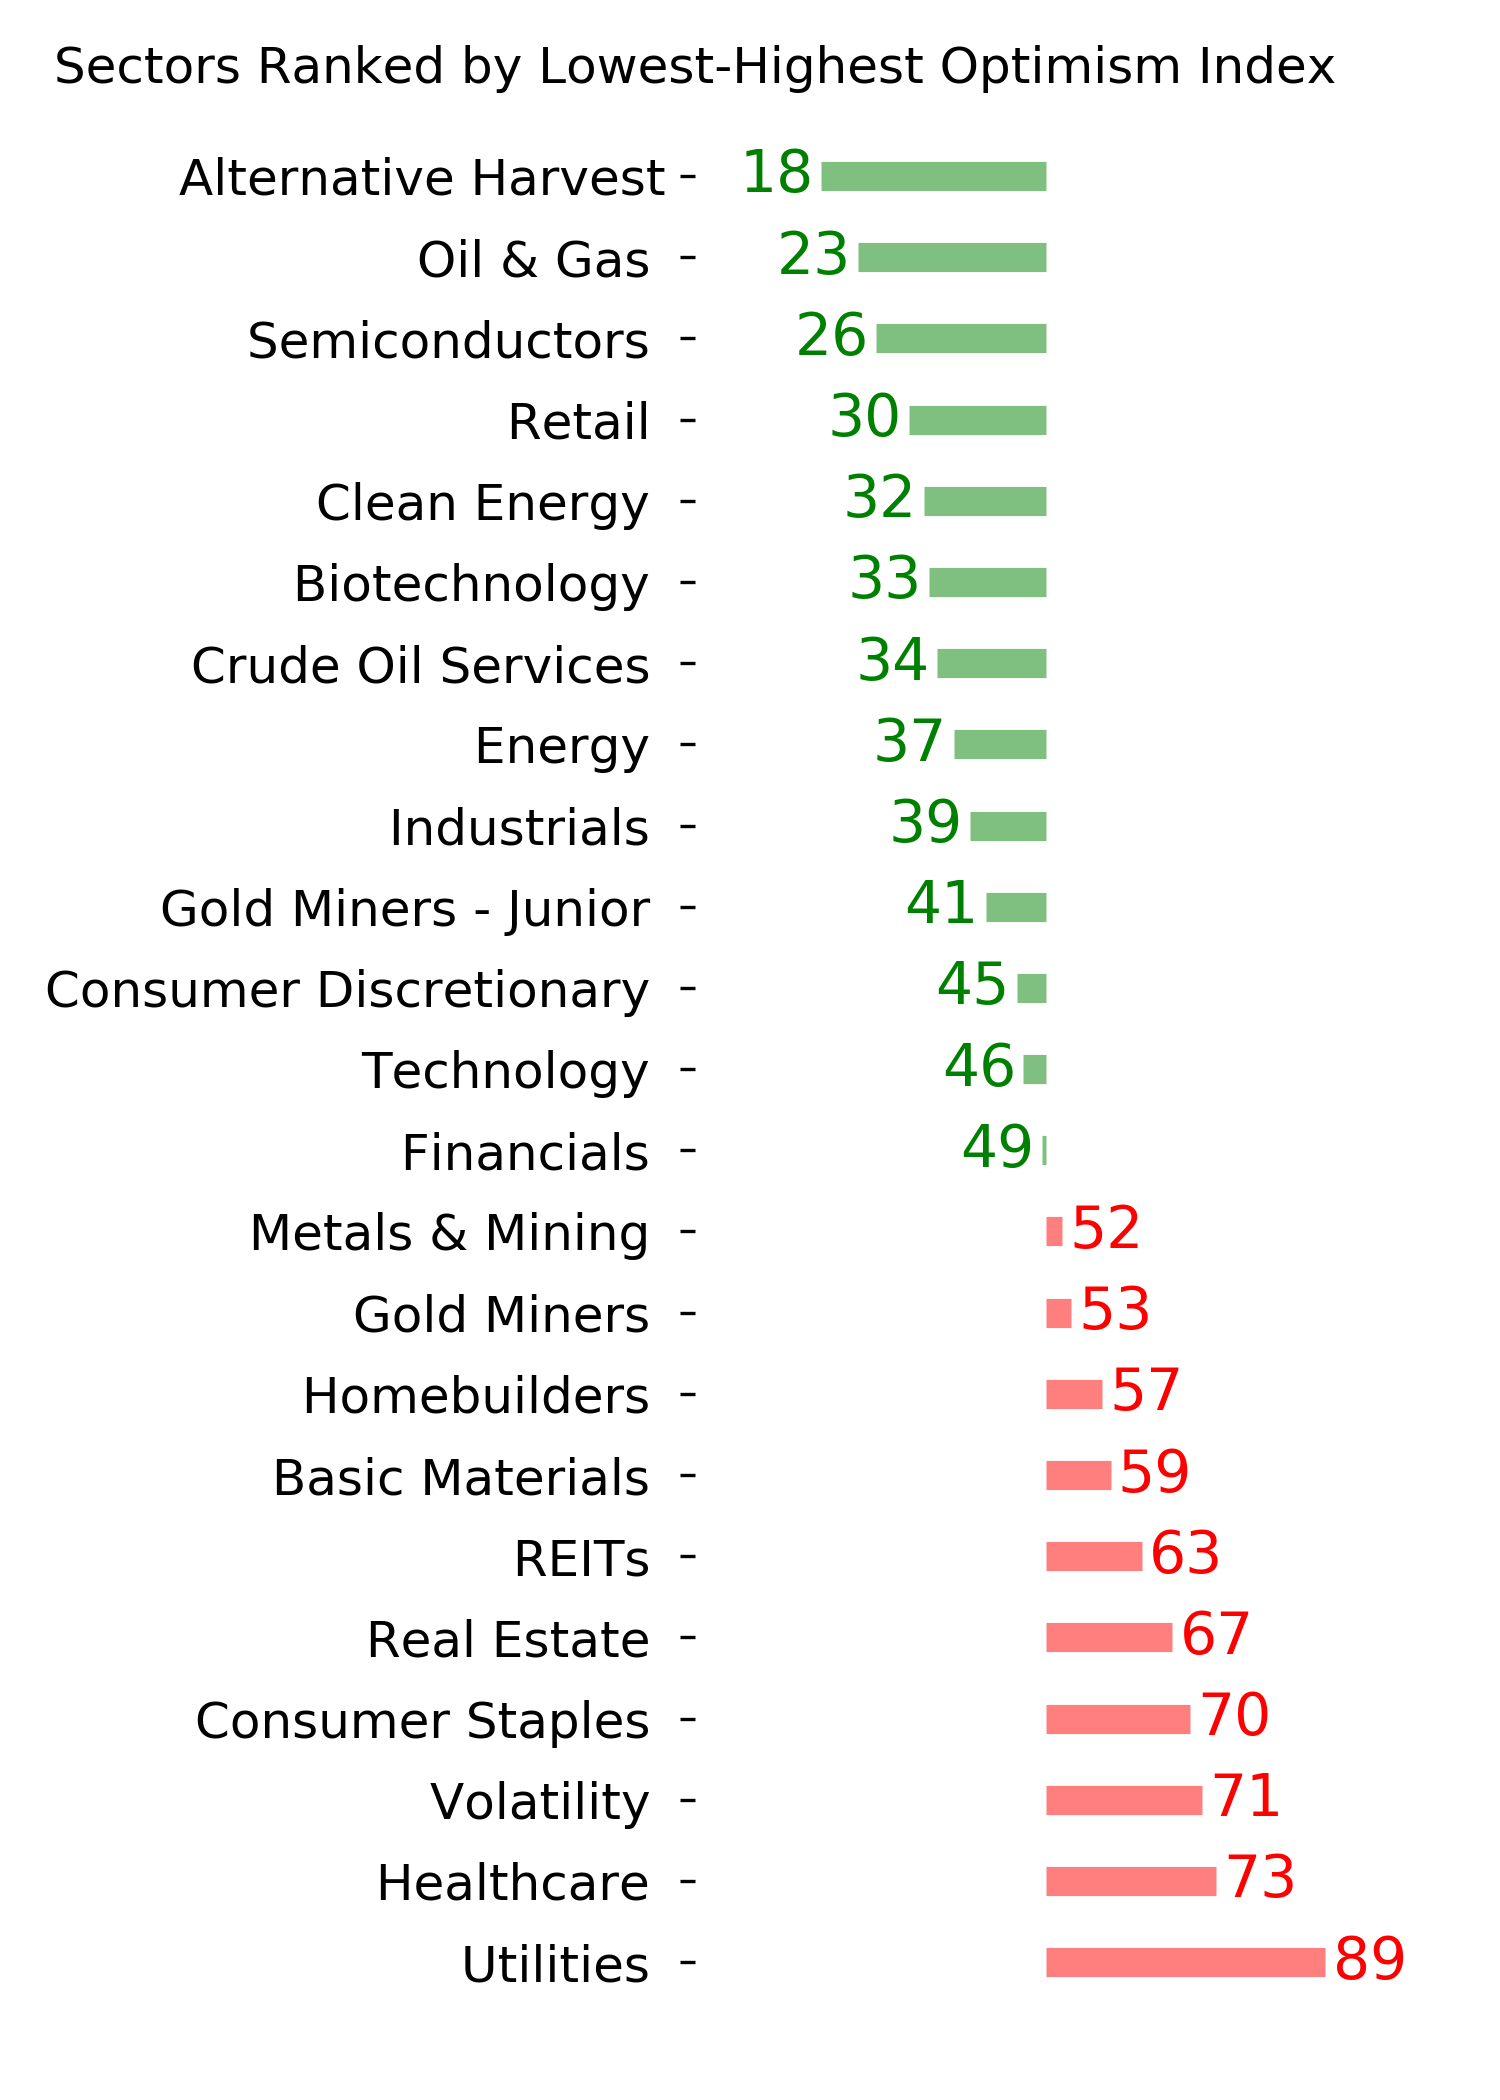
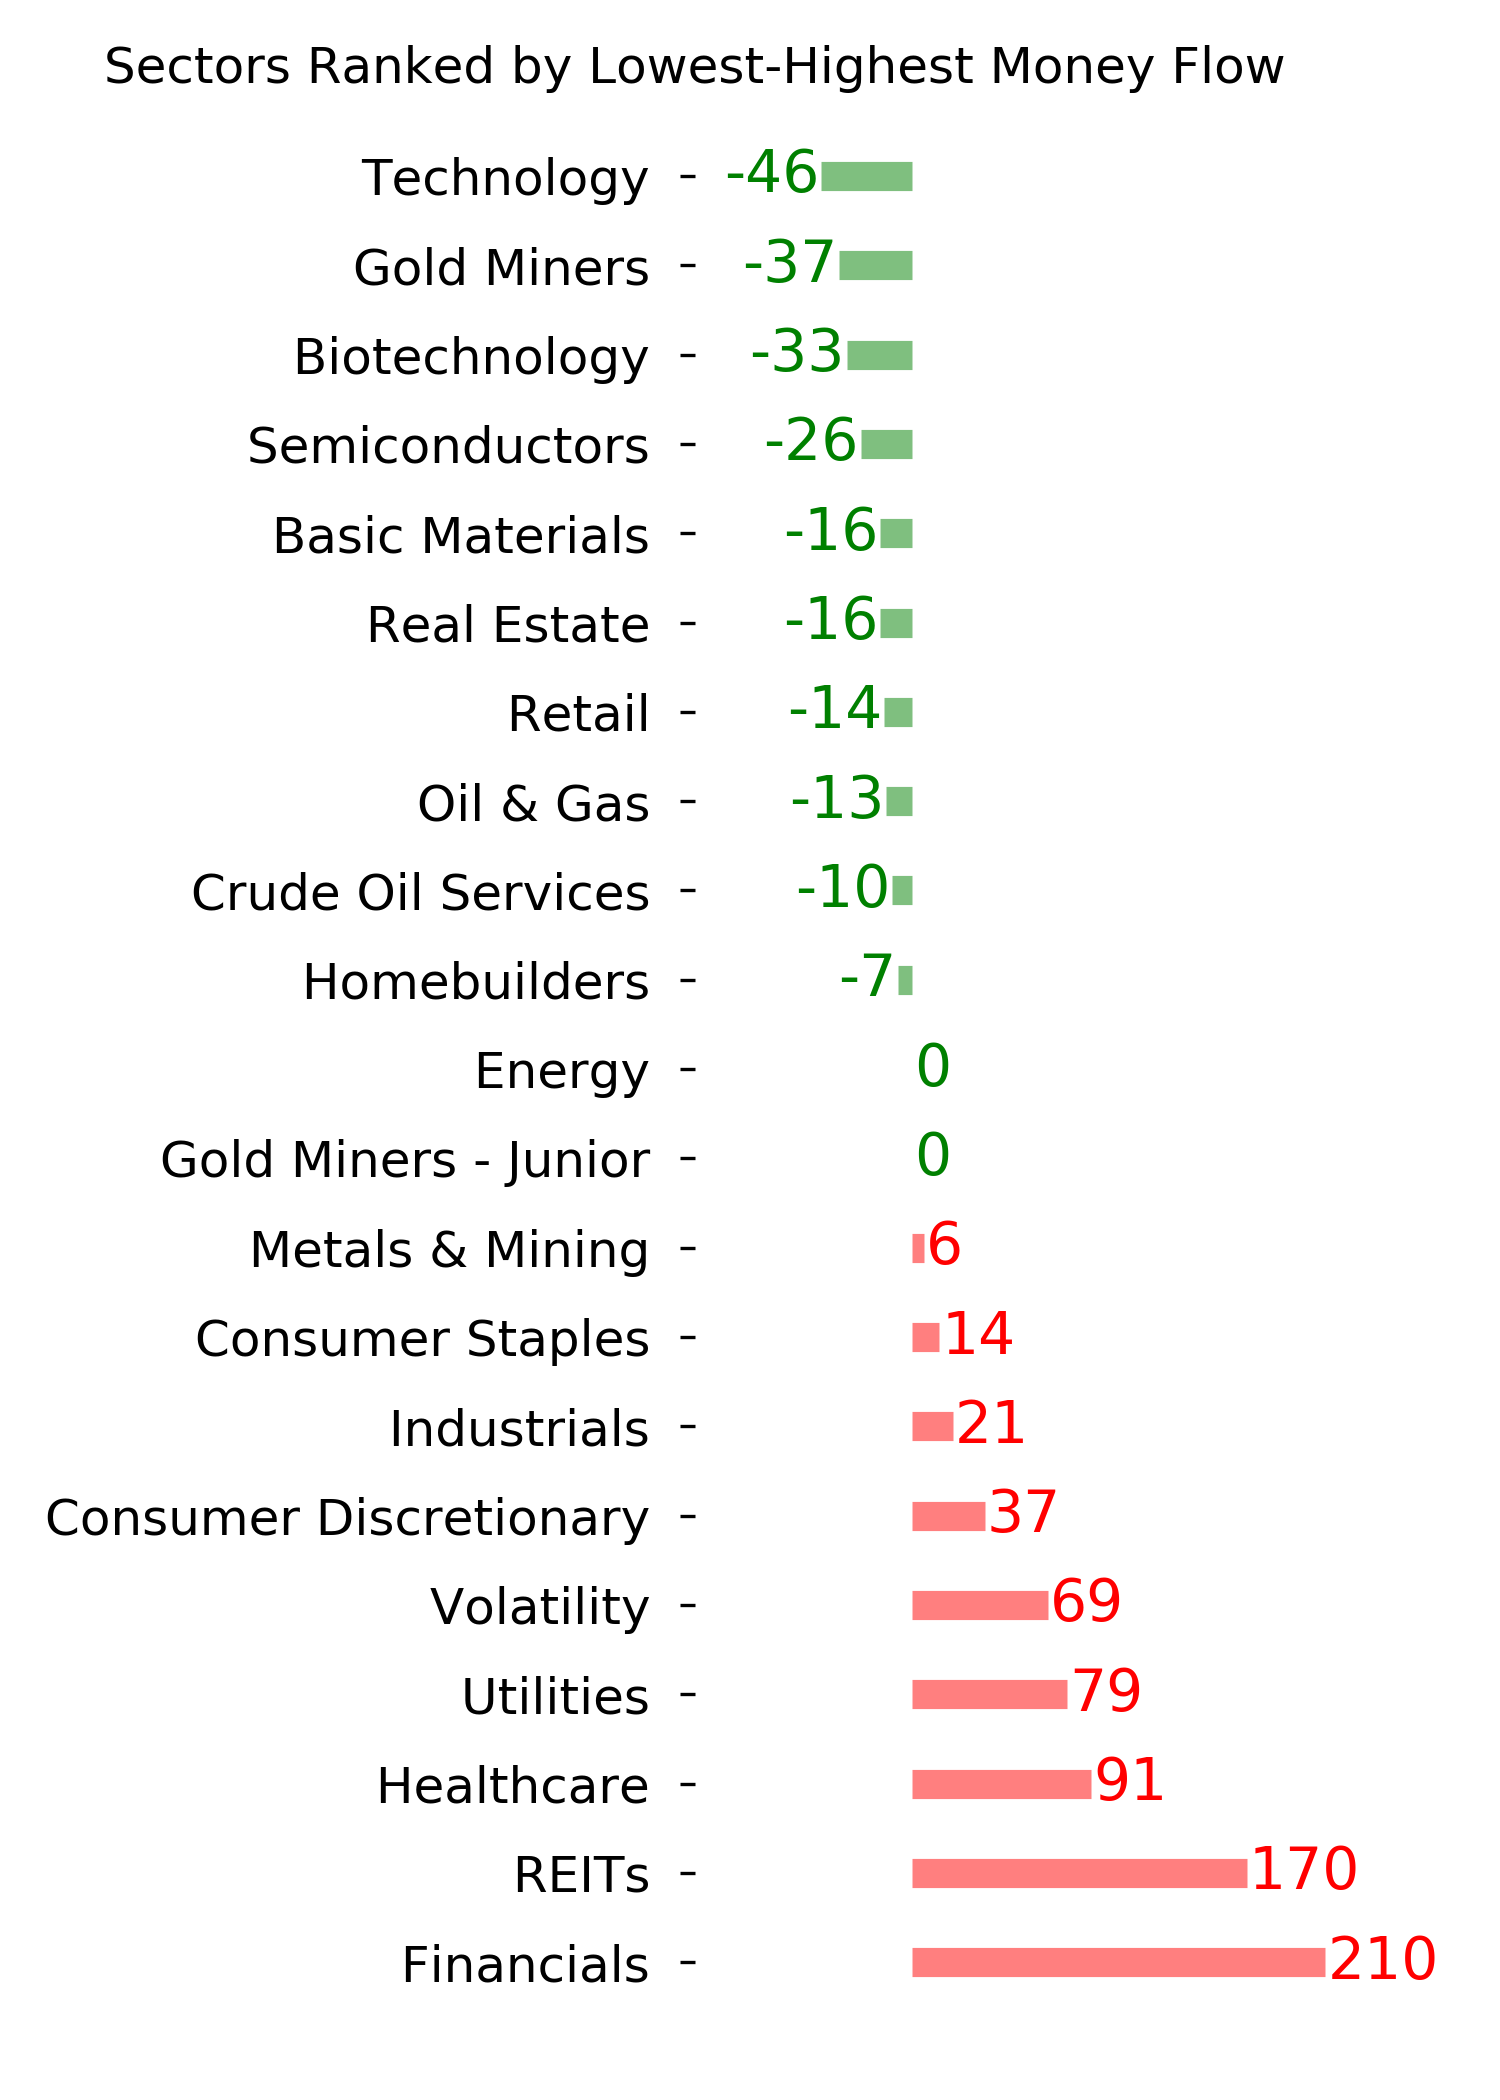
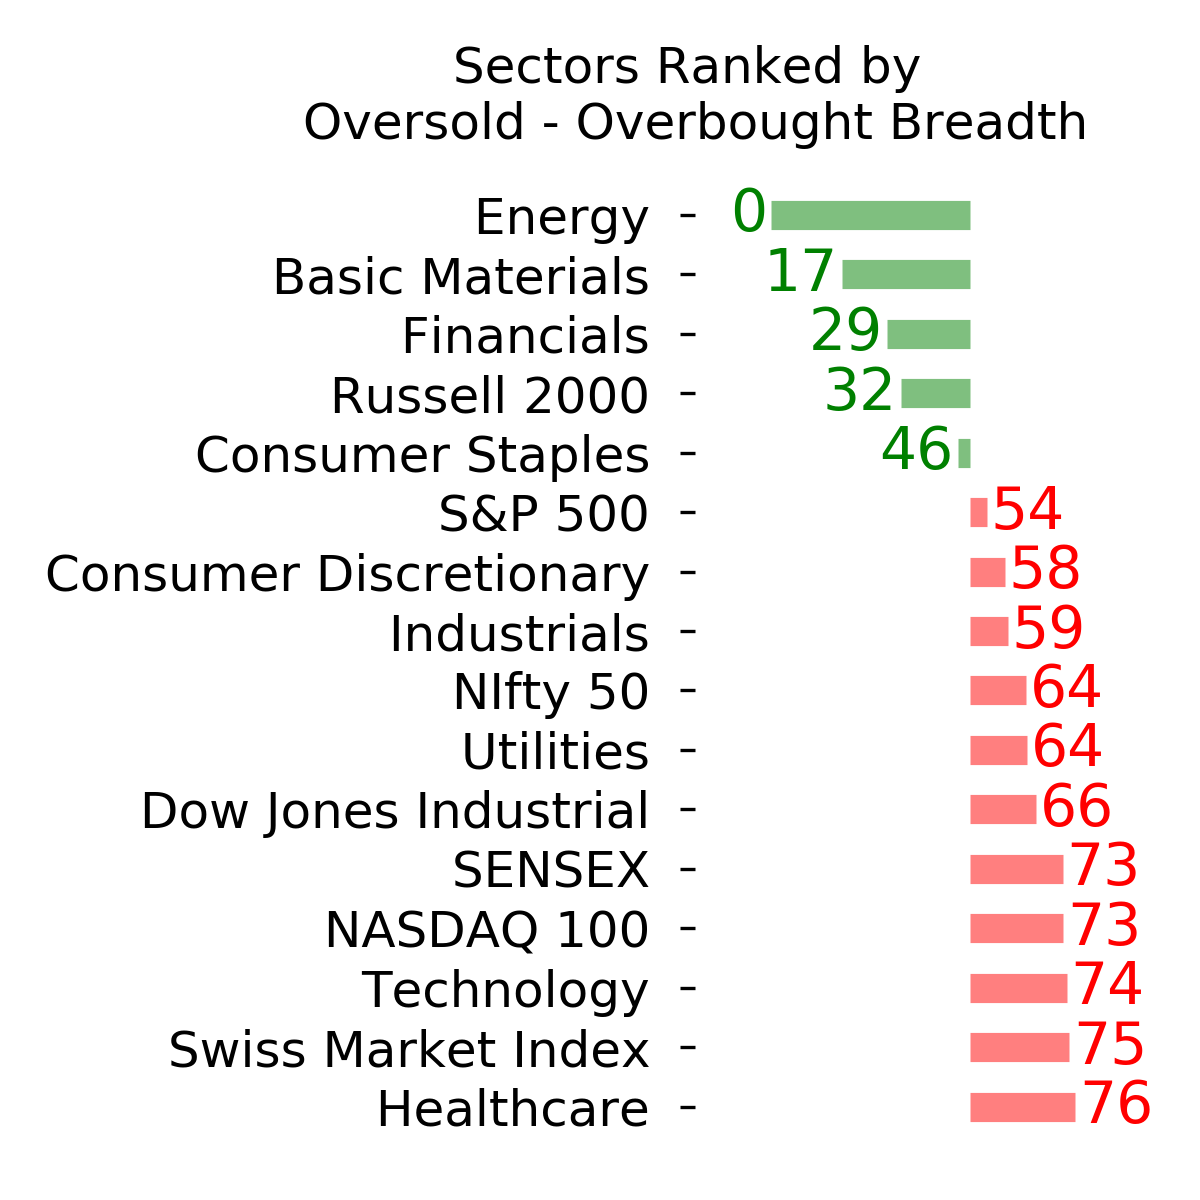
Ranks
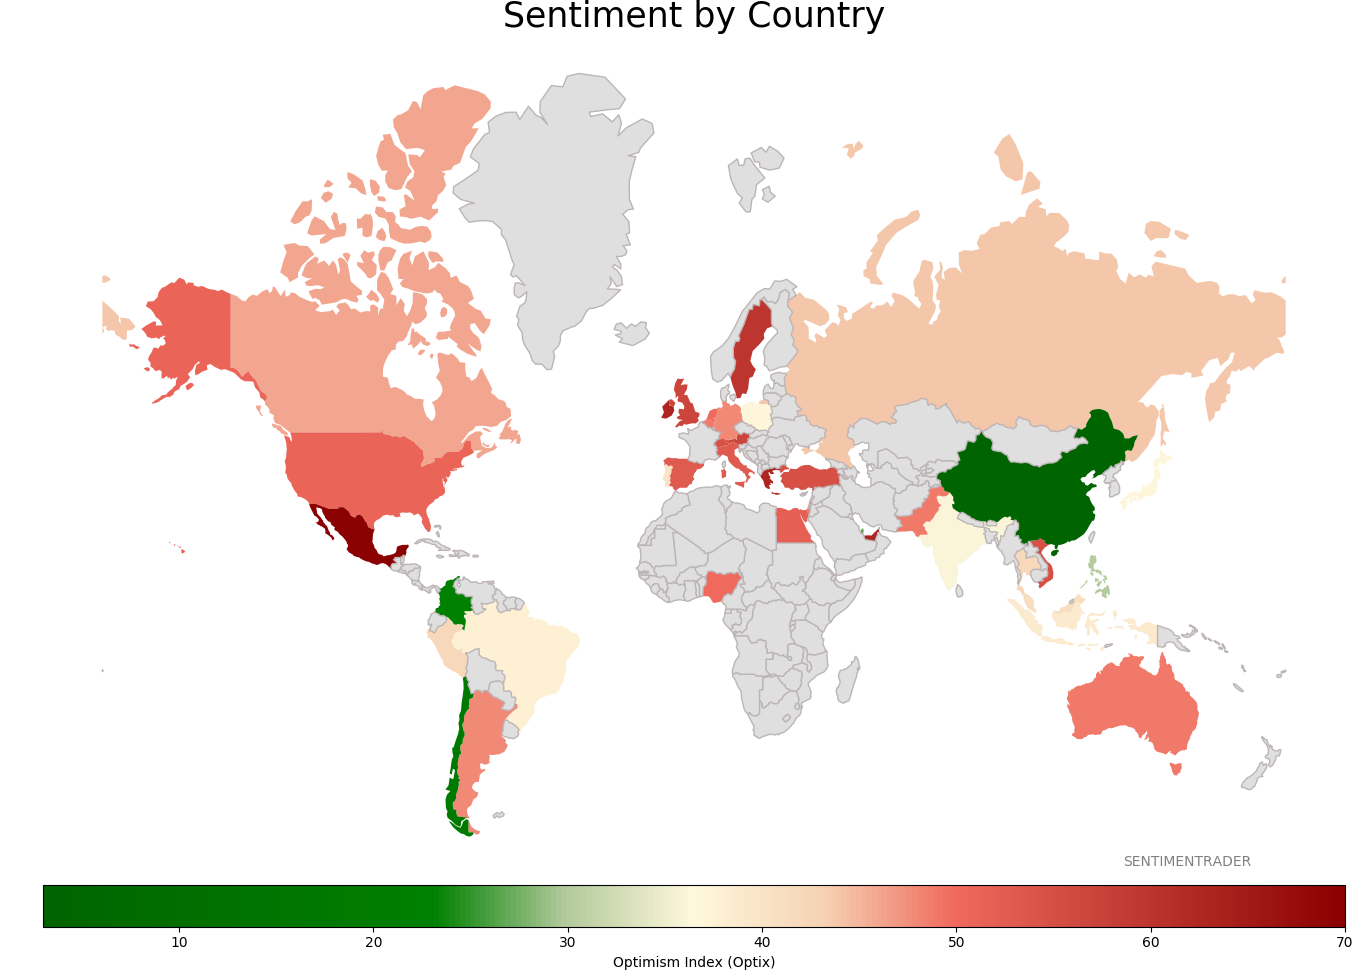
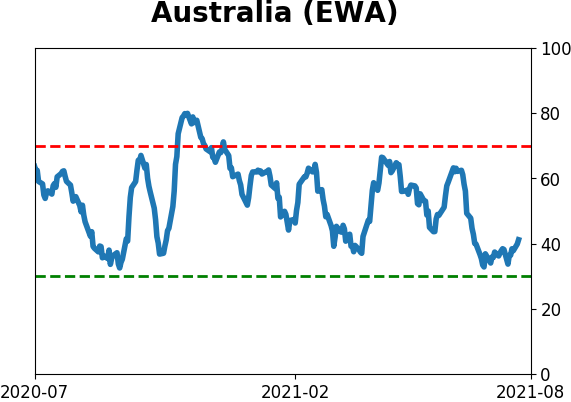
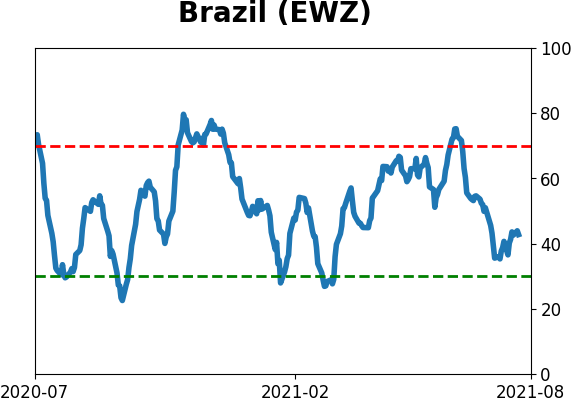
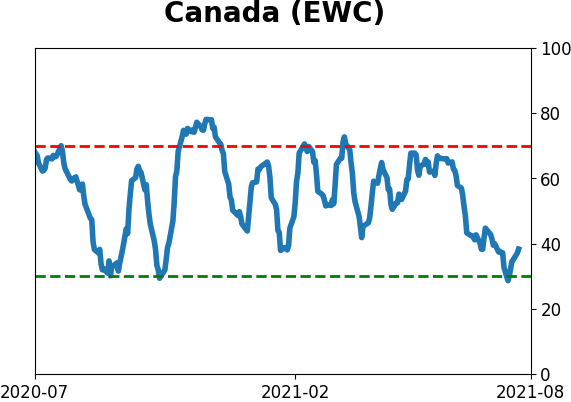
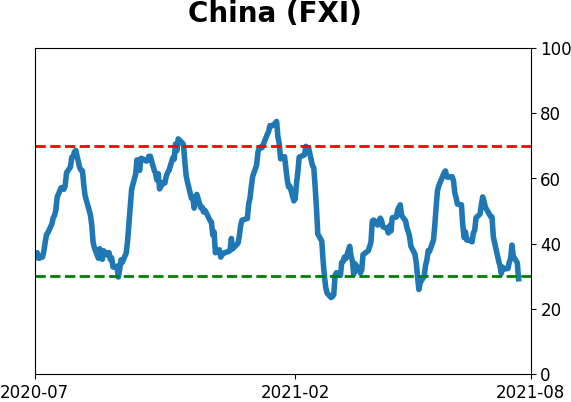
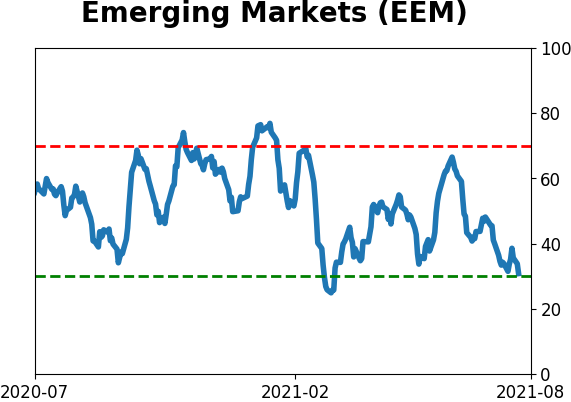
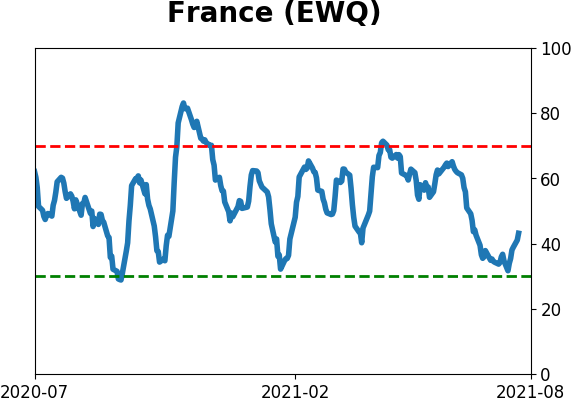
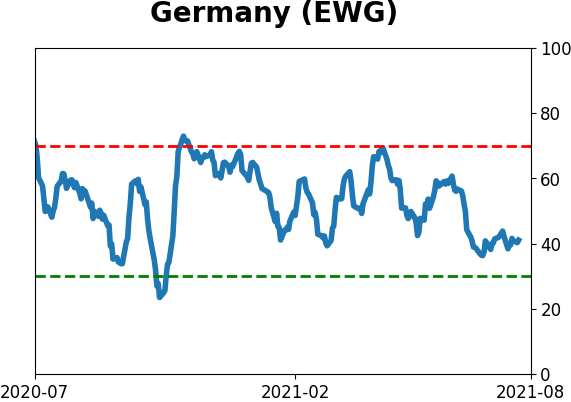
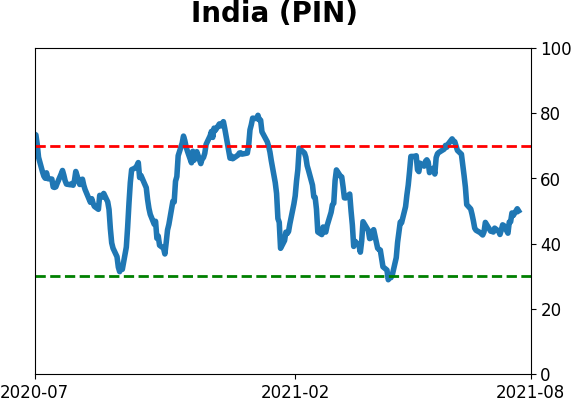
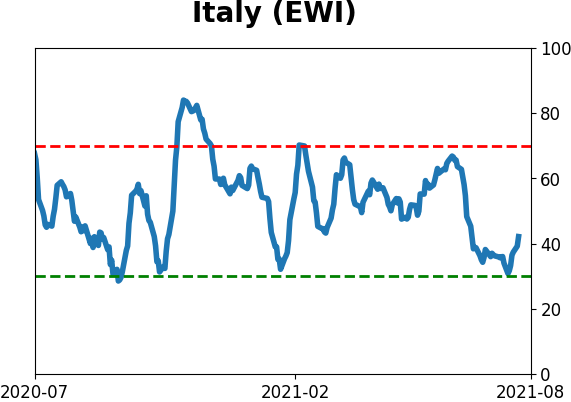
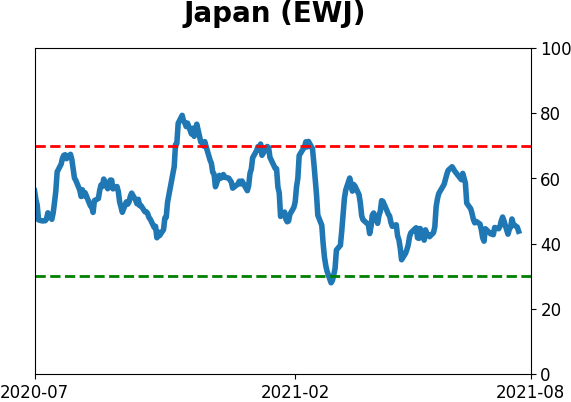
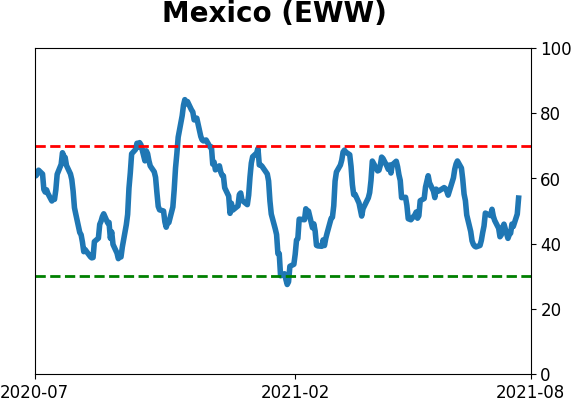
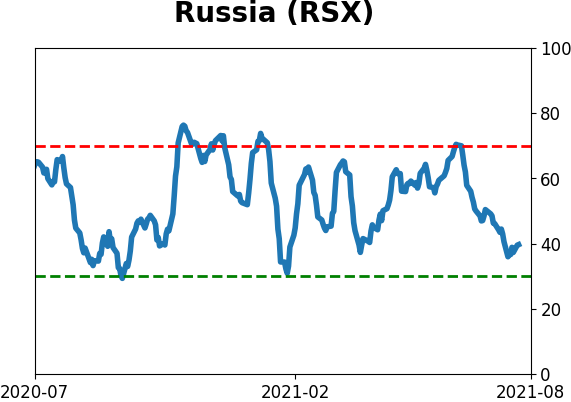
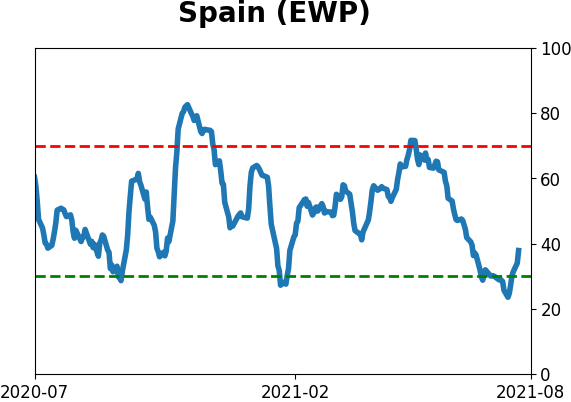
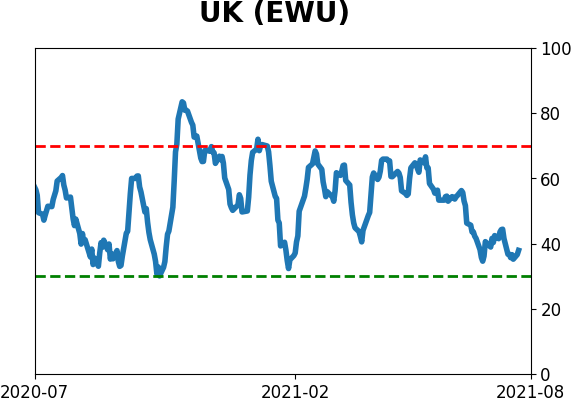
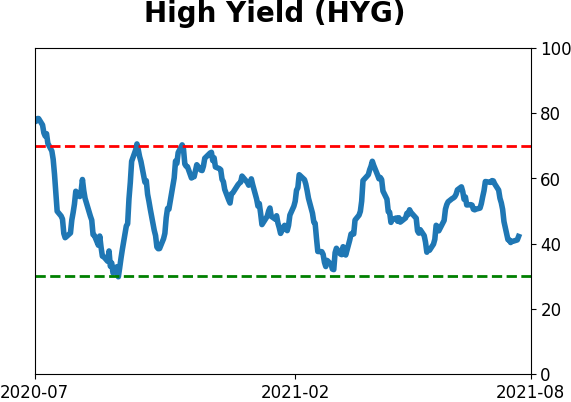
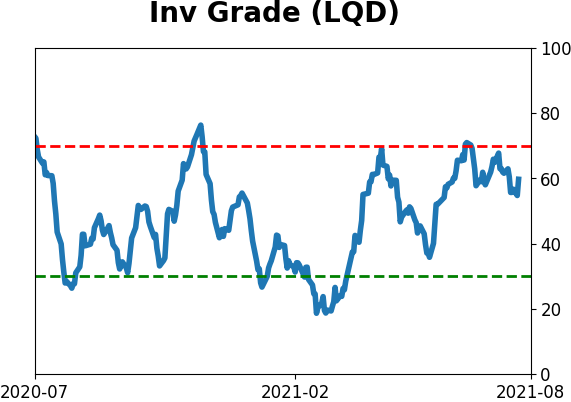
Sentiment Around The World
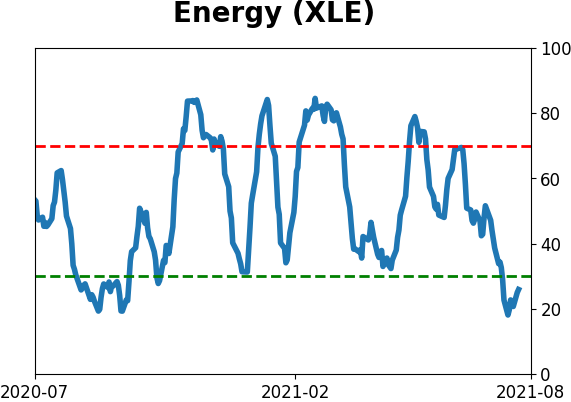
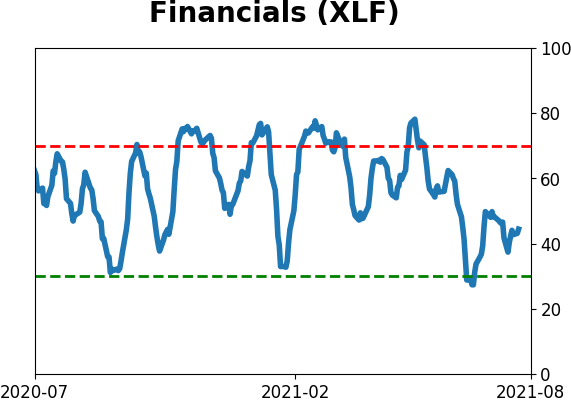
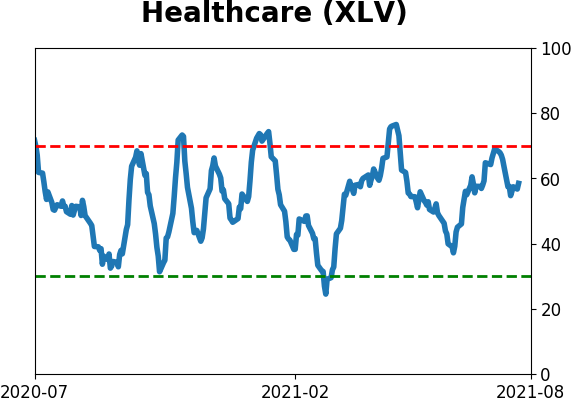
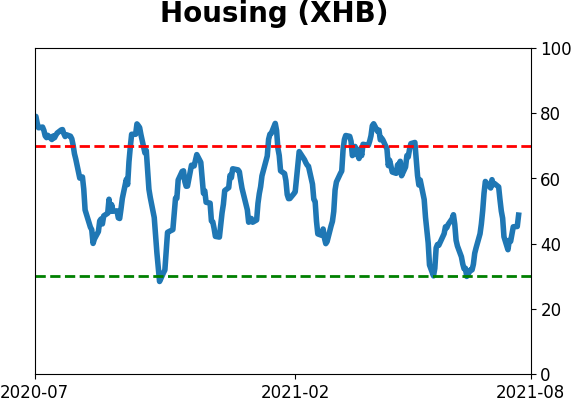
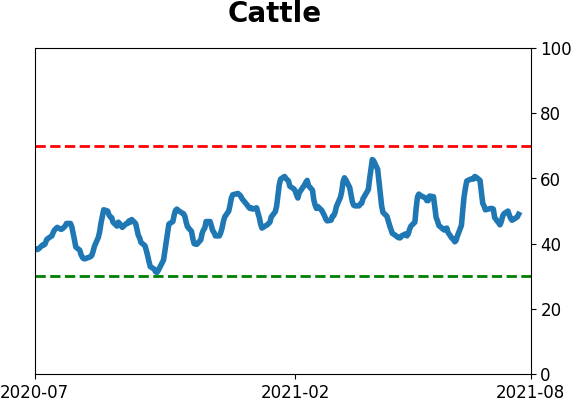
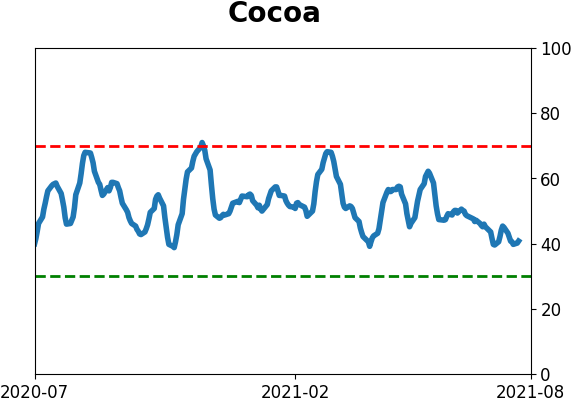
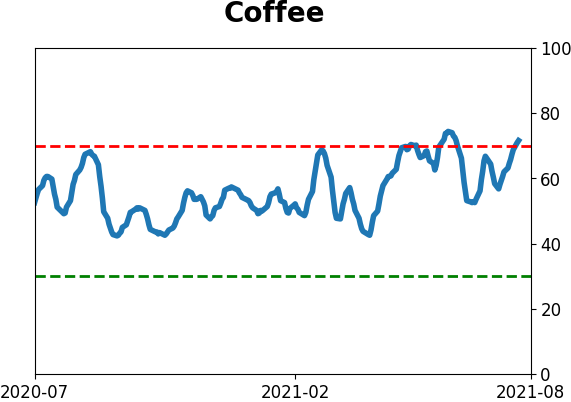
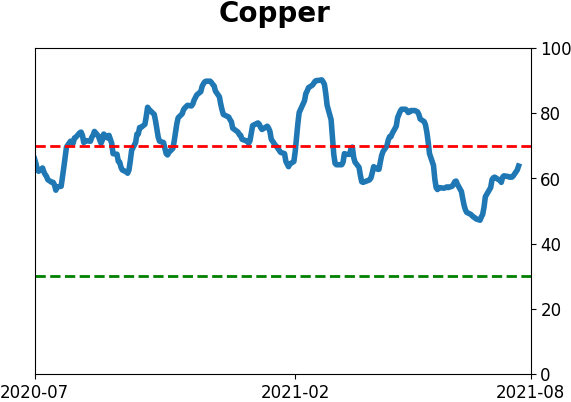
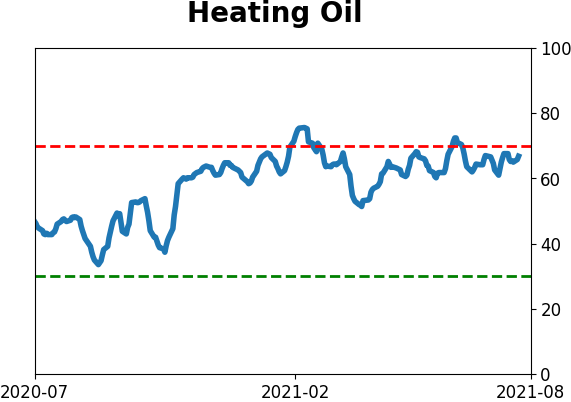
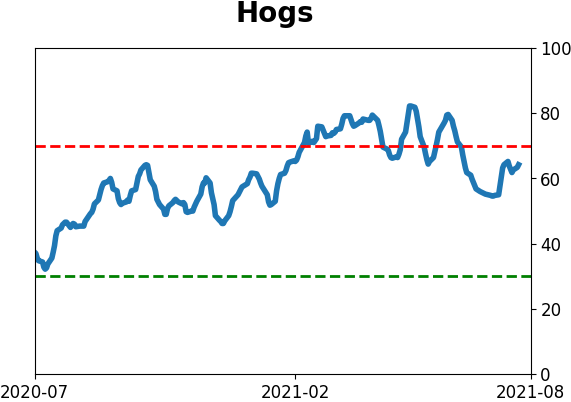
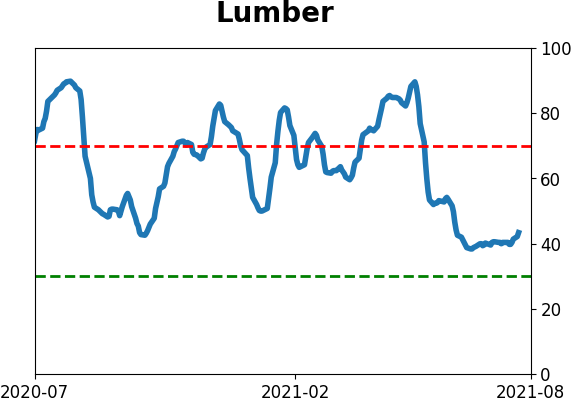
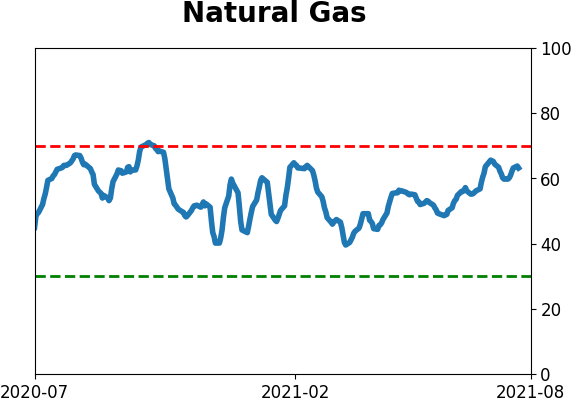
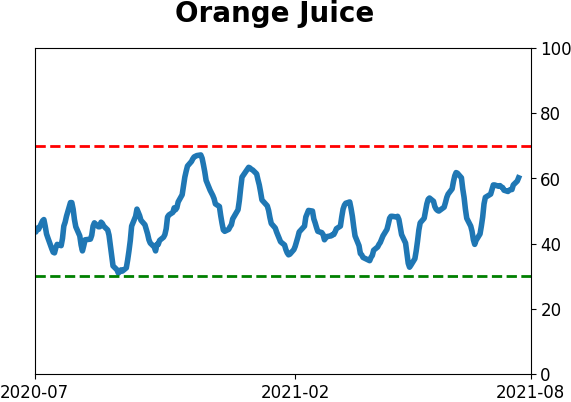
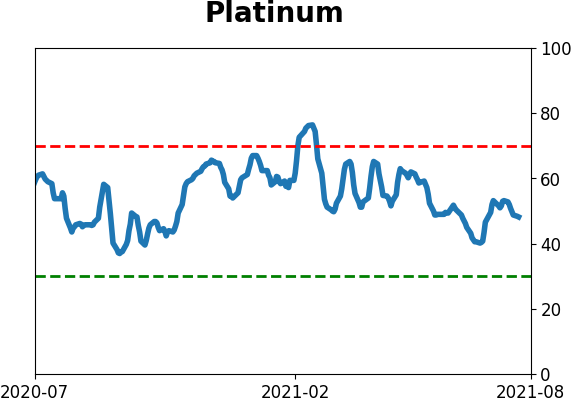
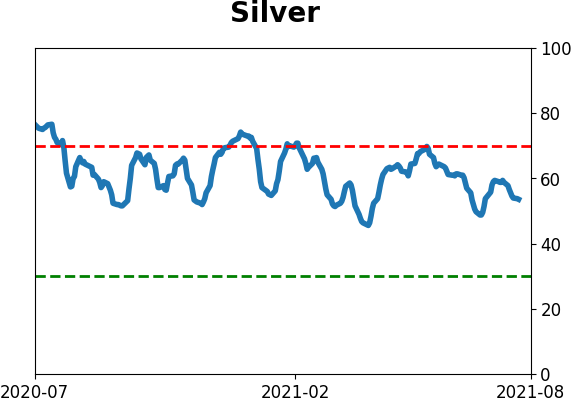
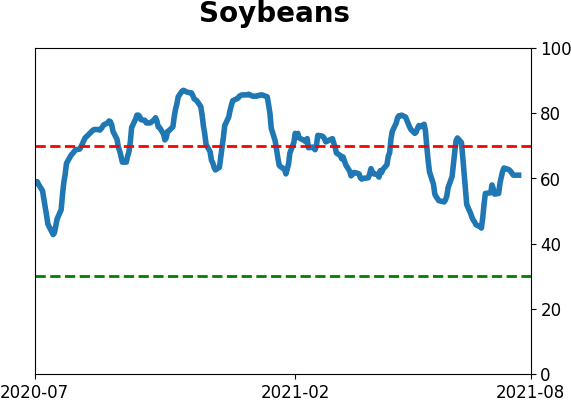
Optimism Index Thumbnails
|
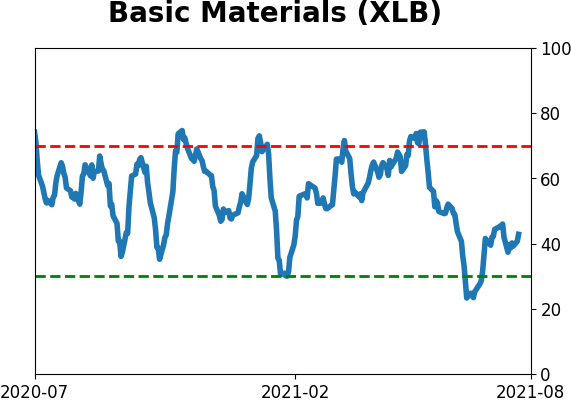
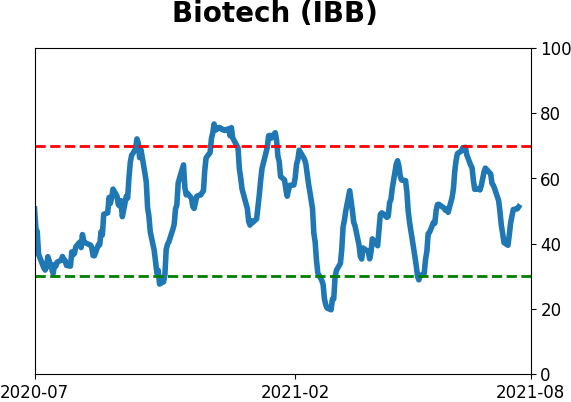
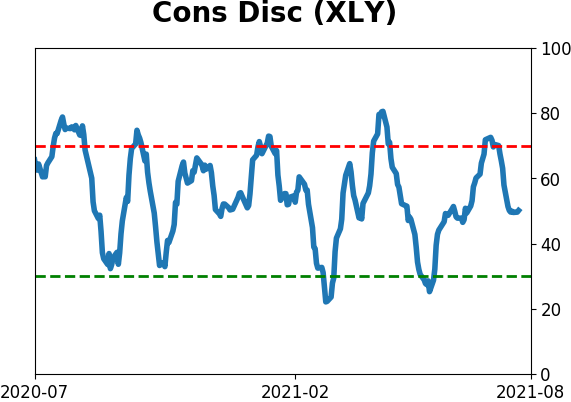
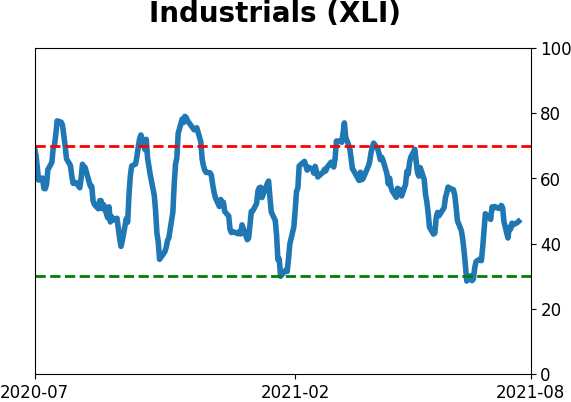
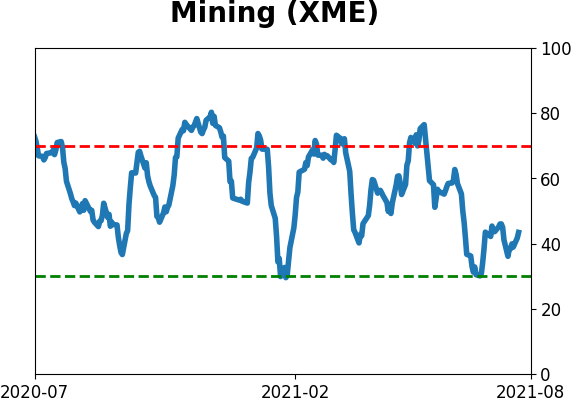
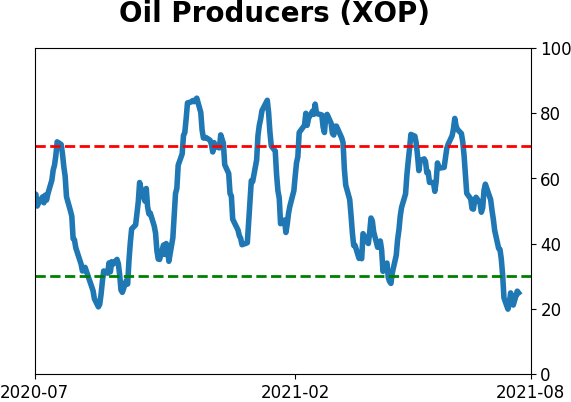
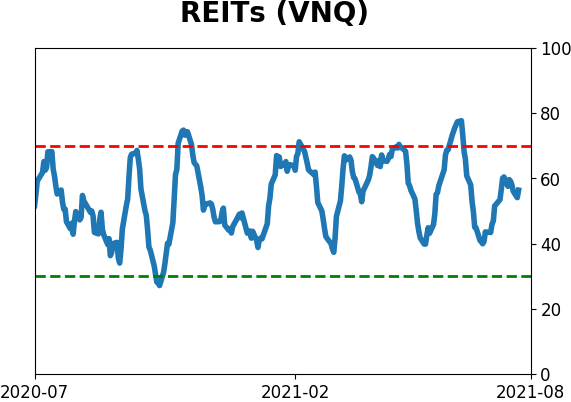
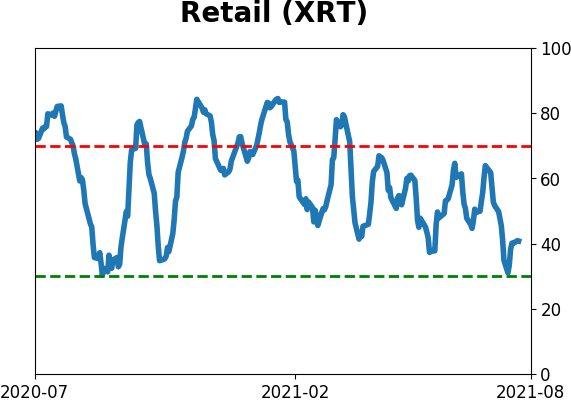
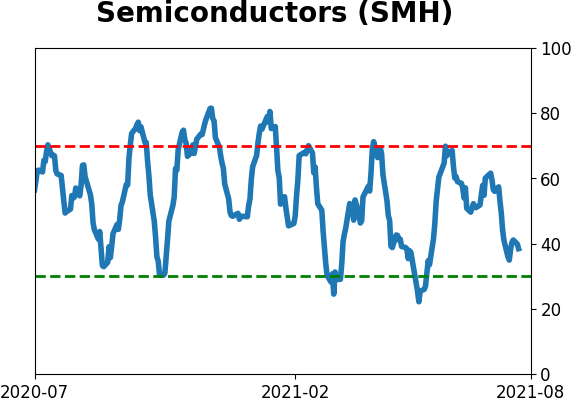
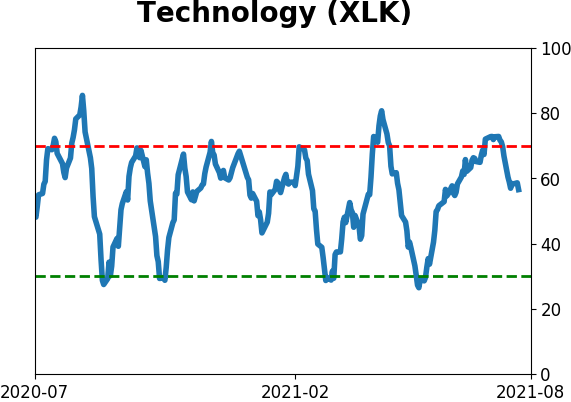
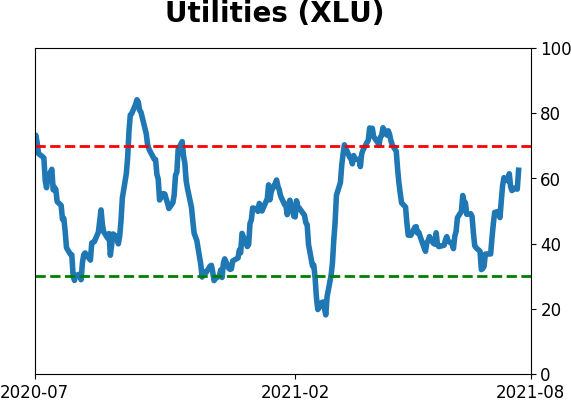
Sector ETF's - 10-Day Moving Average
|
|
|
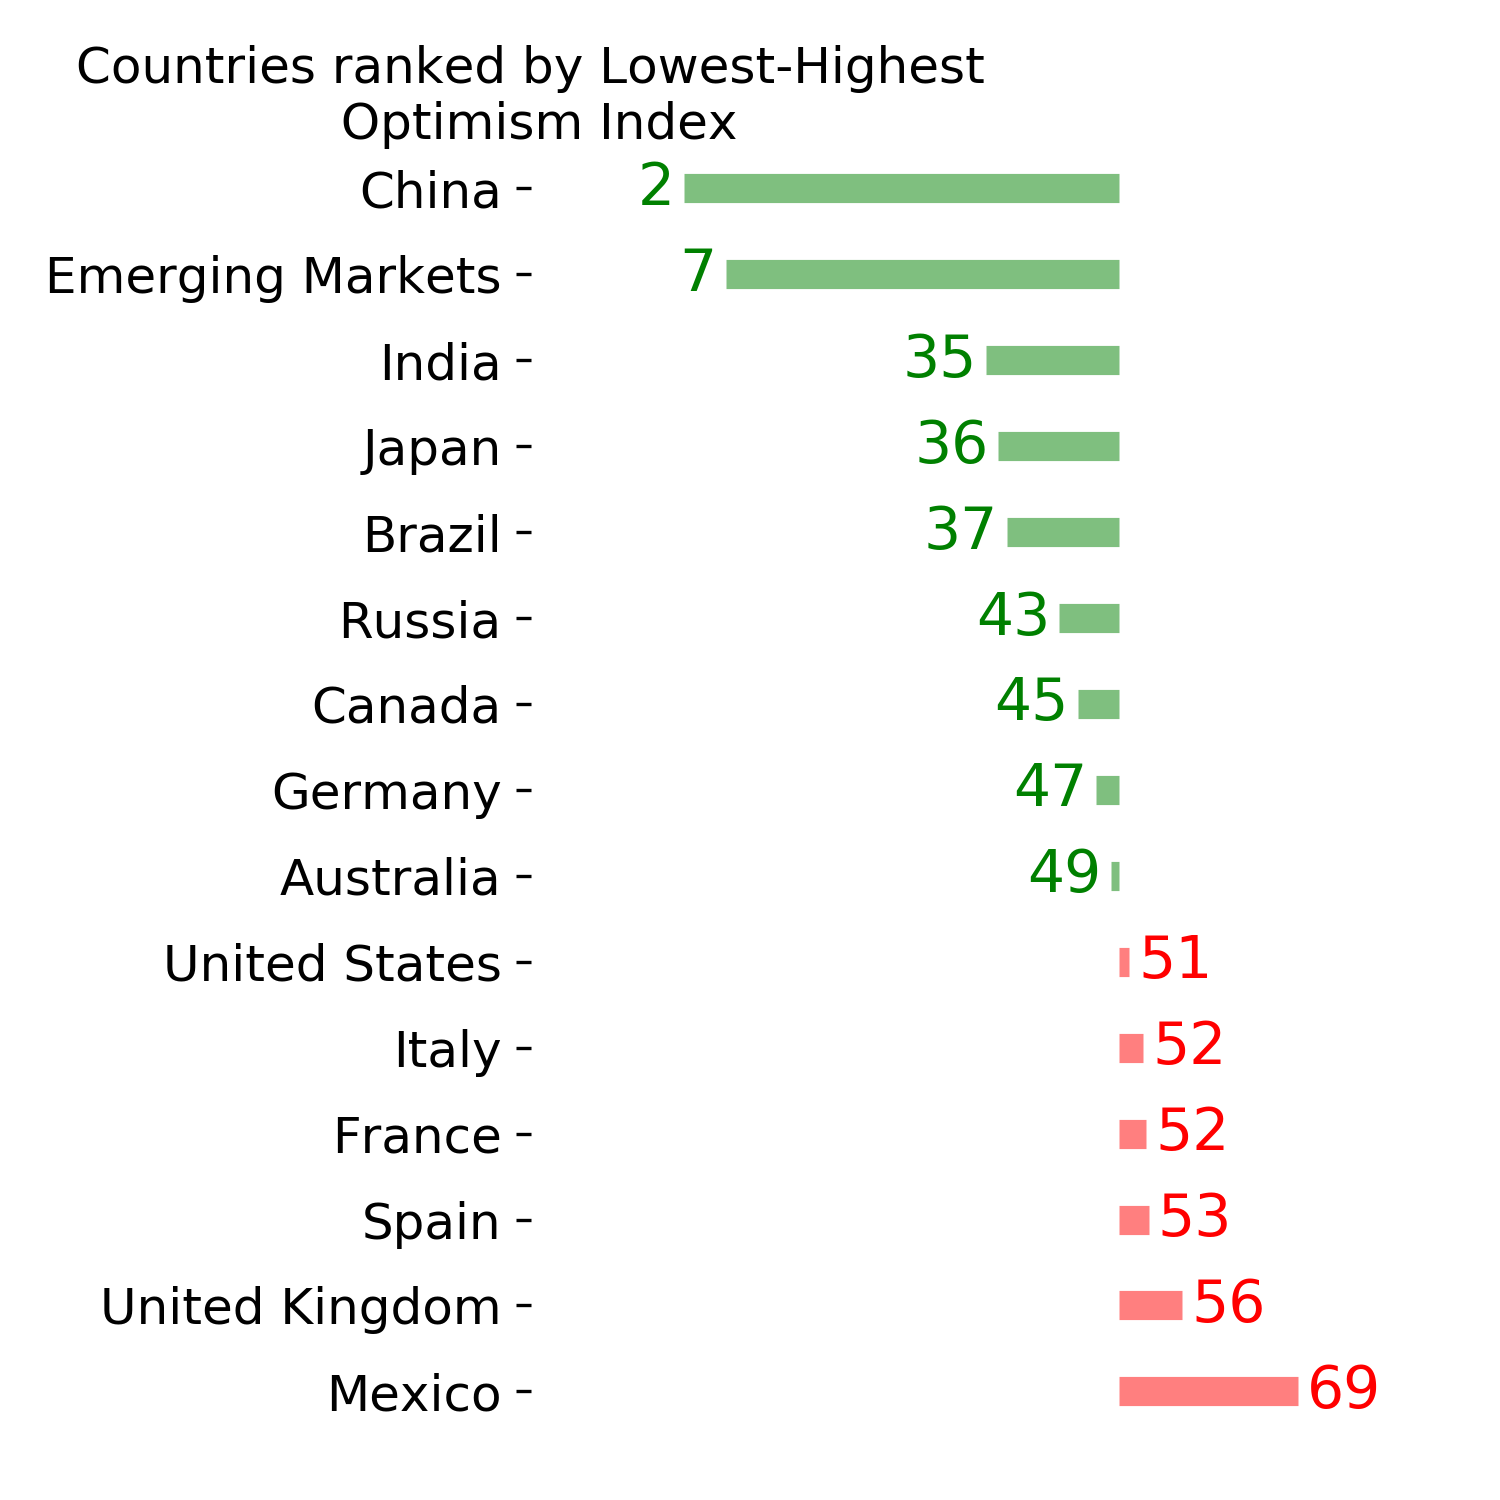
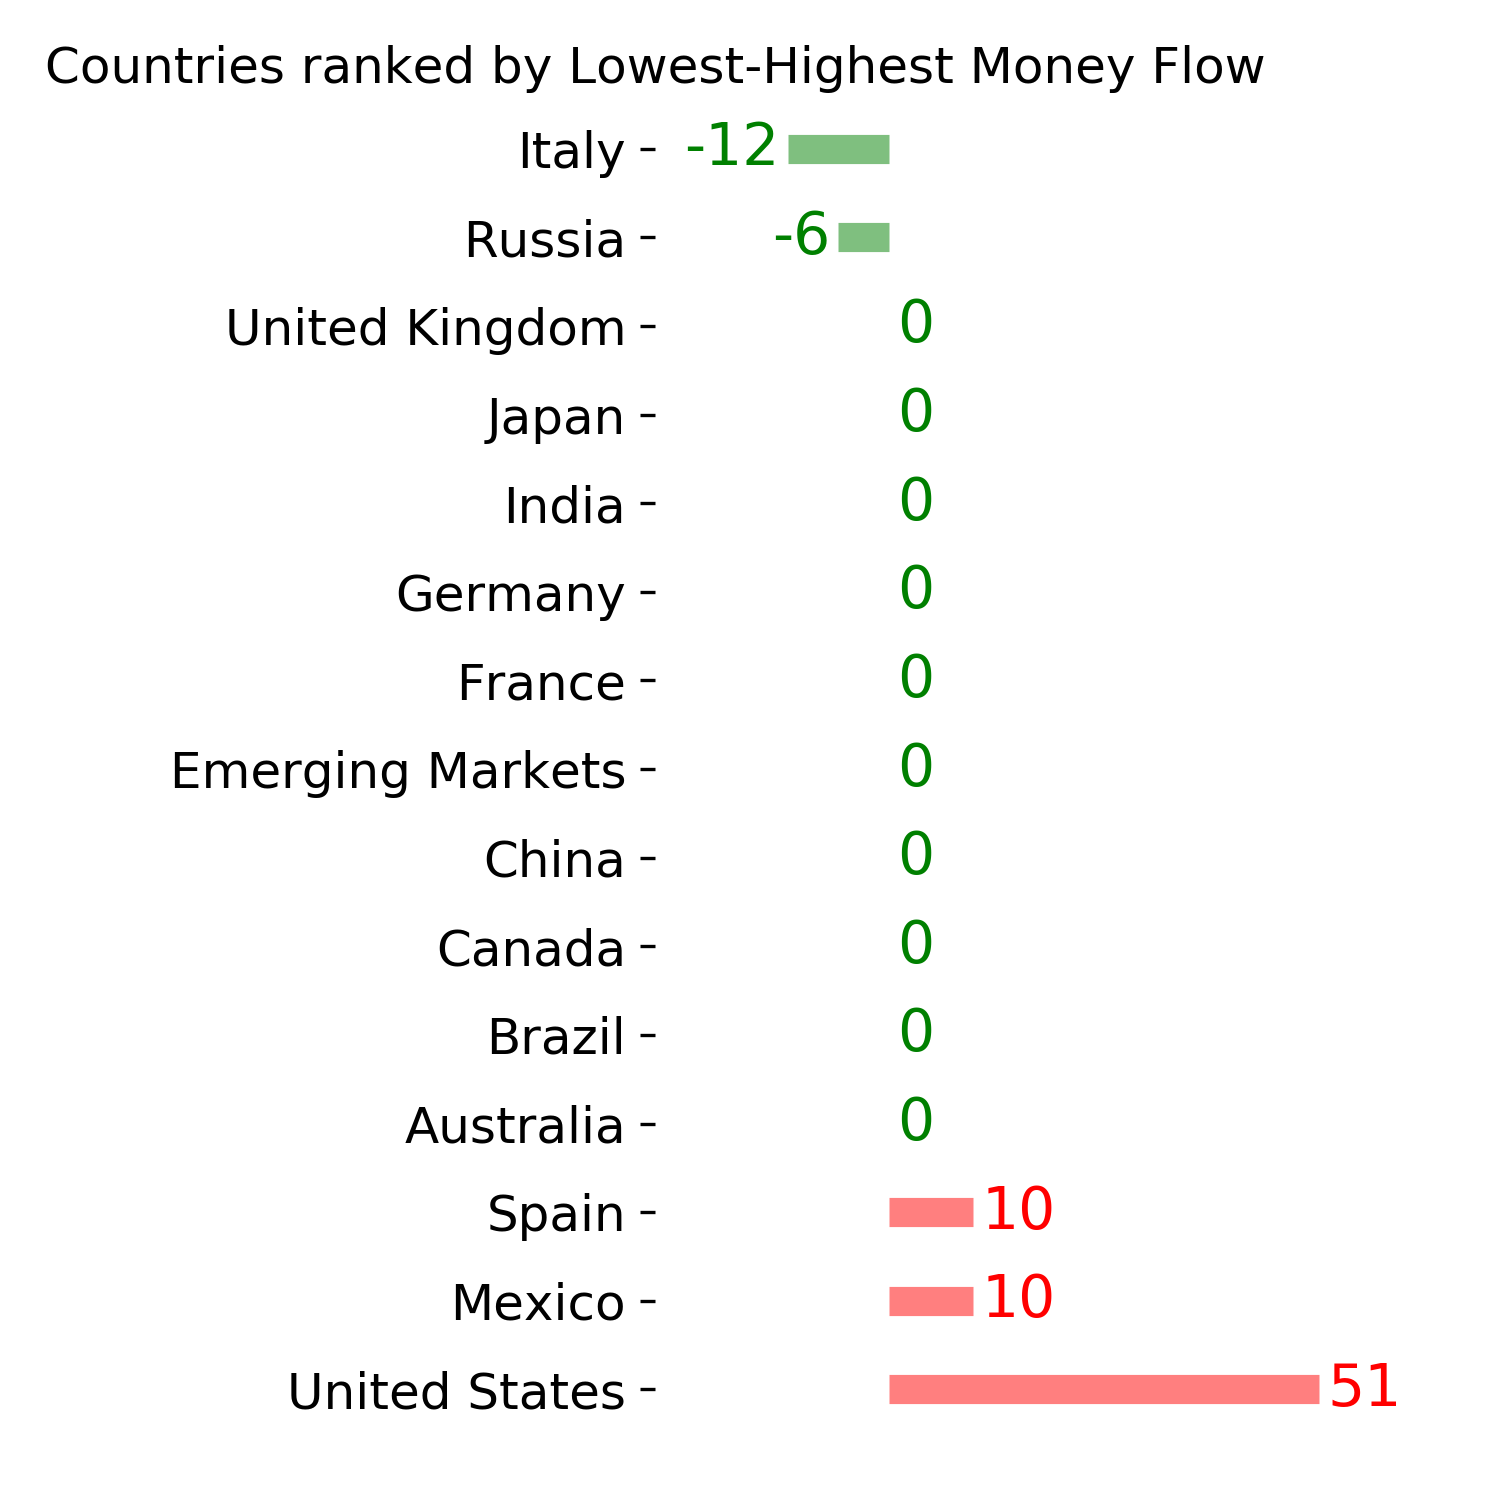
Country ETF's - 10-Day Moving Average
|
|
|
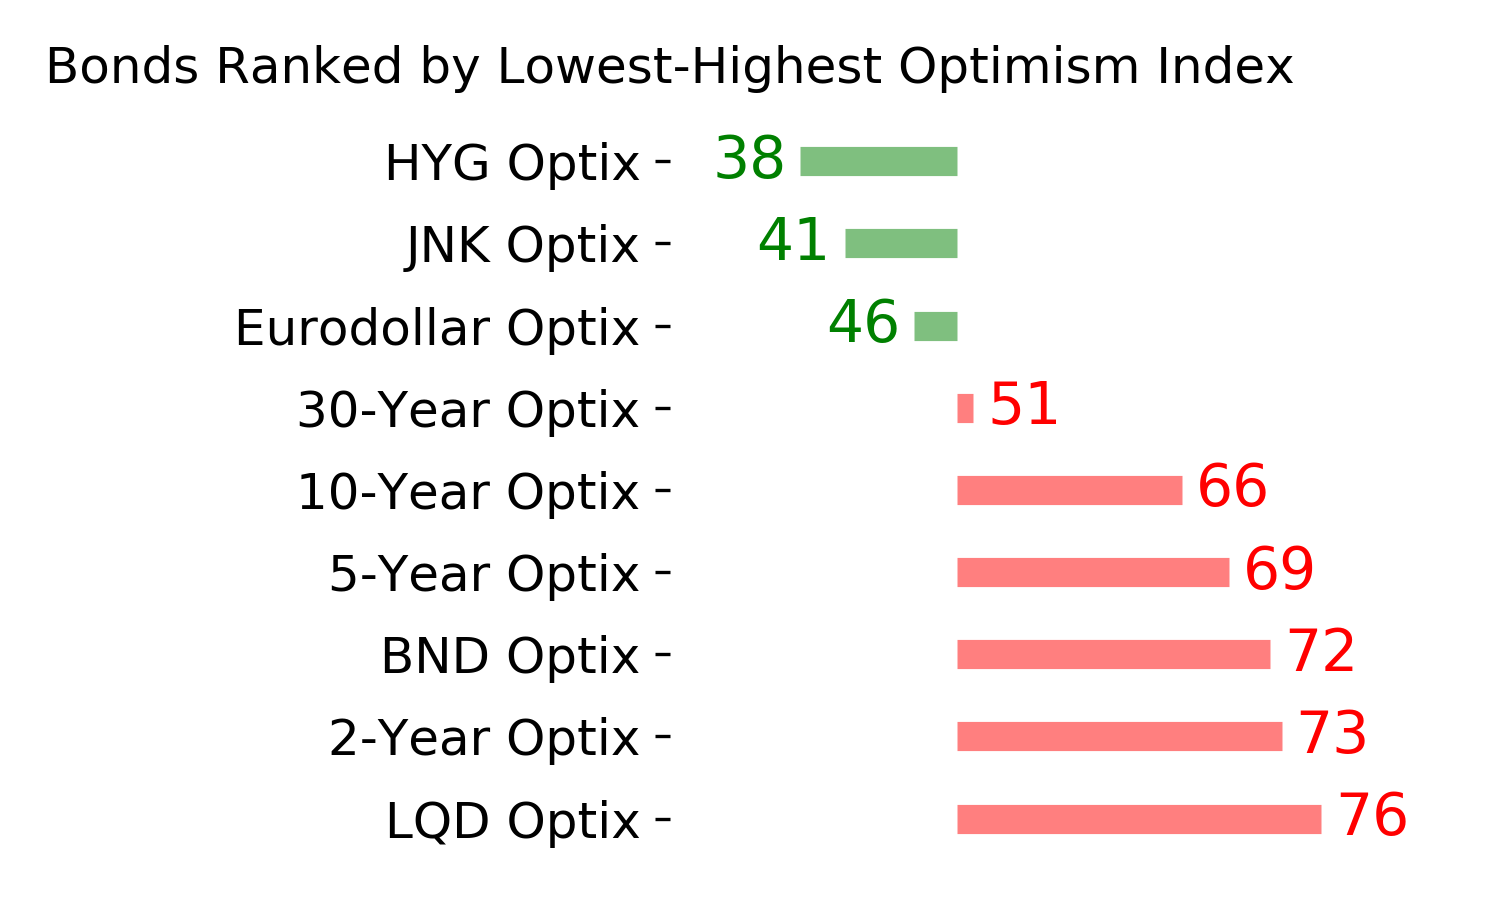
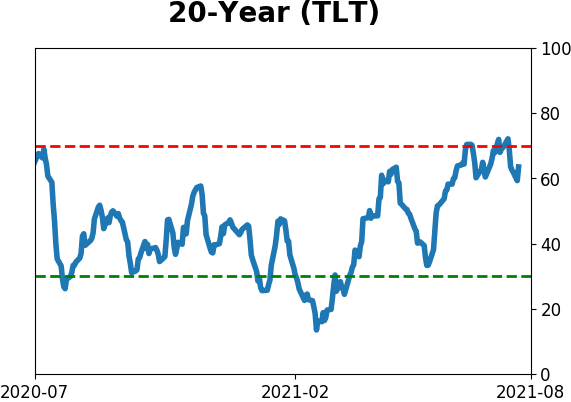
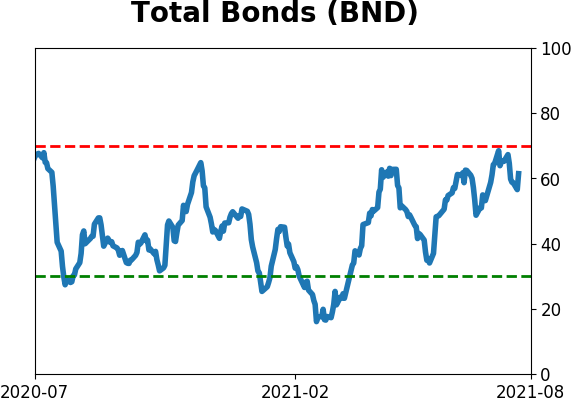
Bond ETF's - 10-Day Moving Average
|
|
|
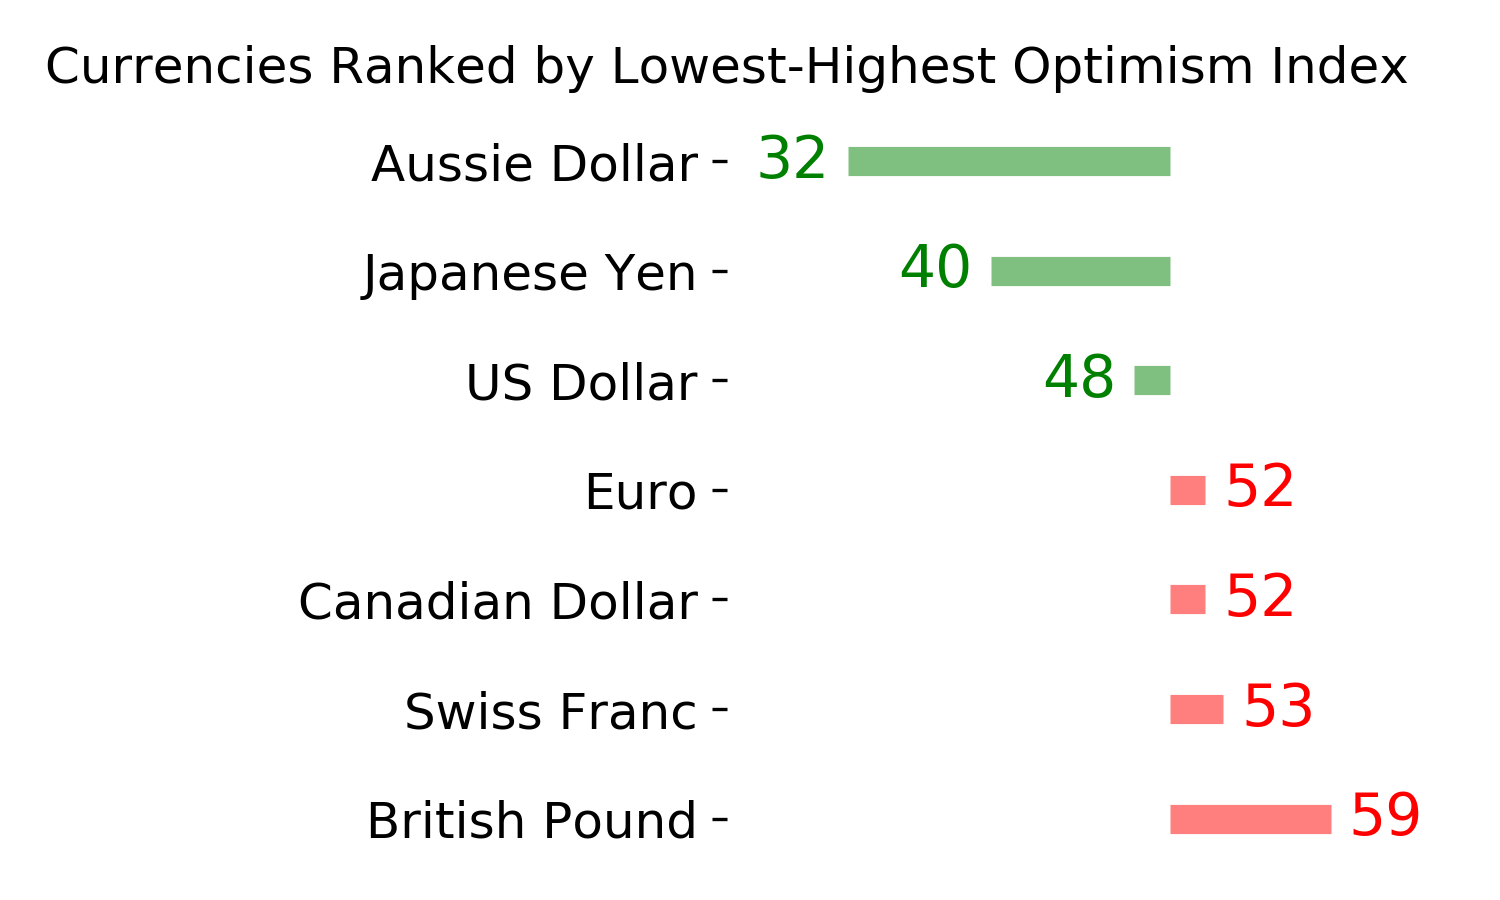
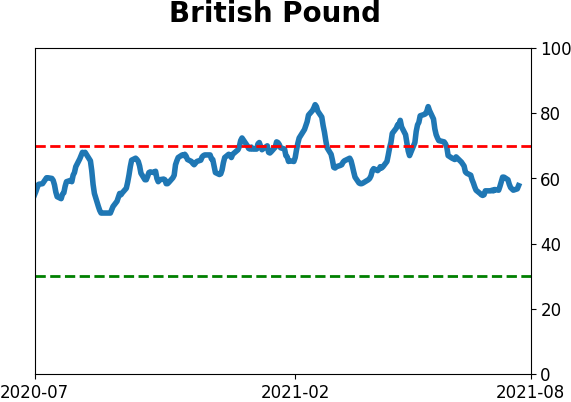
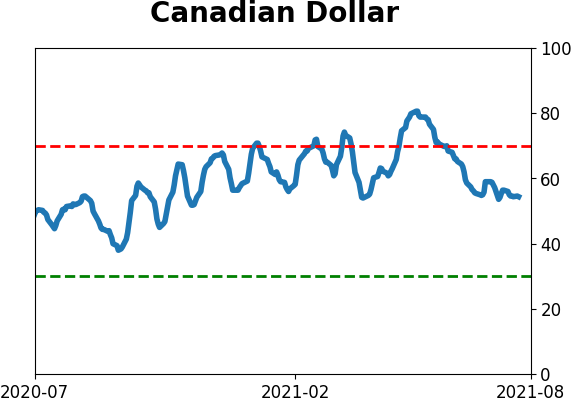
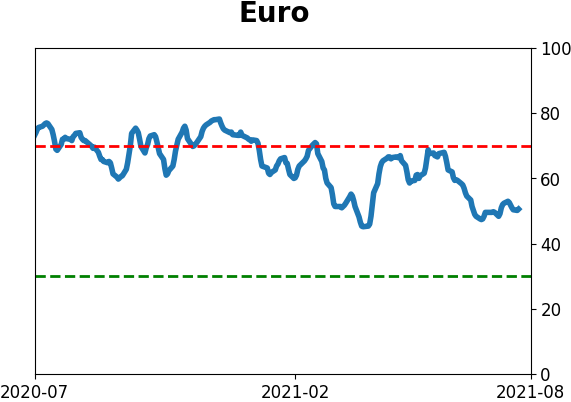
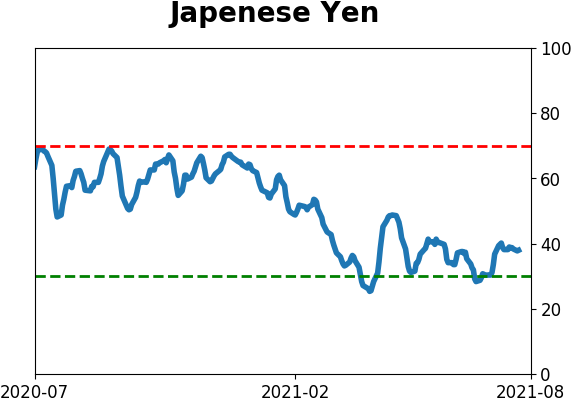
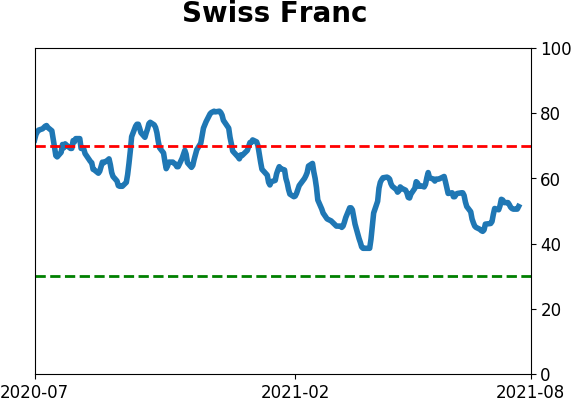
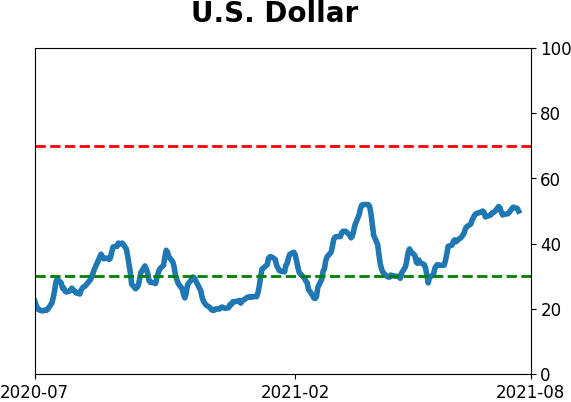
Currency ETF's - 5-Day Moving Average
|
|
|
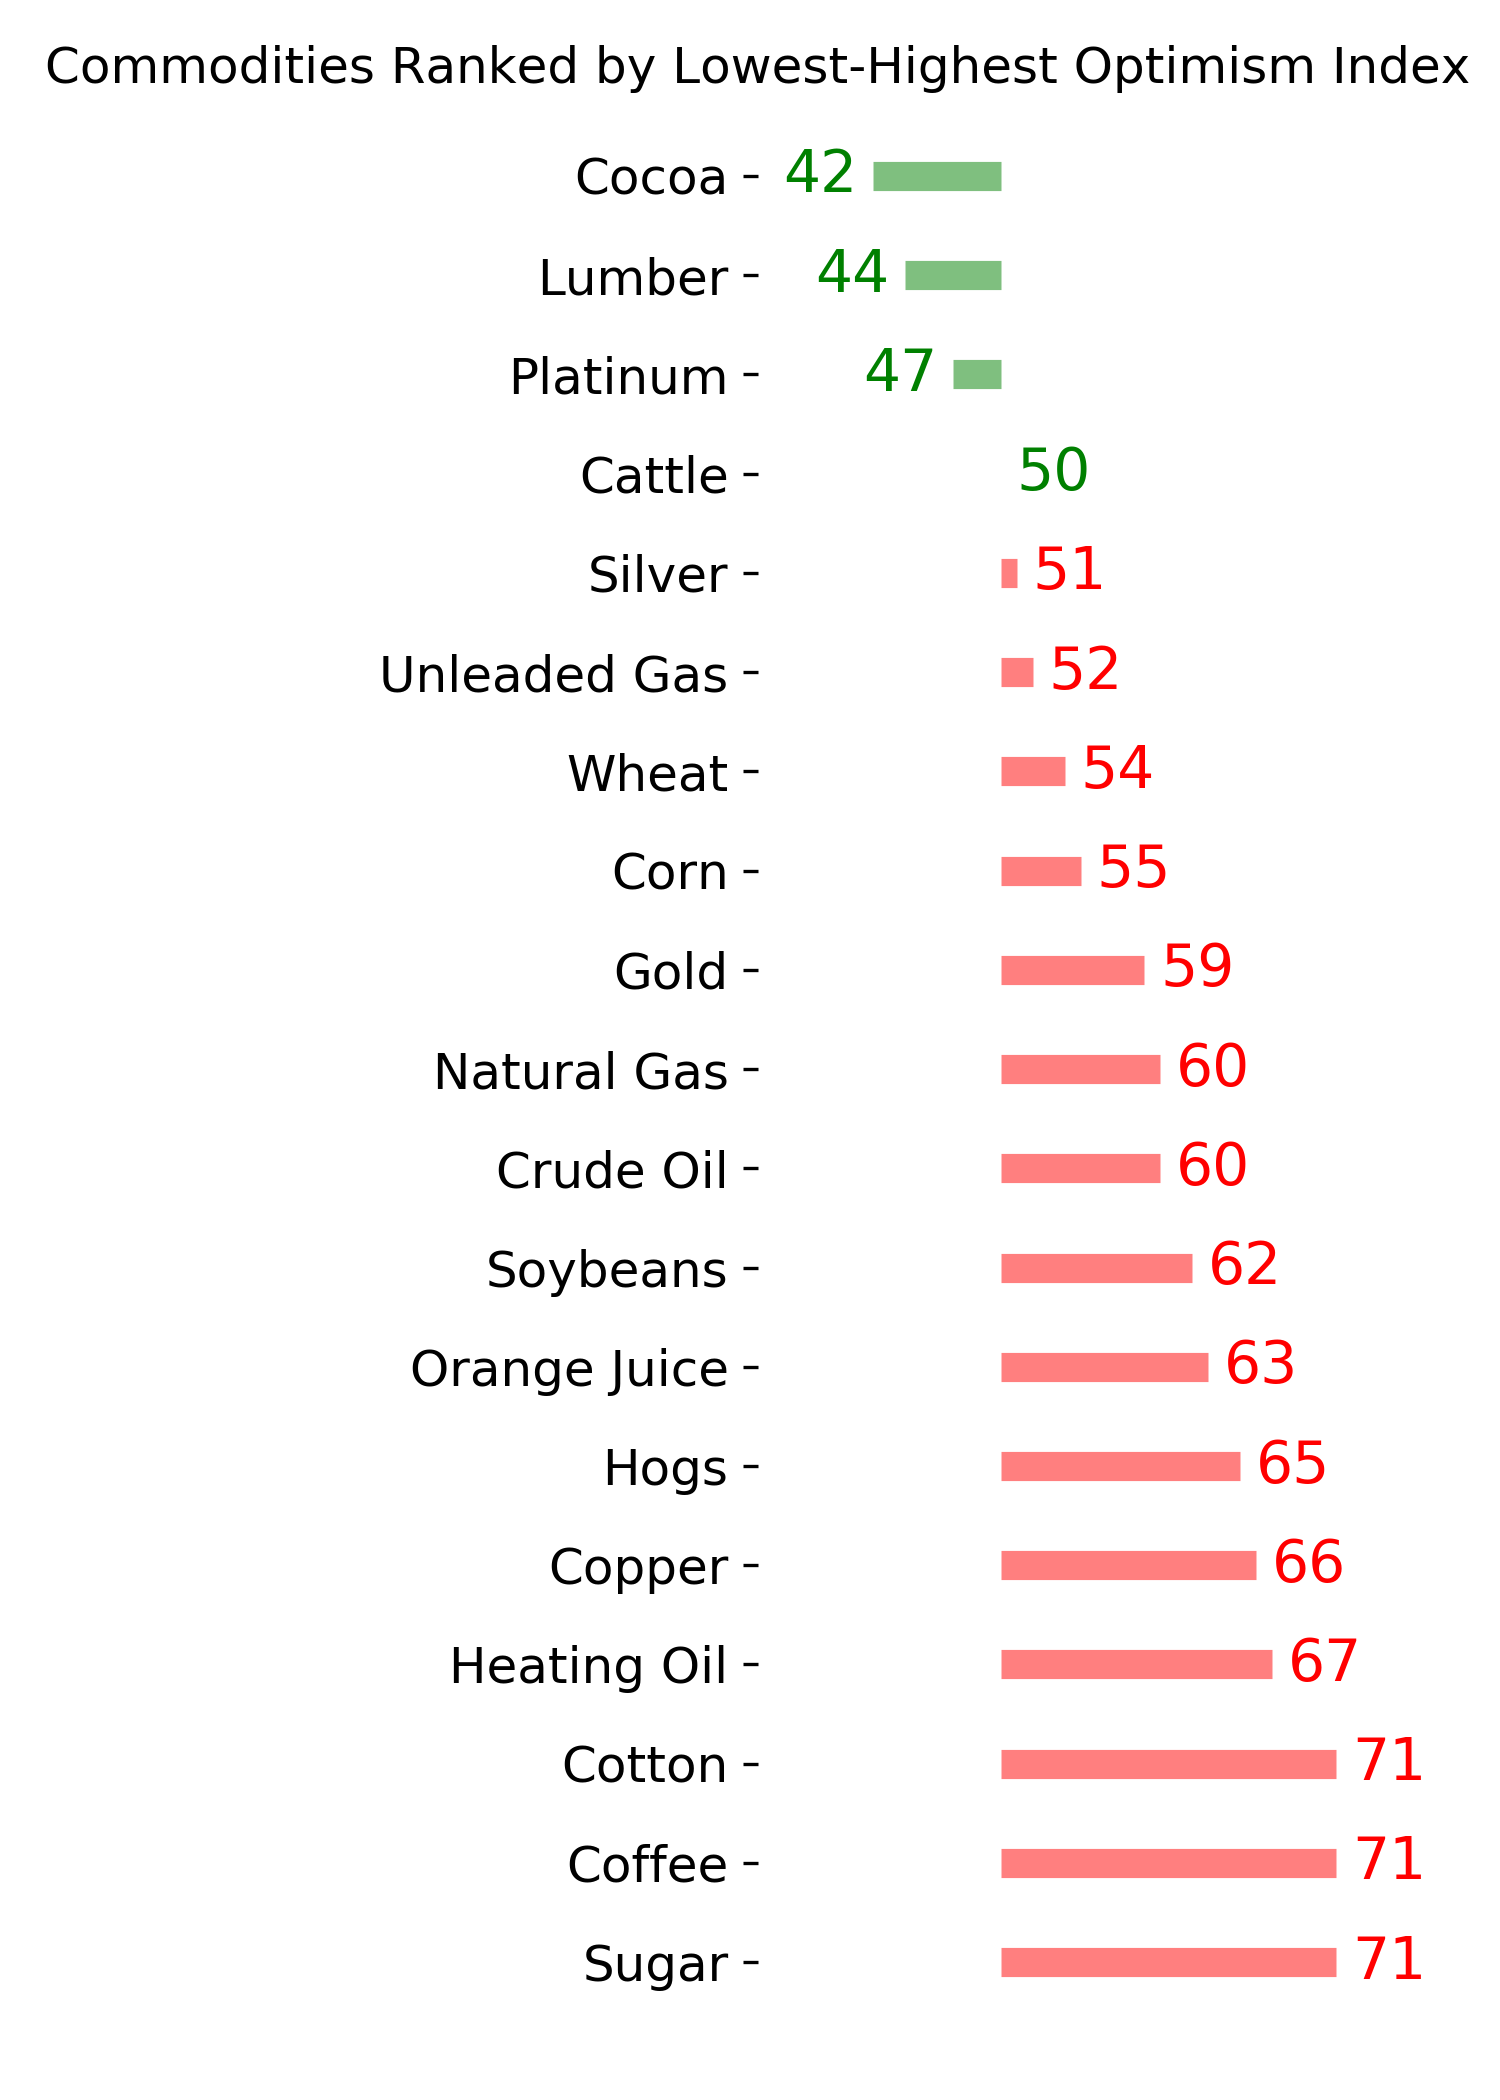
Commodity ETF's - 5-Day Moving Average
|
|