Headlines
|
|
Breadth is breaking out:
The Cumulative Advance/Decline Line has reached a new high for the first time in over a month. That's generally a good thing, though it becomes less so if the S&P 500, and the stocks-only A/D Line, are below their own highs at the time. Which they are now.
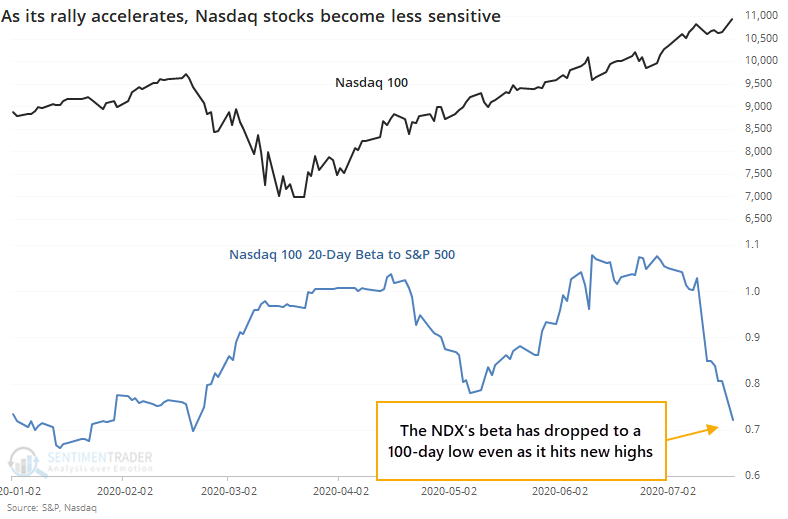
Even as big tech soars, they become "safer":
The big tech stocks driving the Nasdaq 100 have become a sort of safe-haven since the pandemic. As the index has hit new highs, its beta relative to the S&P has actually declined, an unusual situation for a group of stocks that are normally considered highly volatile.
Outflows continue: The exodus from equity funds (both mutual funds and ETFs) has been a theme for months and it's not letting up. The Investment Company Institute reports that domestic funds suffered a nearly $17 billion outflow last week, which is the 11th-largest one-week outflow in more than 15 years. Fund flows are not necessarily a consistent contrary indicator, especially when looking at just one week. The Backtest Engine shows that a weekly outflow of more than $15 billion preceded a gain in the S&P 500 over the next 3 months only 45% of the time.
Bottom Line:
|
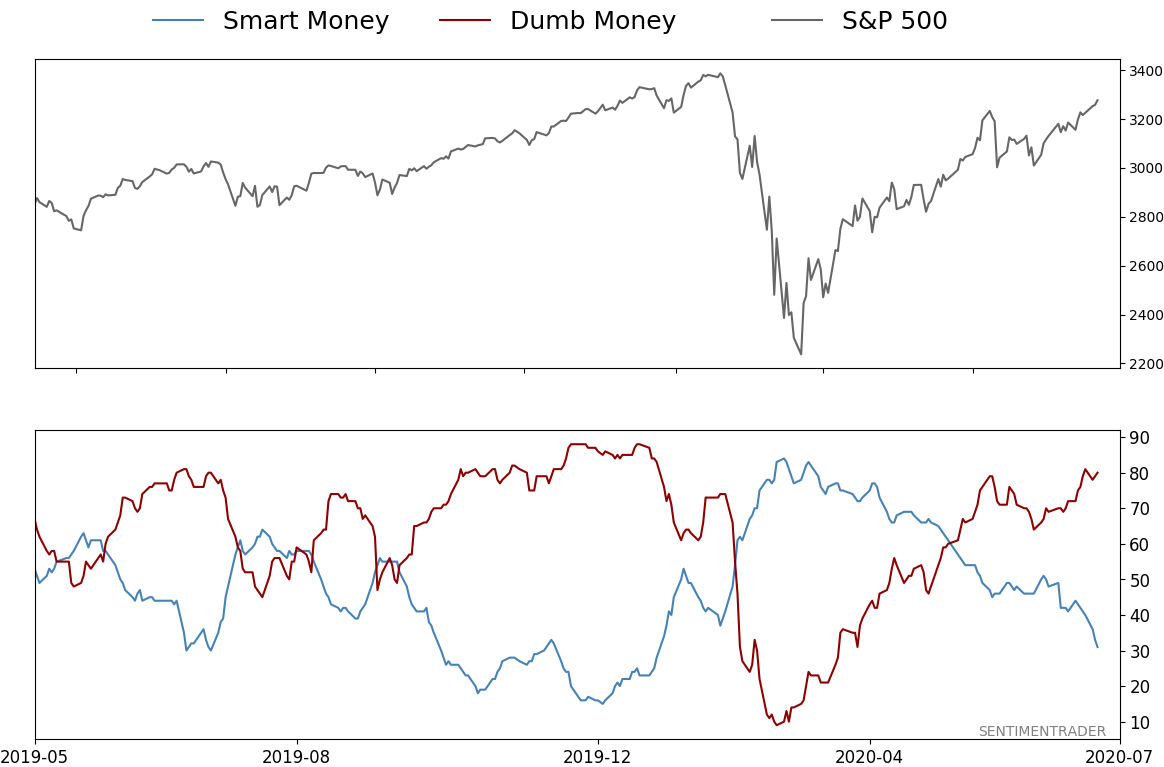
Smart / Dumb Money Confidence
|
Smart Money Confidence: 31%
Dumb Money Confidence: 80%
|
|
Risk Levels
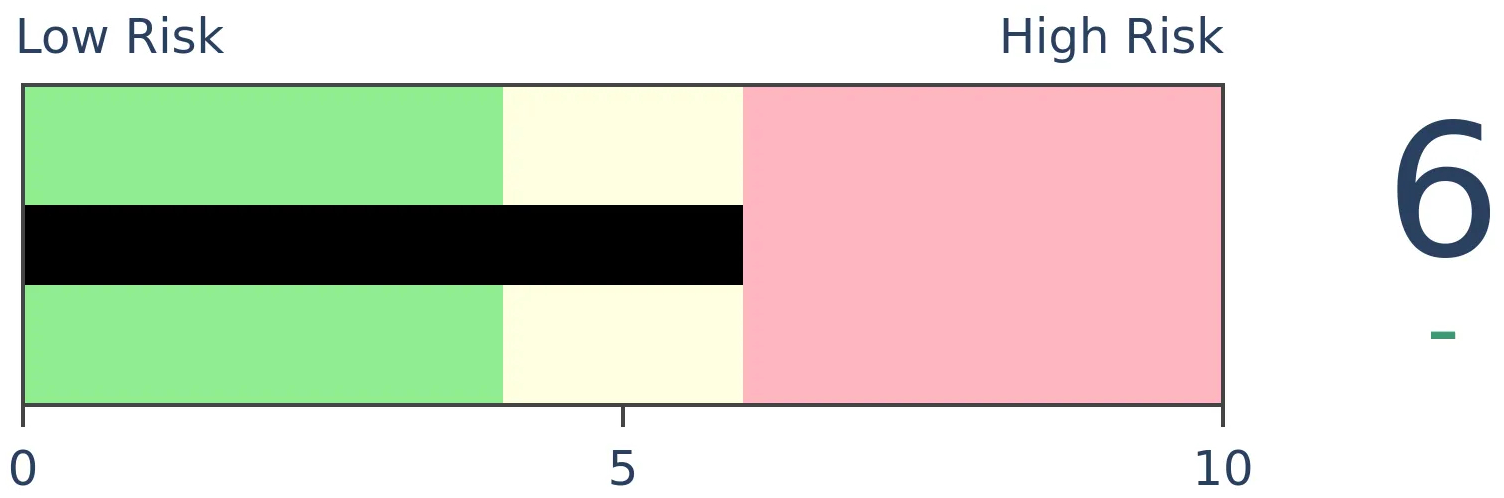
Stocks Short-Term

|
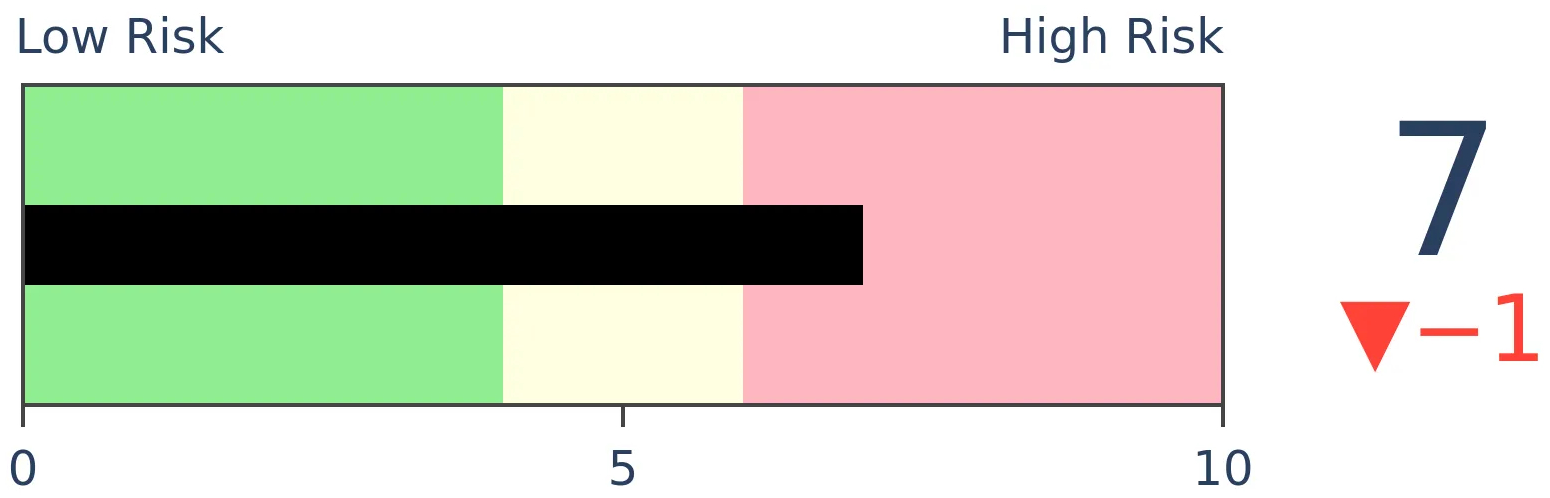
Stocks Medium-Term
|
|
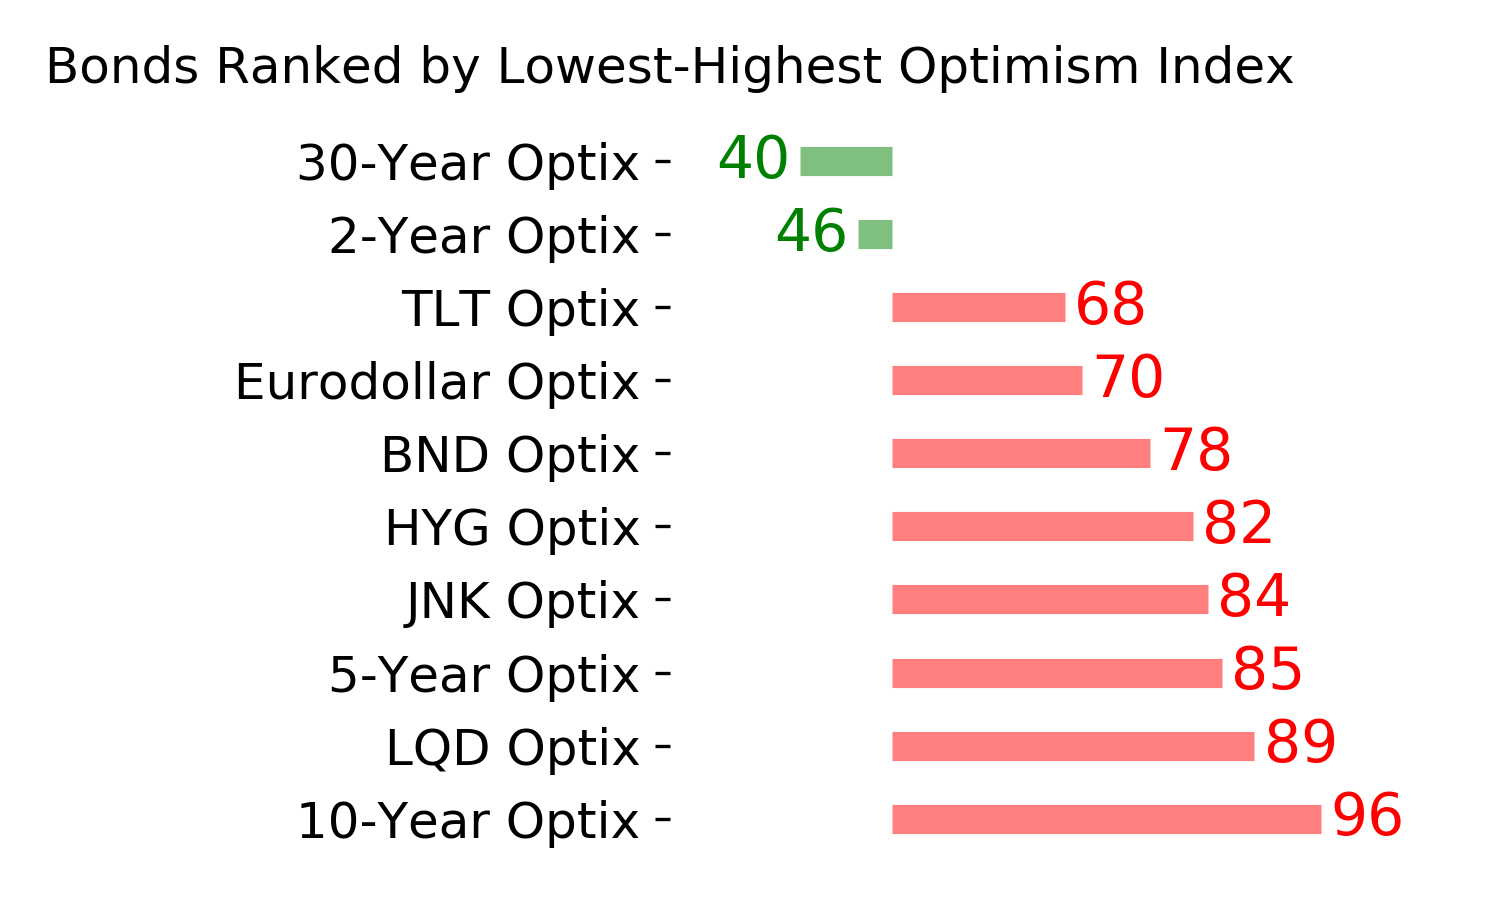
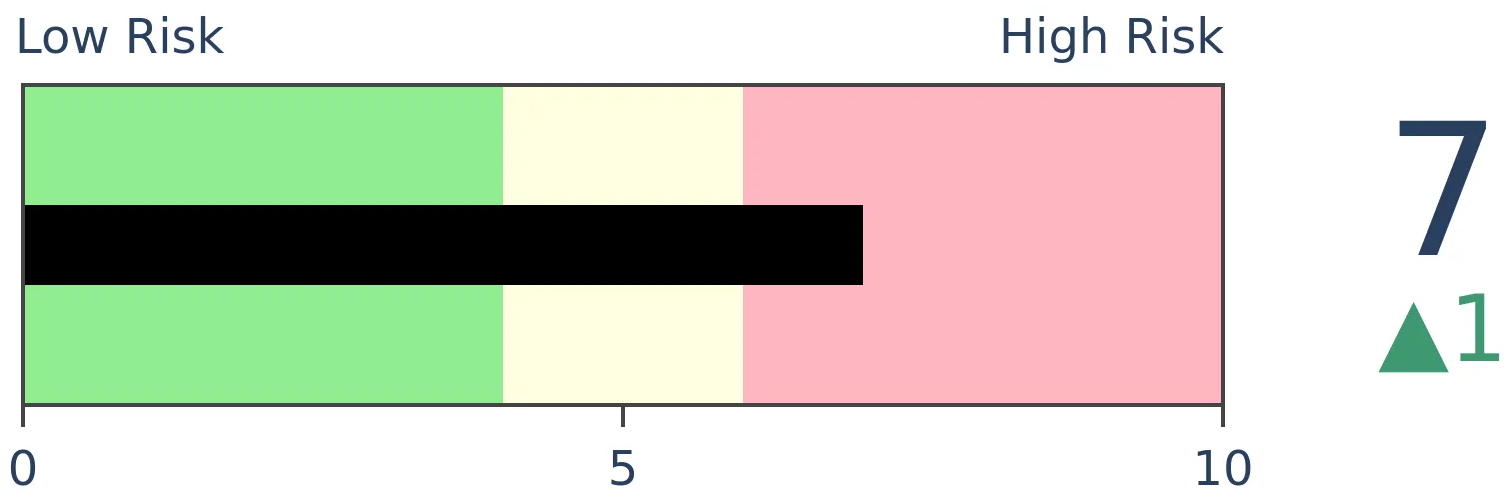
Bonds
|
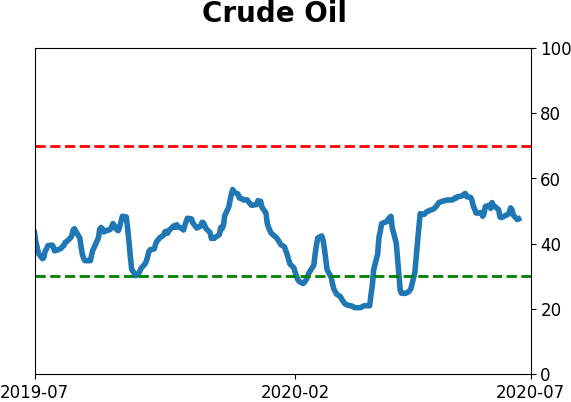
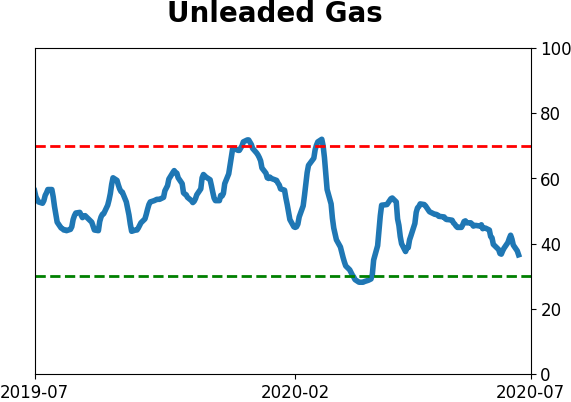
Crude Oil
|
|
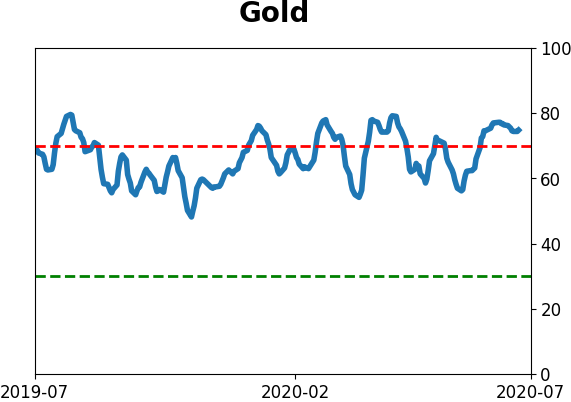
Gold
|
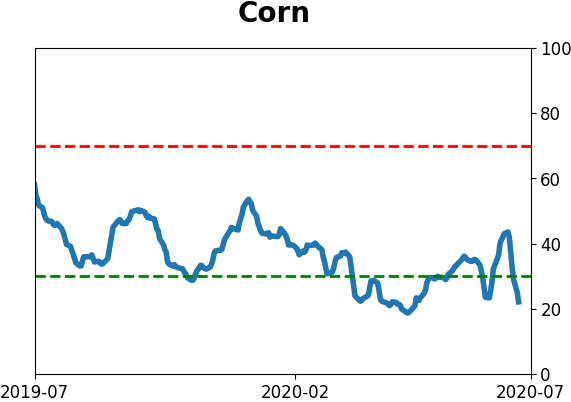
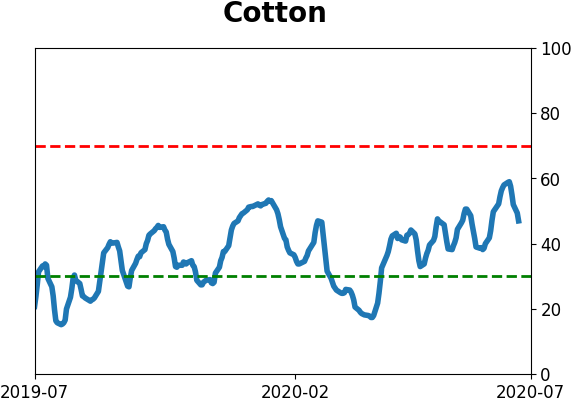
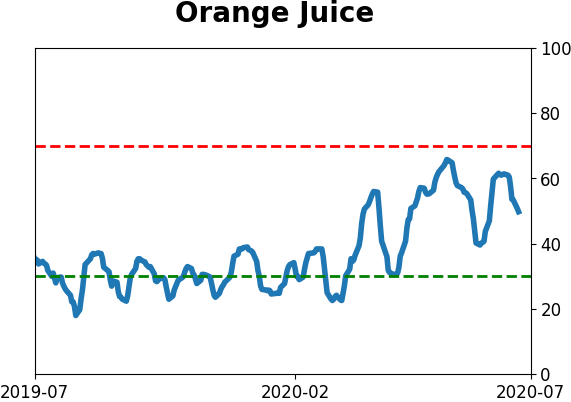
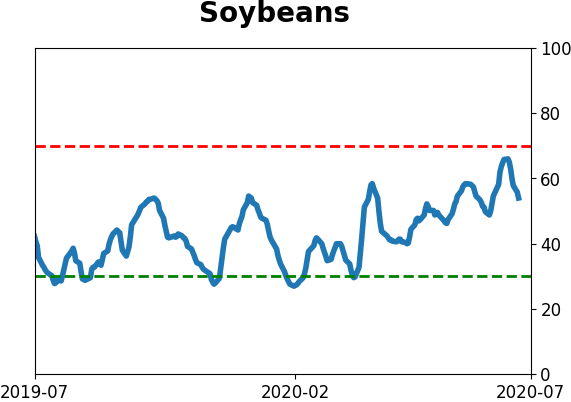
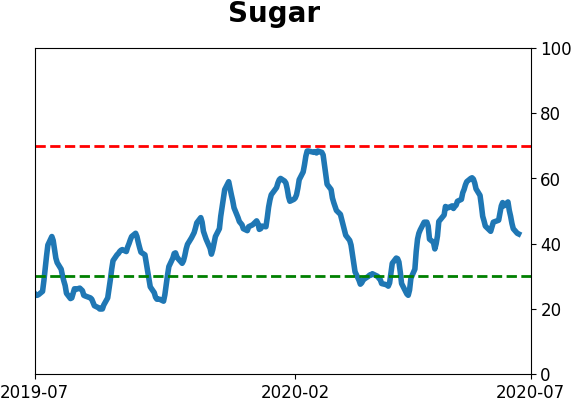
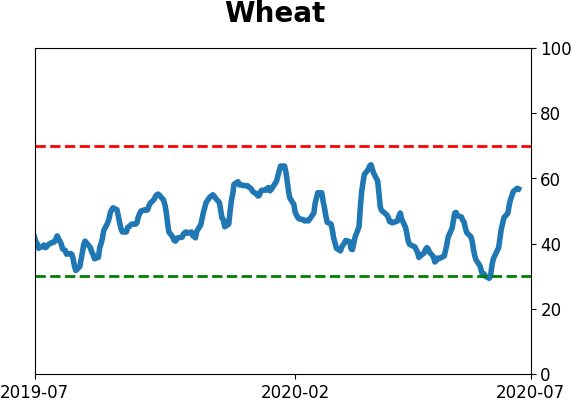
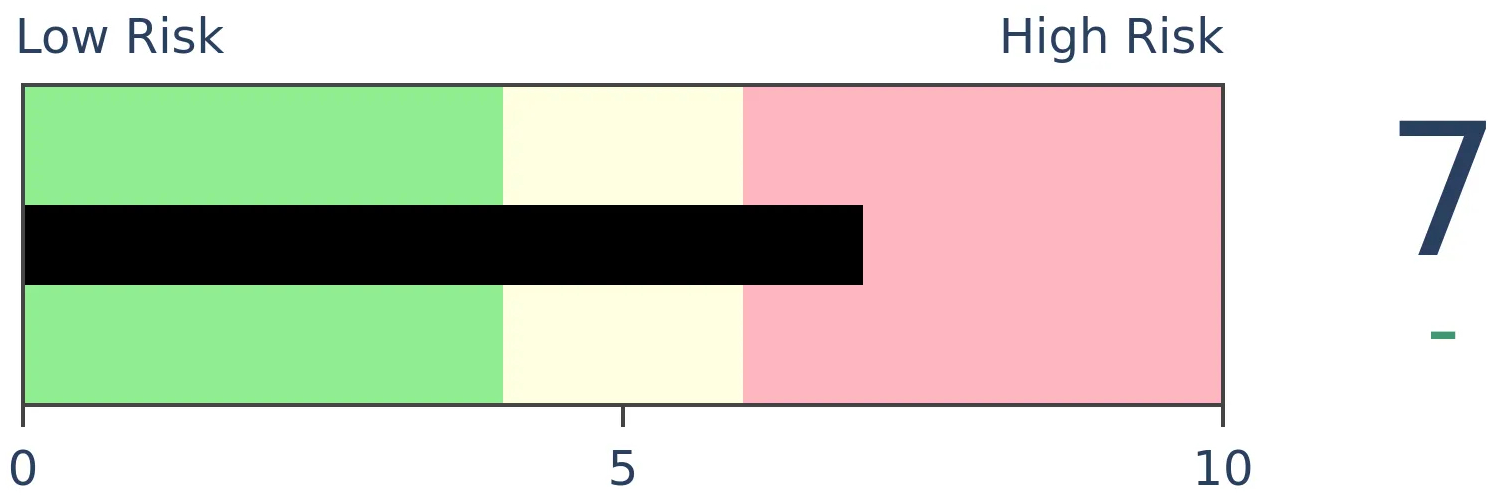
Agriculture

|
|
Research
BOTTOM LINE
The Cumulative Advance/Decline Line has reached a new high for the first time in over a month. That's generally a good thing, though it becomes less so if the S&P 500, and the stocks-only A/D Line, are below their own highs at the time. Which they are now.
FORECAST / TIMEFRAME
None
|
The NYSE Cumulative Advance/Decline Line has just broken out to a new high, exceeding its peak from June, which in turn exceeded the peak from February.
The line is constructed simply by adding each day's difference between the number of advancing and declining securities on the NYSE to the prior day's total. The more consistently we see more securities rising than falling, the higher the line will climb.
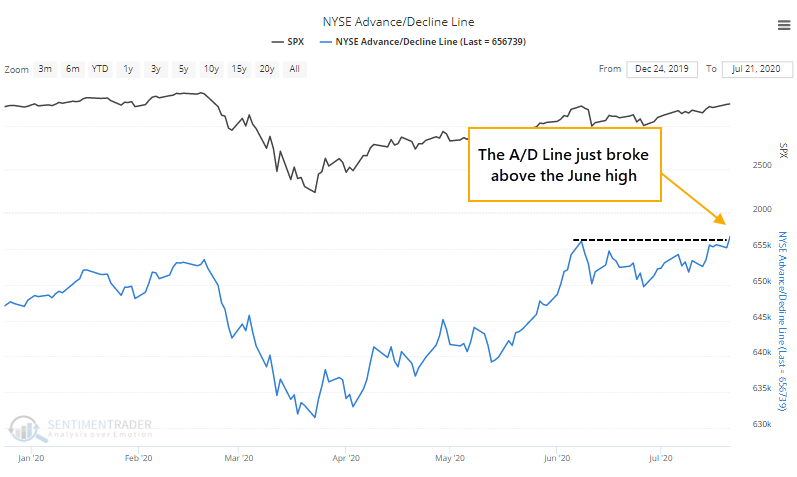
This is supposed to be a good sign, especially with major indexes not necessarily breaking out at the same time. If most securities are mostly rising, then it should eventually drag stocks higher.
Well, let's check. Below, we can see every time since 1940 when the S&P 500 was more than 3.5% below its own 52-week high as the Advance/Decline Line breaks out.
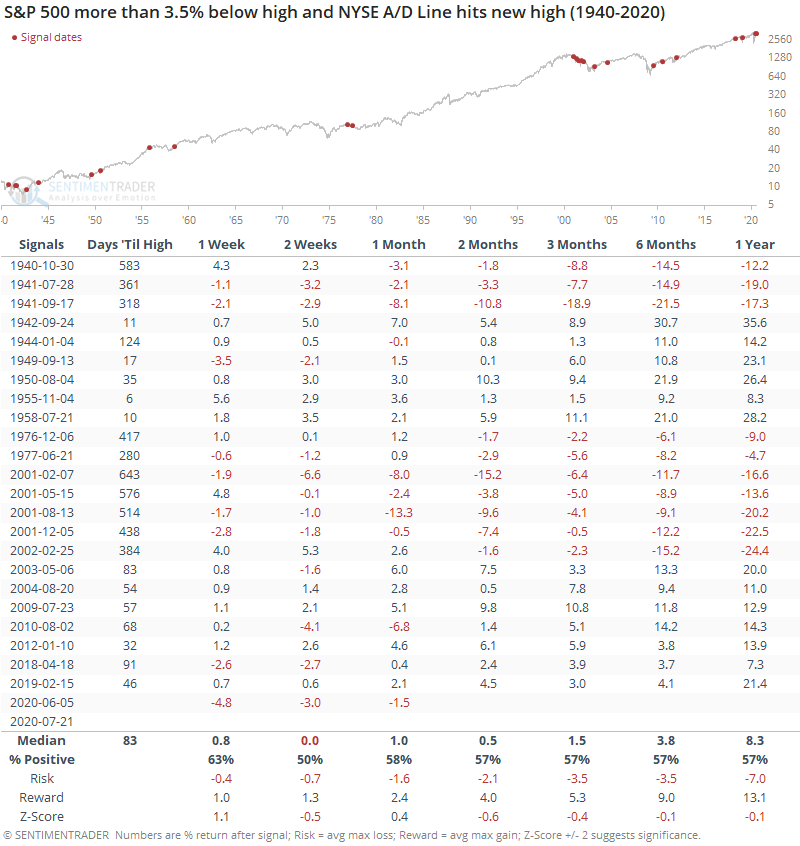
While it's always tempting to think that a breakout in the Advance/Decline Line is a sign that liquidity is plentiful and it's only a matter of time before the S&P gets pulled to a new high as well, it took a median of 83 trading days before it did so. Its forward returns were mediocre at best, with most time frames showing below-average results (a negative z-score) and an uninspiring risk/reward ratio.
It's clear that "something else" is driving the Advance/Decline Line besides just stocks - there are all kinds of securities that trade on the NYSE. And we can see from the High-Yield Bond Cumulative Advance/Decline Line that many rate-sensitive issues, of which there are many on the NYSE, have been doing well. This isn't a bad thing.
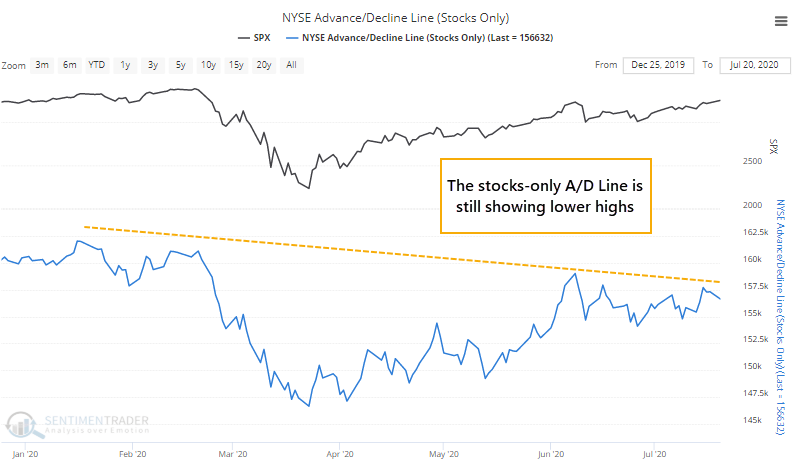
It's just a bit of a worry that the stocks-only line still hasn't broken out. Far from it. This line only includes common stocks, and excludes all the other "stuff" on the NYSE.
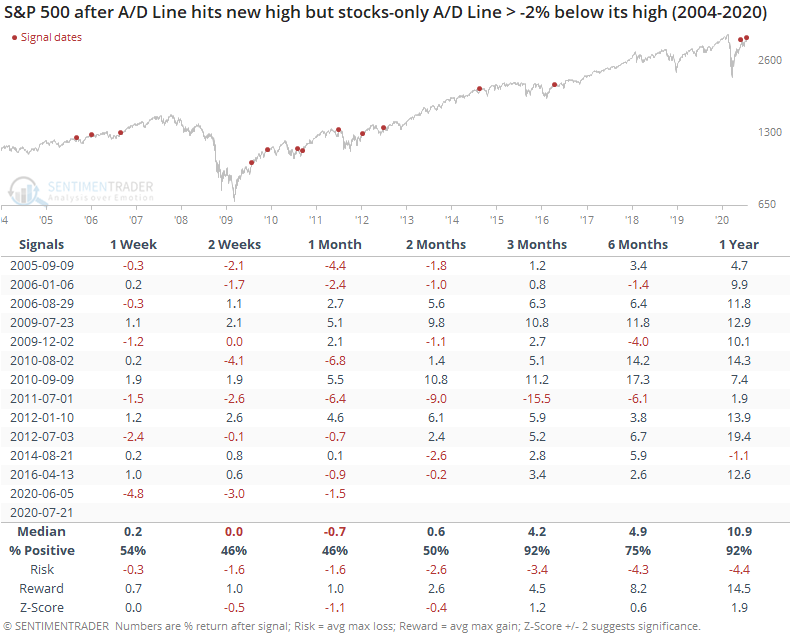
When the all-securities line breaks out for the first time in at least a month, but the stocks-only version lags behind, then the S&P's short-term forward returns were below average. The risk/reward was poor up to two months later.
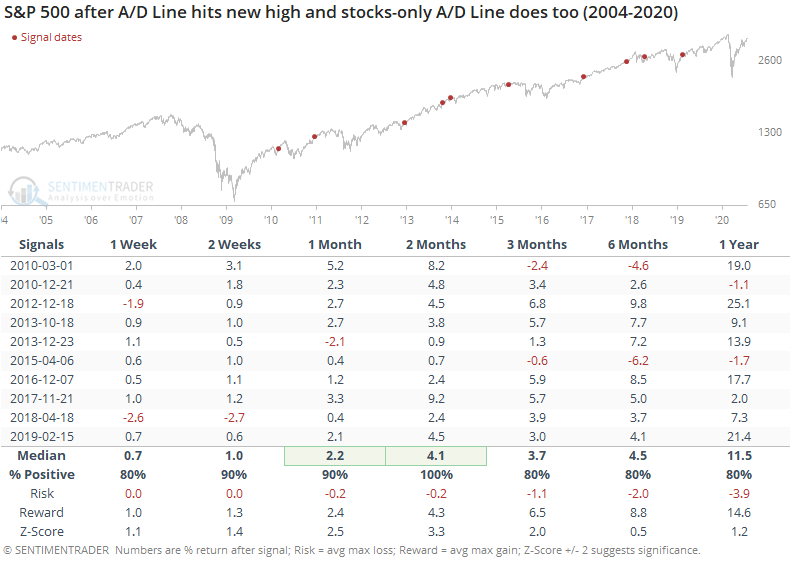
Contrast that to when both lines are at new highs together. Returns were much, much better, with minimal risk going forward.
The new high in the A/D Line is mostly a good thing, but it would be a much better thing if stocks (and the stocks-only A/D Line) were hitting new highs, too. Lags and divergences are generally not a good thing to see. There are also still a worryingly small number of stocks, industries, sectors, and countries trading above their 200-day averages. Healthy markets see these metrics rise, and hold, above 60%.
Even though the S&P is still several percentage points off its peak, one development that bulls might want to grasp onto is that the S&P 500 has turned positive year-to-date by nearly 1% for the first time in months. Seasonality isn't a help at this point, though, so when the index manages to come up for air at this point in the year, it hasn't been much help.
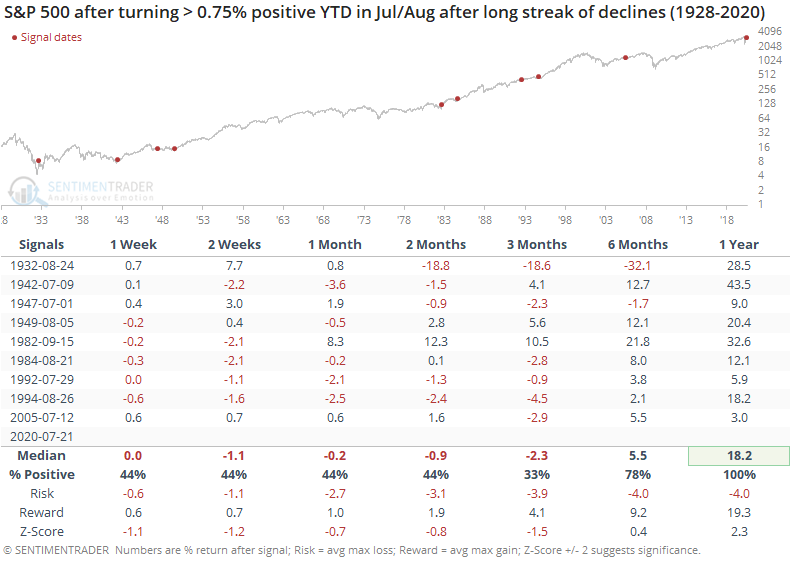
The short-term medium-term returns were very poor as stocks struggled through the rest of the summer months, as there wasn't much evidence of investors trying to chase the index higher. The 6-12 month returns, though, were quite good.
BOTTOM LINE
The big tech stocks driving the Nasdaq 100 have become a sort of safe-haven since the pandemic. As the index has hit new highs, its beta relative to the S&P has actually declined, an unusual situation for a group of stocks that are normally considered highly volatile.
FORECAST / TIMEFRAME
None
|
On the Nasdaq's march to new highs, a curious thing has happened - they've become the "safe" stocks.
As the Wall Street Journal noted, starting during the pandemic, many stocks that would be considered highflying flipped their usual patterns. As indexes like the S&P 500 rose and fell, these stocks rose or fell less than the S&P or even moved in the opposite direction.
On four out of the last seven sessions, the Nasdaq 100 (NDX) has moved less than the S&P 500. Over the past 20 sessions, its beta has plunged to 0.74 relative to the S&P 500, its lowest in more than 100 days.
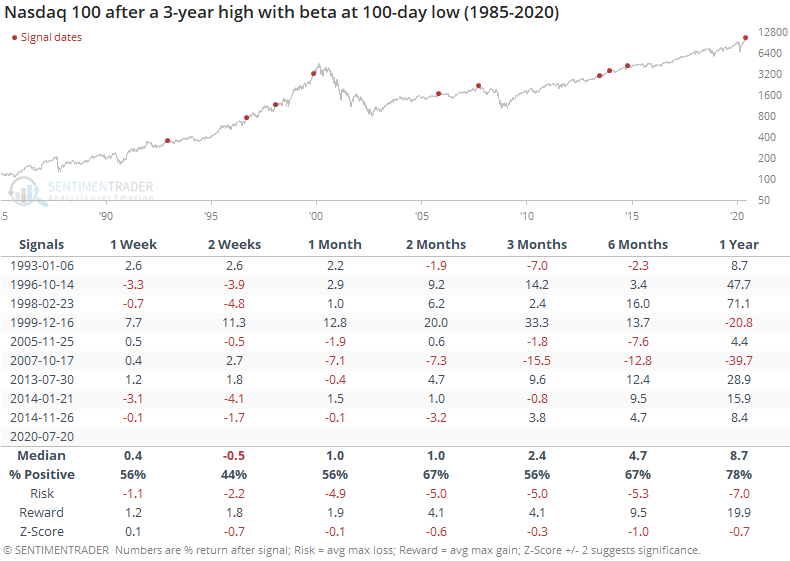
This has been a modest negative for the Nasdaq 100 going forward, with below-average returns and a poor risk/reward ratio, especially up to three months later.
It hasn't been as much of a negative for the broader market, especially over the medium- to long-term. Three months later, the S&P showed only a single loss, though it was a large one.
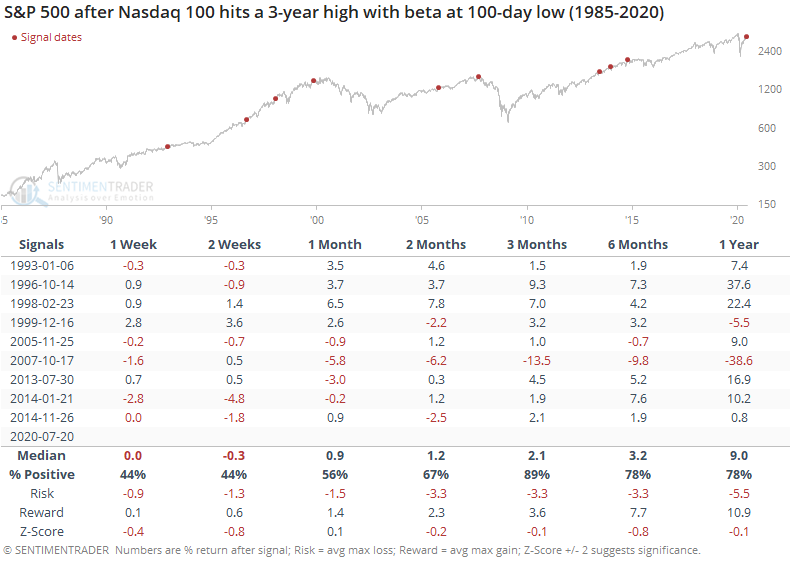
Taken together, this means that the ratio of the Nasdaq 100 to S&P 500 tended to decline, as the big tech stocks took a breather relative to other parts of the market.
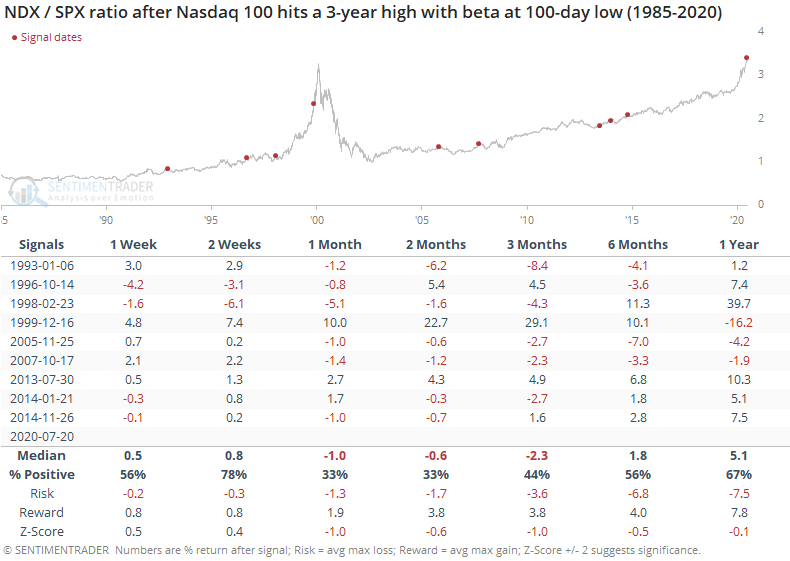
Over the next 1-3 months, the ratio consistently dropped as the S&P outperformed the NDX. There have been other signs in recent weeks that incessant outperformance of these stocks might start to falter, and this is another (minor) one.
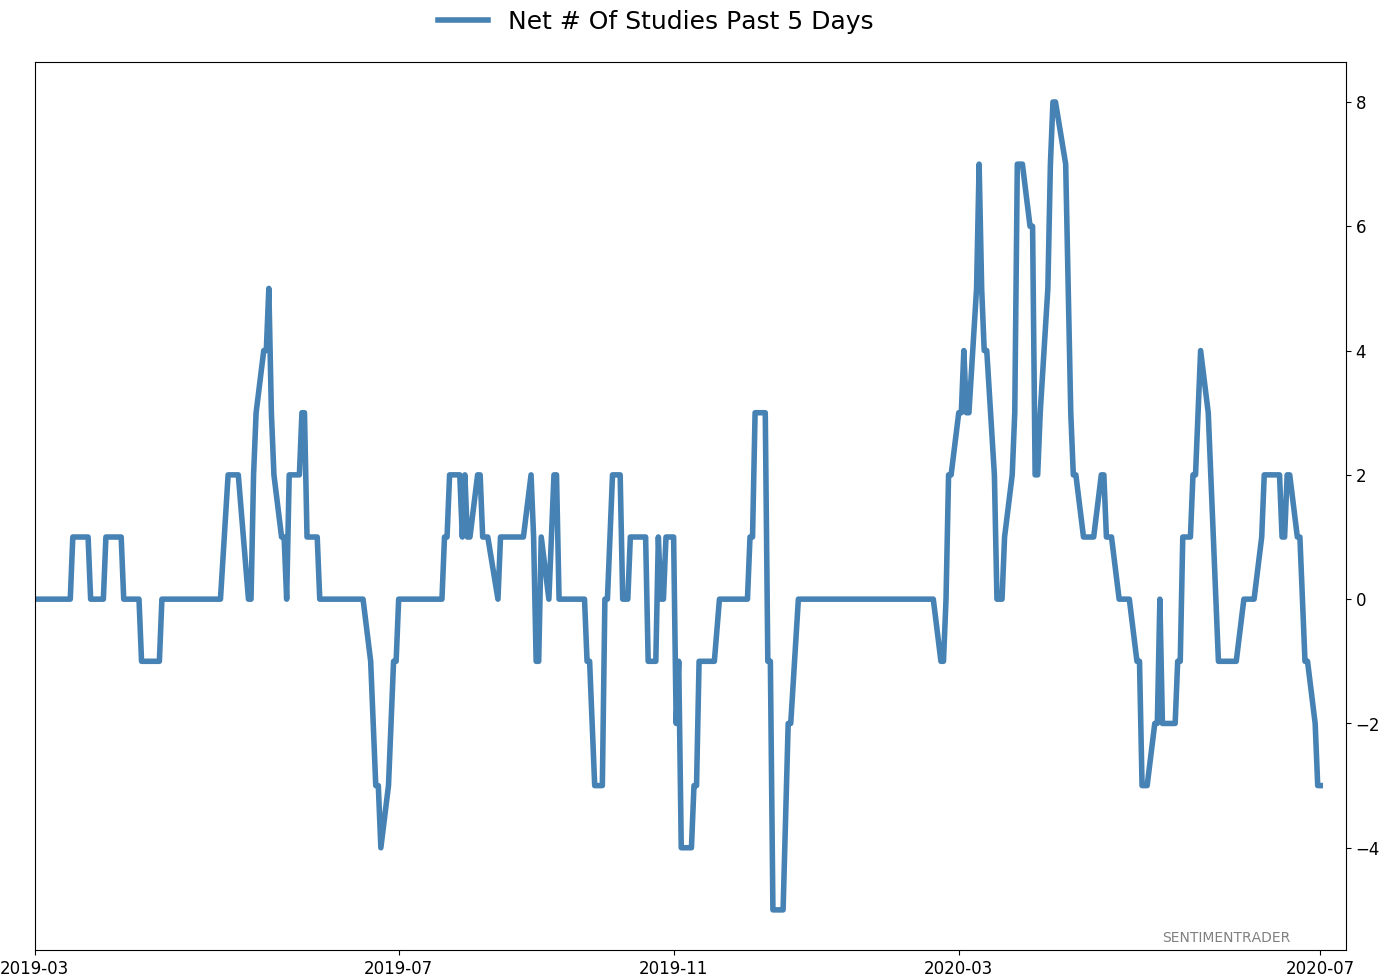
Active Studies
| Time Frame | Bullish | Bearish | | Short-Term | 0 | 0 | | Medium-Term | 8 | 10 | | Long-Term | 44 | 1 |
|
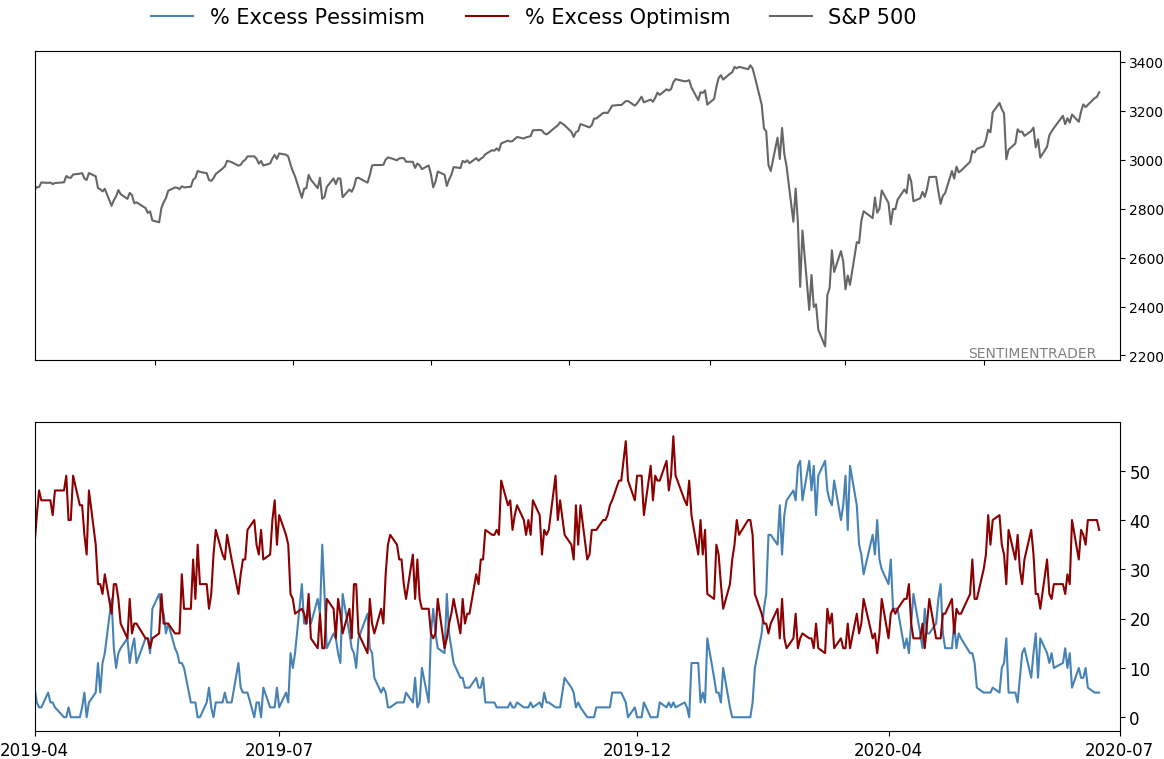
Indicators at Extremes
Portfolio
| Position | Weight % | Added / Reduced | Date | | Stocks | 29.8 | Reduced 9.1% | 2020-06-11 | | Bonds | 0.0 | Reduced 6.7% | 2020-02-28 | | Commodities | 5.2 | Added 2.4%
| 2020-02-28 | | Precious Metals | 0.0 | Reduced 3.6% | 2020-02-28 | | Special Situations | 0.0 | Reduced 31.9% | 2020-03-17 | | Cash | 65.0 | | |
|
Updates (Changes made today are underlined)
In the first months of the year, we saw manic trading activity. From big jumps in specific stocks to historic highs in retail trading activity to record highs in household confidence to almost unbelievable confidence among options traders. All of that came amid a market where the average stock couldn't keep up with their indexes. There were signs of waning momentum in stocks underlying the major averages, which started triggering technical warning signs in late January. After stocks bottomed on the 23rd, they enjoyed a historic buying thrust and retraced a larger amount of the decline than "just a bear market rally" tends to. Those thrusts are the most encouraging sign we've seen in years. Through early June, we were still seeing thrusts that have led to recoveries in longer-term breadth metrics. The longer-term prospects for stocks (6-12 months) still look decent given the above. On a short- to medium-term basis, it was getting harder to make that case. Dumb Money Confidence spiked and there were multiple signs of a historic level of speculation. This is likely the lowest I will go given what I still consider to be compelling positives over a longer time frame. There is not a slam-dunk case to be made for either direction, so it will seem like a mistake whether stocks keep dropping (why didn't I sell more?) or if they turn and head higher (why did I let short-term concerns prevail?). After nearly three decades of trading, I've learned to let go of the idea of perfection.
RETURN YTD: -3.8% 2019: 12.6%, 2018: 0.6%, 2017: 3.8%, 2016: 17.1%, 2015: 9.2%, 2014: 14.5%, 2013: 2.2%, 2012: 10.8%, 2011: 16.5%, 2010: 15.3%, 2009: 23.9%, 2008: 16.2%, 2007: 7.8%
|
|
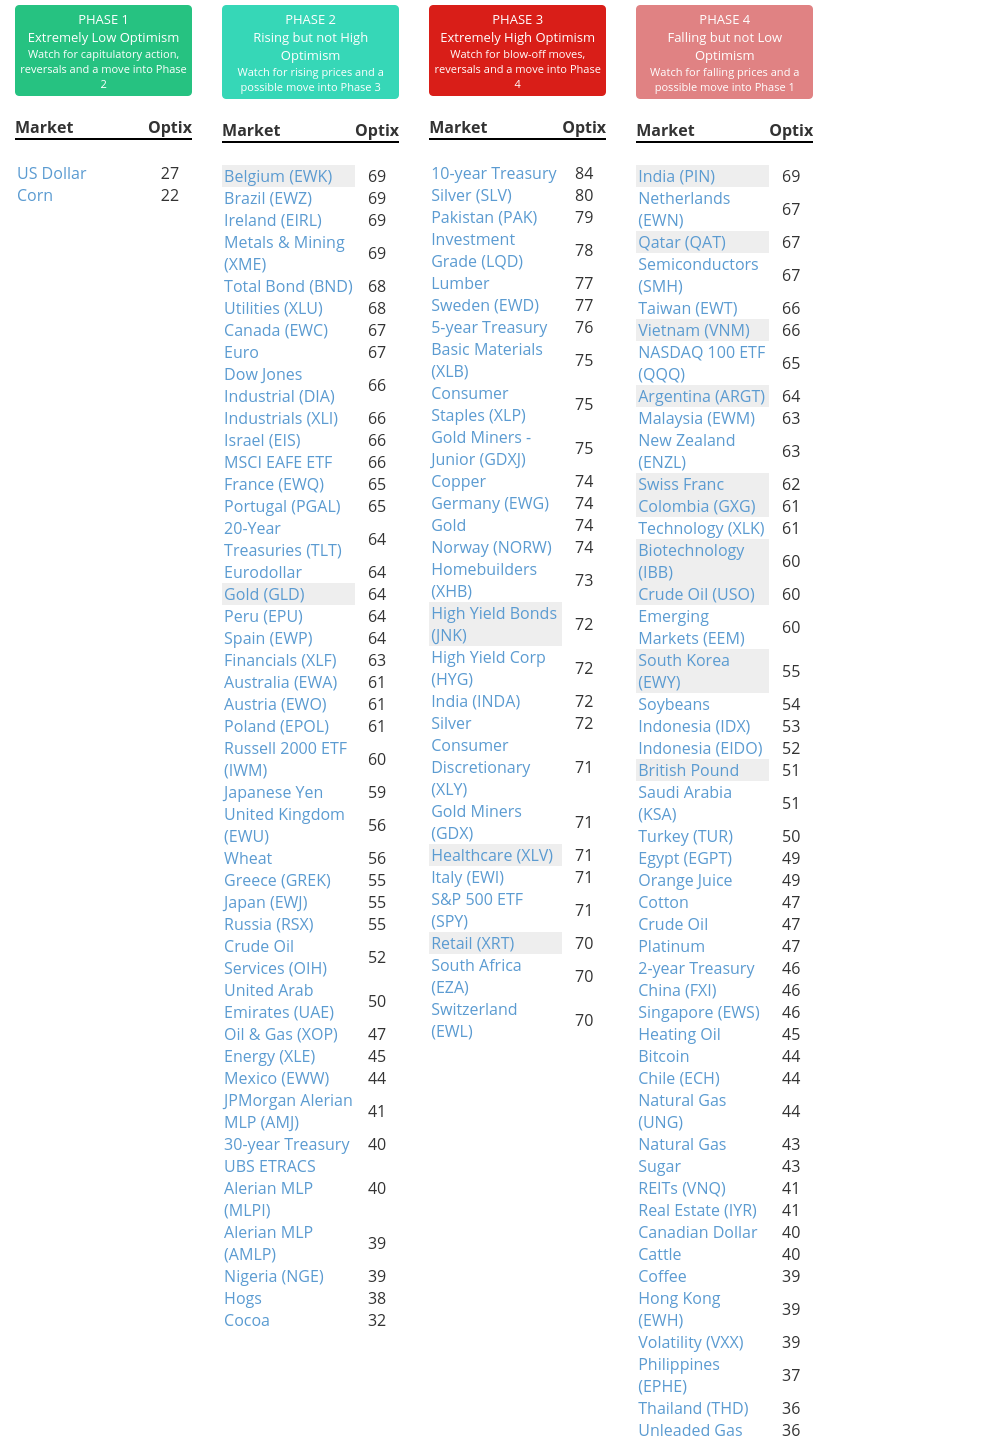
Phase Table
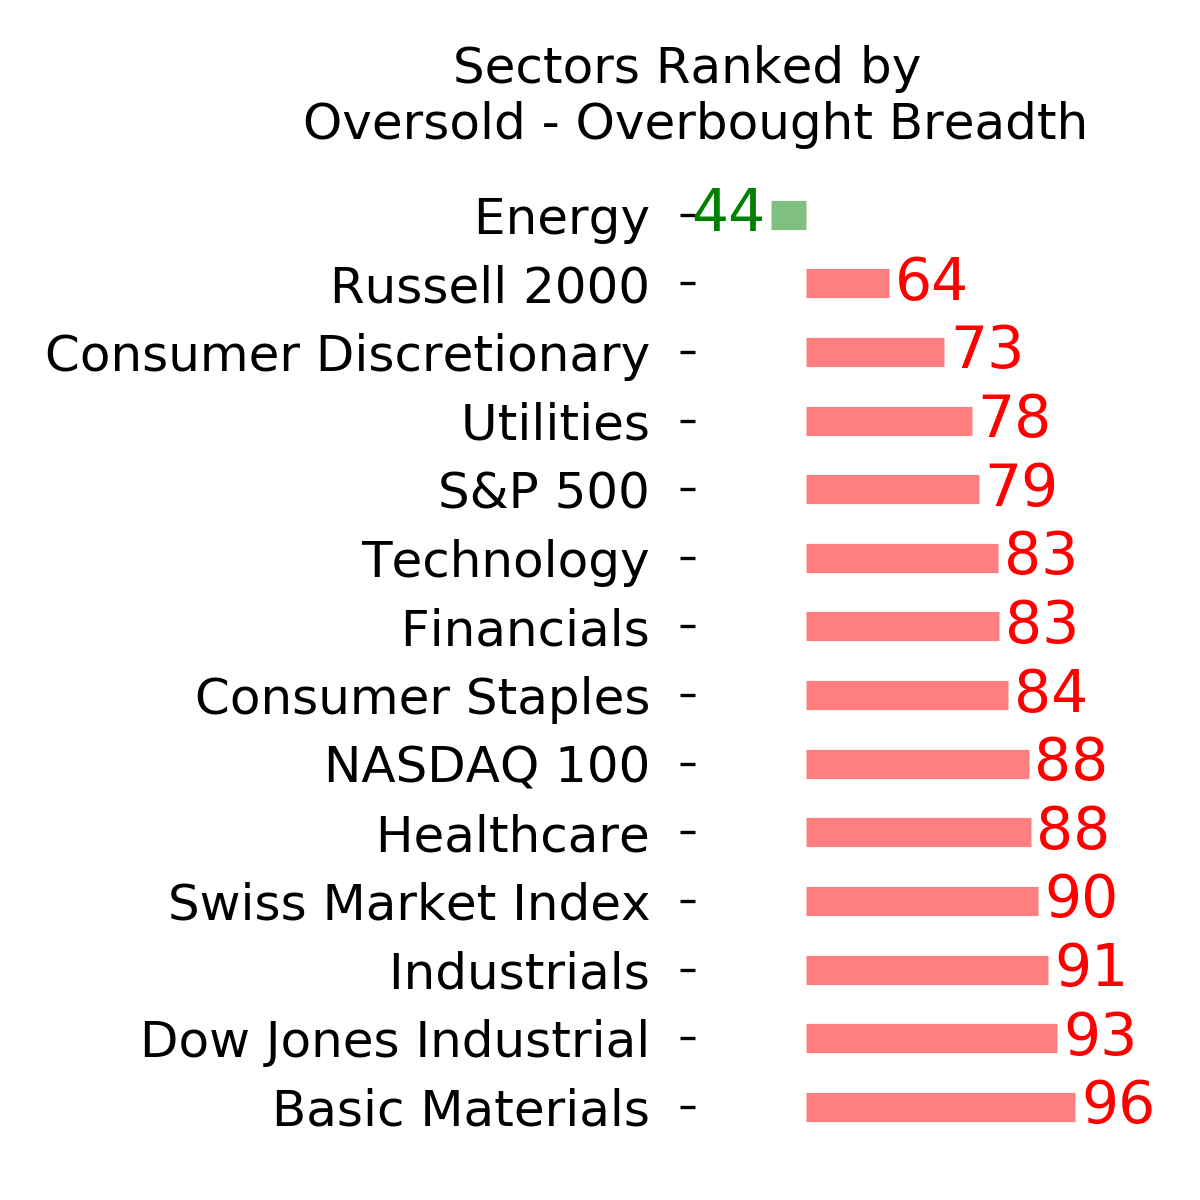
Ranks
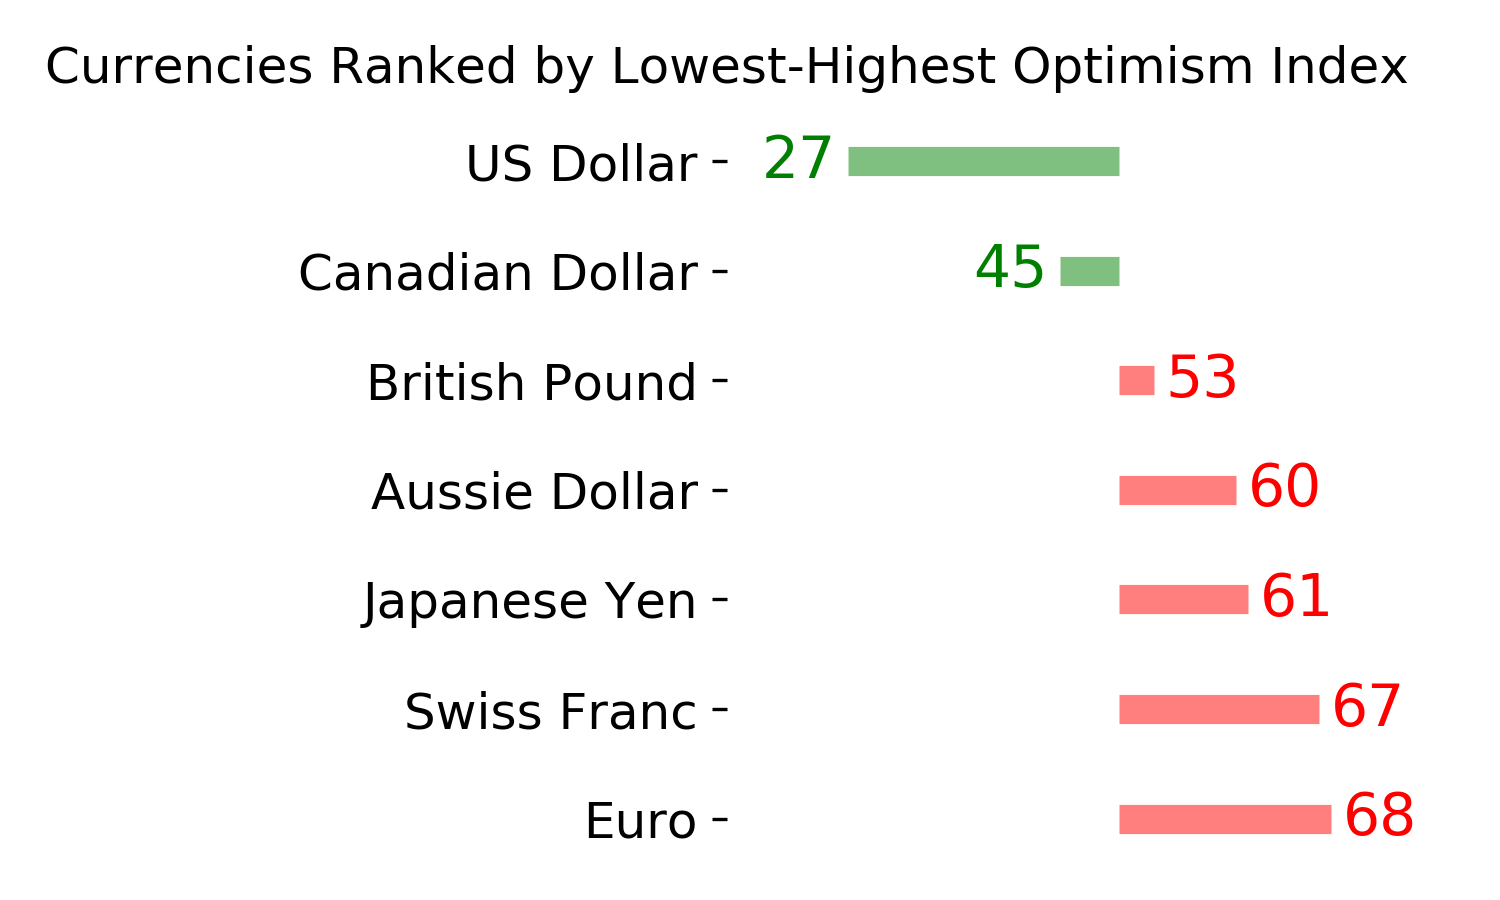
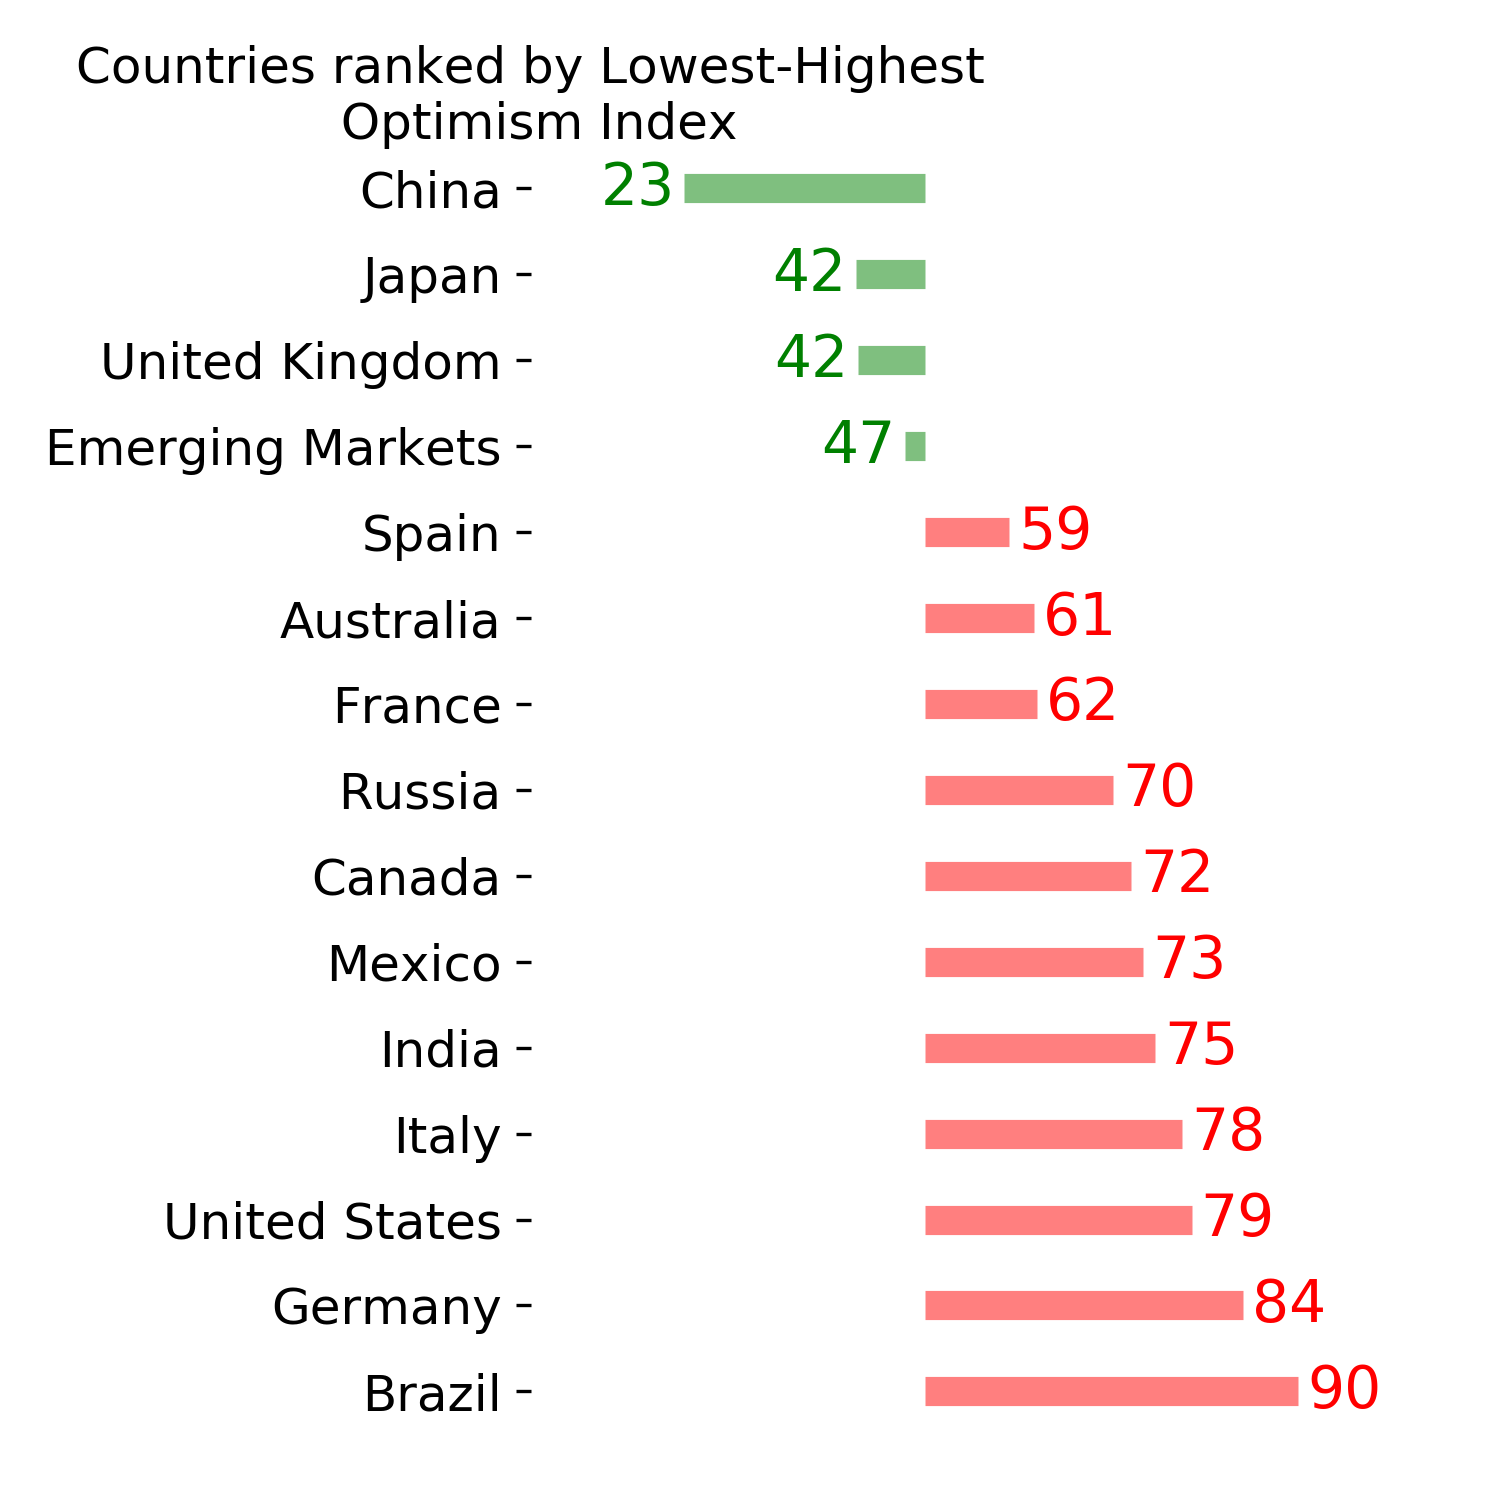
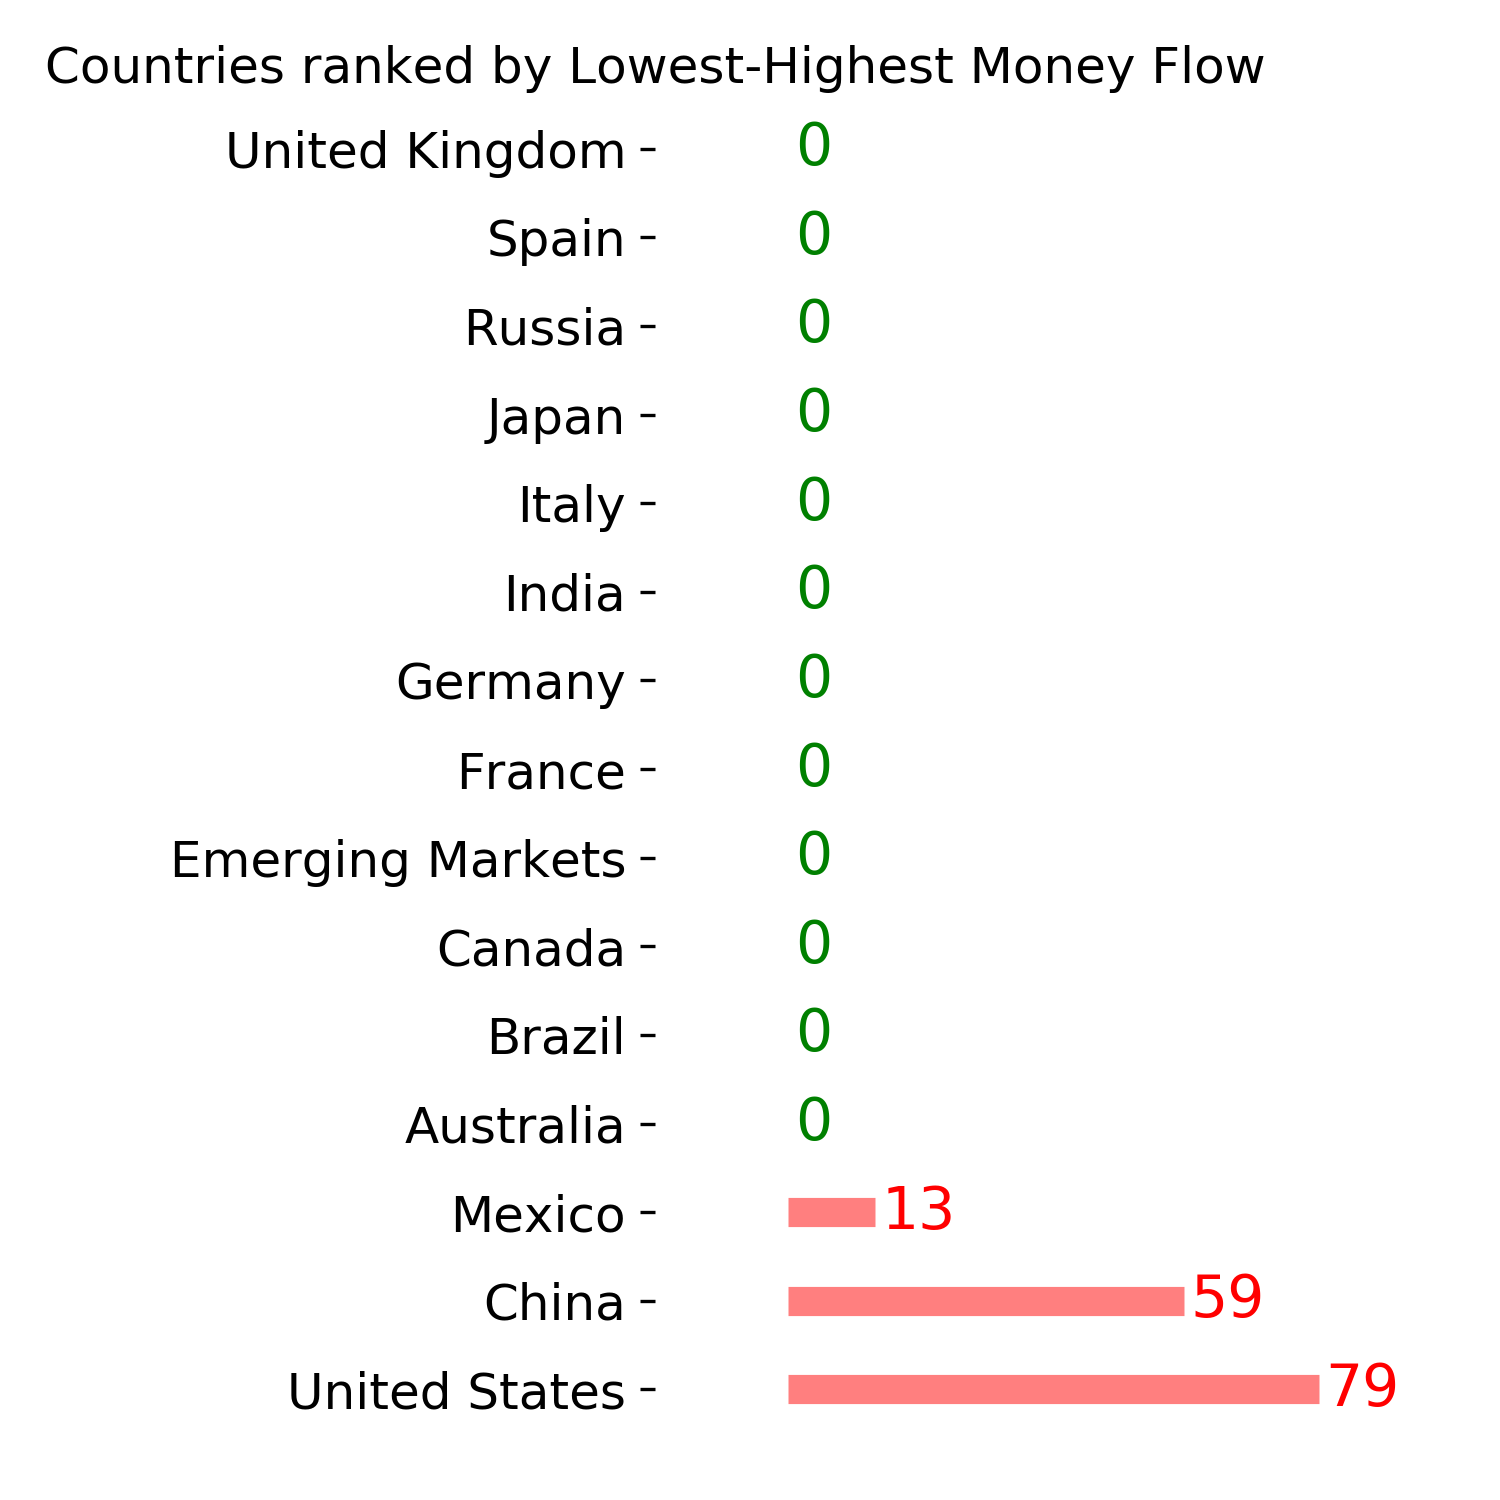
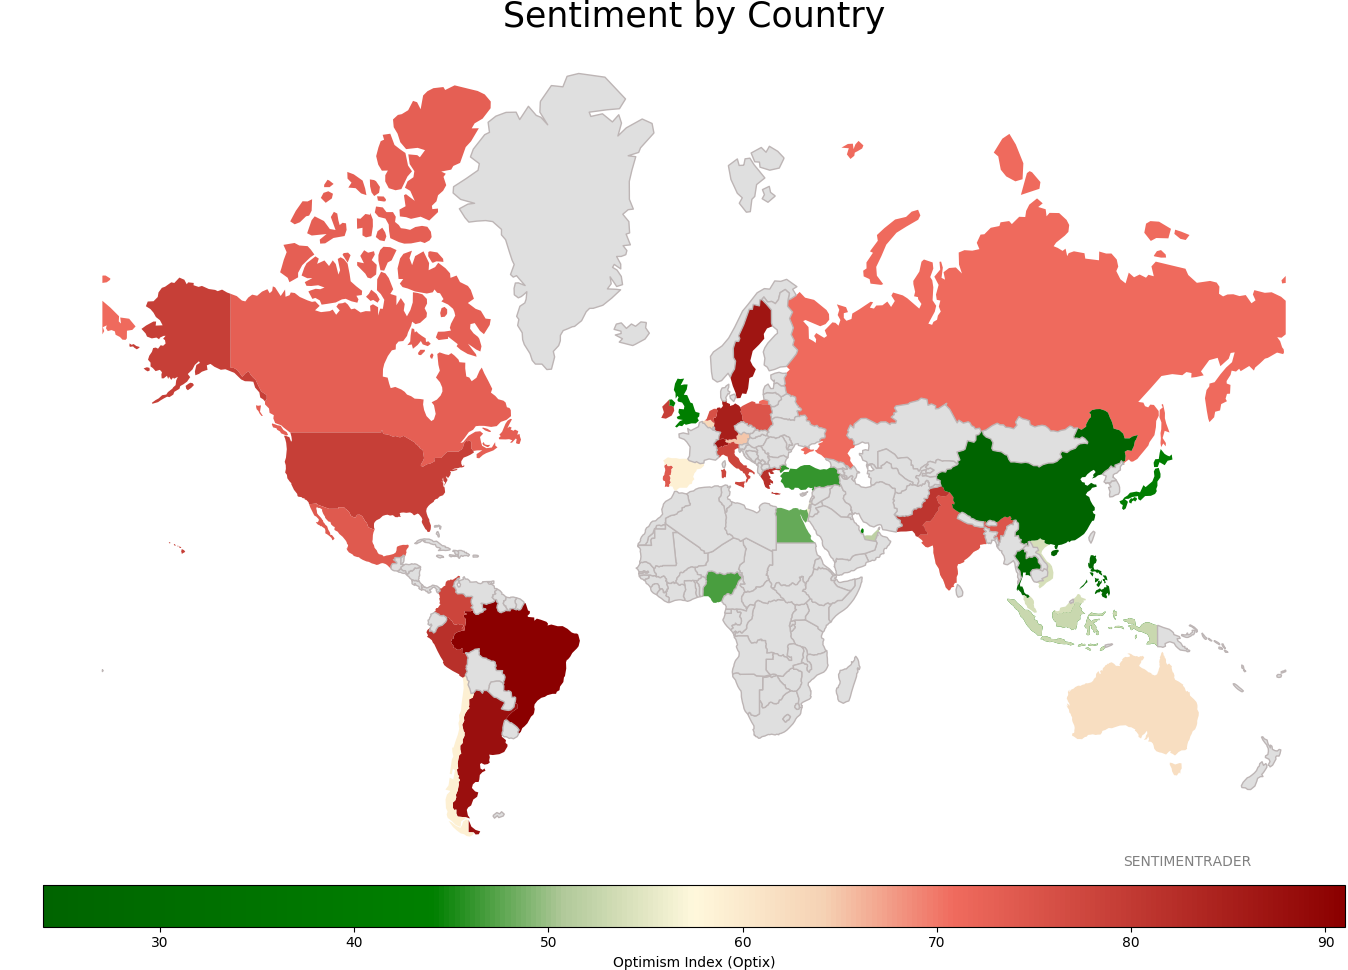
Sentiment Around The World
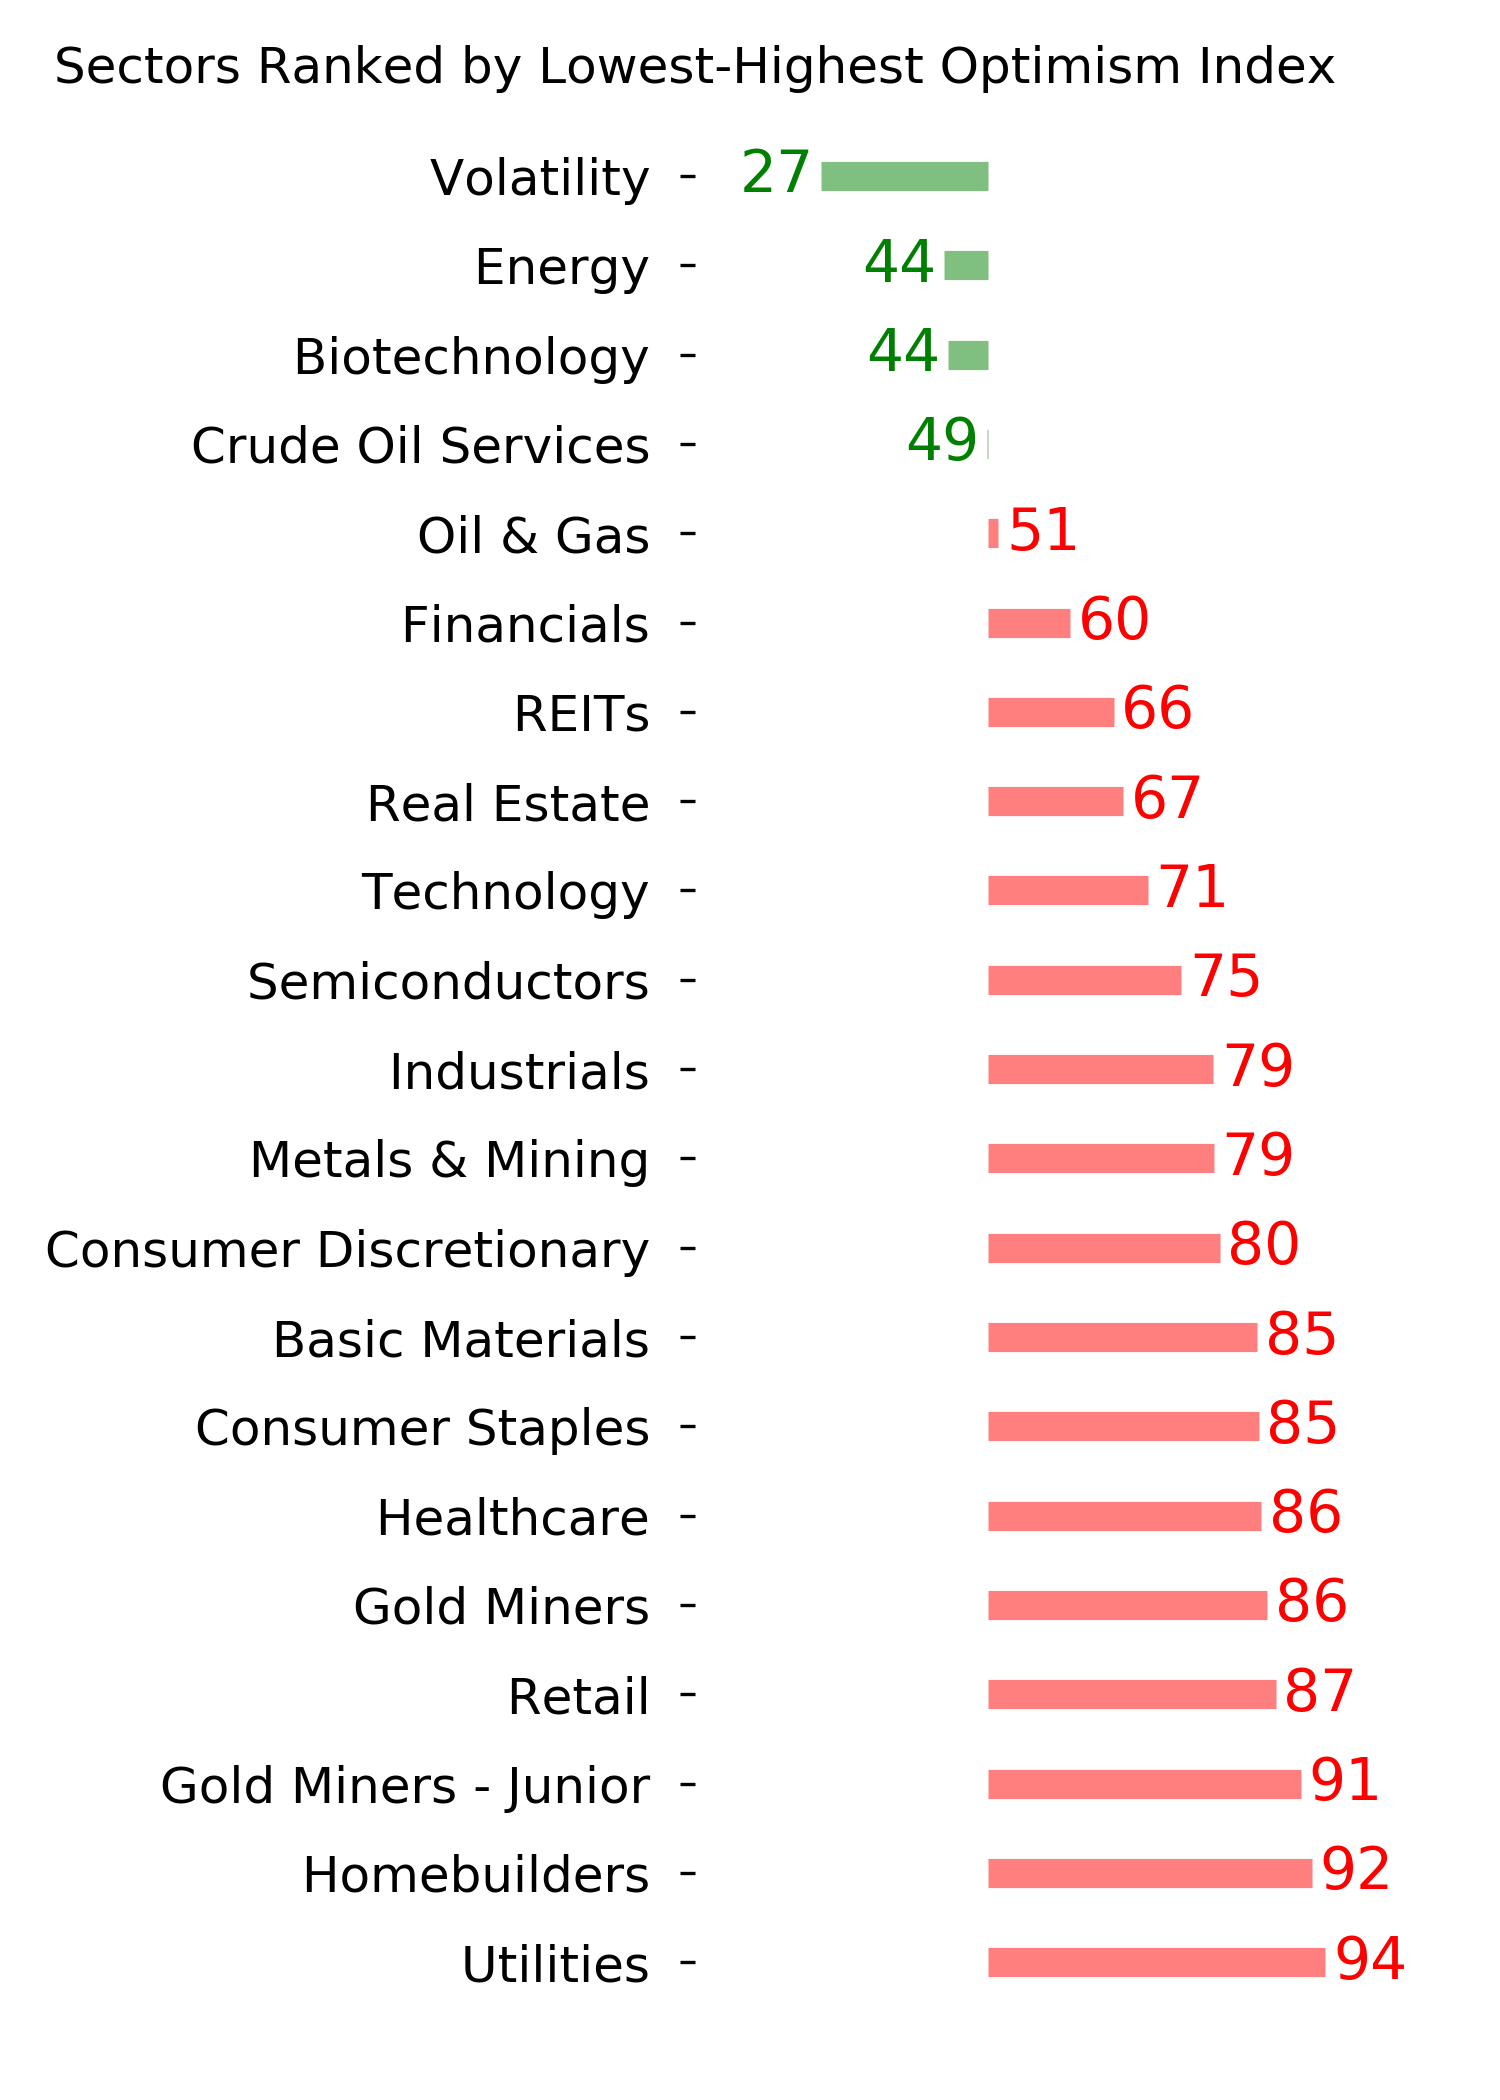
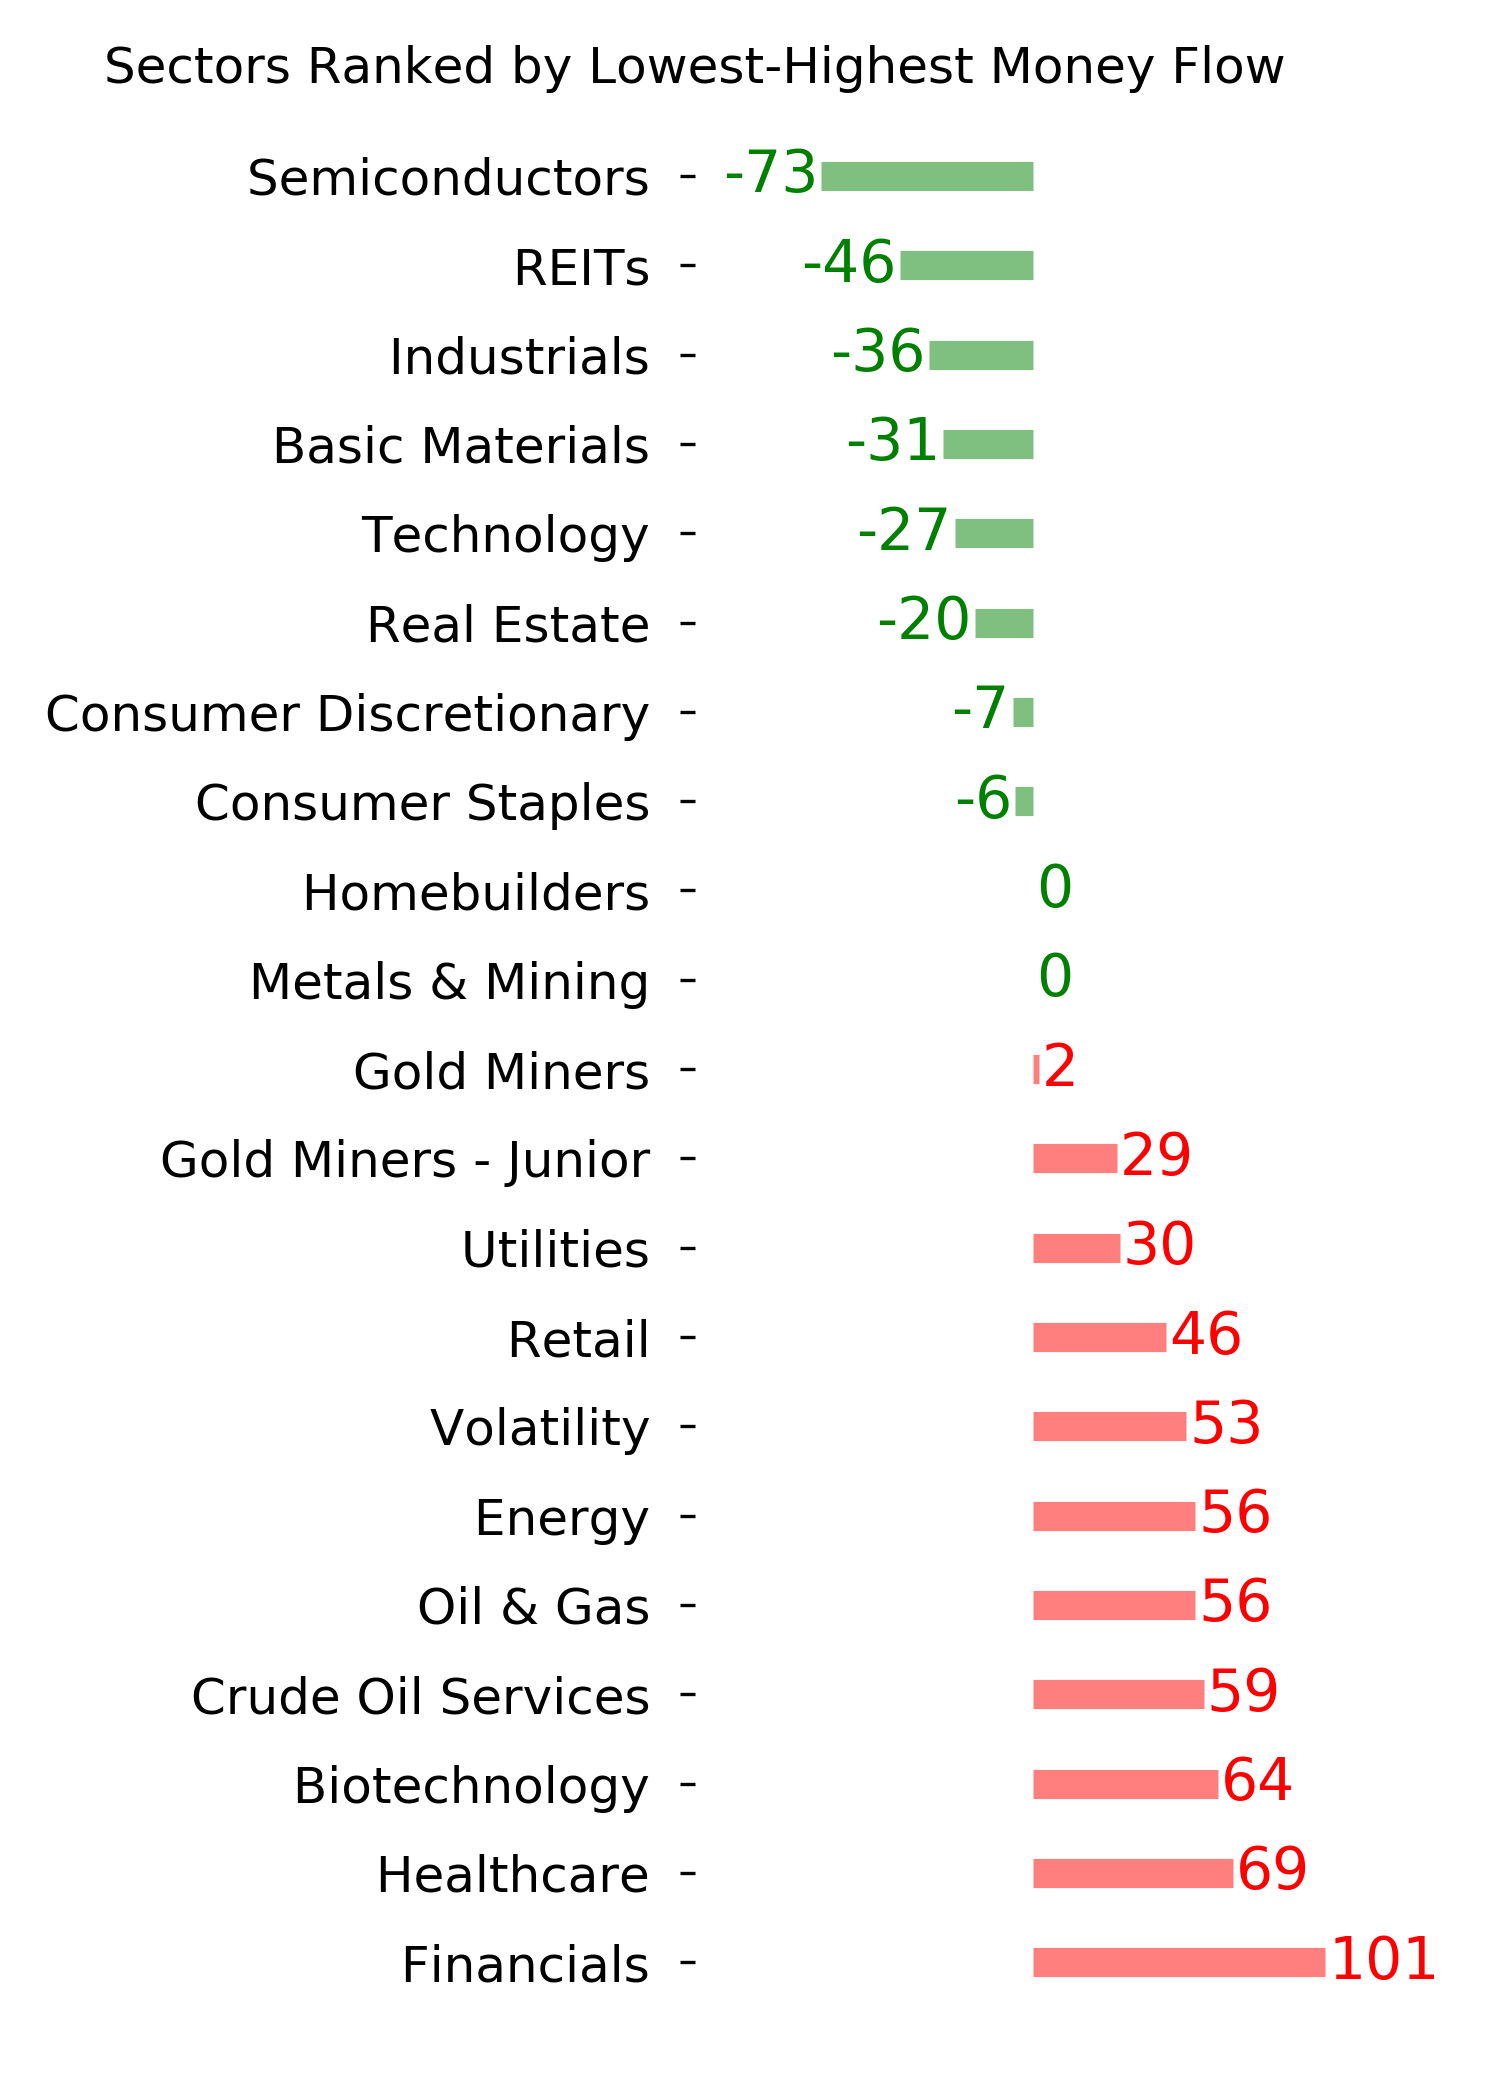
Optimism Index Thumbnails
|
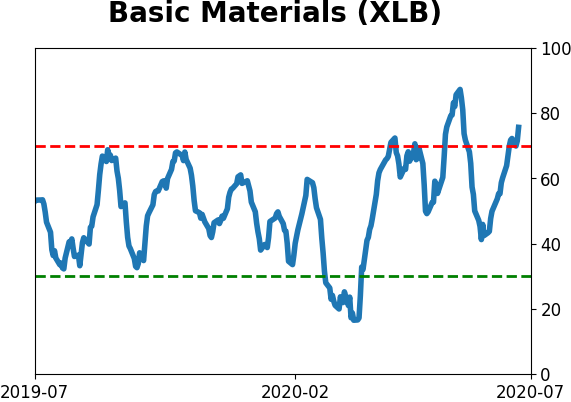
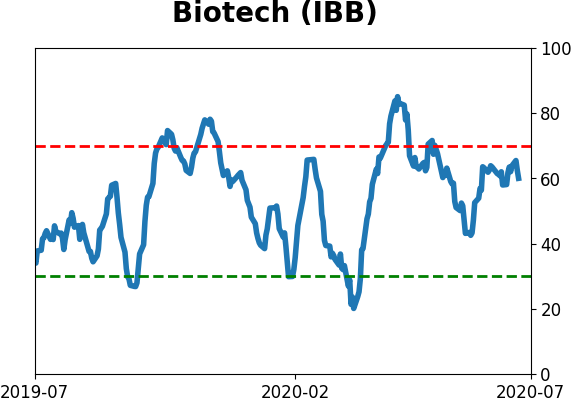
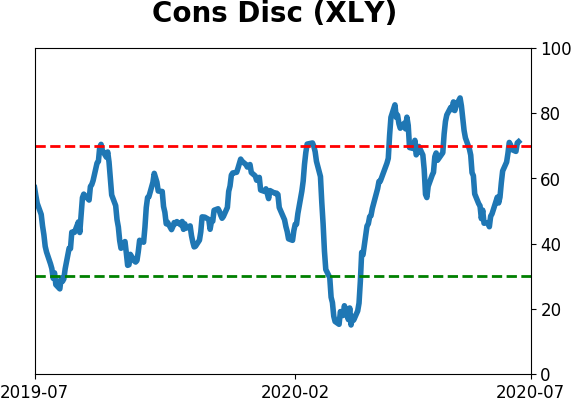
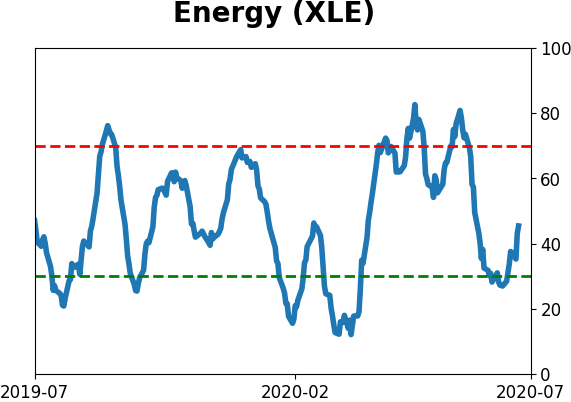
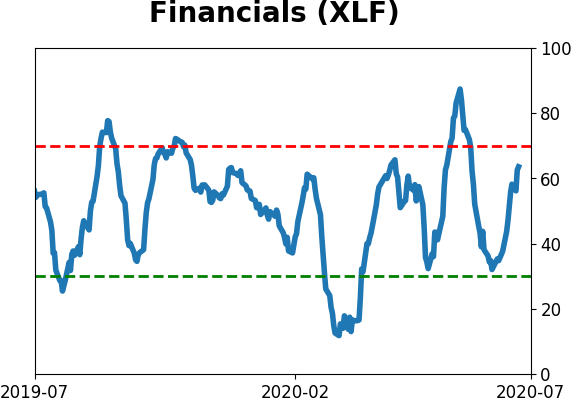
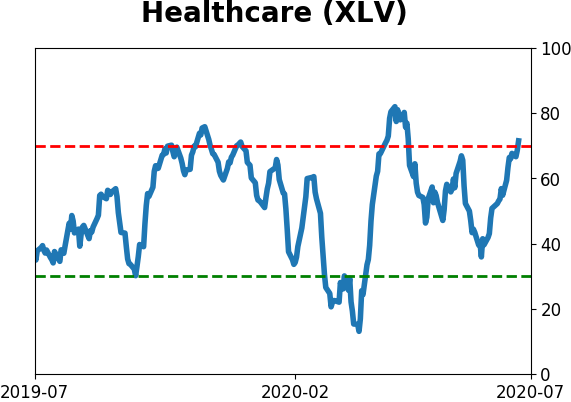
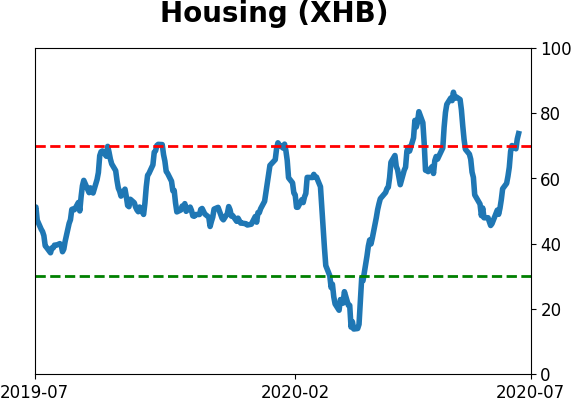
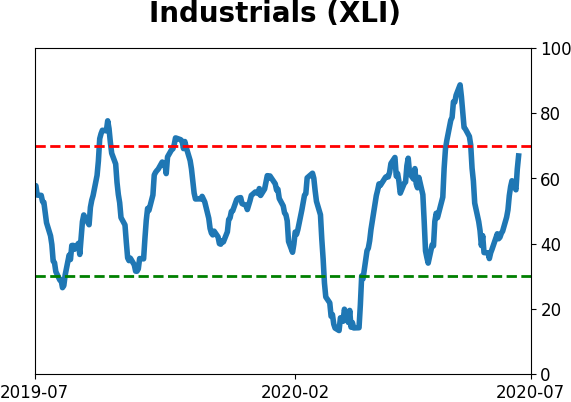
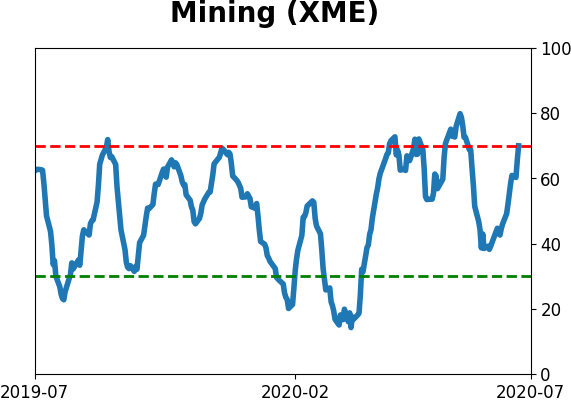
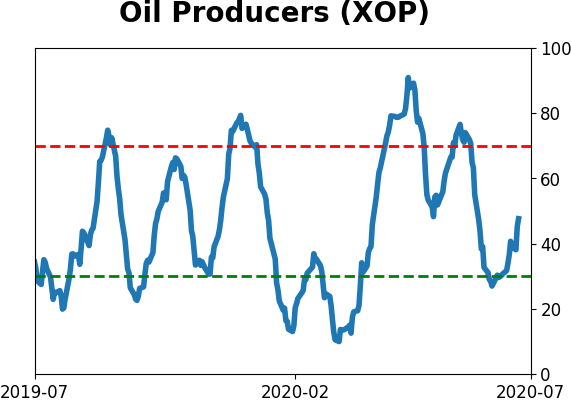
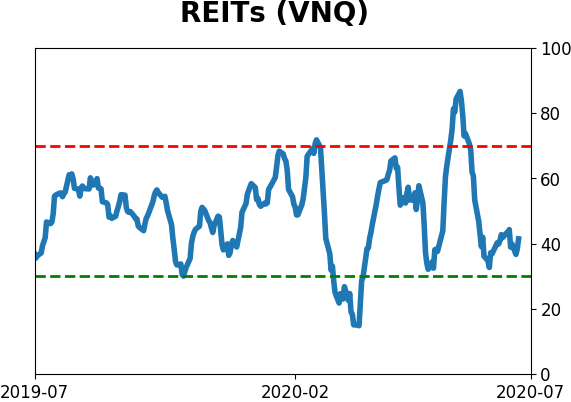
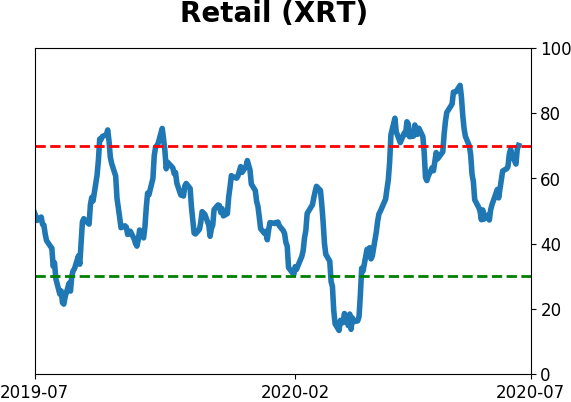
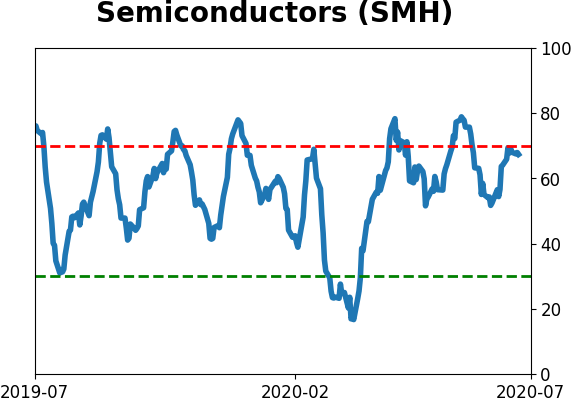
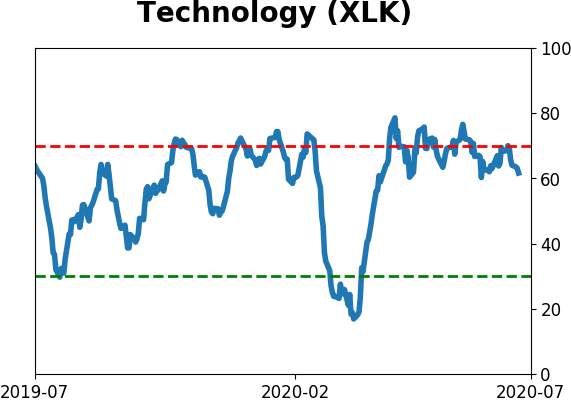
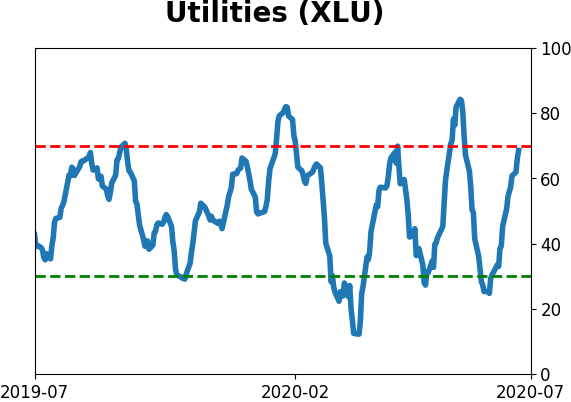
Sector ETF's - 10-Day Moving Average
|
|
|
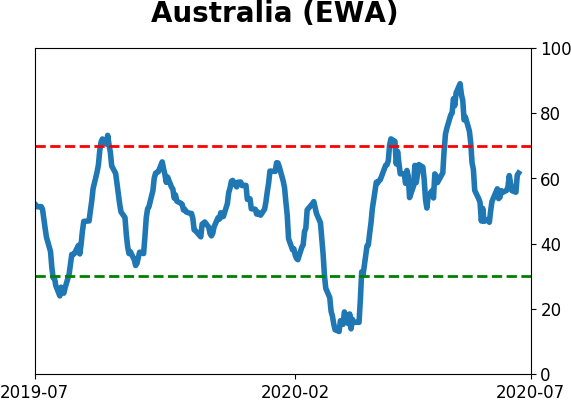
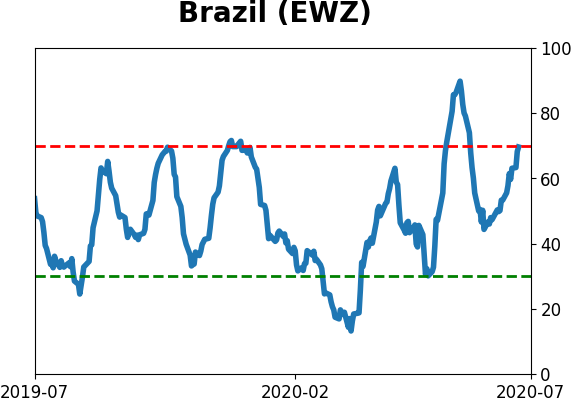
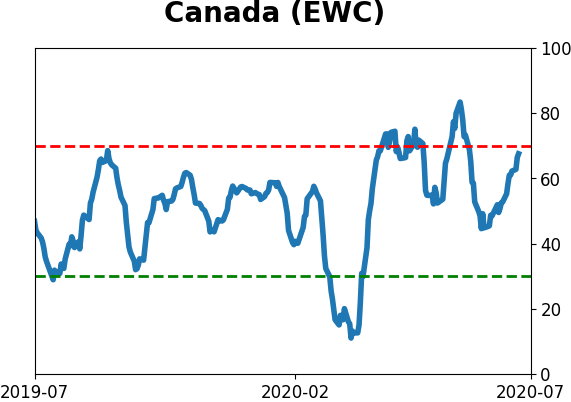
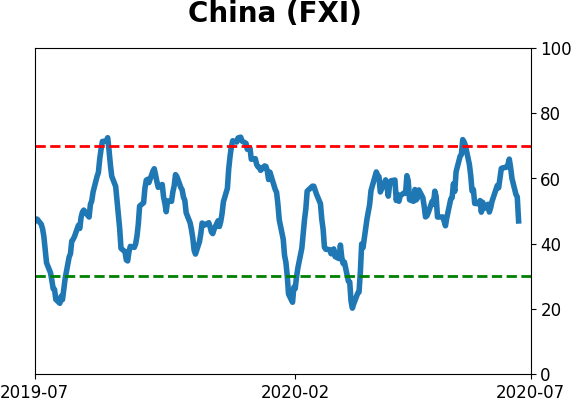
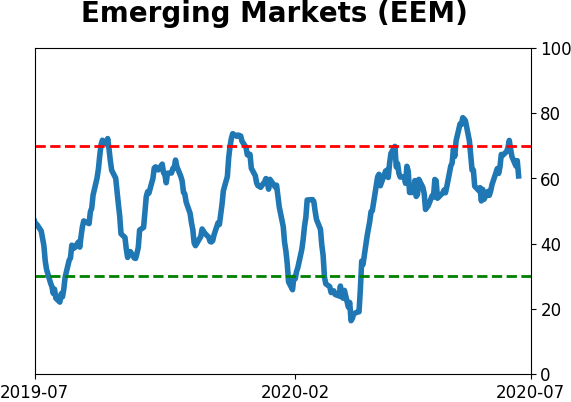
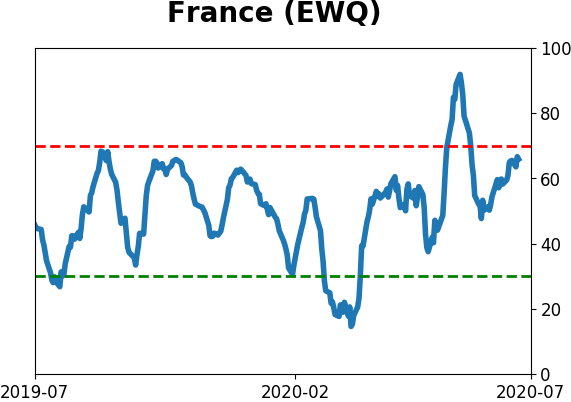
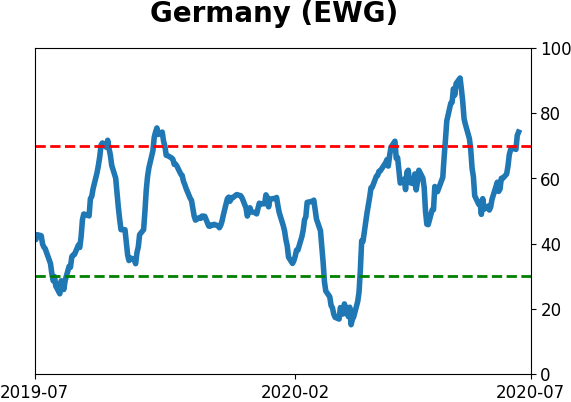
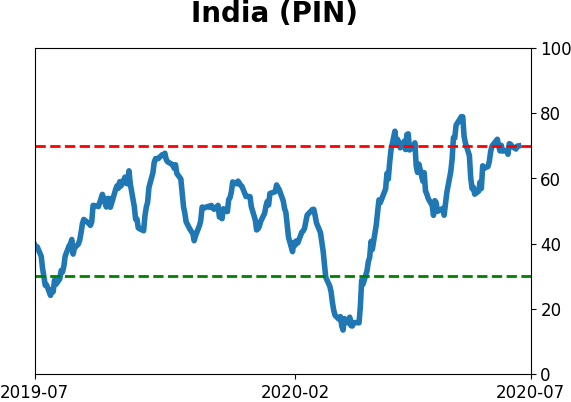
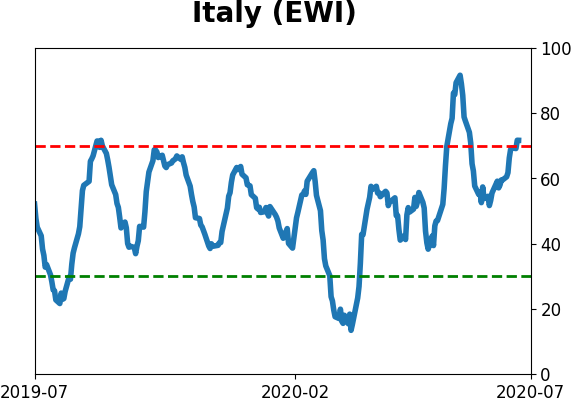
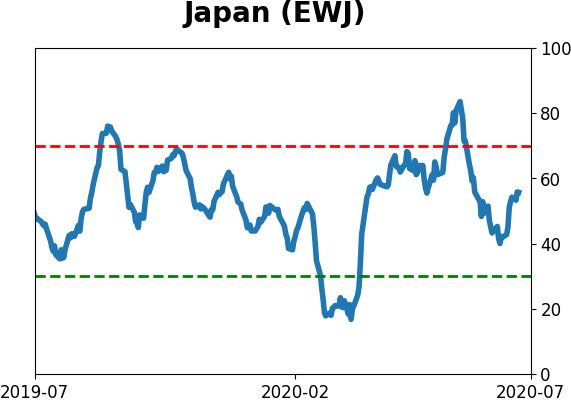
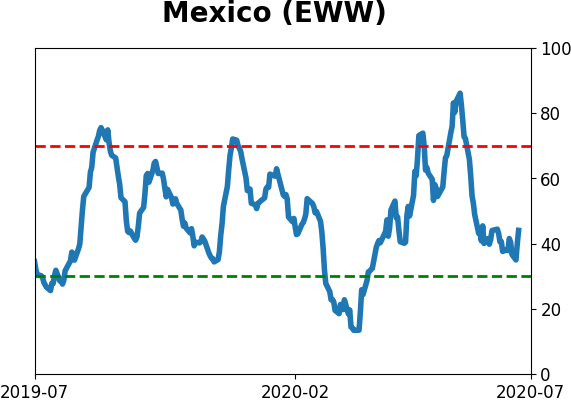
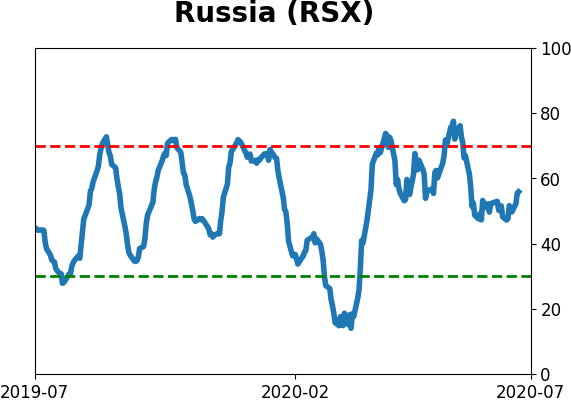
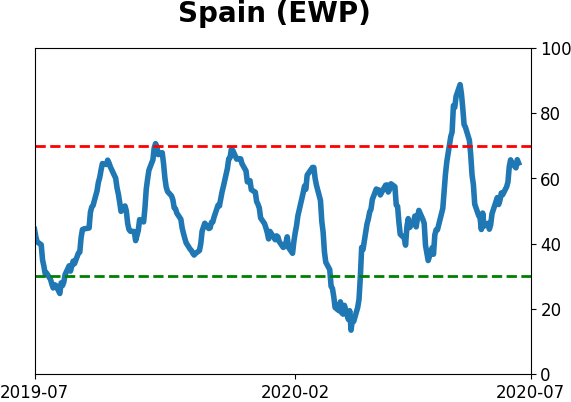
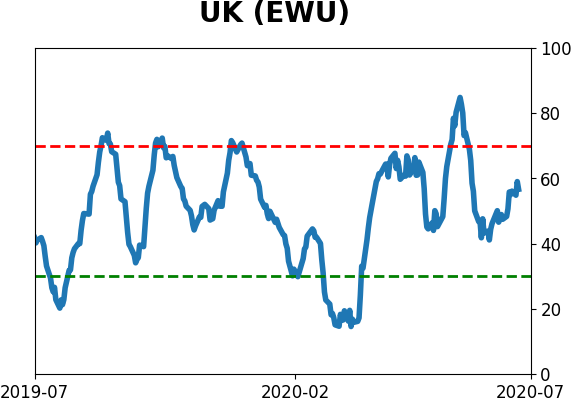
Country ETF's - 10-Day Moving Average
|
|
|
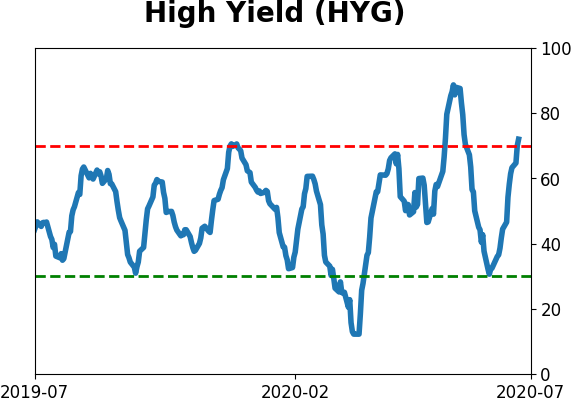
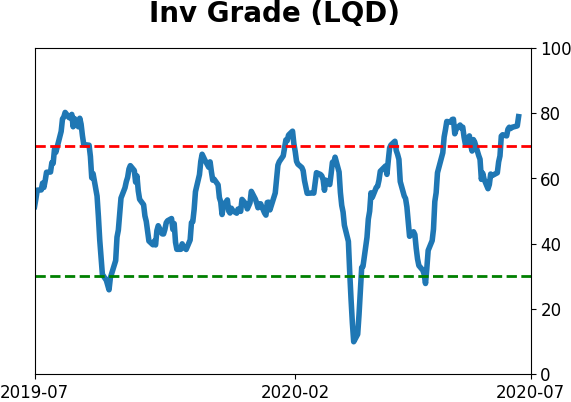
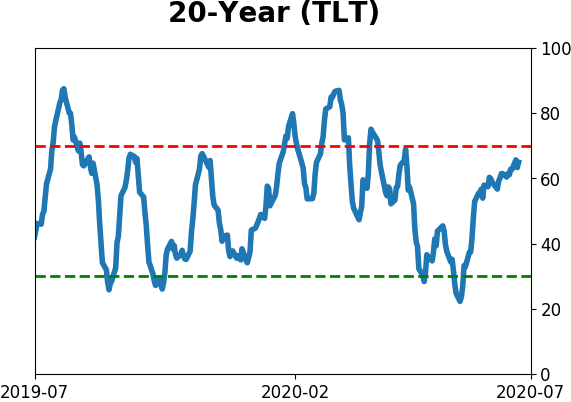
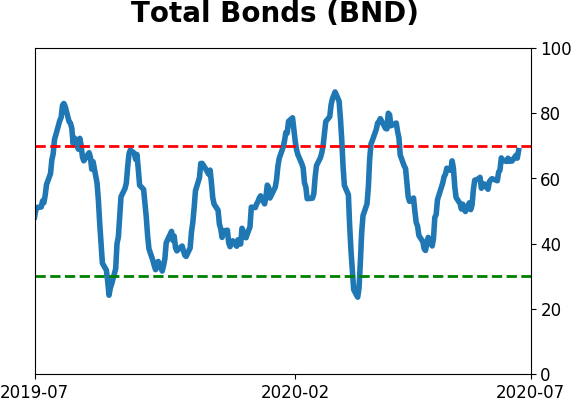
Bond ETF's - 10-Day Moving Average
|
|
|
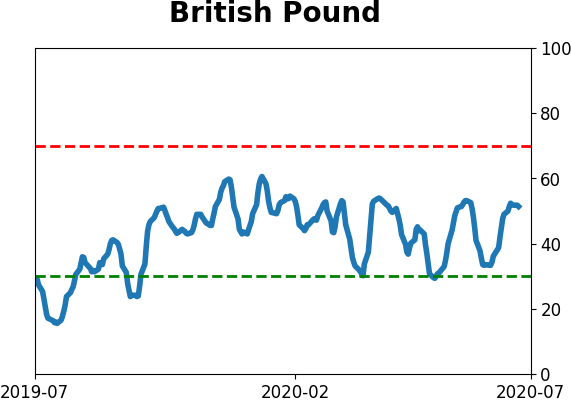
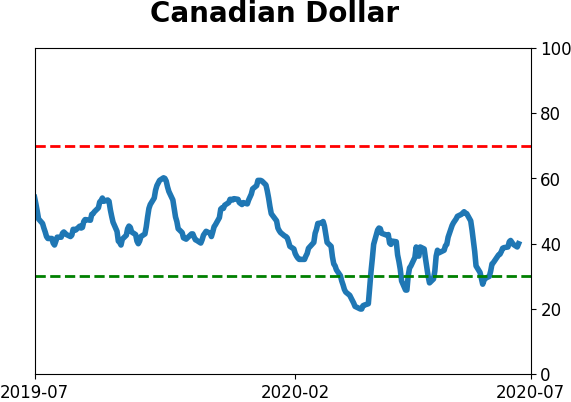
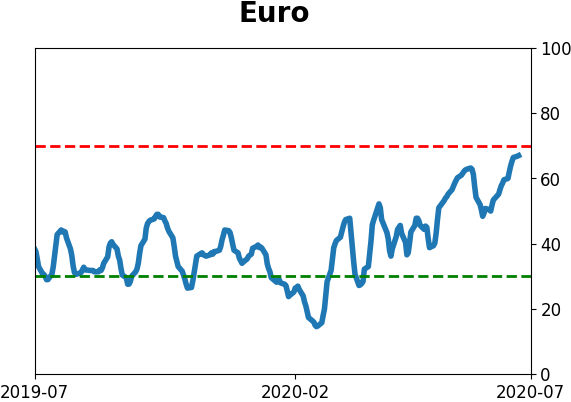
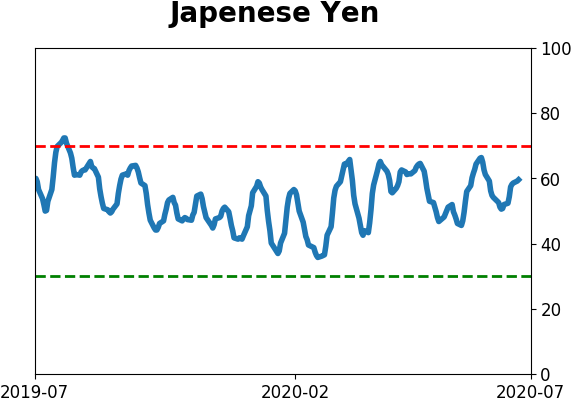
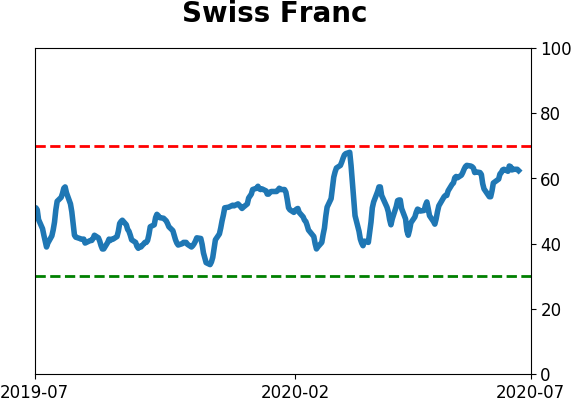
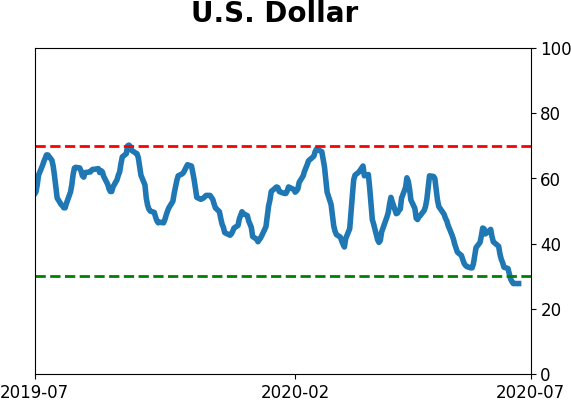
Currency ETF's - 5-Day Moving Average
|
|
|
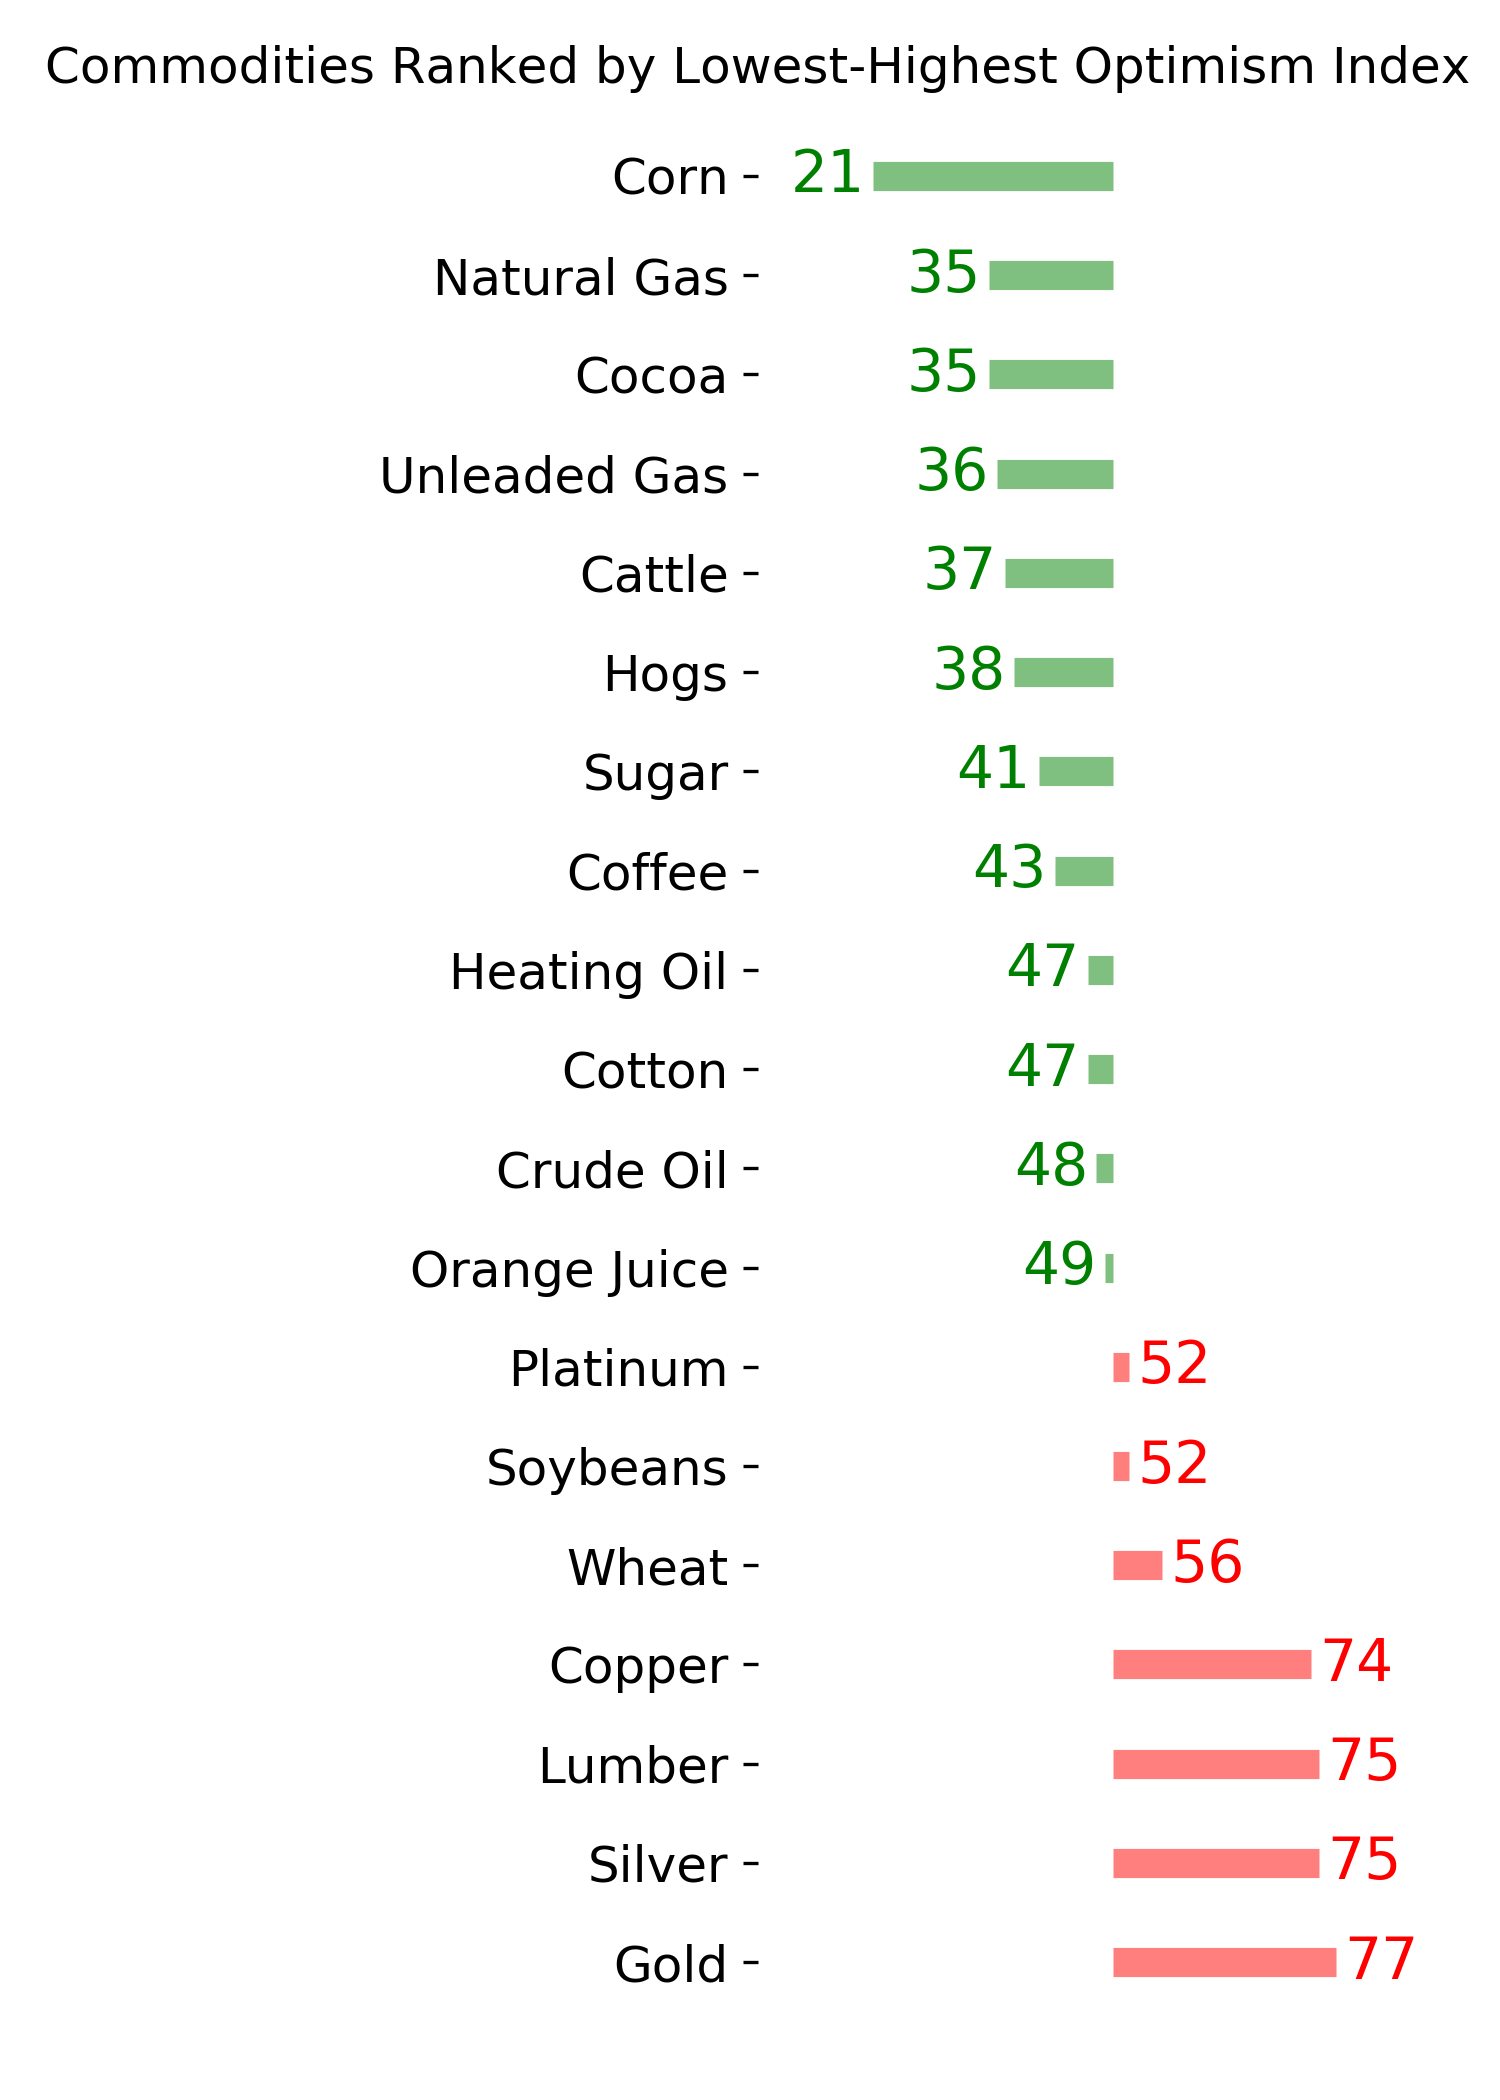
Commodity ETF's - 5-Day Moving Average
|
|