Headlines
|
|
Sentiment Isn't Yet the Support It Needs To Be:
Despite recent record highs and still limited losses in stocks, the Fear & Greed model has declined and is approaching Fear territory. These divergences are not necessarily a good sign. Monday's weakness was enough to push Dumb Money below Smart Money Confidence.
Bottom Line:
See the Outlook & Allocations page for more details on these summaries STOCKS: Hold
The speculative frenzy in February is wrung out. Internal dynamics have mostly held up, with some exceptions. Many of our studies still show a mixed to poor short-term view, with medium- and long-term ones turning more positive. BONDS: Hold
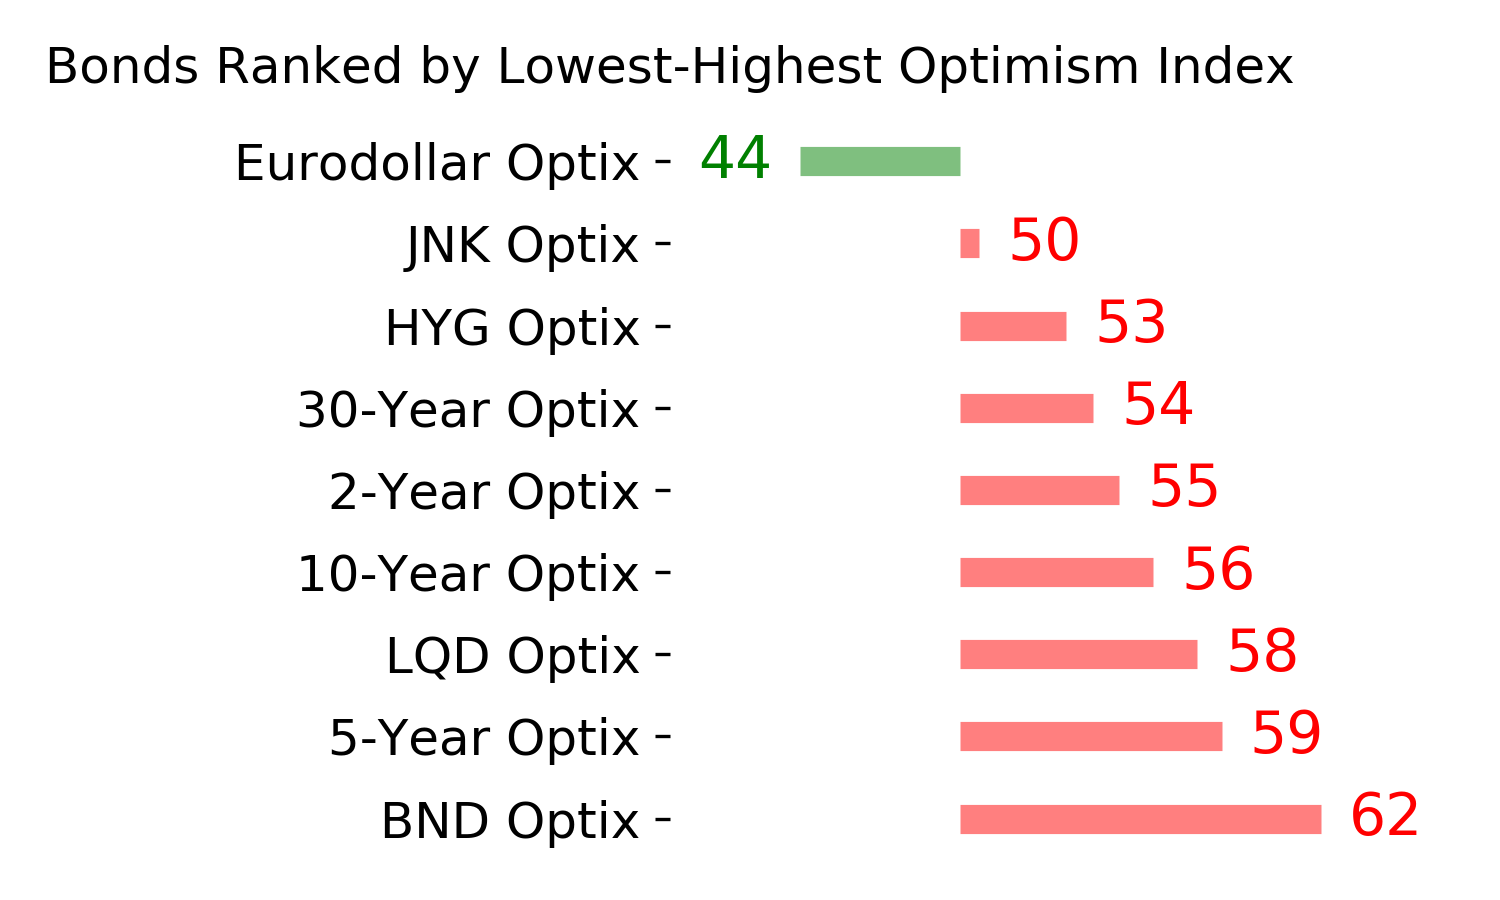
Various parts of the market got hit in March, with the lowest Bond Optimism Index we usually see during healthy environments. After a shaky couple of weeks, the broad bond market has modestly recovered. Not a big edge here either way. GOLD: Hold
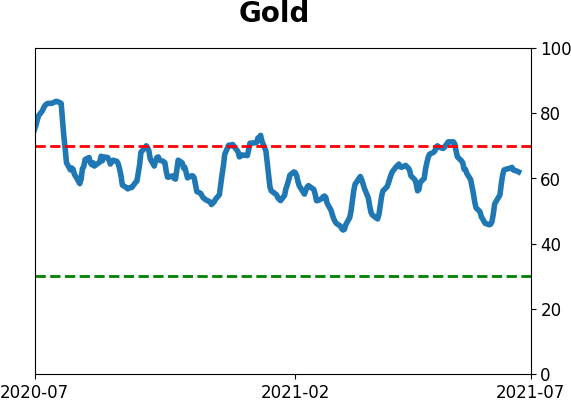
Gold and miners have done very well, recovering above long-term trend lines. The issue is that both have tended to perform poorly after similar situations - will have to wait and see how it plays out.
|
Smart / Dumb Money Confidence
|
Smart Money Confidence: 53%
Dumb Money Confidence: 43%
|
|
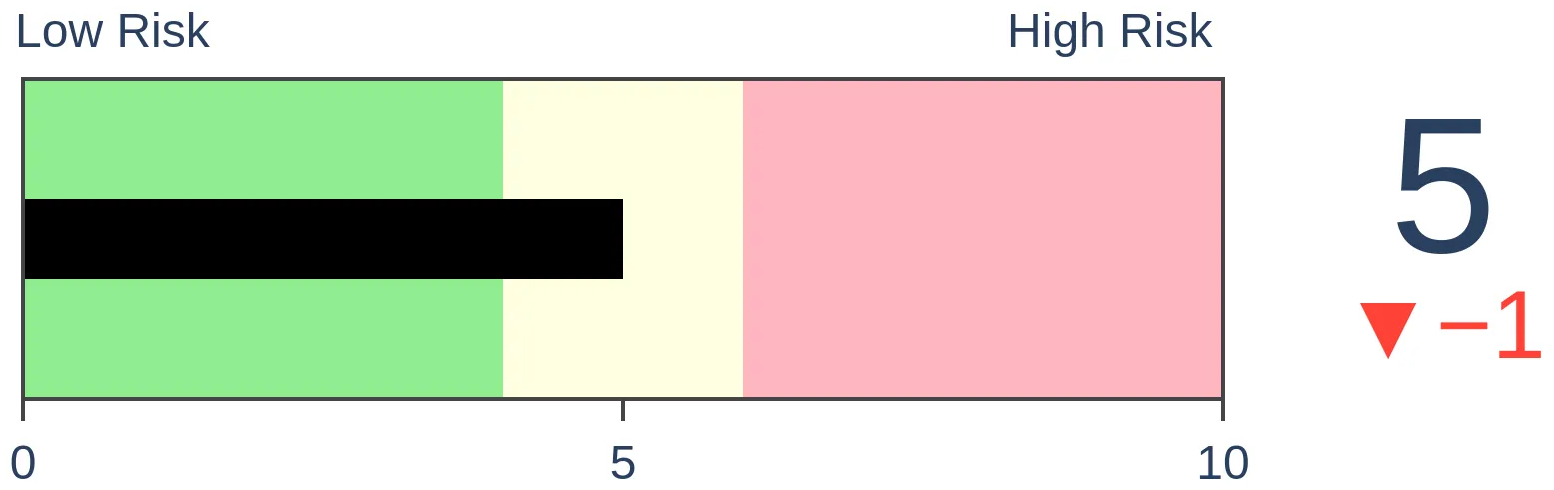
Risk Levels
Stocks Short-Term
|
Stocks Medium-Term

|
|
Bonds

|
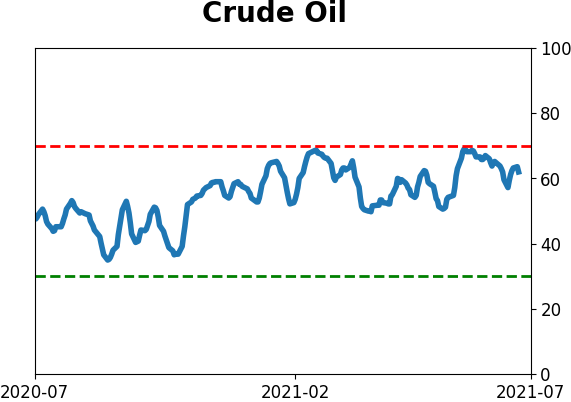
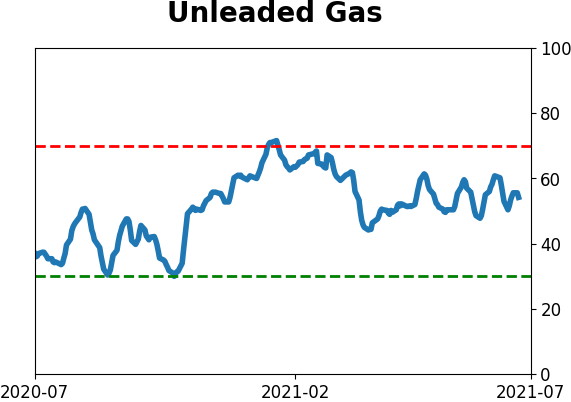
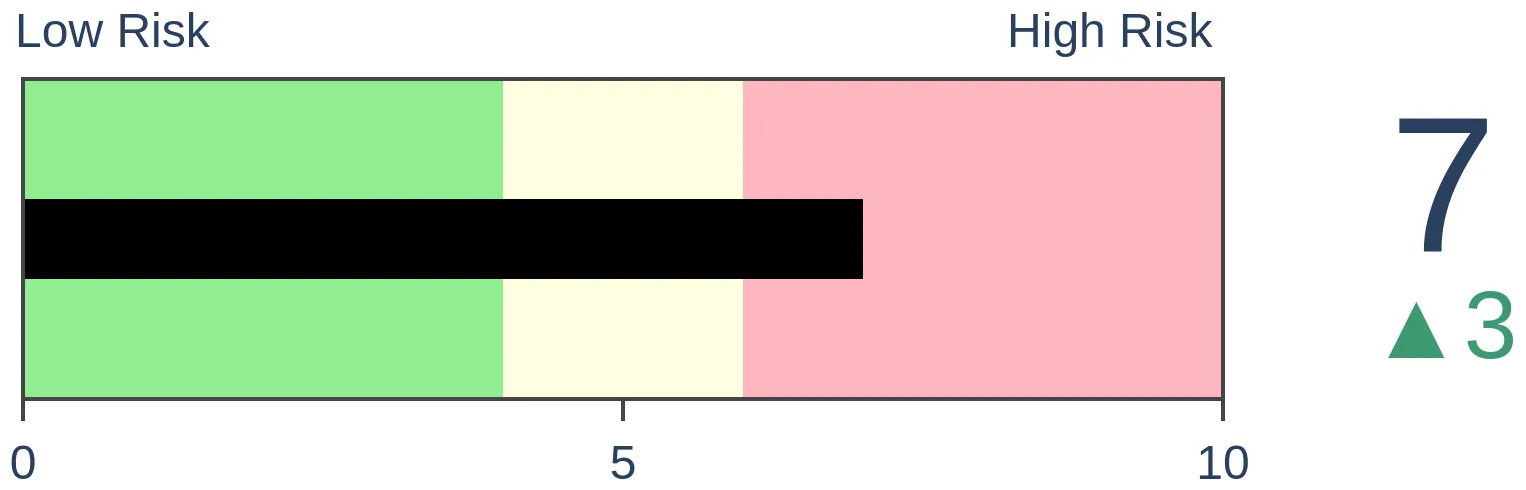
Crude Oil
|
|
Gold
|
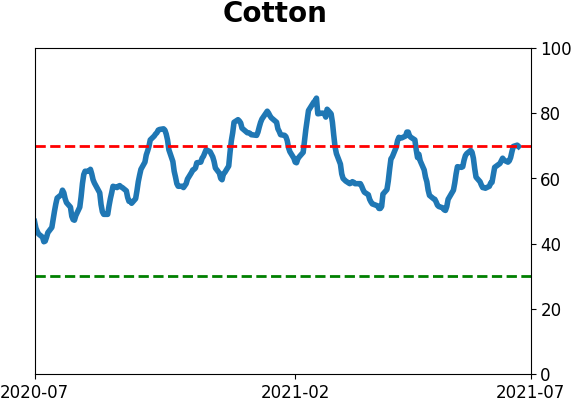
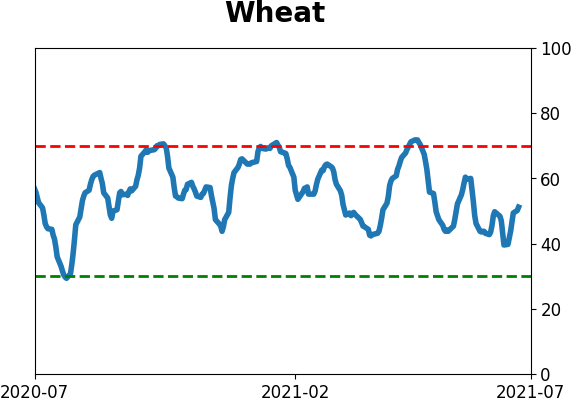
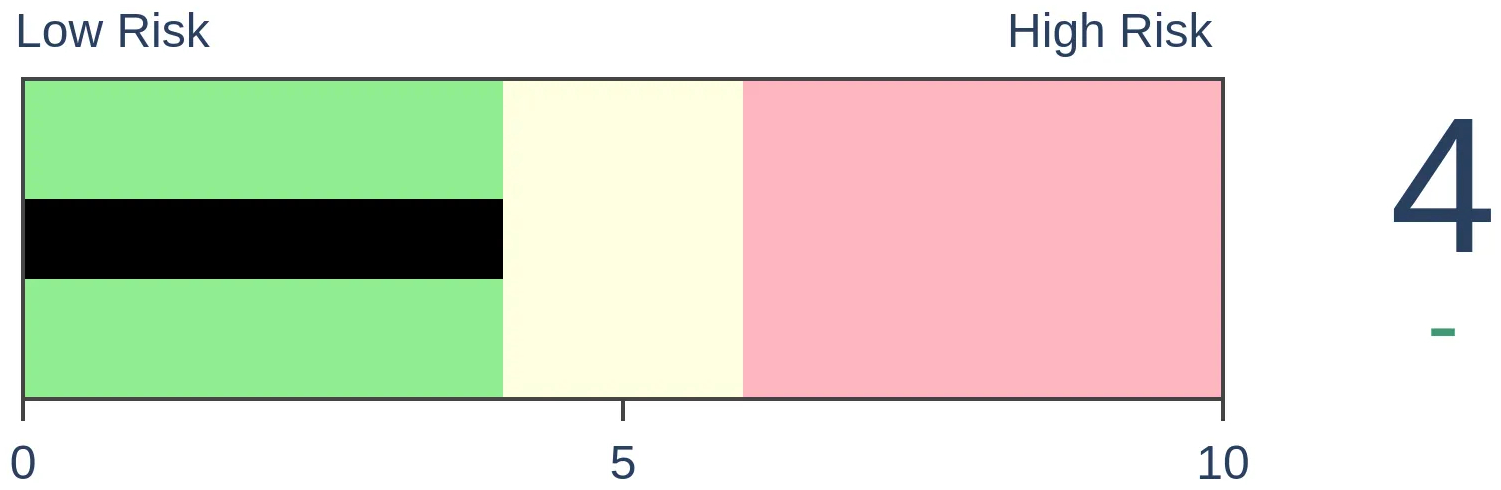
Agriculture

|
|
Research
By Jason Goepfert
BOTTOM LINE
Despite recent record highs and still limited losses in stocks, the Fear & Greed model has declined and is approaching Fear territory. These divergences are not necessarily a good sign. Monday's weakness was enough to push Dumb Money below Smart Money Confidence.
FORECAST / TIMEFRAME
SPY -- Down, Short-Term
|
Investors are already fearful, and that has to be a good sign for stocks.
That's the theory being bandied about regarding the CNN Fear & Greed model. The news organization's sentiment measure has been sliding lower for weeks and is nearing a level considered to show fear.
We used their publicly revealed inputs to recreate the model, though to generate more history and hopefully more accuracy, we use different inputs for high-yield bonds and put/call ratios. There is about a 95% correlation between the two versions.
Unlike at market bottoms, sentiment often peaks well ahead of prices. Investors become euphoric, push prices higher, then gradually lose interest. Bull markets need steadily rising optimism to continue rising, so this is an issue.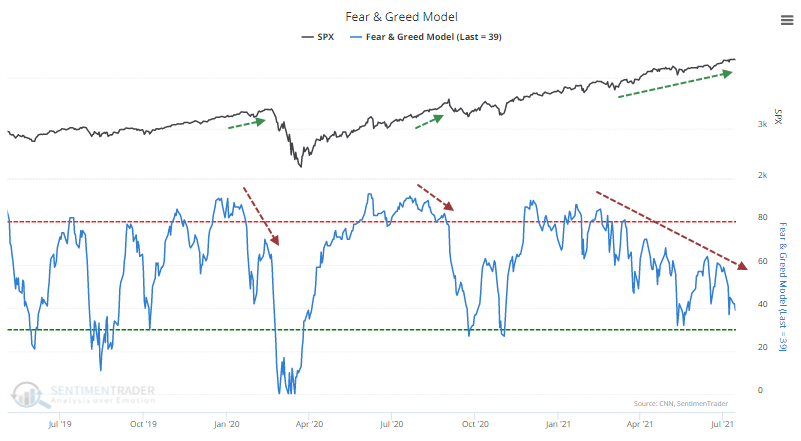
WHAT IT SUGGESTS FOR FUTURE RETURNS
When we look at the numbers, we can see why declining Greed is not necessarily a good thing. The table below shows every time since 1998 when the S&P 500 had been at a 52-week high within the past week, and Fear & Greed fell below 40.
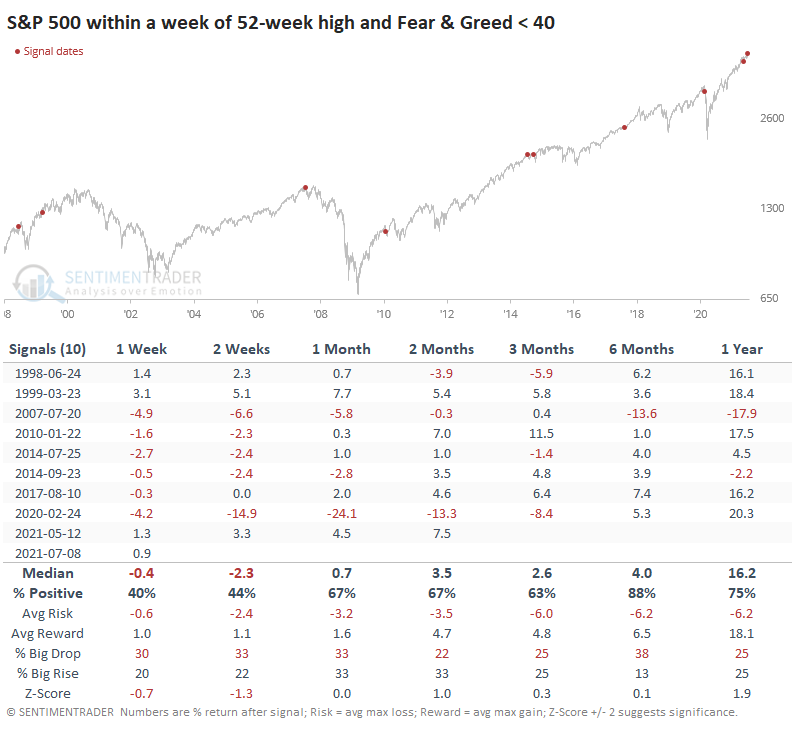
That's not terrible, though short-term returns were weak. How about when the model fell below 40 but the S&P was still within 1% of its high at the time? Here, not so good.
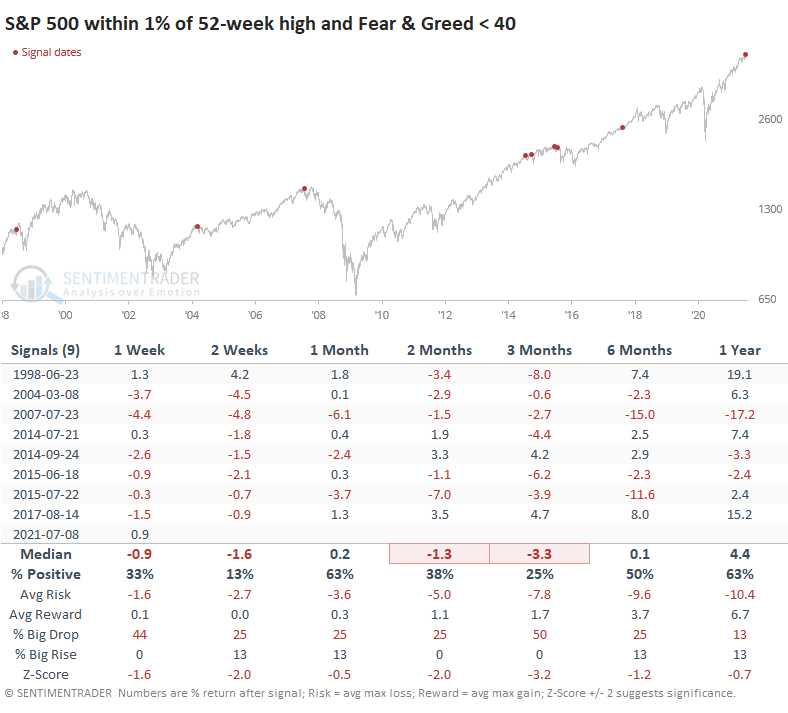
And when both conditions trigger, there were only three precedents, none of them good. The signal from August 2017 only missed triggered by a fraction, though, so that would have been a pretty big exception.
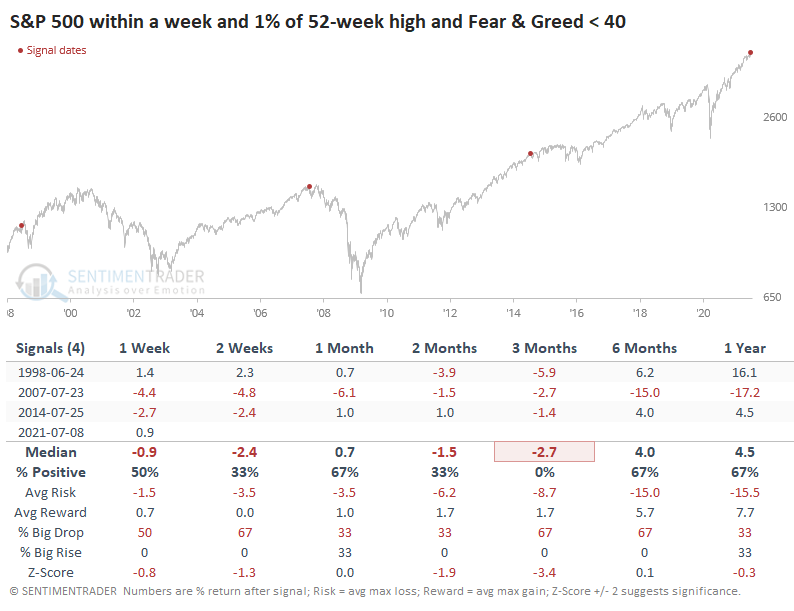
It's been a couple of weeks since this one triggered, and we've seen the expected weakness. If it plays nicely with historical precedent, then there should be more weakness still to come.
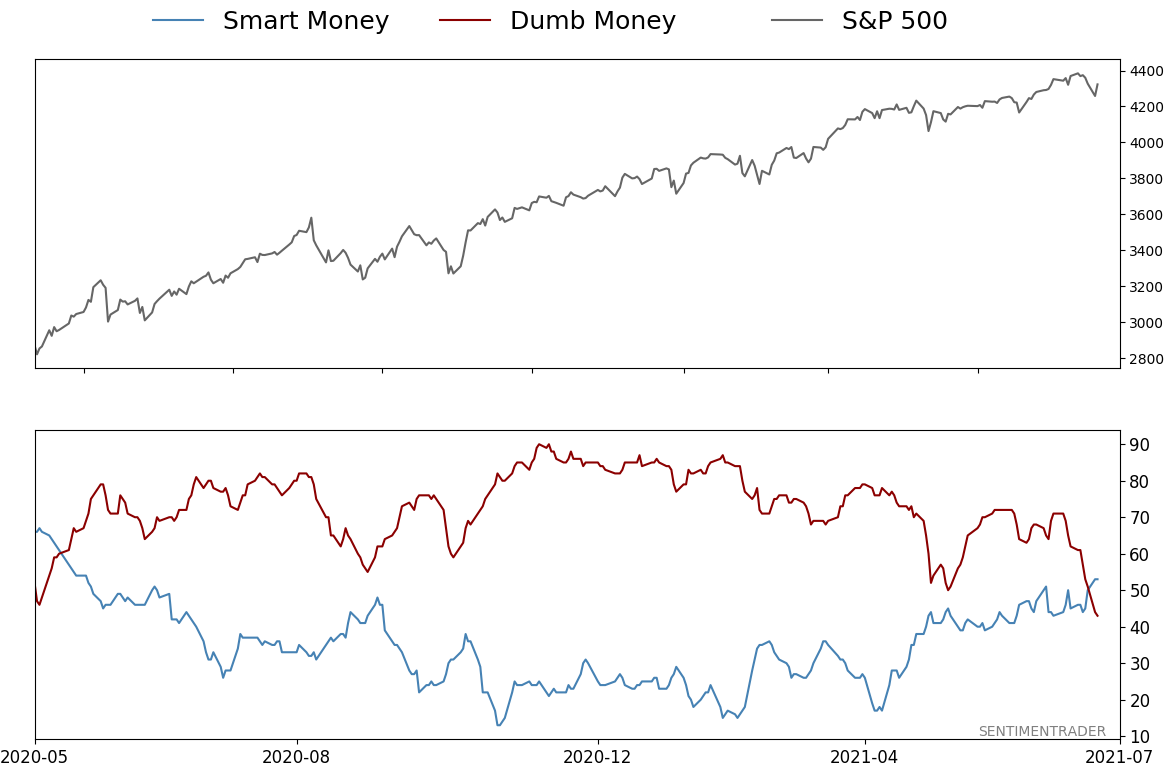
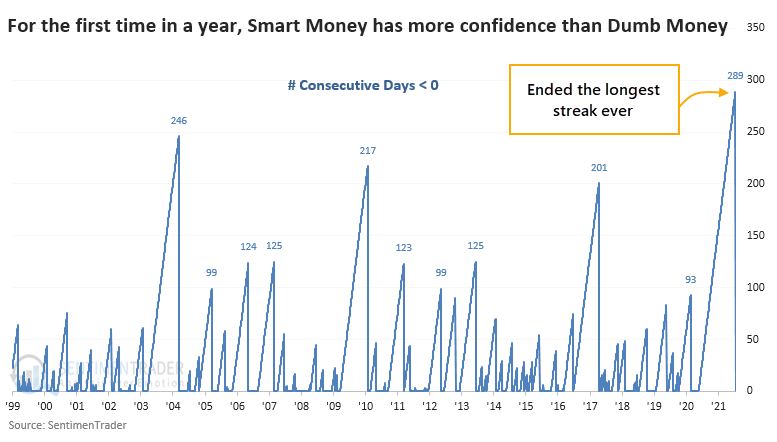
FINALLY, DUMB MONEY CONFIDENCE < SMART MONEY
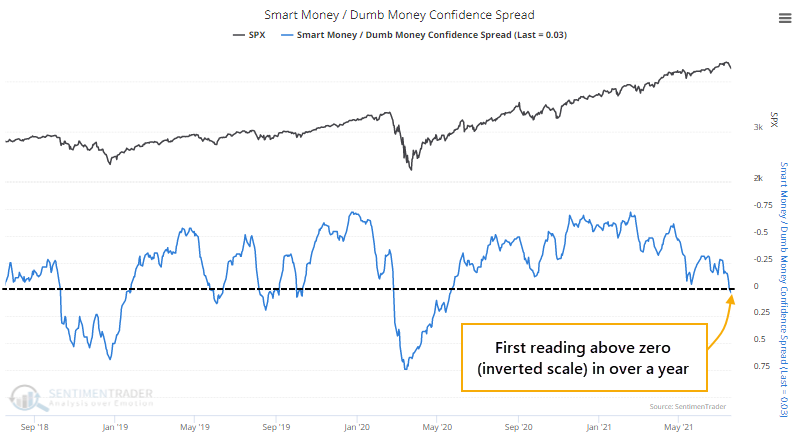
What we saw on Monday was enough to finally push Dumb Money Confidence below Smart Money Confidence for the first time in over a year, so the spread finally turned positive (the chart below has an inverted scale).
This just ended the longest-ever streak with the opposite condition. No other period went more than a year.
The first time that the Confidence Indexes flipped in more than 90 days, the S&P 500 tended to see continued short-term weakness but showed very strong longer-term returns.
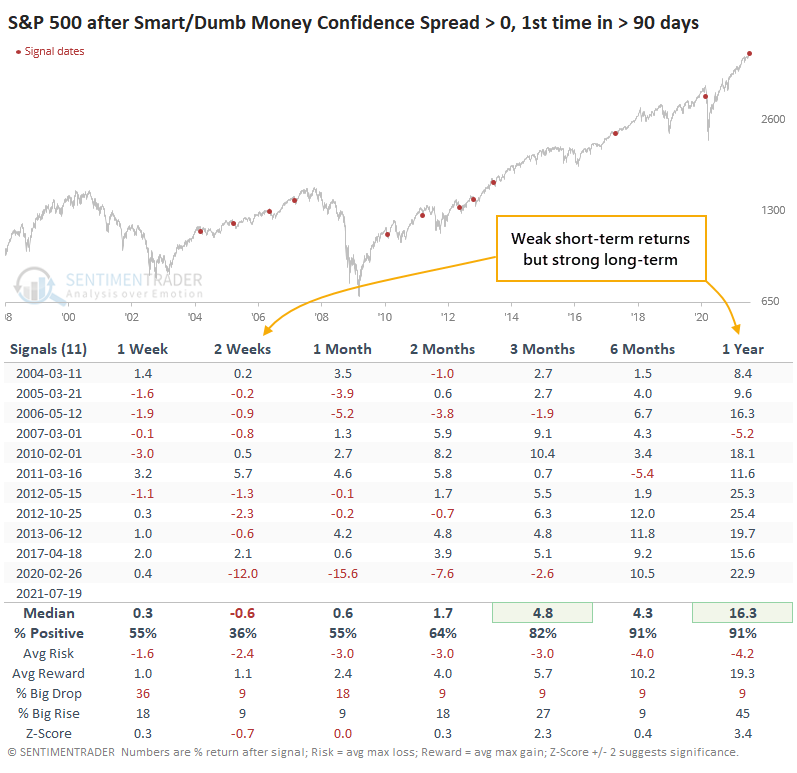
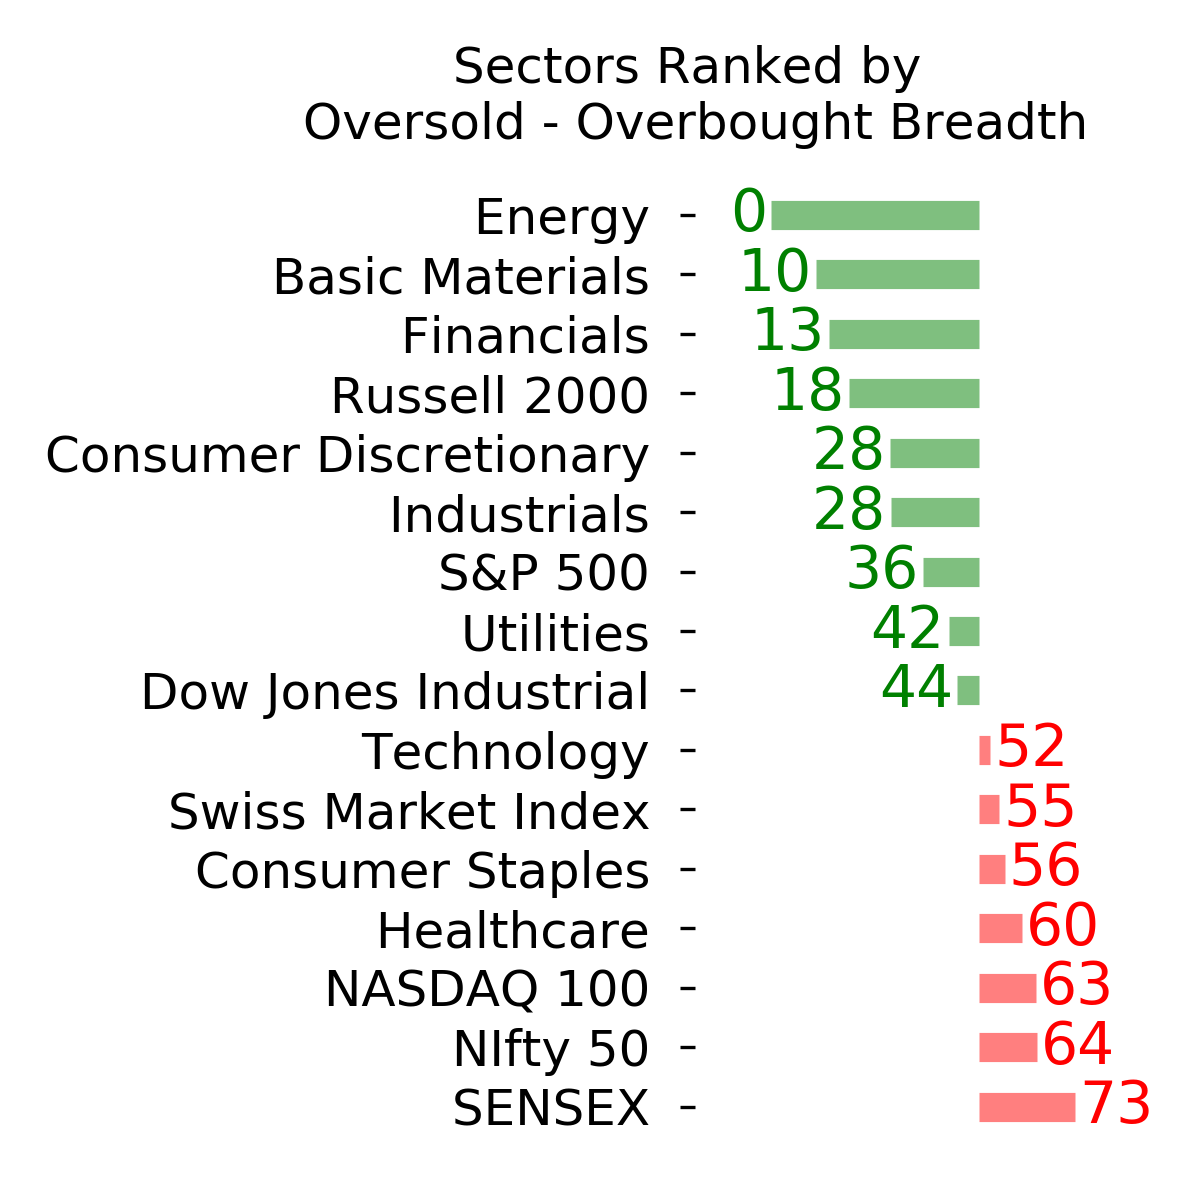
The weakening breadth we've been highlighting has a strong tendency to lead to weak short- to medium-term returns. And the strong momentum in the first half of the year has an even stronger tendency to lead to higher medium- to long-term returns. The flip in Confidence seen above is further support to both arguments.
Active Studies
| Time Frame | Bullish | Bearish | | Short-Term | 0 | 4 | | Medium-Term | 2 | 3 | | Long-Term | 10 | 5 |
|
Indicators at Extremes
Portfolio
| Position | Description | Weight % | Added / Reduced | Date | | Stocks | RSP | 4.1 | Added 4.1% | 2021-05-19 | | Bonds | 23.9% BND, 6.9% SCHP | 30.7 | Reduced 7.1% | 2021-05-19 | | Commodities | GCC | 2.6 | Reduced 2.1%
| 2020-09-04 | | Precious Metals | GDX | 5.6 | Reduced 4.2% | 2021-05-19 | | Special Situations | 4.3% XLE, 2.2% PSCE | 7.6 | Reduced 5.6% | 2021-04-22 | | Cash | | 49.4 | | |
|
Updates (Changes made today are underlined)
Much of our momentum and trend work has remained positive for several months, with some scattered exceptions. Almost all sentiment-related work has shown a poor risk/reward ratio for stocks, especially as speculation drove to record highs in exuberance in February. Much of that has worn off, and most of our models are back toward neutral levels. There isn't much to be excited about here. The same goes for bonds and even gold. Gold has been performing well lately and is back above long-term trend lines. The issue is that it has a poor record of holding onto gains when attempting a long-term trend change like this, so we'll take a wait-and-see approach. RETURN YTD: 9.1% 2020: 8.1%, 2019: 12.6%, 2018: 0.6%, 2017: 3.8%, 2016: 17.1%, 2015: 9.2%, 2014: 14.5%, 2013: 2.2%, 2012: 10.8%, 2011: 16.5%, 2010: 15.3%, 2009: 23.9%, 2008: 16.2%, 2007: 7.8%
|
|
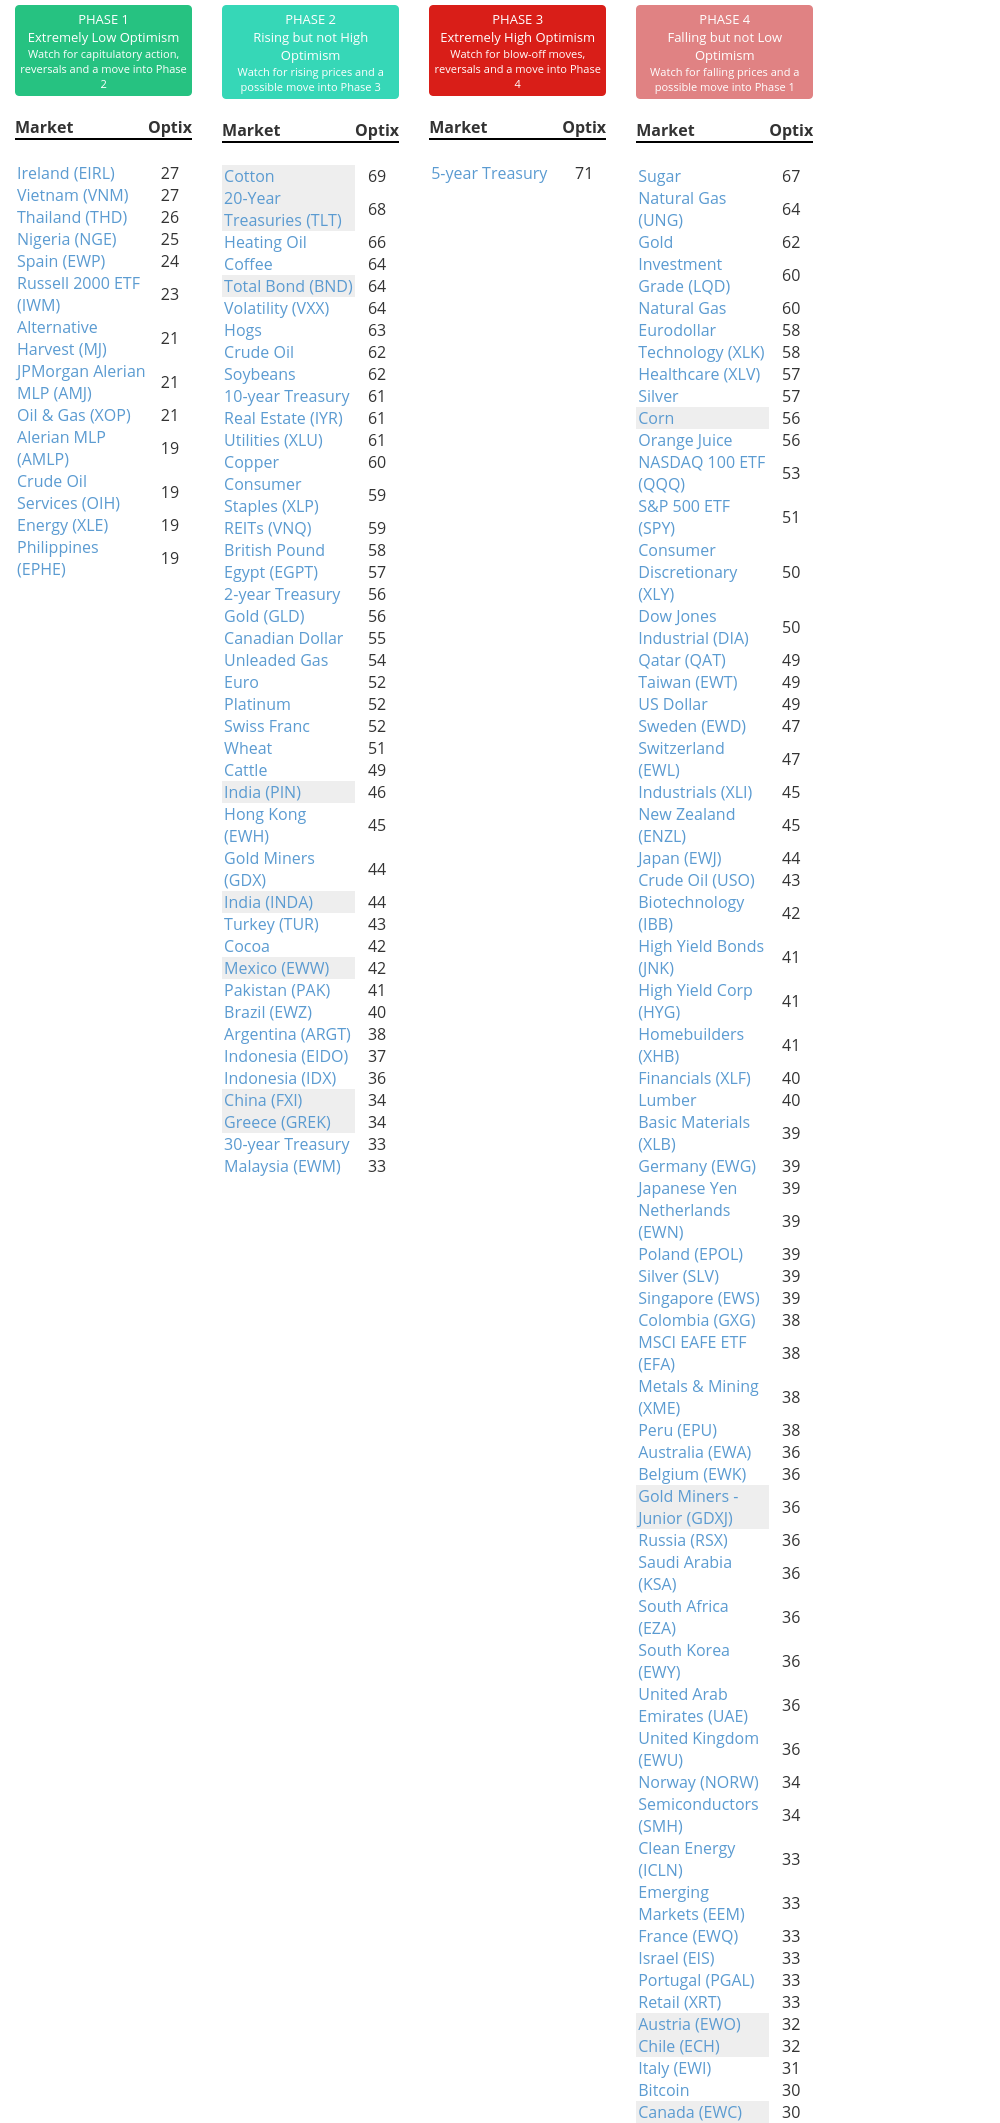
Phase Table
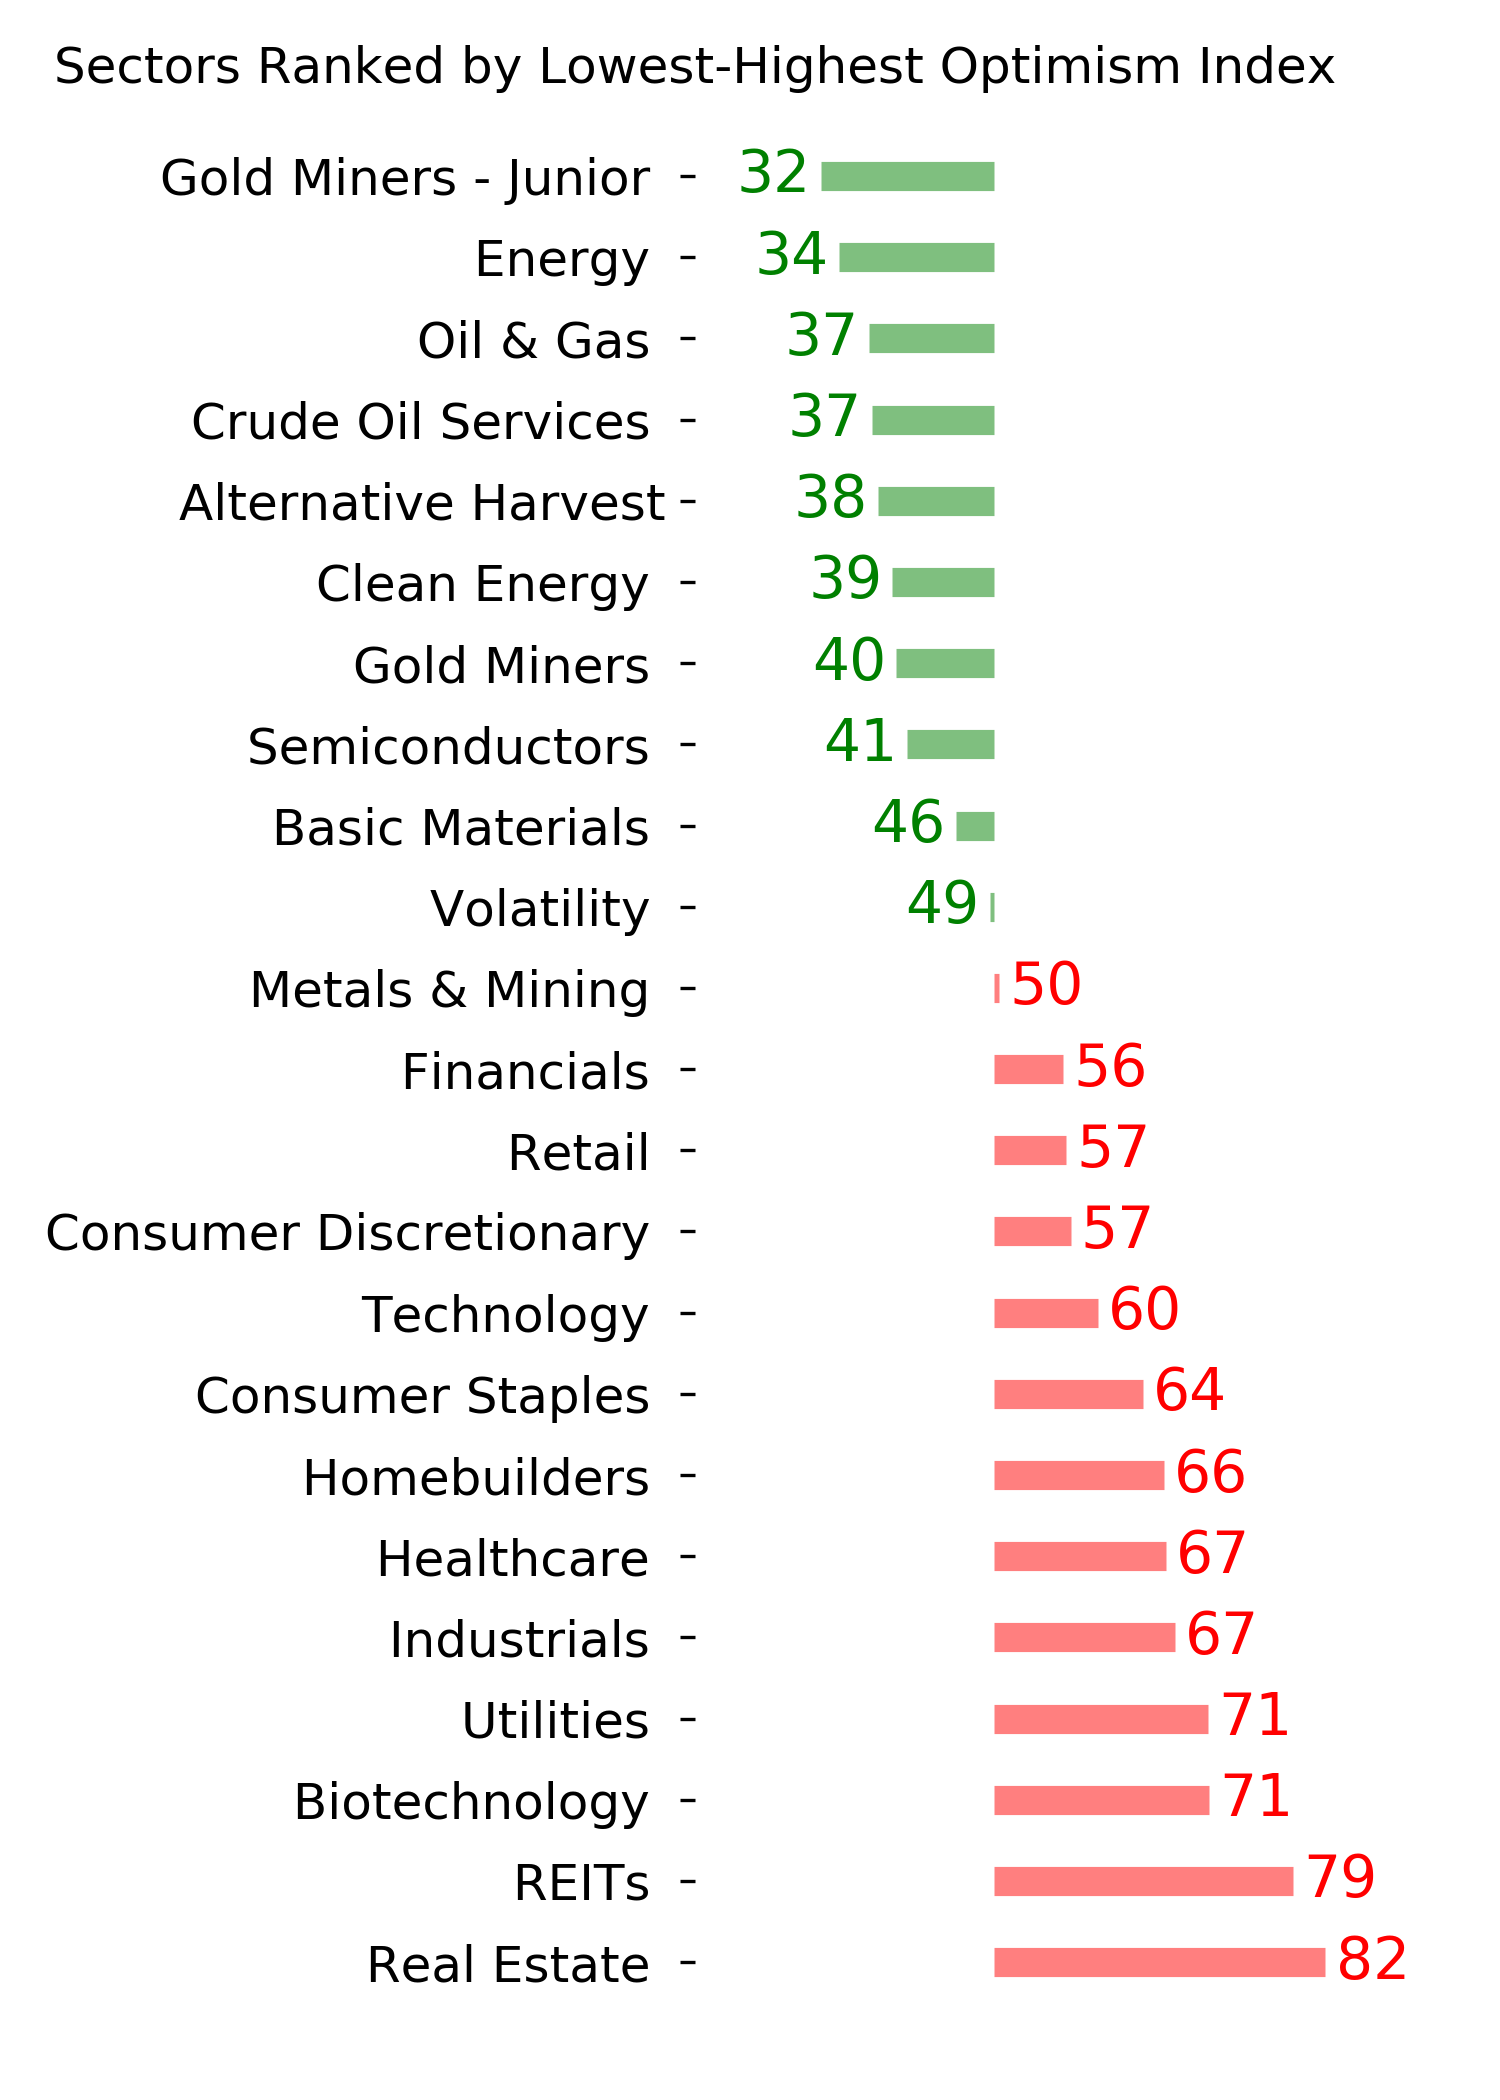
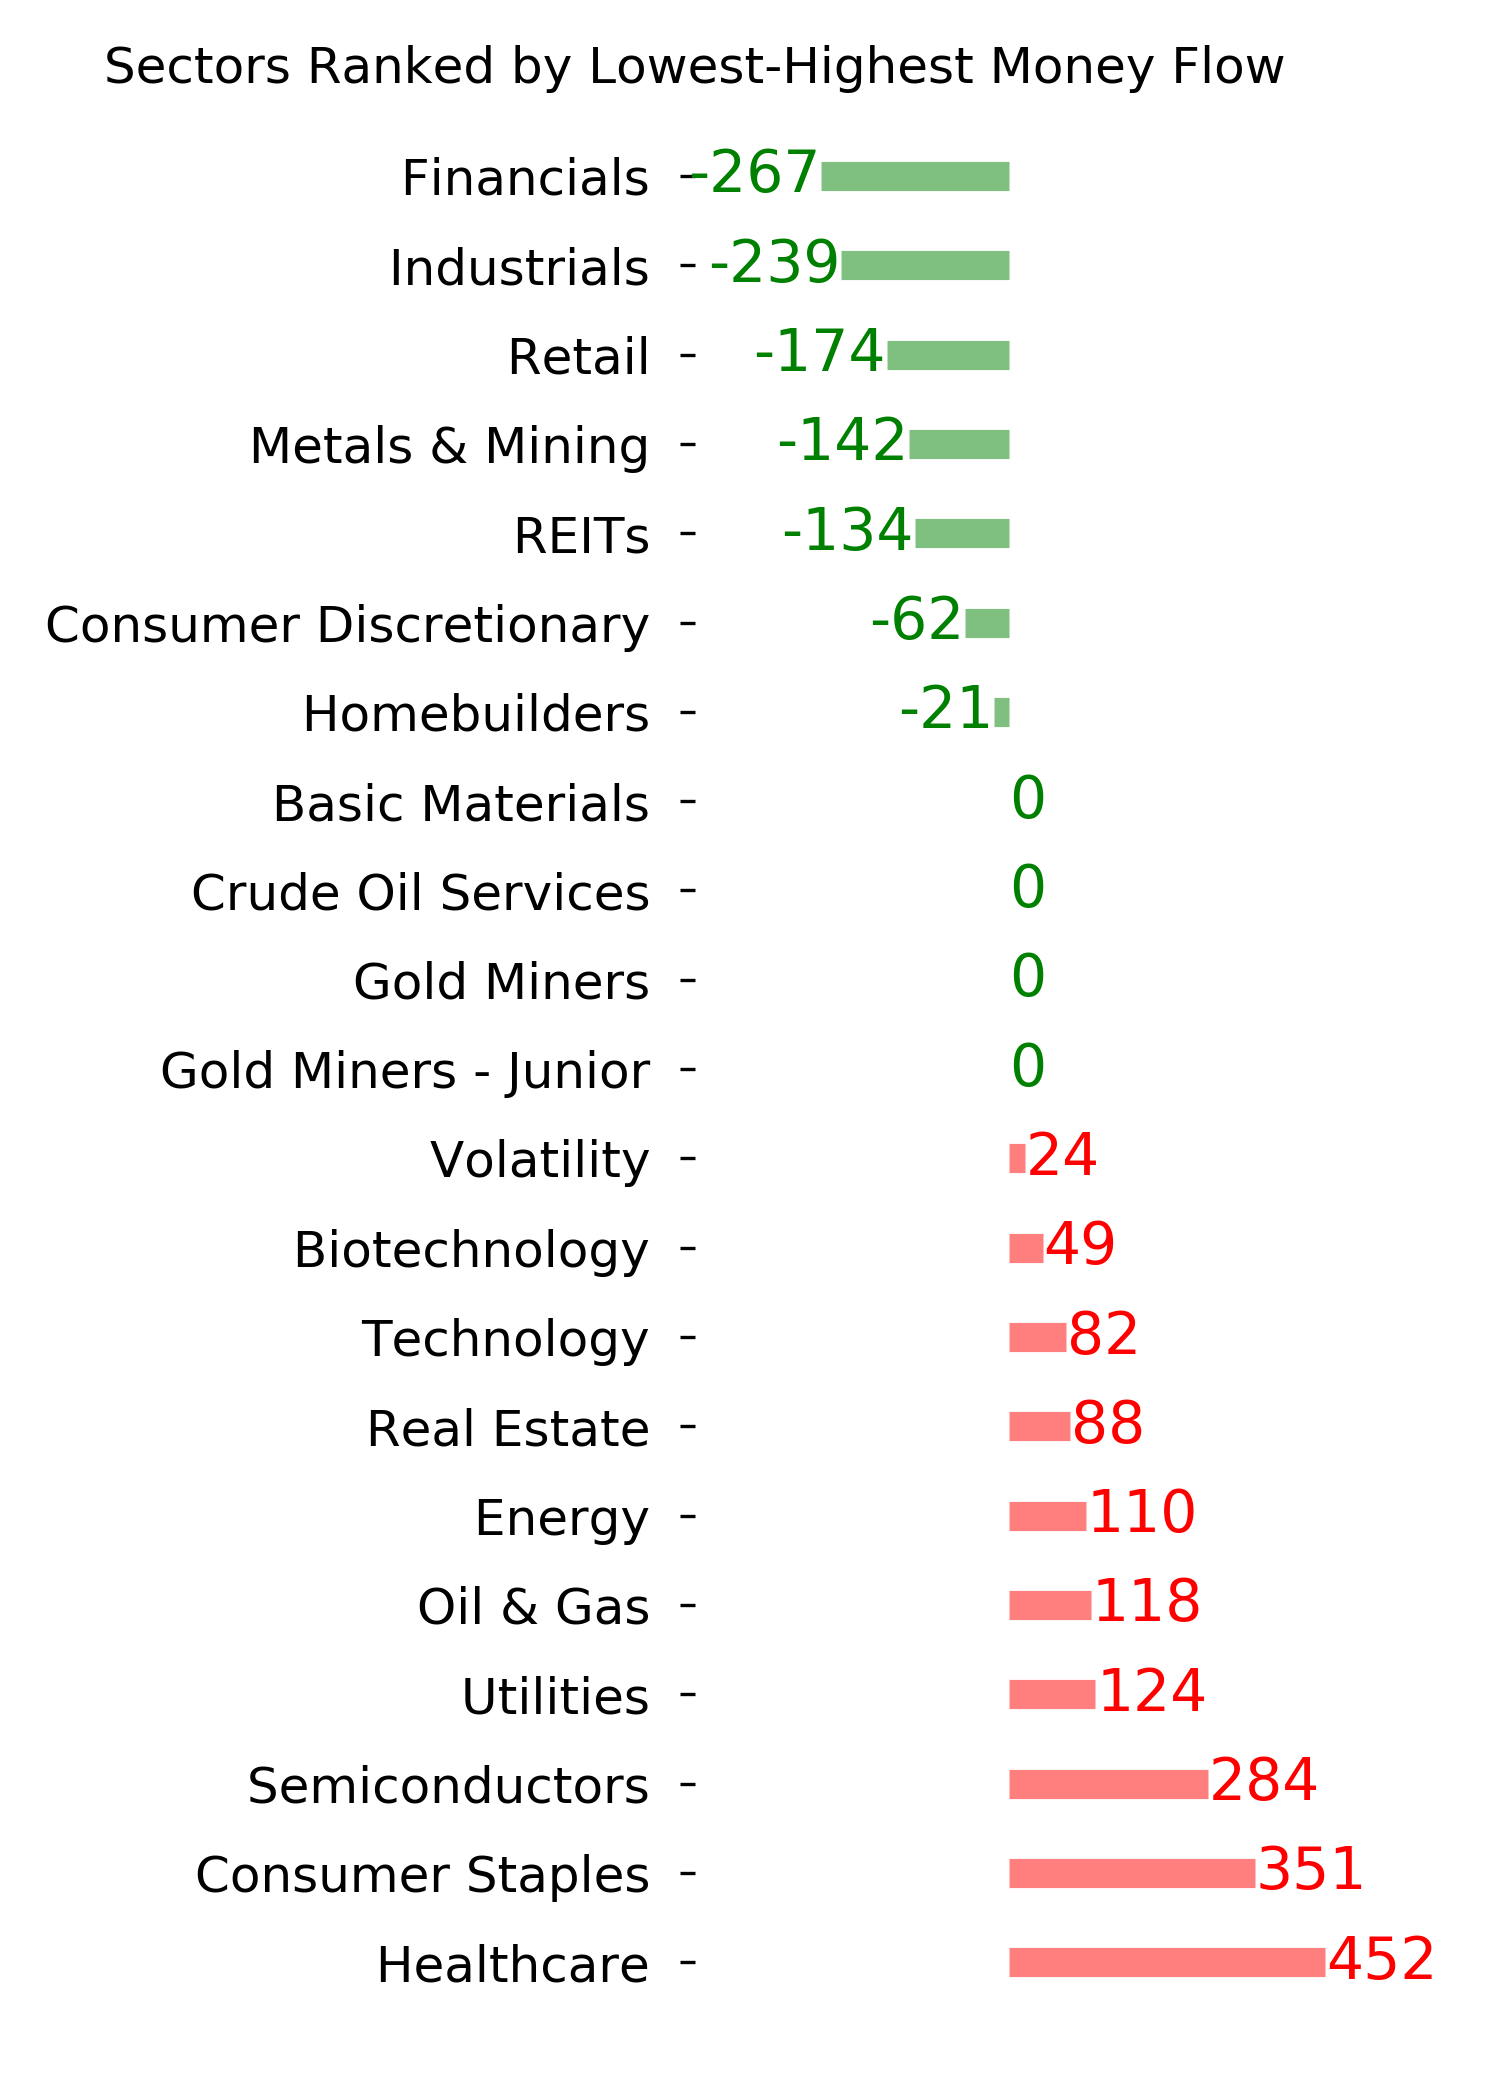
Ranks
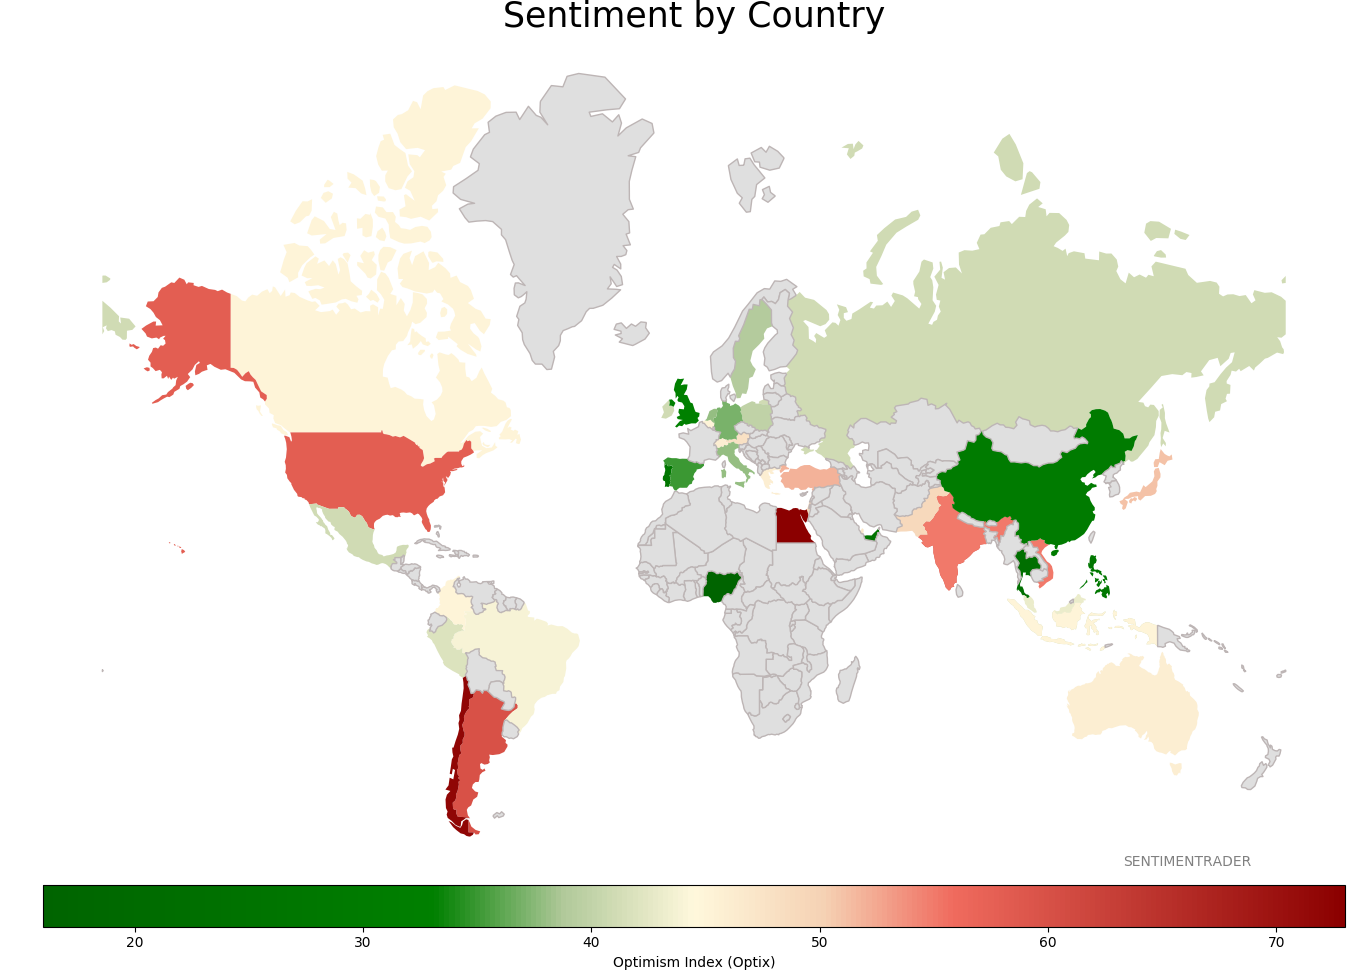
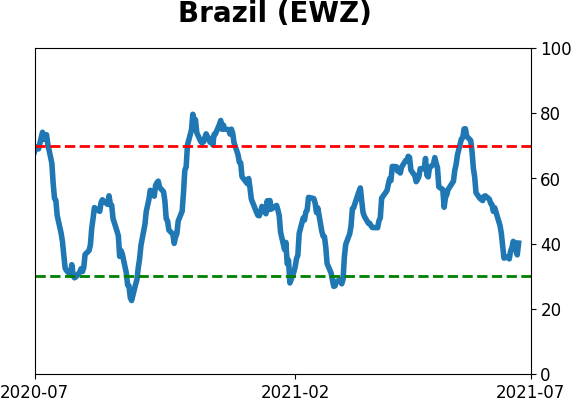
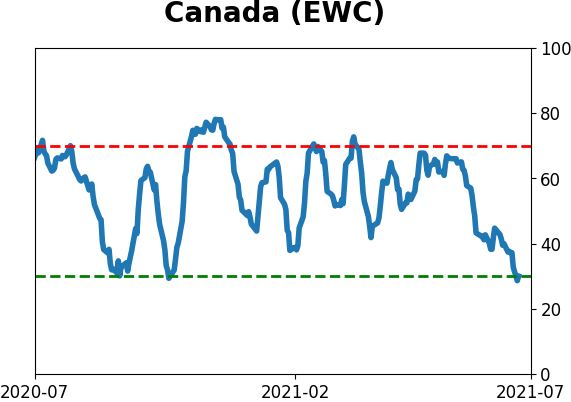
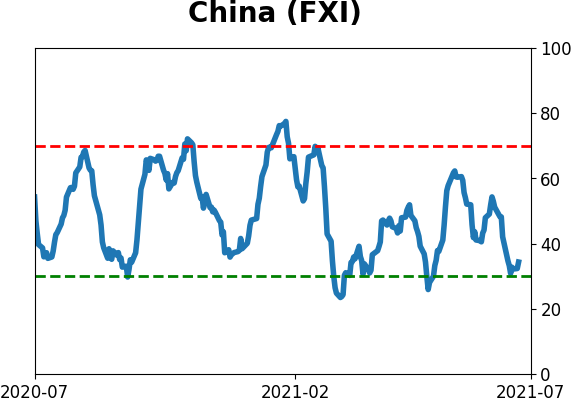
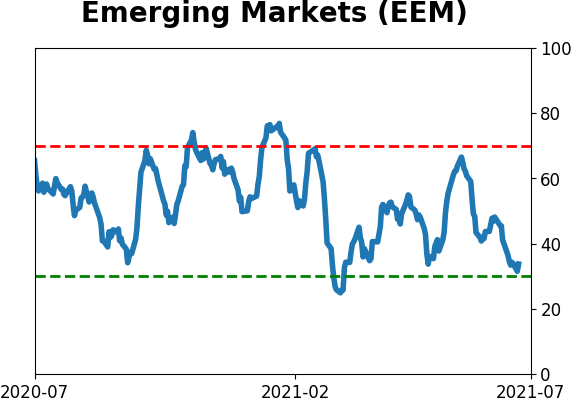
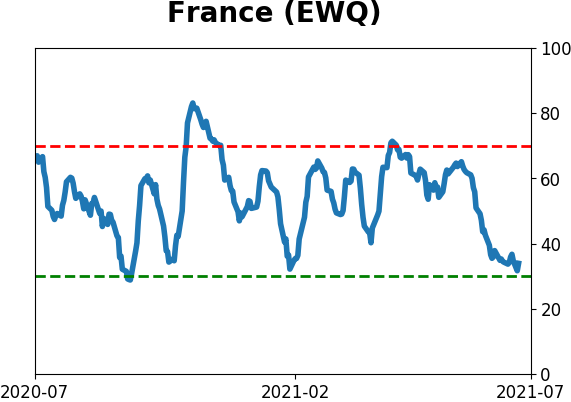
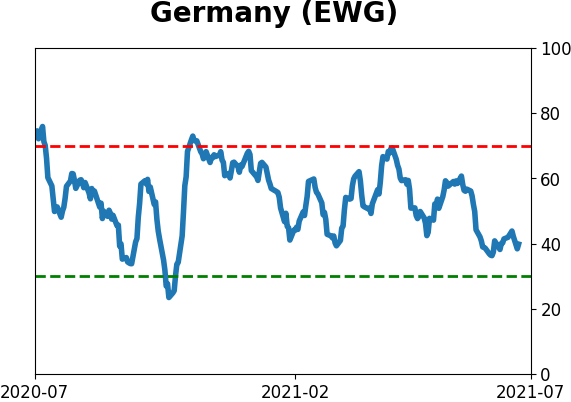
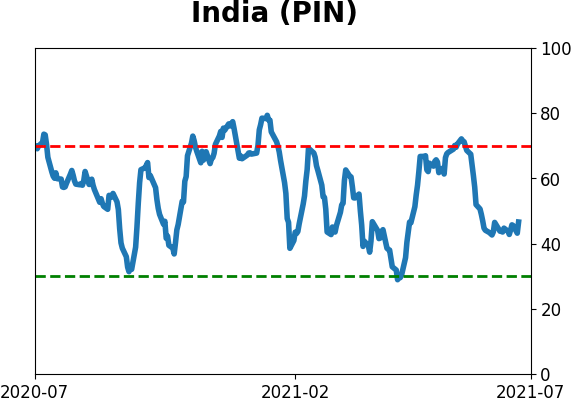
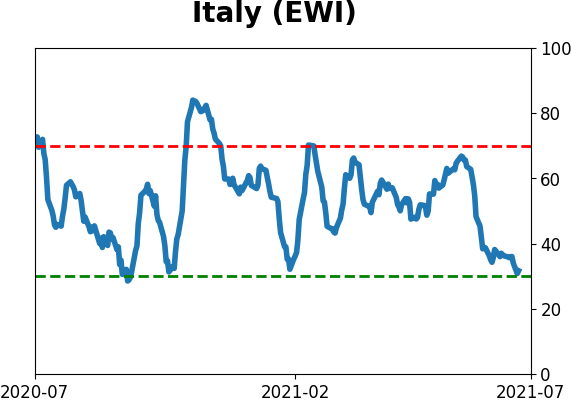
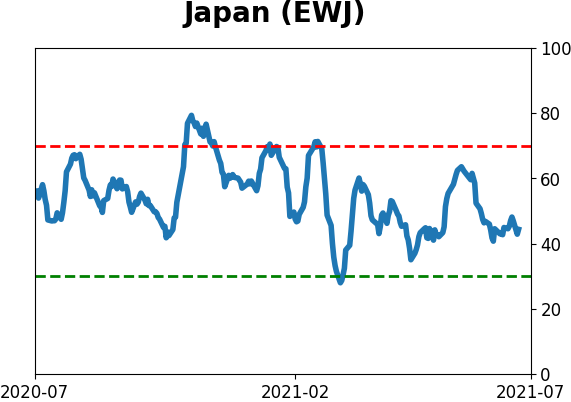
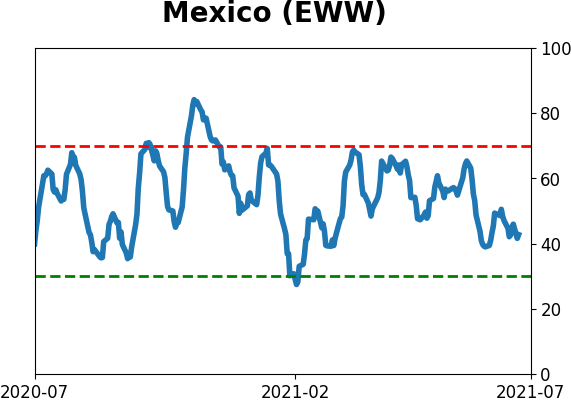
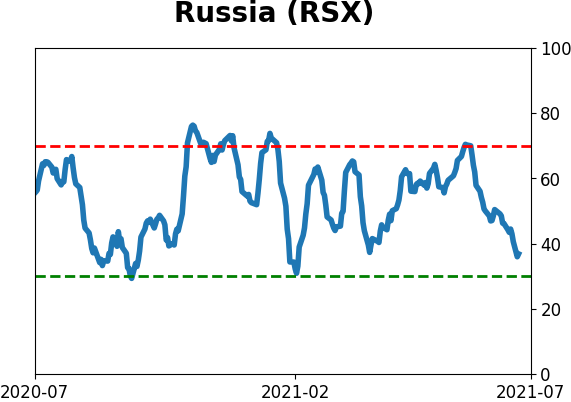
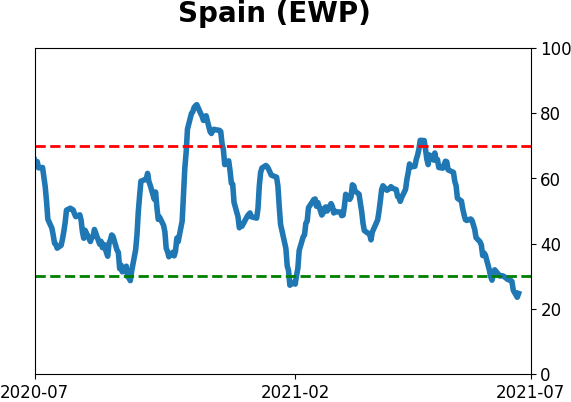
Sentiment Around The World
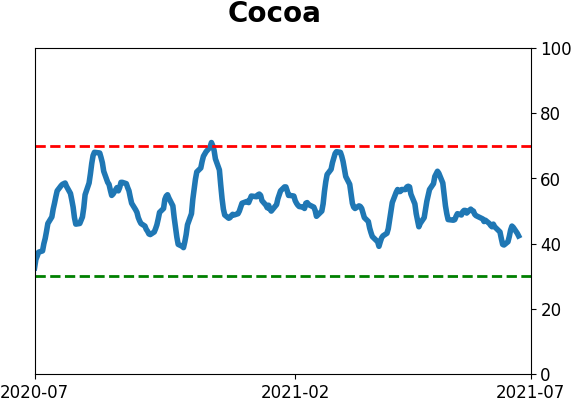
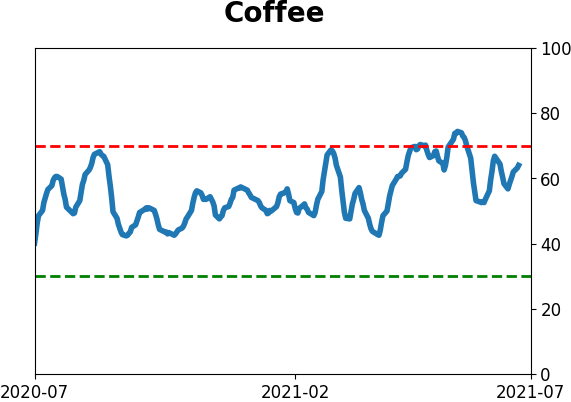
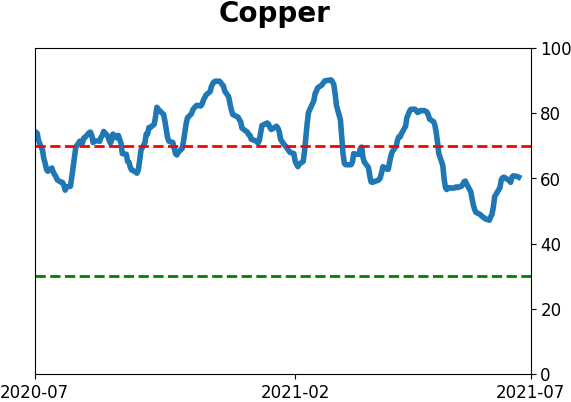
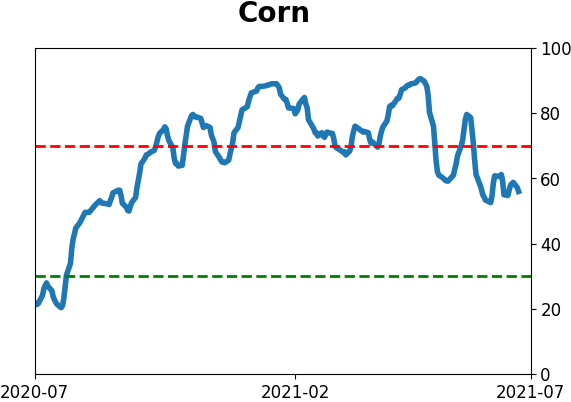
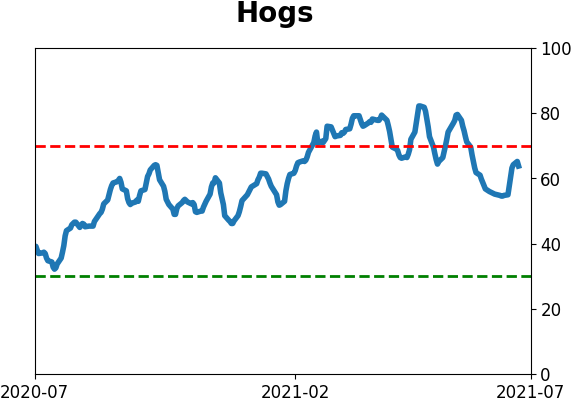
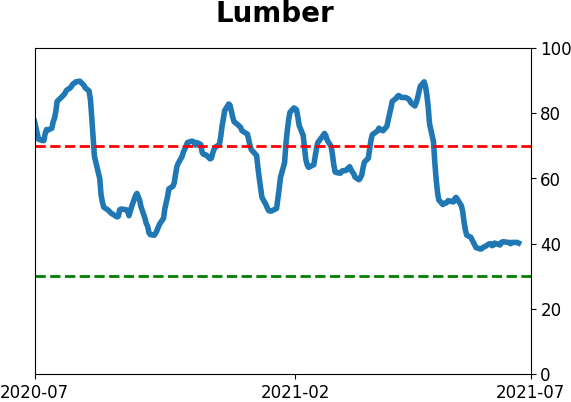
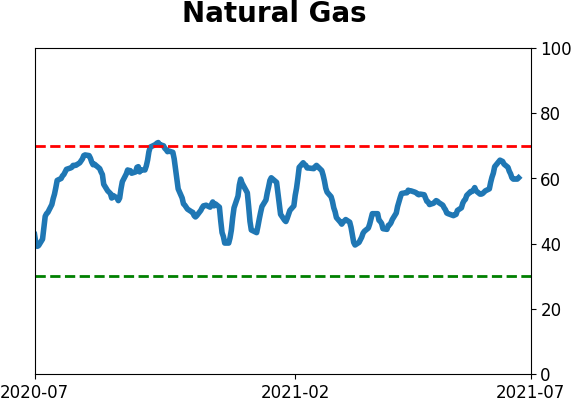
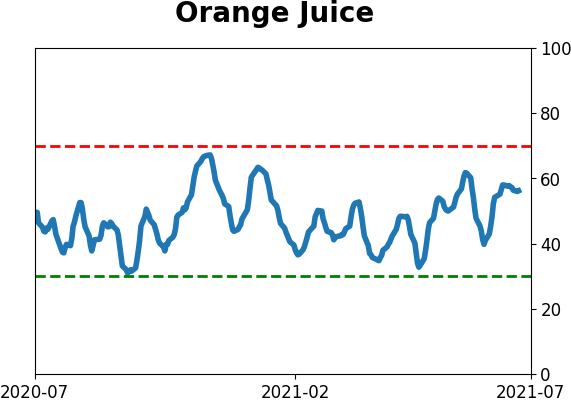
Optimism Index Thumbnails
|
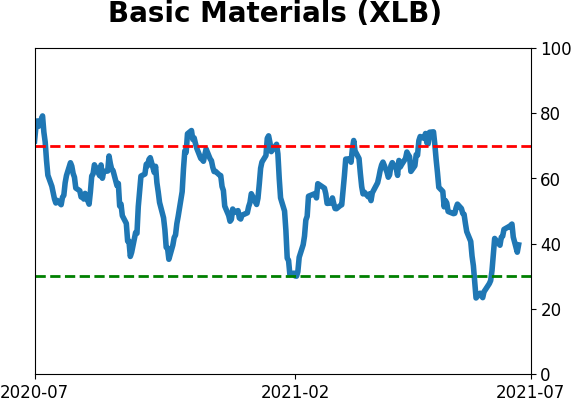
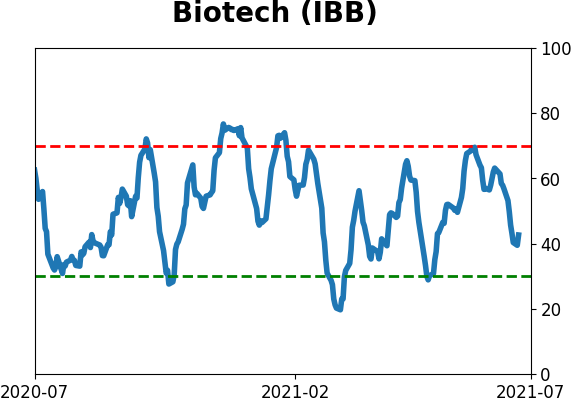
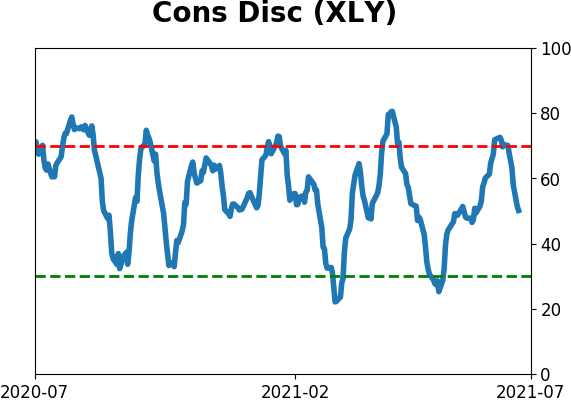
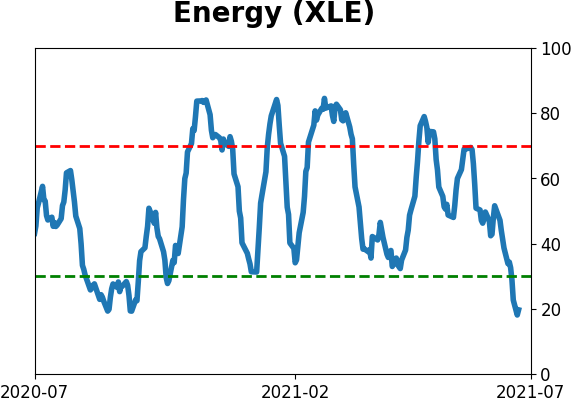
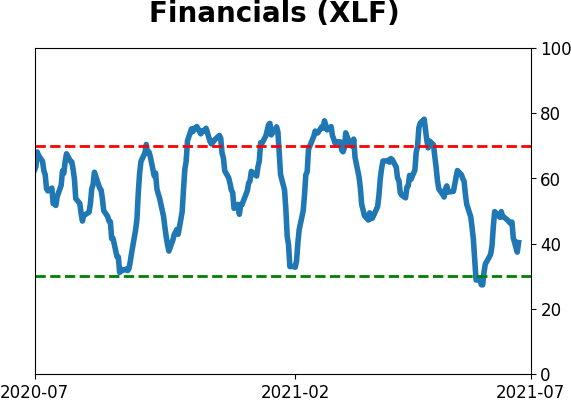
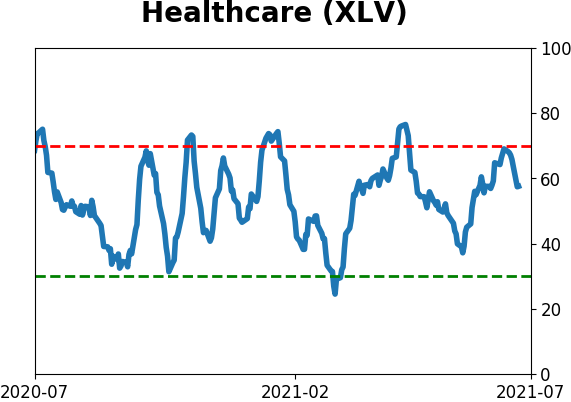
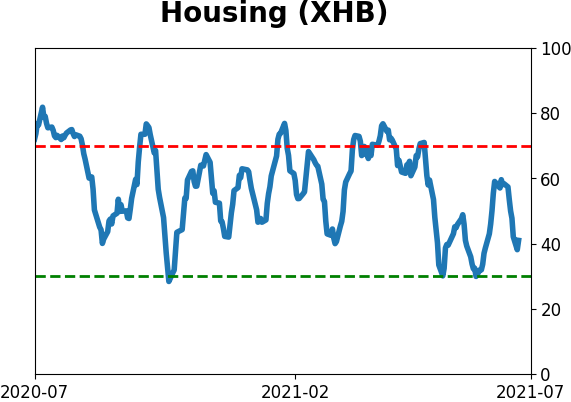
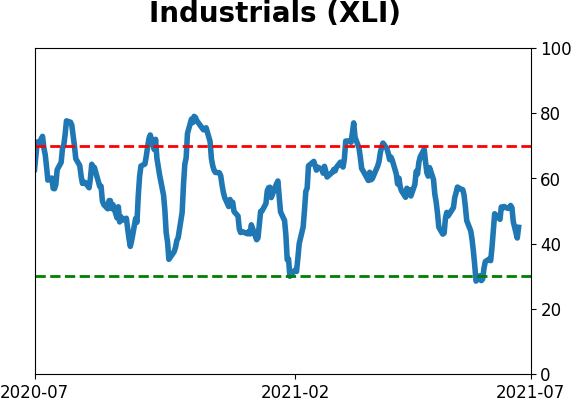
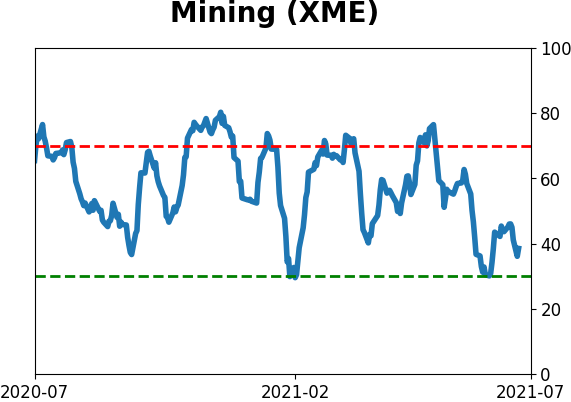
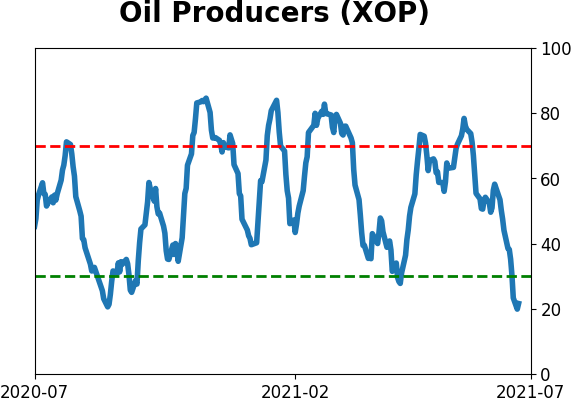
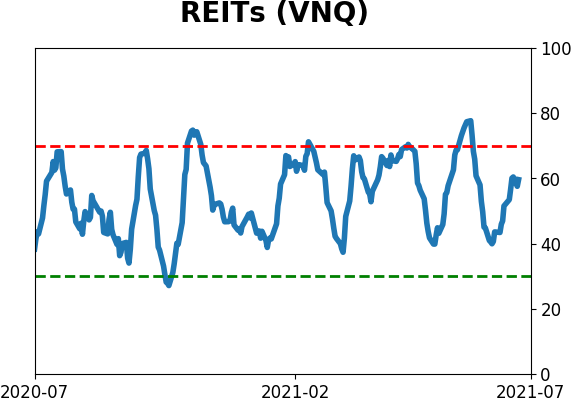
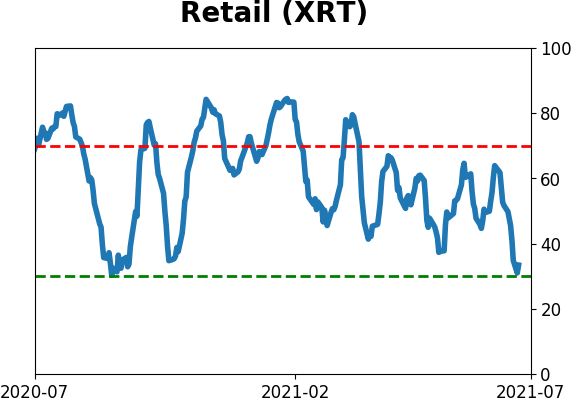
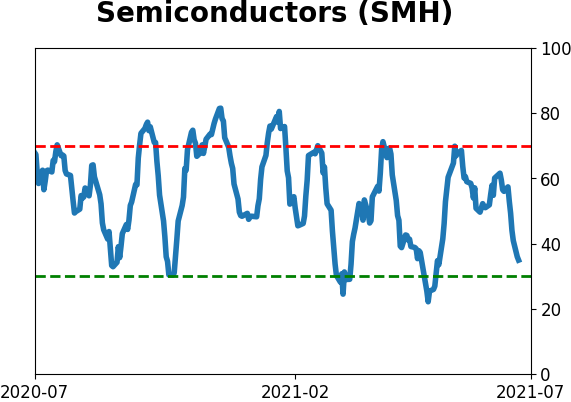
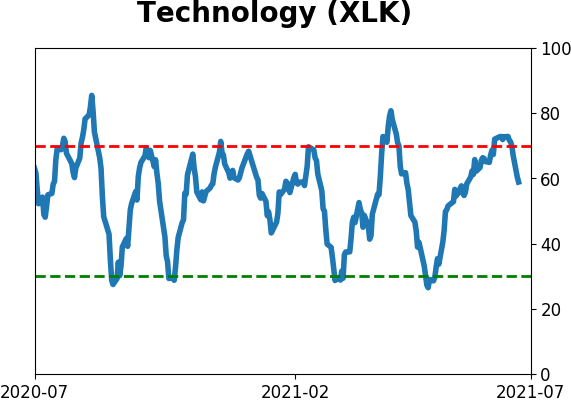
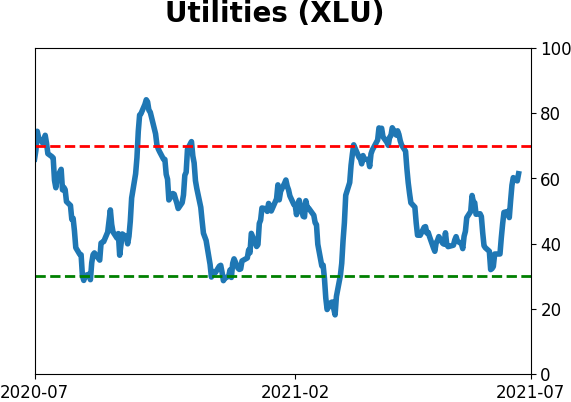
Sector ETF's - 10-Day Moving Average
|
|
|
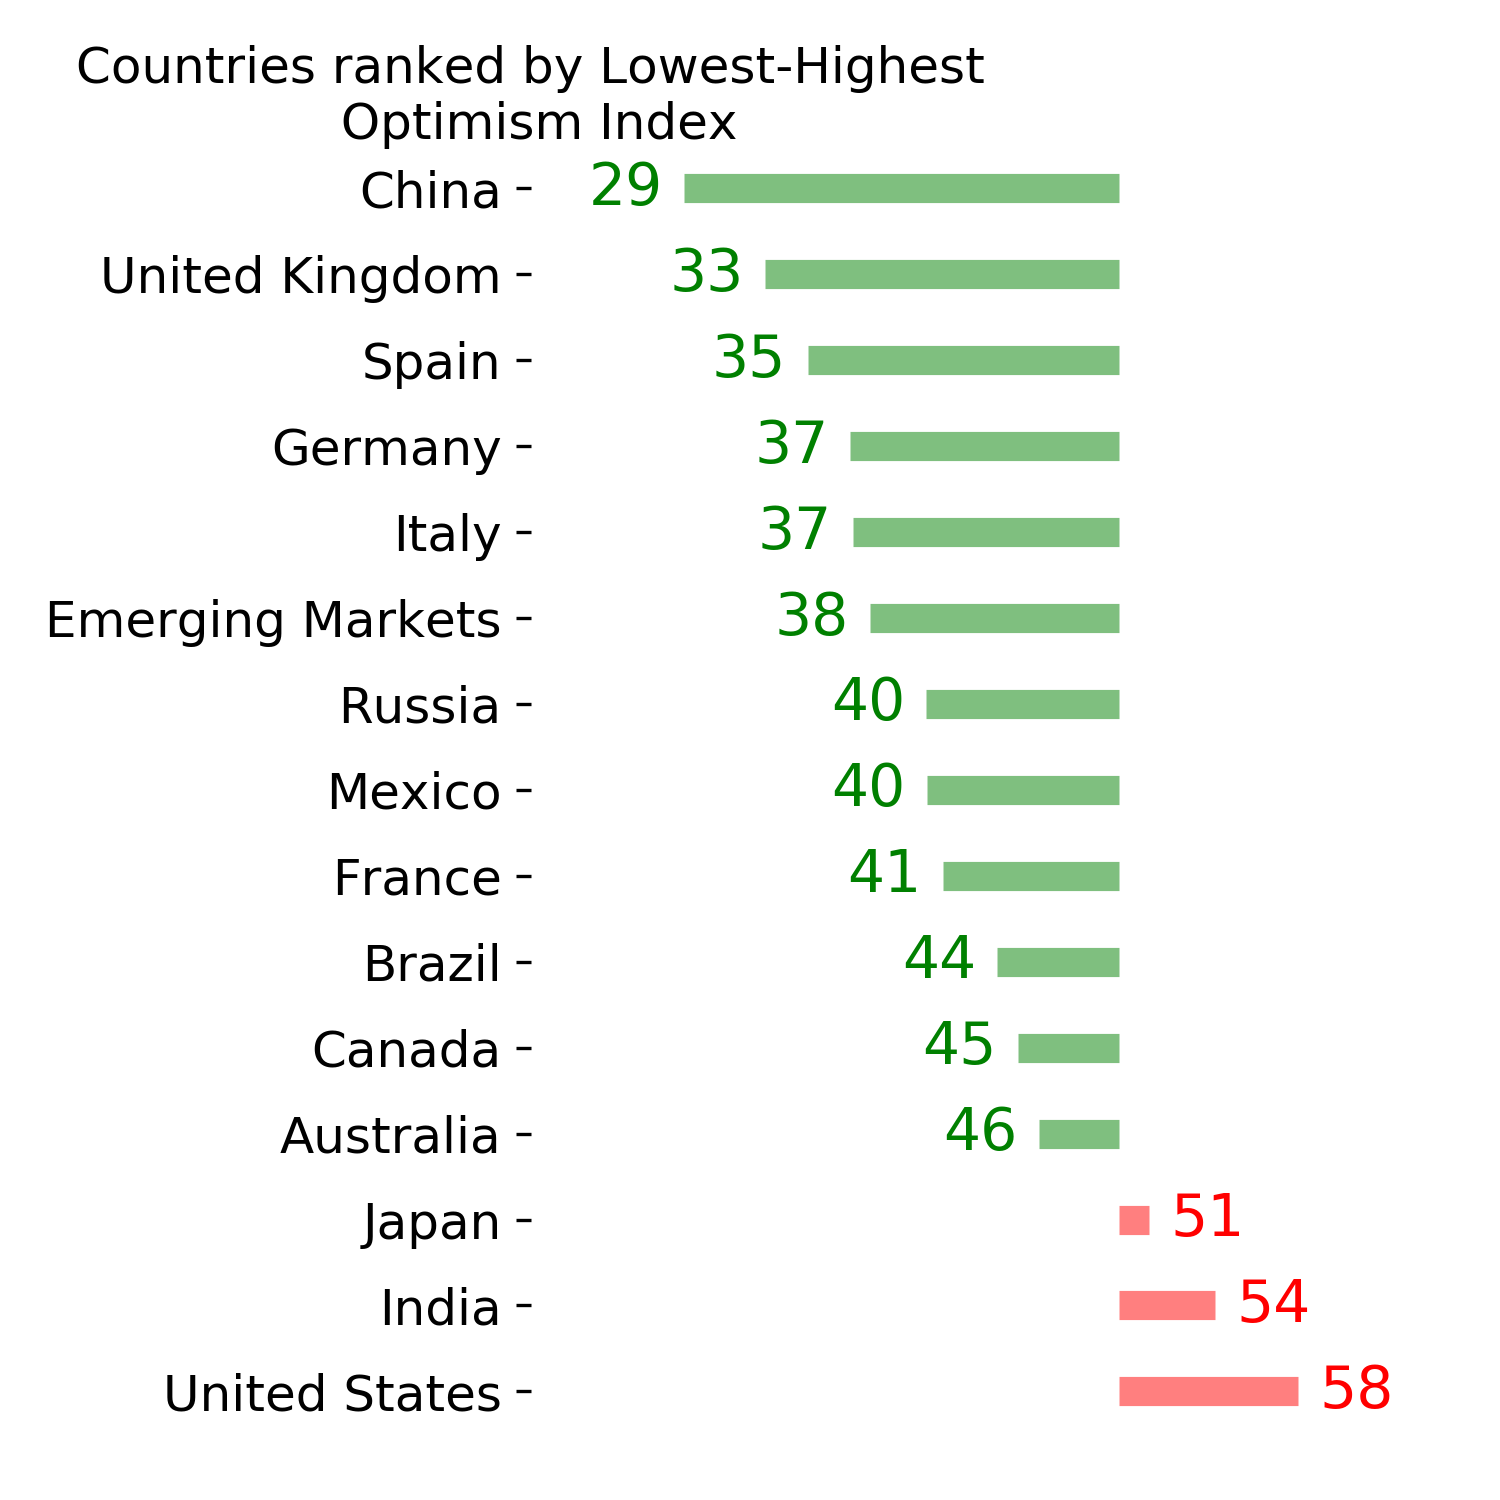
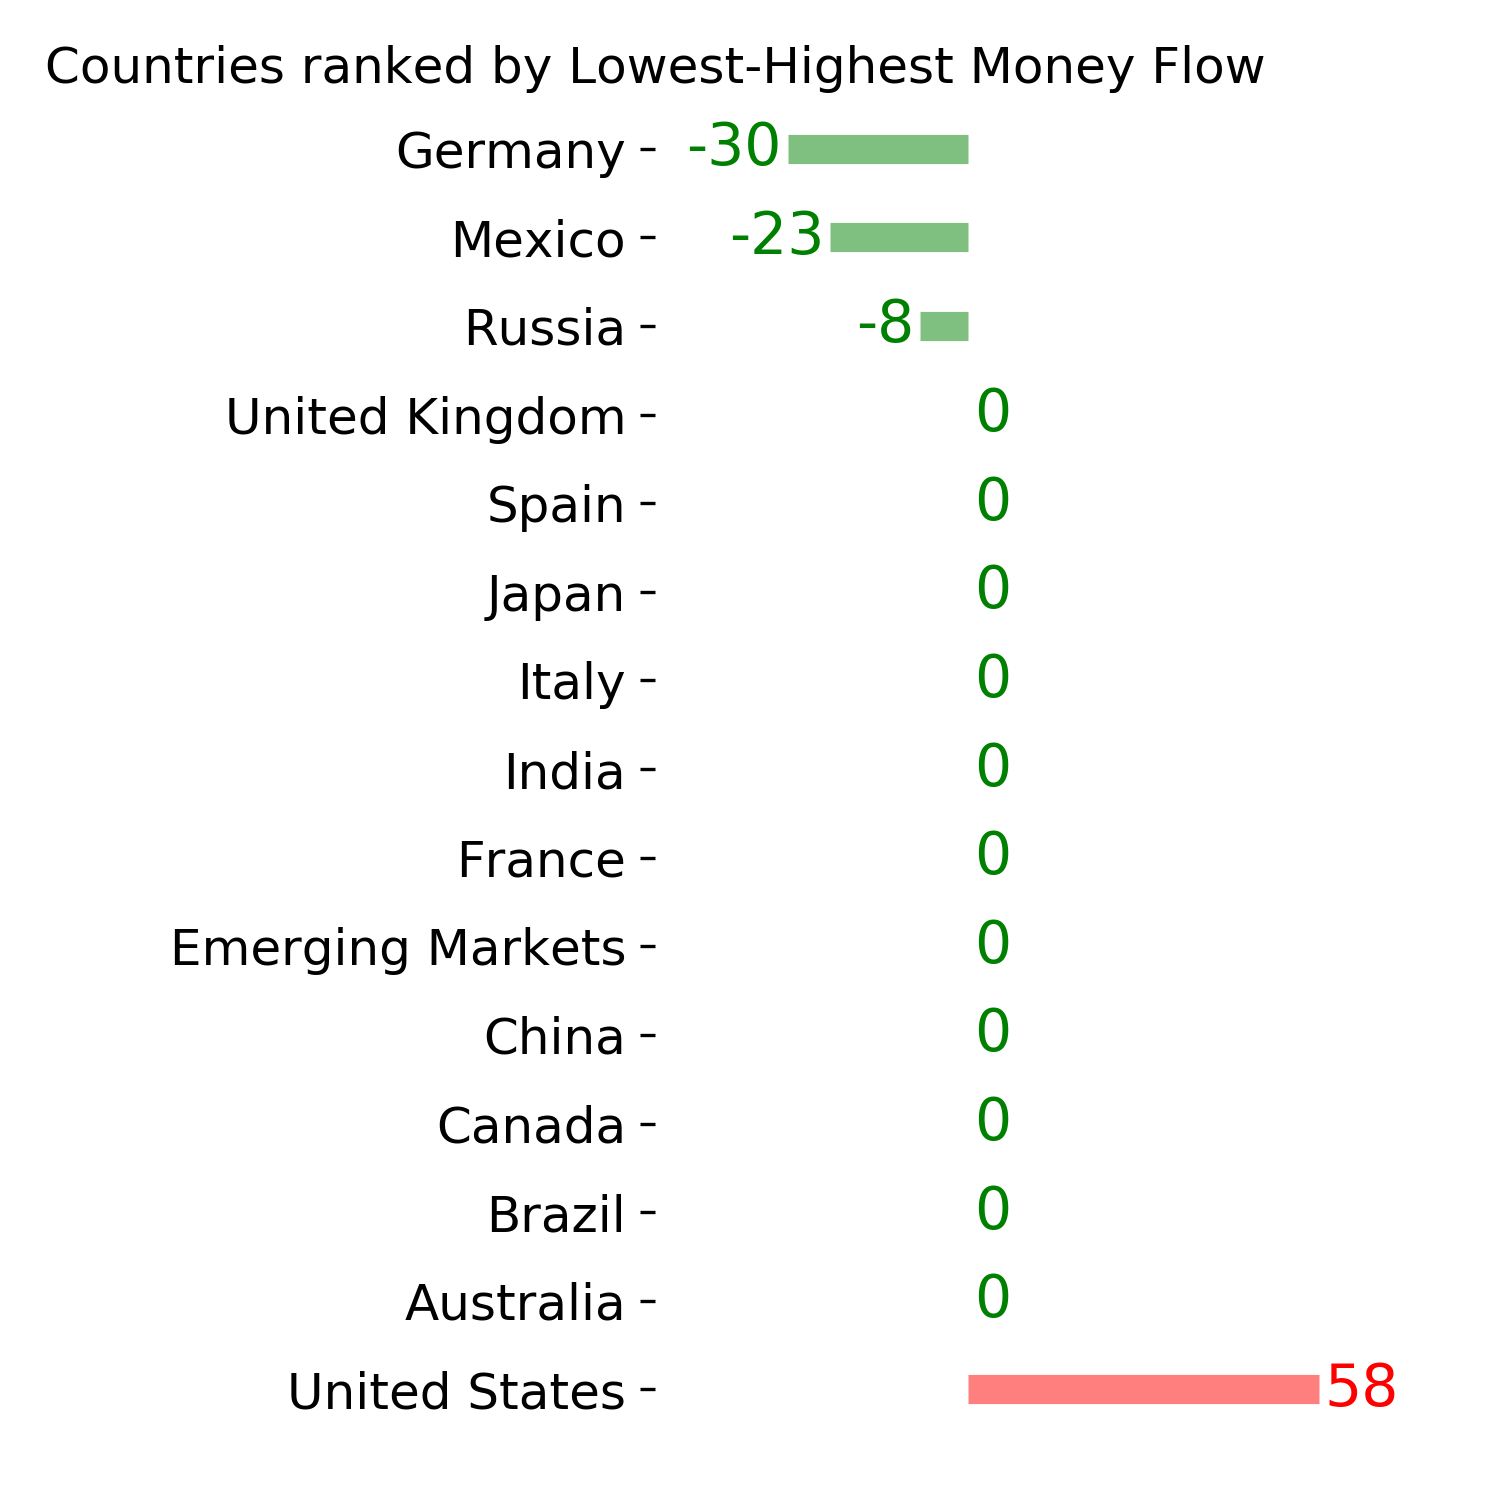
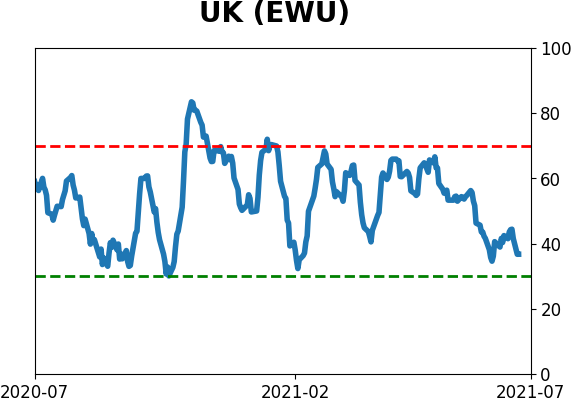
Country ETF's - 10-Day Moving Average
|
|
|
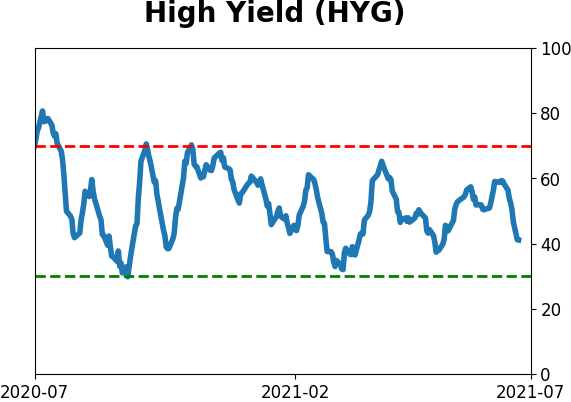
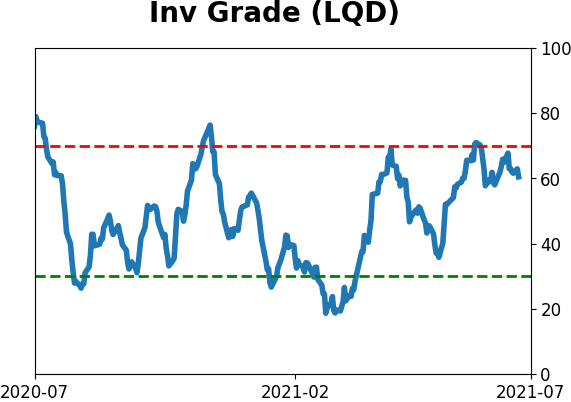
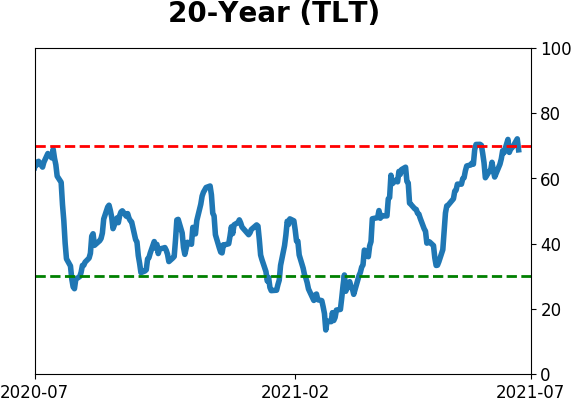
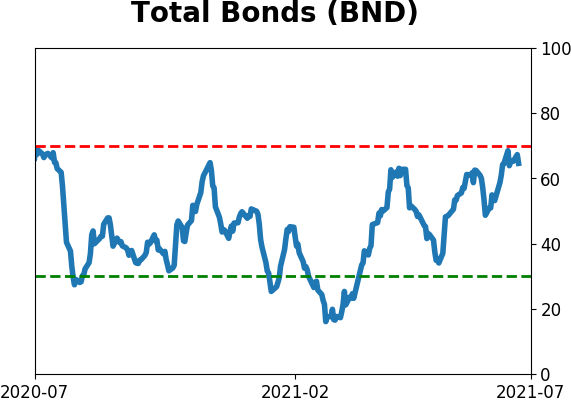
Bond ETF's - 10-Day Moving Average
|
|
|
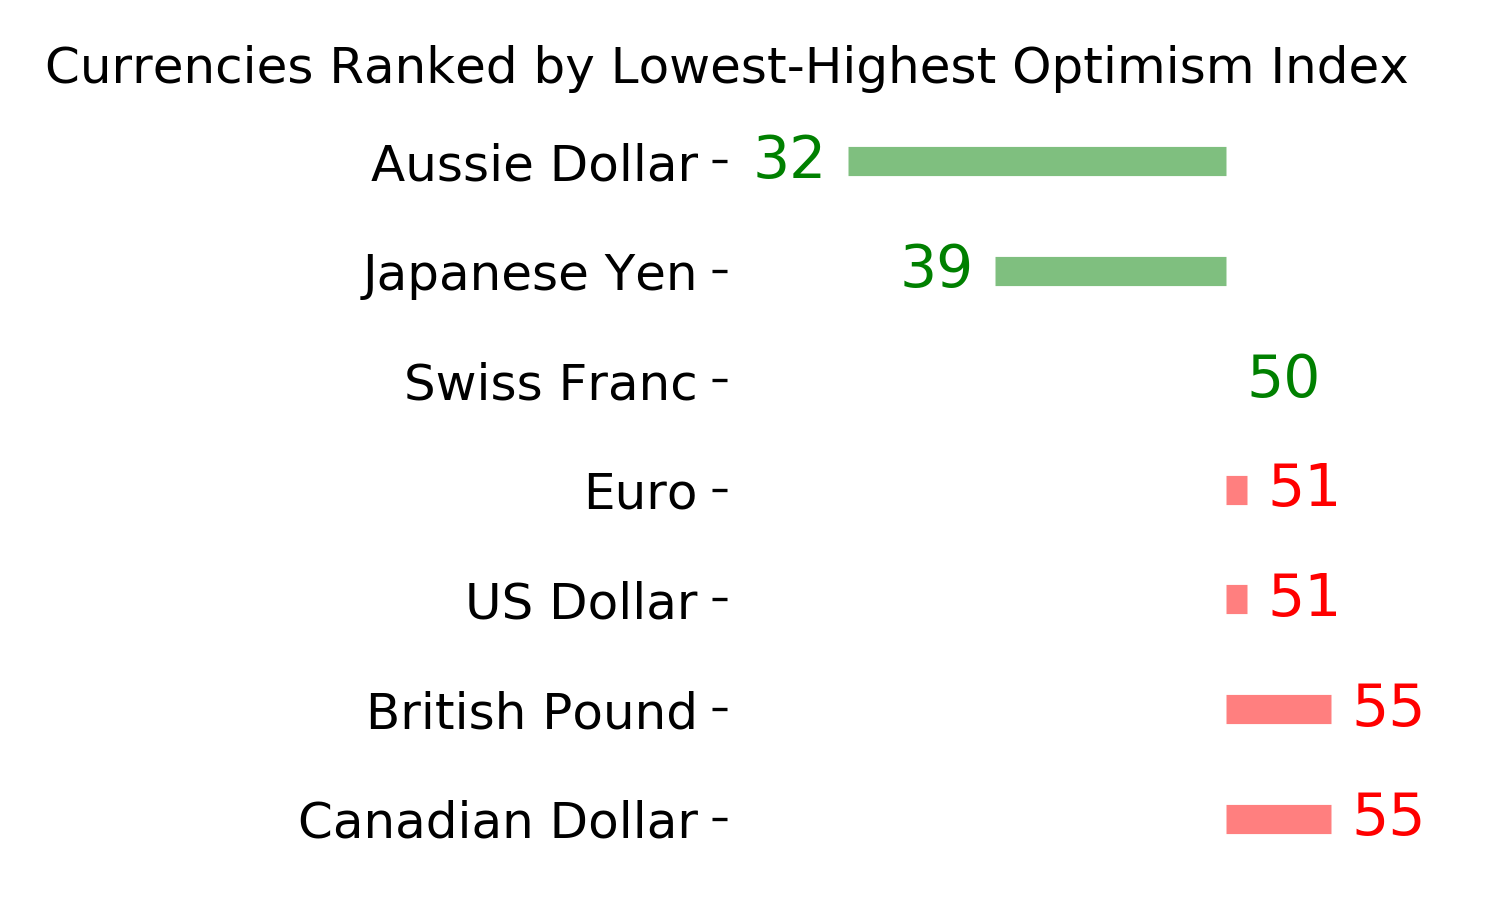
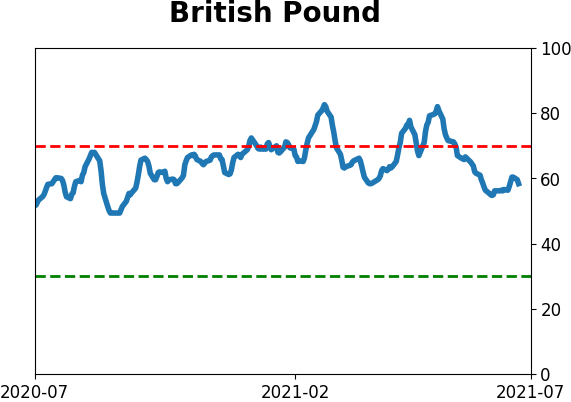
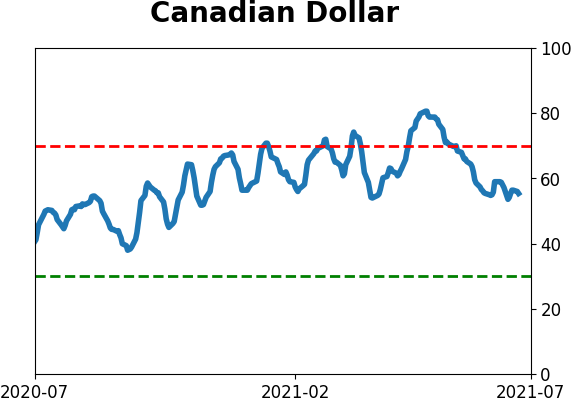
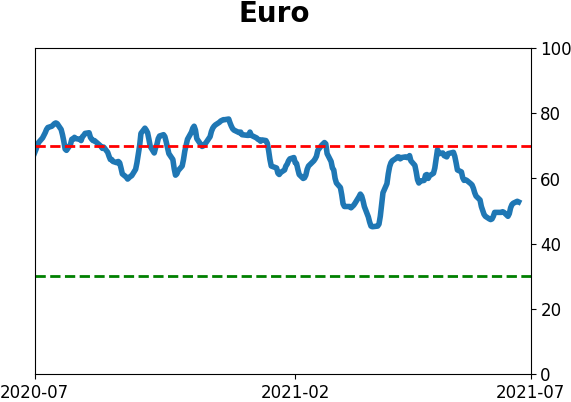
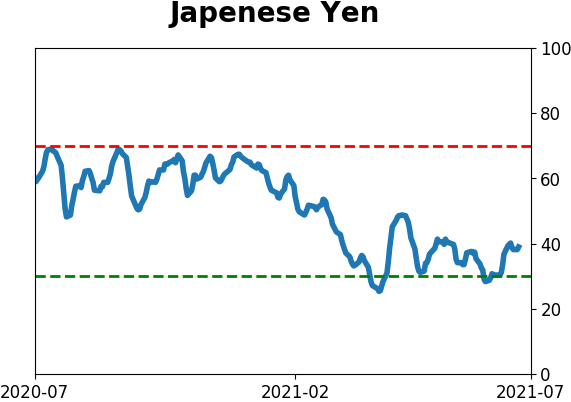
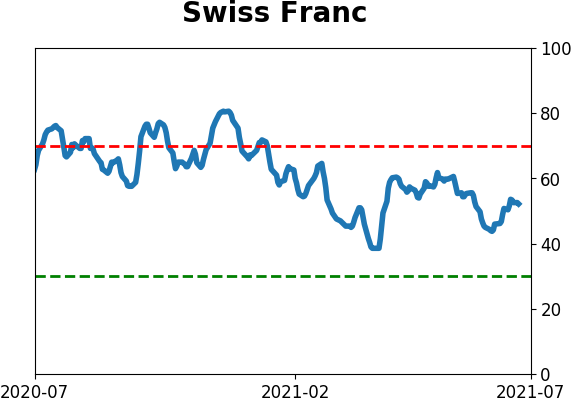
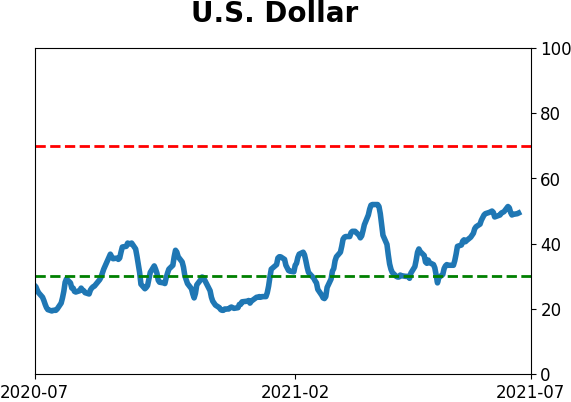
Currency ETF's - 5-Day Moving Average
|
|
|
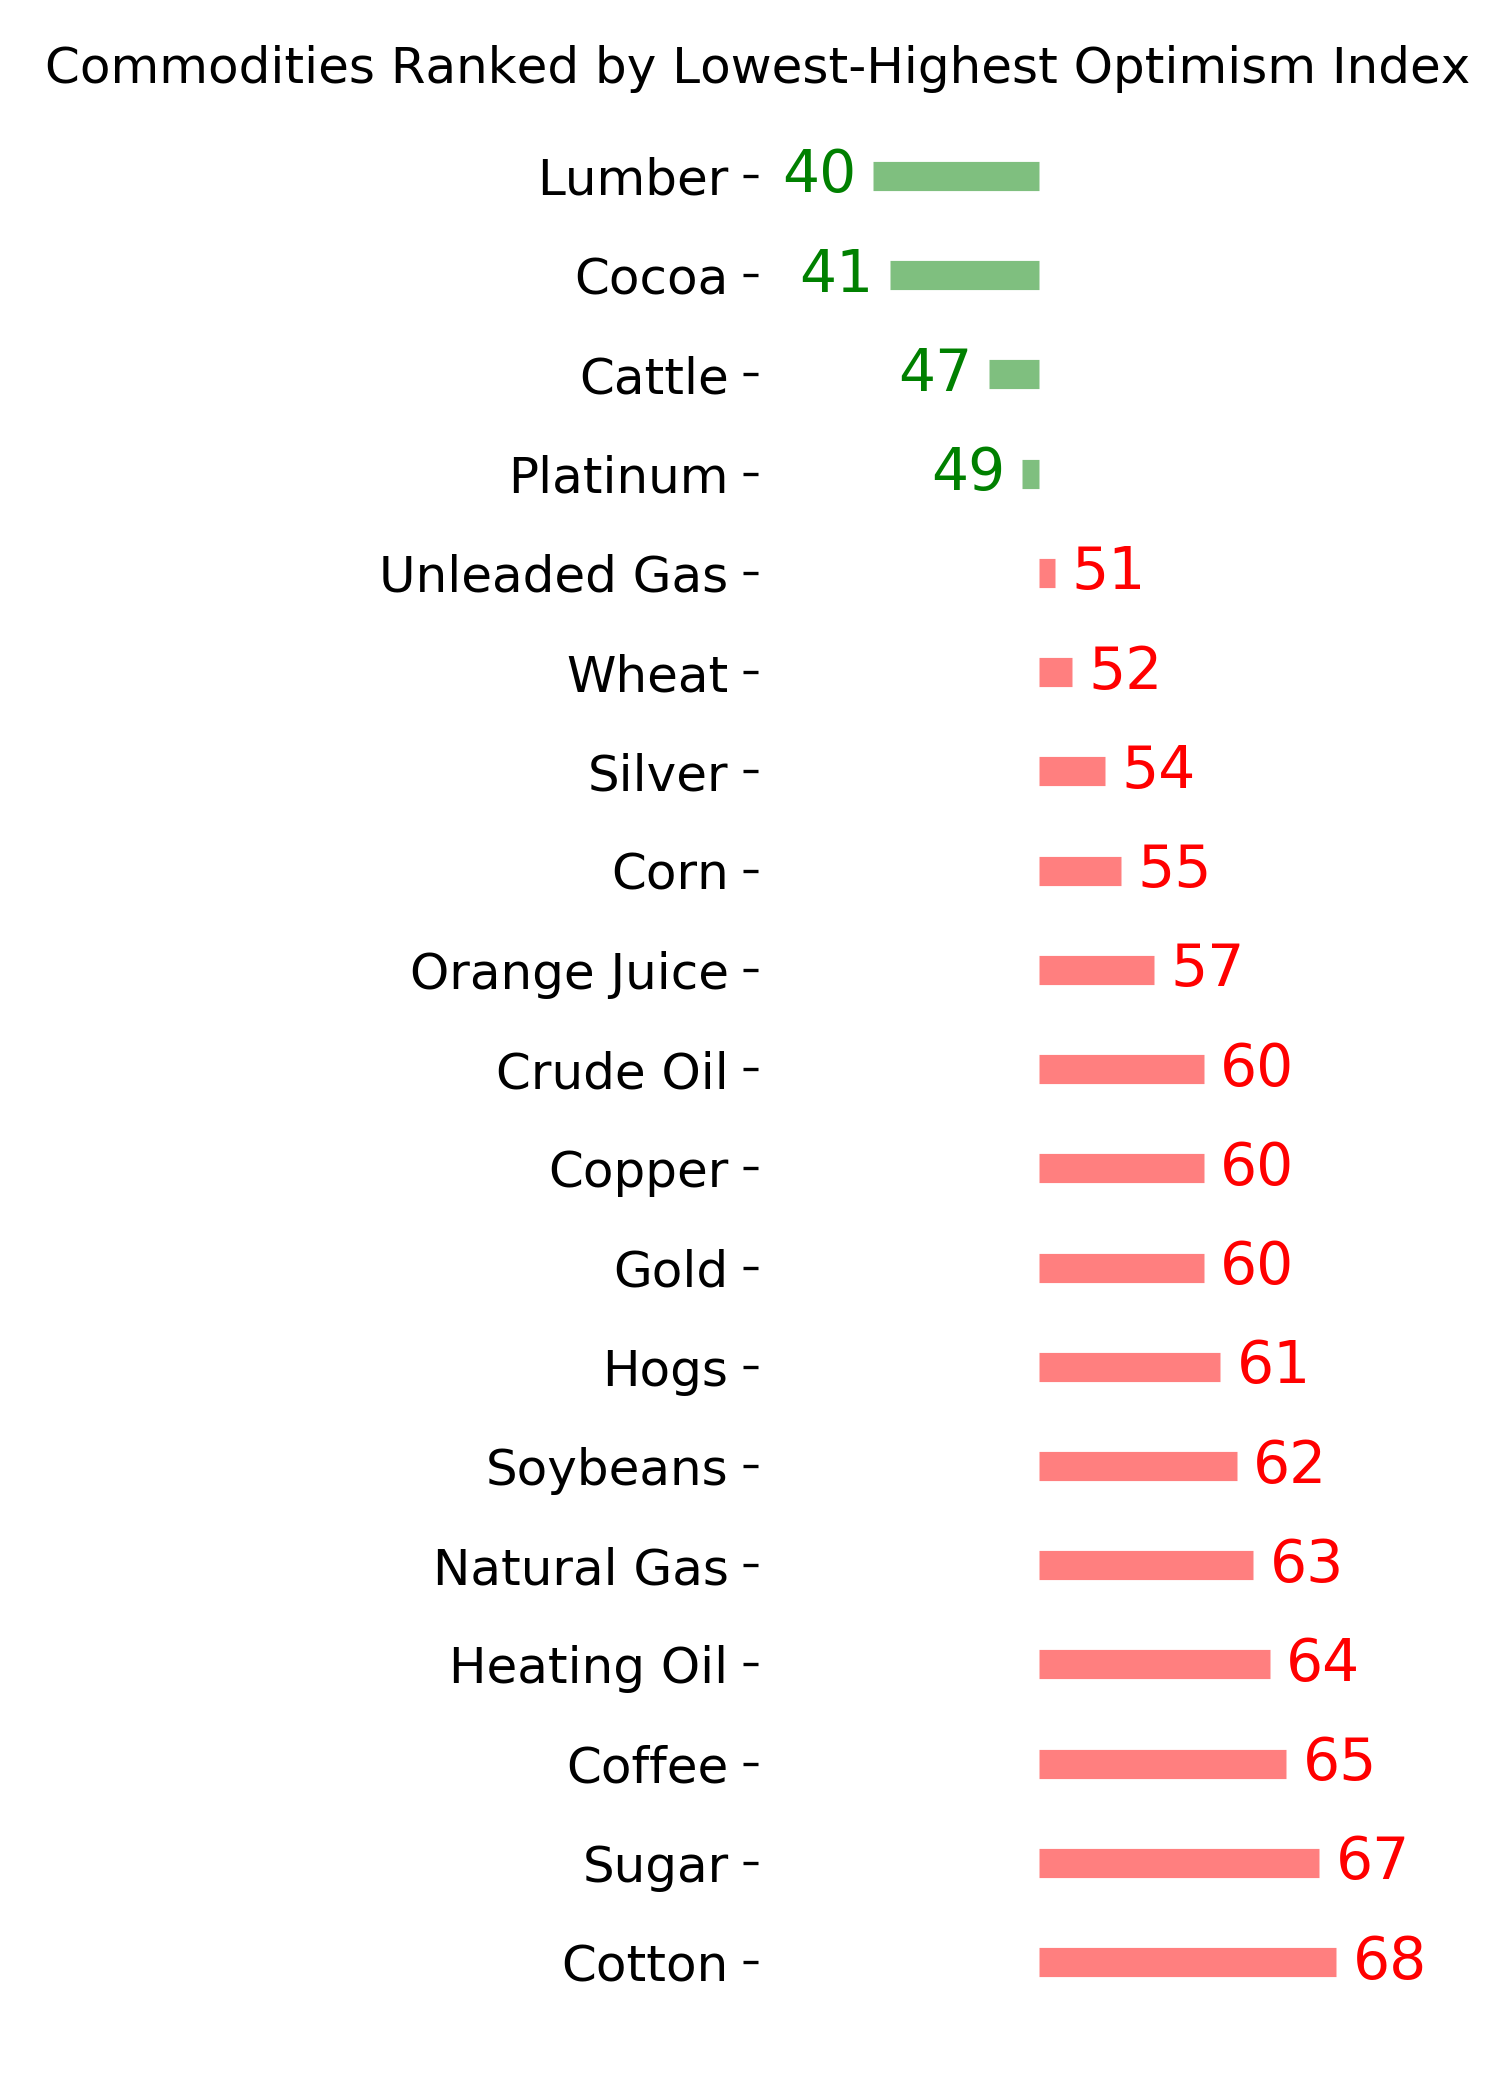
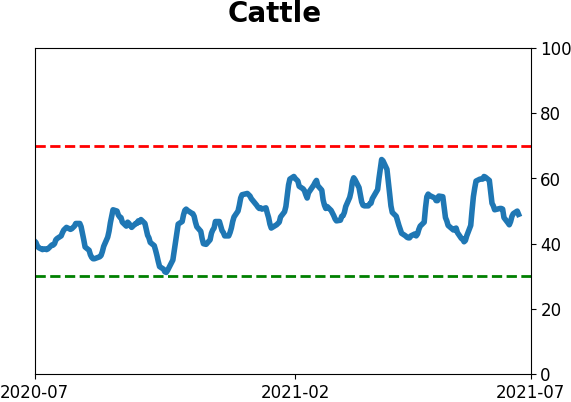
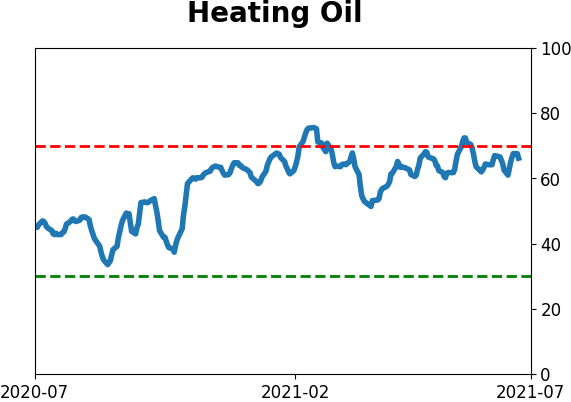
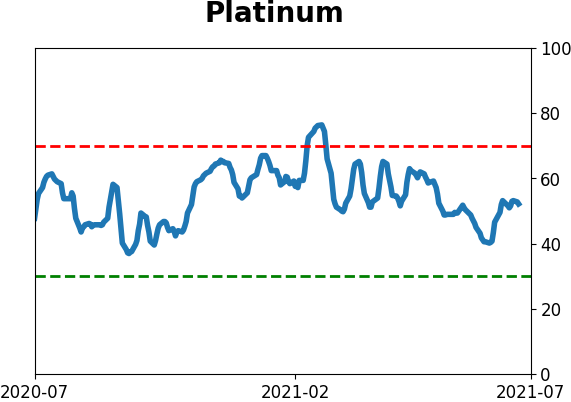
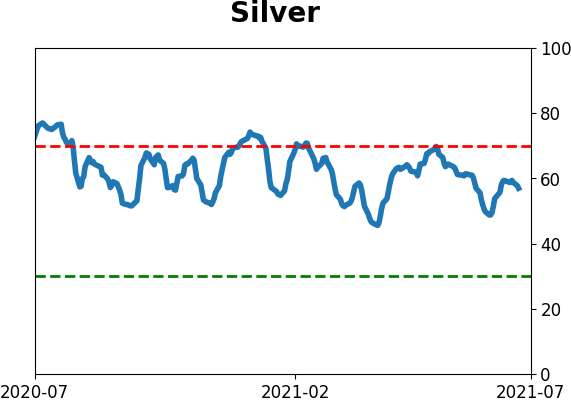
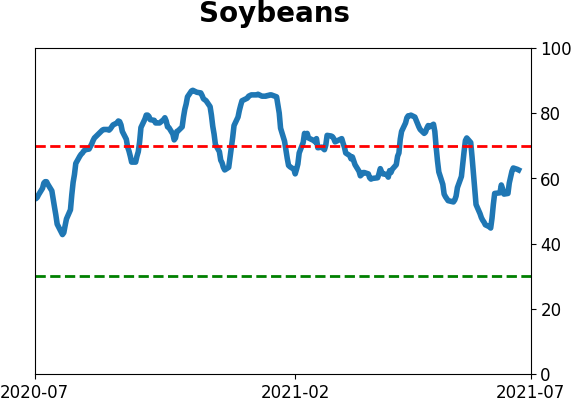
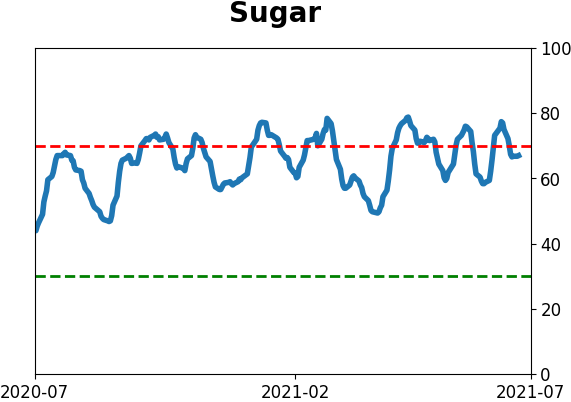
Commodity ETF's - 5-Day Moving Average
|
|