Headlines
|
|
More Stocks Struggle Under the Surface:
Within a few days of major stock indexes sitting at record highs, there has been quite a bit of internal deterioration. The Nasdaq has sounded a Titanic Warning, and the Advance/Decline Lines are hitting multi-month lows, highlighting breadth divergences.
Bottom Line:
See the Outlook & Allocations page for more details on these summaries STOCKS: Hold
The speculative frenzy in February is wrung out. Internal dynamics have mostly held up, with some exceptions. Many of our studies still show a mixed to poor short-term view, with medium- and long-term ones turning more positive. BONDS: Hold
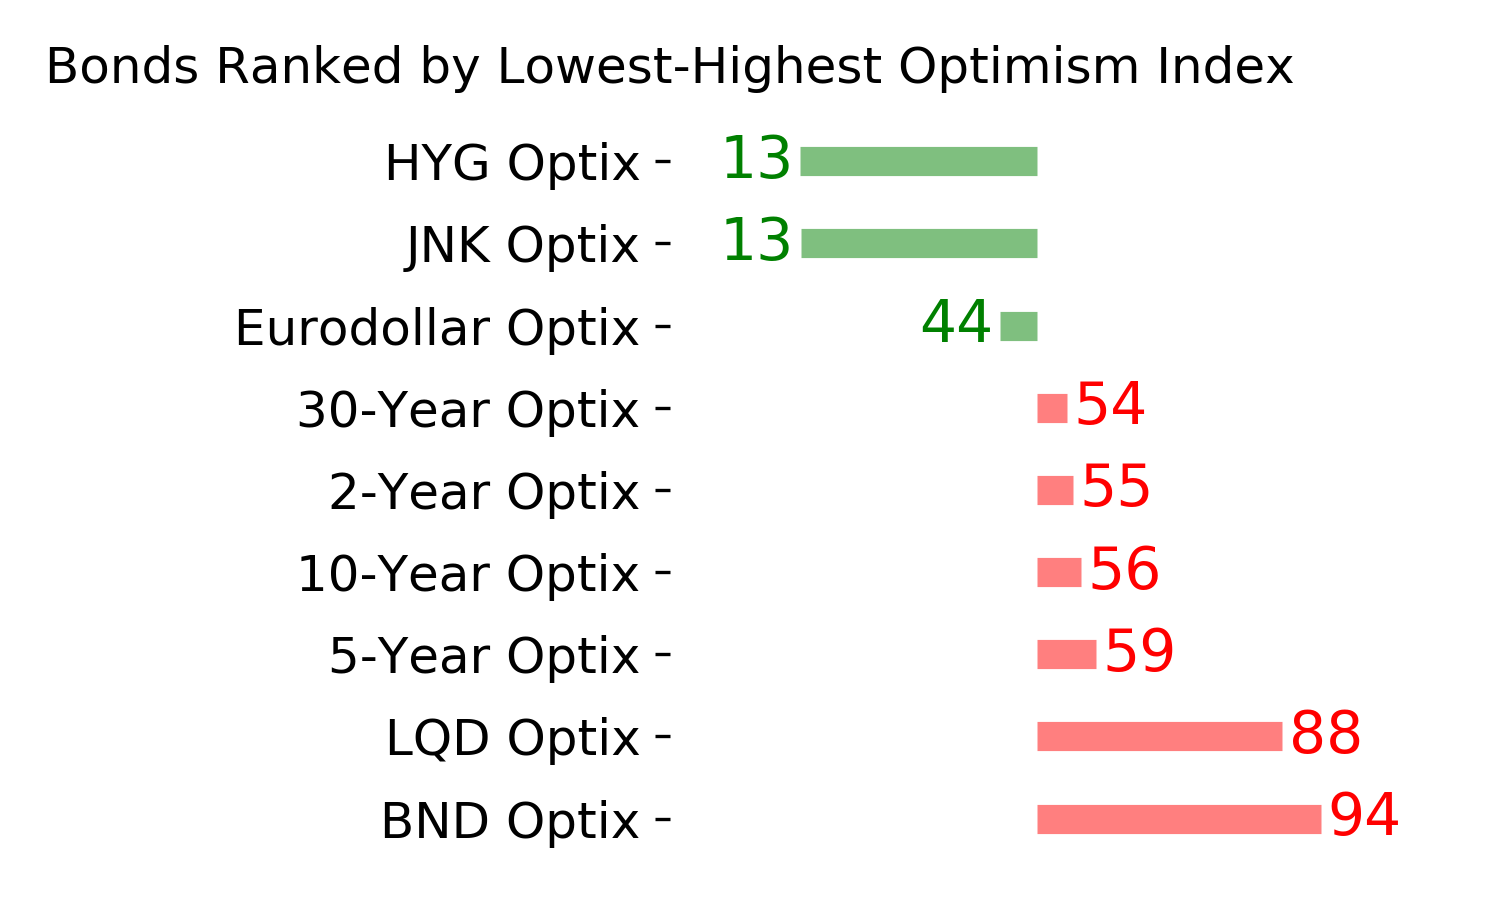
Various parts of the market got hit in March, with the lowest Bond Optimism Index we usually see during healthy environments. After a shaky couple of weeks, the broad bond market has modestly recovered. Not a big edge here either way. GOLD: Hold
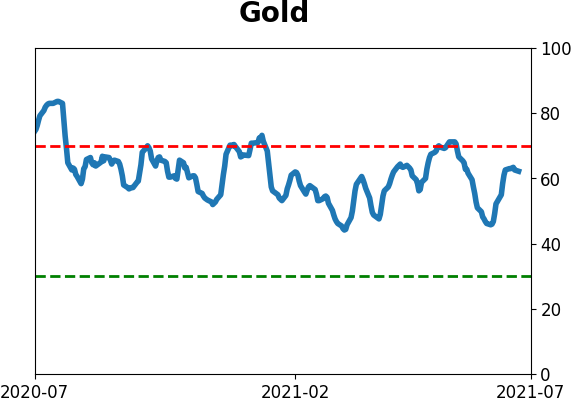
Gold and miners have done very well, recovering above long-term trend lines. The issue is that both have tended to perform poorly after similar situations - will have to wait and see how it plays out.
|
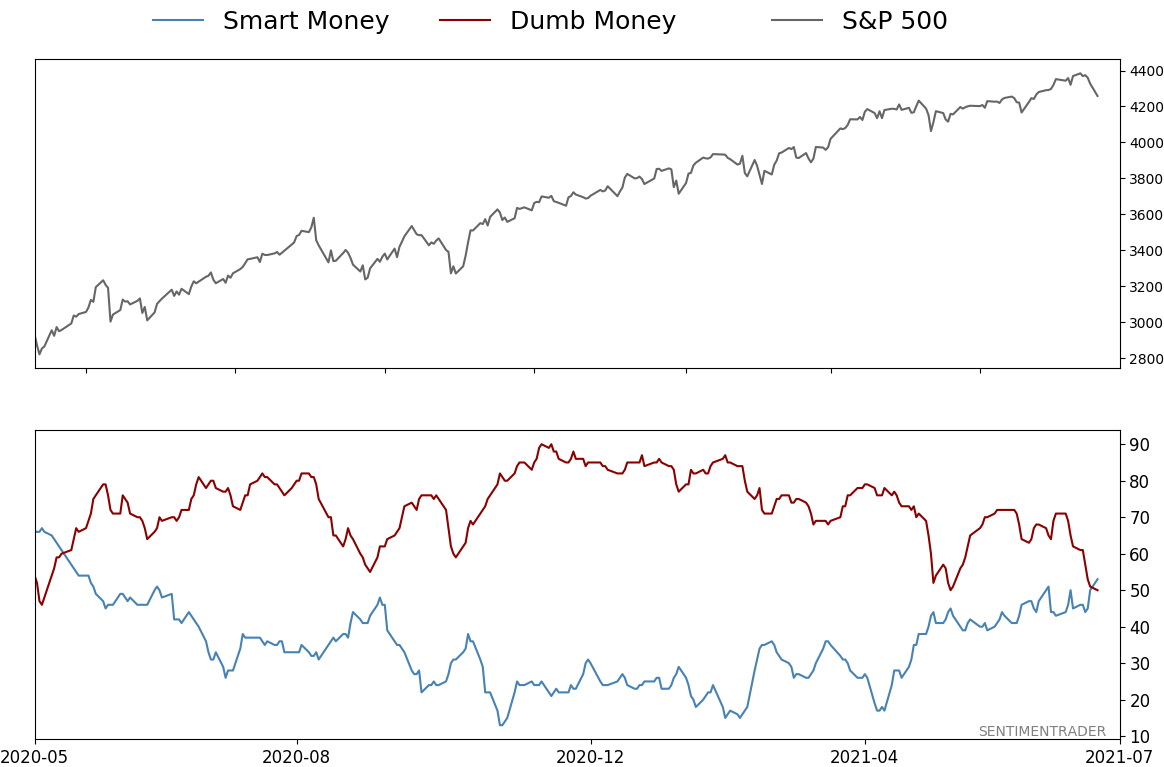
Smart / Dumb Money Confidence
|
Smart Money Confidence: 53%
Dumb Money Confidence: 50%
|
|
Risk Levels
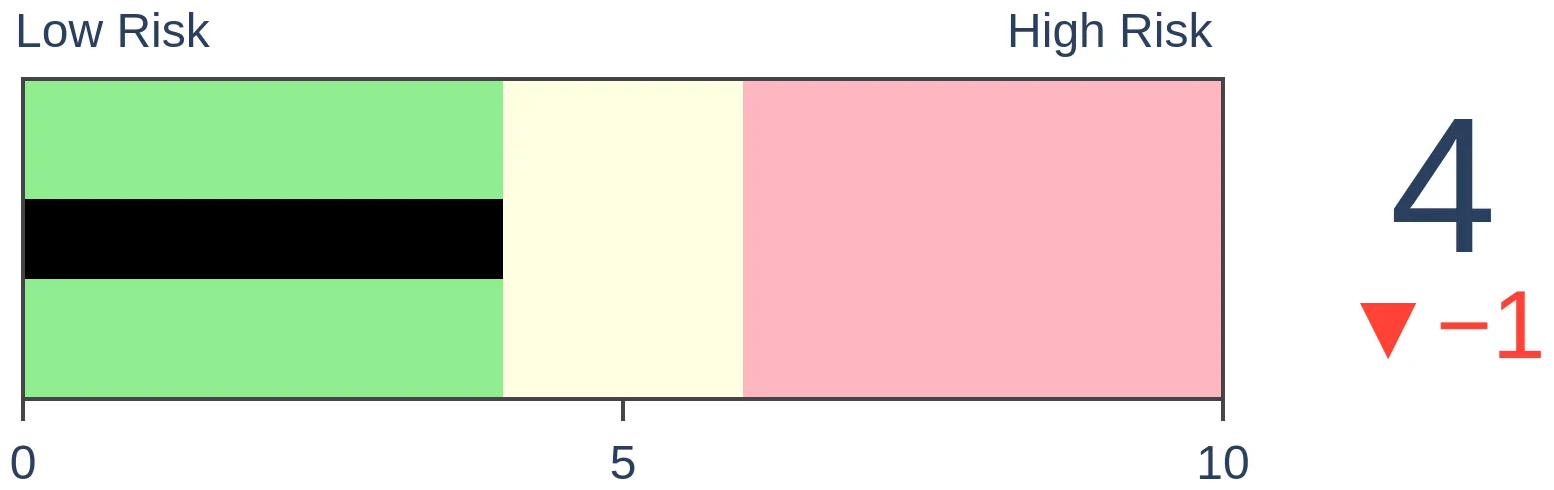
Stocks Short-Term

|
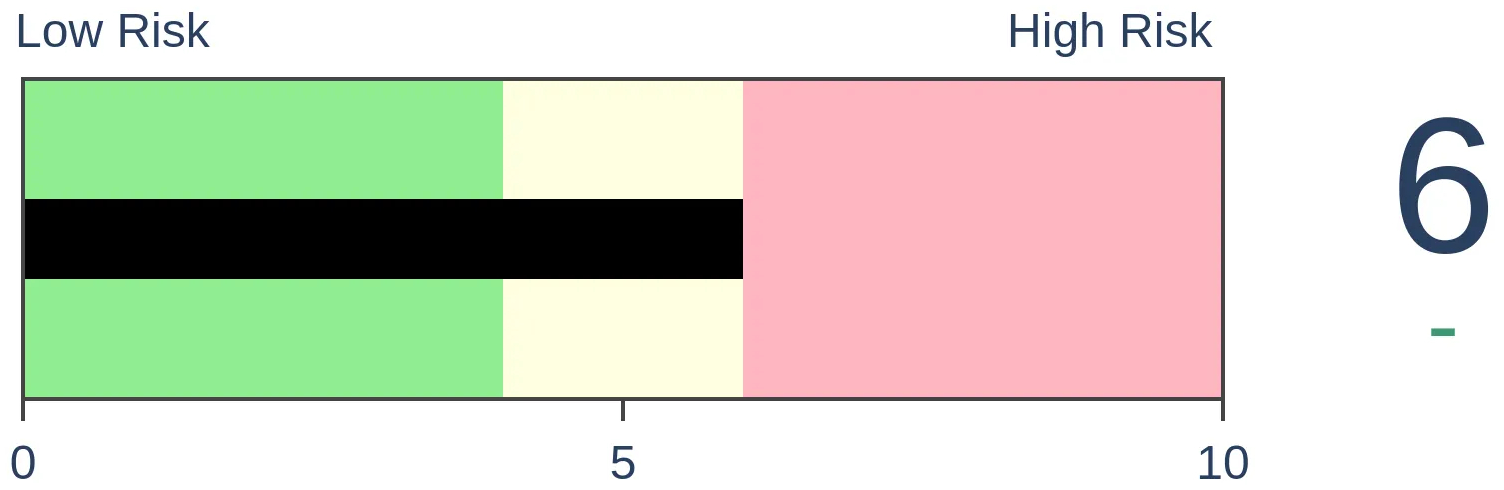
Stocks Medium-Term
|
|
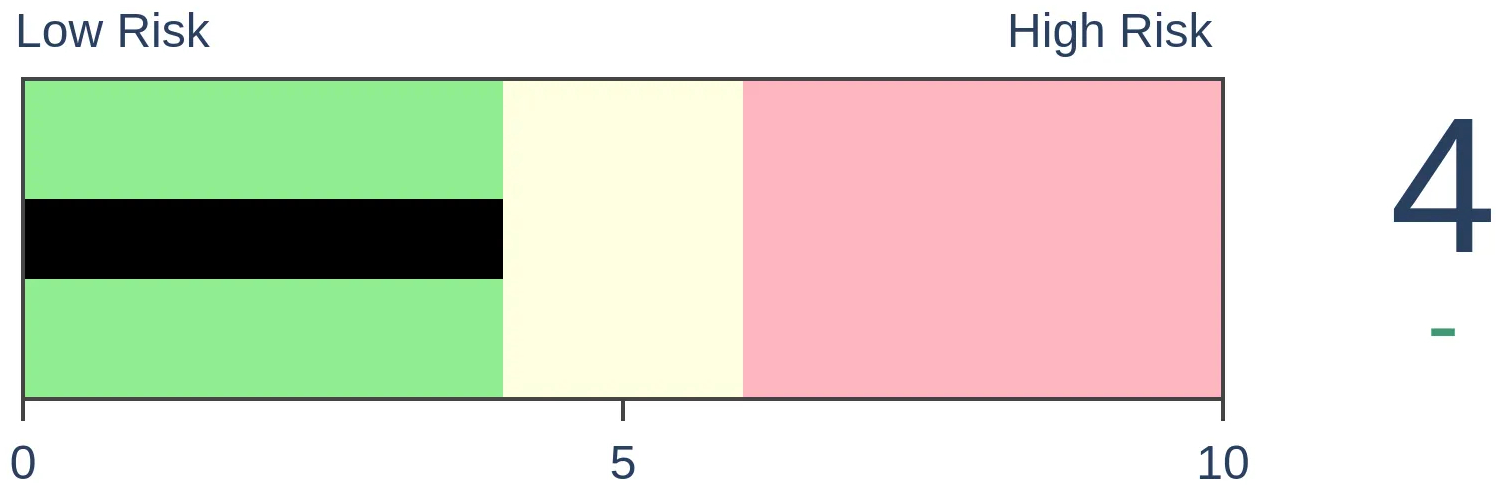
Bonds

|
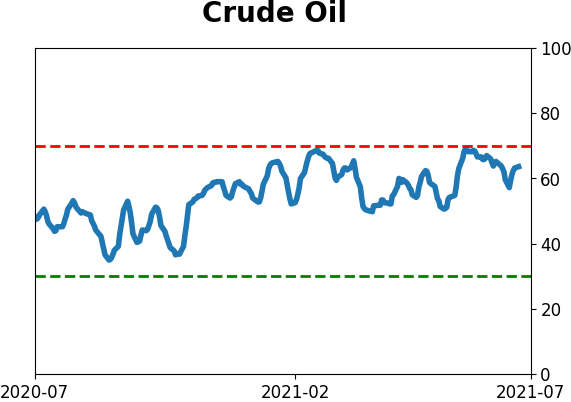
Crude Oil
|
|
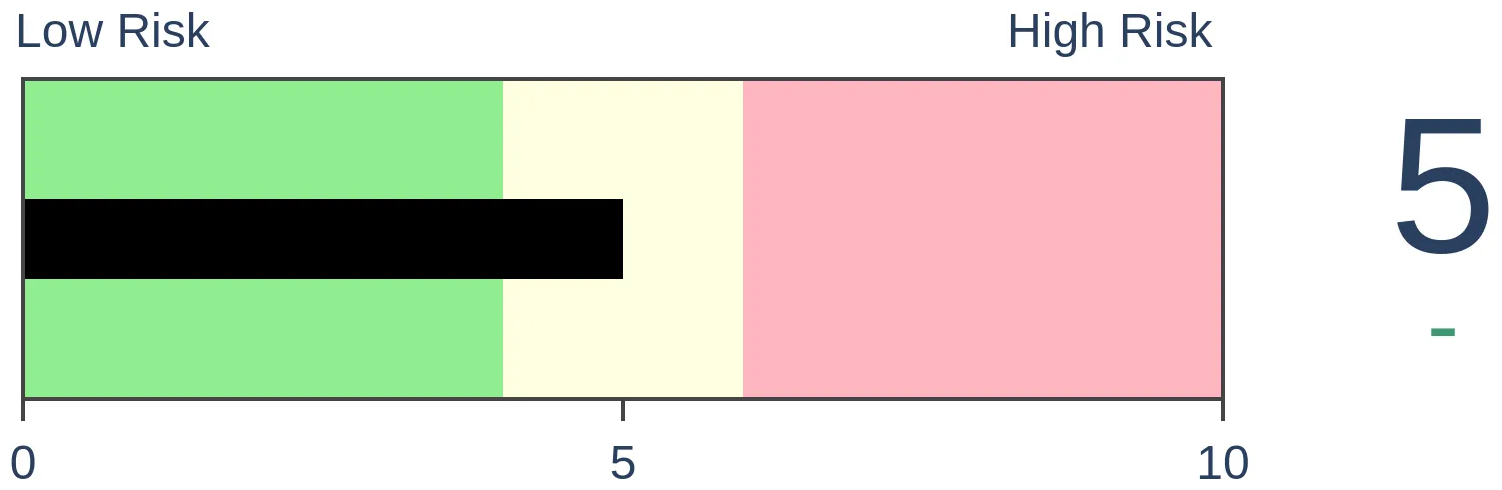
Gold
|
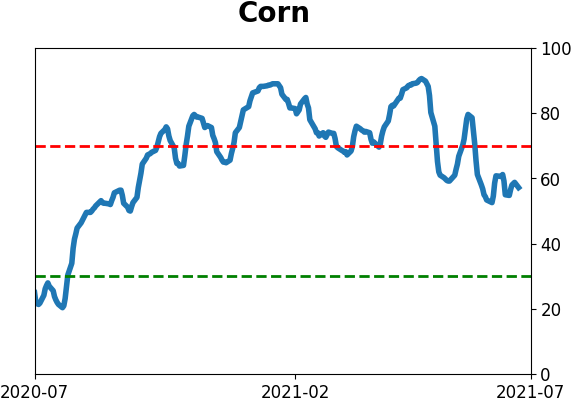
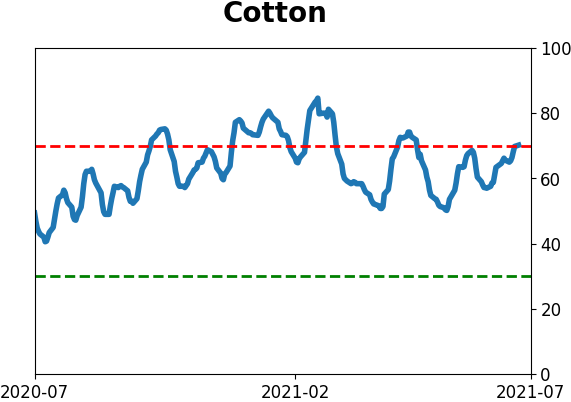
Agriculture
|
|
Research
BOTTOM LINE
Within a few days of major stock indexes sitting at record highs, there has been quite a bit of internal deterioration. The Nasdaq has sounded a Titanic Warning, and the Advance/Decline Lines are hitting multi-month lows, highlighting breadth divergences.
FORECAST / TIMEFRAME
SPY -- Down, Short-Term
|
For months now, and especially since the peak in speculative mania in February, we've watched closely for internal deterioration in the major indexes.
Those signs popped up sporadically, with a day or two of oddly poor breadth readings in the S&P 500 or broader market. But usually, within a couple of days, things would completely reverse and wipe away any divergences.
Not so much this time.
Last week, we saw that the remarkable momentum run in the S&P has come with fewer than 60% of its stocks holding above their 50-day moving averages. That's one of the starkest divergences, over a respectable time frame (not just a single session), since 1928.
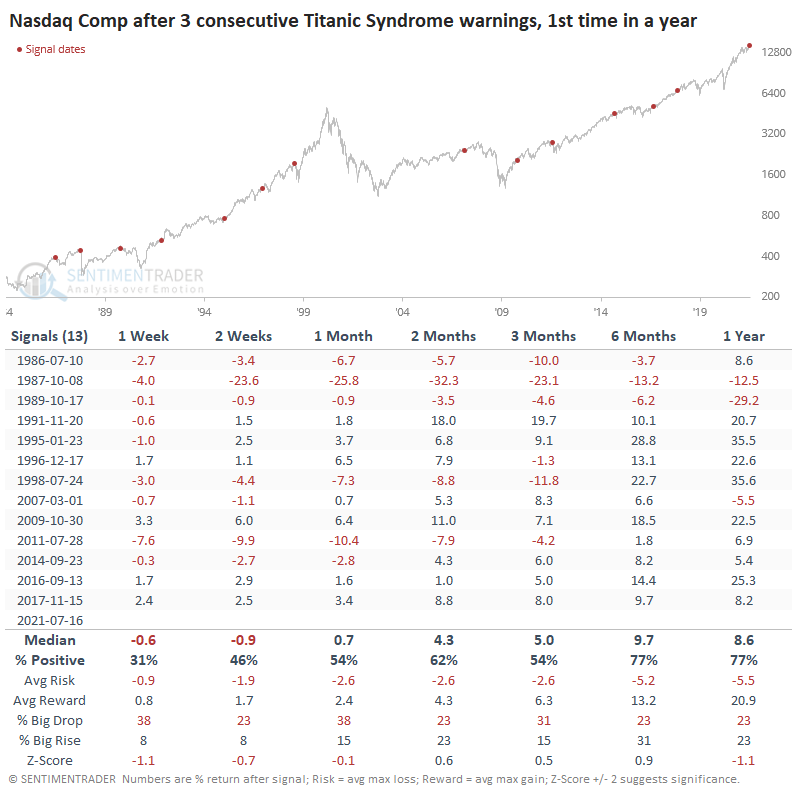
We've also noted that on the Nasdaq, we quickly switched from the Composite sitting at record highs to having more stocks at 52-week lows than 52-week highs. The past three sessions all triggered a Titanic Syndrome warning as a result.
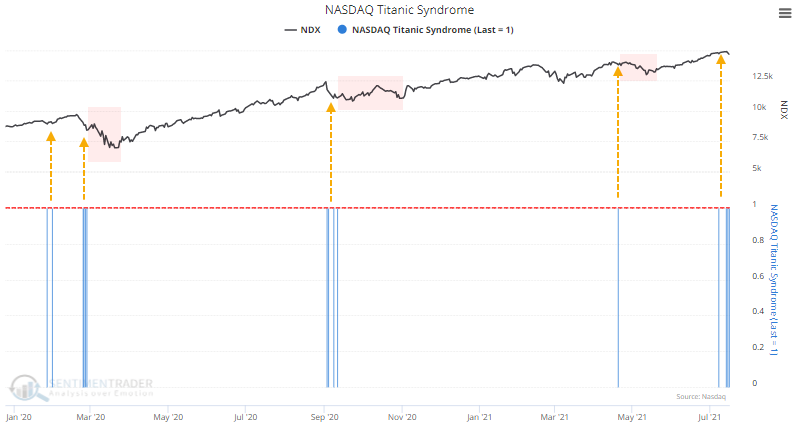
After other back-to-back-to-back warnings, the Nasdaq tended to continue sliding. Over the past few years, in particular, those warnings proved to be short-lived only.
FOLLOWING BREADTH LOWER
All of this internal weakness has bled into broader measures. The Cumulative Advance/Decline Line for the NYSE has now sunk to a multi-month low.
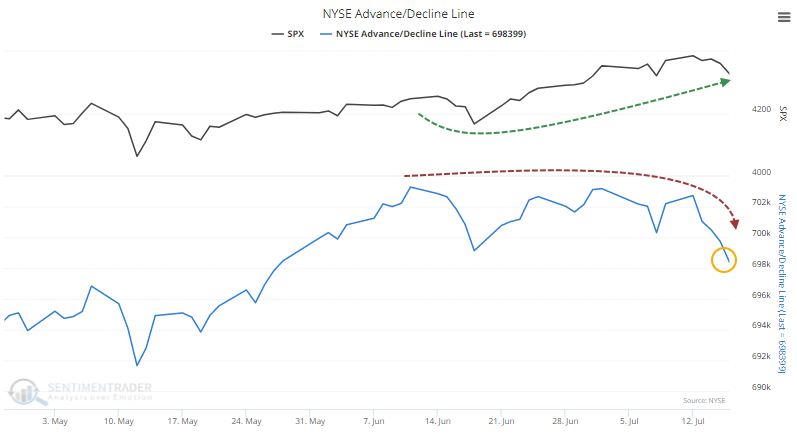
Since the A/D Line peaked on June 11, the S&P 500 has gone on to add more than 100 points and was perched at an all-time high within the past week. The A/D Line, in contrast, has sunk enough to be at its lowest point in two months.
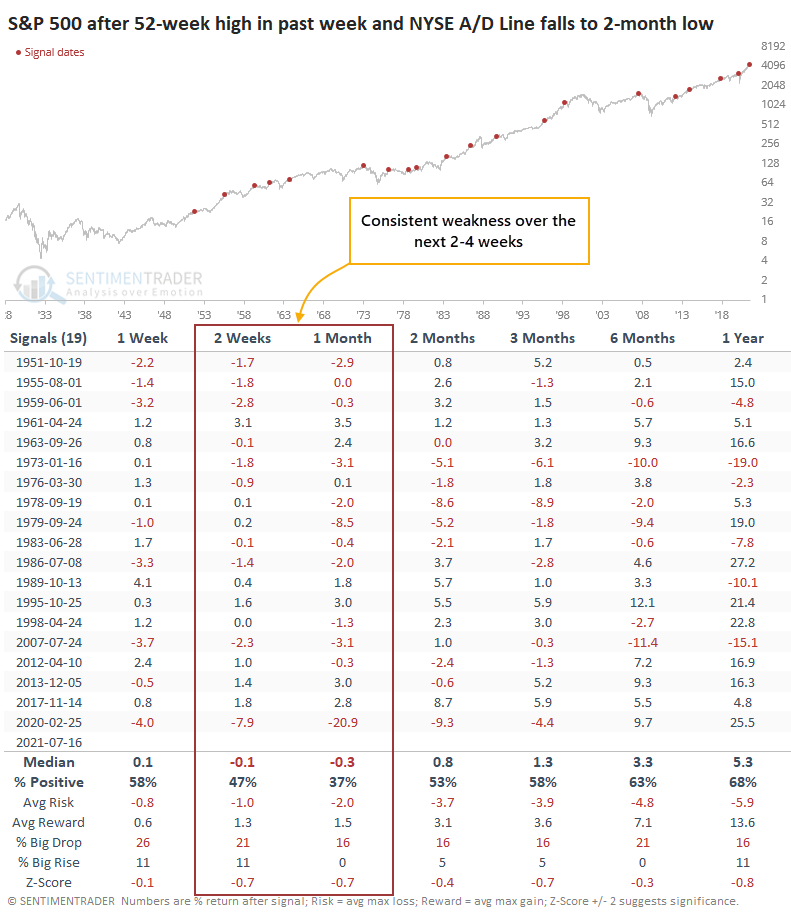
When this has triggered in the past, the S&P tended to follow the A/D Line lower, with a positive return over the next month only 37% of the time. It showed more risk than reward up to three months later and showed below-random returns across all time frames.
WEAKNESS ON BOTH NYSE AND NASDAQ
This same phenomenon is playing out on the Nasdaq. Over the past 40 years, there have only been three other times when this triggered on both the NYSE and Nasdaq within days of each other.
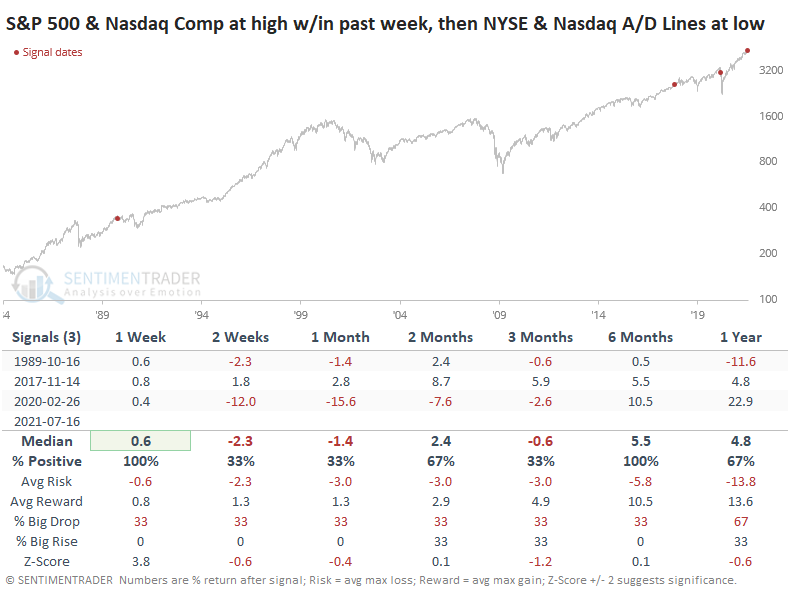
These three preceded the 1990 recession, the 2018 letdown from a speculative peak, and the global pandemic.
The Advance/Decline LIne is heavily influenced by small-cap stocks, interest-rate influenced issues, and other more esoteric securities on the NYSE. And for the past 20 years, we've said, "Good!" Those issues are sensitive to economic conditions and make the A/D Line a better indicator than the one that monitors common stocks only.
The divergences that are evident now aren't too major and haven't persisted for a very long time. That suggests they're less likely to be indicating a major, prolonged slump. The impressive price momentum in the S&P 500 through June is another longer-term positive. As we head into a seasonally rocky period, though, these divergences are enough to suggest that risk is high for short- to medium-term traders.
Active Studies
| Time Frame | Bullish | Bearish | | Short-Term | 0 | 2 | | Medium-Term | 2 | 3 | | Long-Term | 9 | 5 |
|
Indicators at Extremes
Portfolio
| Position | Description | Weight % | Added / Reduced | Date | | Stocks | RSP | 4.1 | Added 4.1% | 2021-05-19 | | Bonds | 23.9% BND, 6.9% SCHP | 30.7 | Reduced 7.1% | 2021-05-19 | | Commodities | GCC | 2.6 | Reduced 2.1%
| 2020-09-04 | | Precious Metals | GDX | 5.6 | Reduced 4.2% | 2021-05-19 | | Special Situations | 4.3% XLE, 2.2% PSCE | 7.6 | Reduced 5.6% | 2021-04-22 | | Cash | | 49.4 | | |
|
Updates (Changes made today are underlined)
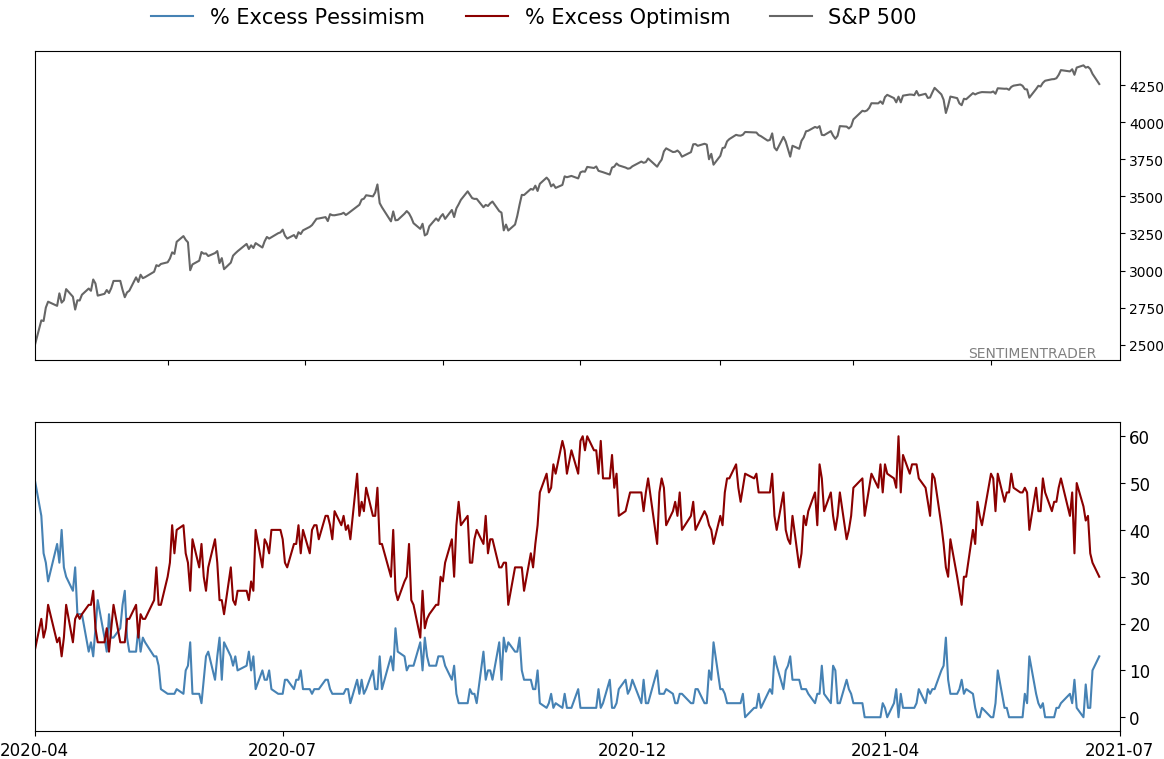
Much of our momentum and trend work has remained positive for several months, with some scattered exceptions. Almost all sentiment-related work has shown a poor risk/reward ratio for stocks, especially as speculation drove to record highs in exuberance in February. Much of that has worn off, and most of our models are back toward neutral levels. There isn't much to be excited about here. The same goes for bonds and even gold. Gold has been performing well lately and is back above long-term trend lines. The issue is that it has a poor record of holding onto gains when attempting a long-term trend change like this, so we'll take a wait-and-see approach. RETURN YTD: 9.1% 2020: 8.1%, 2019: 12.6%, 2018: 0.6%, 2017: 3.8%, 2016: 17.1%, 2015: 9.2%, 2014: 14.5%, 2013: 2.2%, 2012: 10.8%, 2011: 16.5%, 2010: 15.3%, 2009: 23.9%, 2008: 16.2%, 2007: 7.8%
|
|
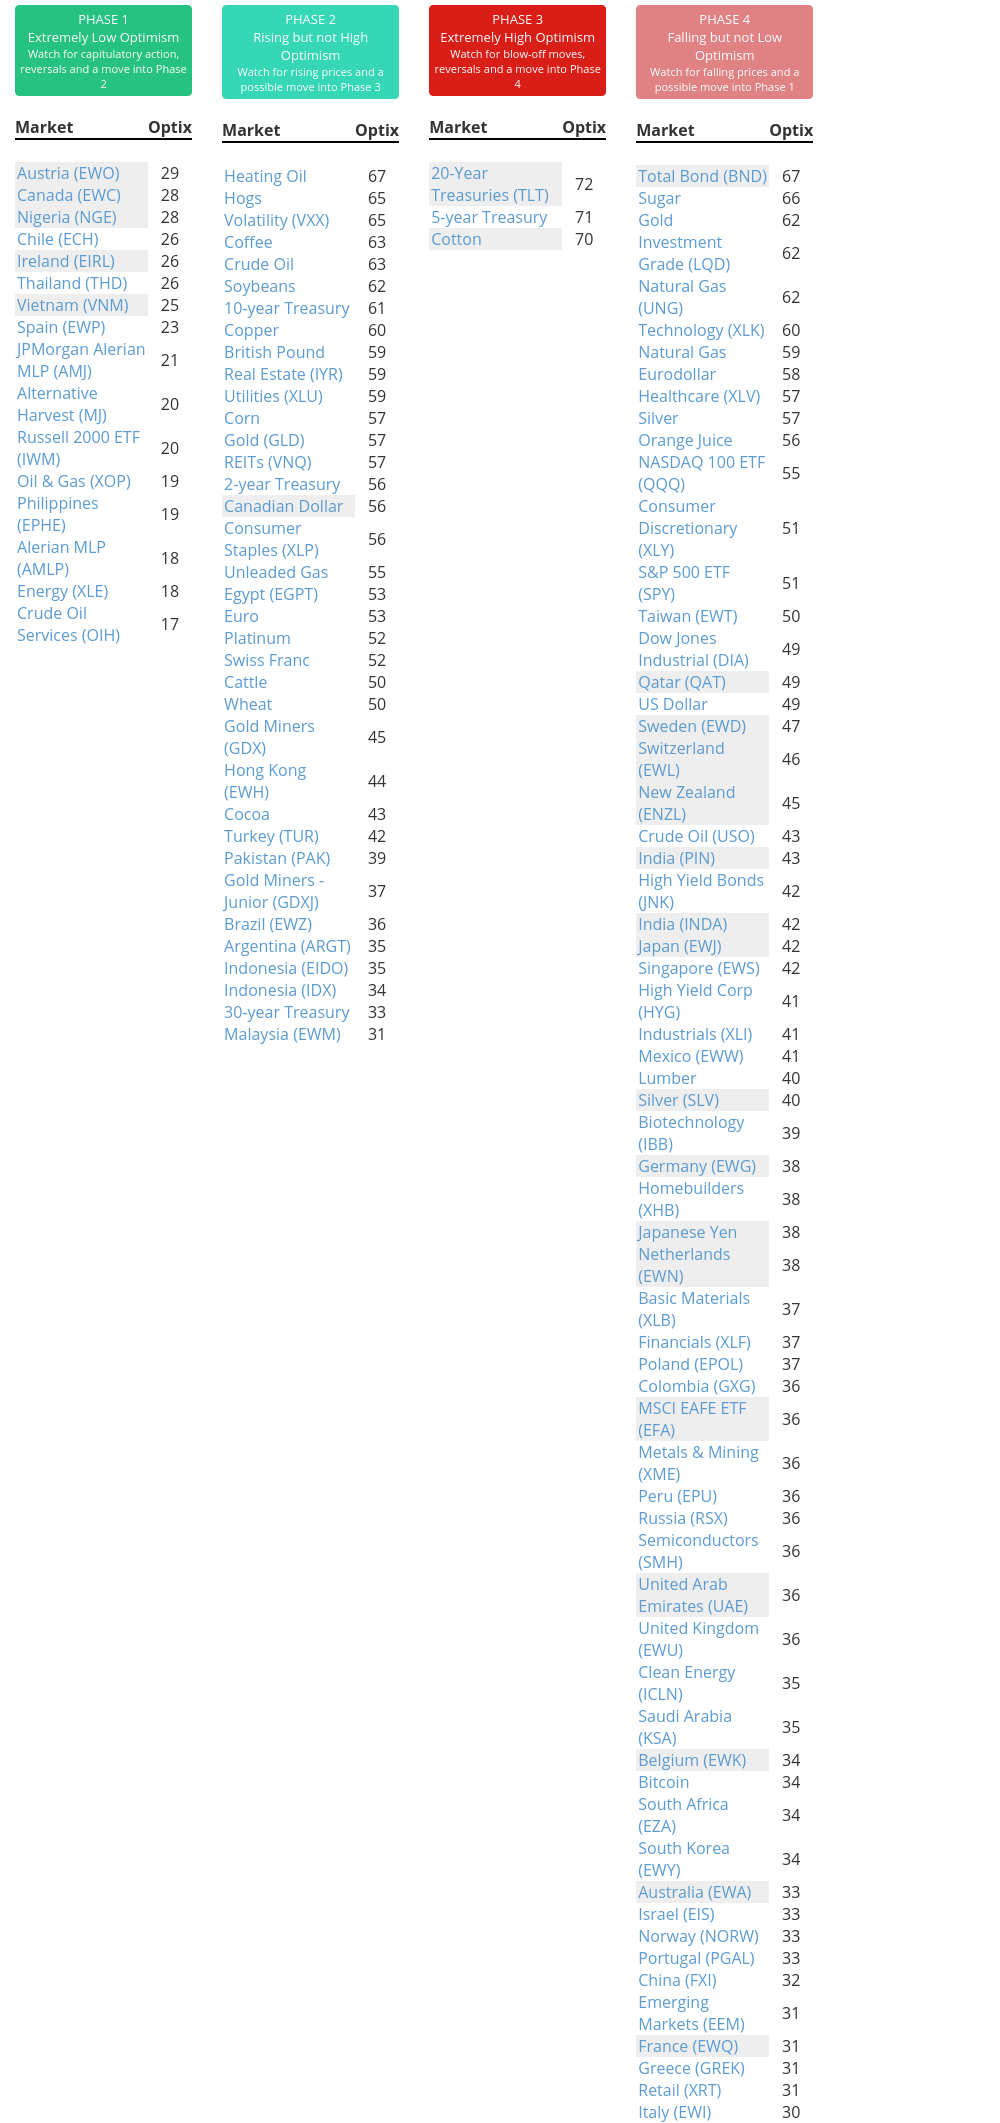
Phase Table
Ranks
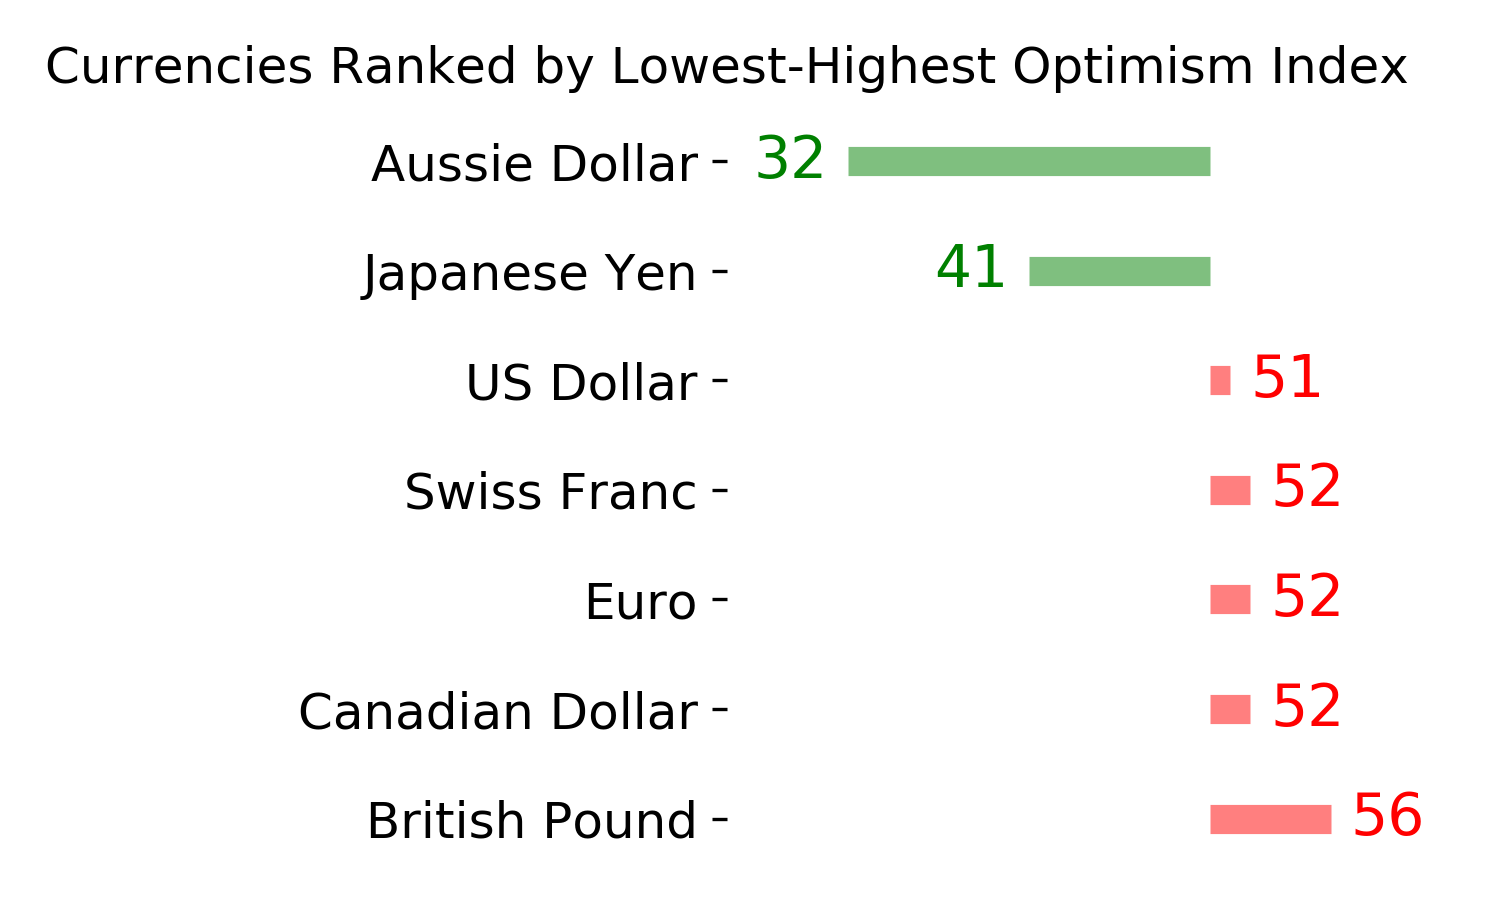
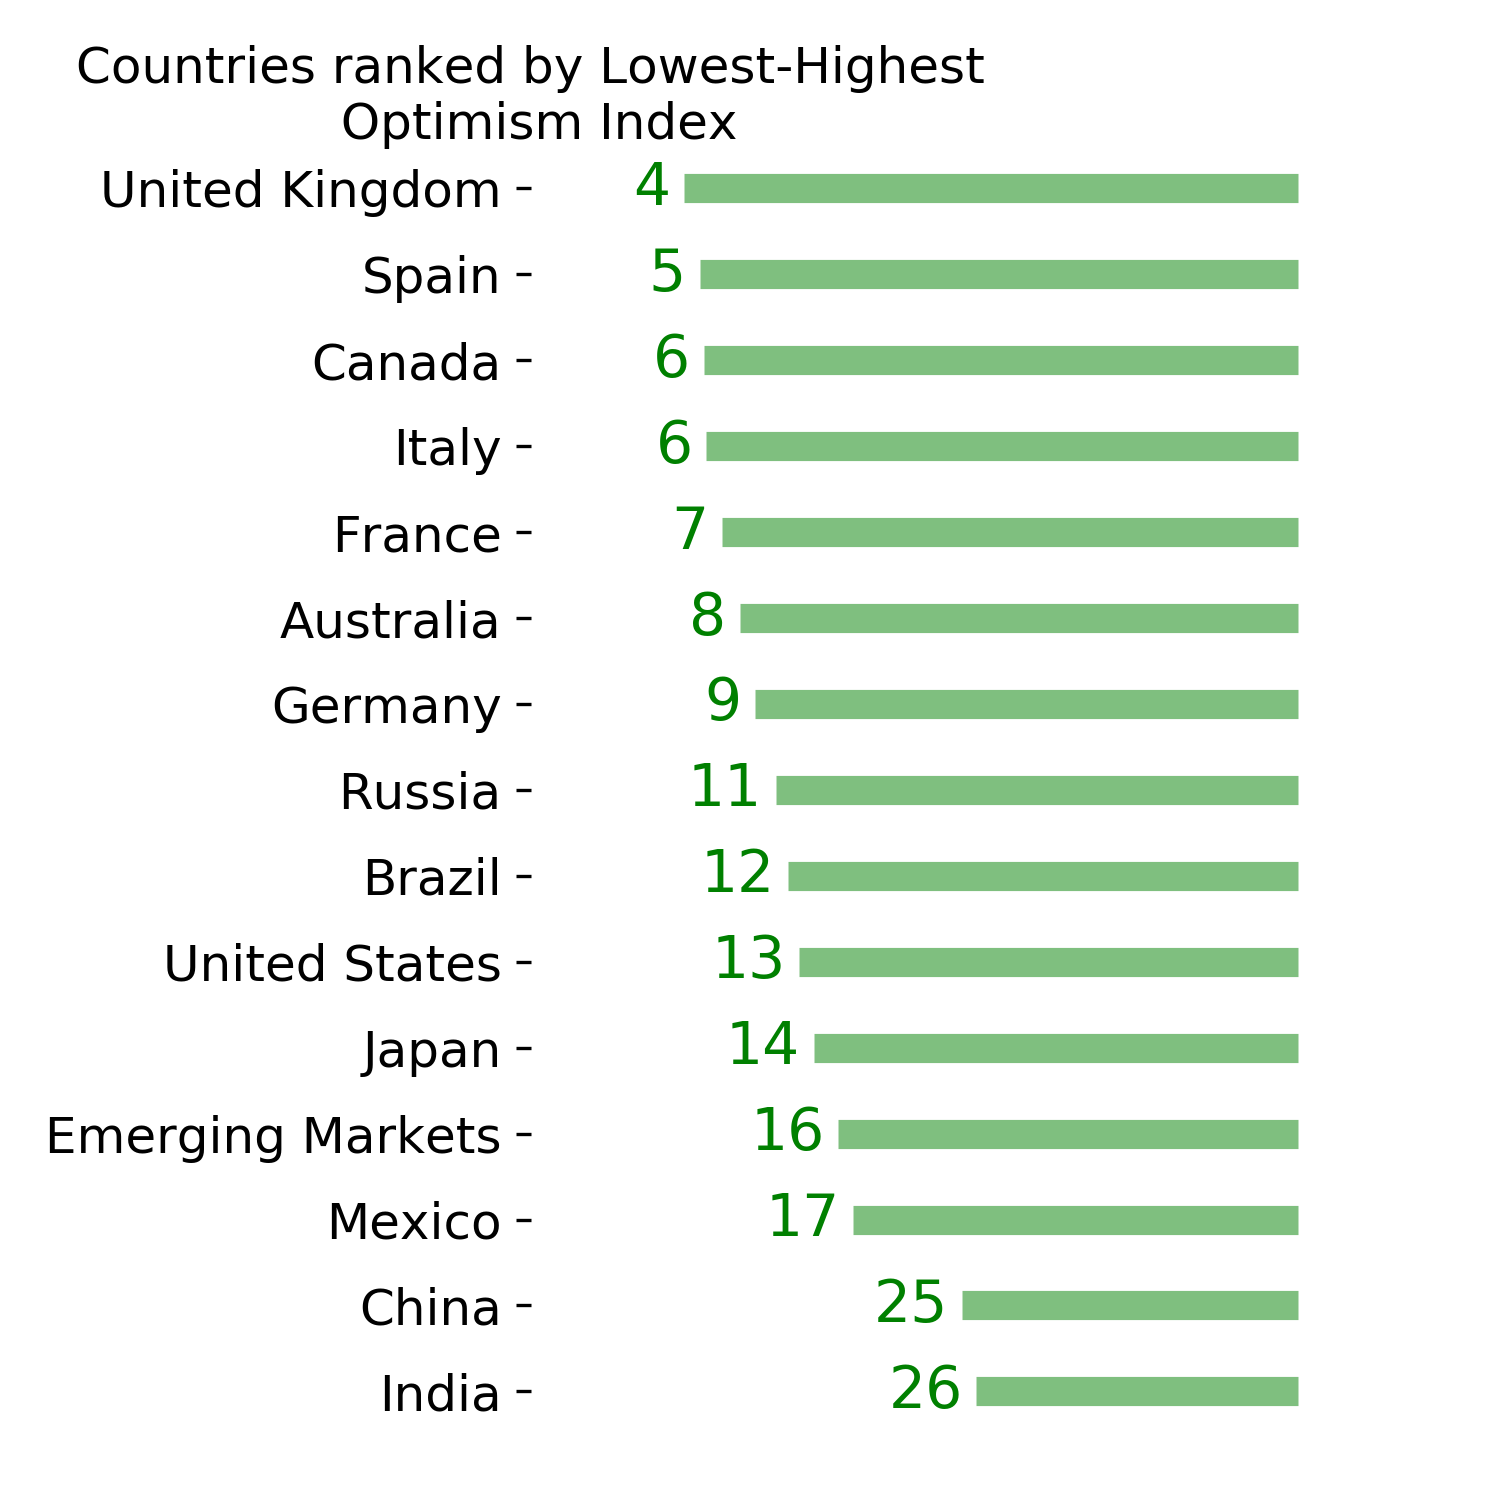
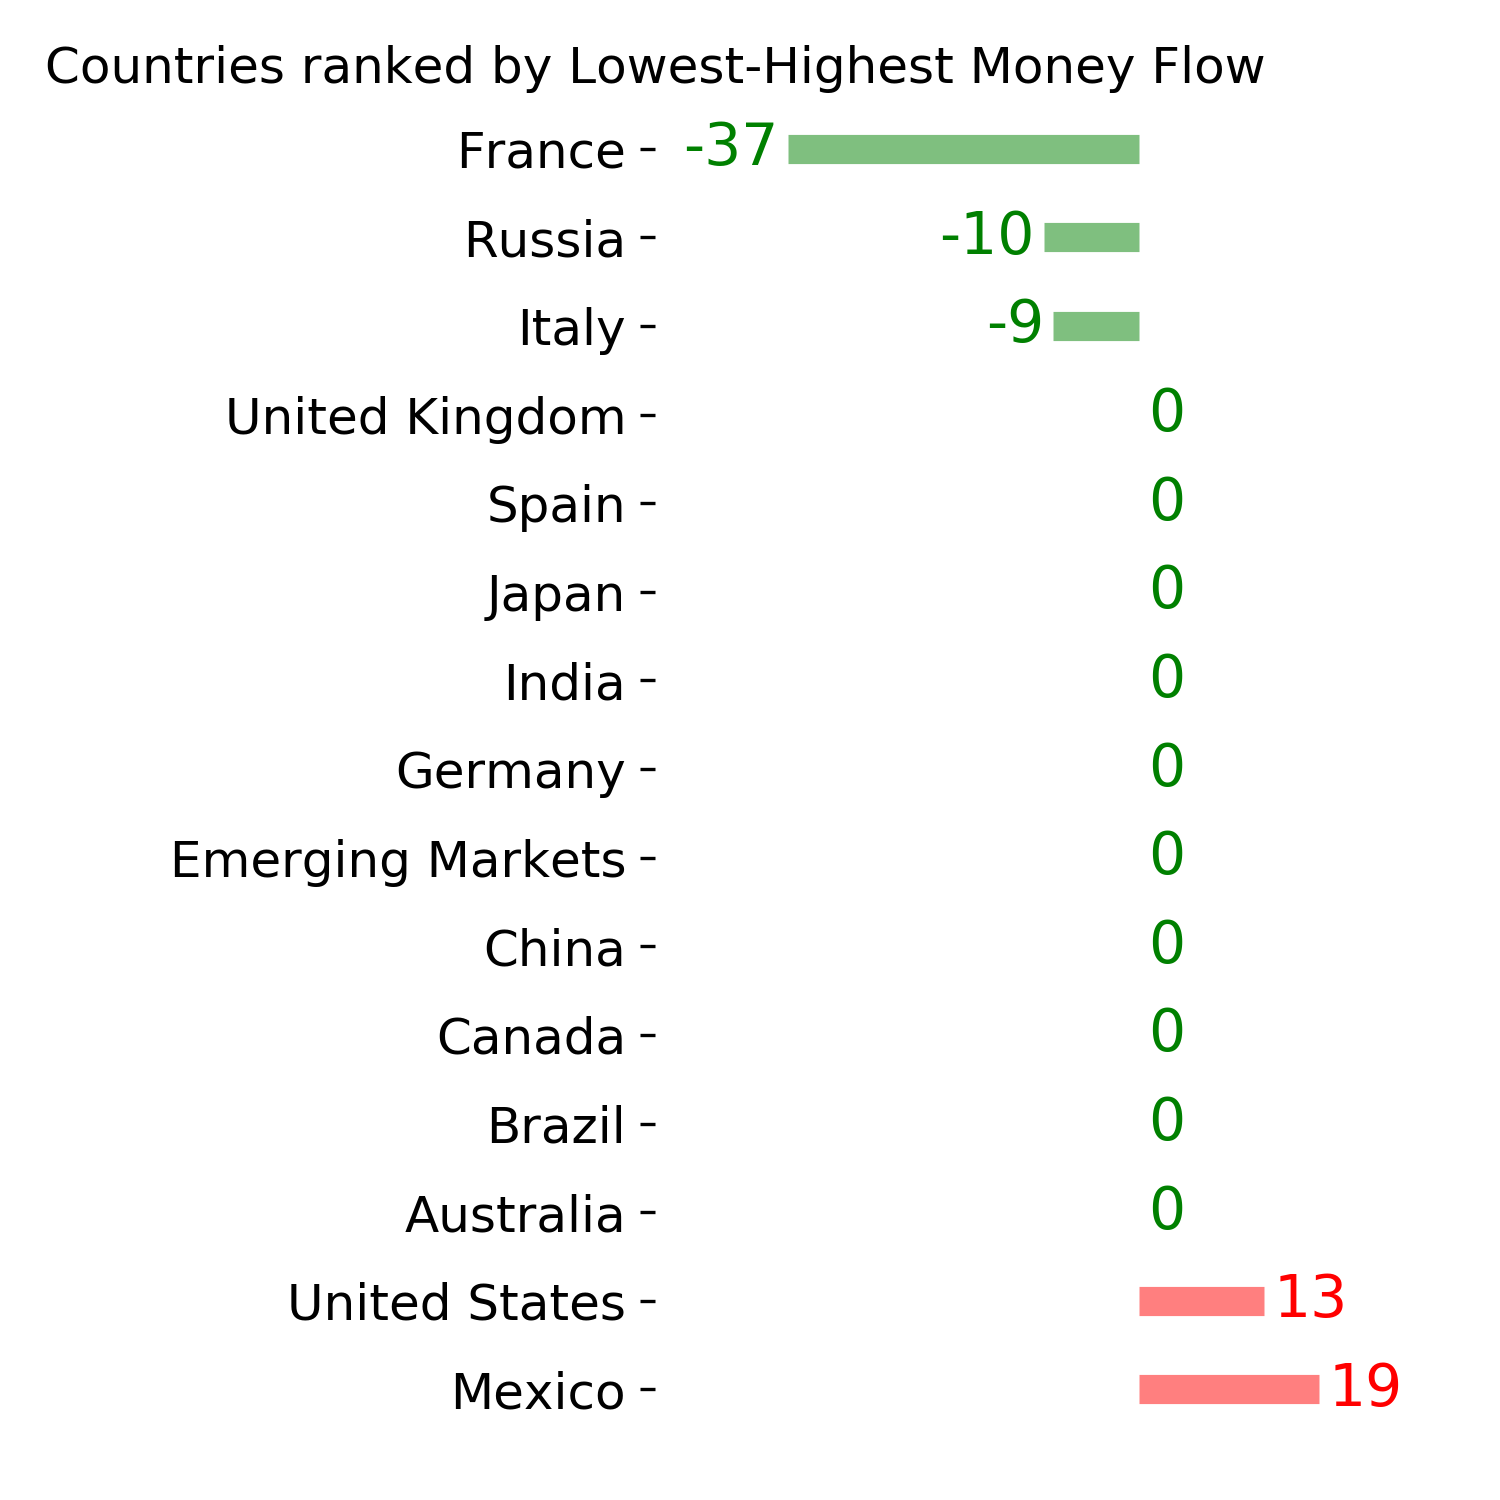
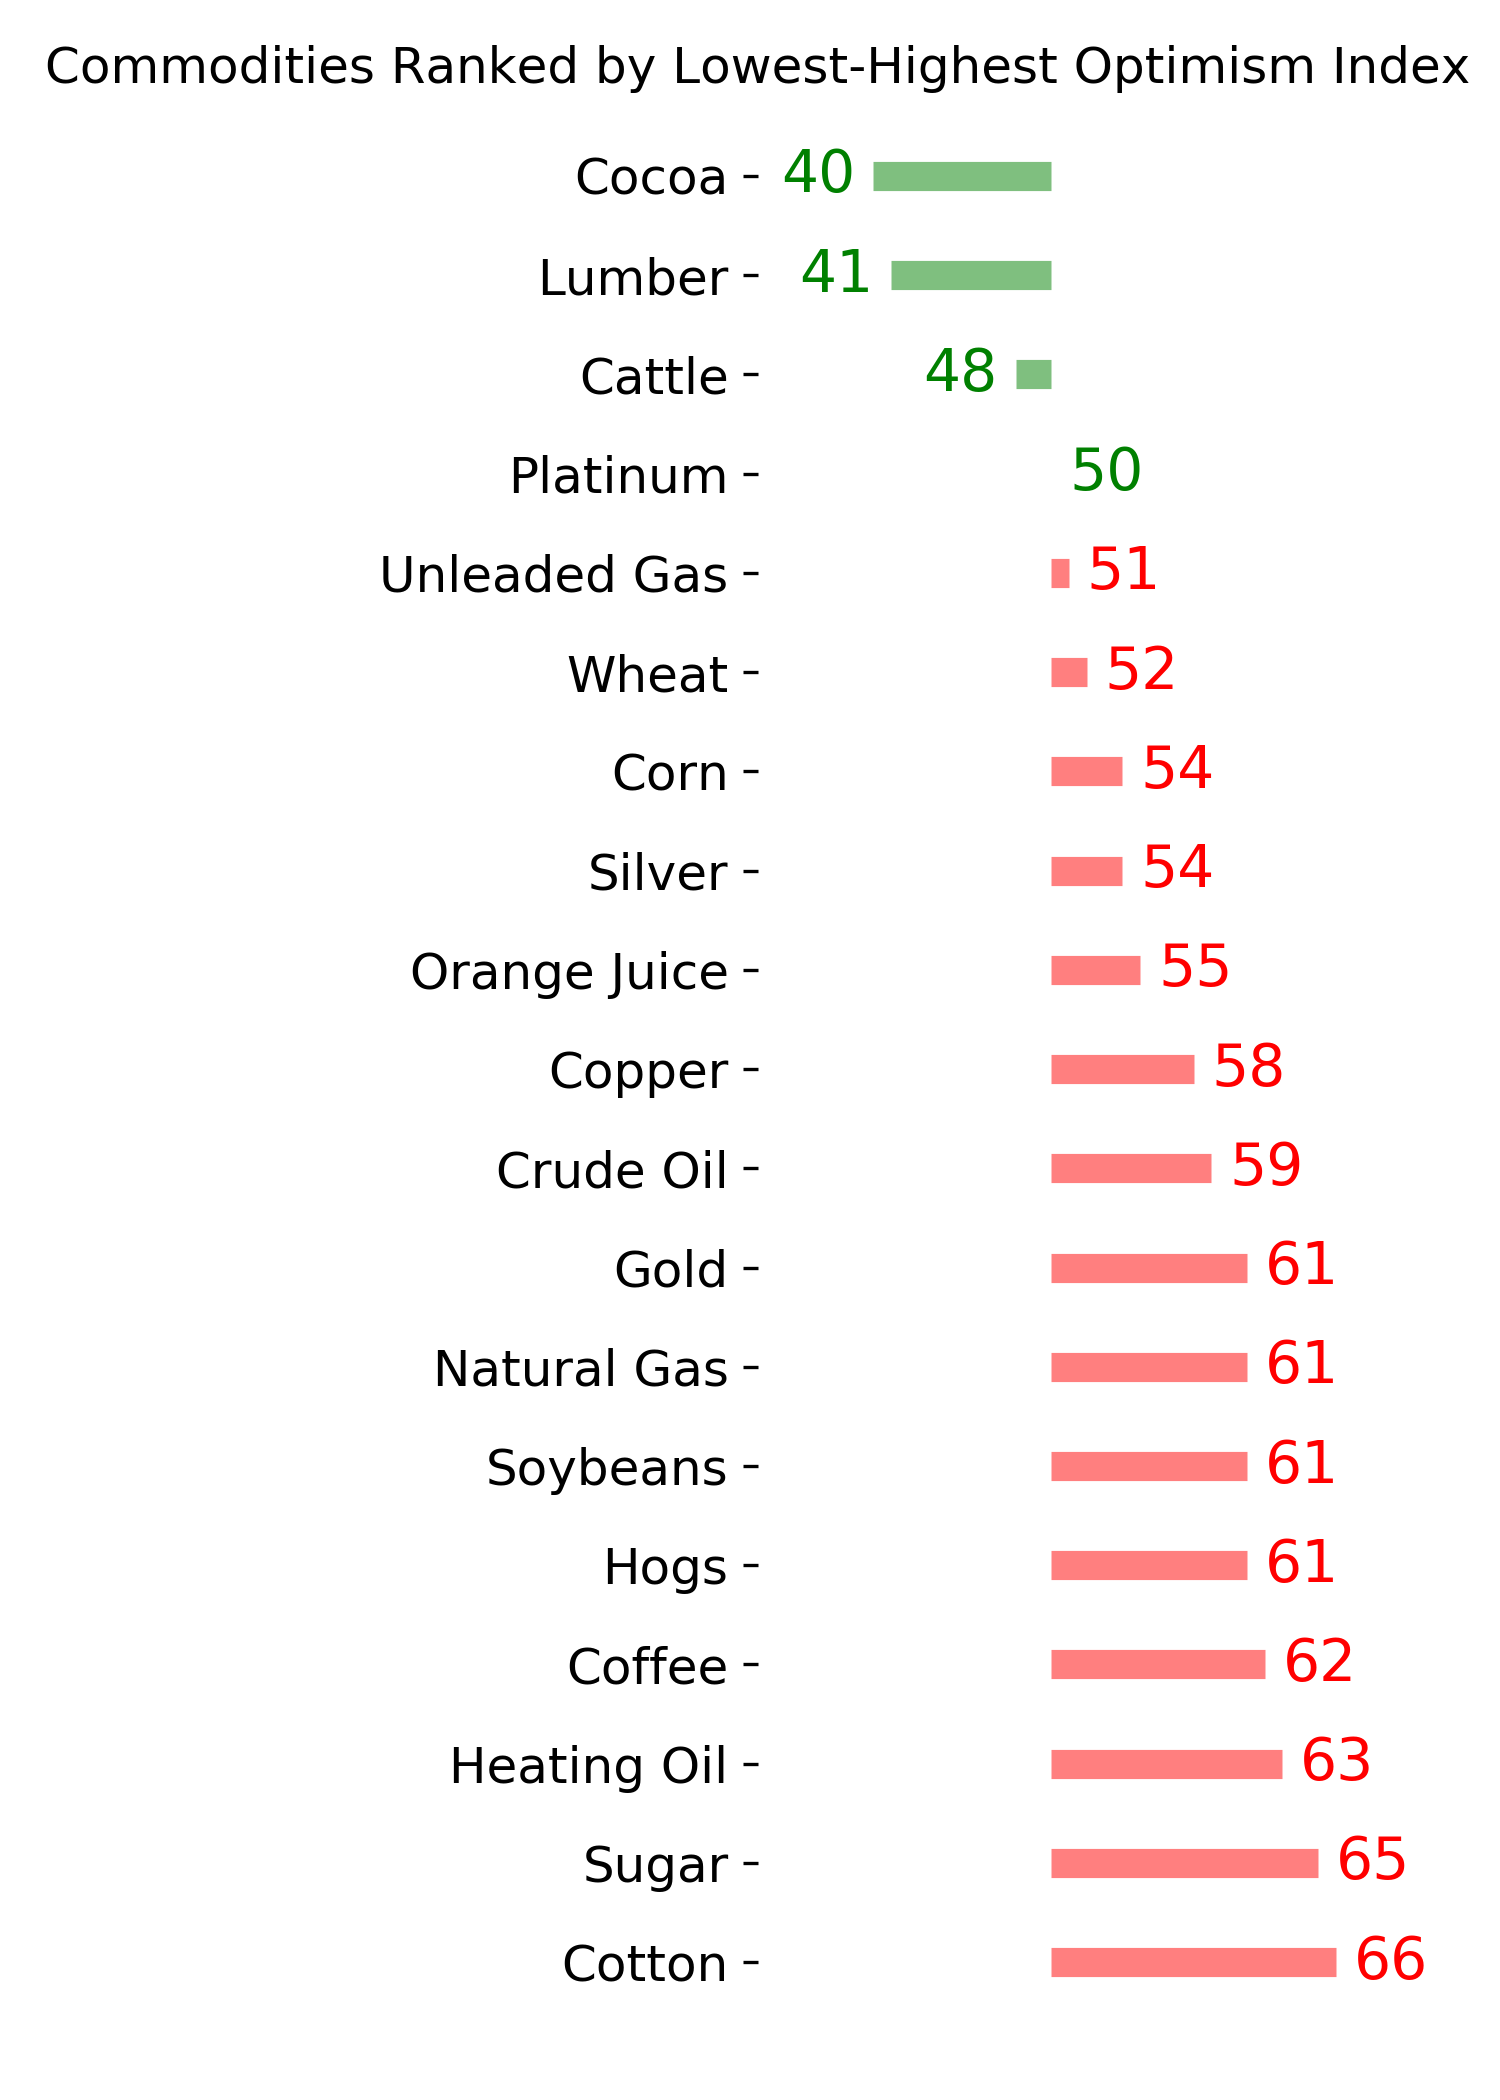
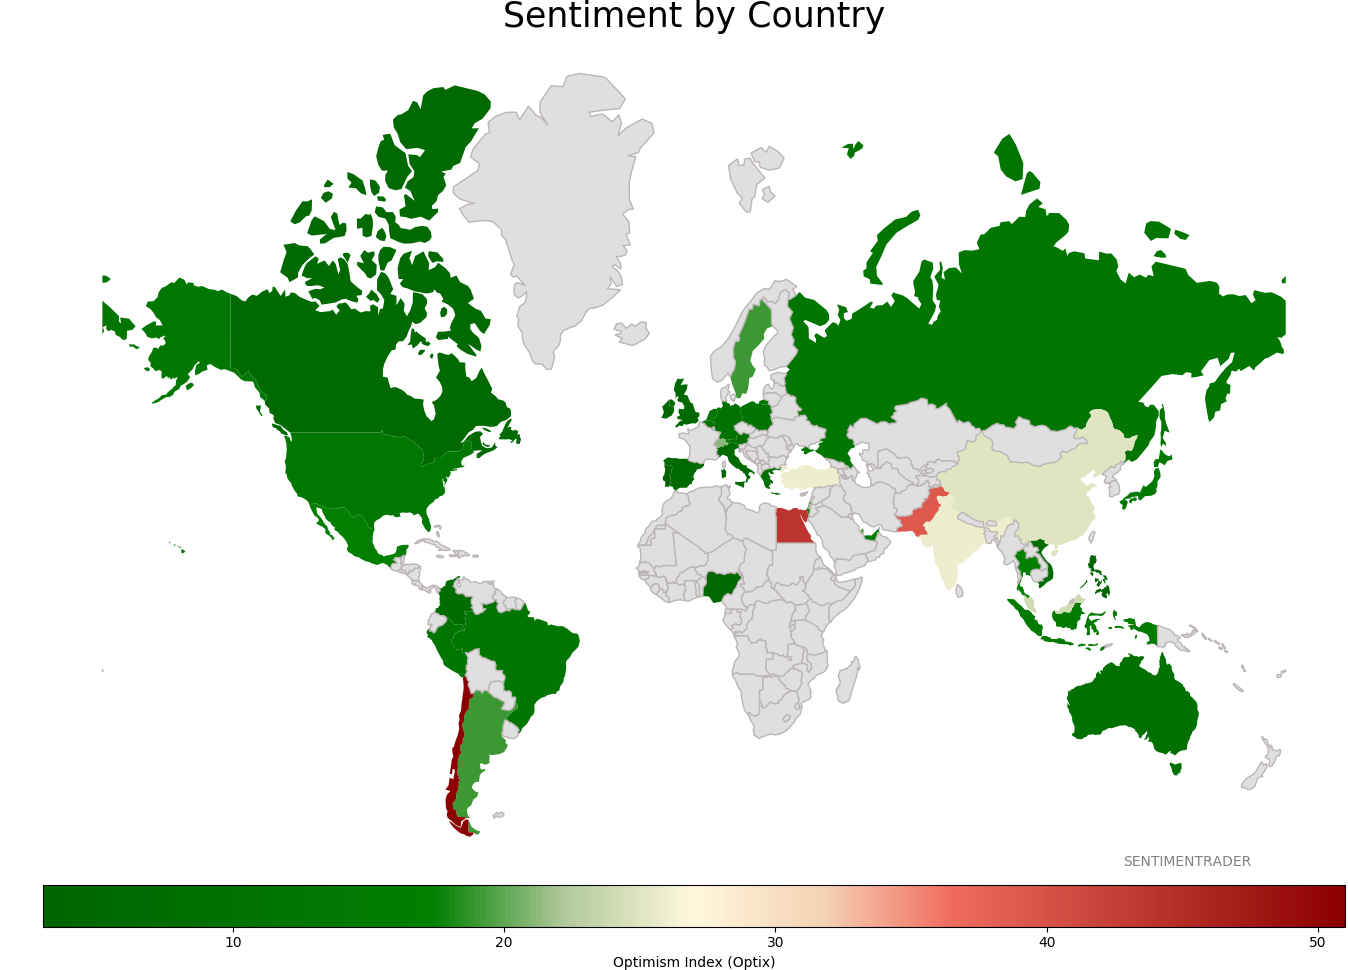
Sentiment Around The World
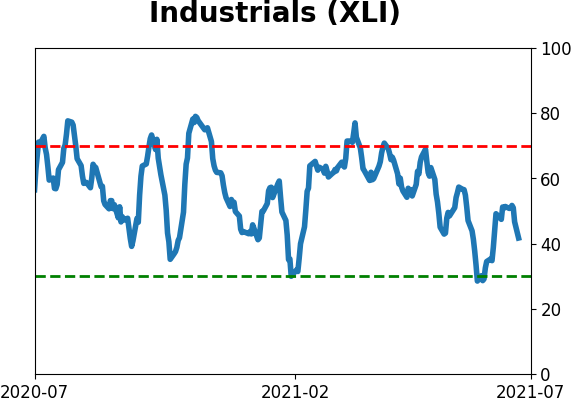
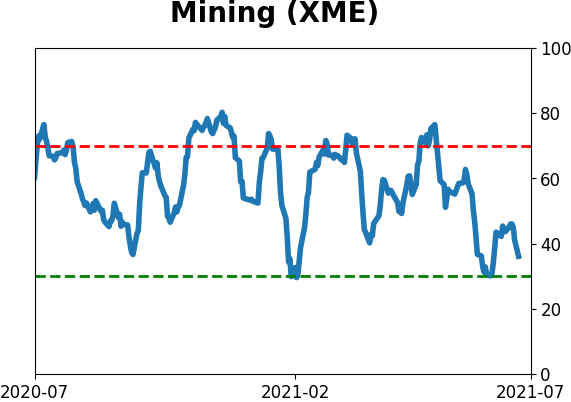
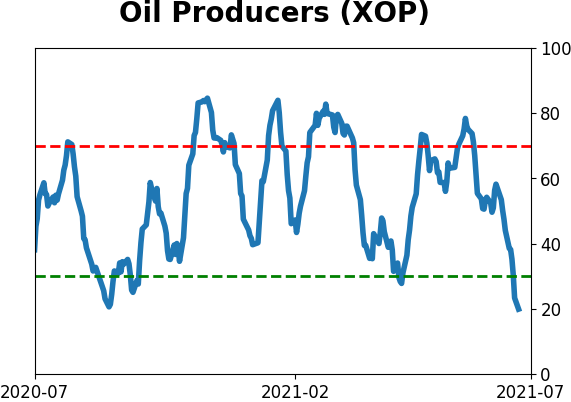
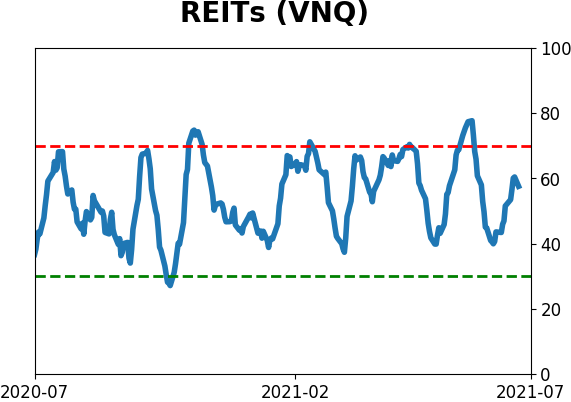
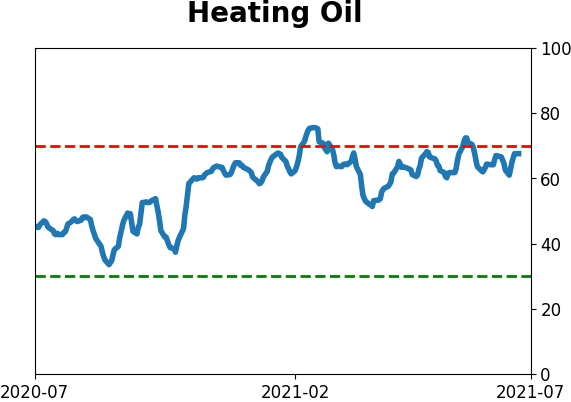
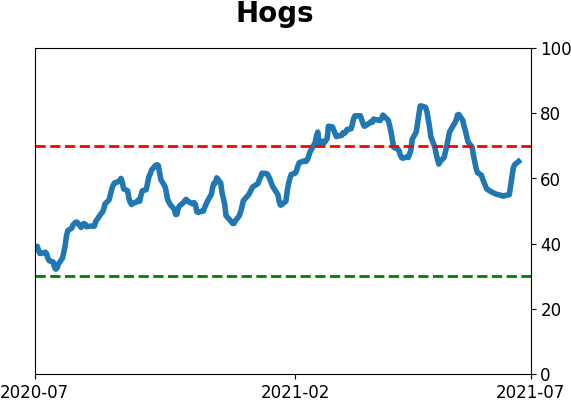
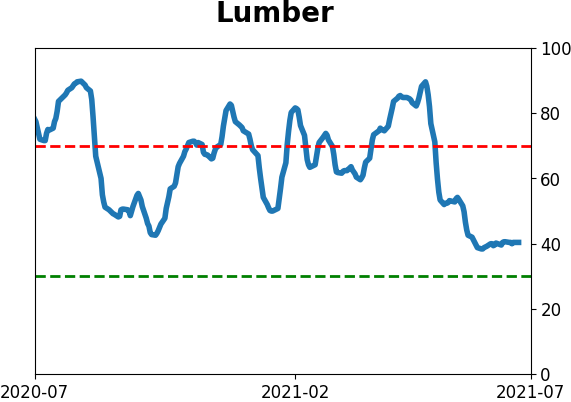
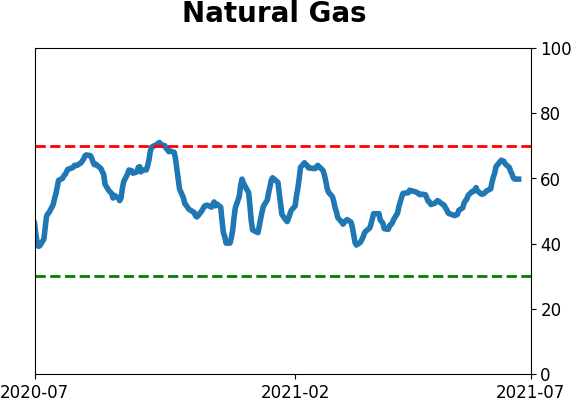
Optimism Index Thumbnails
|
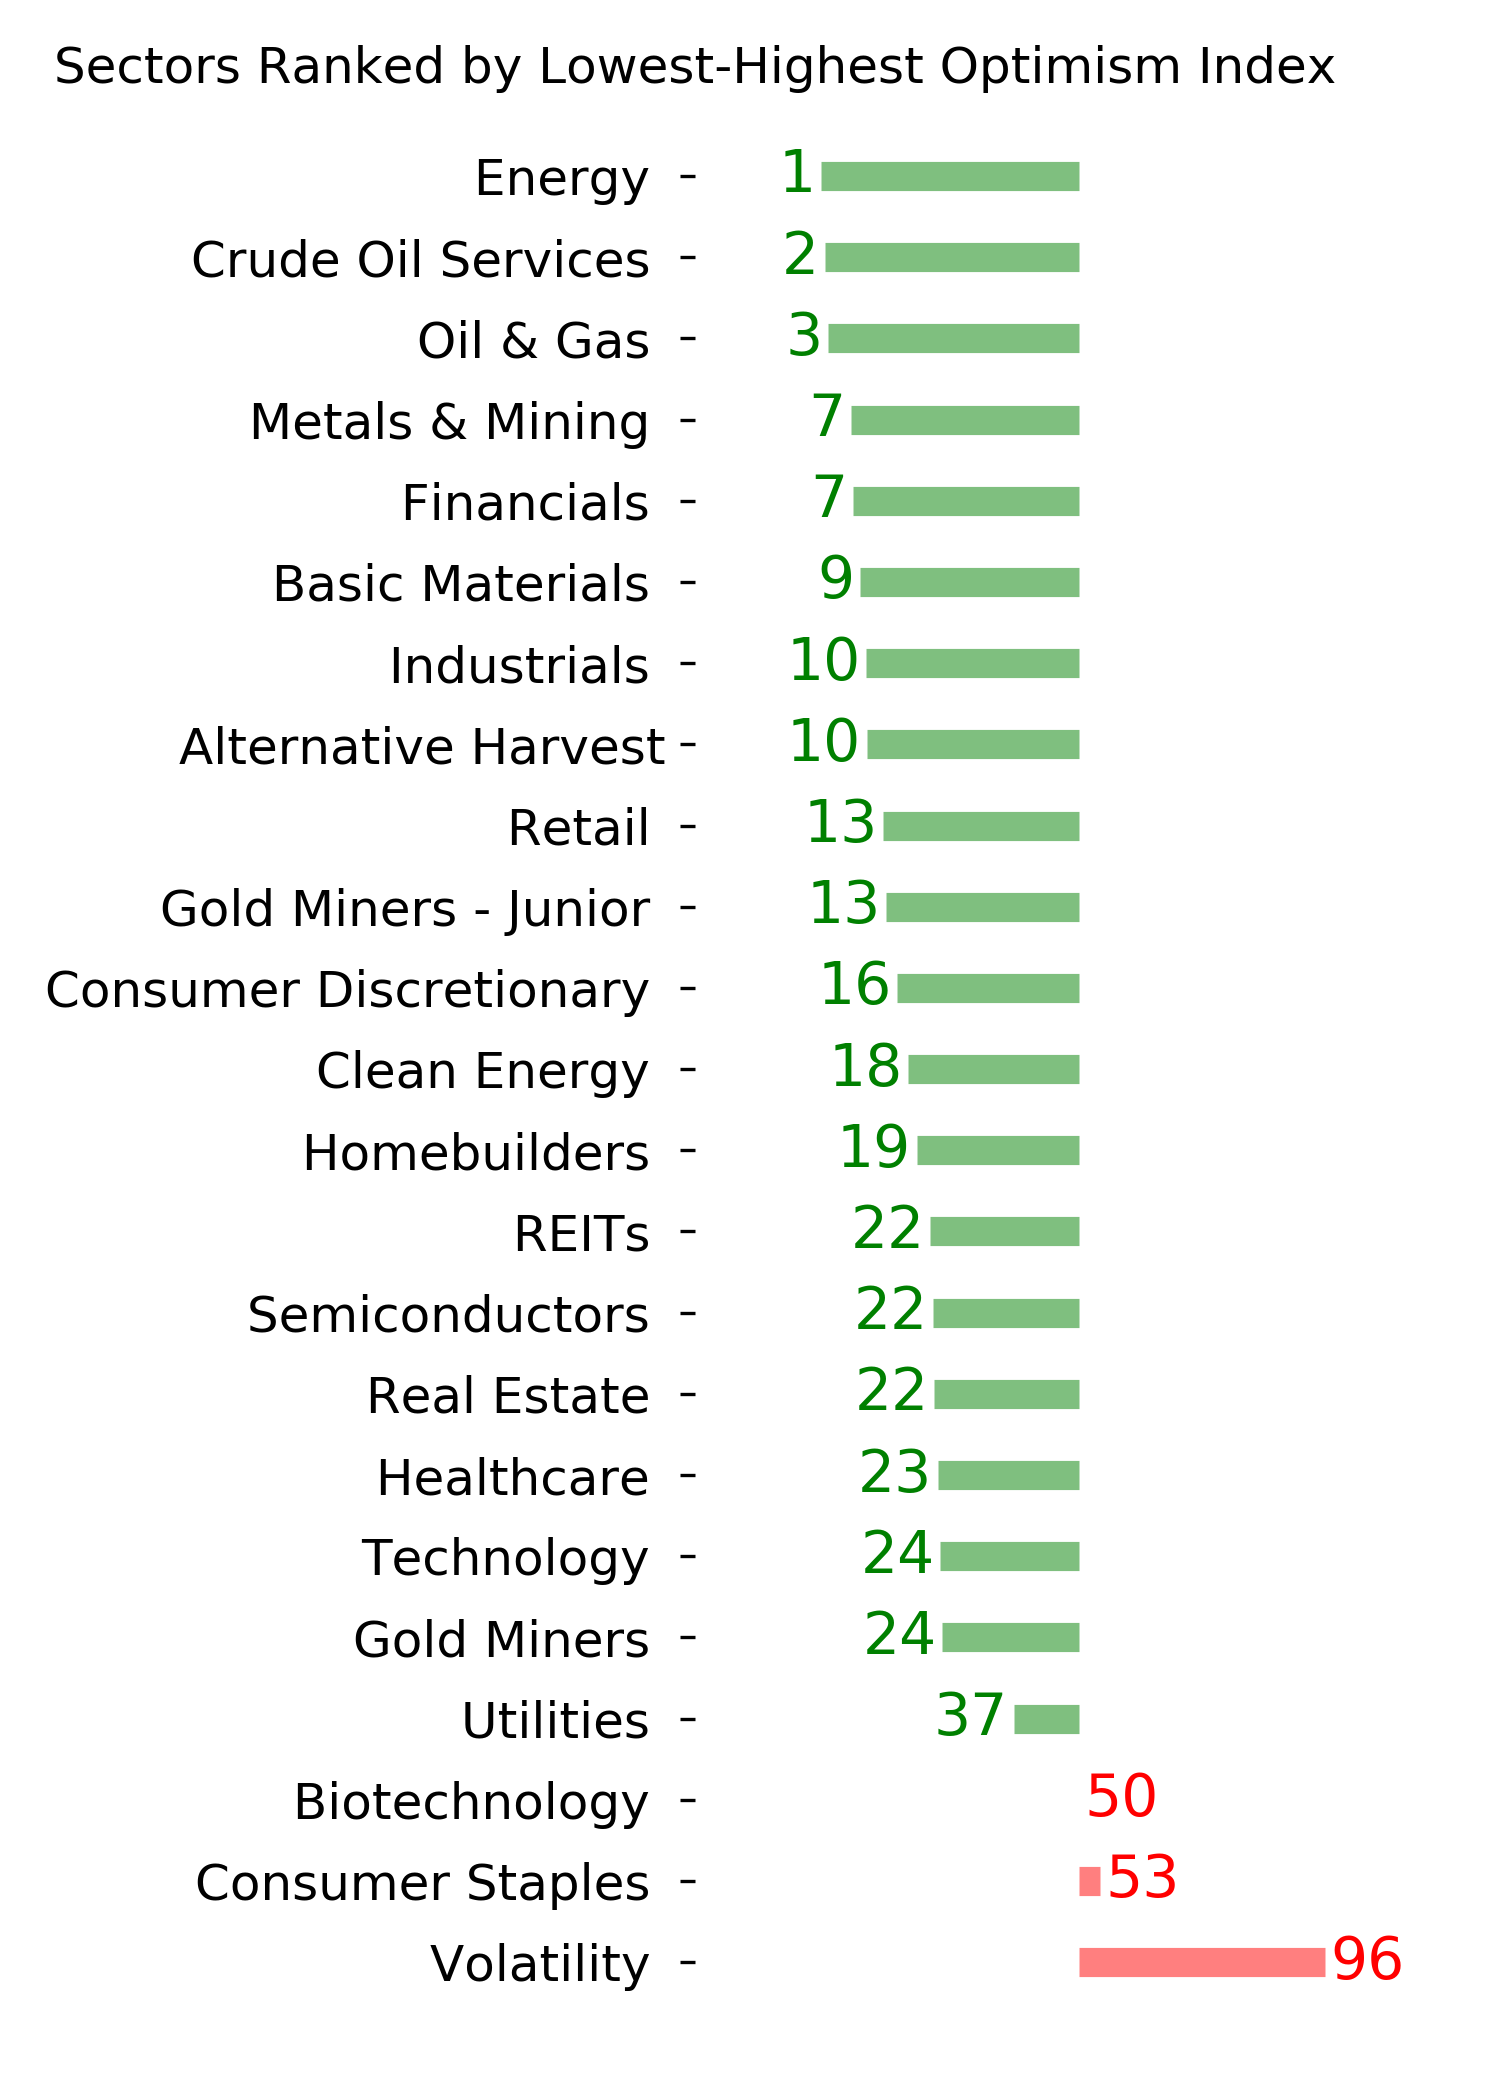
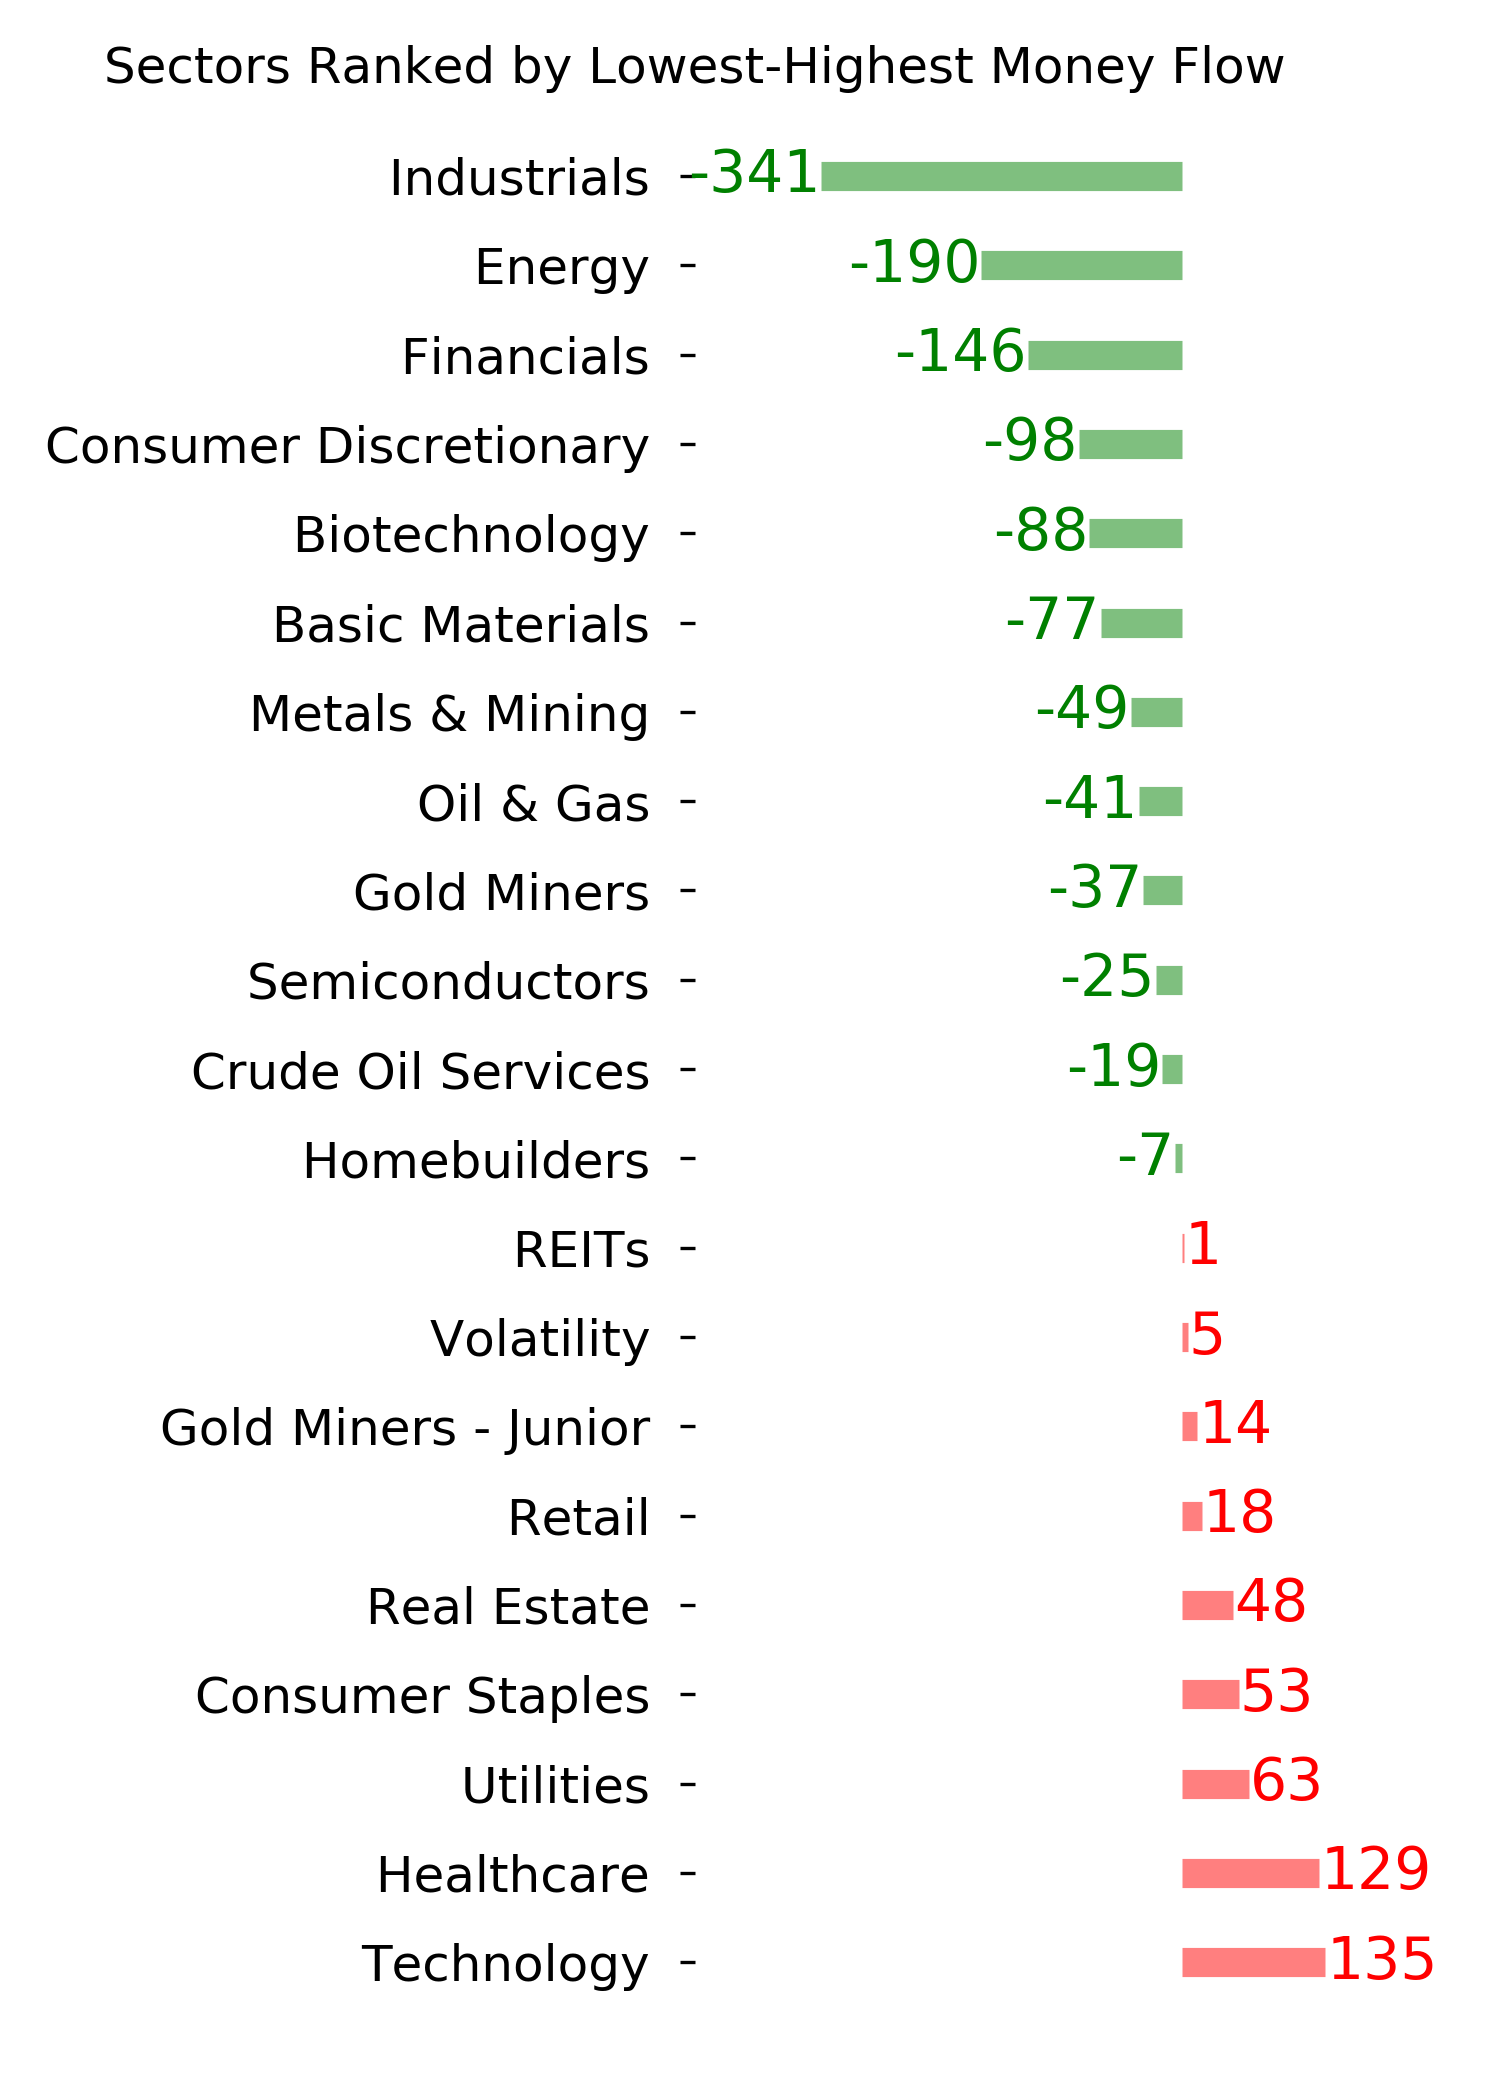
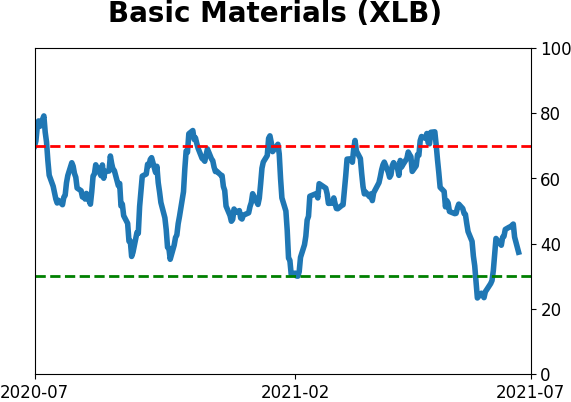
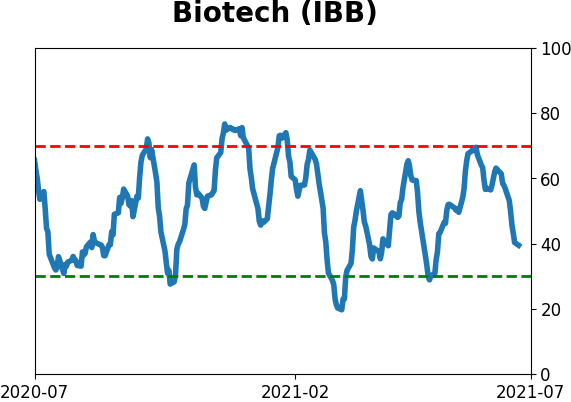
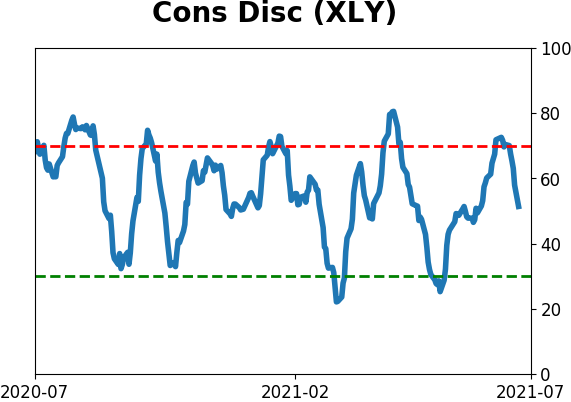
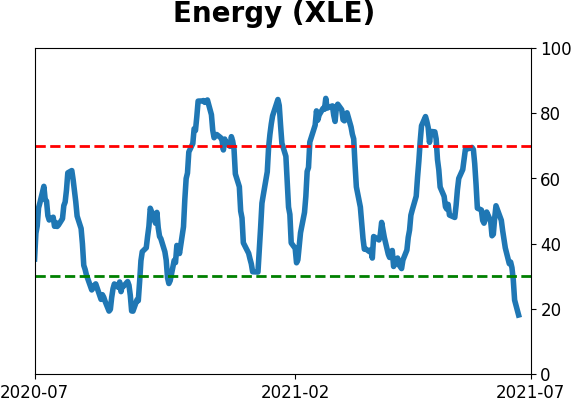
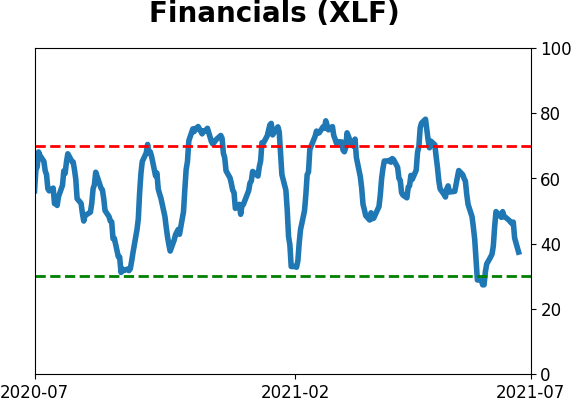
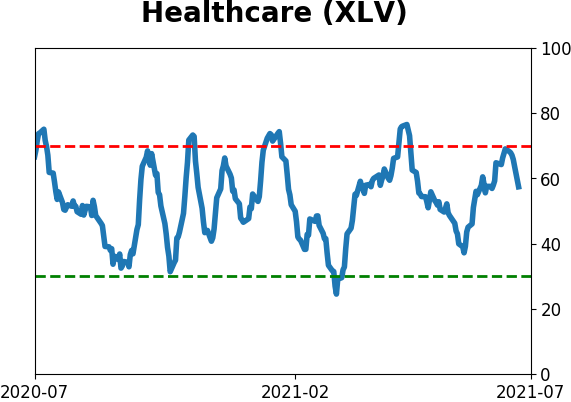
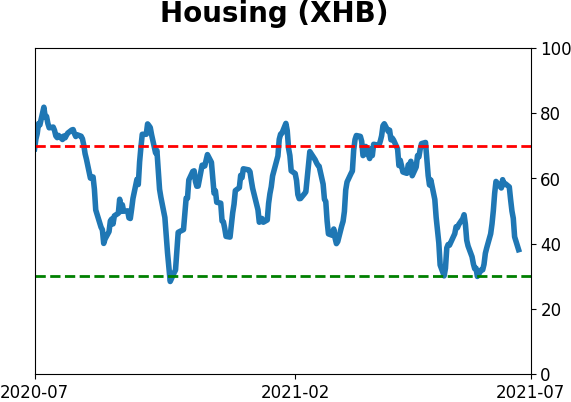
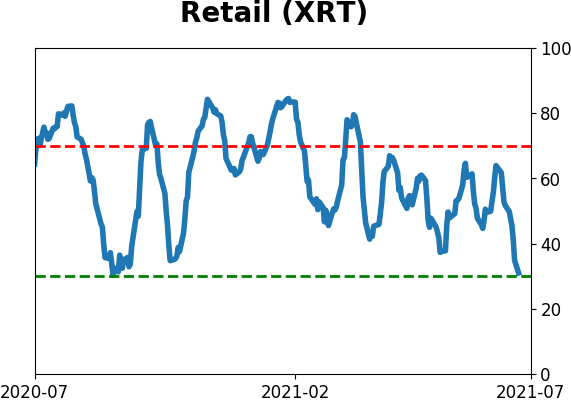
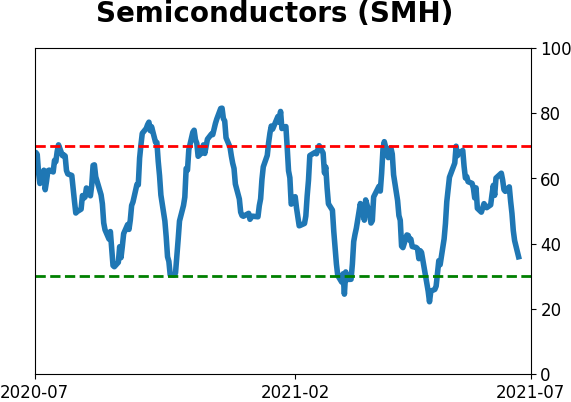
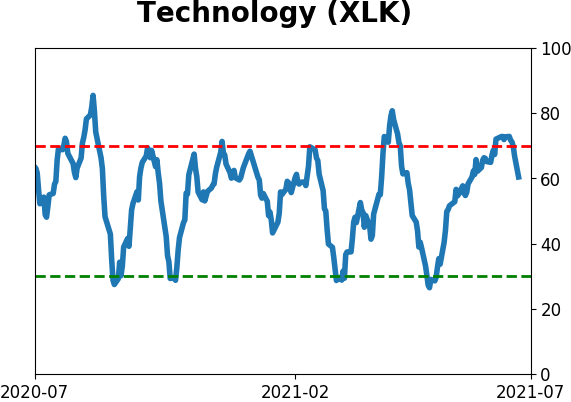
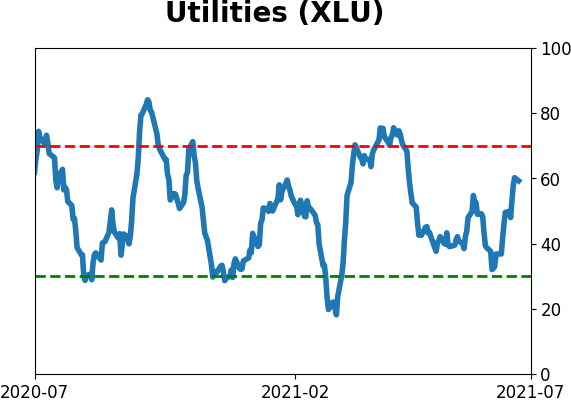
Sector ETF's - 10-Day Moving Average
|
|
|
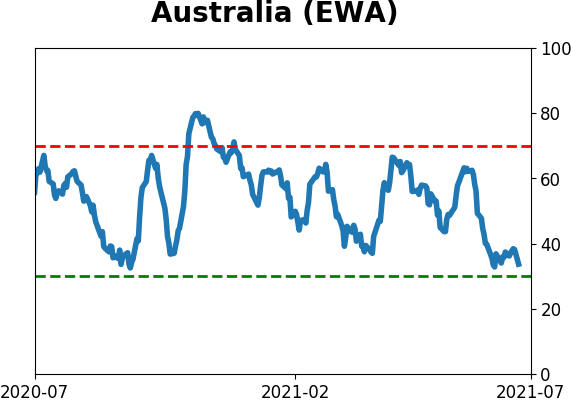
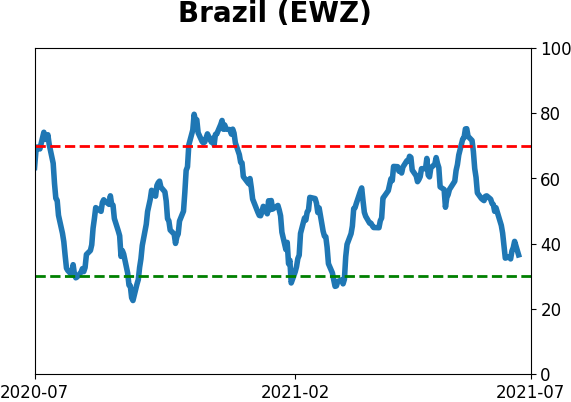
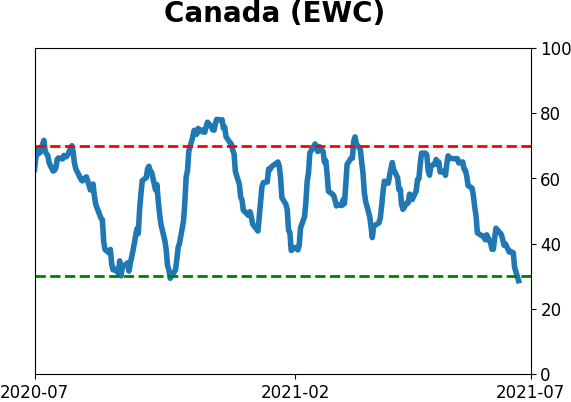
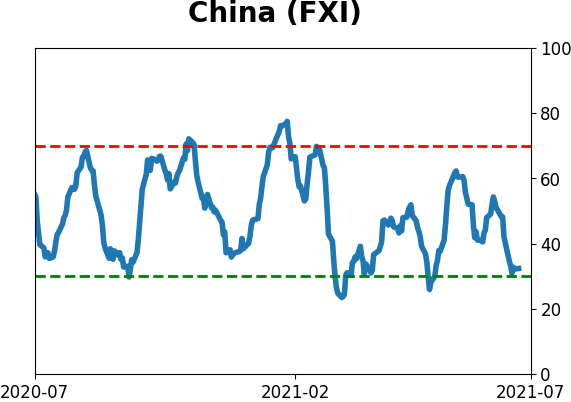
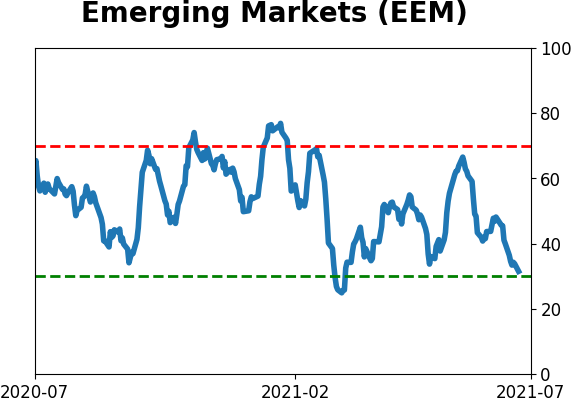
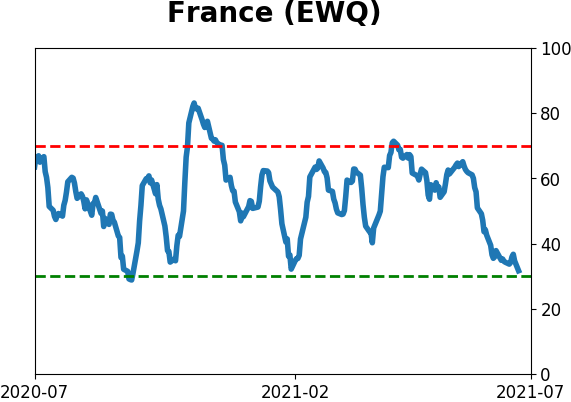
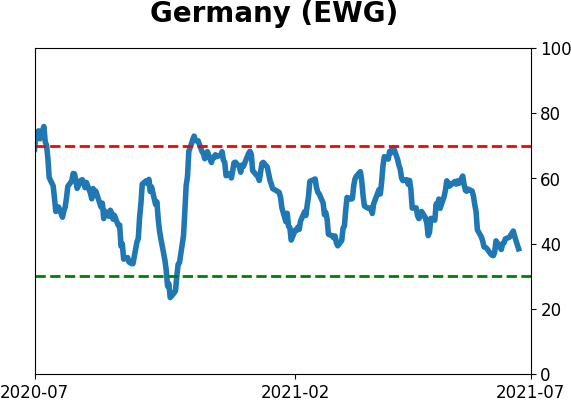
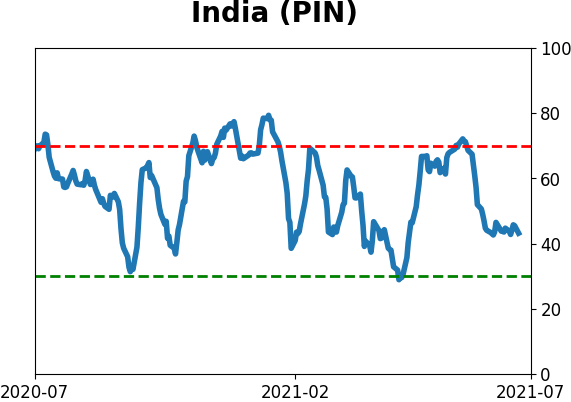
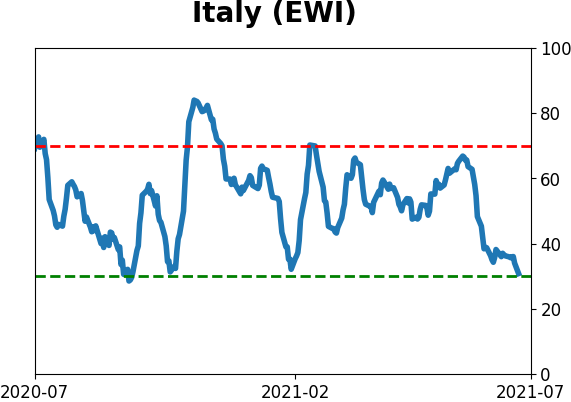
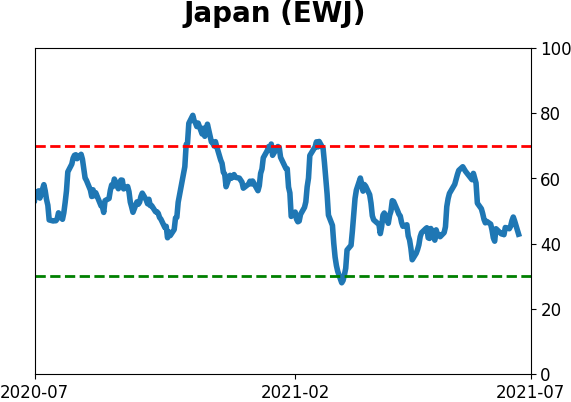
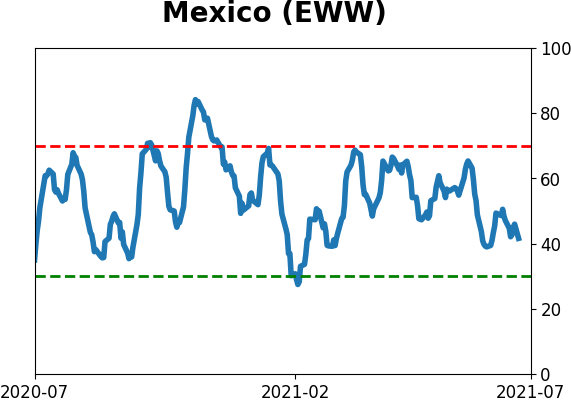
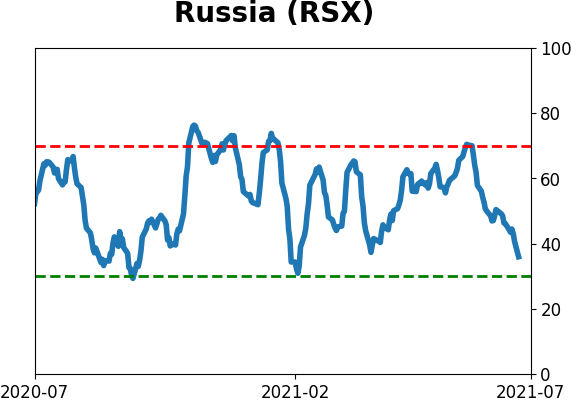
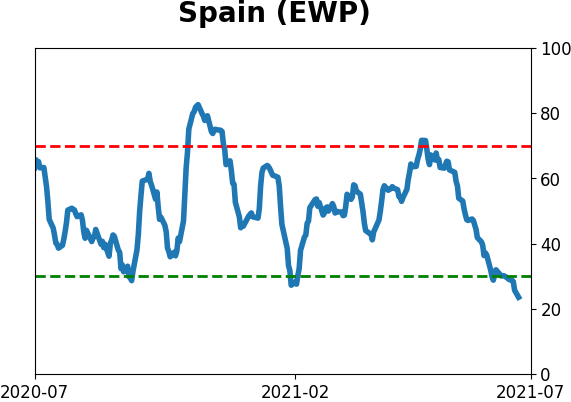
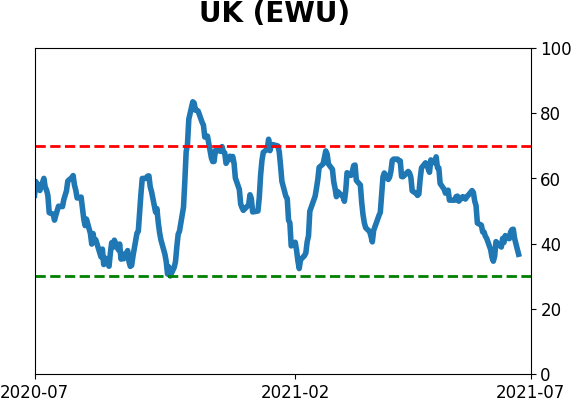
Country ETF's - 10-Day Moving Average
|
|
|
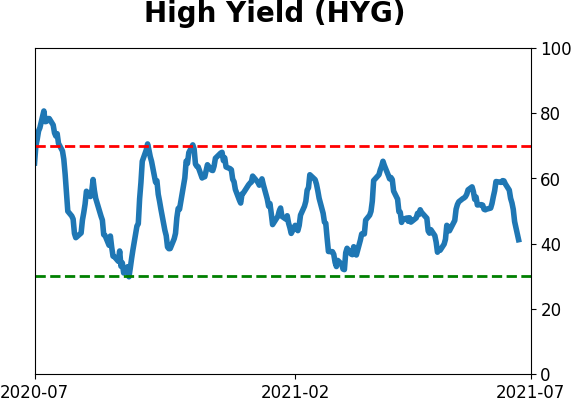
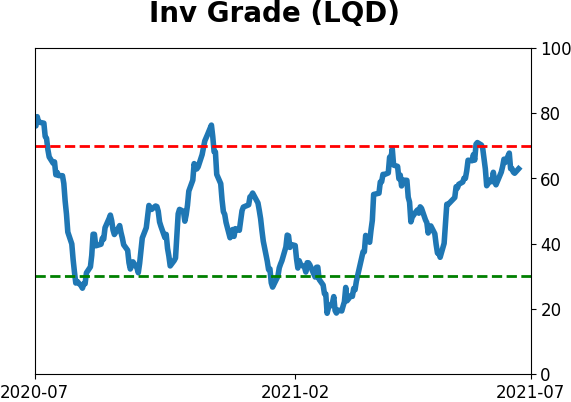
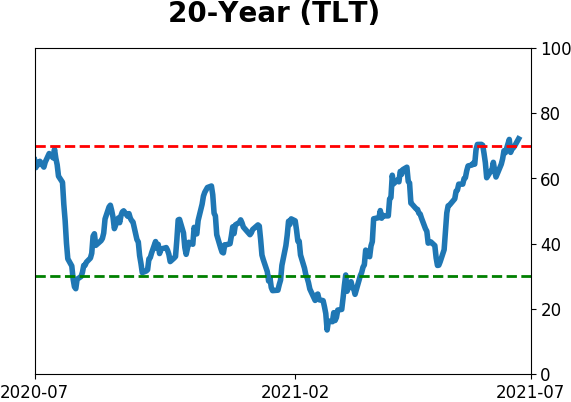
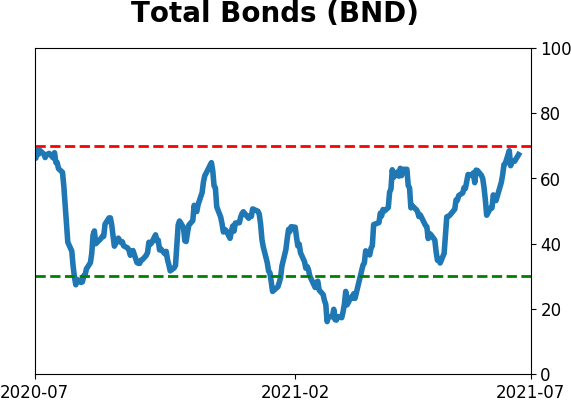
Bond ETF's - 10-Day Moving Average
|
|
|
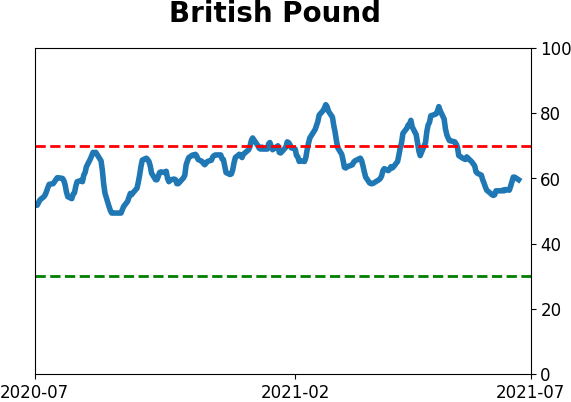
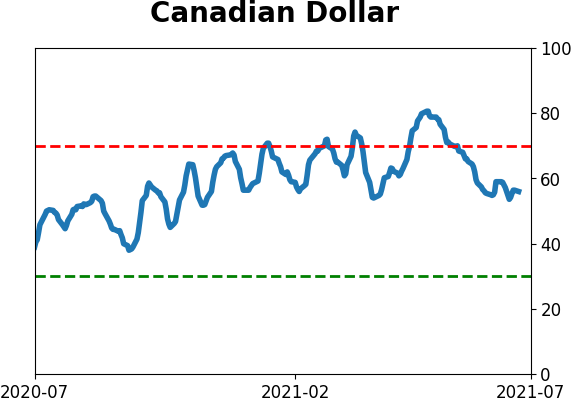
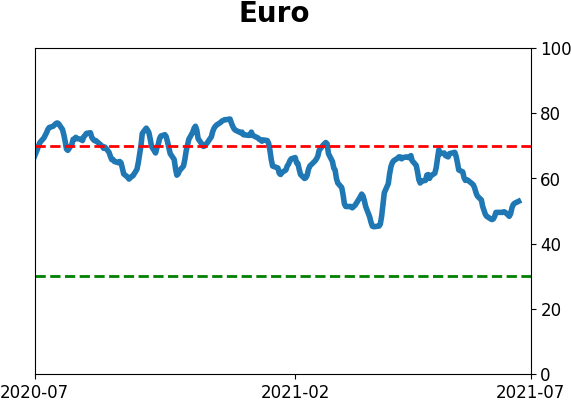
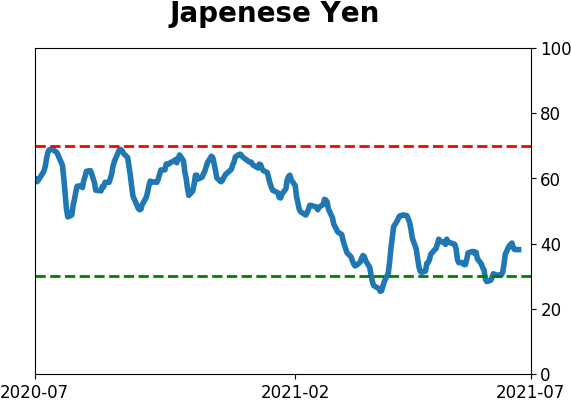
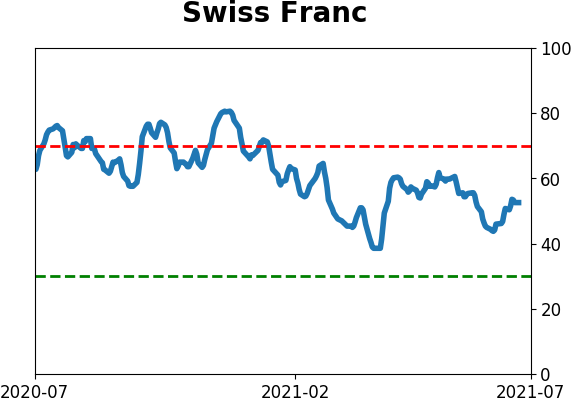
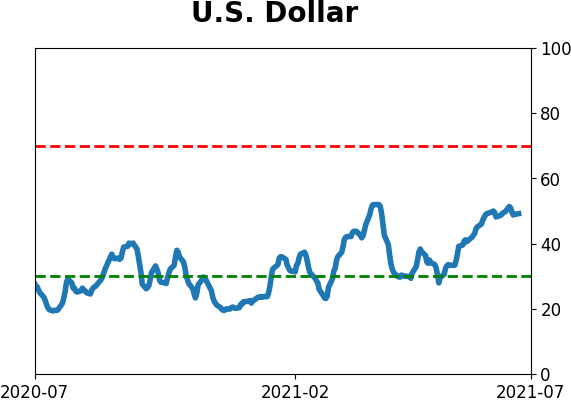
Currency ETF's - 5-Day Moving Average
|
|
|
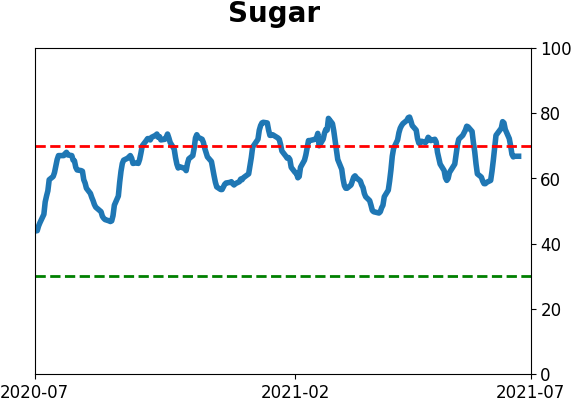
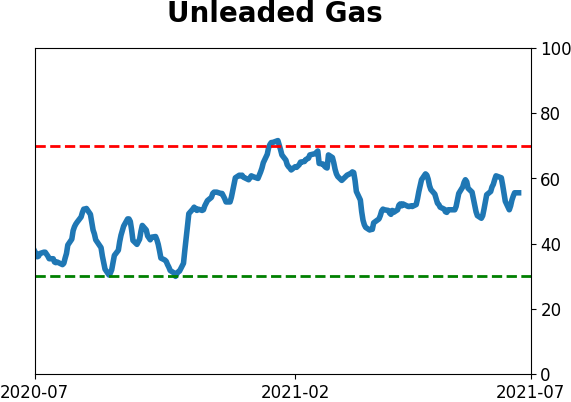
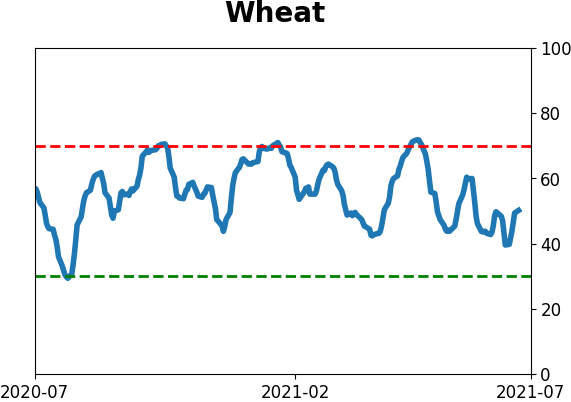
Commodity ETF's - 5-Day Moving Average
|
|