Headlines
|
|
Investors are pessimistic, but buying speculative options:
In recent weeks, investors have been snapping up speculative call options to a historic degree. Oddly, though, some of them are also saying that they're highly pessimistic on stocks over the longer-term. Rarely have two sets of indicators diverged to this degree.
Industrial production gears up:
Many economic data series are showing rebounds from their spring depths. One of the more widely-watched ones, industrial production, has moved more than 5% off its low, which typically meant the end of past contractions.
Bottom Line:
- Weight of the evidence has been suggesting flat/lower stock prices short- to medium-term, though that turned more neutral as stocks pulled back recently; still suggesting higher prices long-term
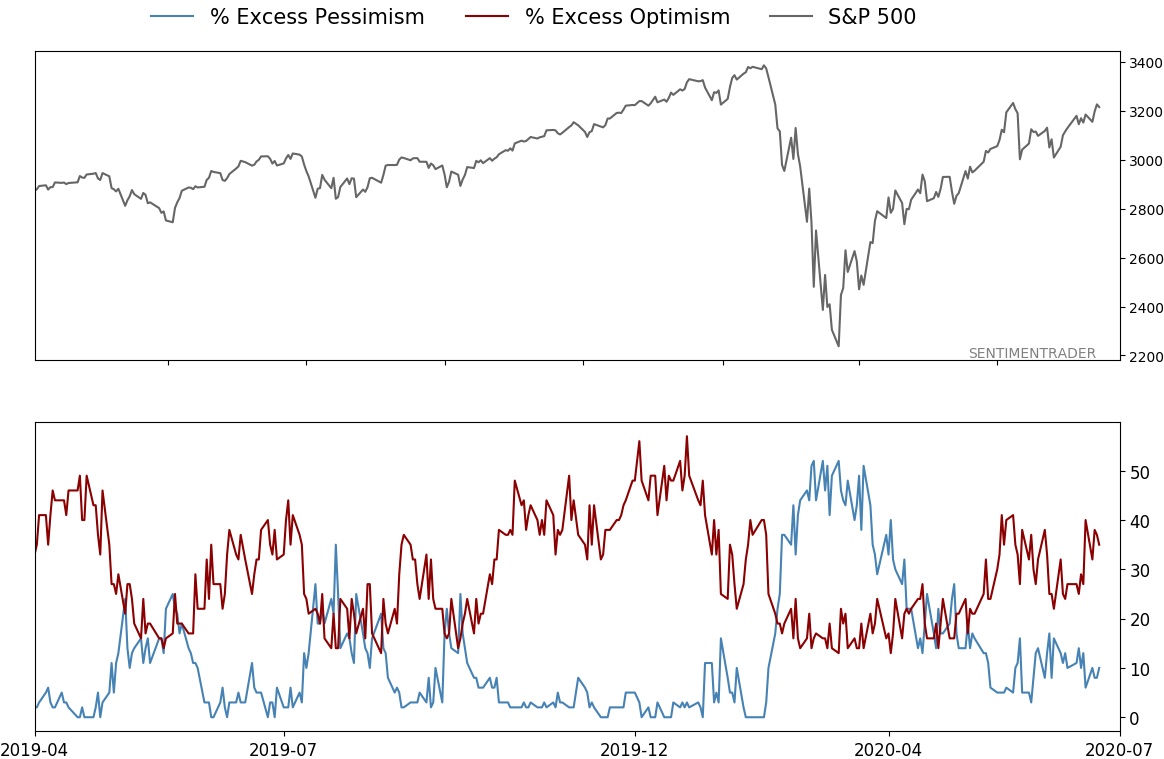
- Indicators show high and declining optimism, as Dumb Money Confidence neared 80% in early June with signs of reckless speculation, historic buying pressure, then even more speculation during what appears to be an unhealthy market environment
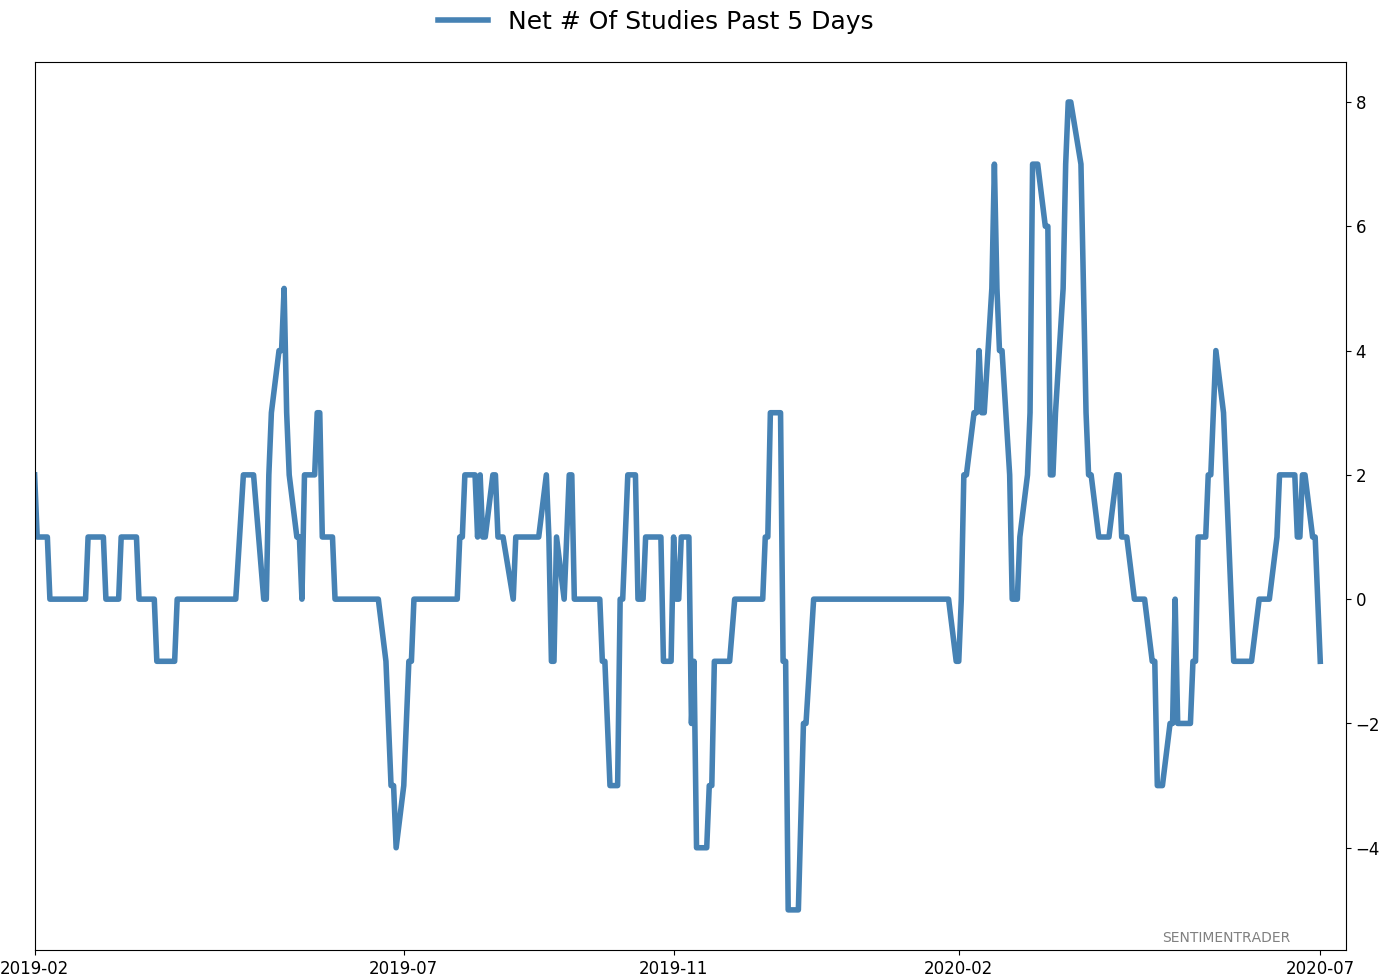
- Active Studies show a heavy positive skew over the medium- to long-term; breadth thrusts, recoveries, and trend changes have an almost unblemished record at preceding higher prices over a 6-12 month time frame
- Signs of extremely skewed preference for tech stocks nearing exhaustion, especially relative to industrials and financials (here and here)
- Indicators and studies for other markets are mixed with no strong conclusion, though it's not a great sign for Treasuries that hedgers are net short.
|
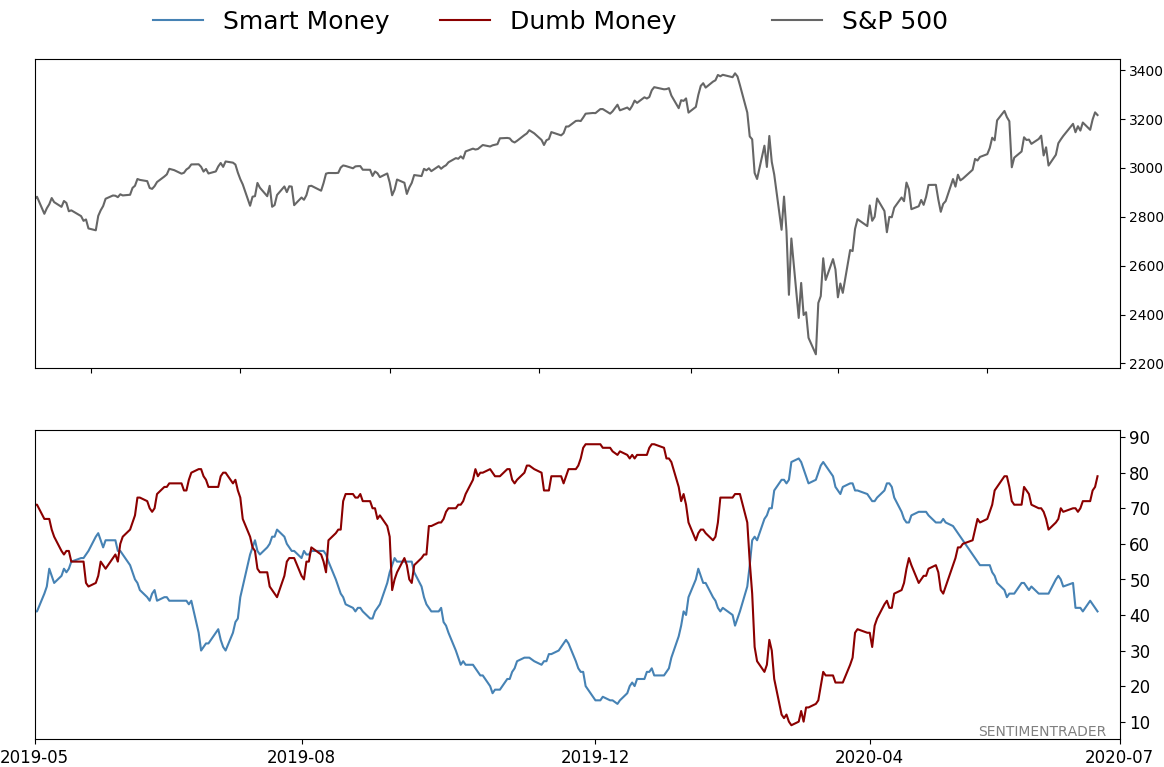
Smart / Dumb Money Confidence
|
Smart Money Confidence: 41%
Dumb Money Confidence: 79%
|
|
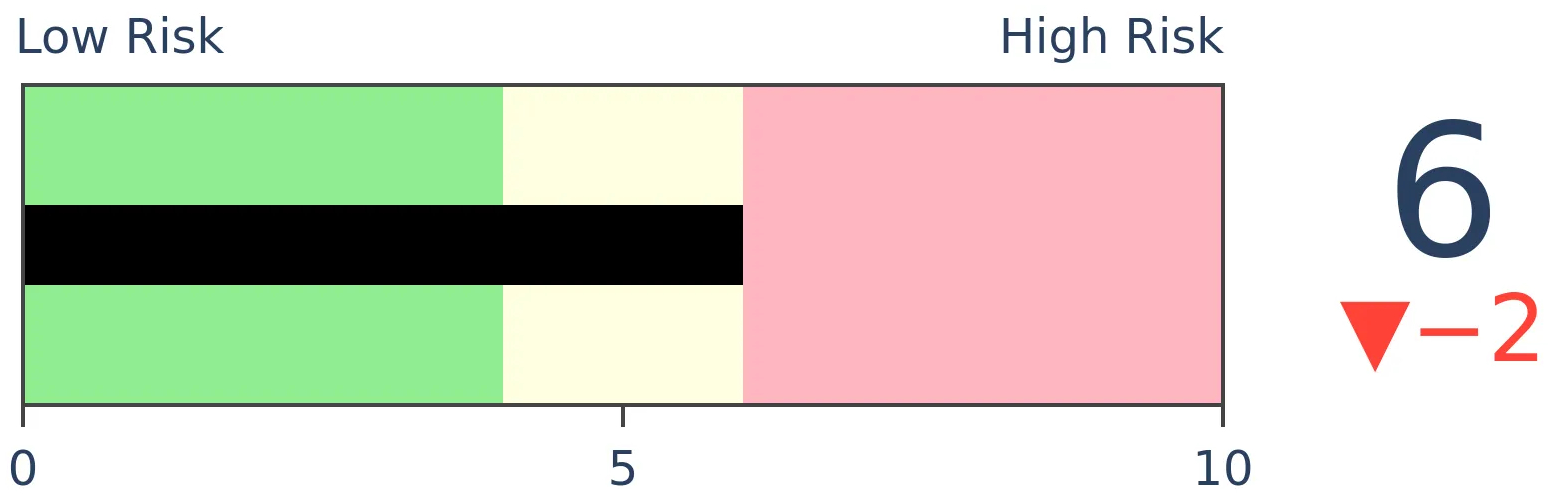
Risk Levels
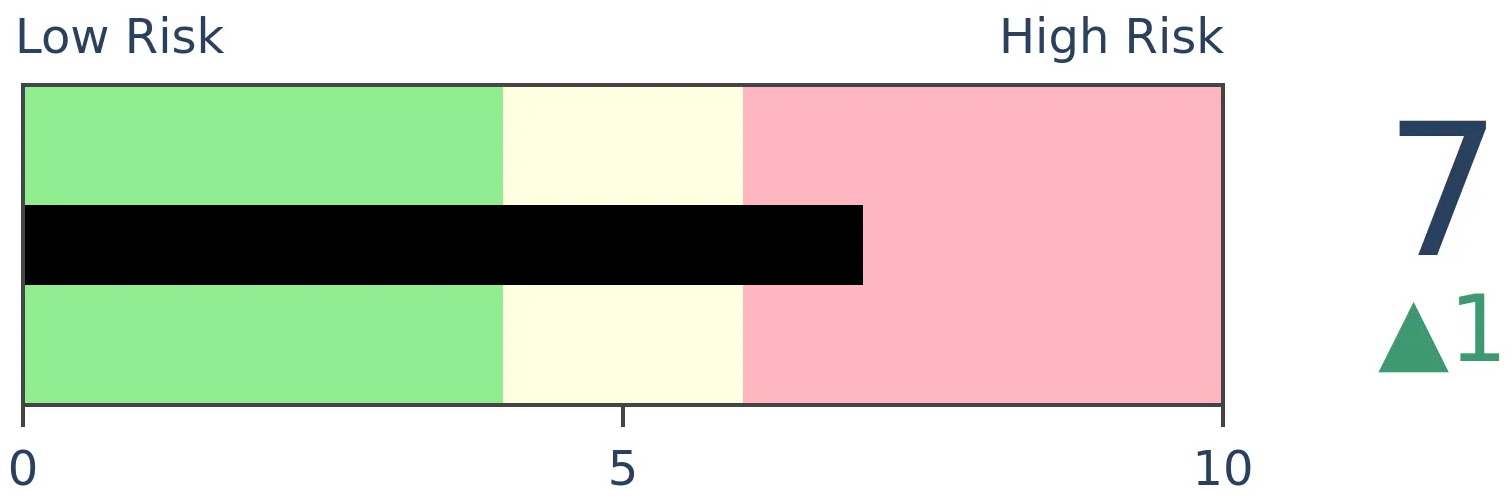
Stocks Short-Term
|
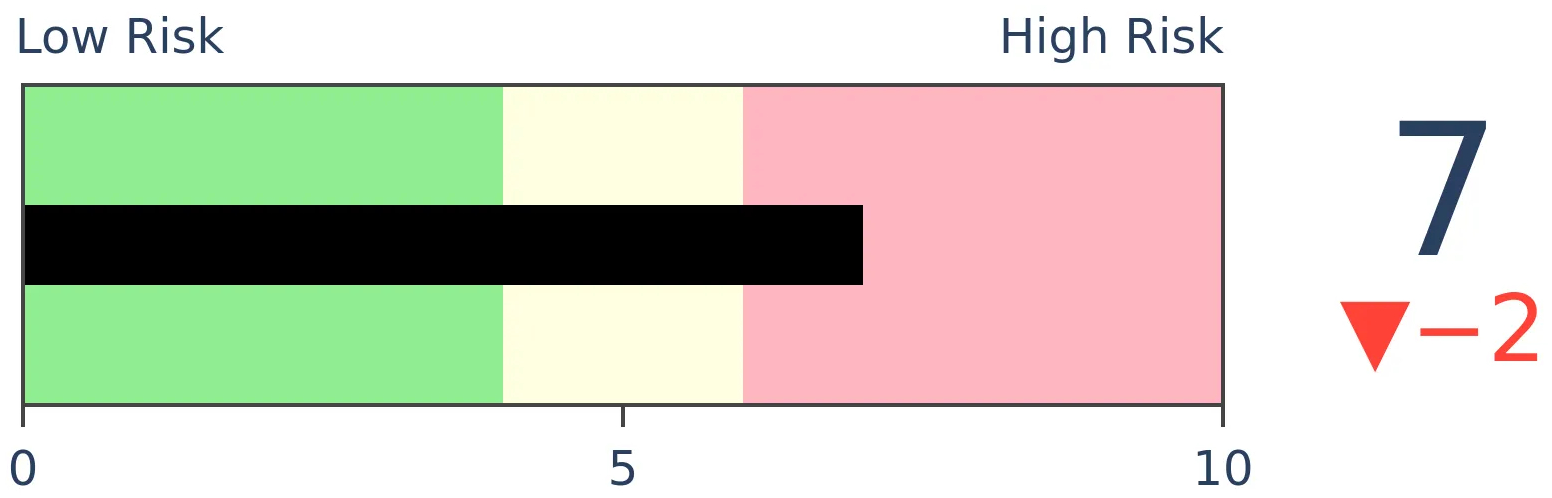
Stocks Medium-Term
|
|
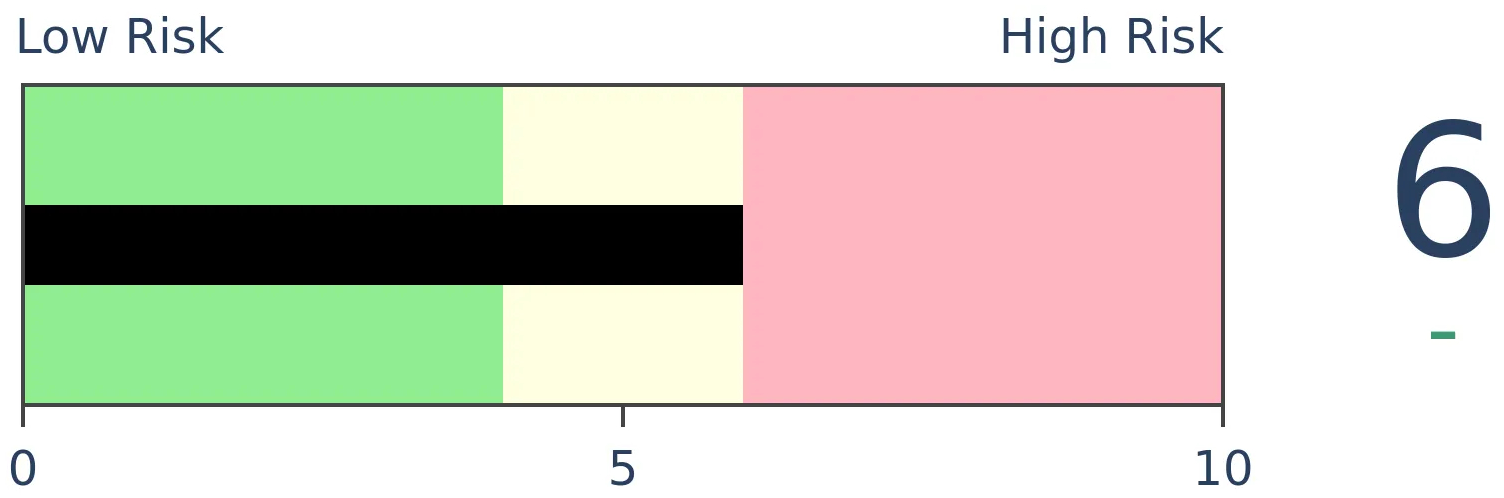
Bonds

|
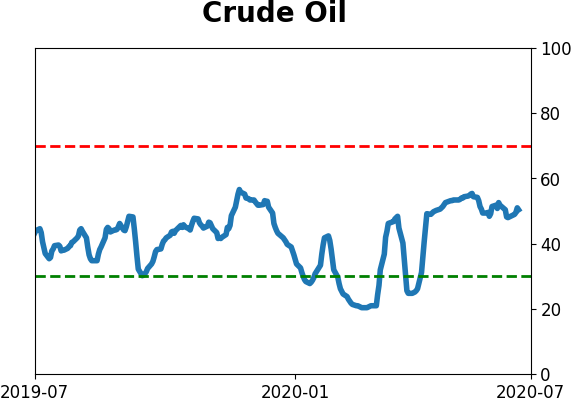
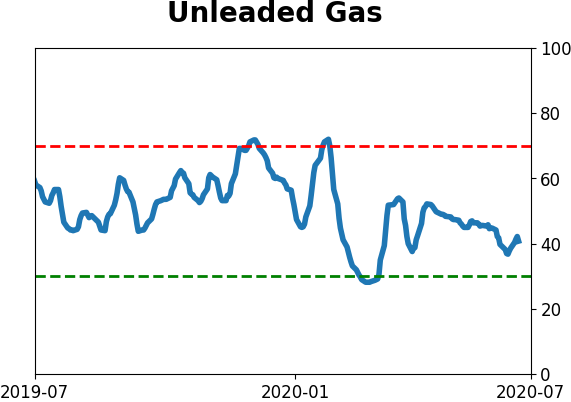
Crude Oil
|
|
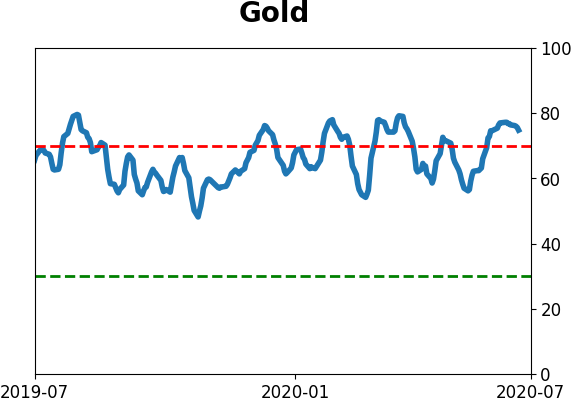
Gold

|
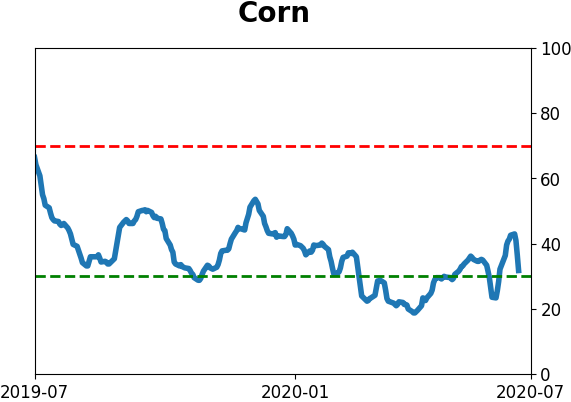
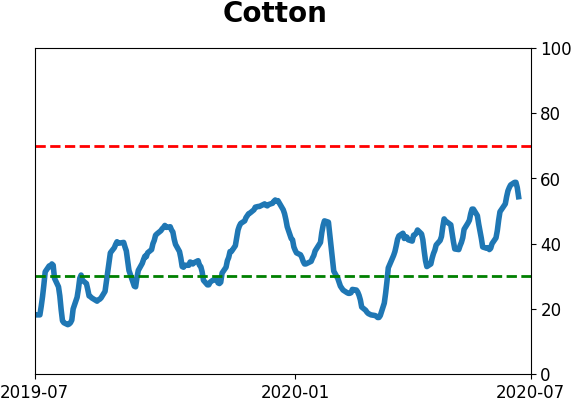
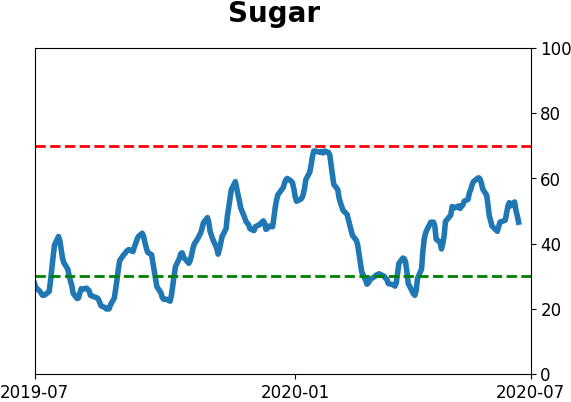
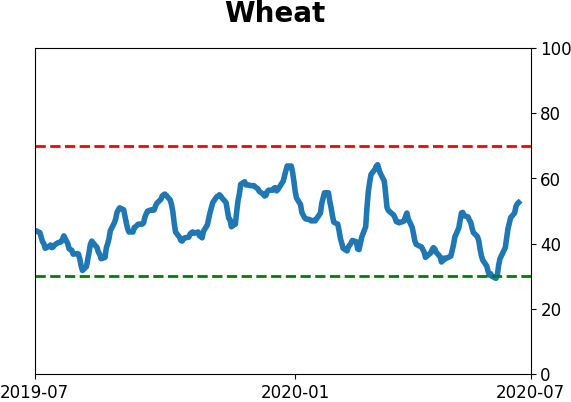
Agriculture
|
|
Research
BOTTOM LINE
In recent weeks, investors have been snapping up speculative call options to a historic degree. Oddly, though, some of them are also saying that they're highly pessimistic on stocks over the longer-term. Rarely have two sets of indicators diverged to this degree.
FORECAST / TIMEFRAME
None
|
Defining "sentiment" isn't a one-sided affair. All of us want to look at a single end-all, be-all indicator of what the hordes are thinking or how they're behaving, but it's just not that simple. Using one metric has been way too prone to error.
The frustrating part about this is that most of the time, at least a few measures are in conflict with each other. There are usually 2-3 times per year in each market where almost everything lines up, and defining where sentiment is can be relatively straightforward. That was mostly the case in January-February (excessive optimism) and March (excessive pessimism).
Right now, most shorter-term guides are showing a lot of optimism, some on a historic scale. On a medium- to long-term basis, it's much more mixed, and some are even showing outright pessimism, even after a historic rally.
We've looked at these conflicts many times in the past, and one of the most egregious right now is between the options market and some surveys, like AAII. As noted by Urban Carmel, the two have rarely been this much at odds.
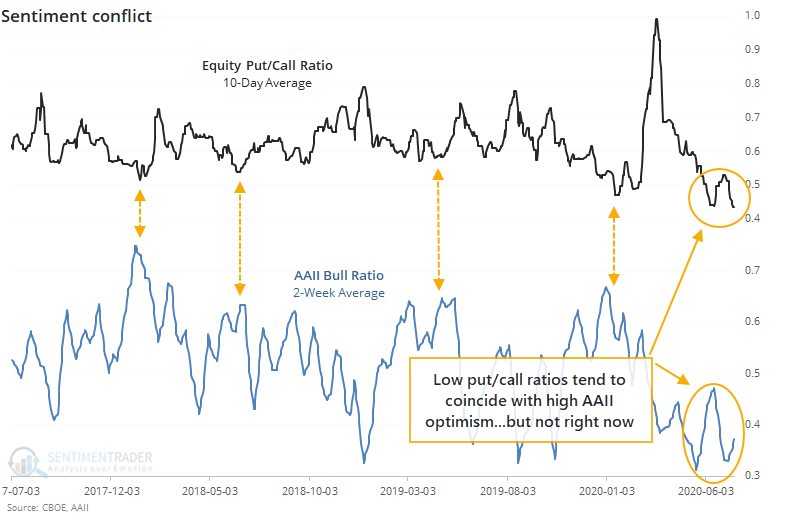
Over the past two weeks, options traders have shown a historic level of speculation, and that has pushed the 10-day Equity-only Put/Call Ratio to its lowest level since the year 2000. At the same time, the AAII survey of individual investors shows a Bull Ratio that ranks among the lowest in the survey's history.
So who do we believe? Are investors in a speculative frenzy as indicated by the options market, or are they depressed like some survey's show?
We always place more weight on real-money indicators as opposed to surveys, because people often say one thing but do another. That's true in real life, and it's true in markets.
Let's go back to 1993 and look for every time when the put/call ratio was in the bottom 10% of its range over the past year, and so was the AAII survey.
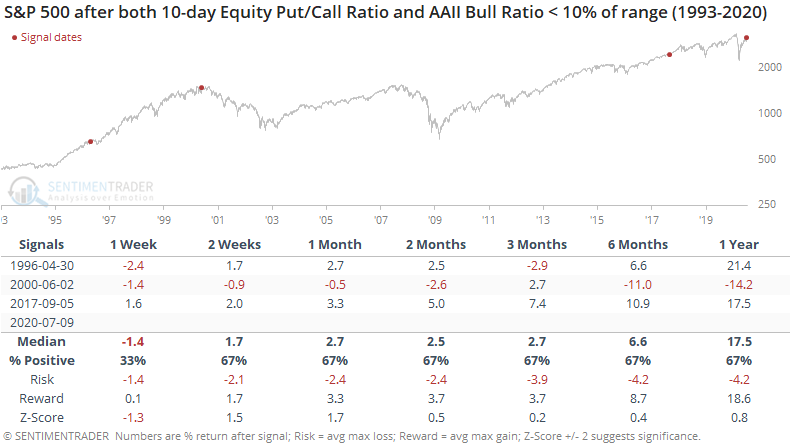
Clearly, not a large sample size here. And making it even less useful, there wasn't any real consistency among them. Stocks pulled back after this happened in 1996 and 2000, but took off to the upside in 2017.
Let's relax the parameters to get a larger sample. The table below shows times when both indicators were in the bottom 25% of their ranges.
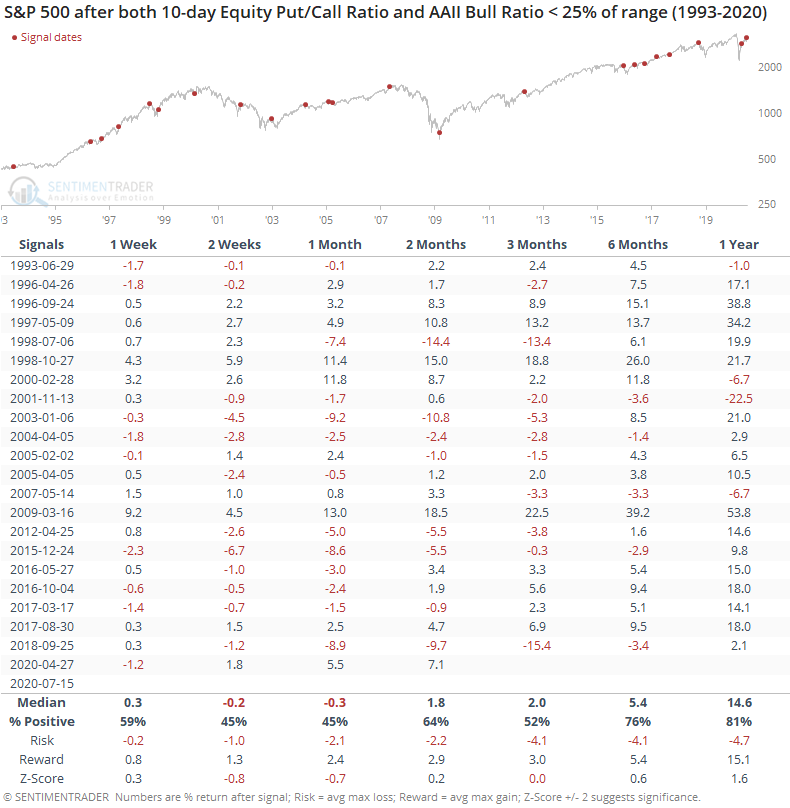
These conditions led to returns that are in line with what we should expect. The high optimism indicated by the put/call ratios helped to put a damper on shorter-term returns, while the low optimism indicated by the AAII survey helped lead to above-average longer-term returns. Since 2010, all but one of the signals led to short-term pullbacks and long-term gains, so recent history has confirmed this general pattern.
It's rare to see indicators like this diverge as much as they are now, but it's not unprecedented. The times that it has happened, stocks have usually responded more to put/call ratios over a period of weeks and the survey over a period of many months. That would indicate some downside risk now, but more reward over the next 6-12 months.
BOTTOM LINE
Many economic data series are showing rebounds from their spring depths. One of the more widely-watched ones, industrial production, has moved more than 5% off its low, which typically meant the end of past contractions.
FORECAST / TIMEFRAME
None
|
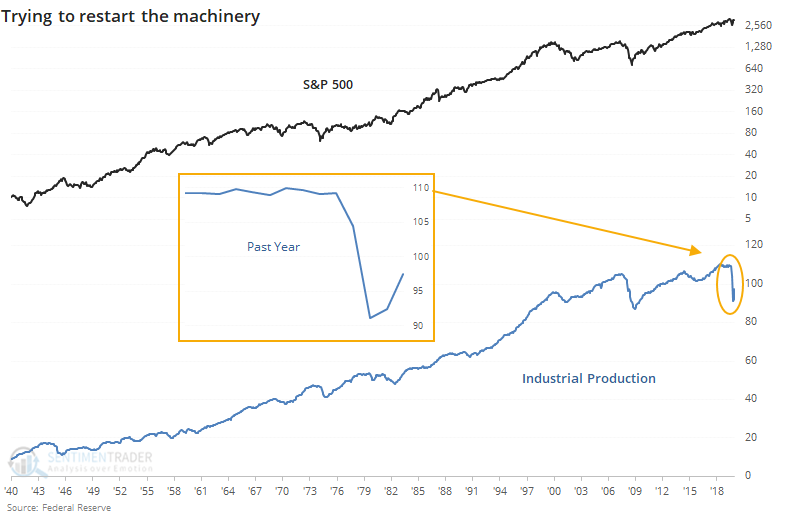
According to the Federal Reserve, the U.S.'s industrial machinery is trying to restart.
As noted by the Wall Street Journal:
"U.S. manufacturing increased in June for the second straight month, a sign of economic recovery in the weeks before the recent surge in coronavirus cases. Industrial production—a measure of output at factories, mines and utilities—rose a seasonally adjusted 5.4% in June from May, the Federal Reserve said Wednesday. That was a bigger increase than the 4% rise anticipated by economists surveyed by The Wall Street Journal."
While the industries captured by this data account for a smaller part of the economy than in decades past, it's a seemingly encouraging sign. We can see how this indicator has coincided with the general trend of stocks over the past 80 years.
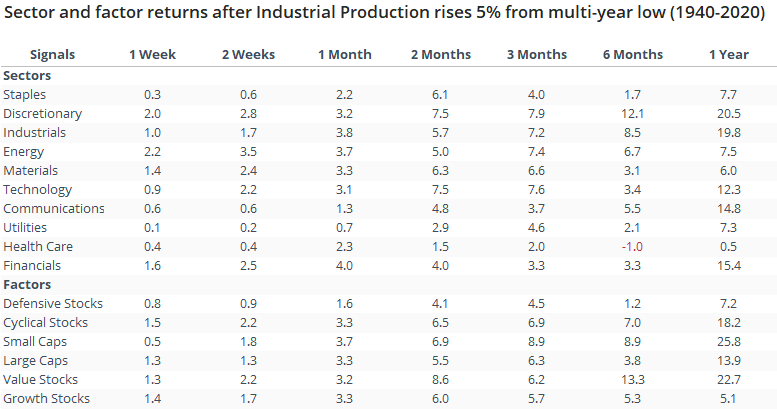
Even though economic data tend to trail gyrations in stocks, by the time Industrial Production rebounded at least 5% from a multi-year low, it was still a good sign for stocks going forward.
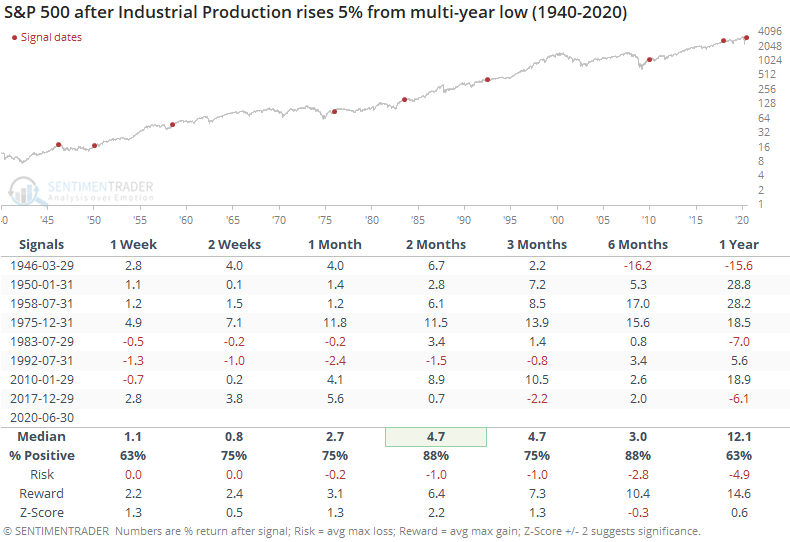
Since 1980, three of the four signals preceded losses in the S&P at some point over the next 1-3 months, so it wasn't an immediate and sustained buy signal. Two of them also showed losses over the next year. Overall, the sweet spot for gains with the lowest risk relative to reward was over the next 2-6 months.
Among sectors, industrial stocks were not the most impressive performers. All sectors and factors showed positive median returns going forward, with discretionary stocks seeing the largest absolute gains, energy stocks the largest gains relative to the random, and financial stocks the most consistent gains.
Active Studies
| Time Frame | Bullish | Bearish | | Short-Term | 0 | 0 | | Medium-Term | 8 | 7 | | Long-Term | 44 | 1 |
|
Indicators at Extremes
Portfolio
| Position | Weight % | Added / Reduced | Date | | Stocks | 29.8 | Reduced 9.1% | 2020-06-11 | | Bonds | 0.0 | Reduced 6.7% | 2020-02-28 | | Commodities | 5.2 | Added 2.4%
| 2020-02-28 | | Precious Metals | 0.0 | Reduced 3.6% | 2020-02-28 | | Special Situations | 0.0 | Reduced 31.9% | 2020-03-17 | | Cash | 65.0 | | |
|
Updates (Changes made today are underlined)
In the first months of the year, we saw manic trading activity. From big jumps in specific stocks to historic highs in retail trading activity to record highs in household confidence to almost unbelievable confidence among options traders. All of that came amid a market where the average stock couldn't keep up with their indexes. There were signs of waning momentum in stocks underlying the major averages, which started triggering technical warning signs in late January. After stocks bottomed on the 23rd, they enjoyed a historic buying thrust and retraced a larger amount of the decline than "just a bear market rally" tends to. Those thrusts are the most encouraging sign we've seen in years. Through early June, we were still seeing thrusts that have led to recoveries in longer-term breadth metrics. The longer-term prospects for stocks (6-12 months) still look decent given the above. On a short- to medium-term basis, it was getting harder to make that case. Dumb Money Confidence spiked and there were multiple signs of a historic level of speculation. This is likely the lowest I will go given what I still consider to be compelling positives over a longer time frame. There is not a slam-dunk case to be made for either direction, so it will seem like a mistake whether stocks keep dropping (why didn't I sell more?) or if they turn and head higher (why did I let short-term concerns prevail?). After nearly three decades of trading, I've learned to let go of the idea of perfection.
RETURN YTD: -4.6% 2019: 12.6%, 2018: 0.6%, 2017: 3.8%, 2016: 17.1%, 2015: 9.2%, 2014: 14.5%, 2013: 2.2%, 2012: 10.8%, 2011: 16.5%, 2010: 15.3%, 2009: 23.9%, 2008: 16.2%, 2007: 7.8%
|
|
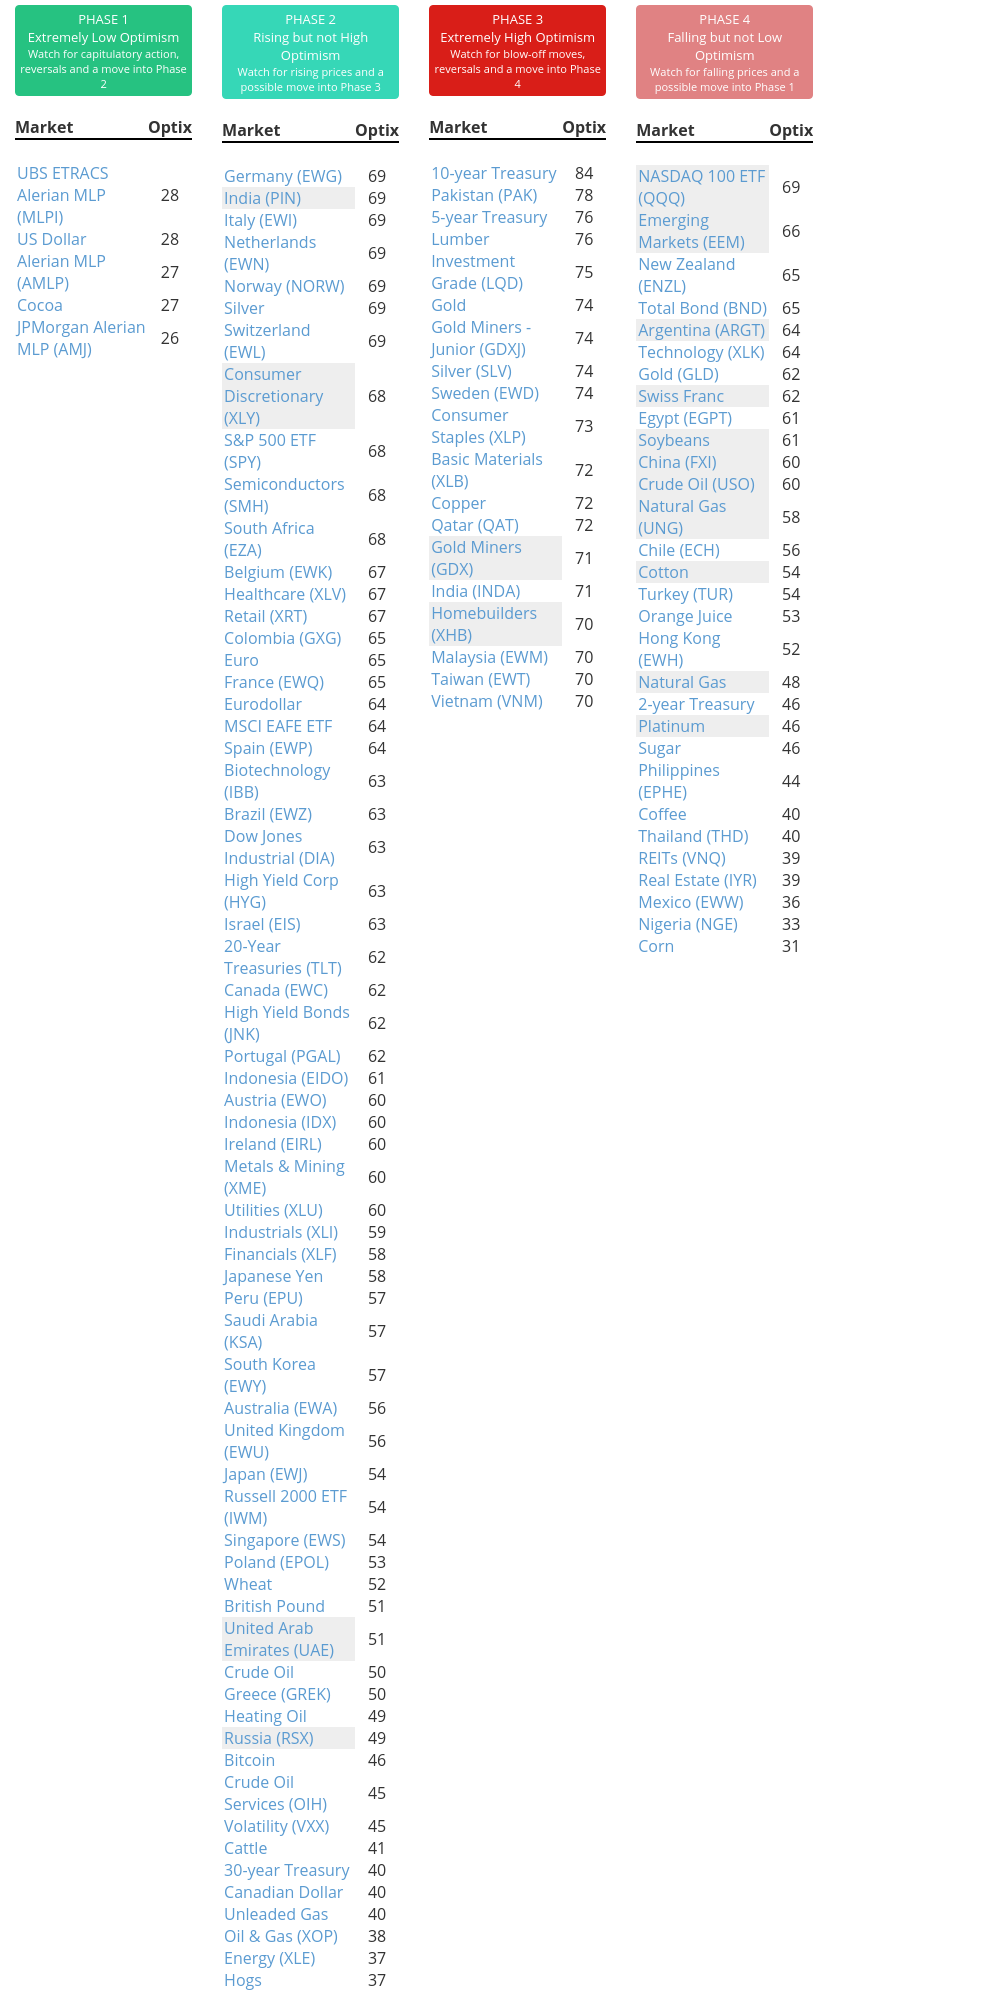
Phase Table
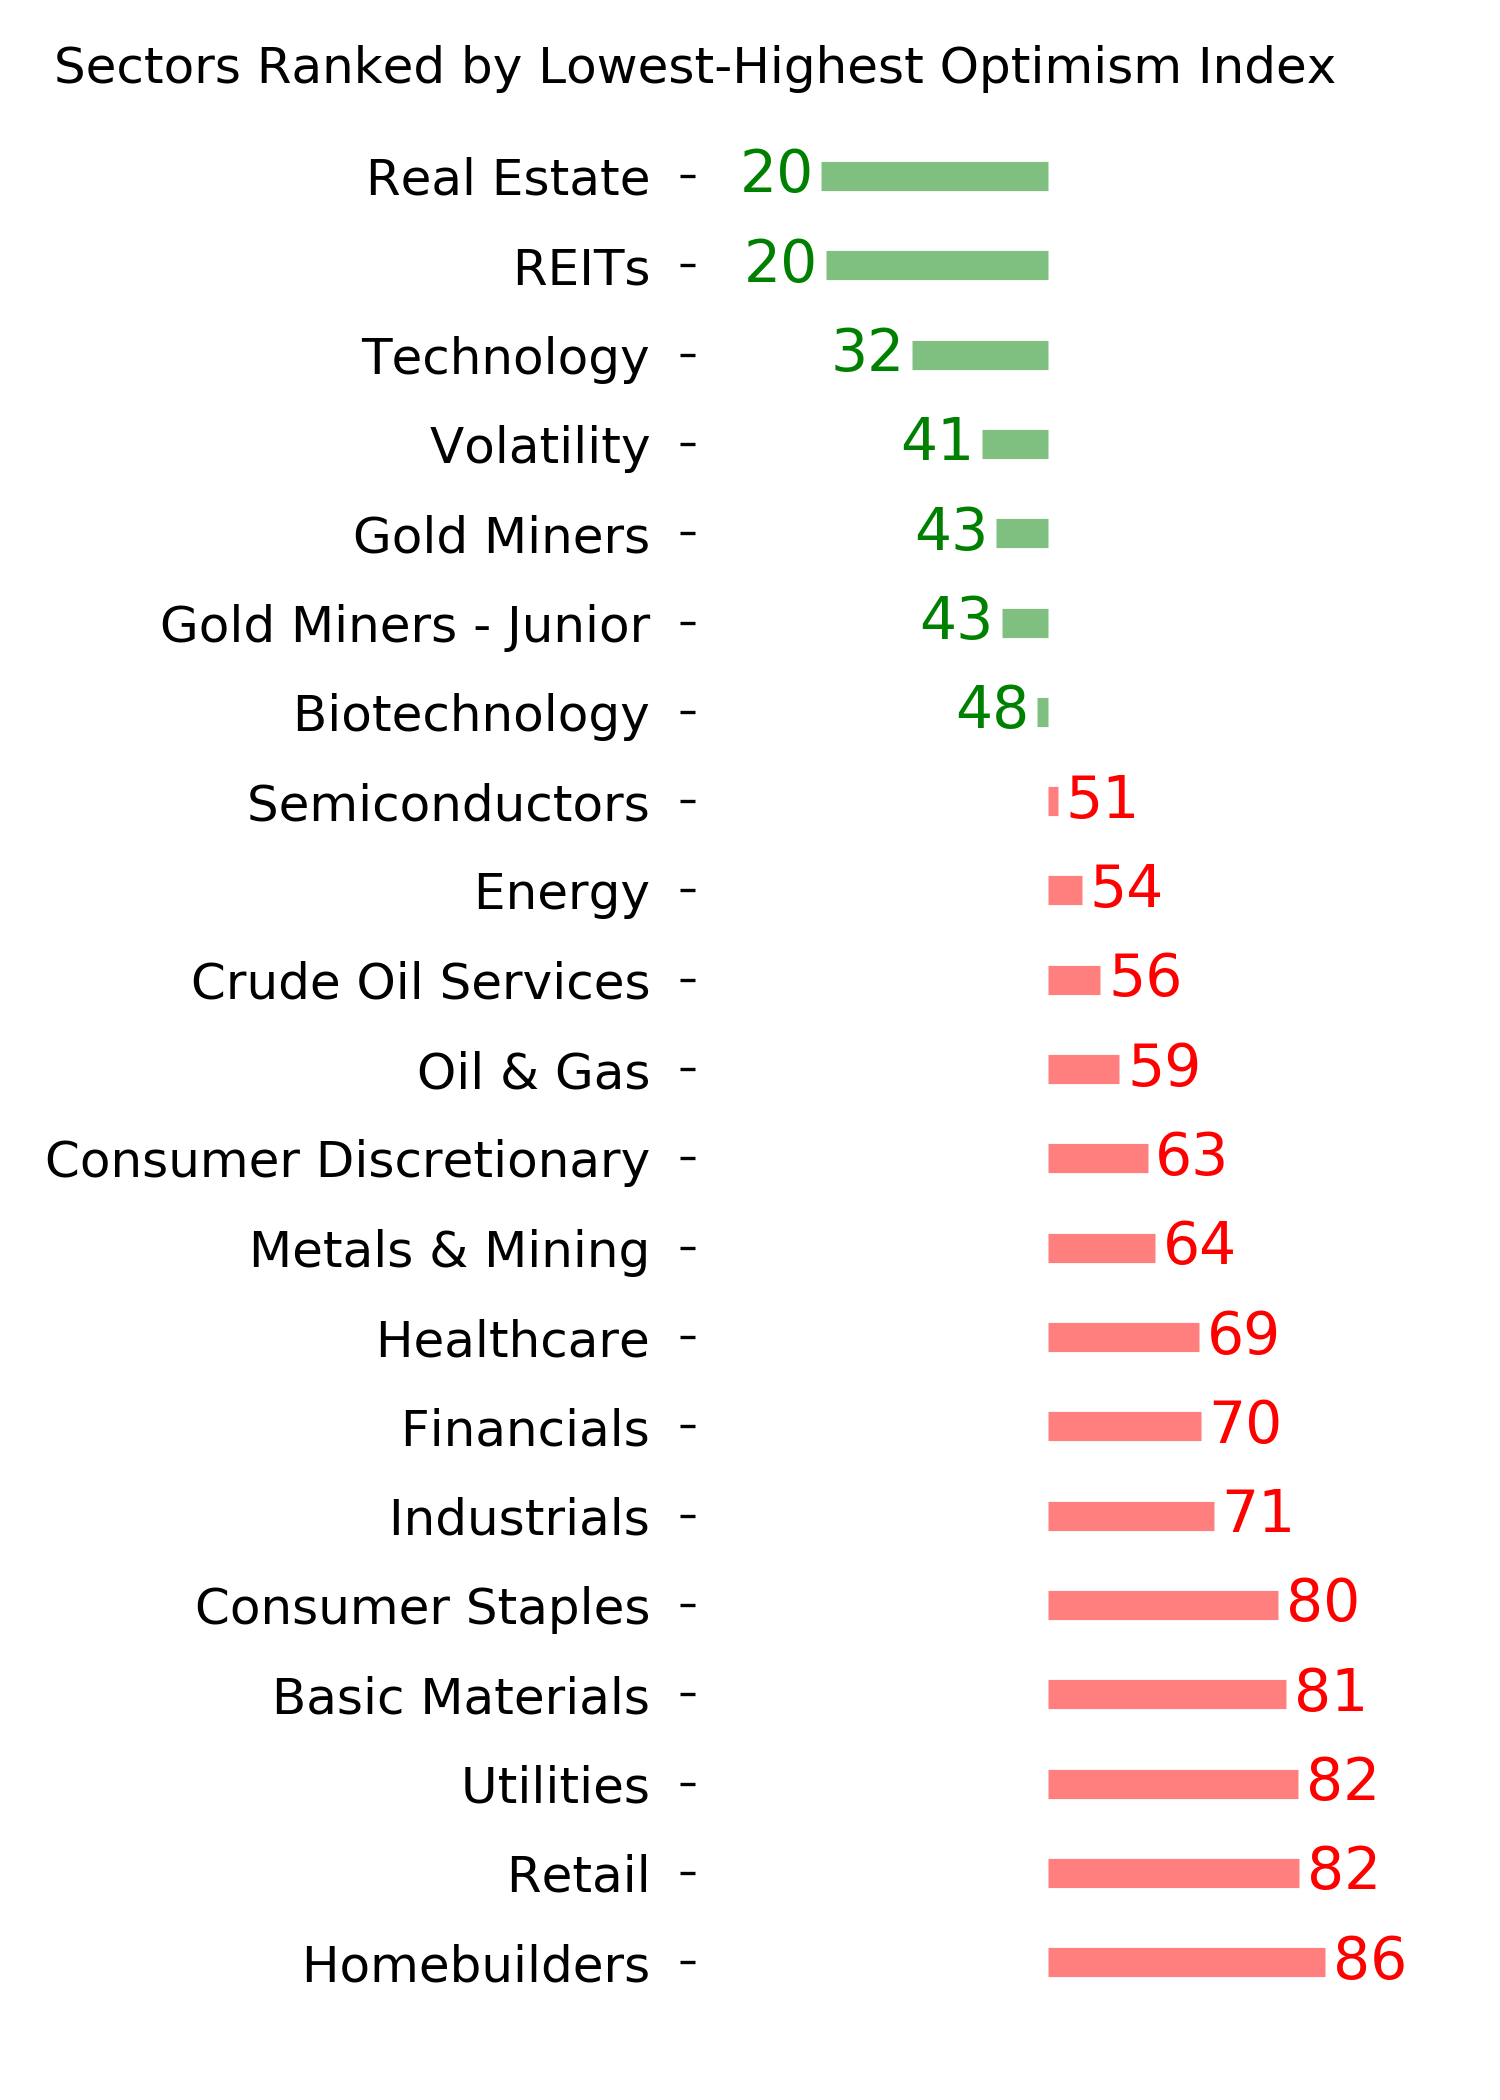
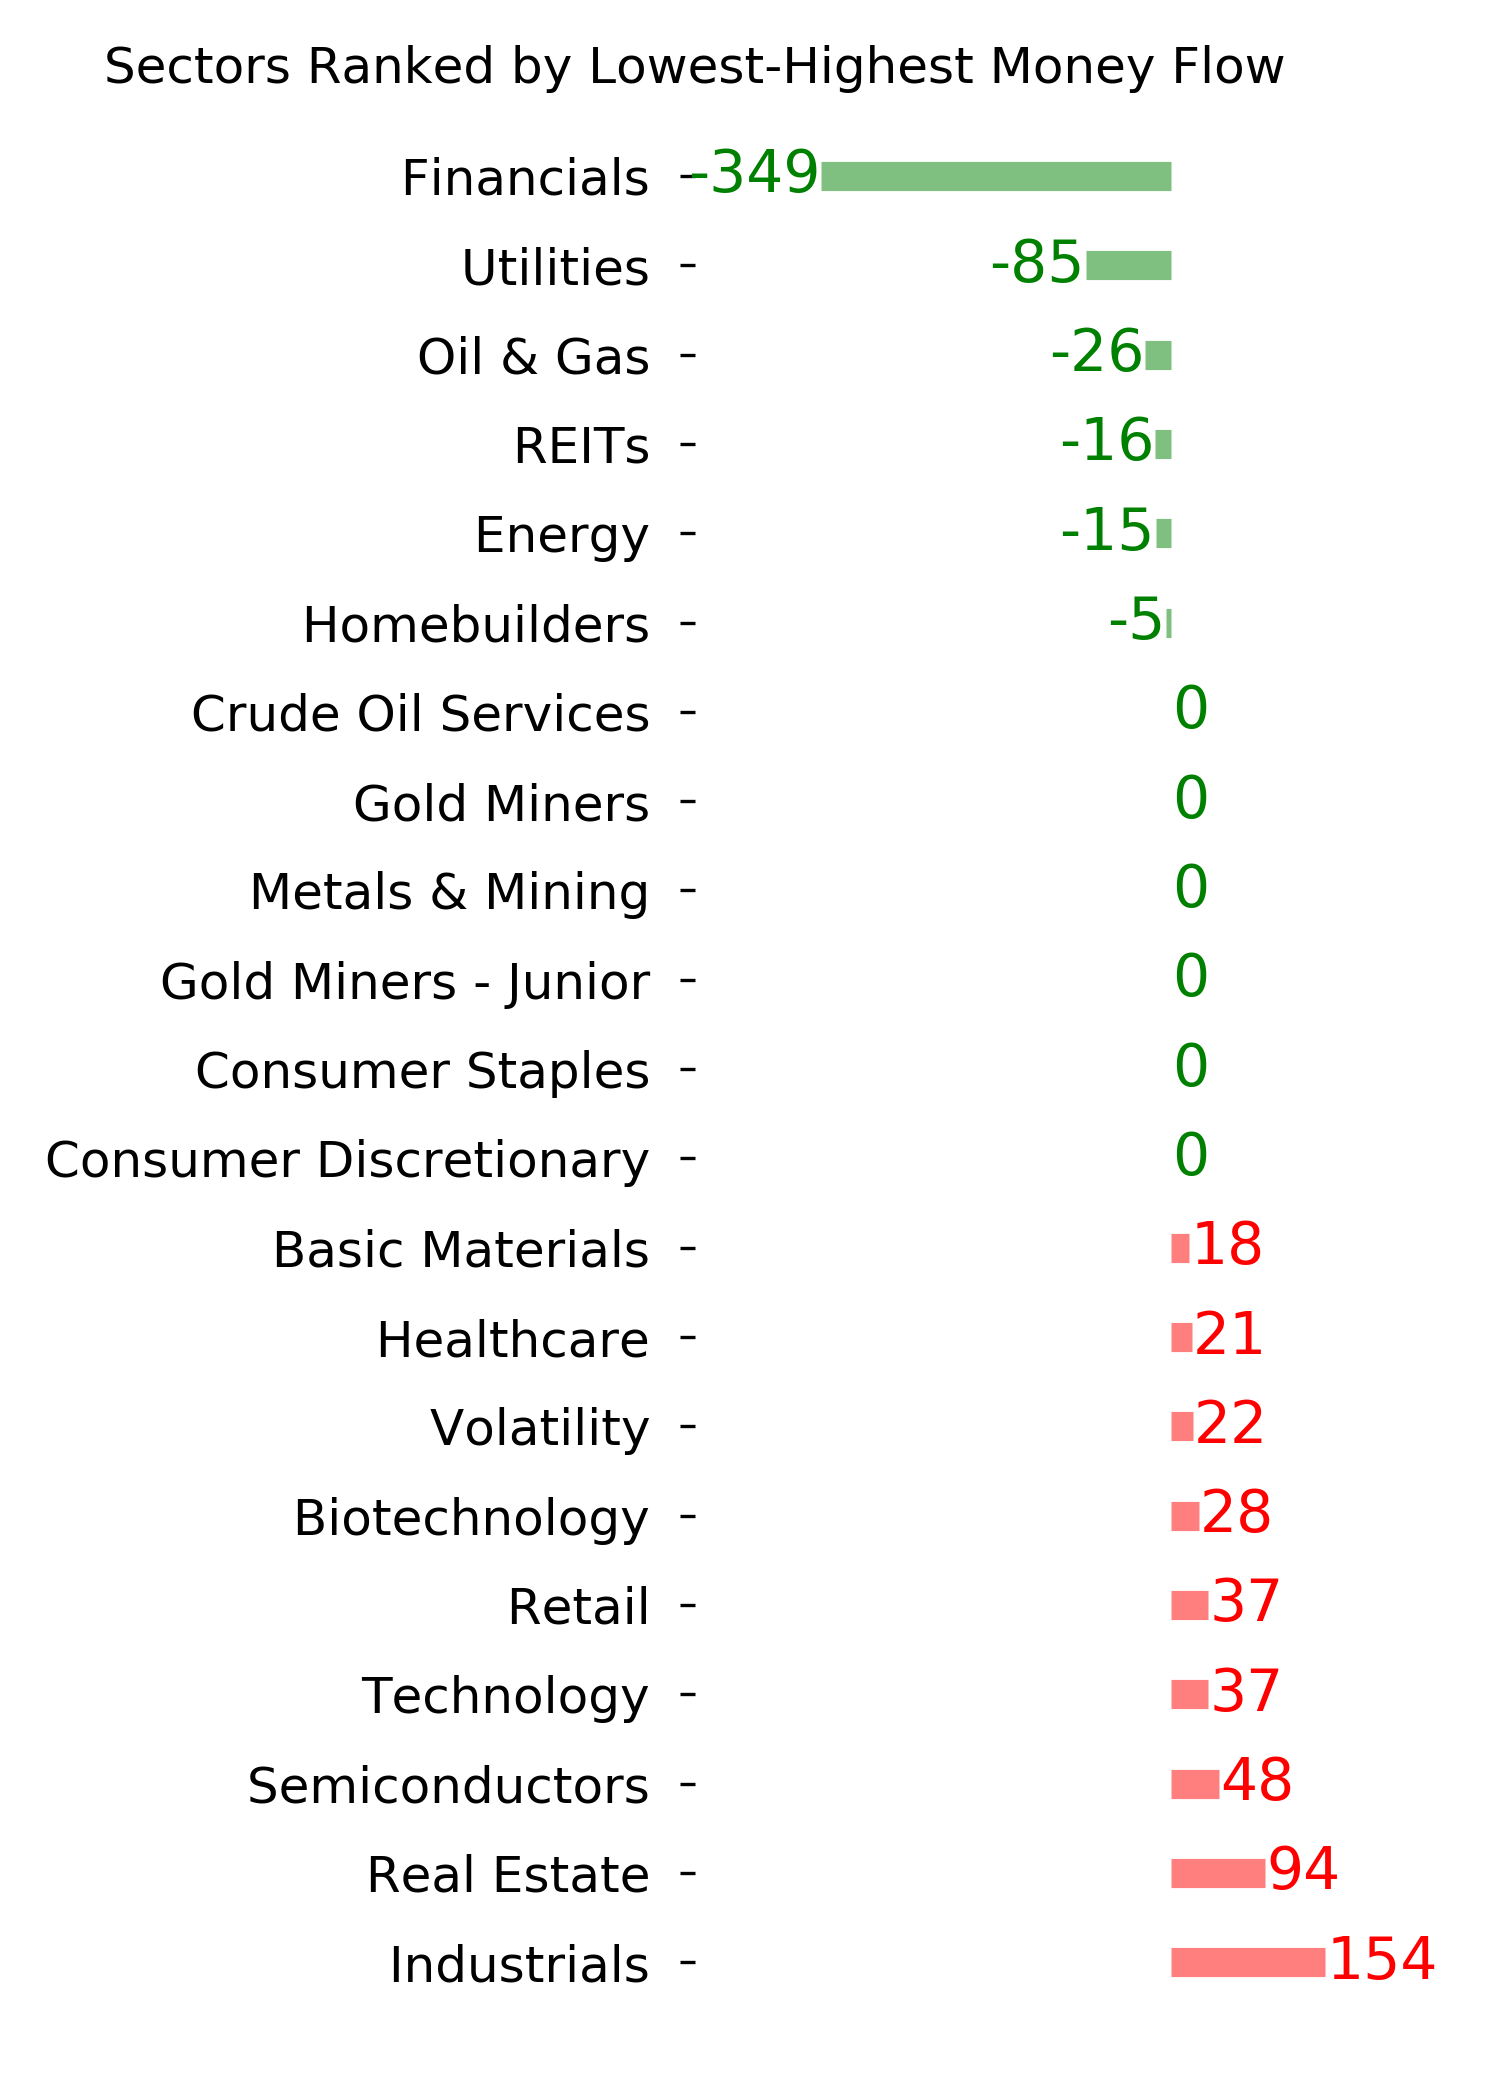
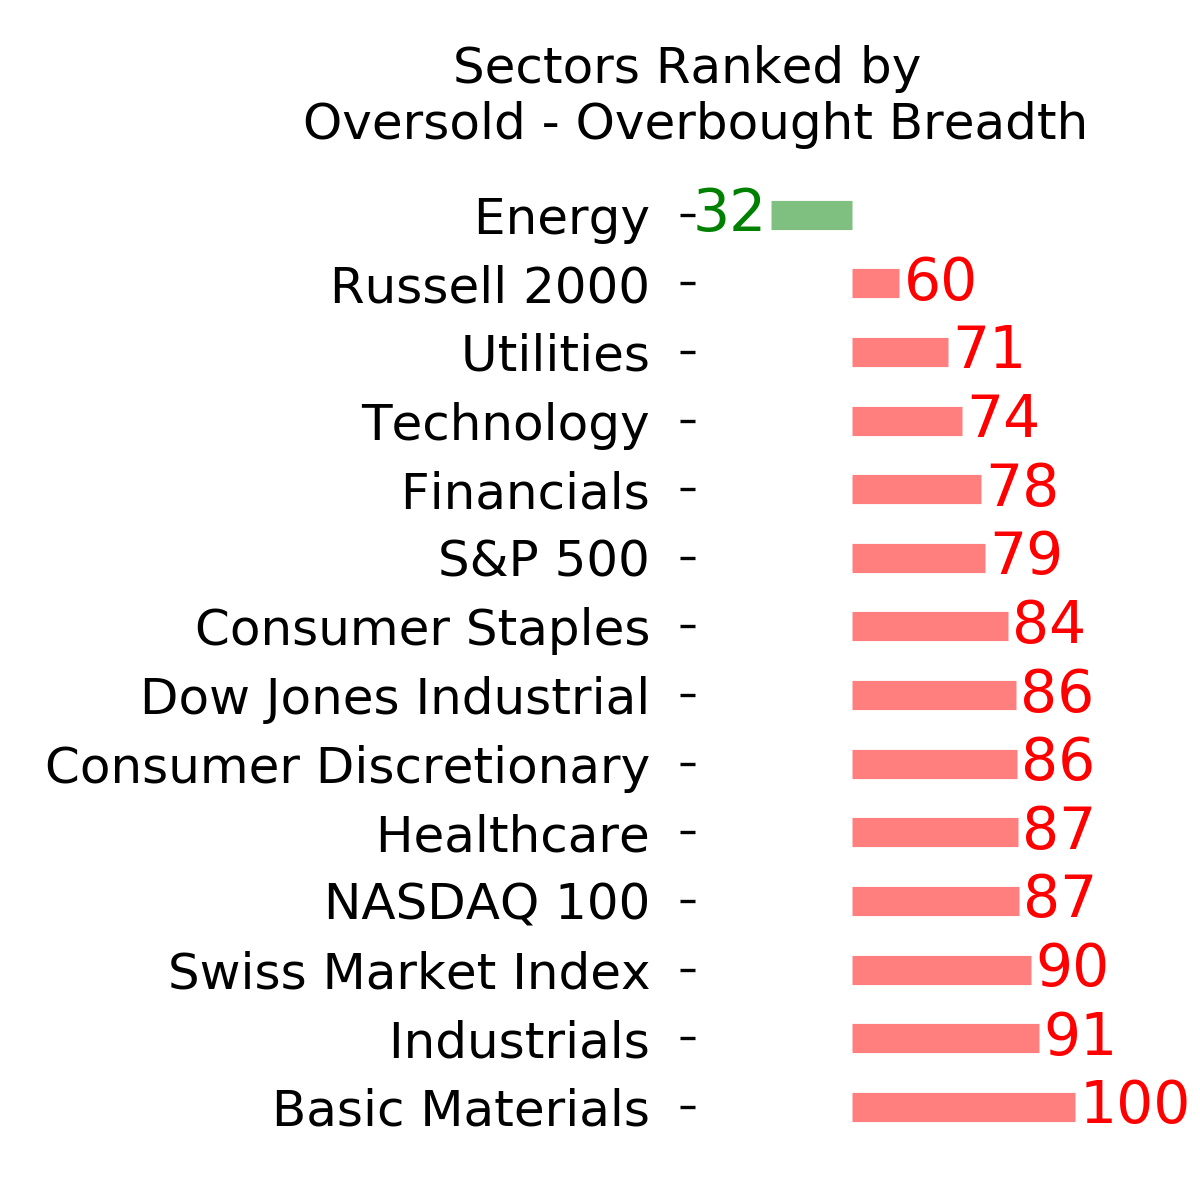
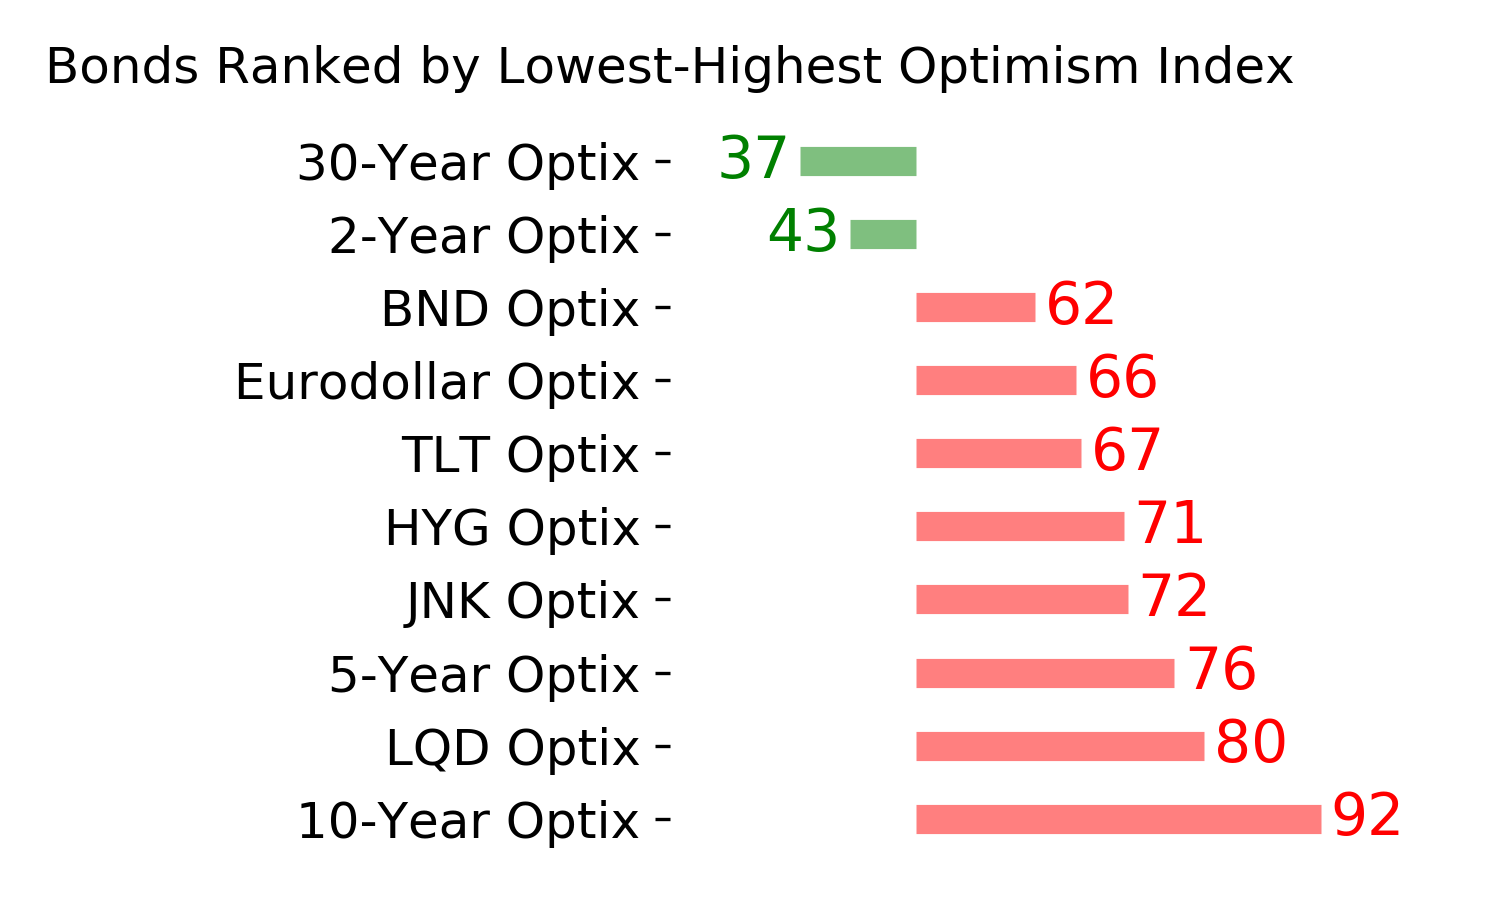
Ranks
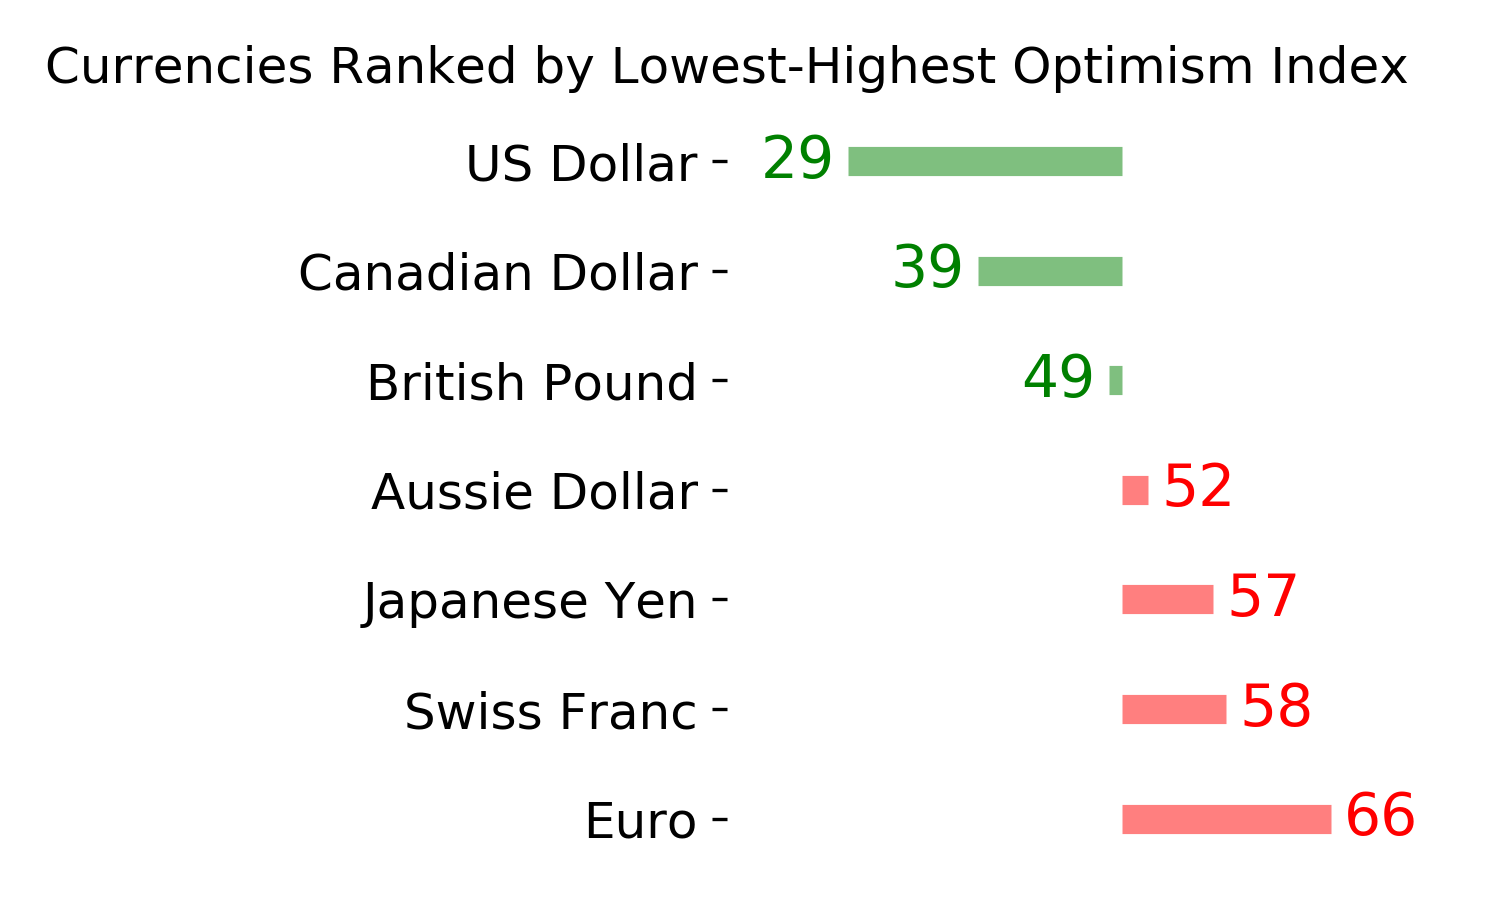
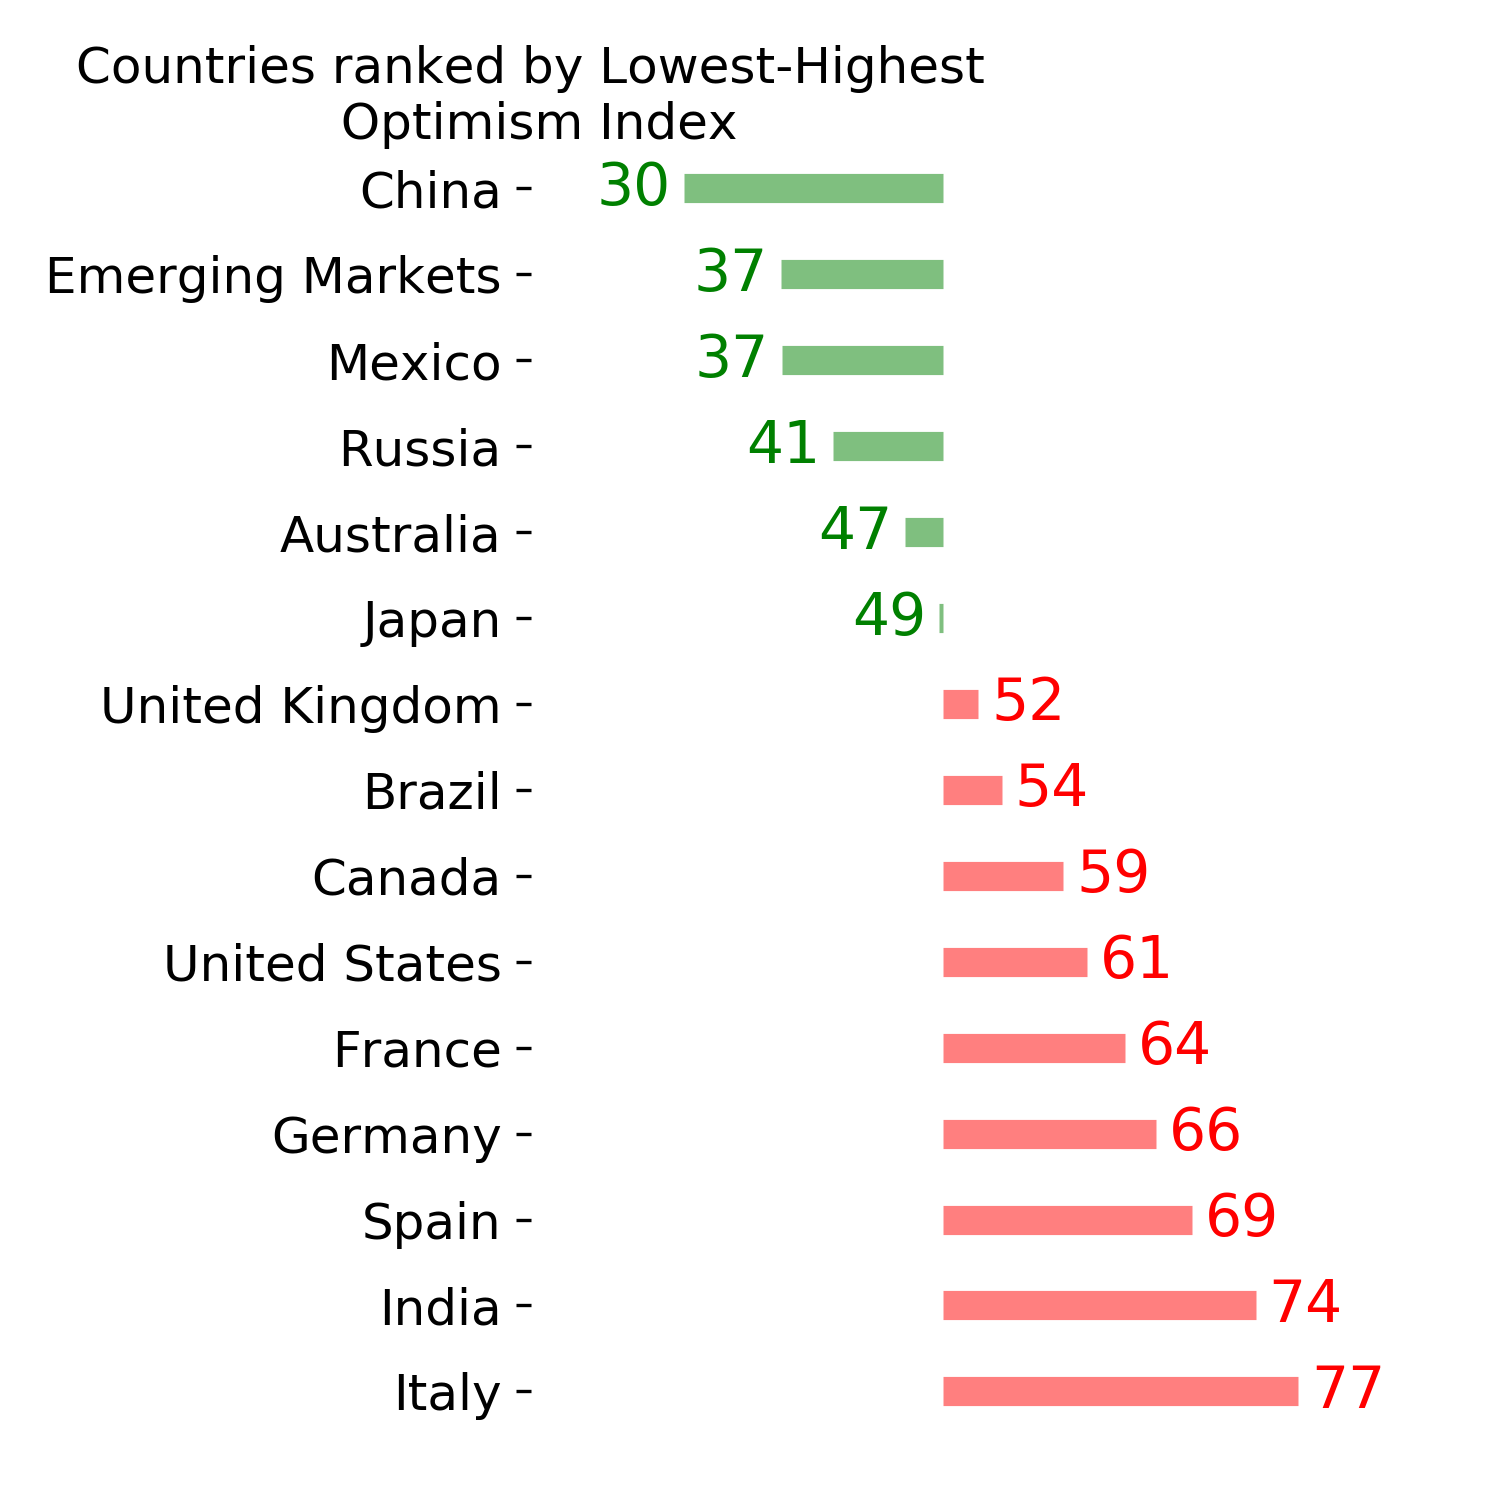
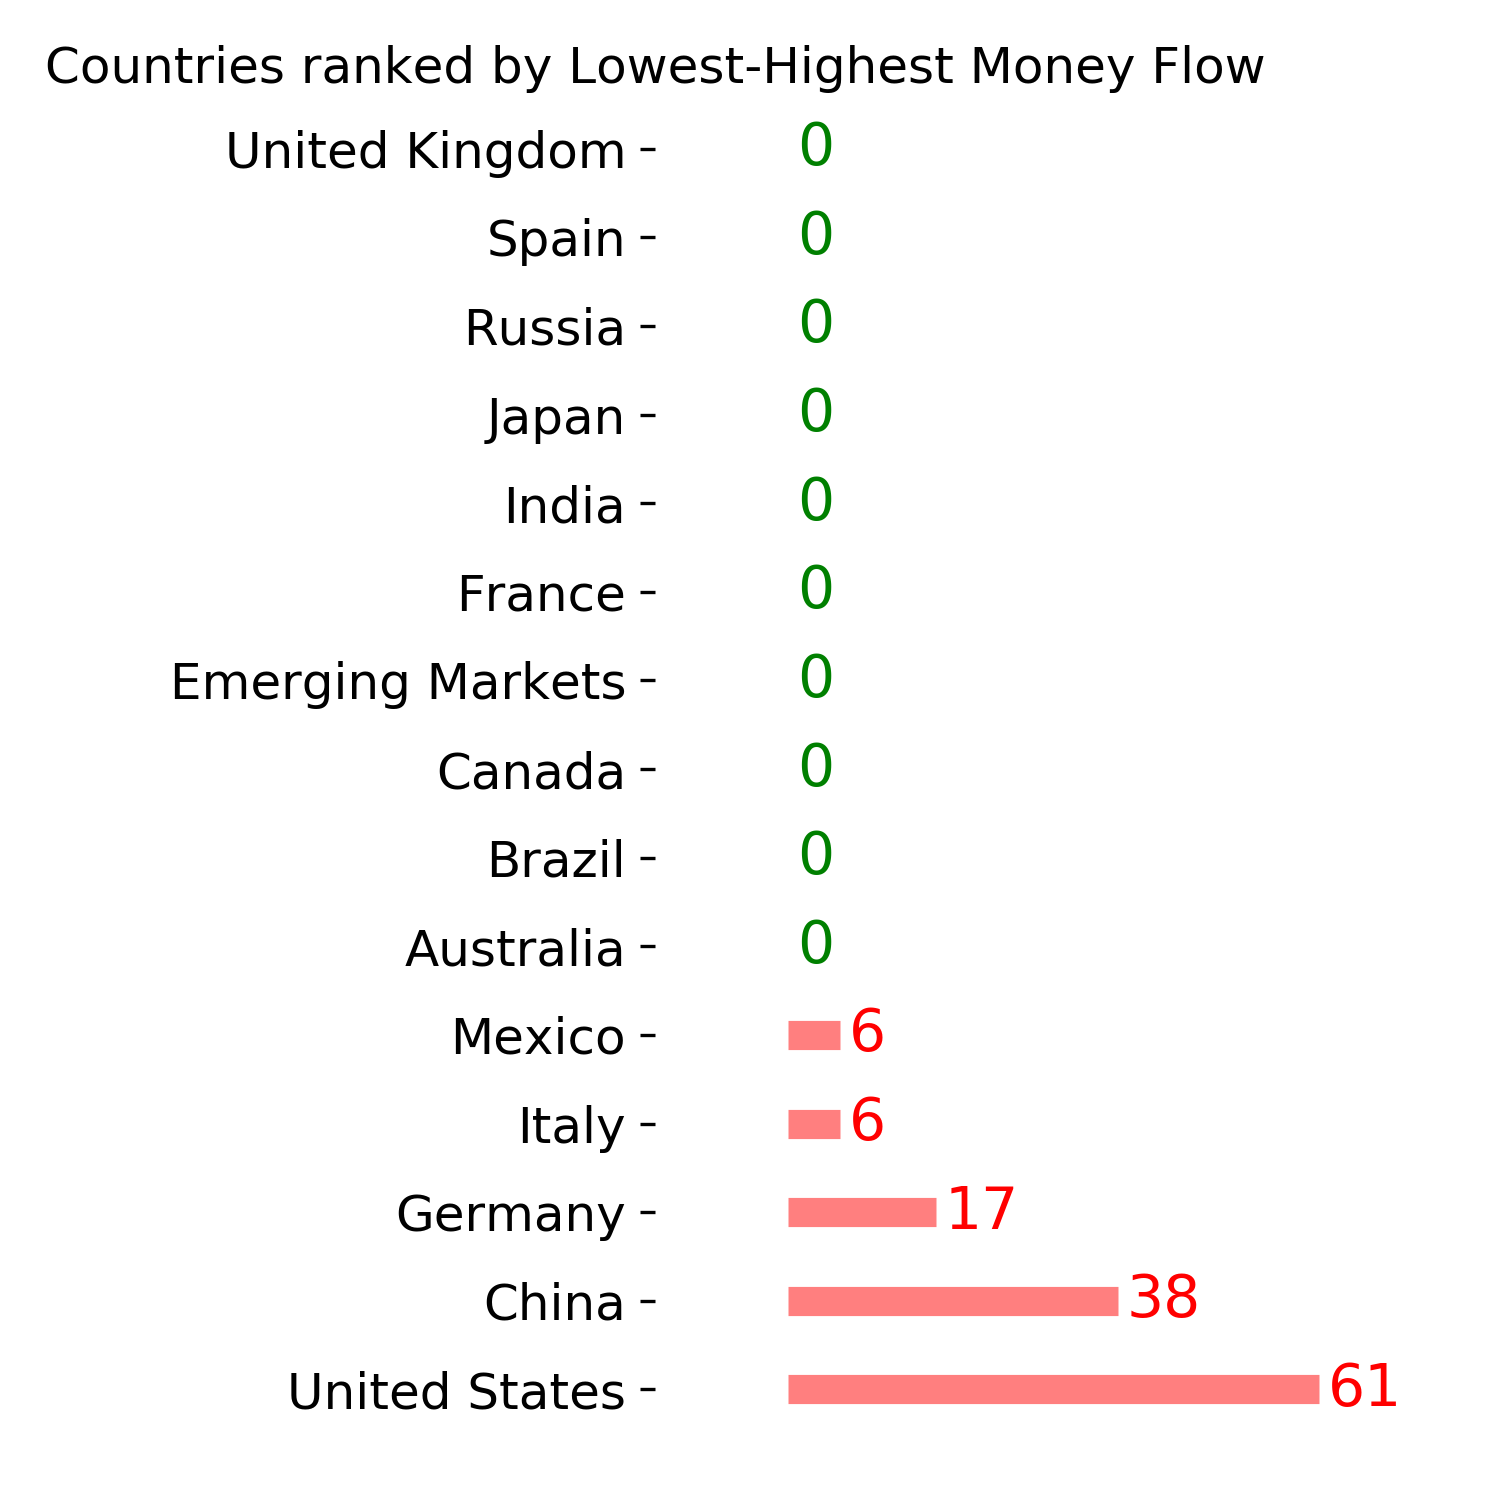
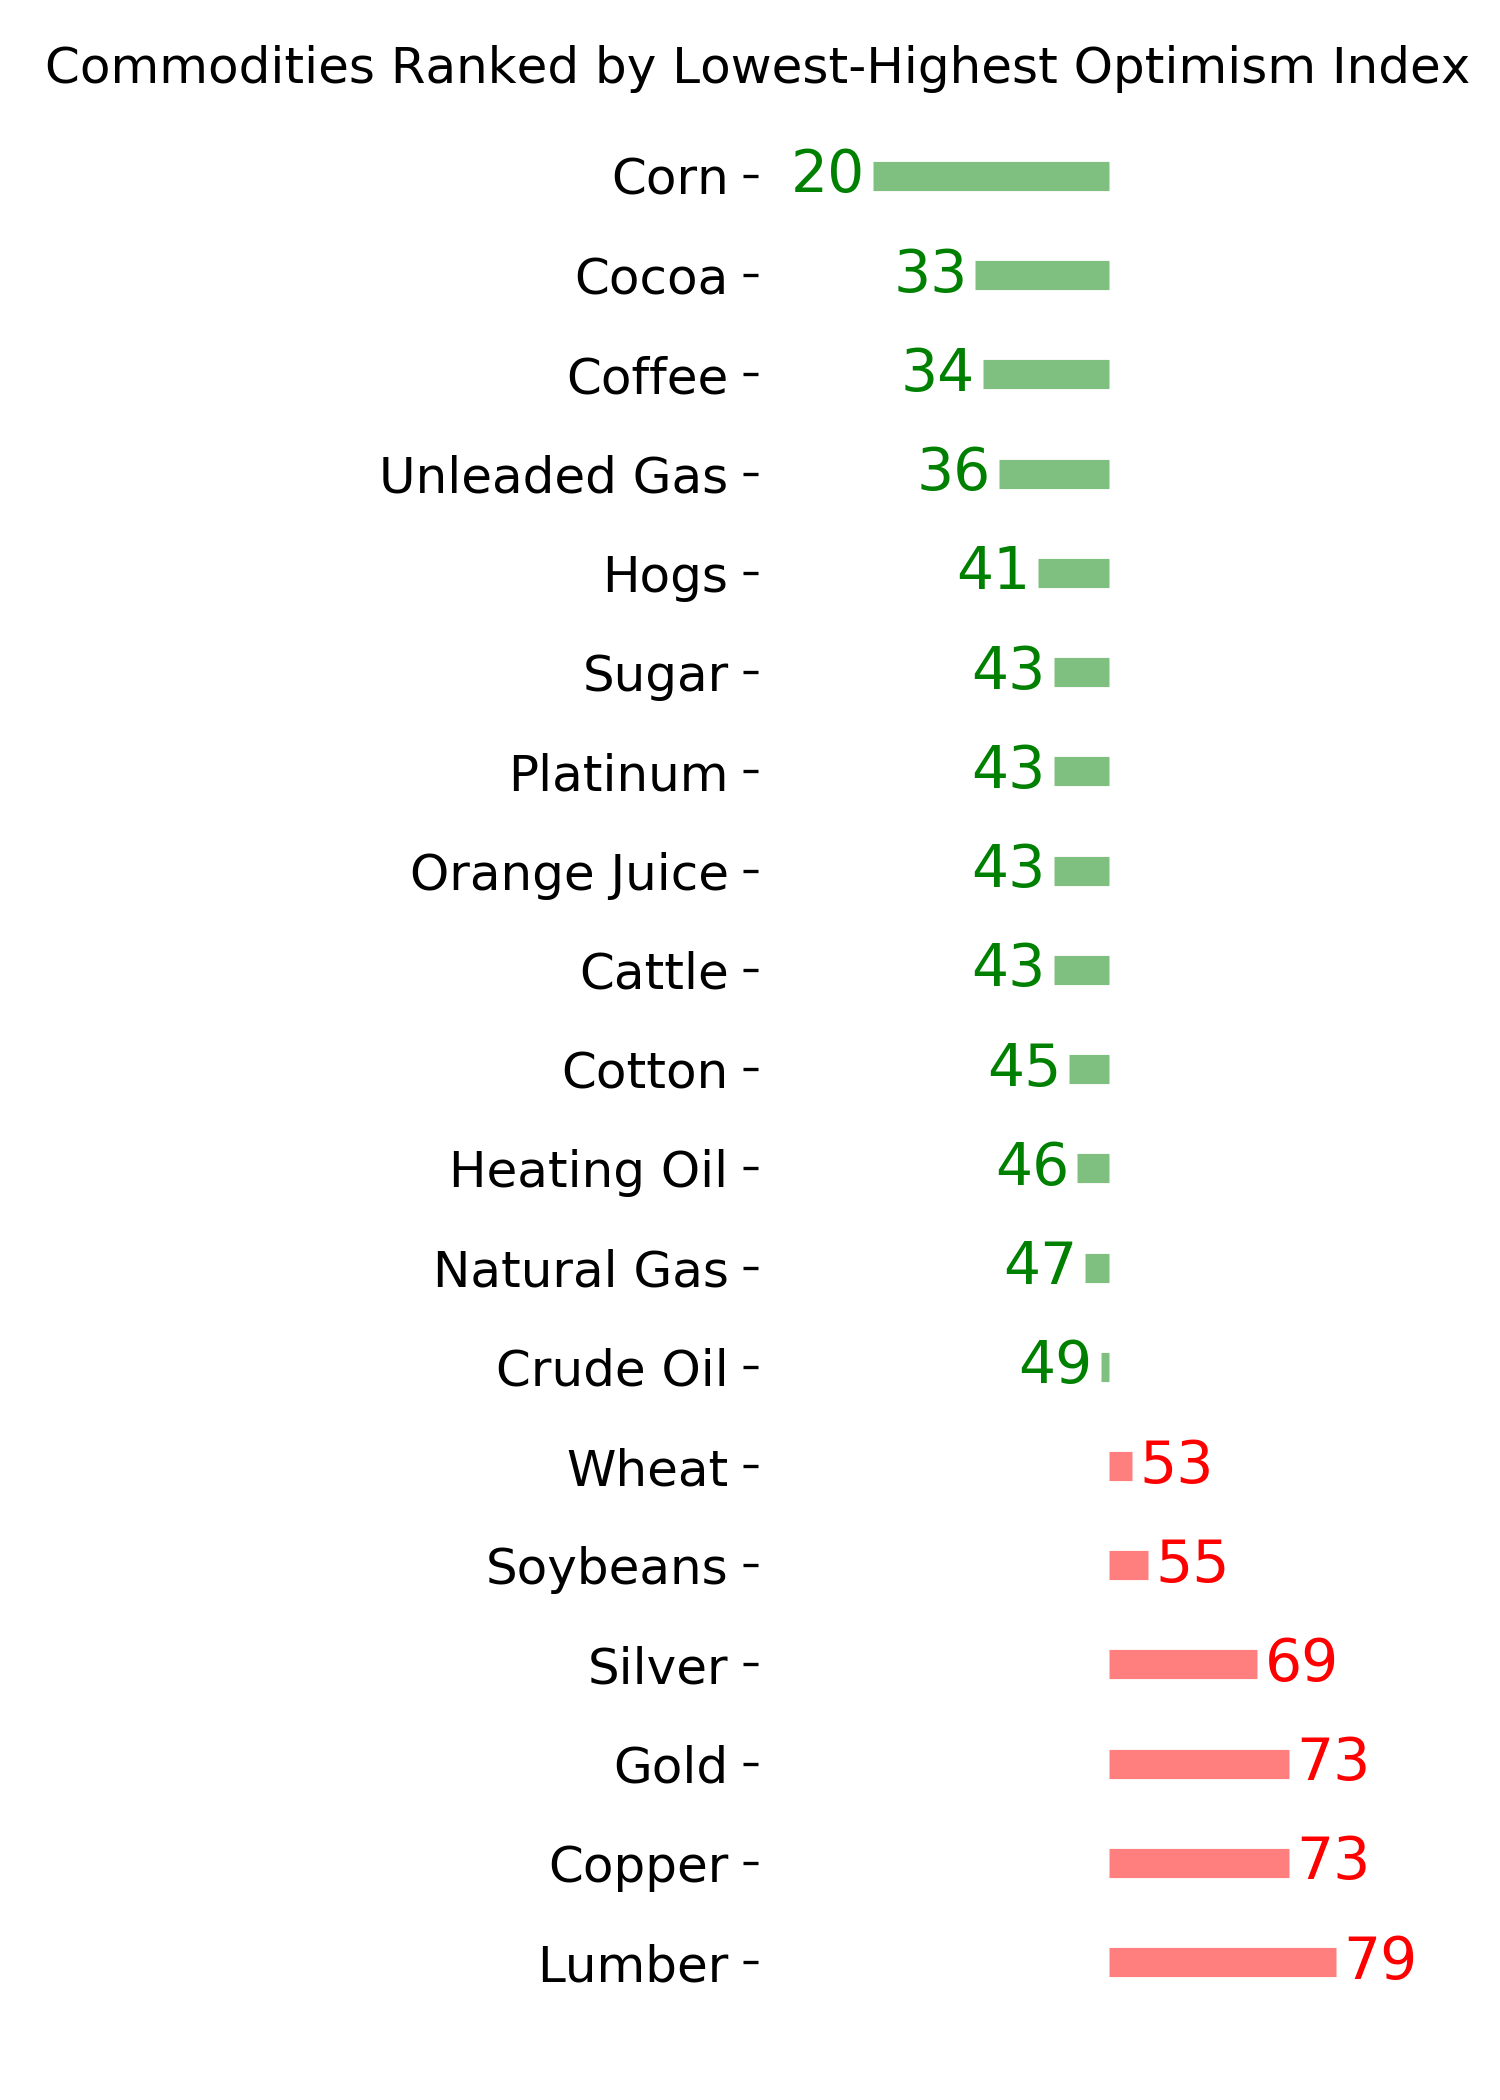
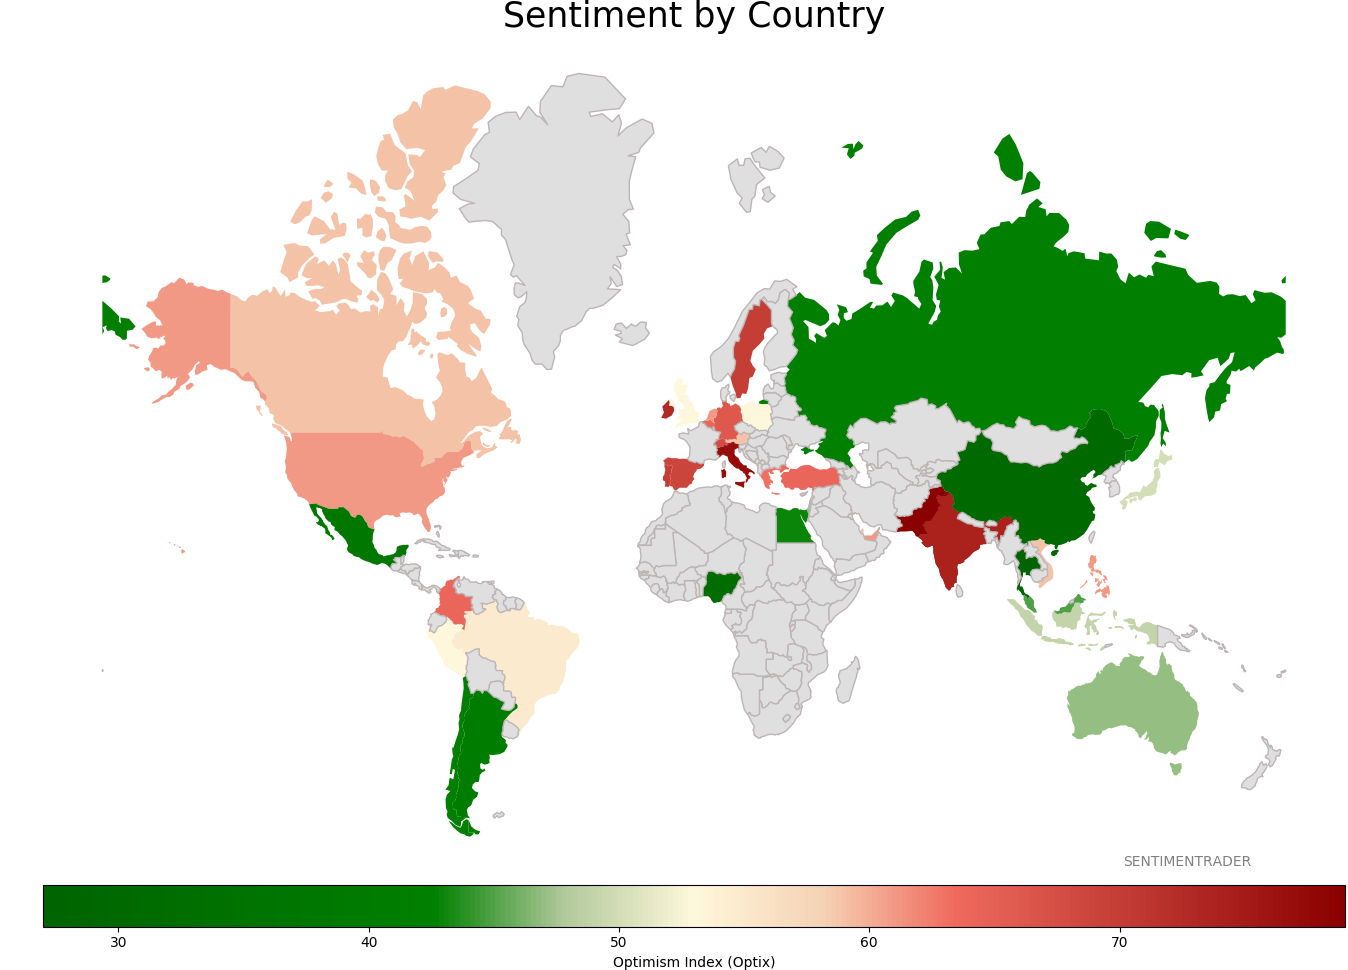
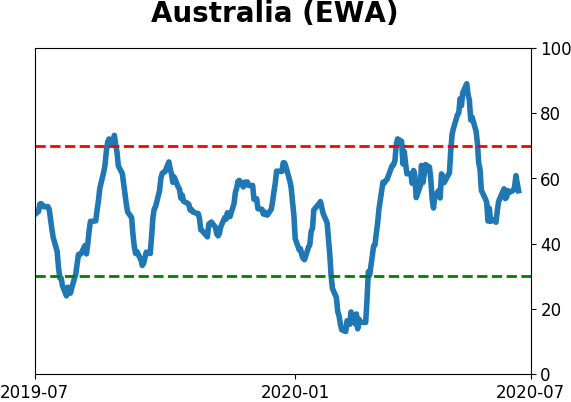
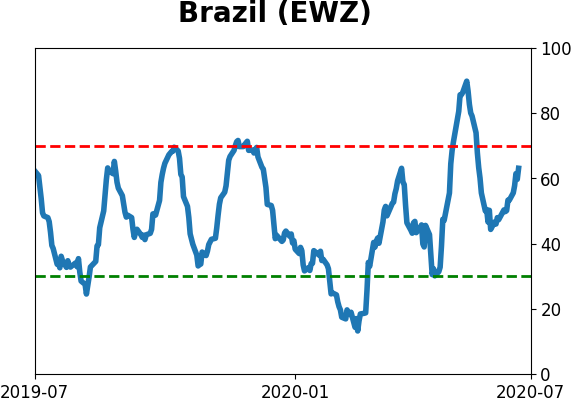
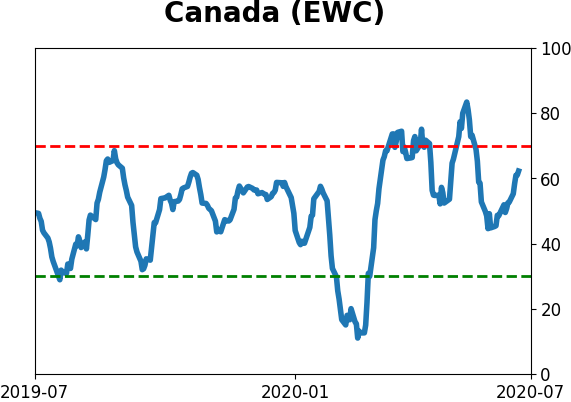
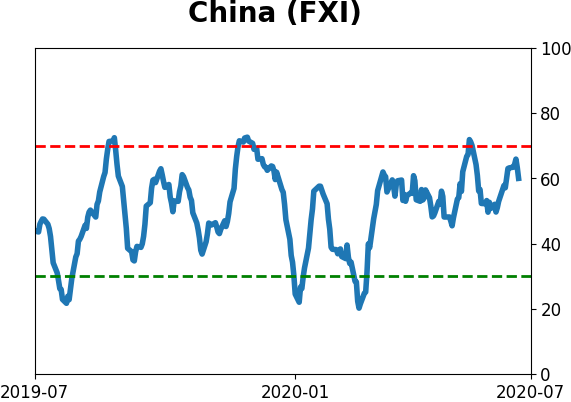
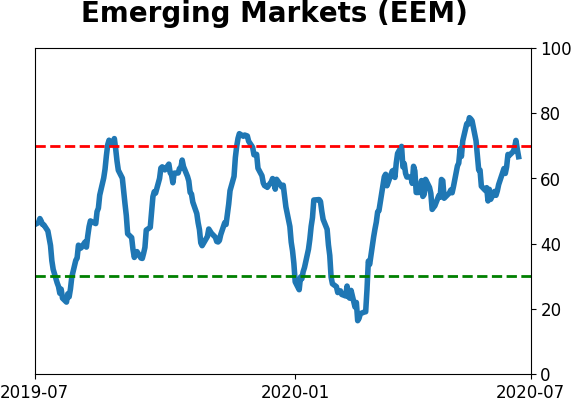
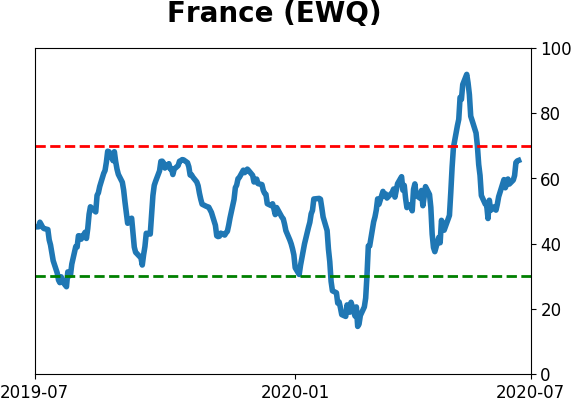
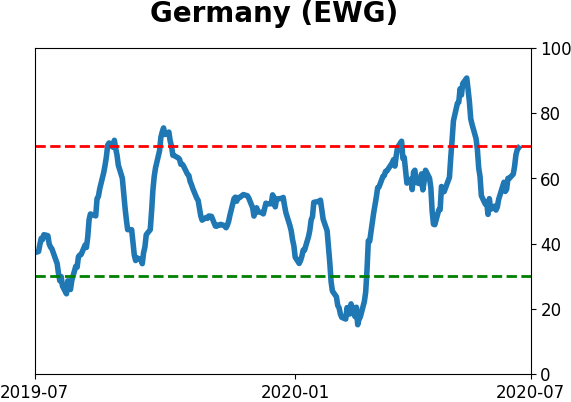
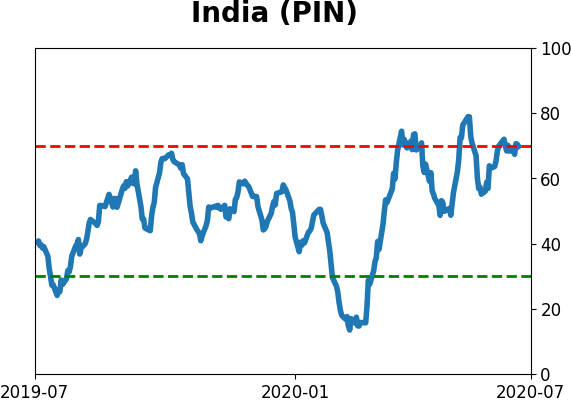
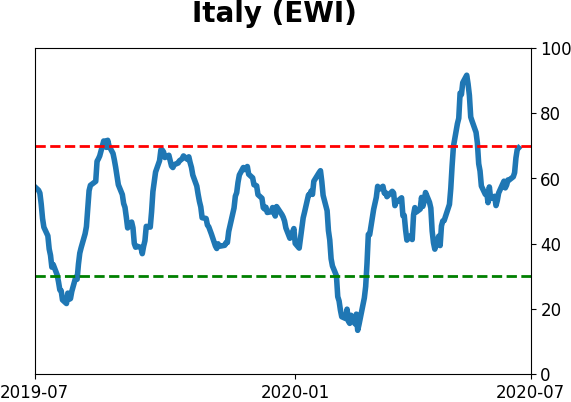
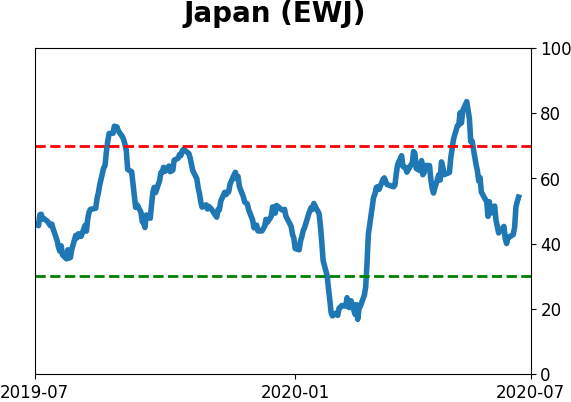
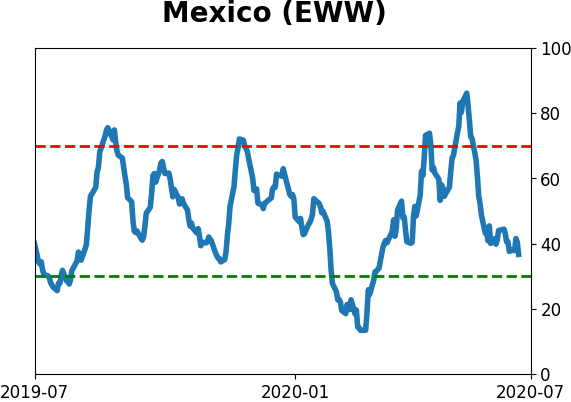
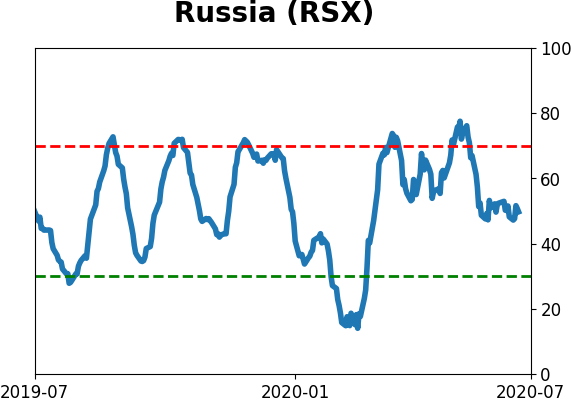
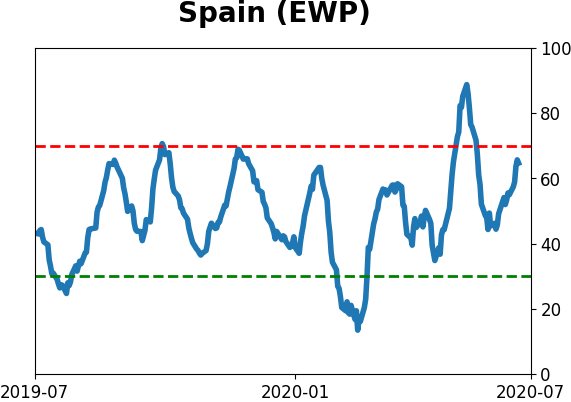
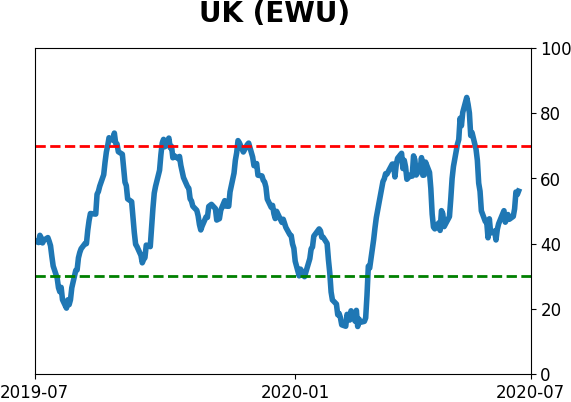
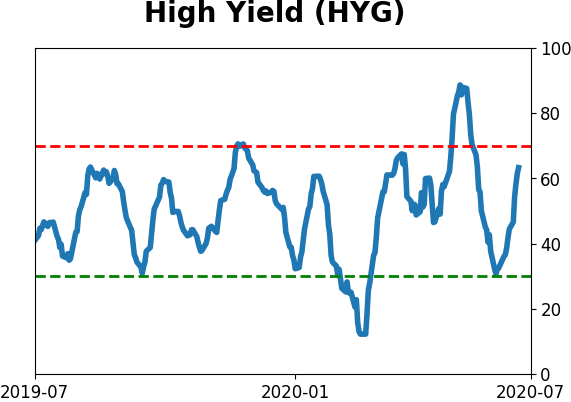
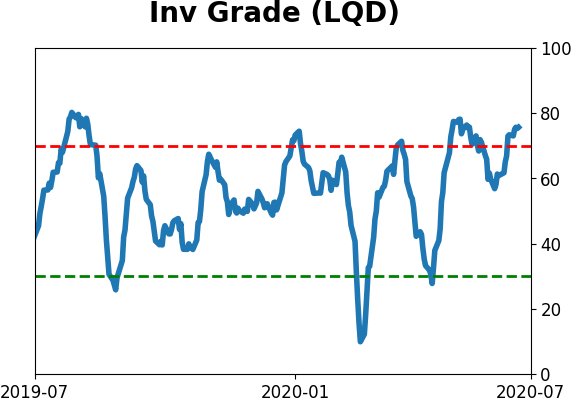
Sentiment Around The World
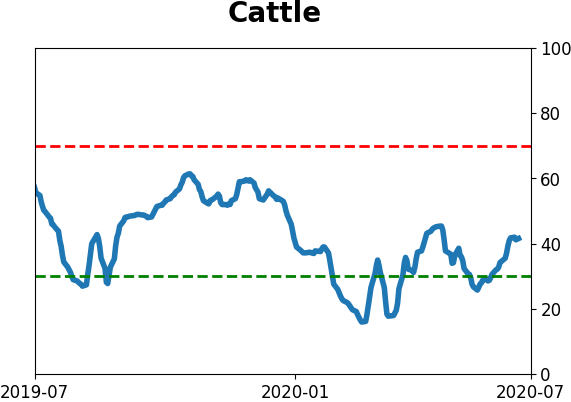
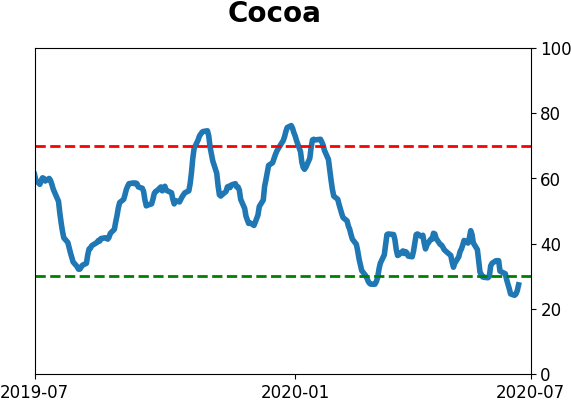
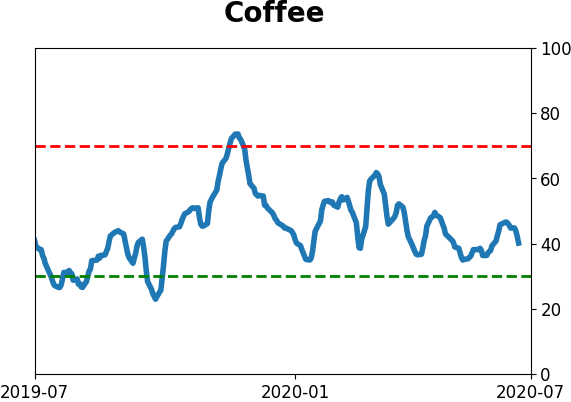
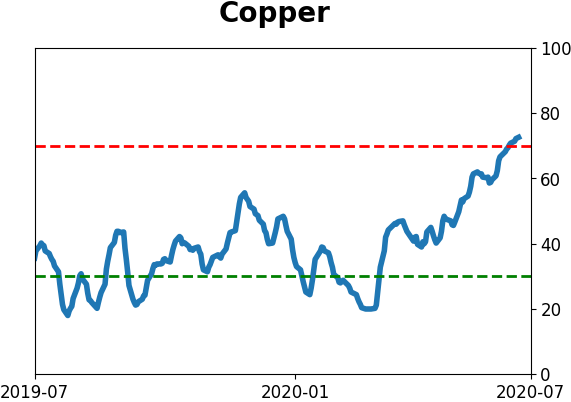
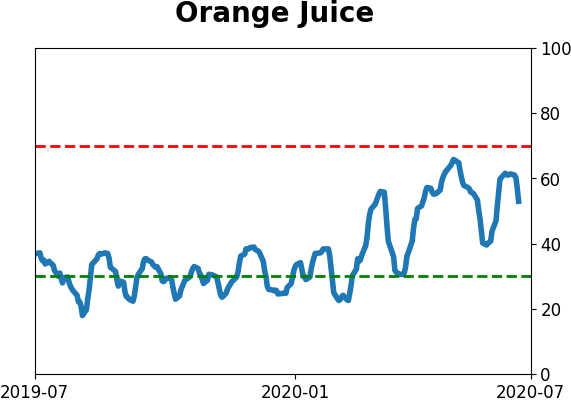
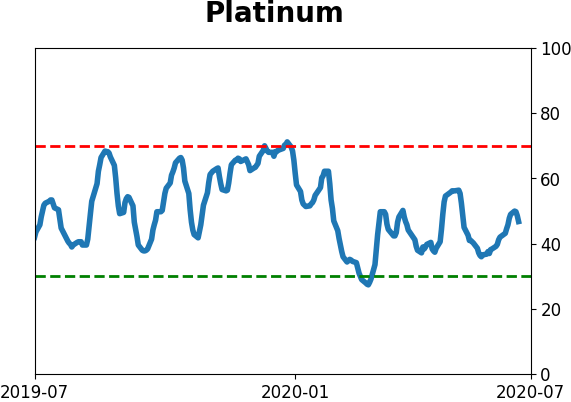
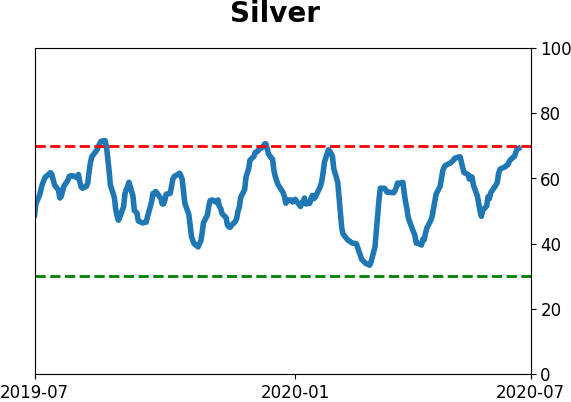
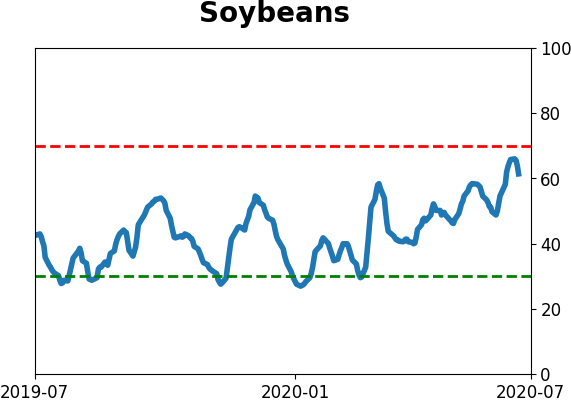
Optimism Index Thumbnails
|
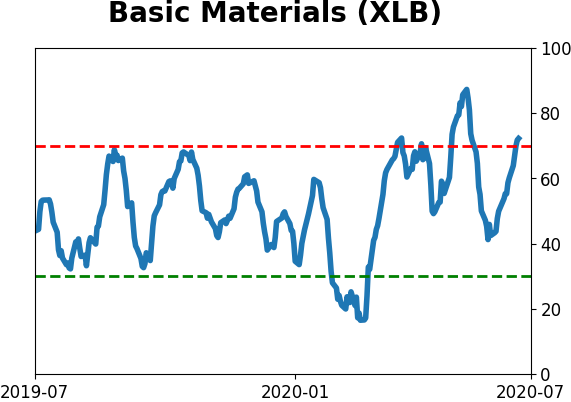
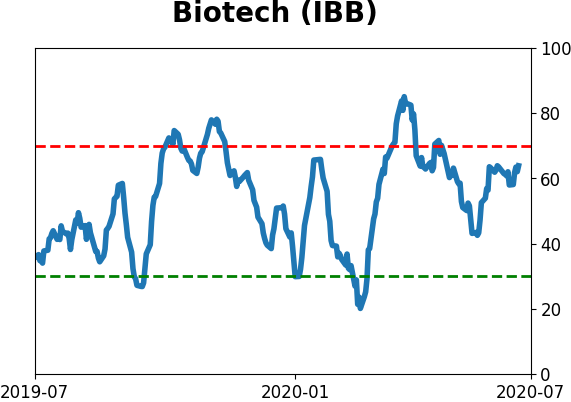
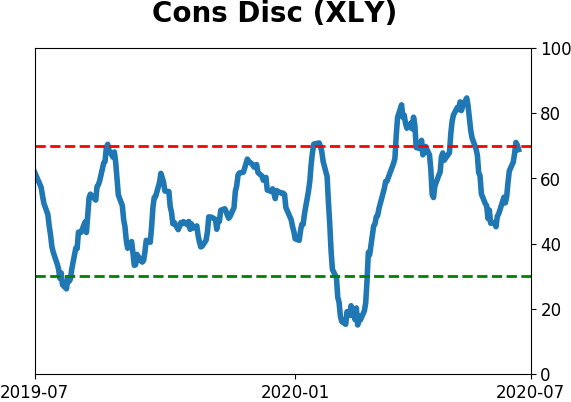
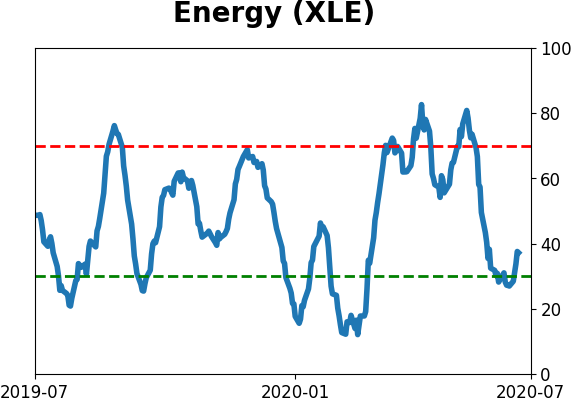
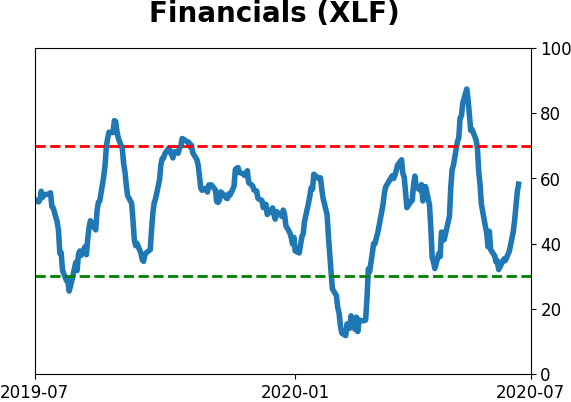
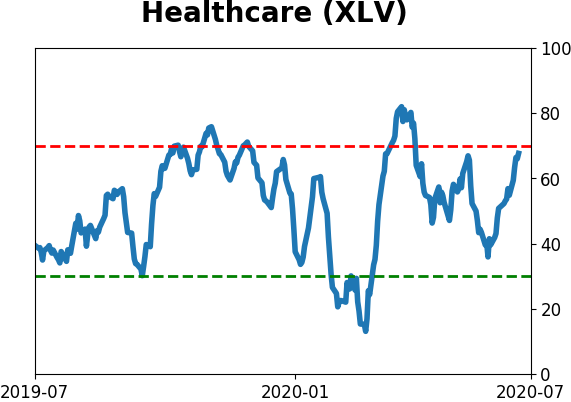
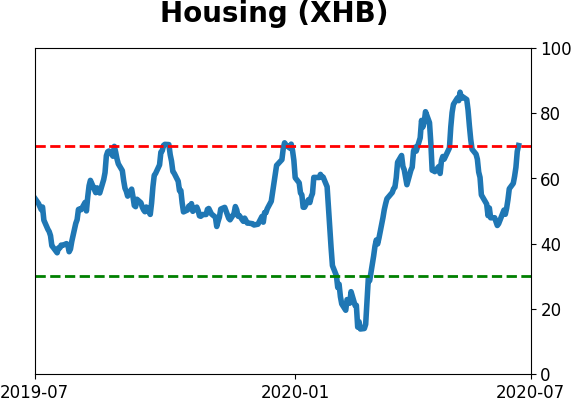
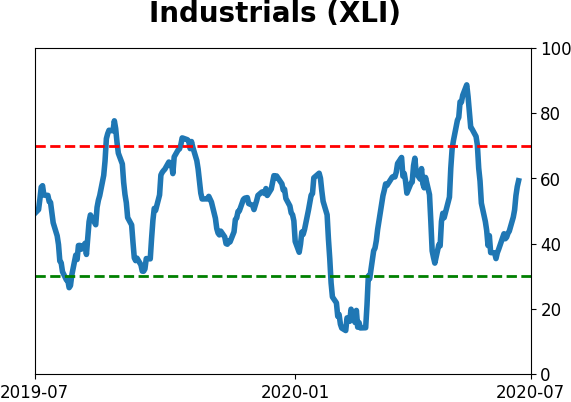
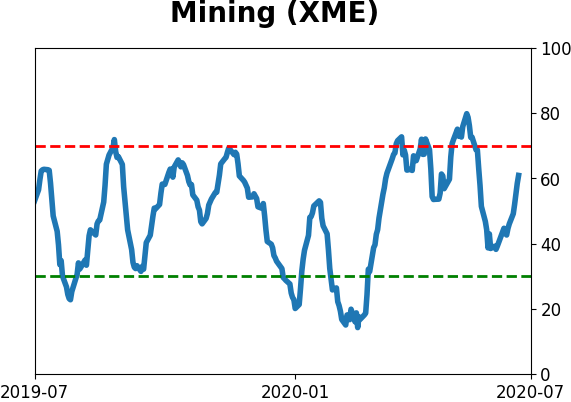
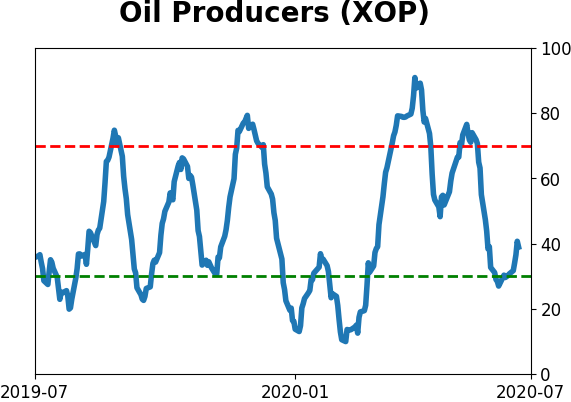
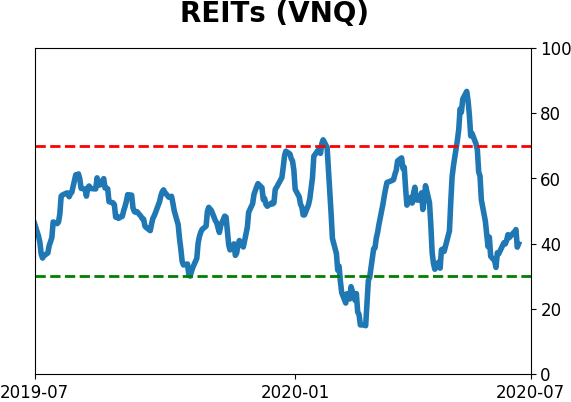
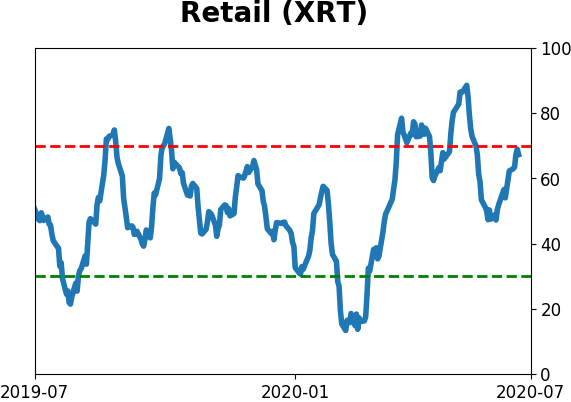
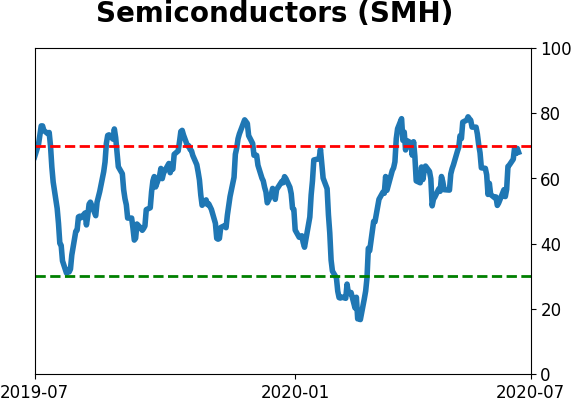
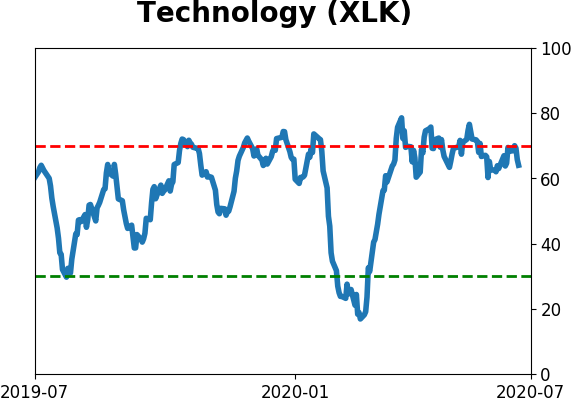
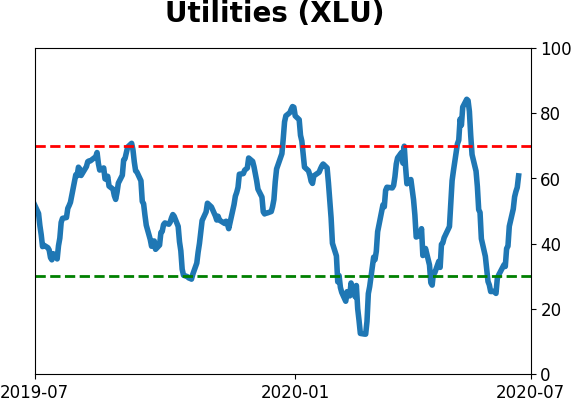
Sector ETF's - 10-Day Moving Average
|
|
|
Country ETF's - 10-Day Moving Average
|
|
|
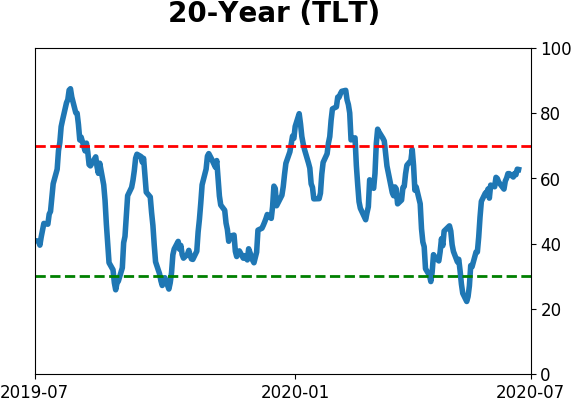
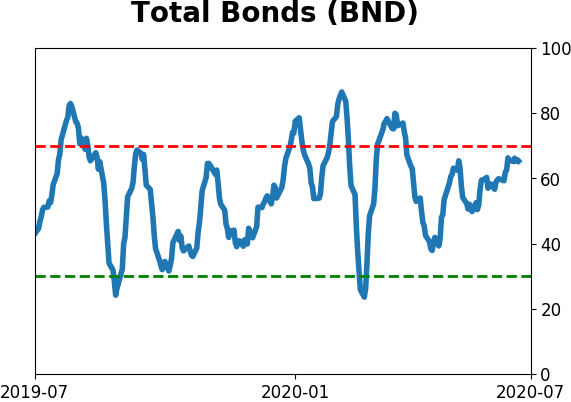
Bond ETF's - 10-Day Moving Average
|
|
|
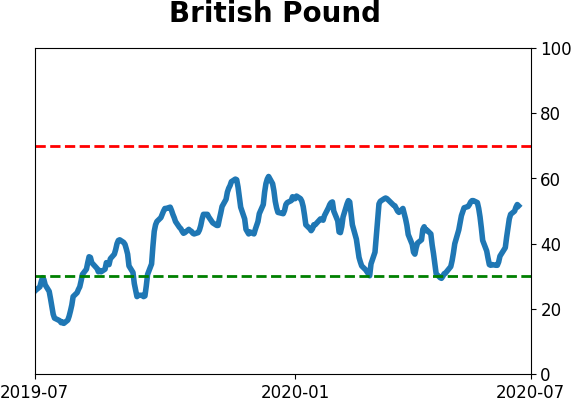
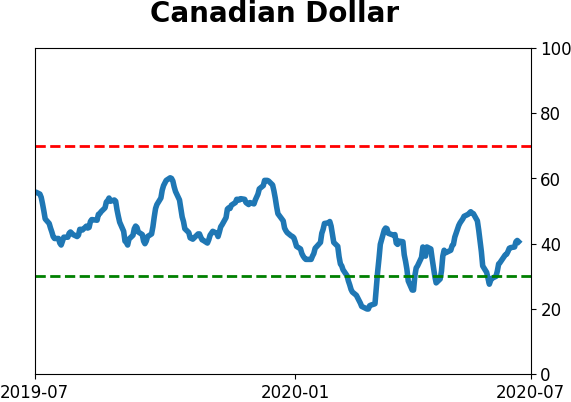
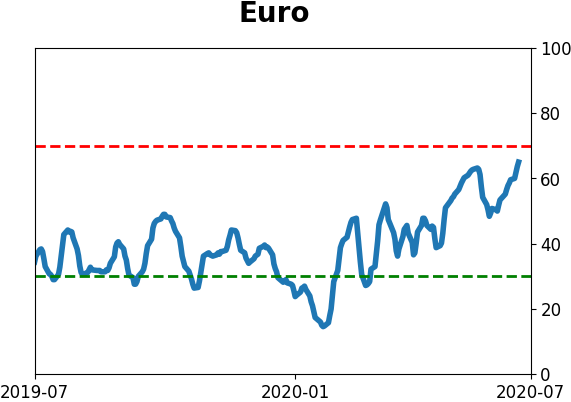
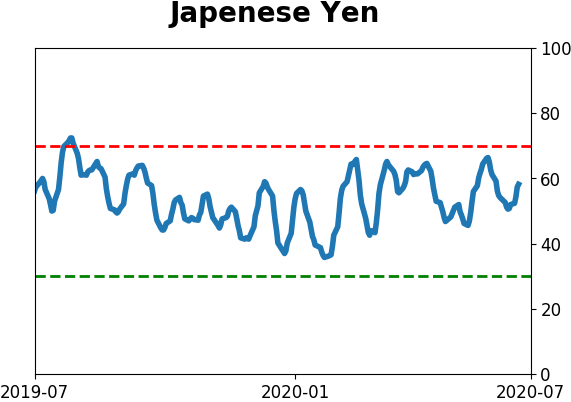
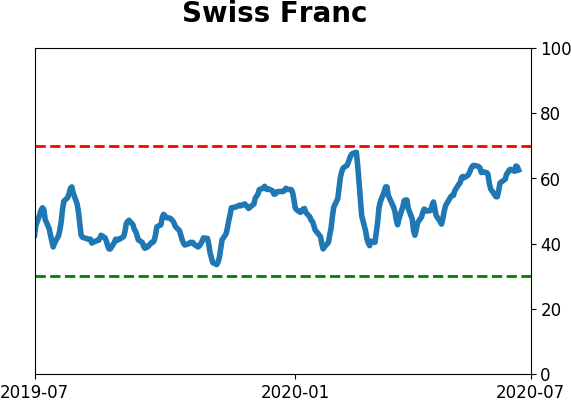
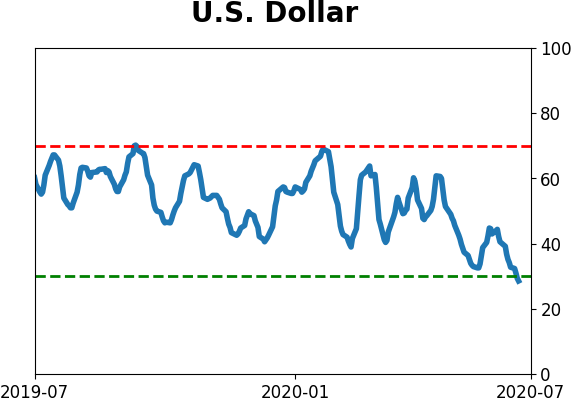
Currency ETF's - 5-Day Moving Average
|
|
|
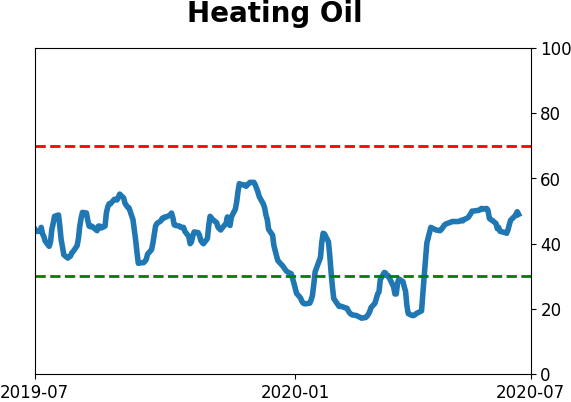
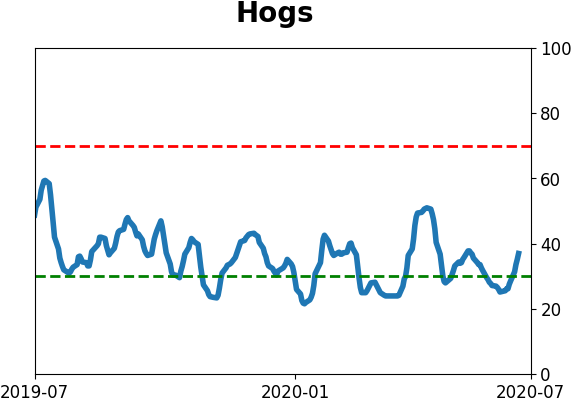
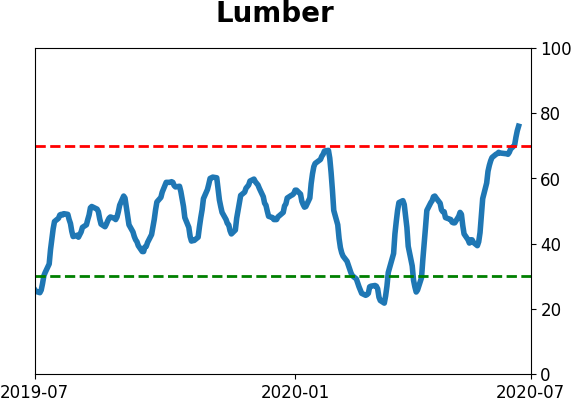
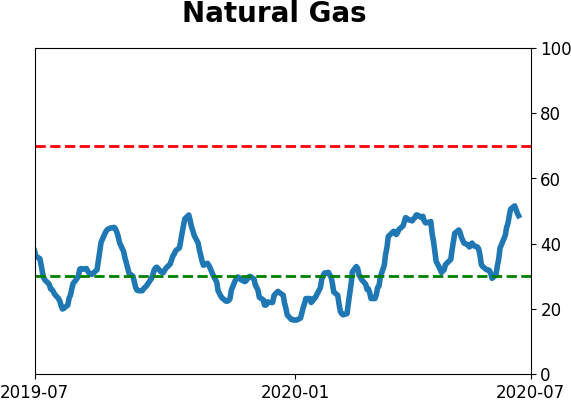
Commodity ETF's - 5-Day Moving Average
|
|