Headlines
|
|
The stock market un-splits thanks to overwhelming new lows:
A few months ago, we looked at the "split" conditions in stocks, with many securities hitting 52-week highs at the same time that many were falling to 52-week lows. That condition has resolved, as new lows dominate once again. Given the extended nature of the unhealthy environment, there are compelling signs it sets up a long-term oversold market.
|
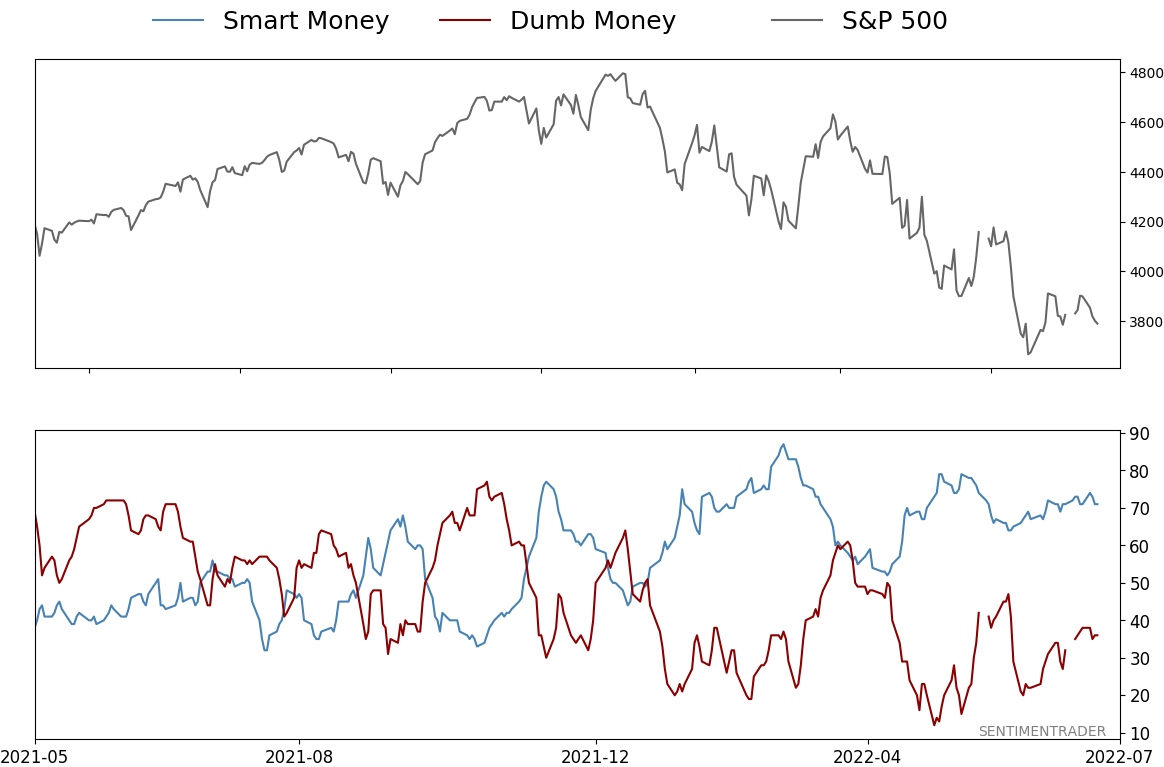
Smart / Dumb Money Confidence
|
Smart Money Confidence: 71%
Dumb Money Confidence: 36%
|
|
Risk Levels
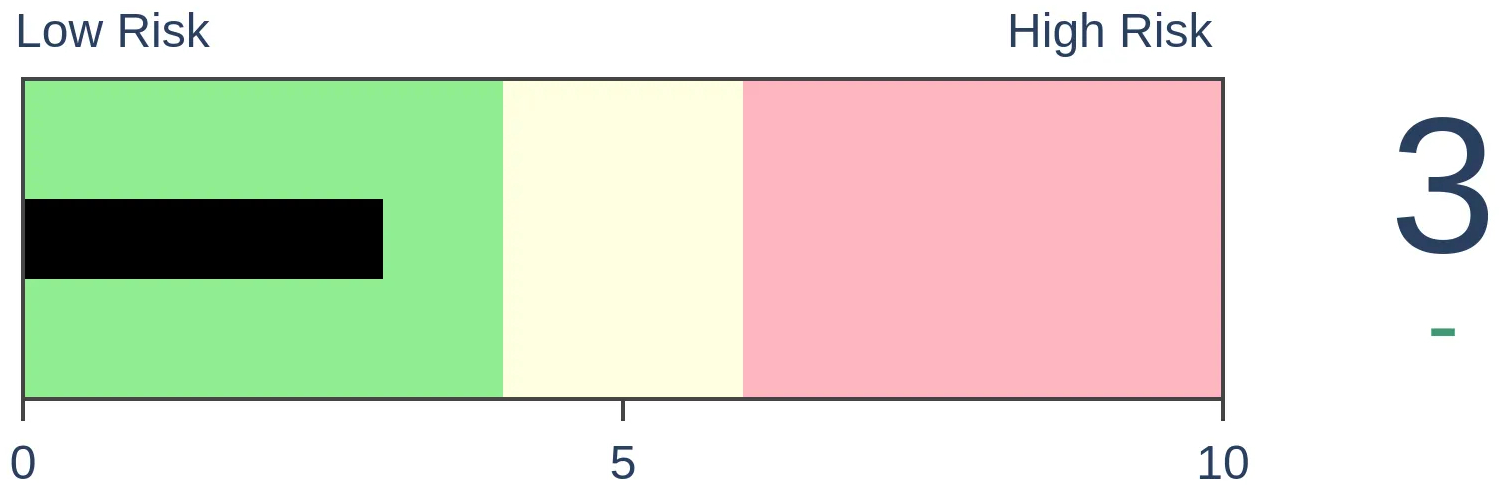
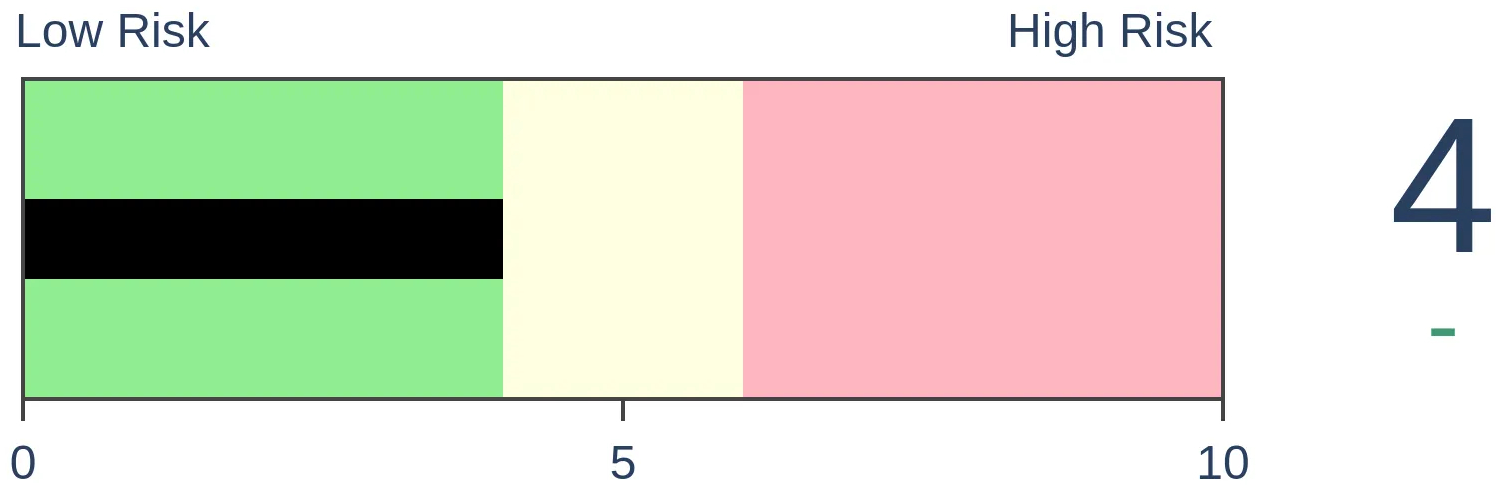
Stocks Short-Term

|
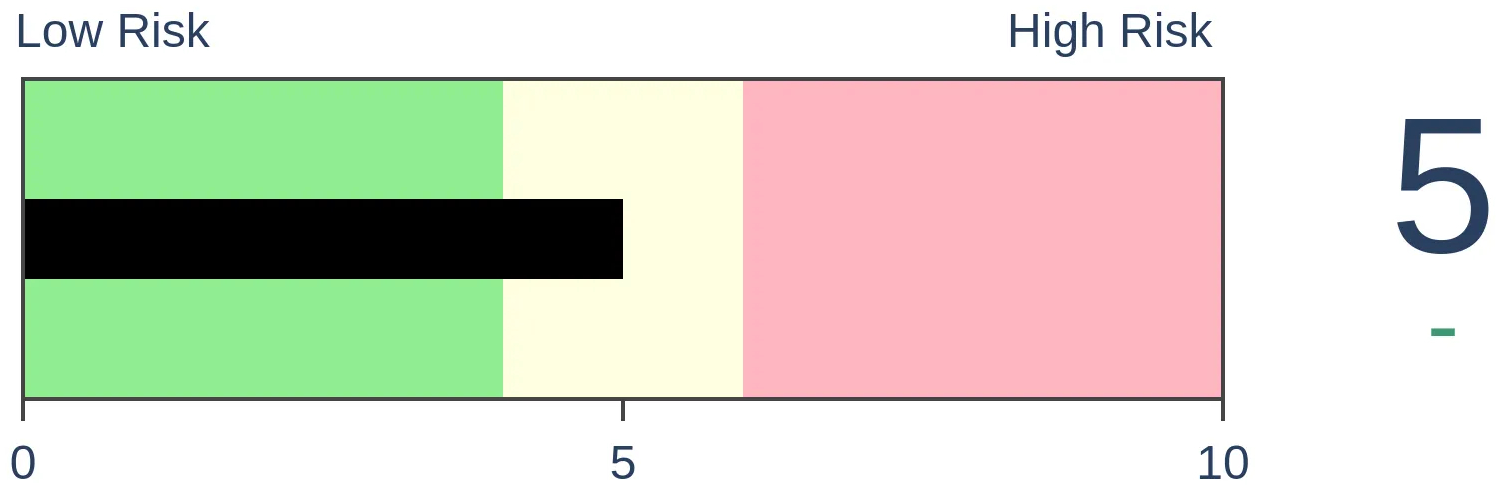
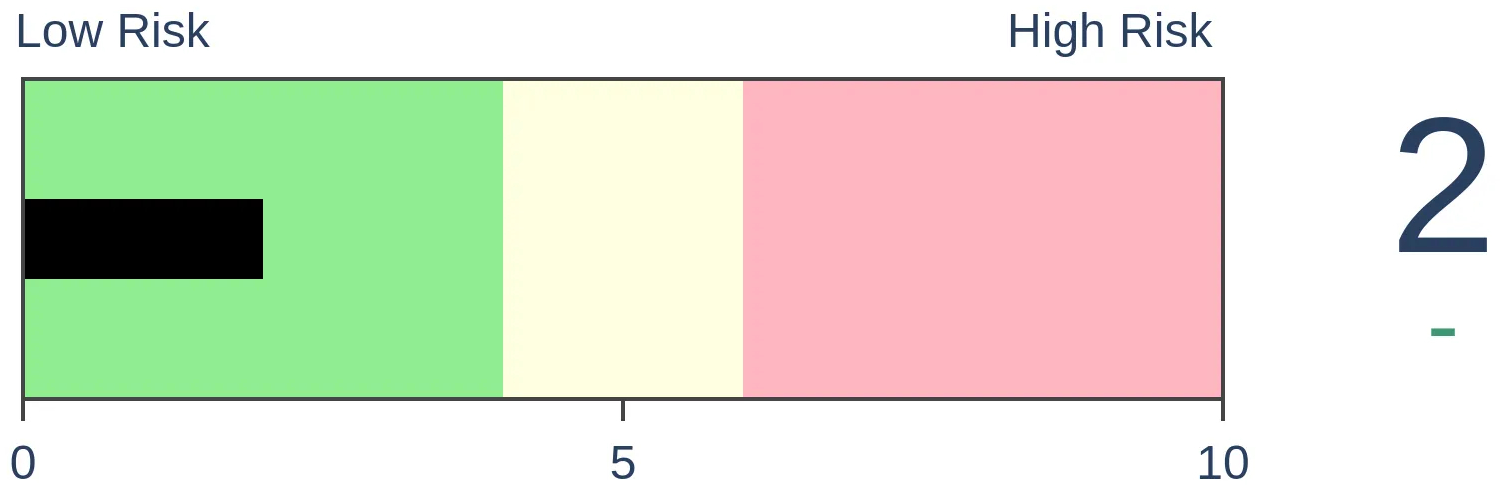
Stocks Medium-Term
|
|
Bonds
|
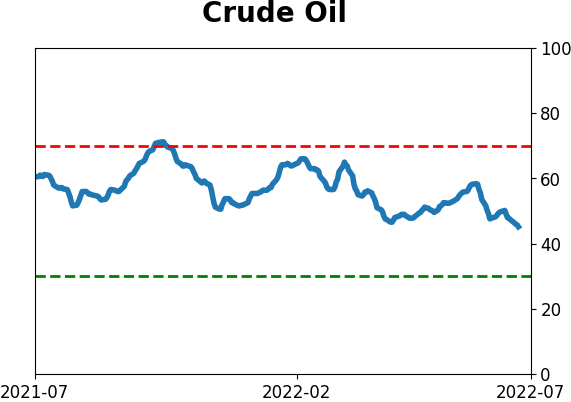
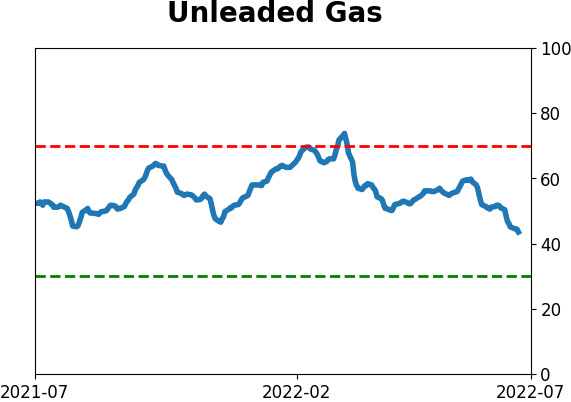
Crude Oil
|
|
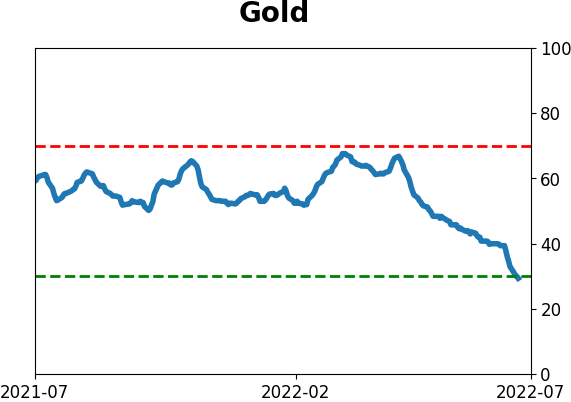
Gold
|
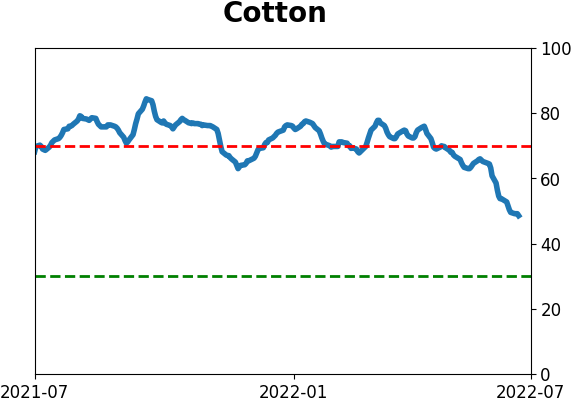
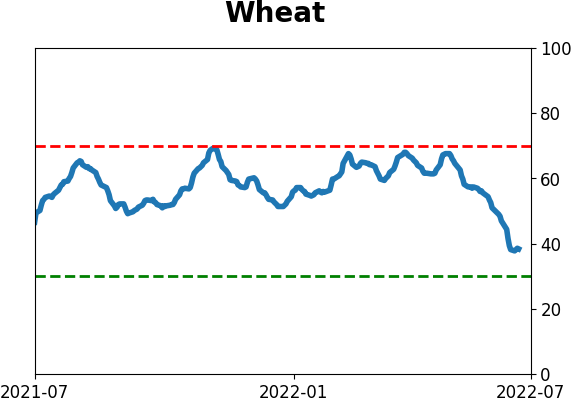
Agriculture

|
|
Research
By Jason Goepfert
BOTTOM LINE
A few months ago, we looked at the "split" conditions in stocks, with many securities hitting 52-week highs at the same time that many were falling to 52-week lows. That condition has resolved, as new lows dominate once again. Given the extended nature of the unhealthy environment, there are compelling signs it sets up a long-term oversold market.
FORECAST / TIMEFRAME
None
|
Key points:
- Stocks have gone more than six months without any big surge in 52-week highs versus 52-week lows
- The 100-day averages of related measures are near the most-stretched levels in 20 or more years
- A renewed dominance of new lows after a split market has suggested deeply oversold conditions
A long (long, long) time without a blip in new highs
Even when stocks do well, they have a long way to go to get healthy. By the looks of this week, it's going to be a long slog indeed.
The percentage of NYSE securities at a 52-week high minus 52-week low continues to skew negative. This is a hallmark of bear market environments. About the only potential positive is the so-bad-it's-good extremes from June, when more than 30% of securities plunged to a 52-week low.
That's only potential future buying power. Bulls should want to see this figure pop above the zero line and hold there.
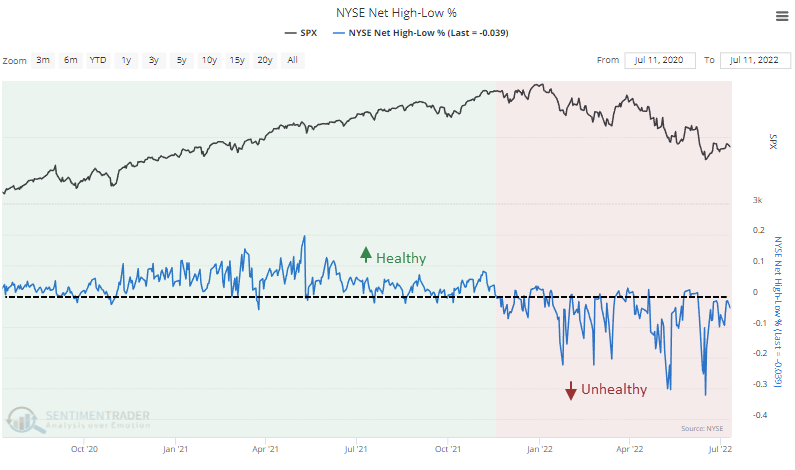
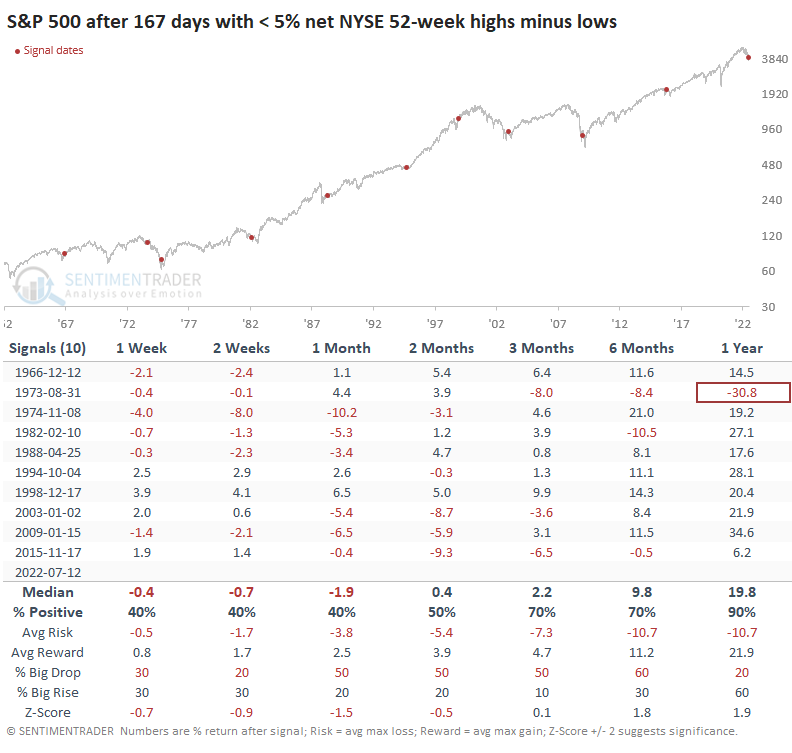
It has been over six months since there have been 5% more new highs than new lows. Our current environment ranks as the 5th-worst in 60 years when we average the high-low differential during that stretch.
Over the past 167 sessions, the NYSE Net High - Low % has averaged -5.0%, meaning an average day saw 5% more securities at 52-week lows than 52-week highs. The only stretches when stocks suffered more were in November 1974 (-10.8%), August 1973 (-8.9%), December 1966 (-8.7%), and January 2009 (-7.9%).
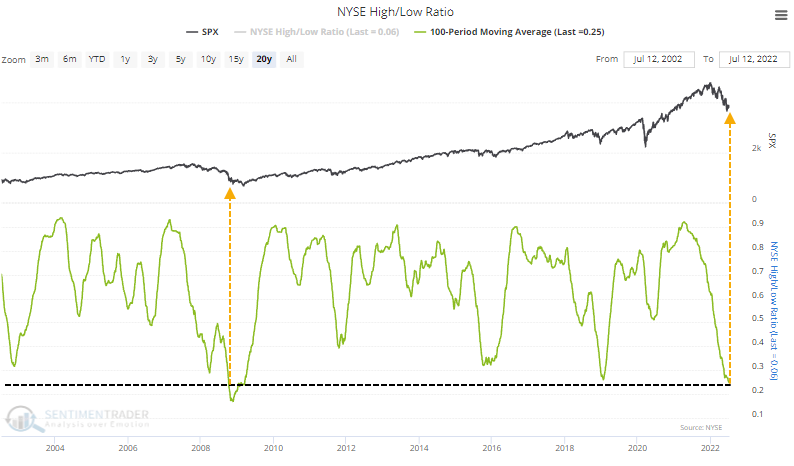
A slightly different way of looking at this data, as a ratio instead of a difference, shows that the 100-day average of the NYSE High/Low Ratio just fell to the 2nd-lowest level in 20 years.
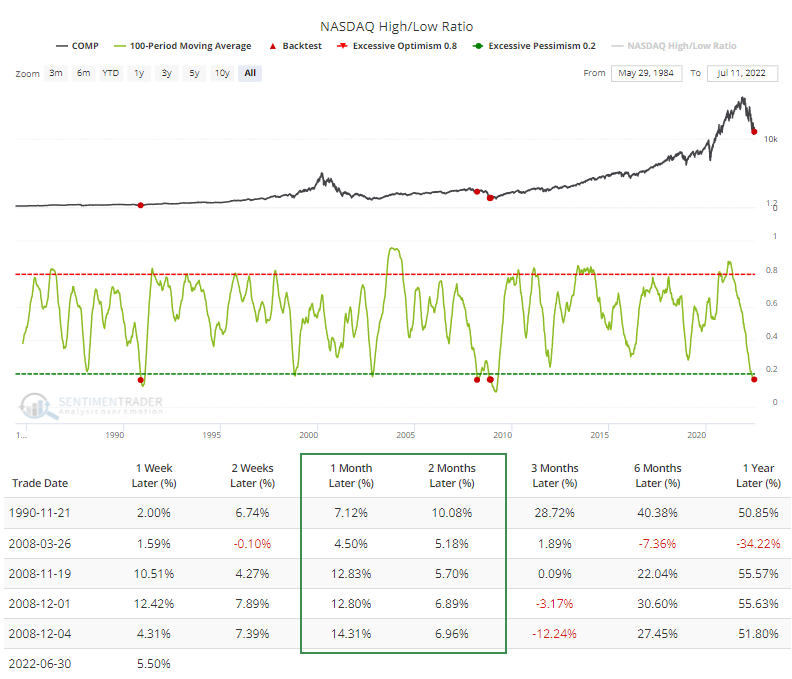
It's pretty bad on the Nasdaq exchange, too. The Nasdaq High/Low Ratio over the past 100 days has been even worse. The Backtest Engine shows that there have been only three distinct comparable periods in 40 years.
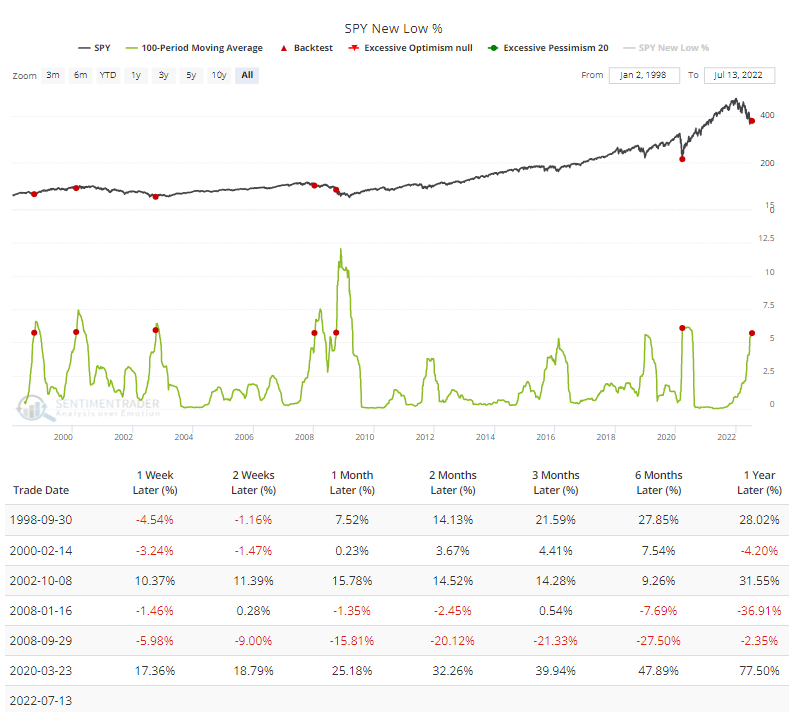
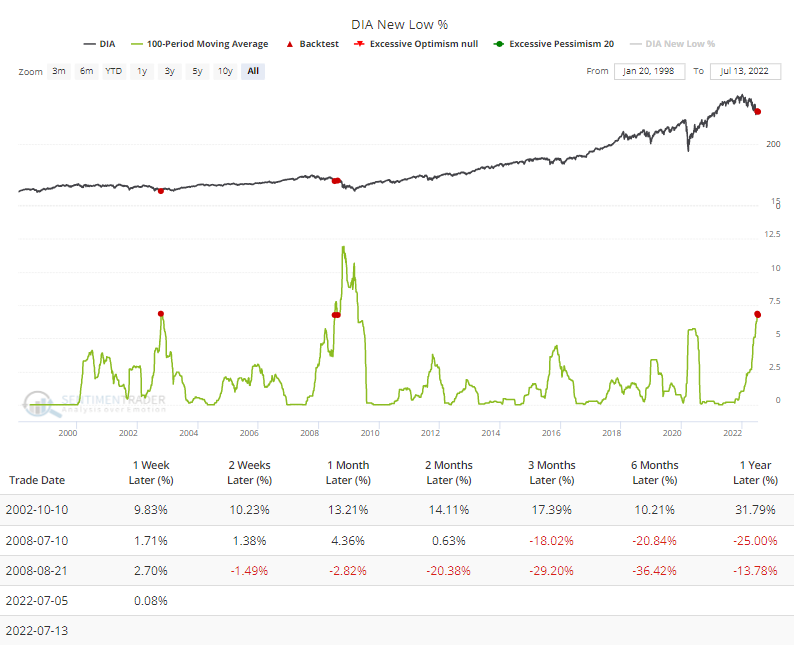
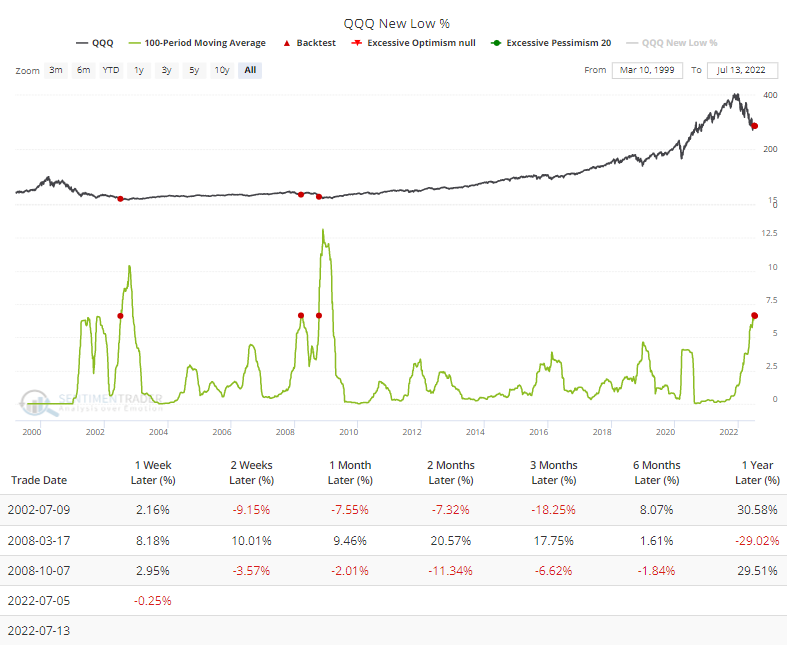
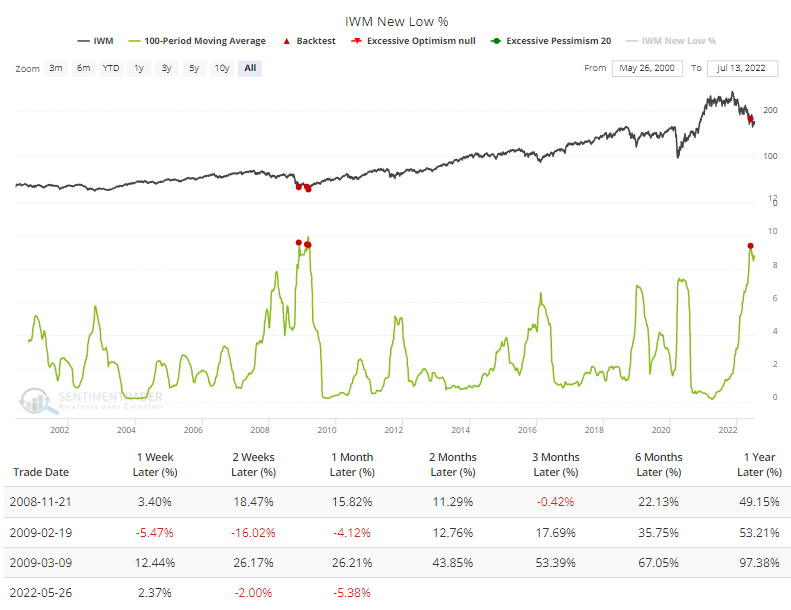
Most of the major indexes often see a divergence between when they set 52-week lows themselves and how many of their component stocks do. As the indexes suffer protracted declines, fewer and fewer stocks tend to also set new lows, setting the indexes up for an eventual rally and end to a bear market. We have not seen any evidence of that yet.
Again, about the only positive we might be able to take from this is just how bad things have been and for how long. The 100-day average of 52-week lows within the "big four" indexes are near the most extreme readings in more than 20 years, per the Backtest Engine.
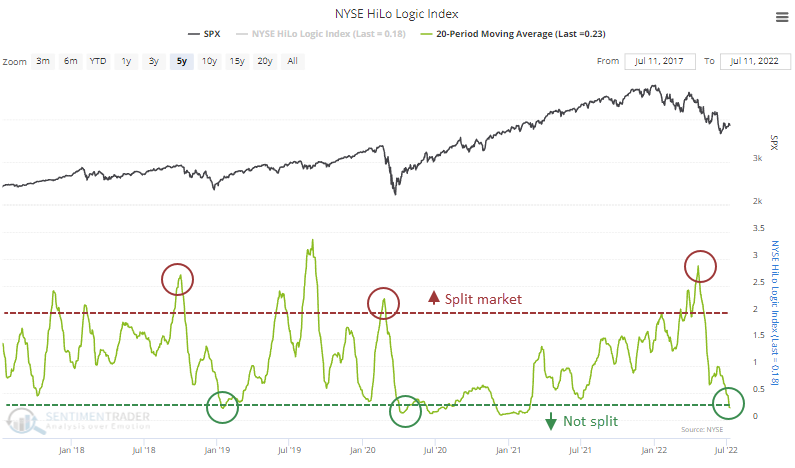
The market isn't as split, thanks to the surge in new lows
A few months ago, we had concerns about stocks because the market was extremely split. There were a lot of securities hitting 52-week highs while others were falling to 52-week lows. That kind of behavior has been a consistently negative sign over the decades.
It has been resolved over the past month, and the NYSE HiLo Logic Index has plunged. A drop in the ratio can occur because either buyers return and push many stocks to new highs, or sellers emerge and push them to new lows. Obviously, bulls would prefer the former scenario.
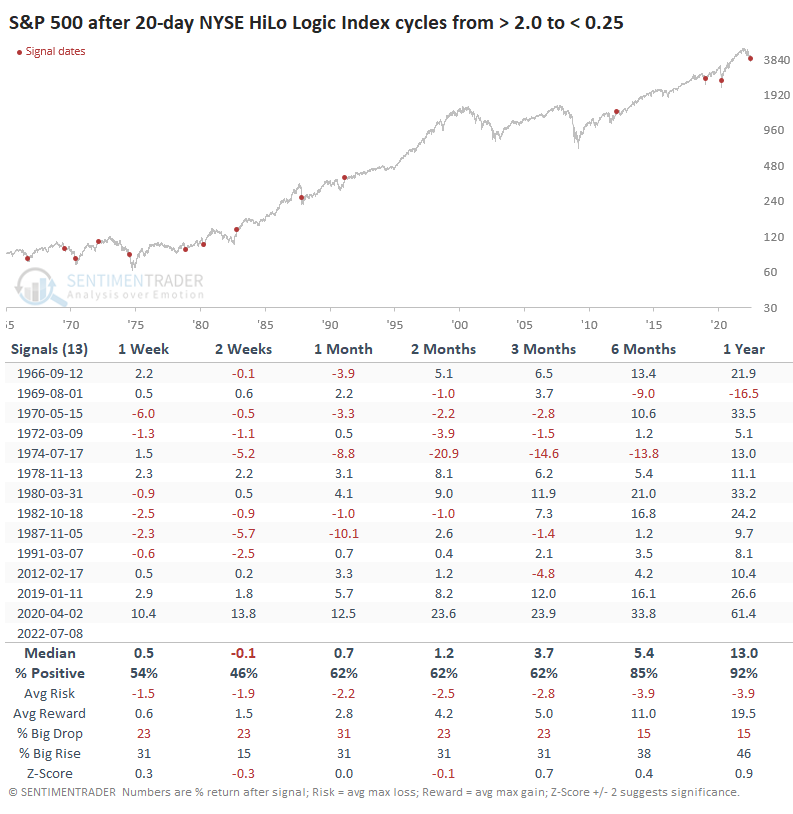
It might not matter. The table below shows other times when the HiLo Logic Index cycled from above 2.5 to below 0.25. These are times when the market was extremely split between those at new highs and new lows, then became un-split. It didn't matter whether the un-split was due to a dominance of new highs or new lows, just that one side dominated.
This was kind of a heads-I-win-tails-you-lose situation for bulls. If there was a sudden surge in 52-week highs, it indicated returning confidence and a new bull phase. If there was a jump in 52-week lows, it indicated severely oversold conditions and soon-to-be-exhausted sellers. A year after these cycles, the S&P 500 showed a positive return after 12 out of 13 signals.
What the research tells us...
One of the most nefarious aspects of bear markets is the temptation to continually buy "oversold" conditions. That word is in quotes because there is no clear definition. Investors act differently during bear markets; oversold doesn't mean what it does in healthier environments. There is absolutely a risk - a high one - that we're currently in the midst of this exact phenomenon.
We've been pointing out positives for weeks, for months even, and indexes like the S&P 500 are within a few bad days of hitting fresh lows. Not good. The economic backdrop is deteriorating rapidly, as Dean and Jay have highlighted, and while stocks are discounting mechanisms, they can't ignore recessions. The only question is whether investors have already discounted that possibility. Based on the sentiment and other factors we've discussed lately, that seems to be the case, and the most likely base scenario continues to be a multi-week to a multi-month relief rally. Now we just need to see evidence that it's happening.
Indicators at Extremes
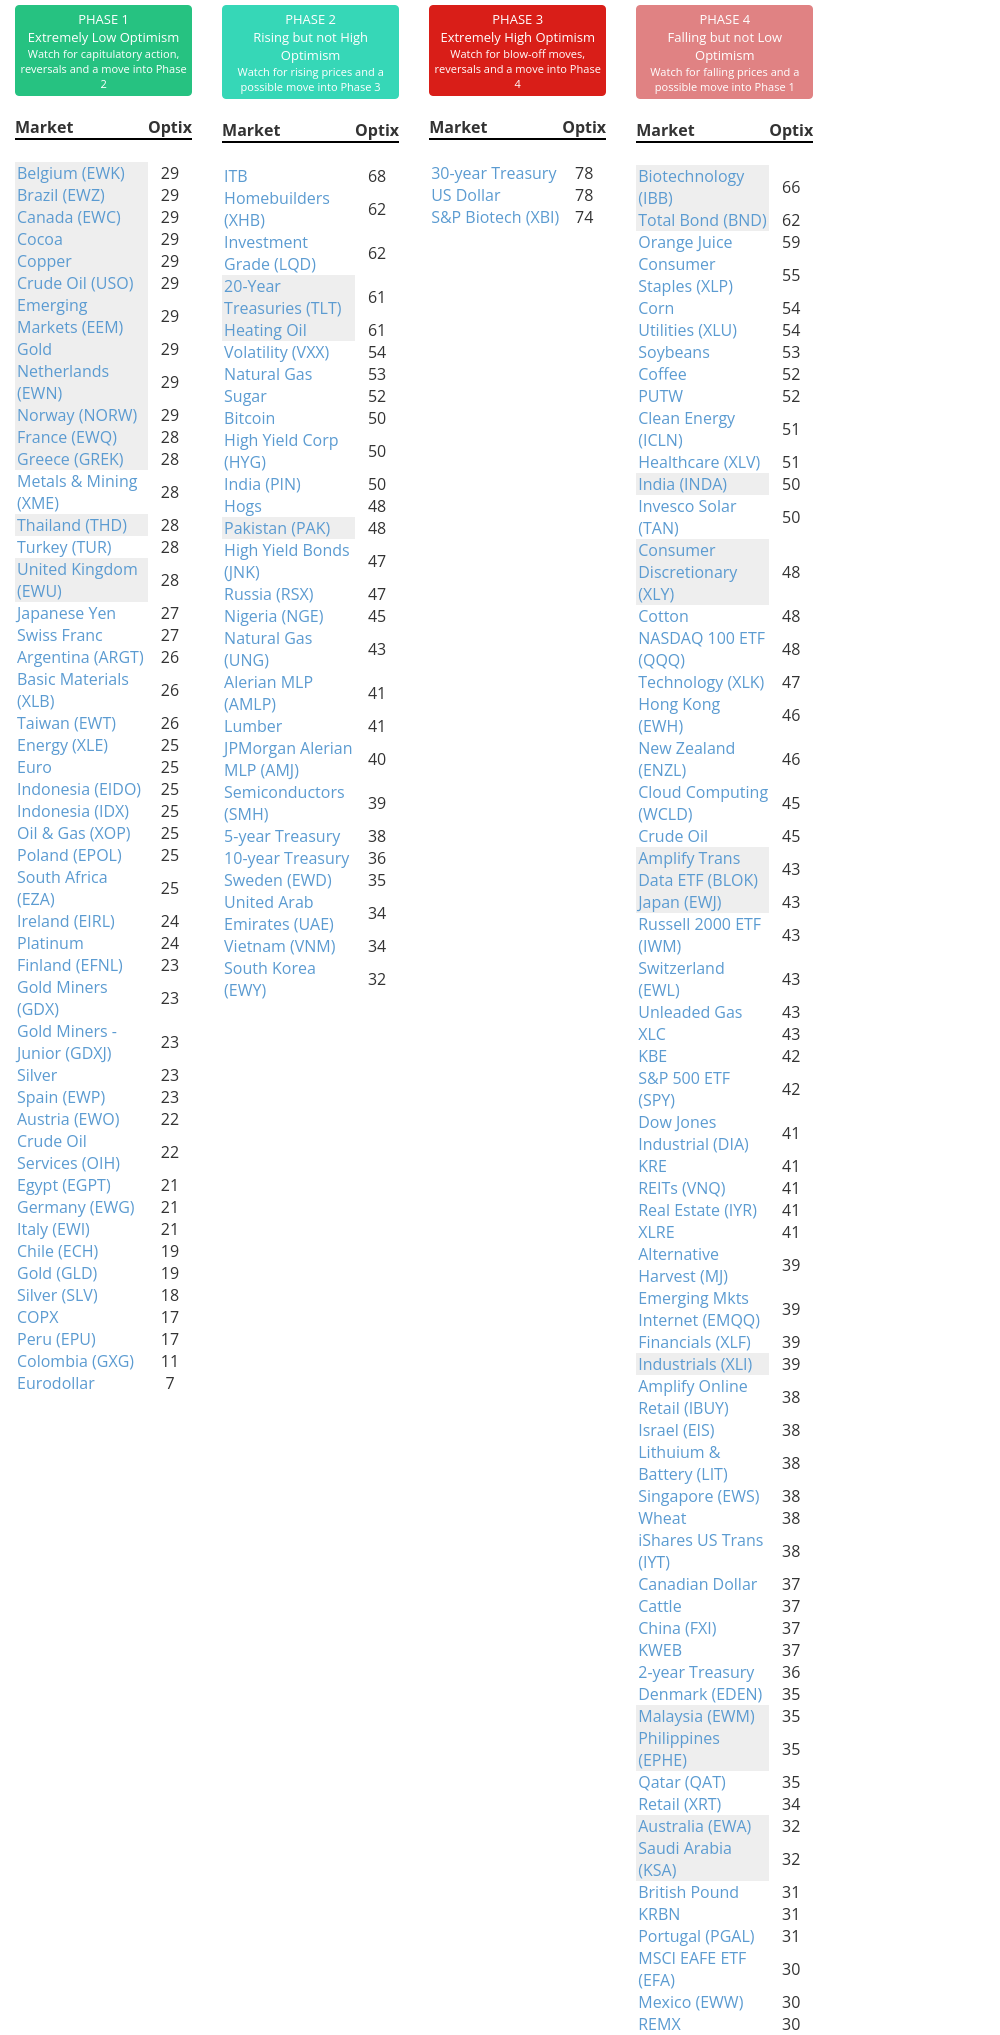
Phase Table
Ranks
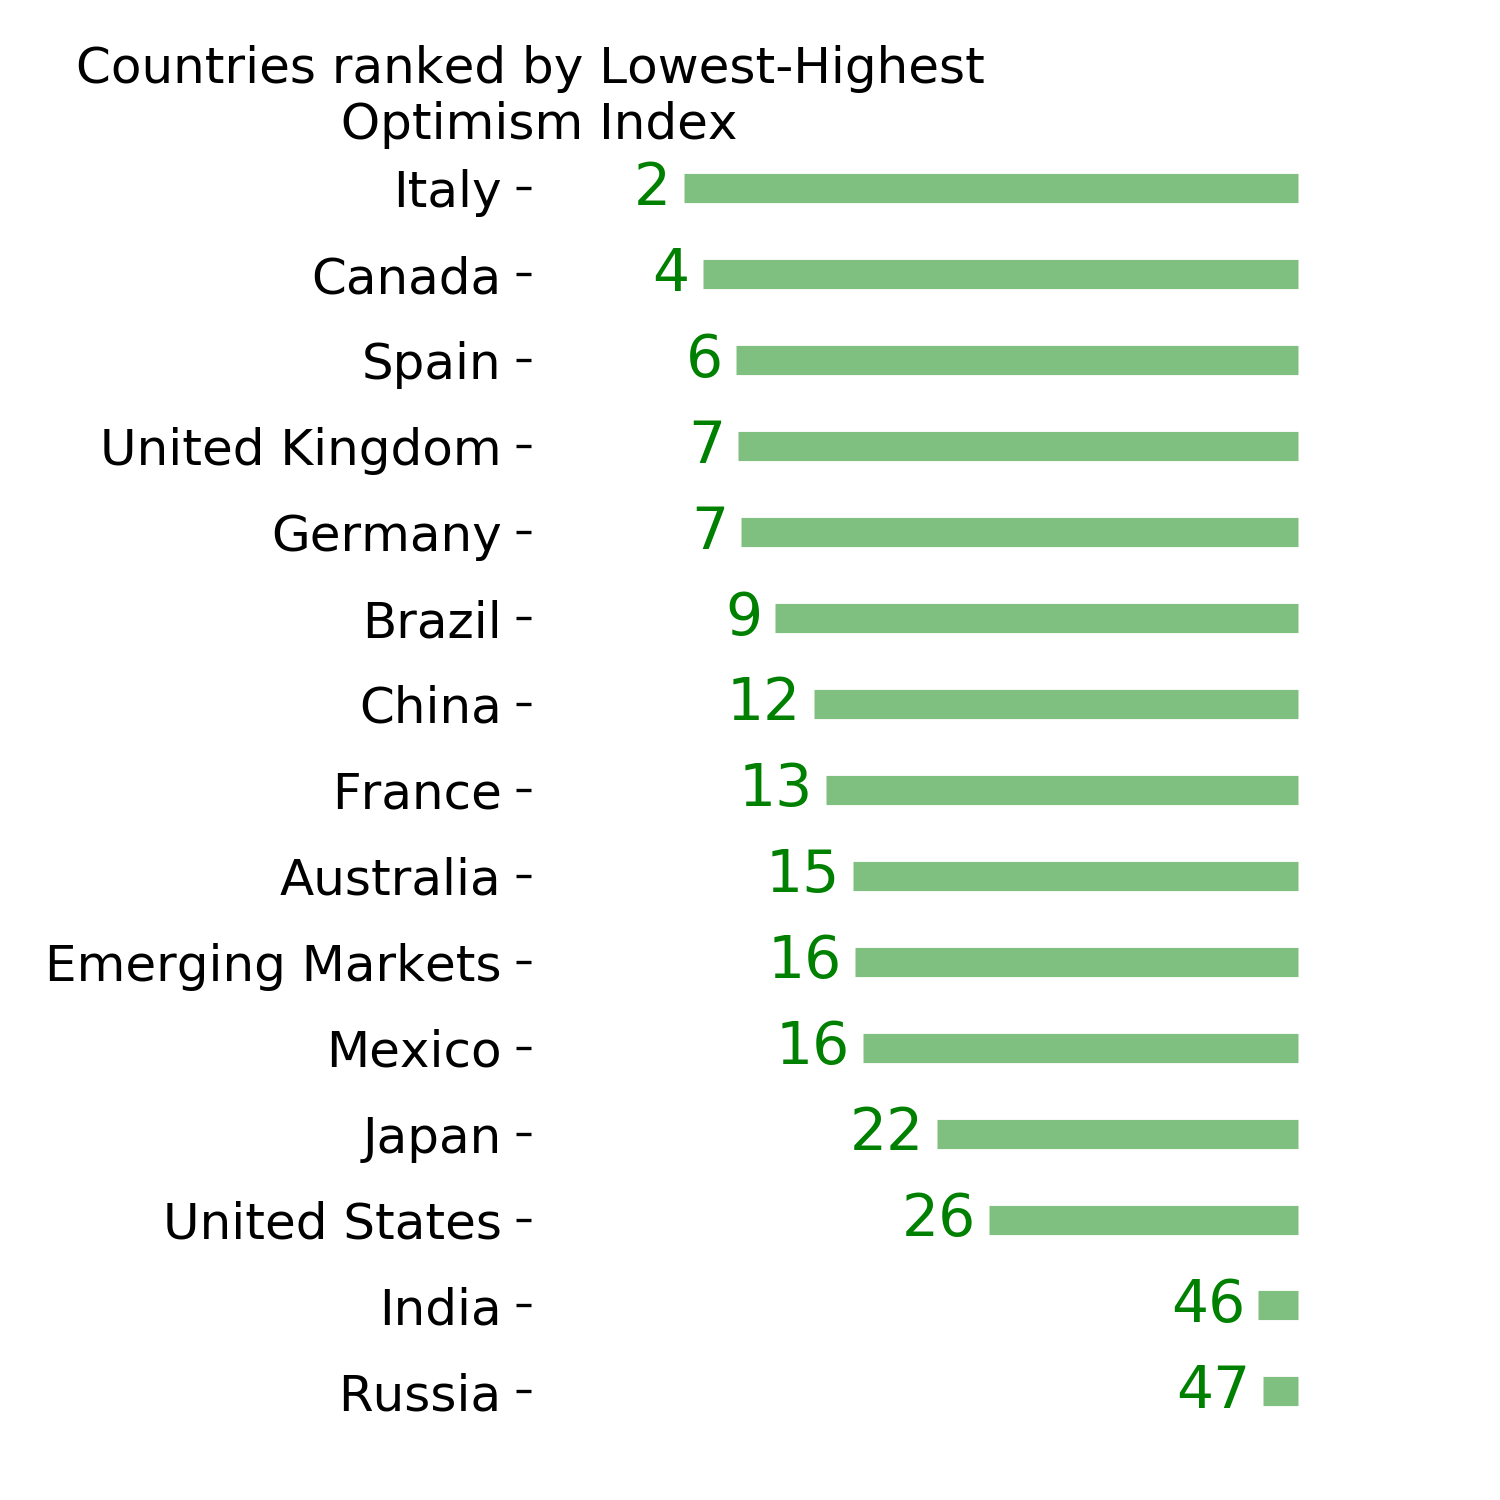
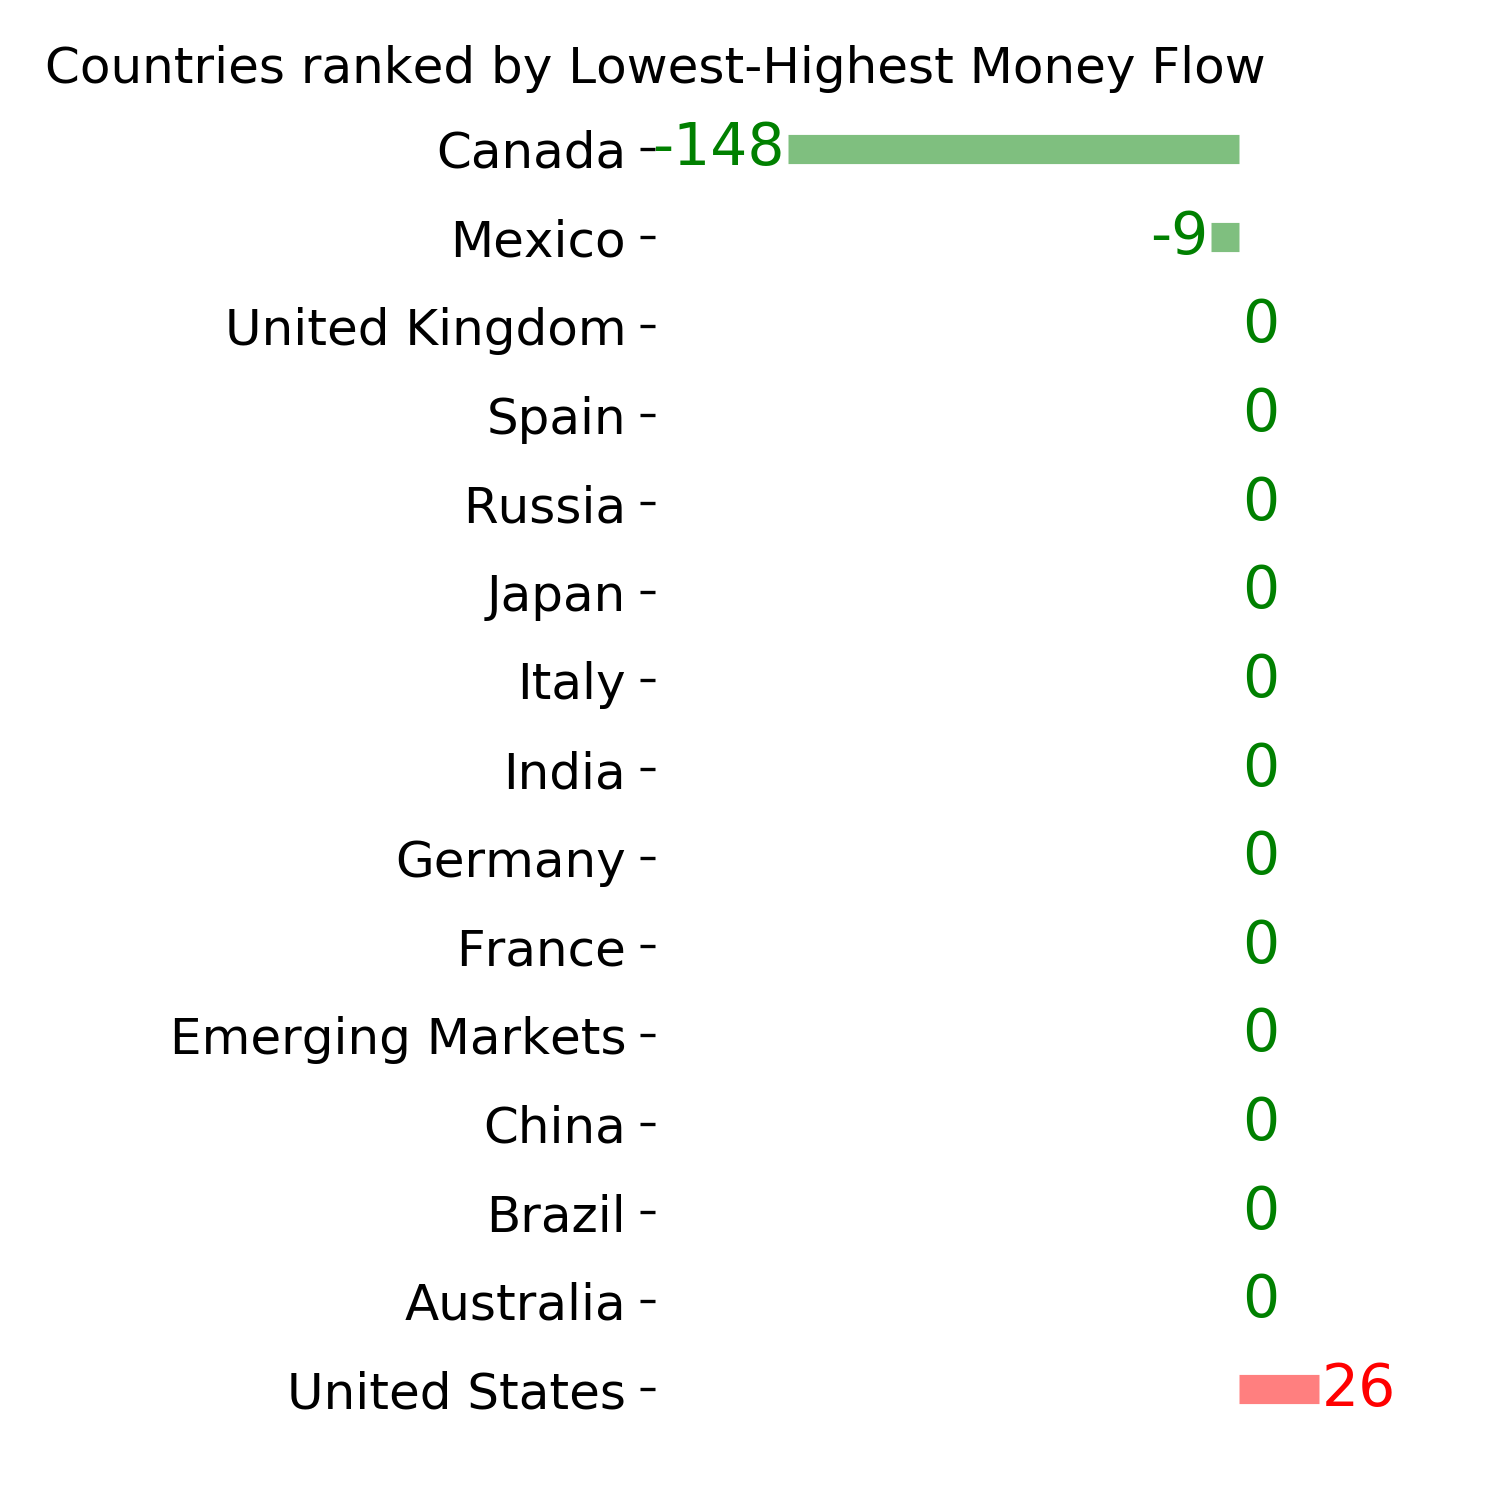
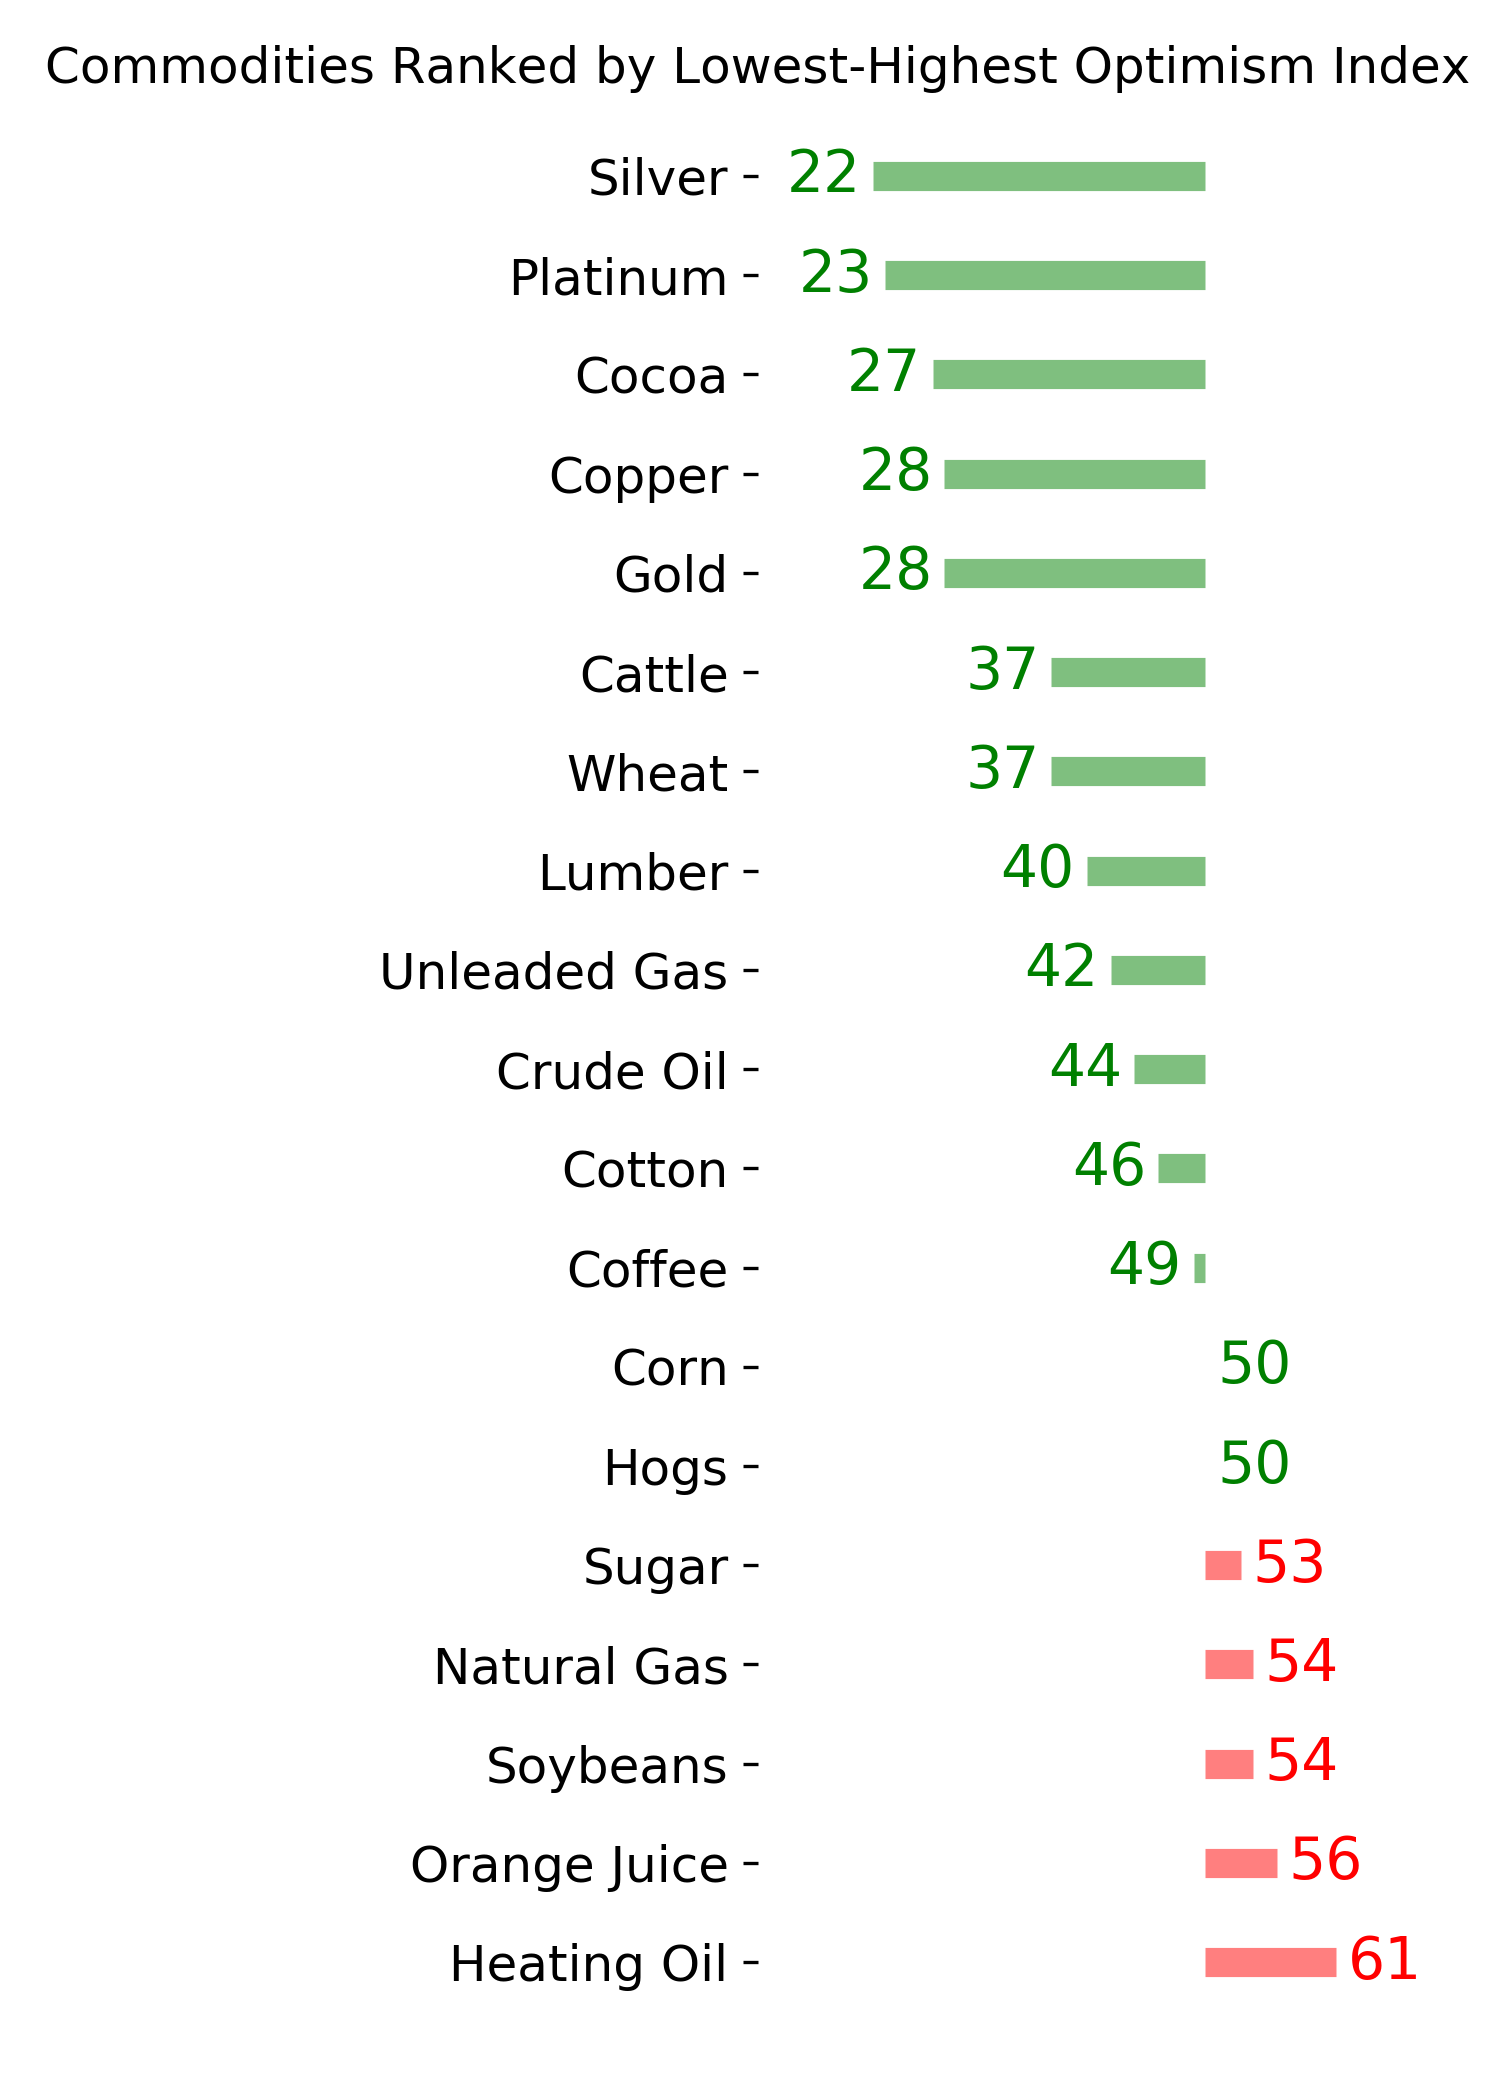
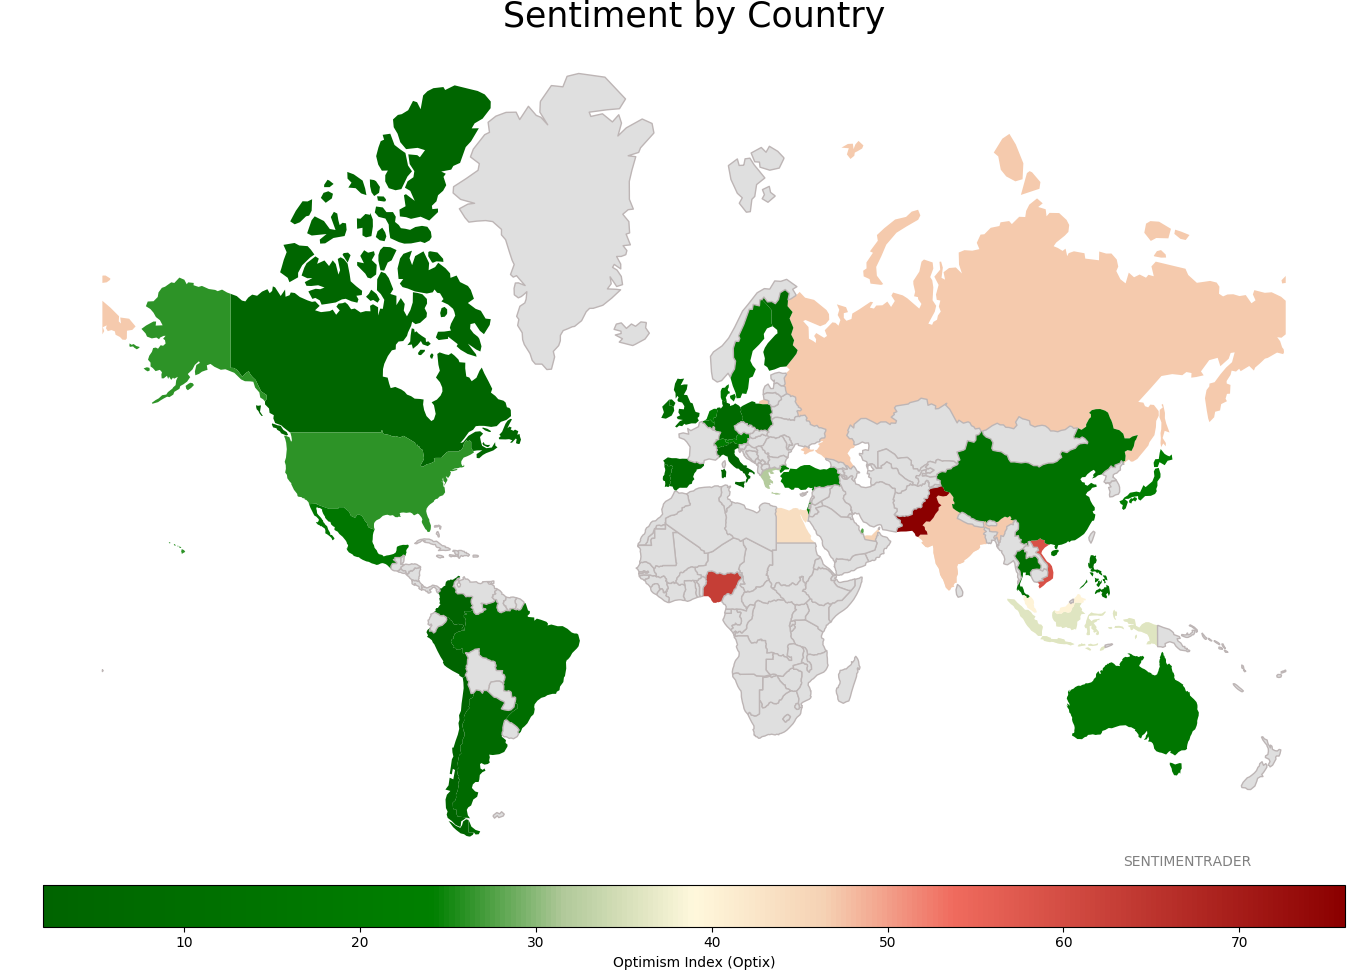
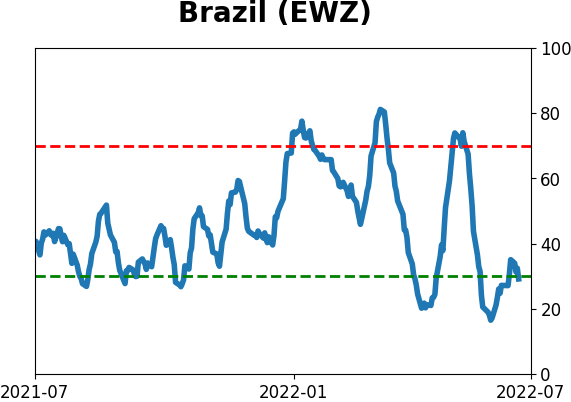
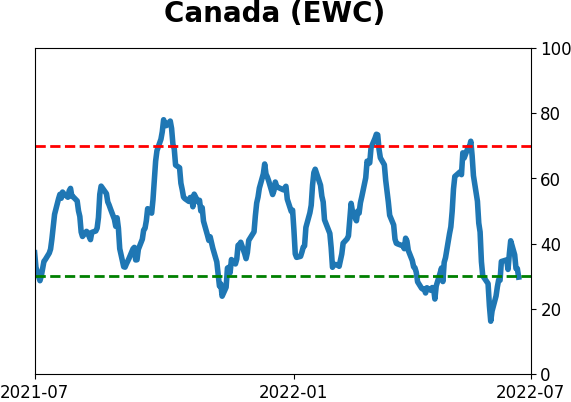
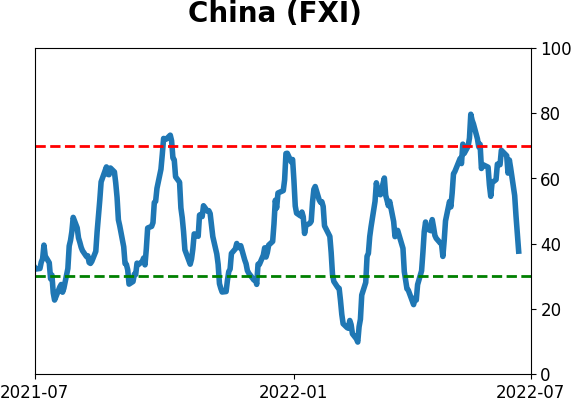
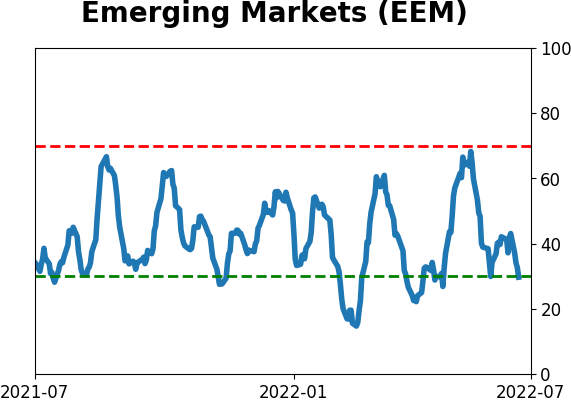
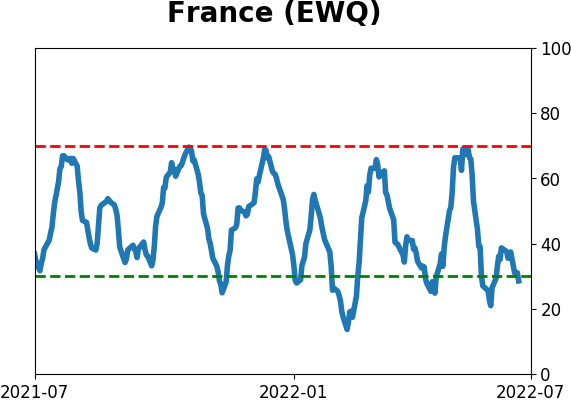
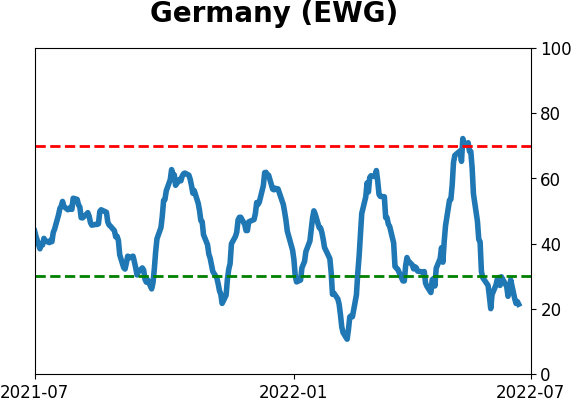
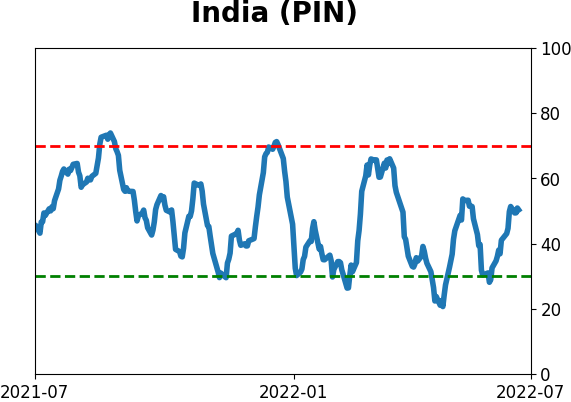
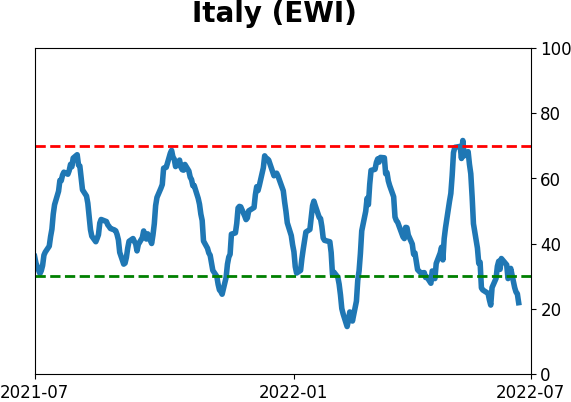
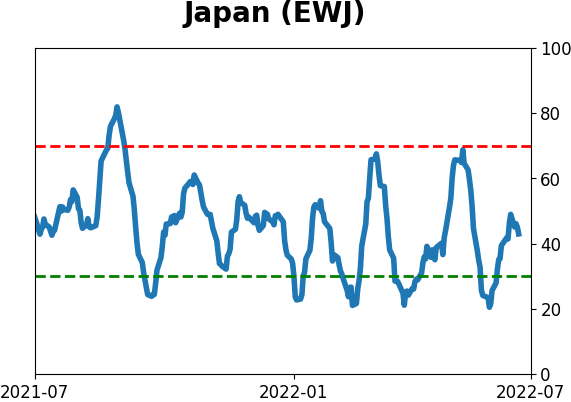
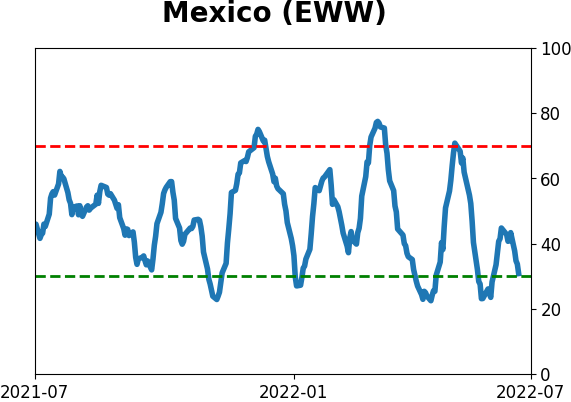
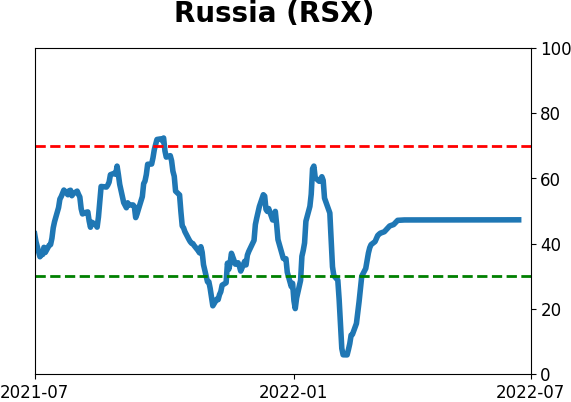
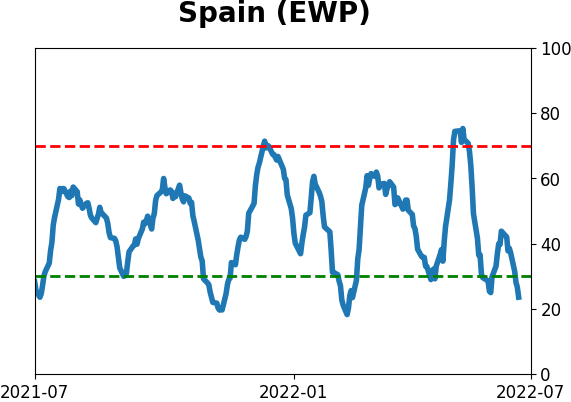
Sentiment Around The World
Optimism Index Thumbnails
|
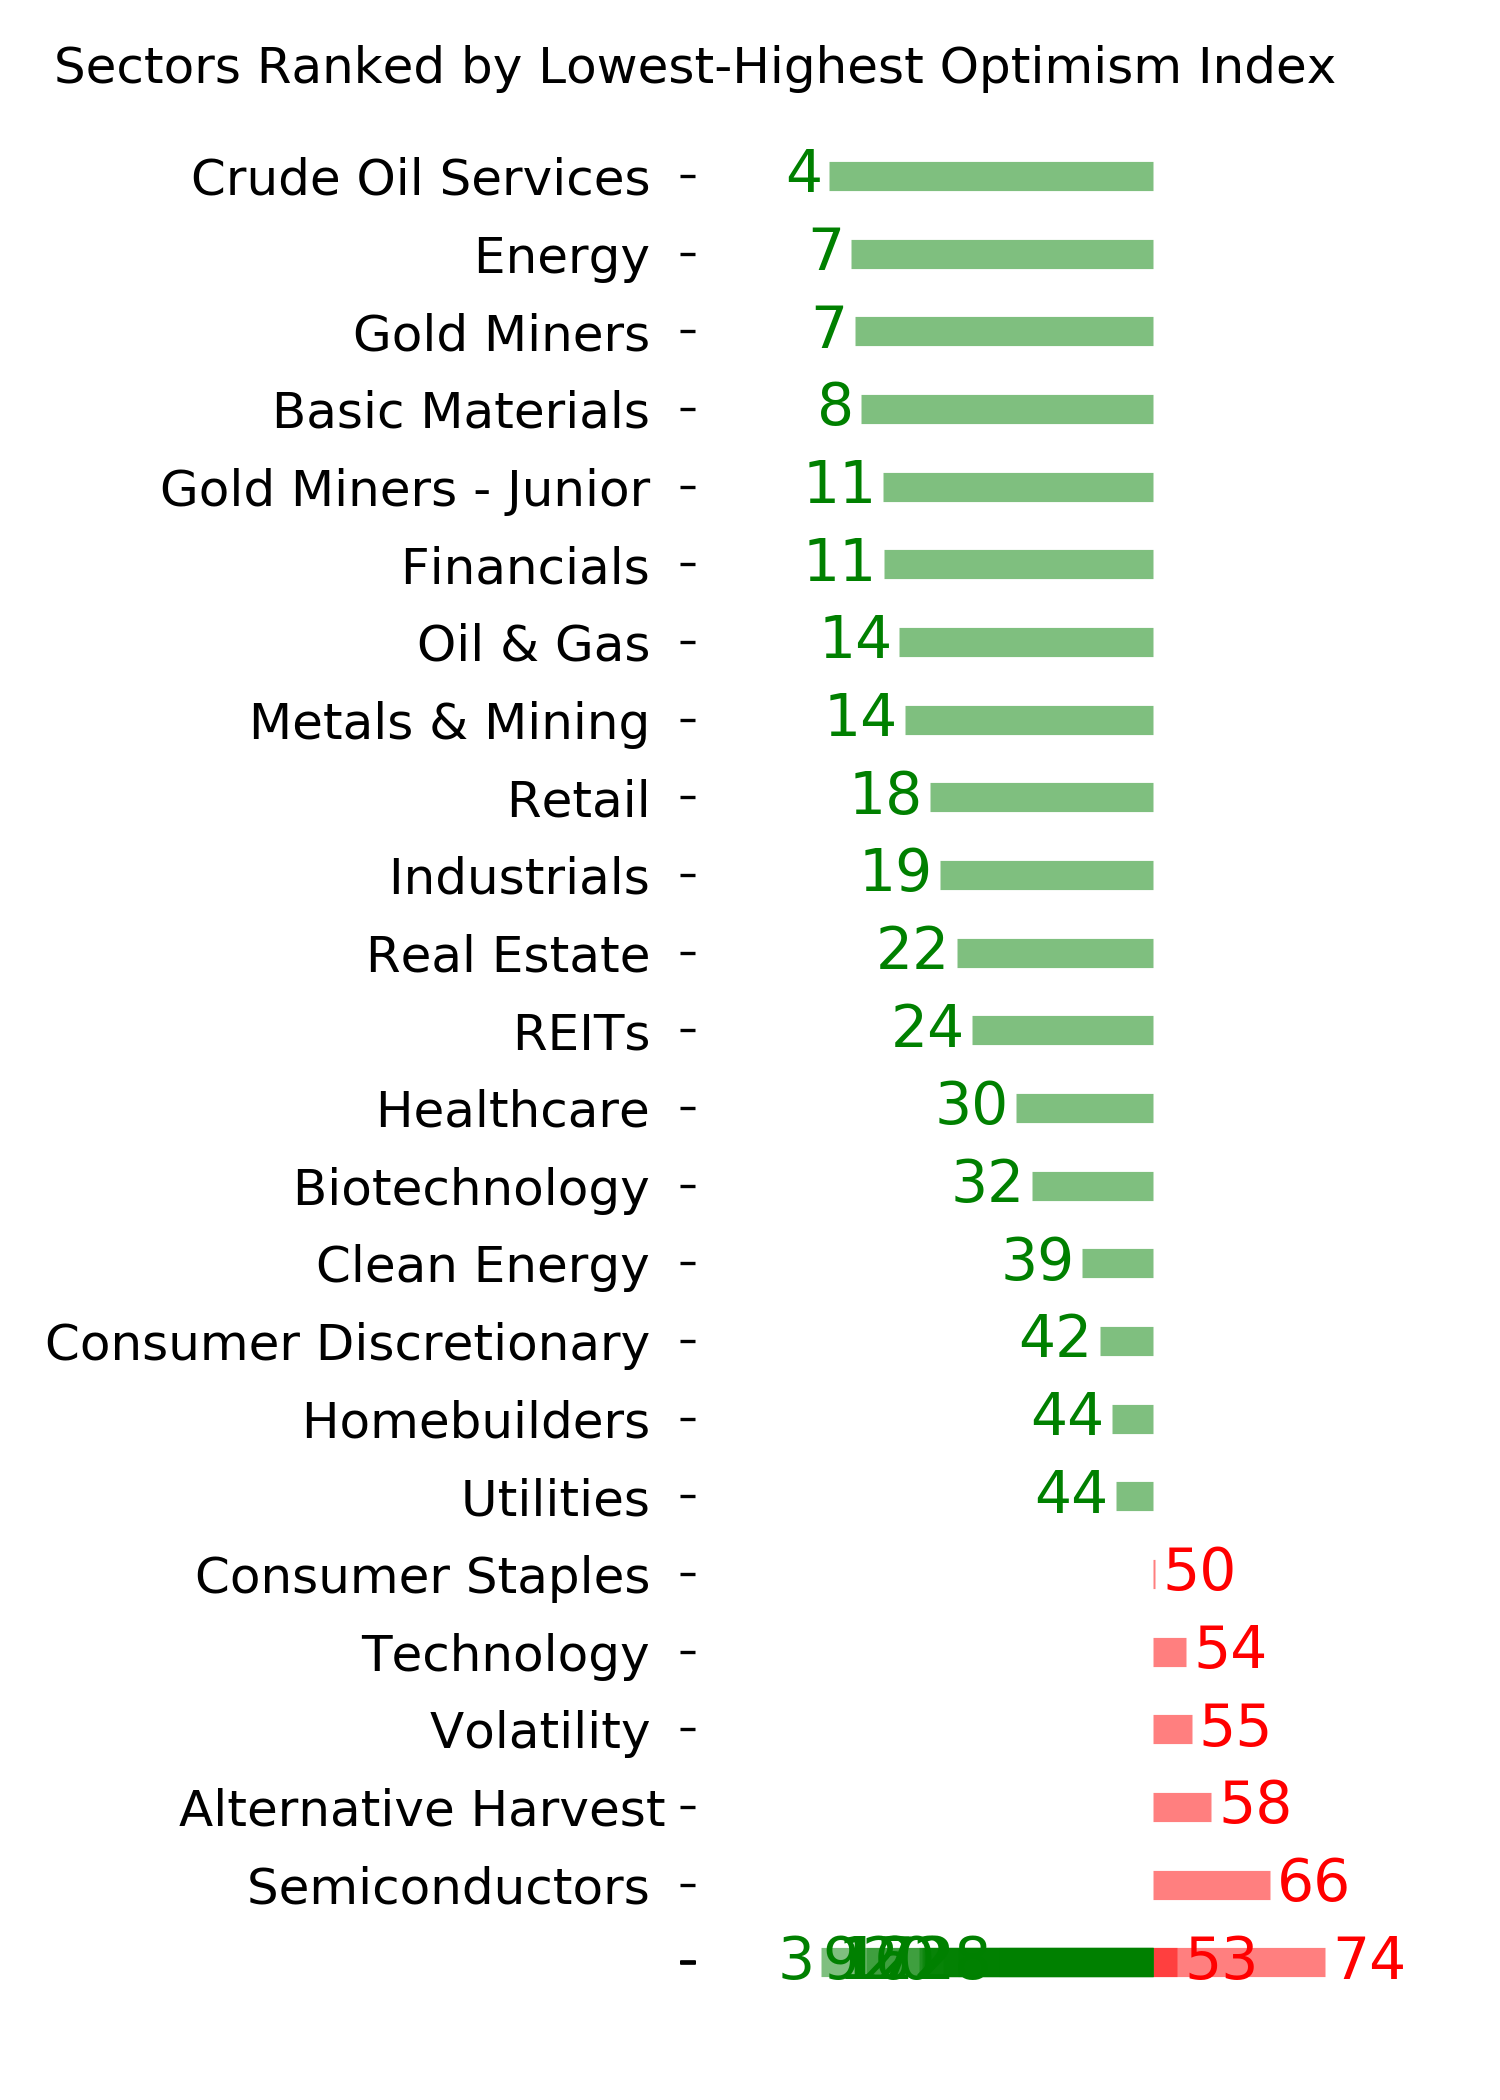
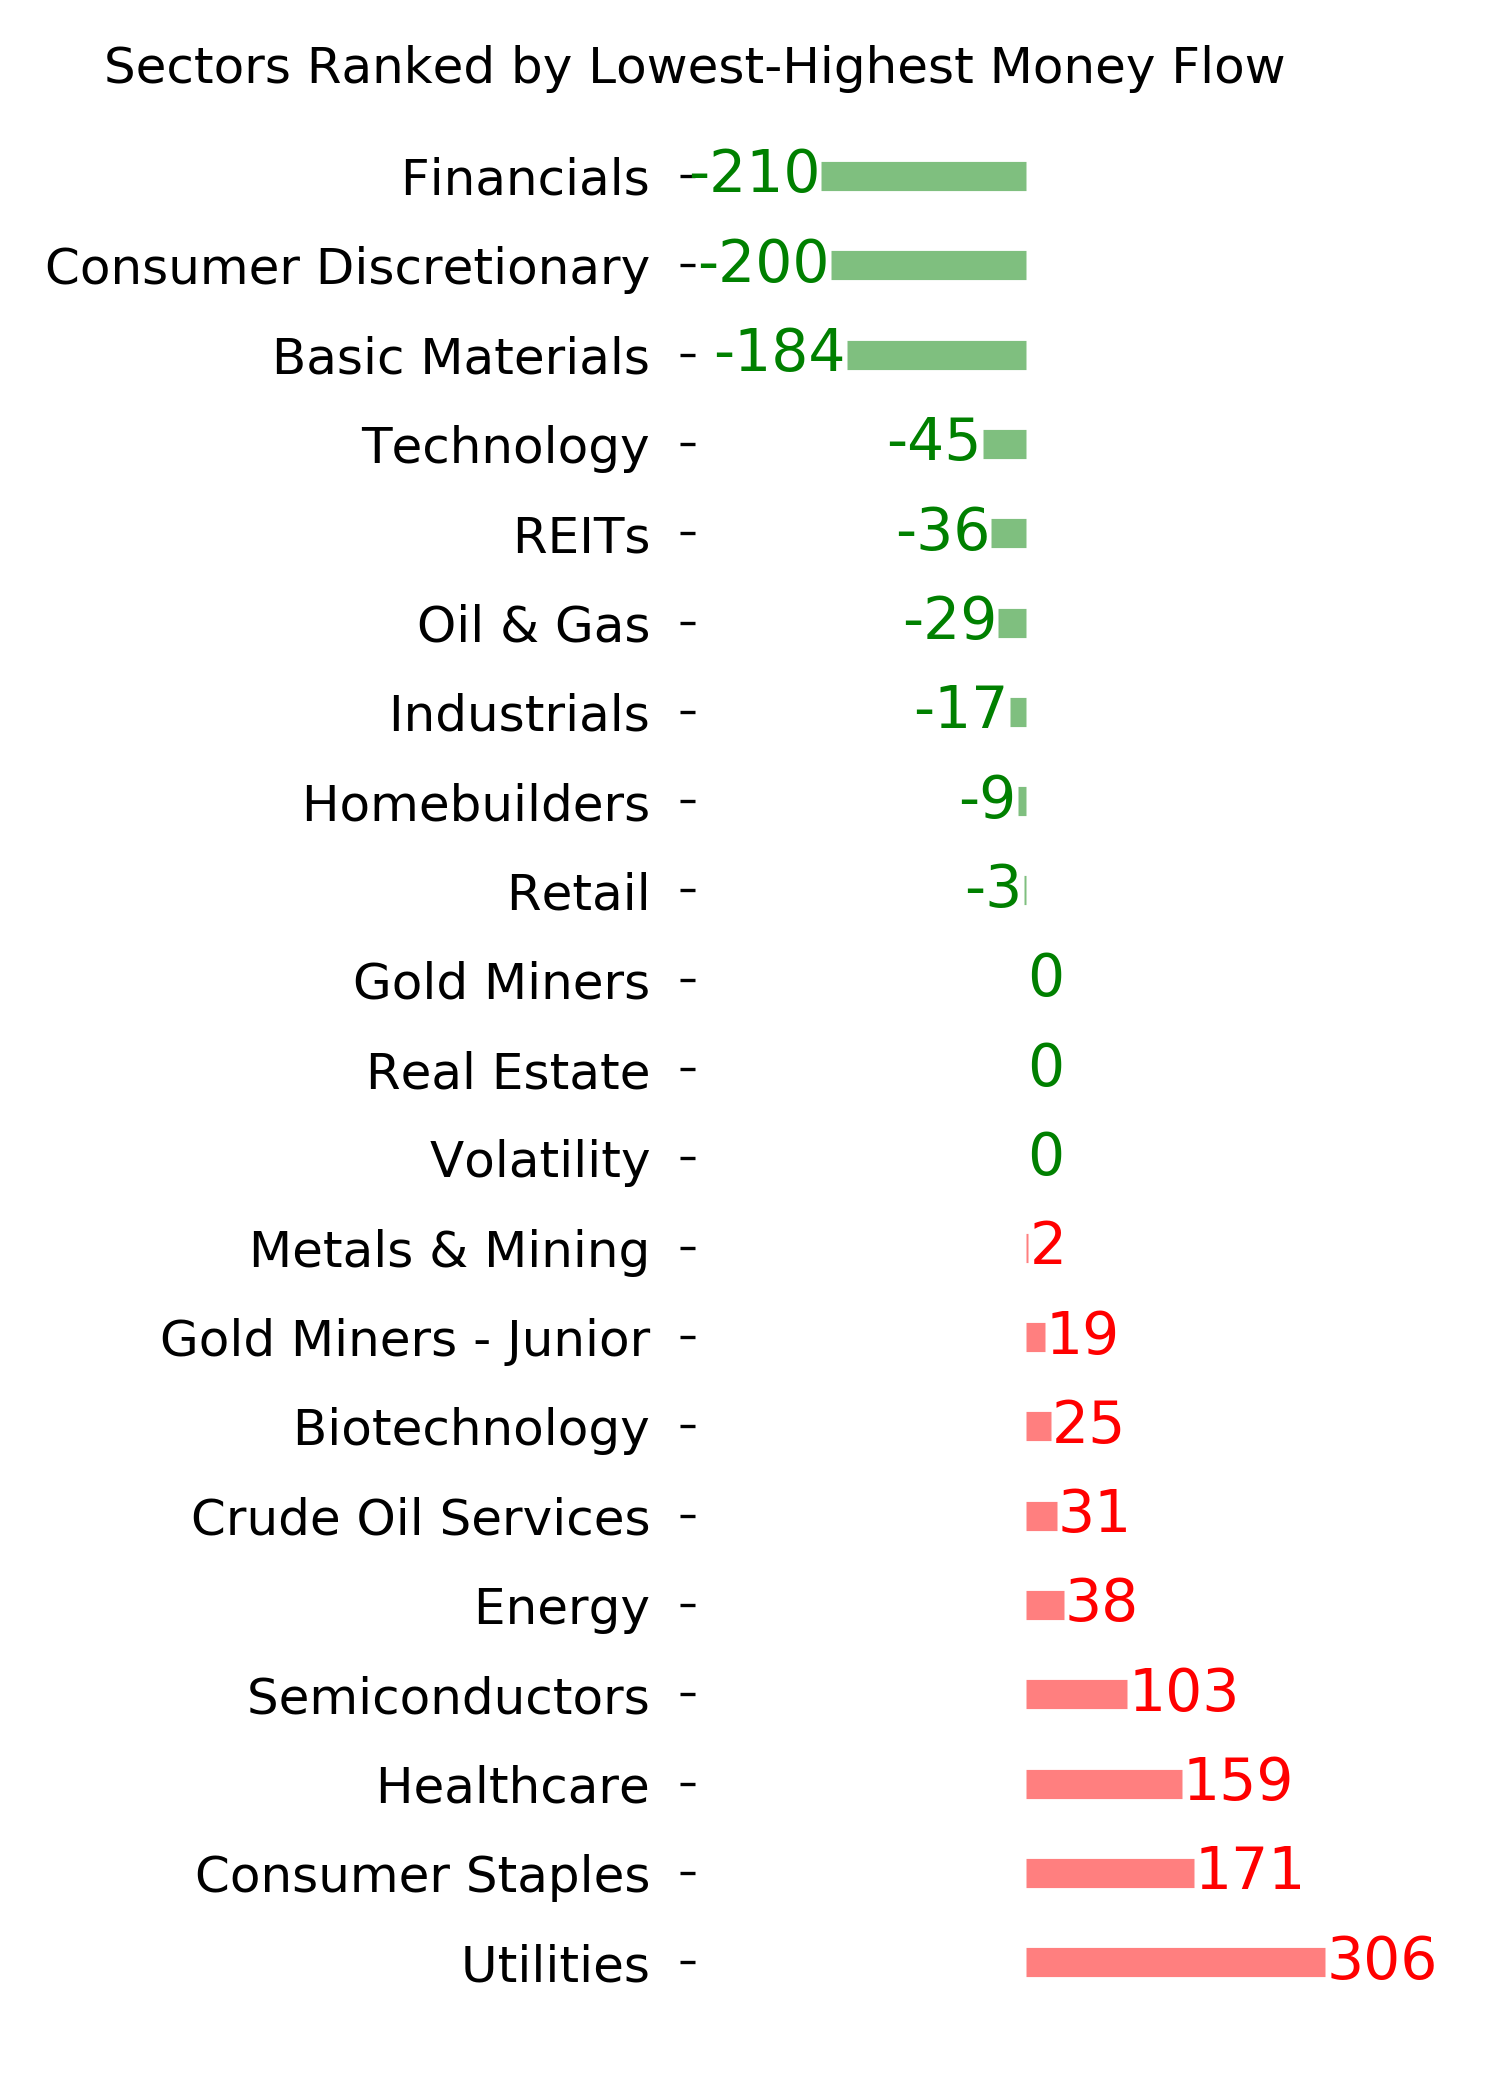
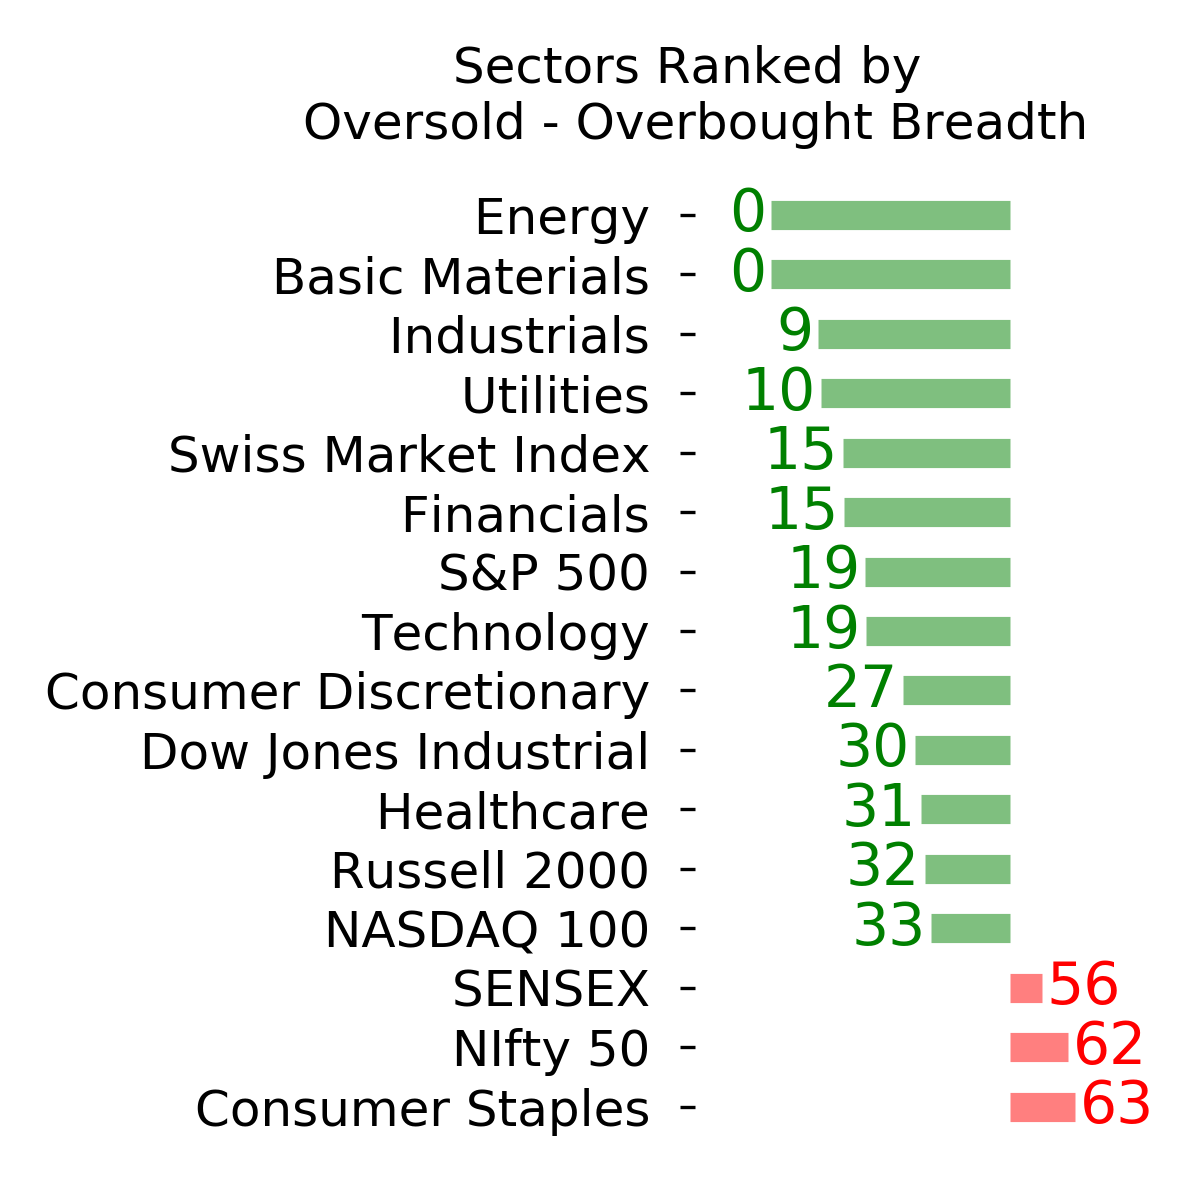
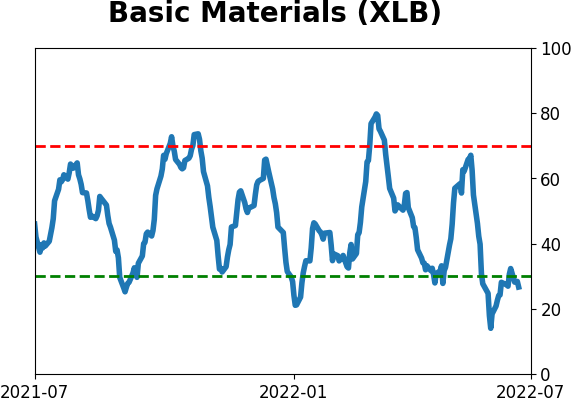
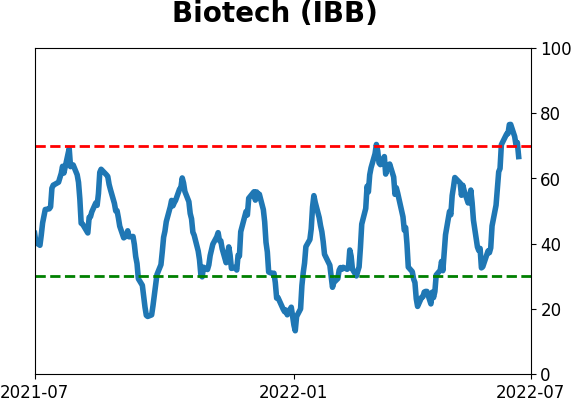
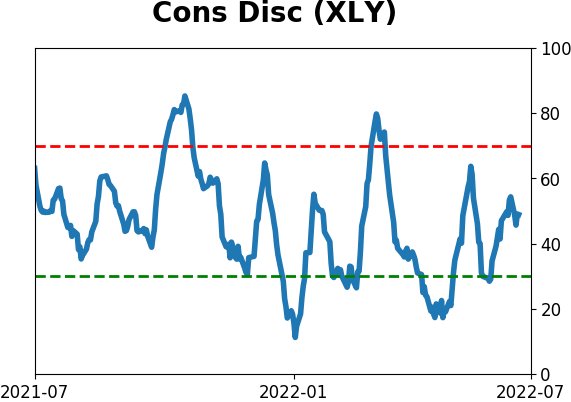
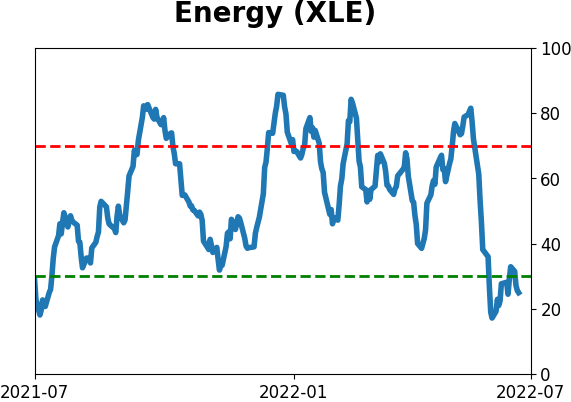
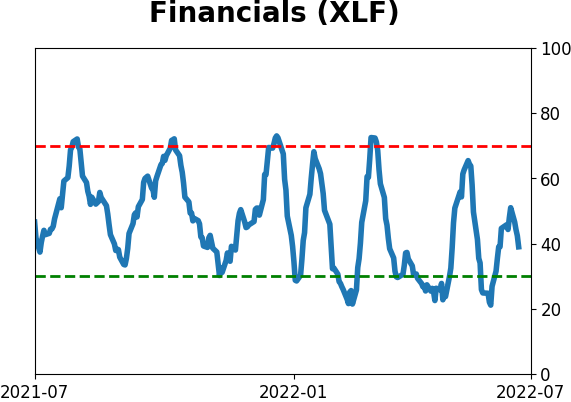
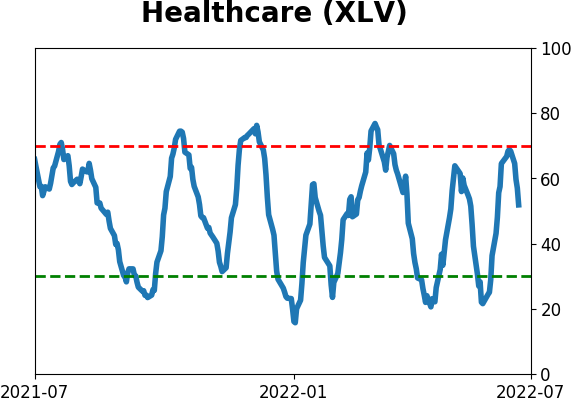
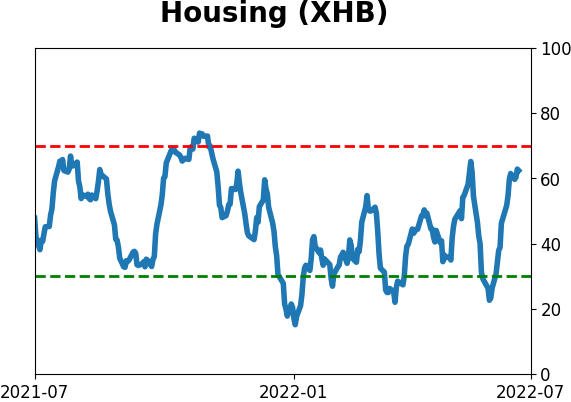
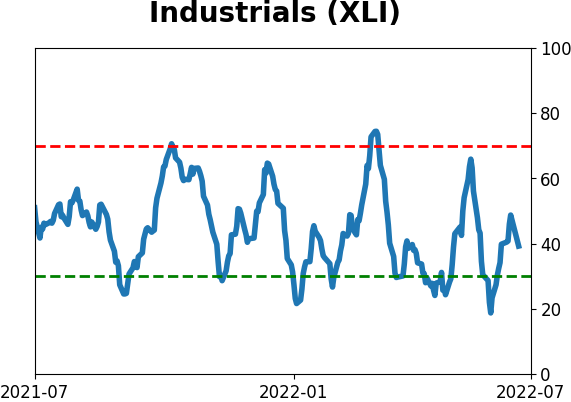
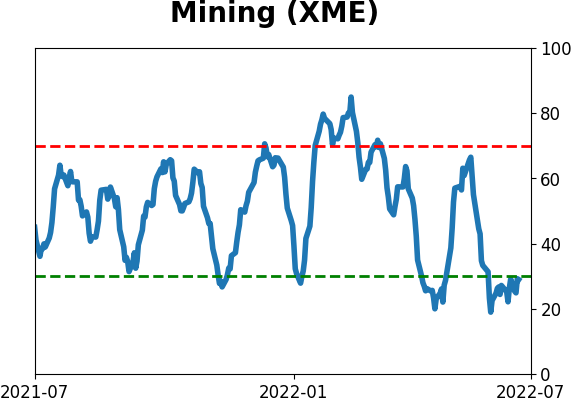
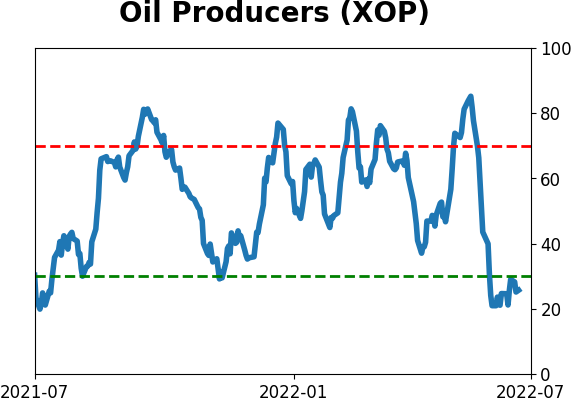
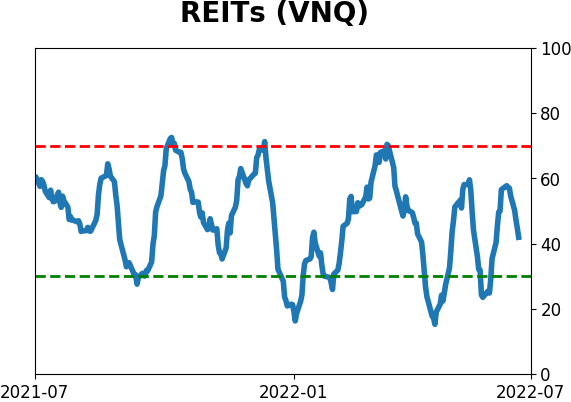
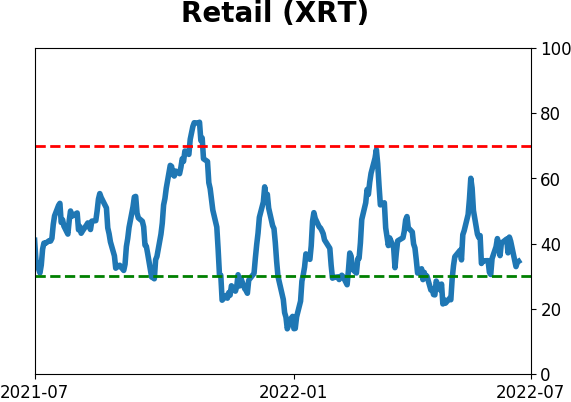
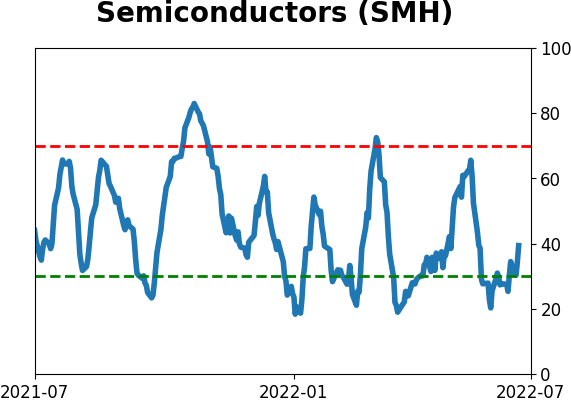
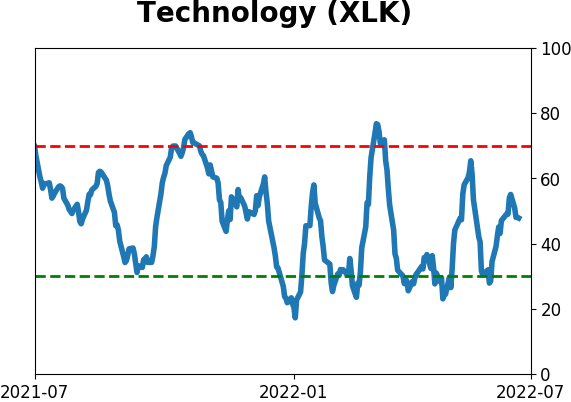
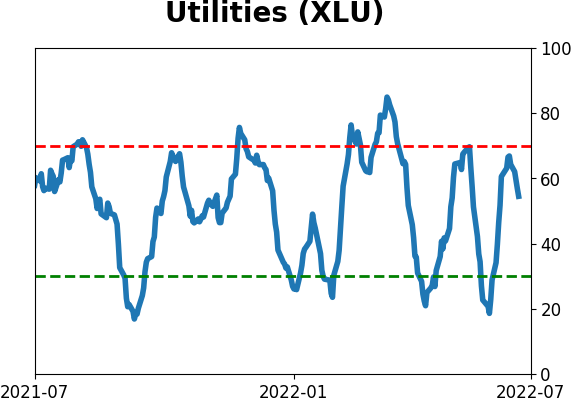
Sector ETF's - 10-Day Moving Average
|
|
|
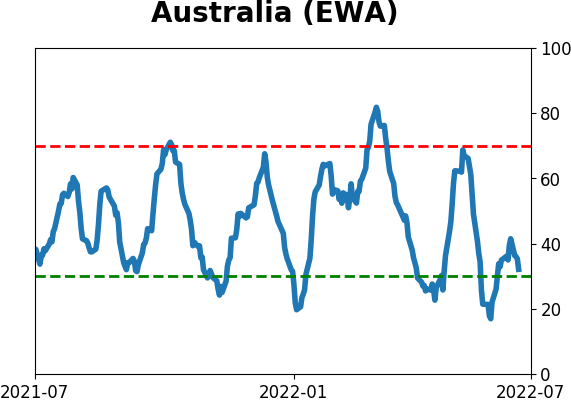
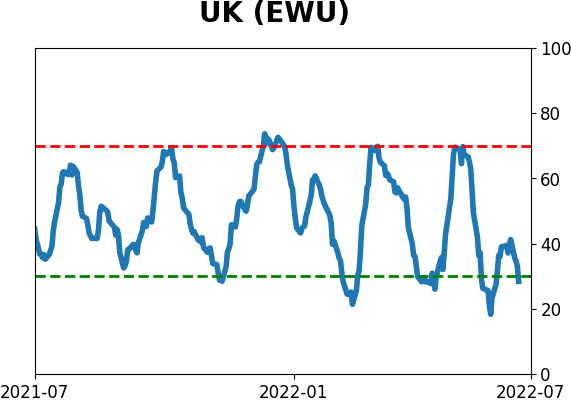
Country ETF's - 10-Day Moving Average
|
|
|
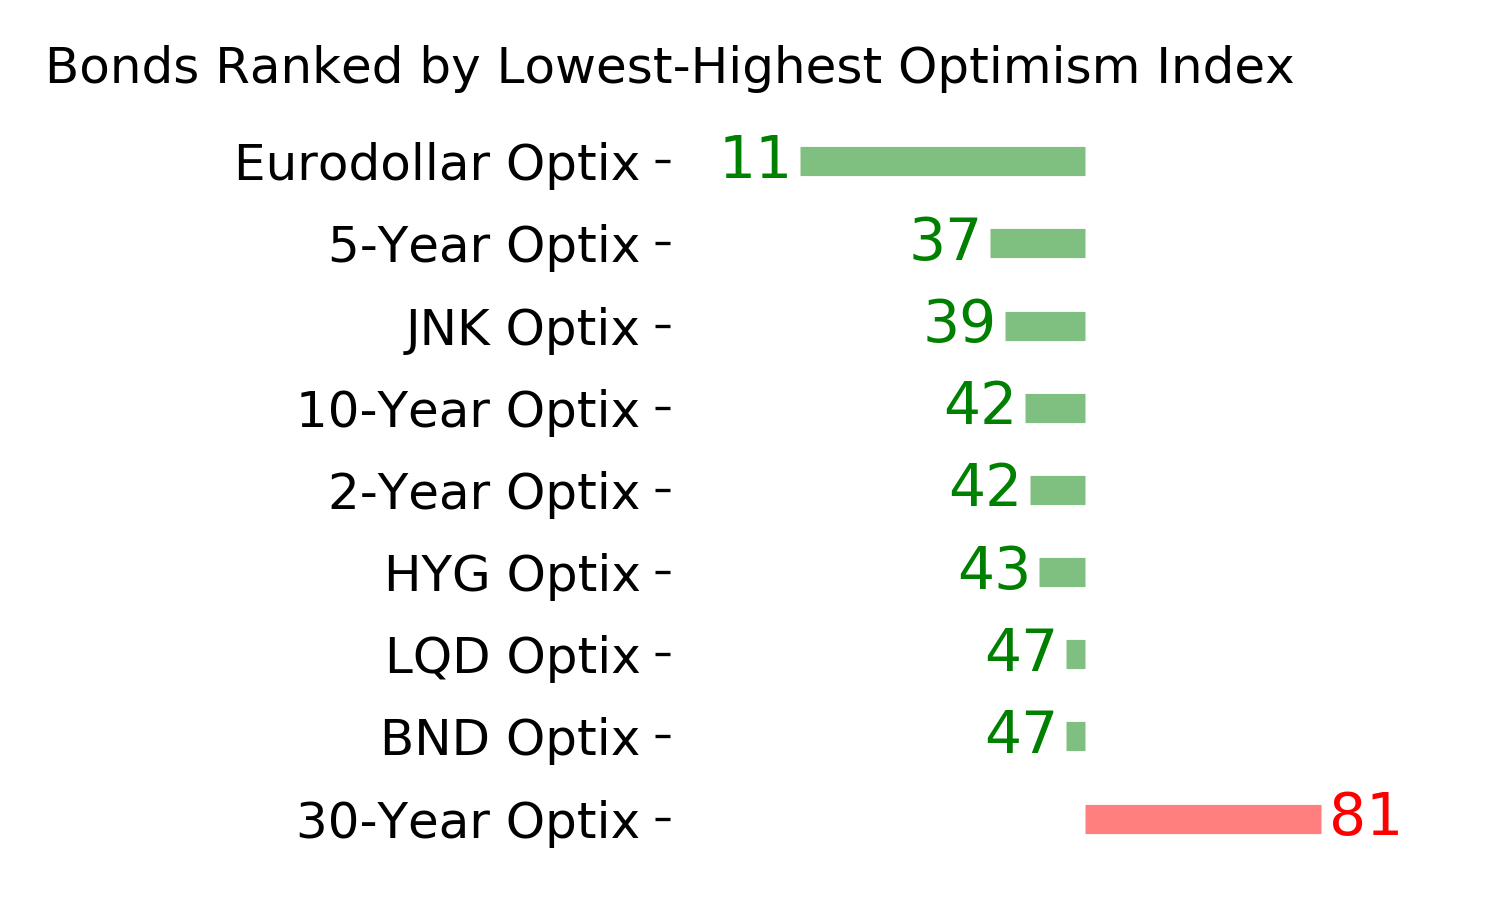
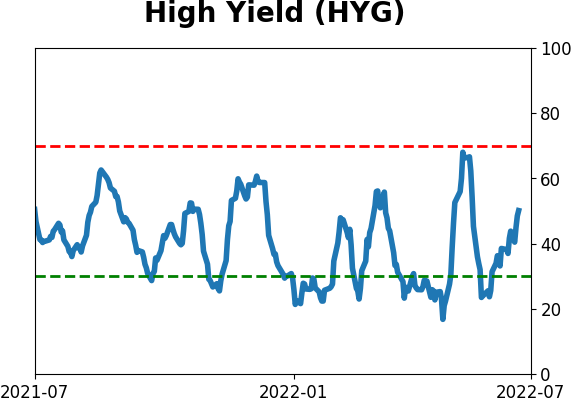
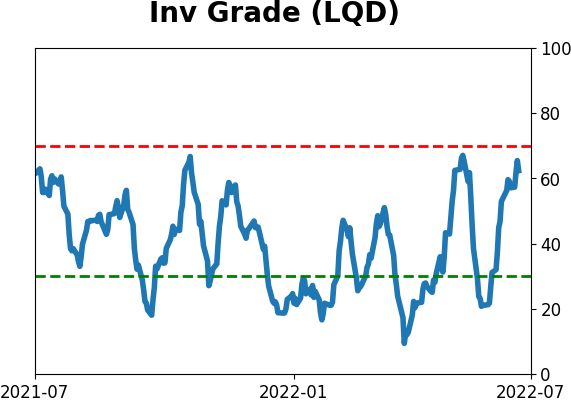
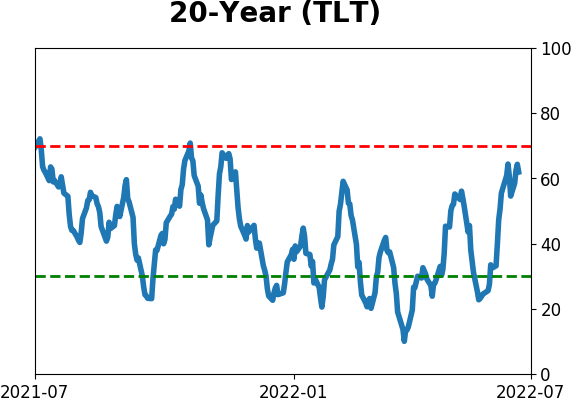
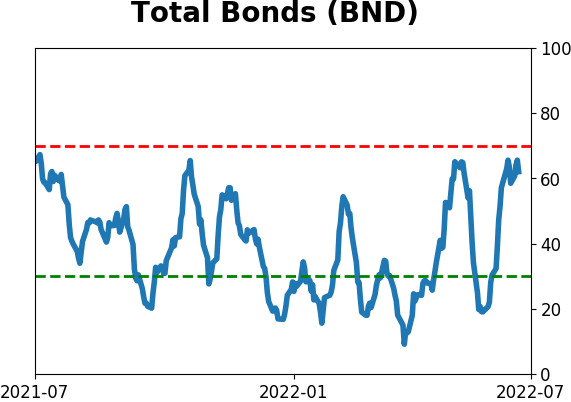
Bond ETF's - 10-Day Moving Average
|
|
|
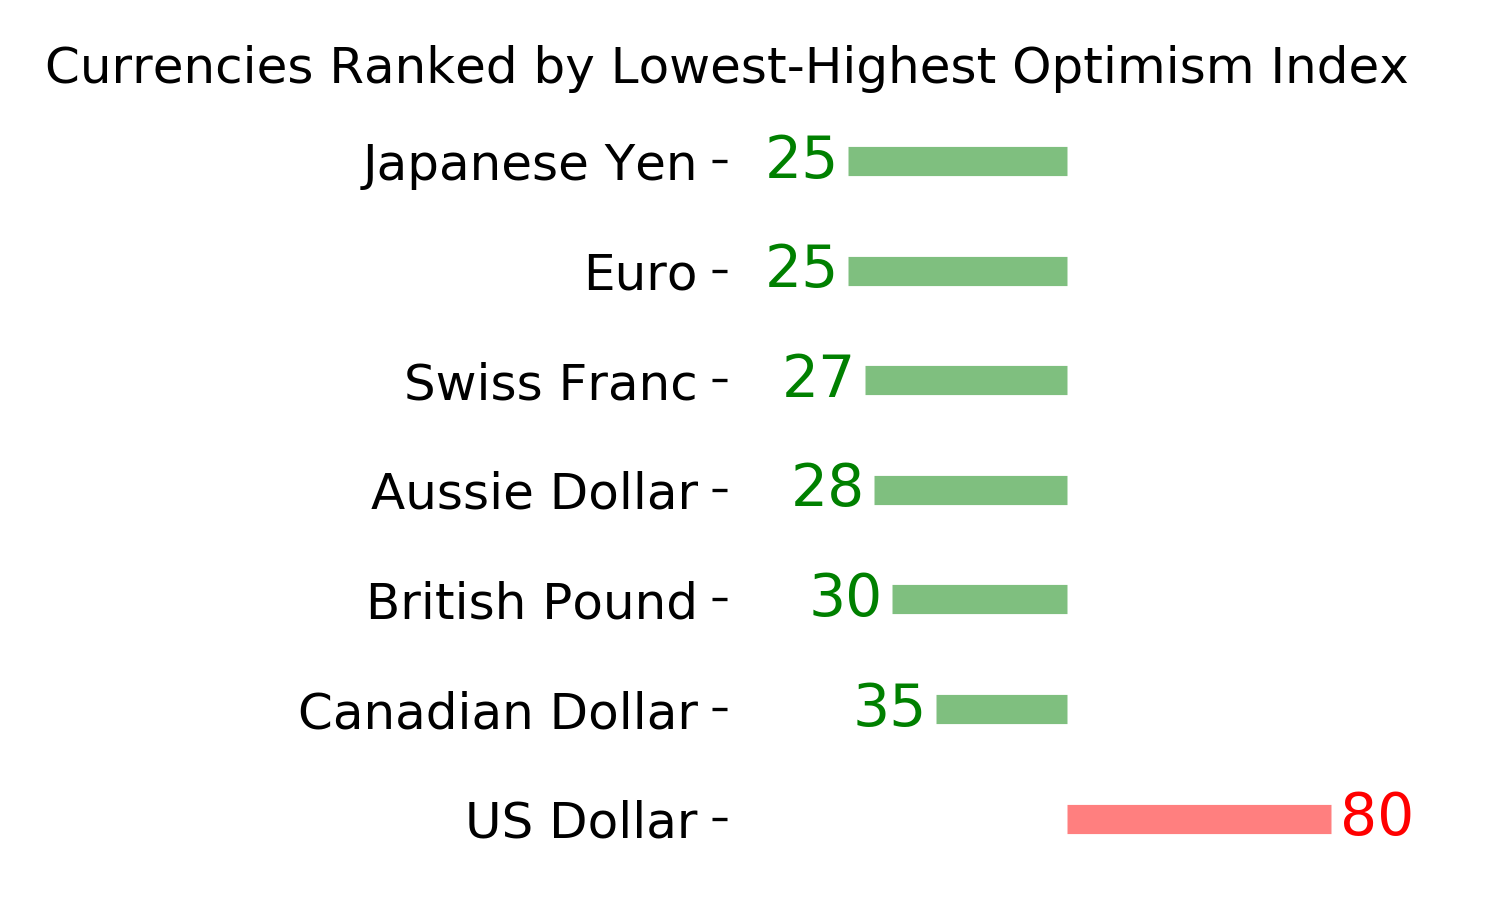
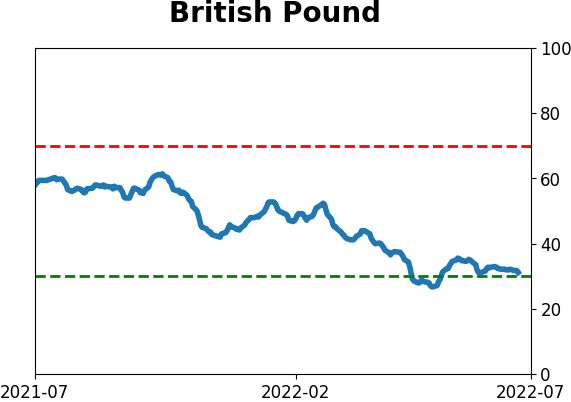
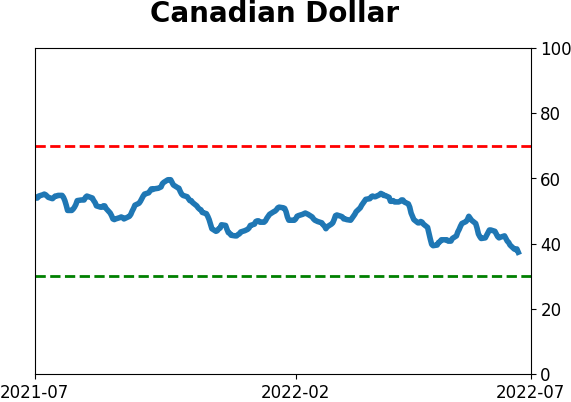
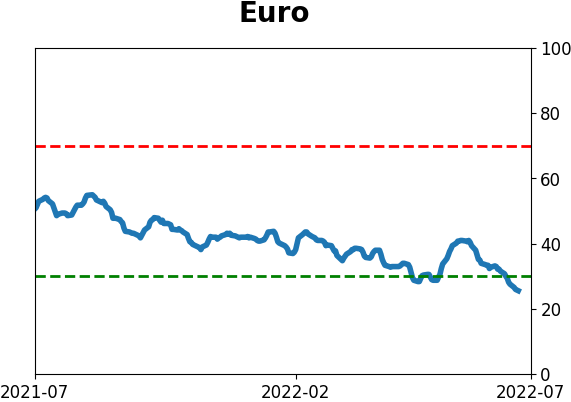
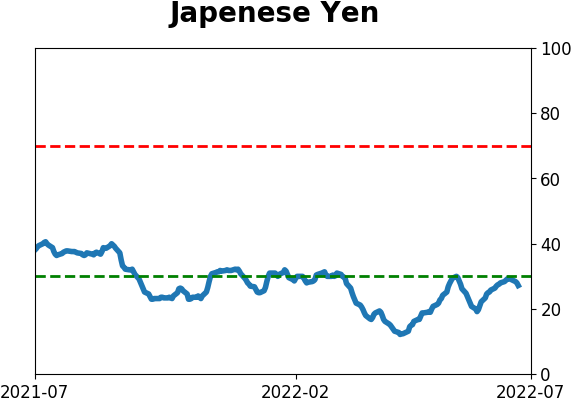
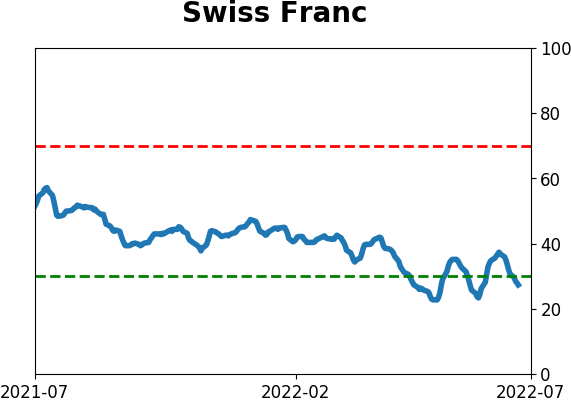
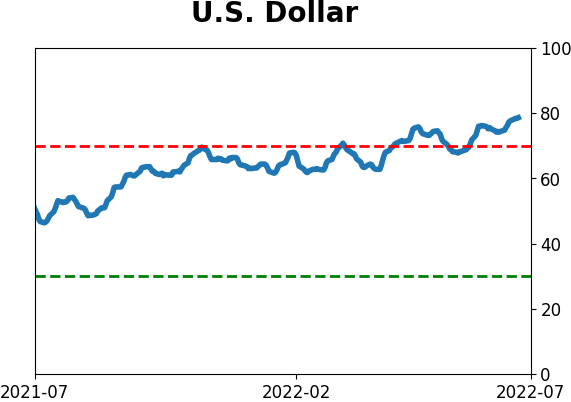
Currency ETF's - 5-Day Moving Average
|
|
|
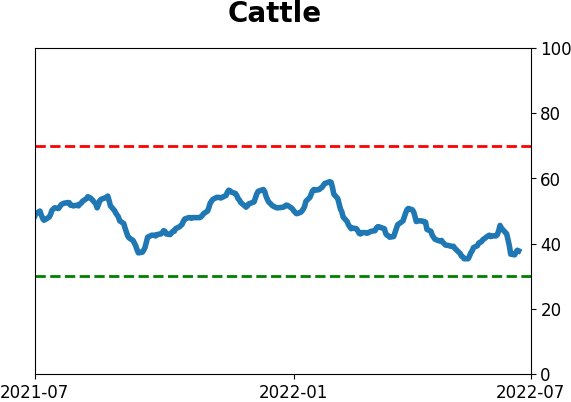
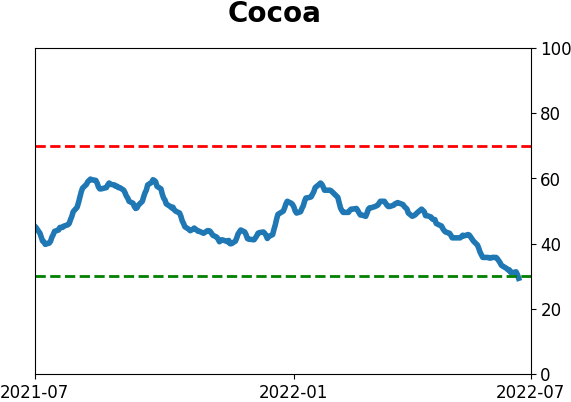
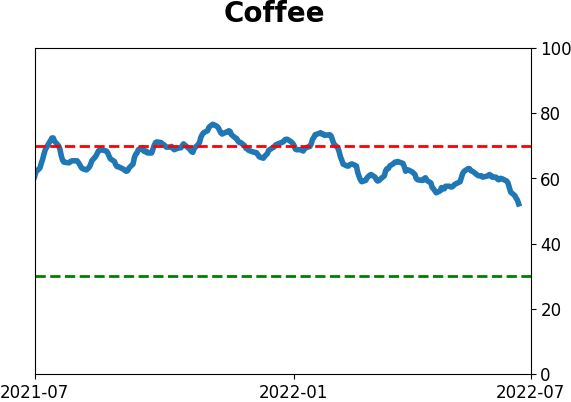
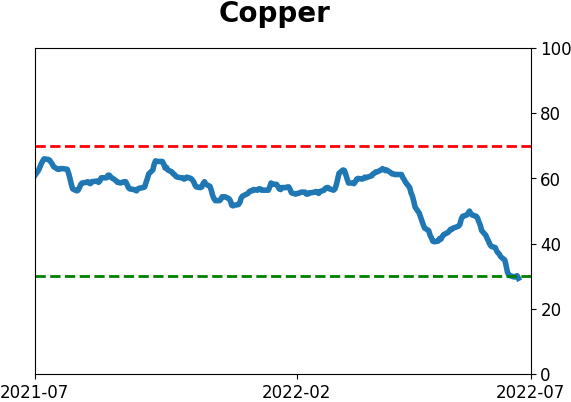
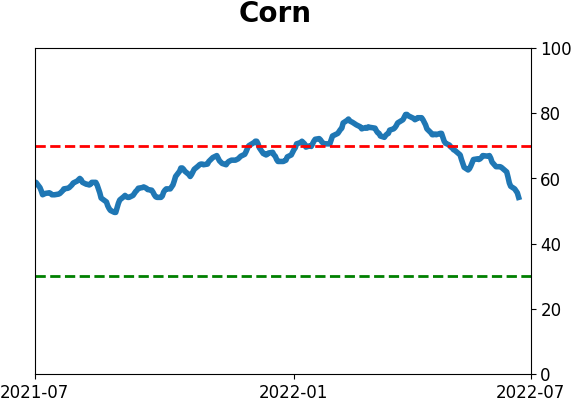
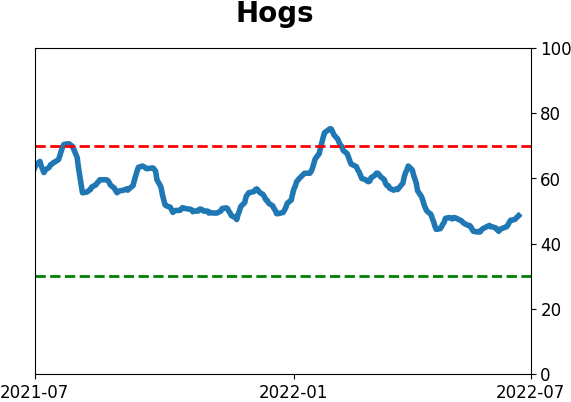
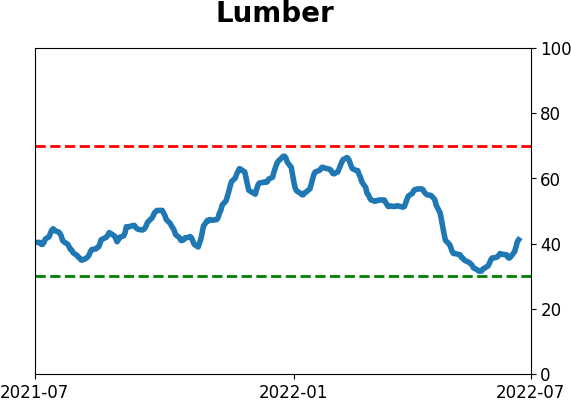
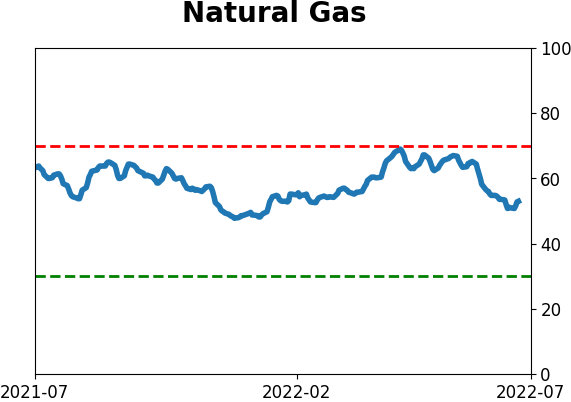
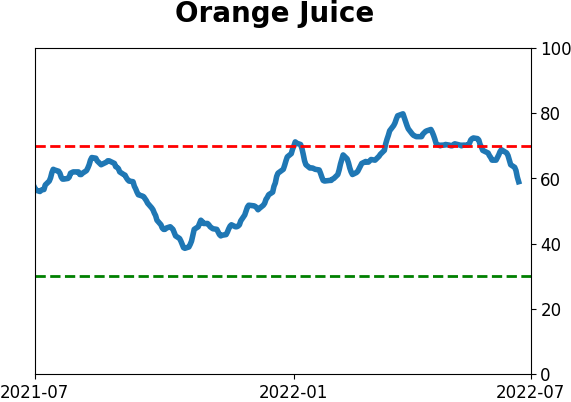
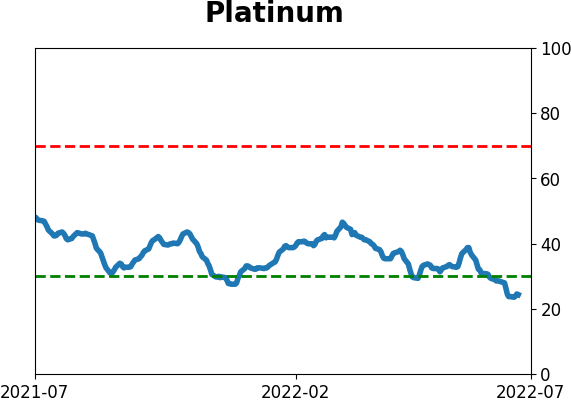
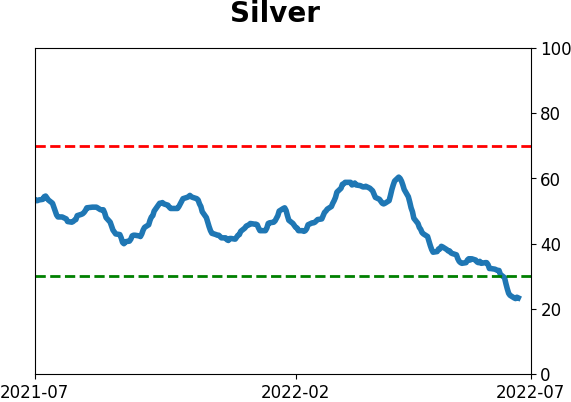
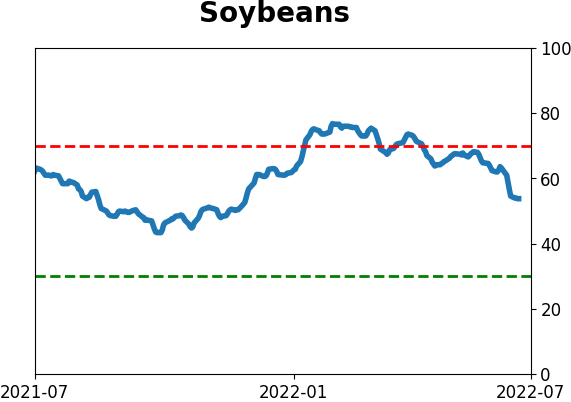
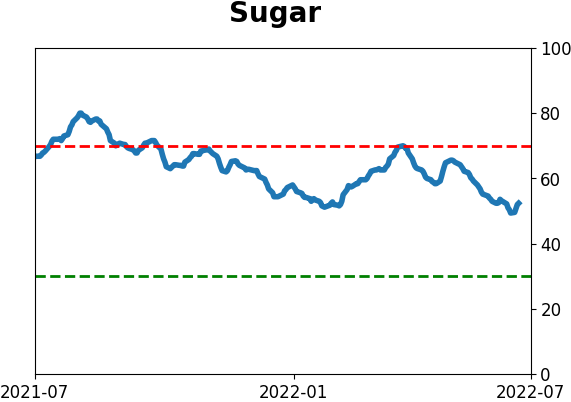
Commodity ETF's - 5-Day Moving Average
|
|