Headlines
|
|
Small Caps' Plunging Correlation to Growth, Tech:
The correlation between Small-Cap stocks and Growth stocks has plunged to an 80-year low. This is primarily due to the Technology sector, which is also showing an extremely low correlation to Small-Cap stocks. The other times this happened, Small-Caps tended to outperform.
Bottom Line:
See the Outlook & Allocations page for more details on these summaries STOCKS: Hold
The speculative frenzy in February is wrung out. Internal dynamics have mostly held up, with some exceptions. Many of our studies still show a mixed to poor short-term view, with medium- and long-term ones turning more positive. BONDS: Hold
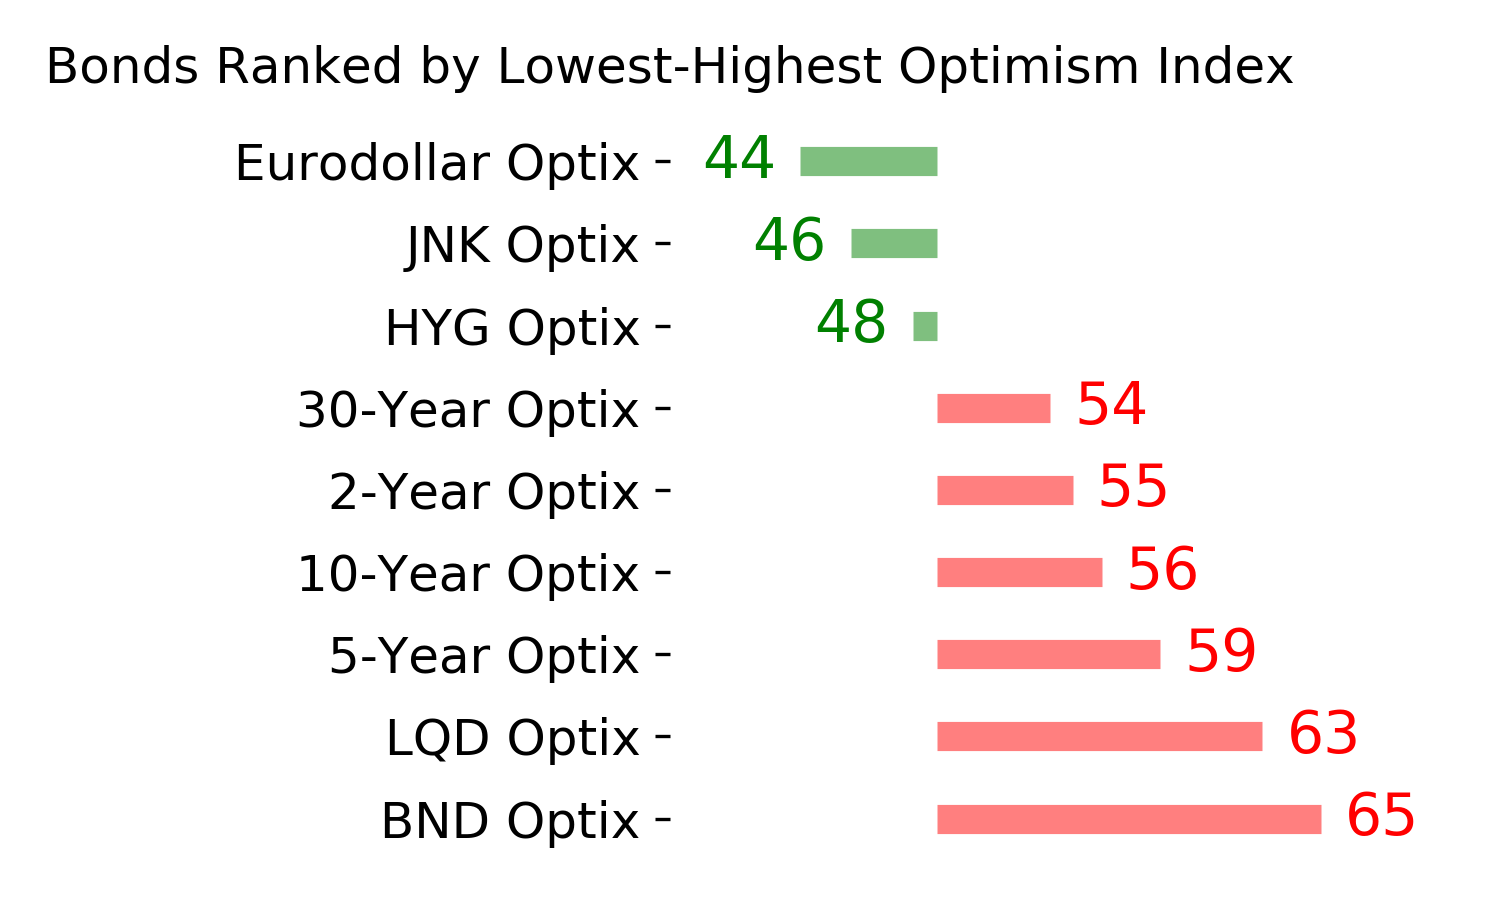
Various parts of the market got hit in March, with the lowest Bond Optimism Index we usually see during healthy environments. After a shaky couple of weeks, the broad bond market has modestly recovered. Not a big edge here either way. GOLD: Hold
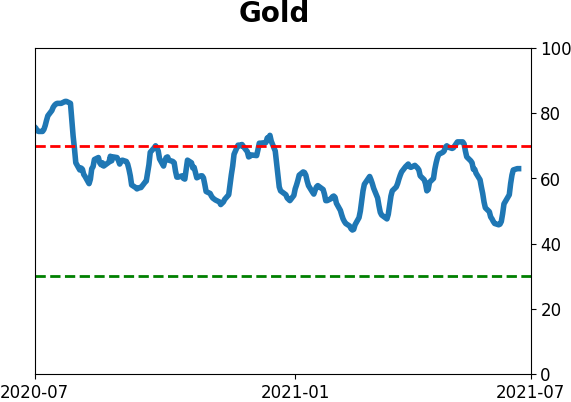
Gold and miners have done very well, recovering above long-term trend lines. The issue is that both have tended to perform poorly after similar situations - will have to wait and see how it plays out.
|
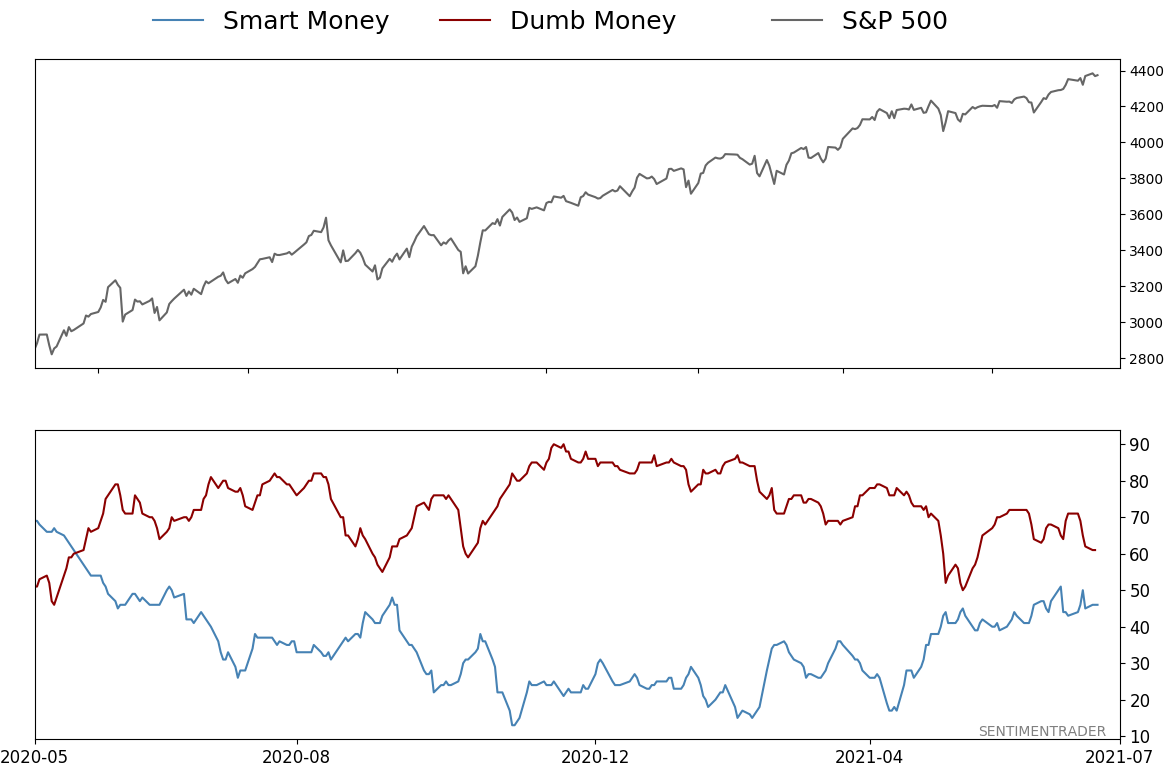
Smart / Dumb Money Confidence
|
Smart Money Confidence: 46%
Dumb Money Confidence: 61%
|
|
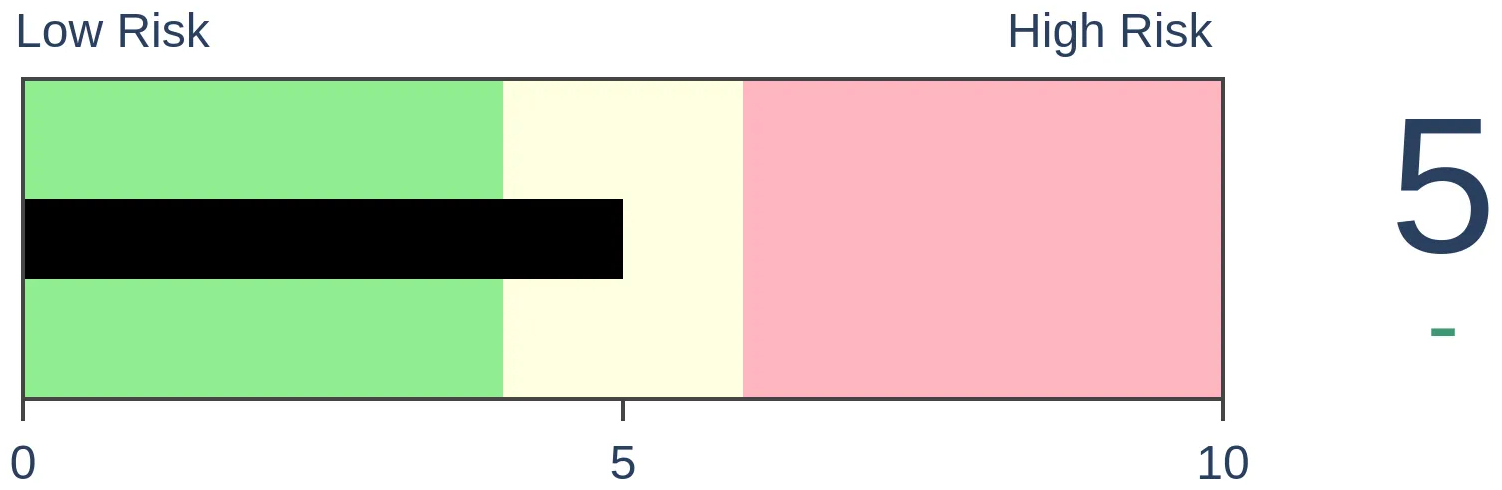
Risk Levels
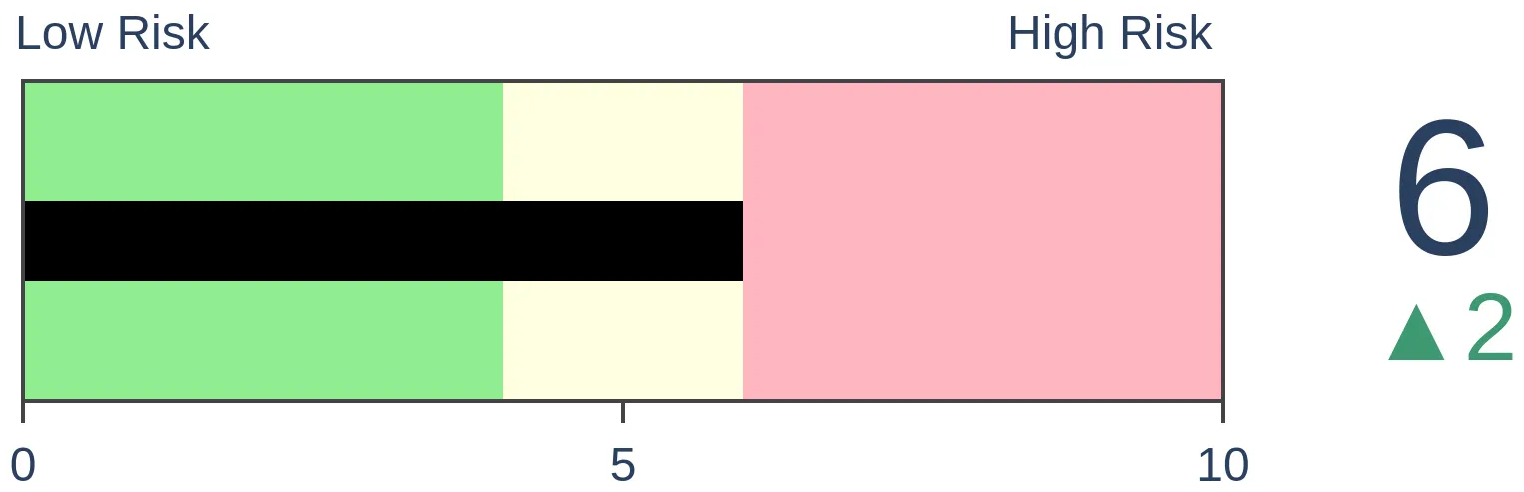
Stocks Short-Term

|
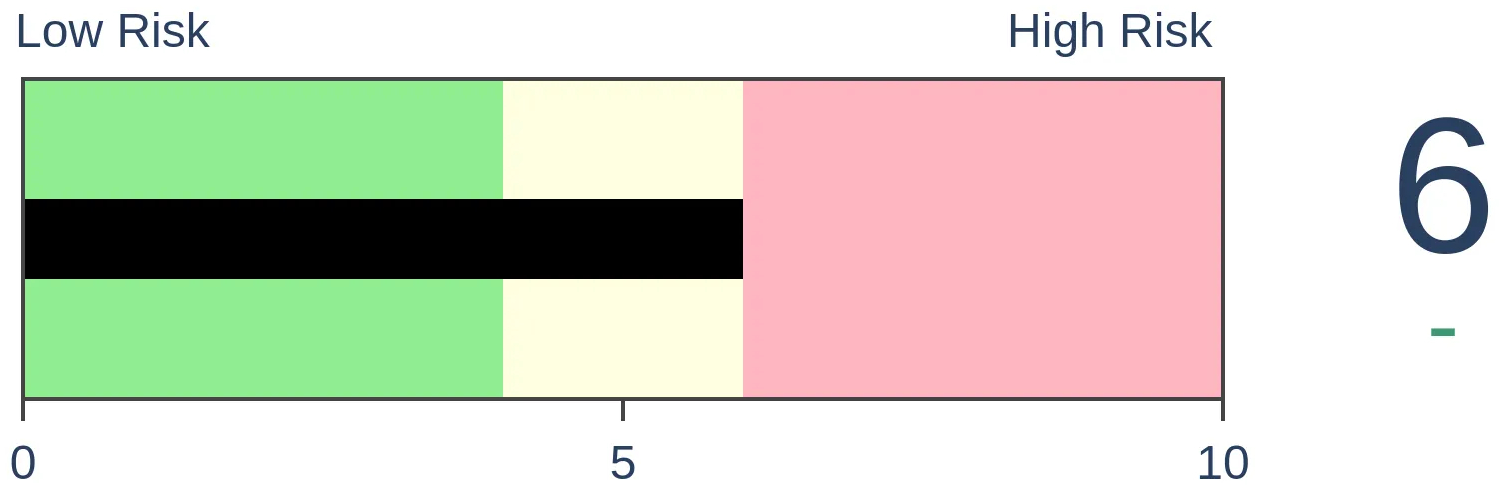
Stocks Medium-Term

|
|
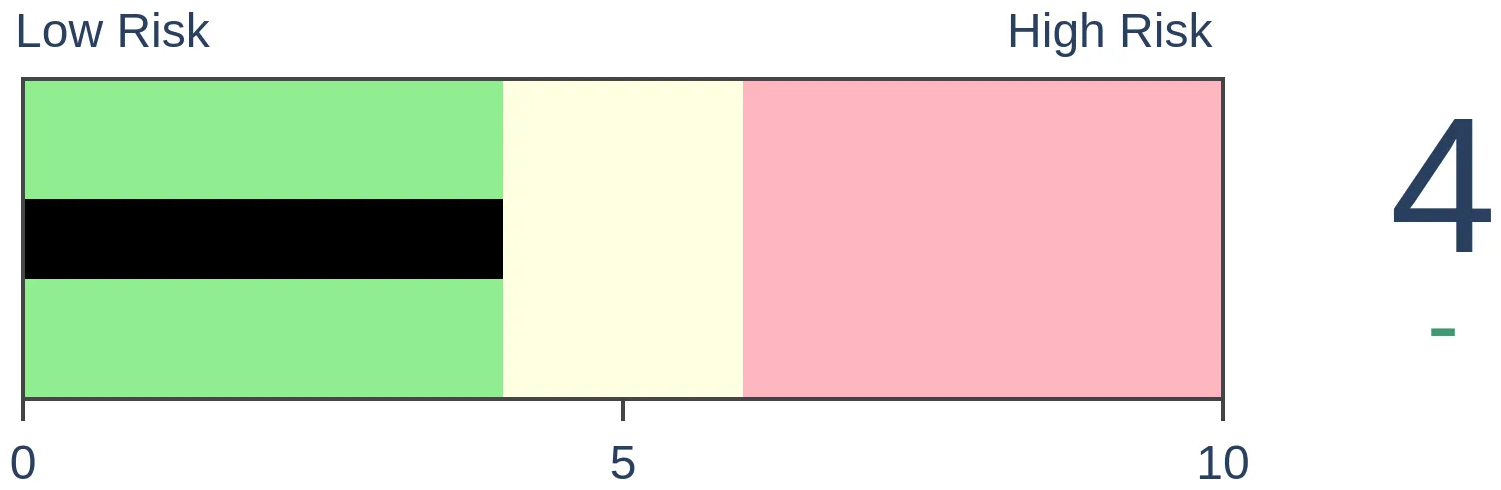
Bonds
|
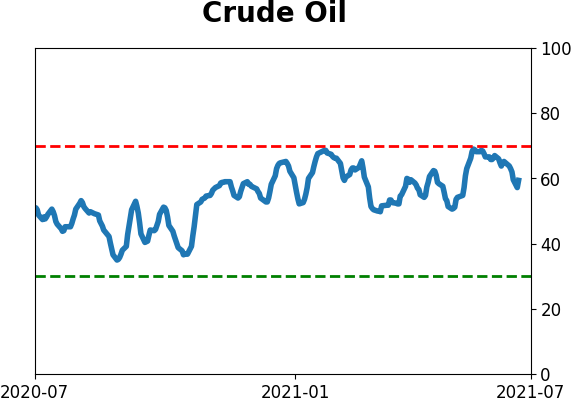
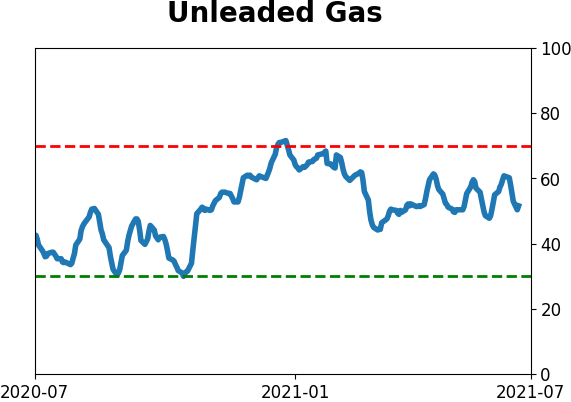
Crude Oil
|
|
Gold
|
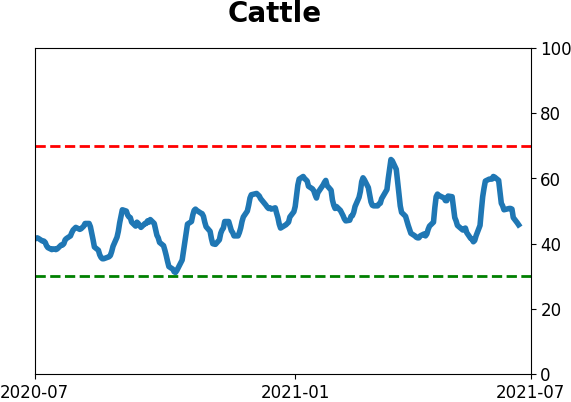
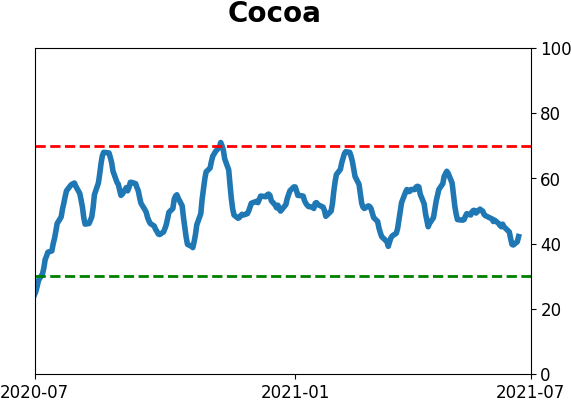
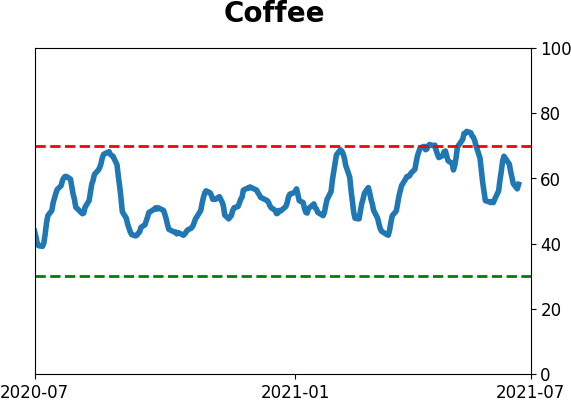
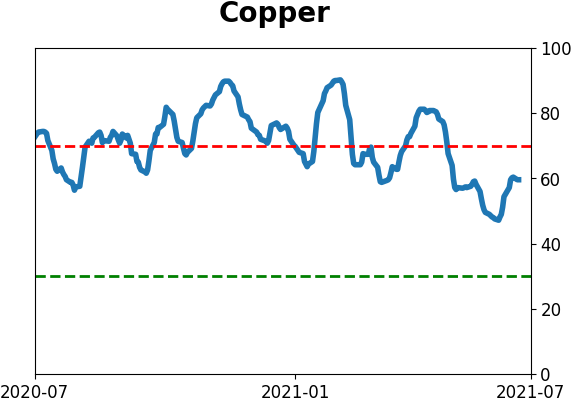
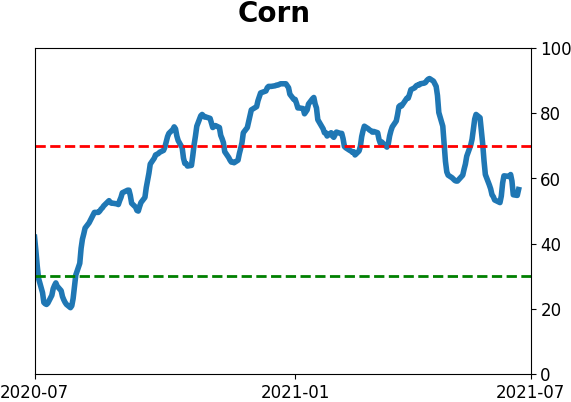
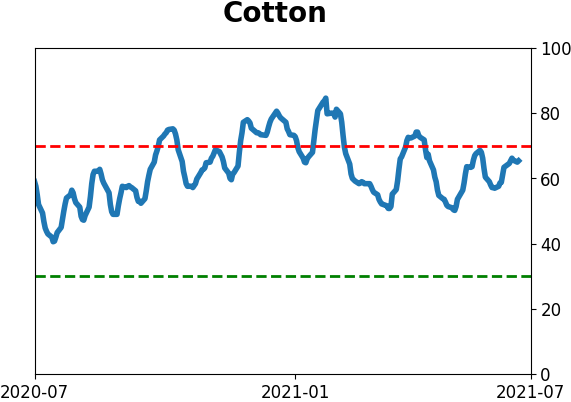
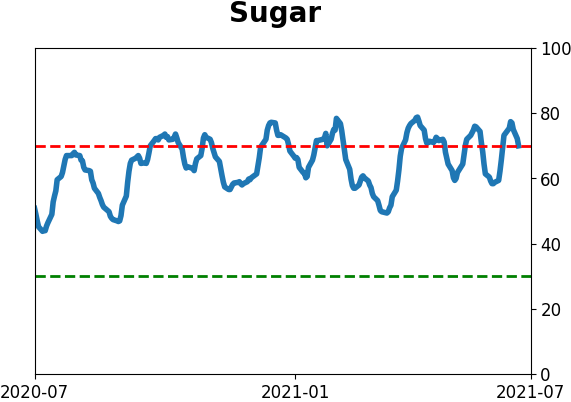
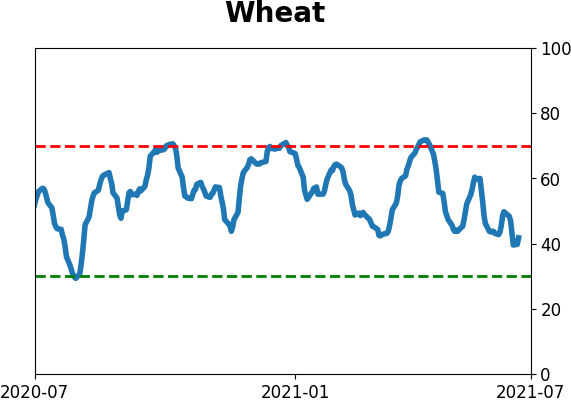
Agriculture
|
|
Research
BOTTOM LINE
The correlation between Small-Cap stocks and Growth stocks has plunged to an 80-year low. This is primarily due to the Technology sector, which is also showing an extremely low correlation to Small-Cap stocks. The other times this happened, Small-Caps tended to outperform.
FORECAST / TIMEFRAME
None
|
Investors are having a tough time keeping a grasp on things. So are we, with some of the oddest, whippiest few stretches in market history.
Stock indexes have been levitating at record highs, but there is a lot of tumult under the surface. Even within solid indexes like the S&P 500, a near-record low number of stocks are managing to hang onto their medium-term trends.
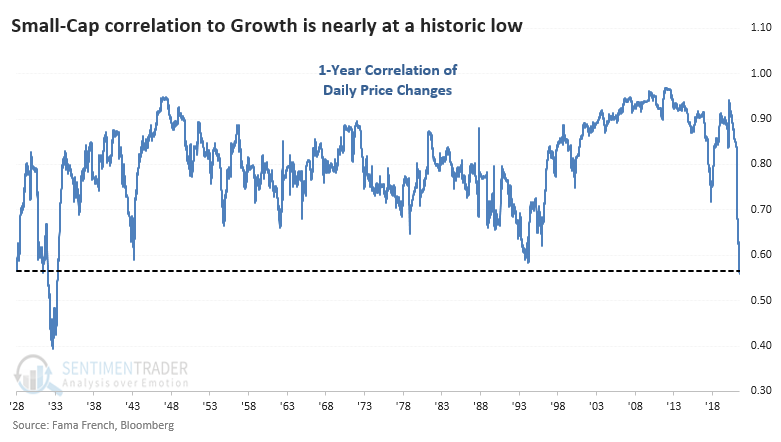
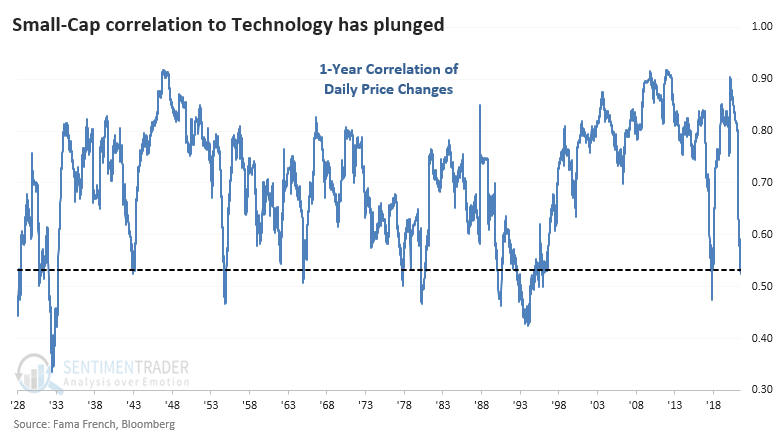
Some of the rotation has been vicious. Among sectors and factors, none is more evident than between Small-Cap stocks and Growth. Over the past year, the correlation between those two factors has plunged to the lowest since 1933.
TECH IS TO BLAME (OR CREDIT)
To a large extent, Growth = Technology, and we can see a similar plunge in that correlation. The rolling 1-year correlation between Small-Caps and Technology has just nosedived and is nearing its prior recent low from the end of 2017.
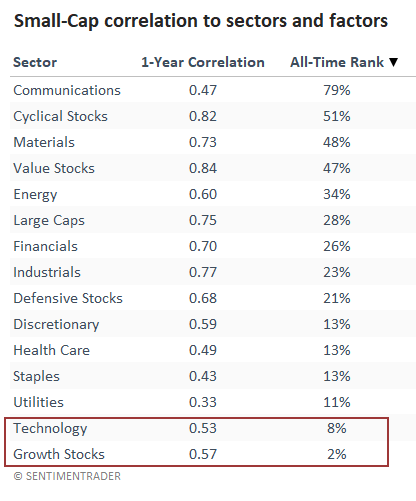
Looking at Small-Caps' correlation to major sectors and factors, Growth and Technology rank at the bottom of the list, both in the bottom 10% of their all-time ranges.
LOW CORRELATIONS' CORRELATION TO FUTURE RETURNS
As for what it means for future returns, for the broader market, the answer was, "not much."
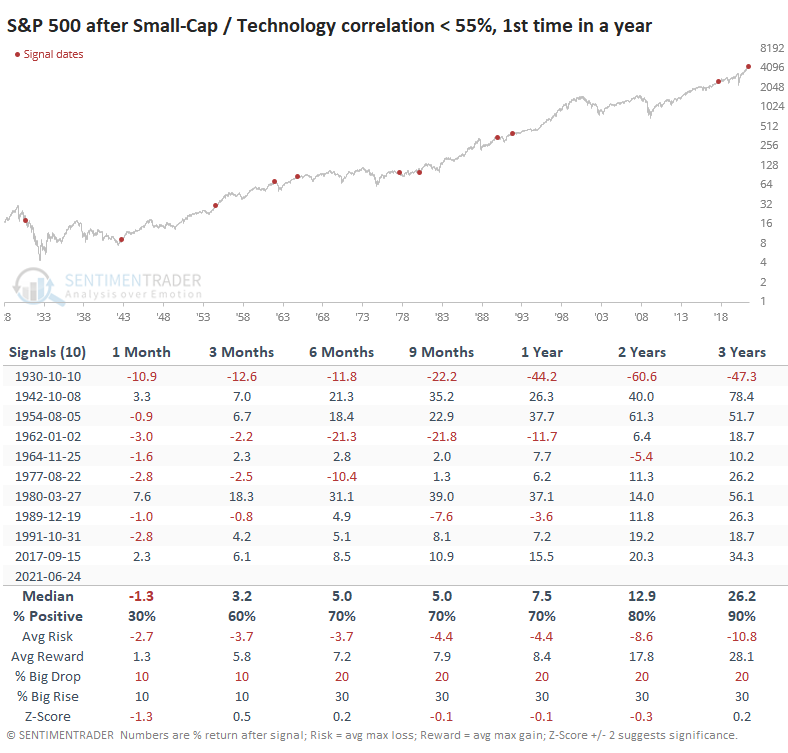
The S&P 500's returns over the next 9-24 months were below random, with a relatively poor risk/reward ratio, but it wasn't consistent. It did precede the meltdown in the early 1930s and the malaise of the '60s, but other than that, returns were mostly fine.
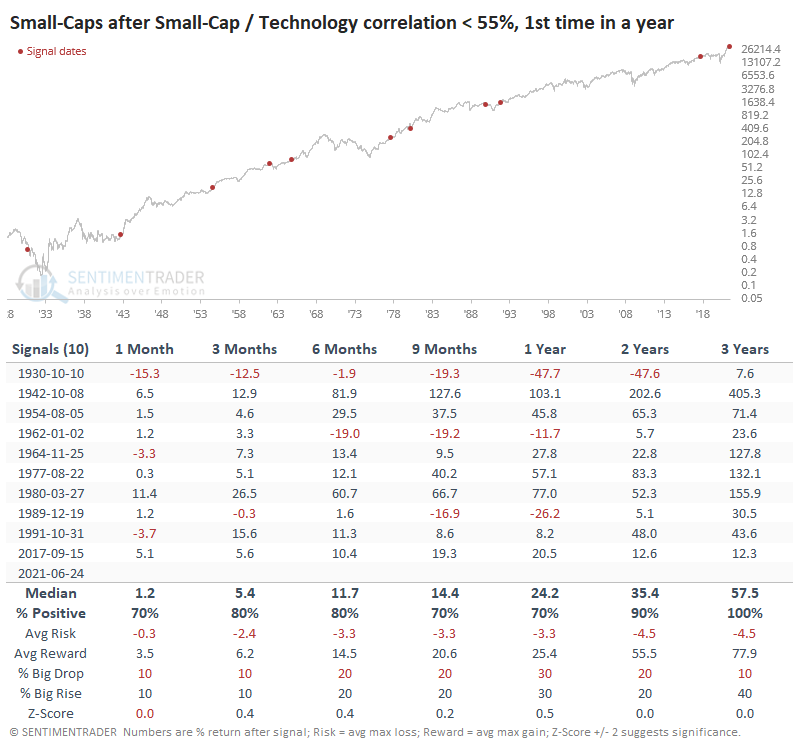
Small-Cap stocks tended to do better, with no losses over the next 3 years. There were a few major declines but more (and larger) rallies. The overall risk versus reward ratio across time frames was impressively positive.
Technology stocks did a bit worse, with lower average returns, more risk, and slightly less reward on several time frames.
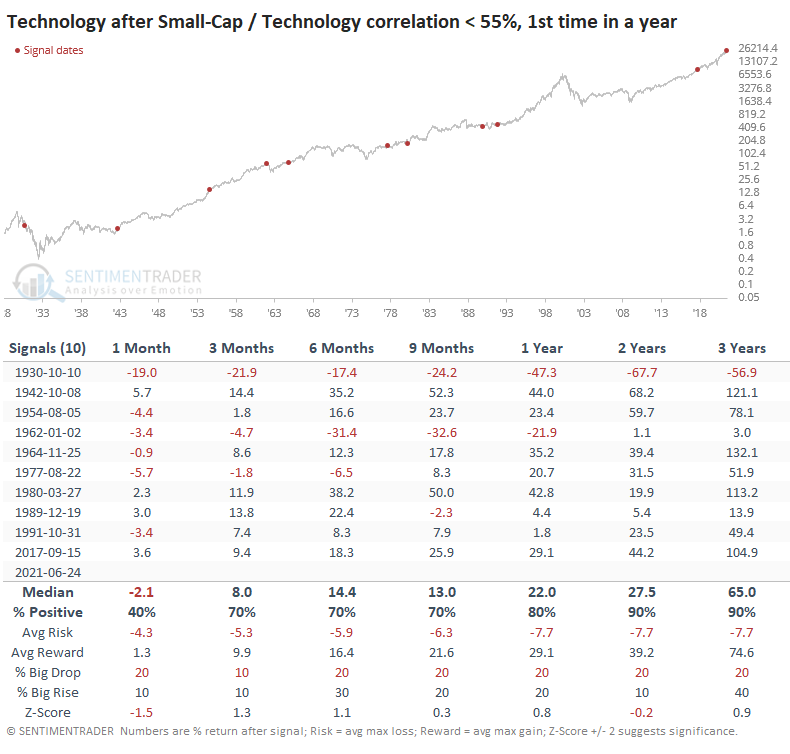
SMALL-CAP PROSPECTS VS. TECH
Those differences in future returns mean that Small-Cap stocks tended to do relatively better than Technology, and we can see that in the table below.
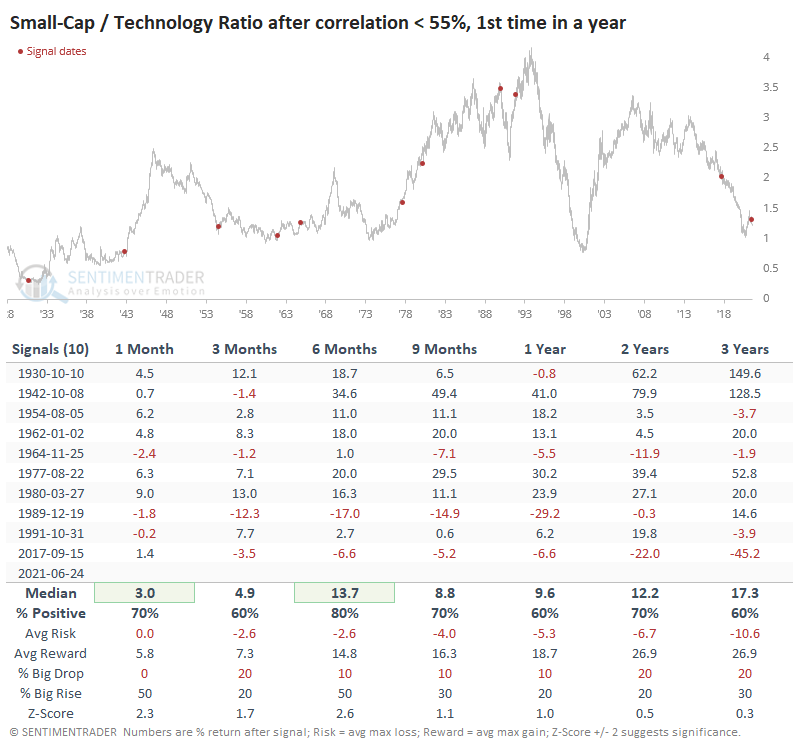
There were a couple of big misses, including the most recent signal from 2017. It also didn't work in late 1989 as the U.S. was heading into a recession. Other than those major exceptions, Small-Caps mostly outperformed across most time frames, with some major disparities in there.
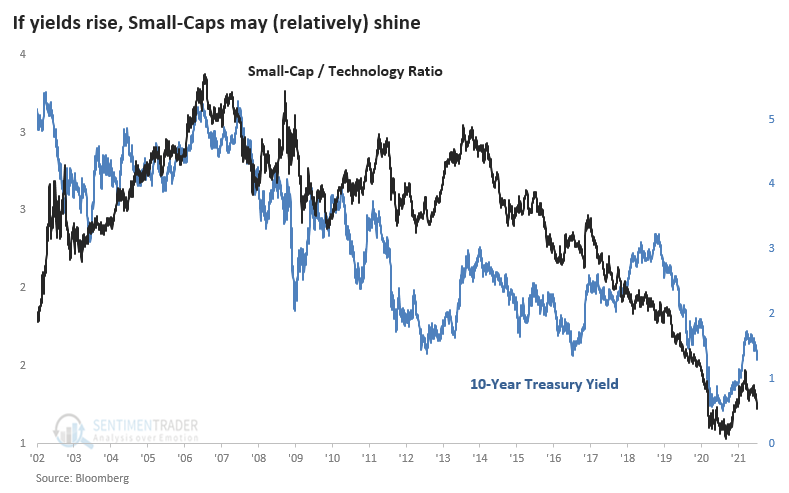
A big part of whether Small-Caps can regain and retain outperformance versus Technology may lie with the path of 10-year Treasury yields. Over the past 20 years, in particular, the two have closely followed each other.
The tumult under the surface of the indexes is being spun as either a positive or a negative, depending on the point of view (and portfolio positioning) of whoever is spouting the opinion. When we take an objective look at similar behavior and how investors reacted afterward, there isn't much support for a bearish argument. There is more support for the idea that Small-Caps could be a better place over the long term than Technology.
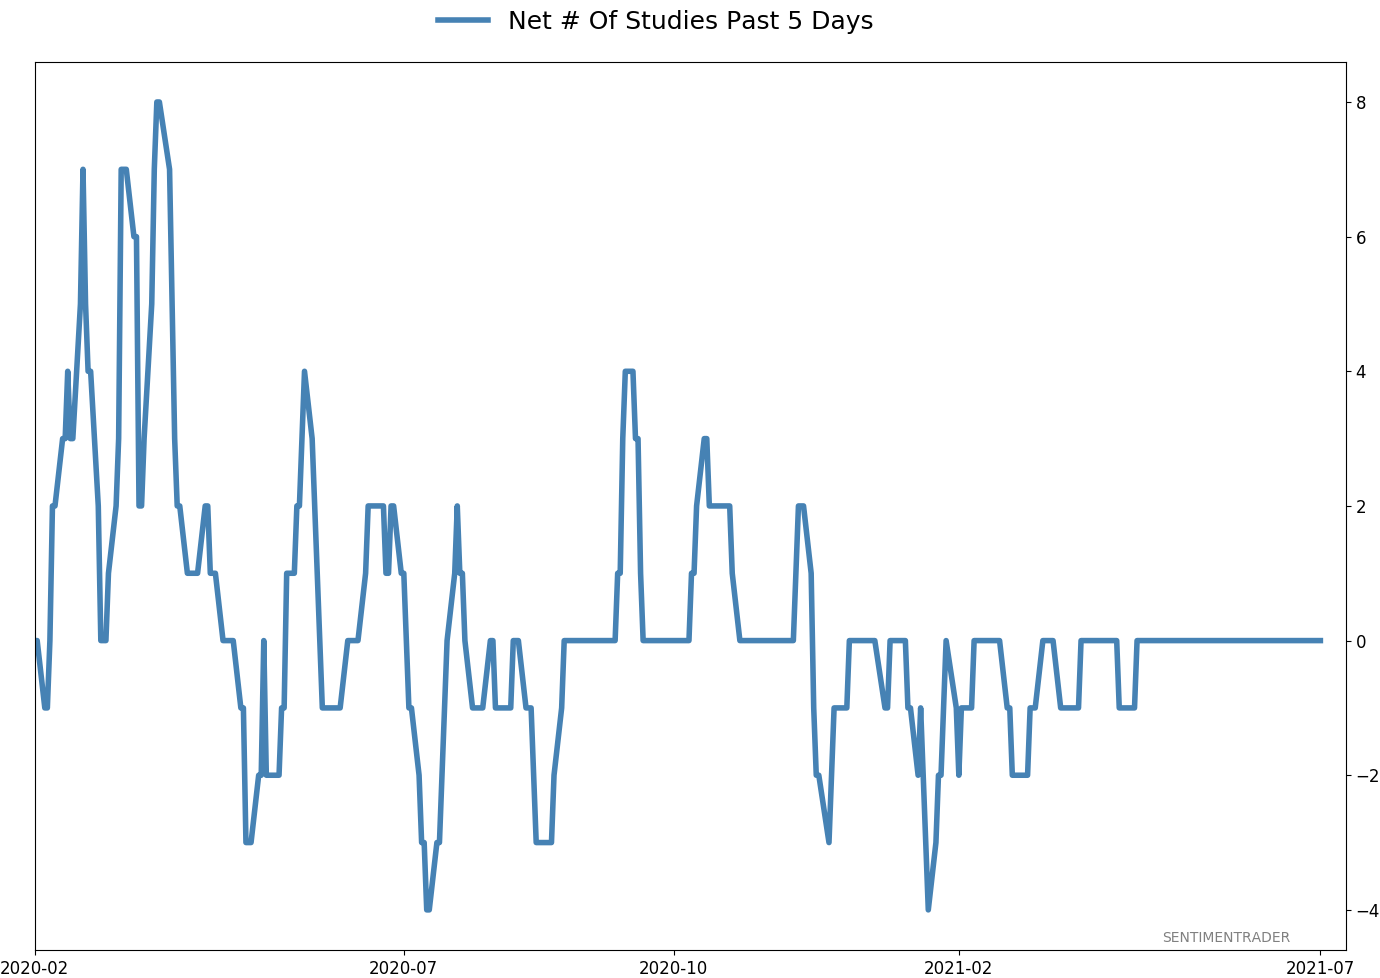
Active Studies
| Time Frame | Bullish | Bearish | | Short-Term | 0 | 1 | | Medium-Term | 2 | 3 | | Long-Term | 9 | 5 |
|
Indicators at Extremes
Portfolio
| Position | Description | Weight % | Added / Reduced | Date | | Stocks | RSP | 4.1 | Added 4.1% | 2021-05-19 | | Bonds | 23.9% BND, 6.9% SCHP | 30.7 | Reduced 7.1% | 2021-05-19 | | Commodities | GCC | 2.6 | Reduced 2.1%
| 2020-09-04 | | Precious Metals | GDX | 5.6 | Reduced 4.2% | 2021-05-19 | | Special Situations | 4.3% XLE, 2.2% PSCE | 7.6 | Reduced 5.6% | 2021-04-22 | | Cash | | 49.4 | | |
|
Updates (Changes made today are underlined)
Much of our momentum and trend work has remained positive for several months, with some scattered exceptions. Almost all sentiment-related work has shown a poor risk/reward ratio for stocks, especially as speculation drove to record highs in exuberance in February. Much of that has worn off, and most of our models are back toward neutral levels. There isn't much to be excited about here. The same goes for bonds and even gold. Gold has been performing well lately and is back above long-term trend lines. The issue is that it has a poor record of holding onto gains when attempting a long-term trend change like this, so we'll take a wait-and-see approach. RETURN YTD: 9.1% 2020: 8.1%, 2019: 12.6%, 2018: 0.6%, 2017: 3.8%, 2016: 17.1%, 2015: 9.2%, 2014: 14.5%, 2013: 2.2%, 2012: 10.8%, 2011: 16.5%, 2010: 15.3%, 2009: 23.9%, 2008: 16.2%, 2007: 7.8%
|
|
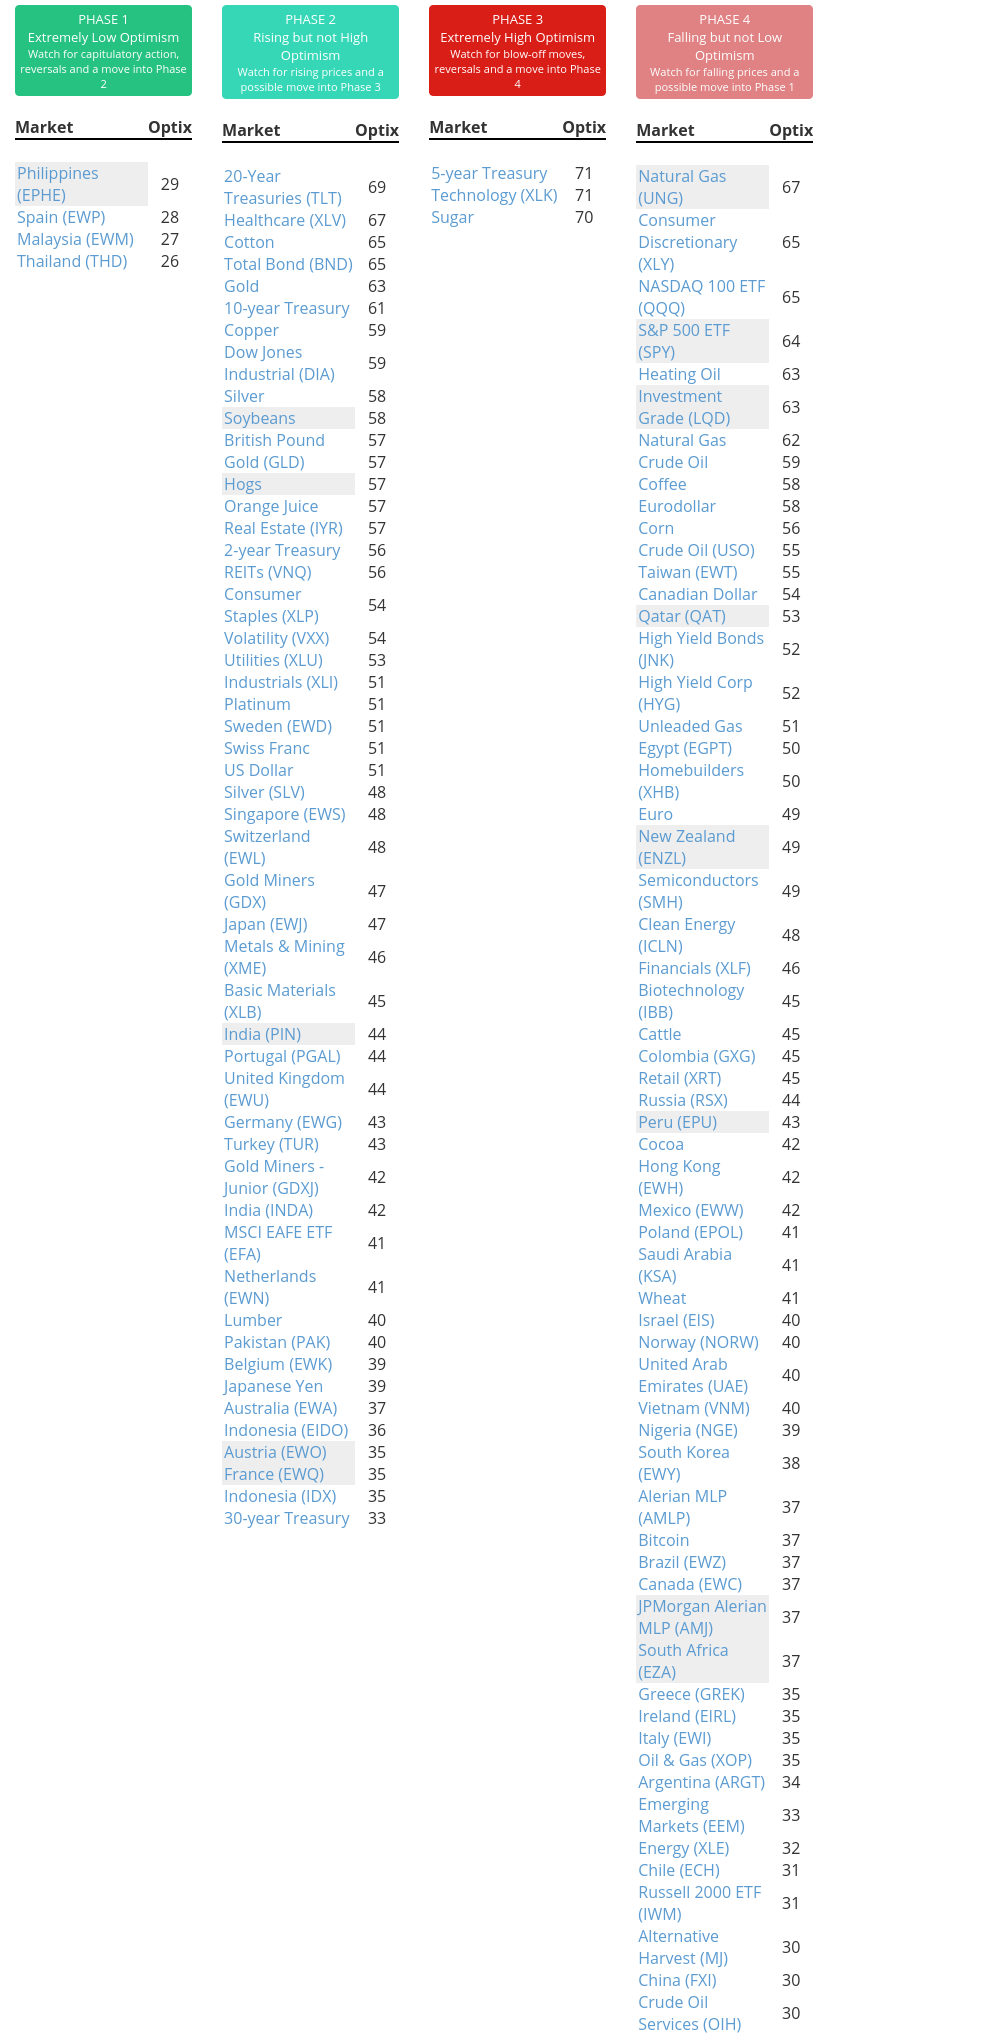
Phase Table
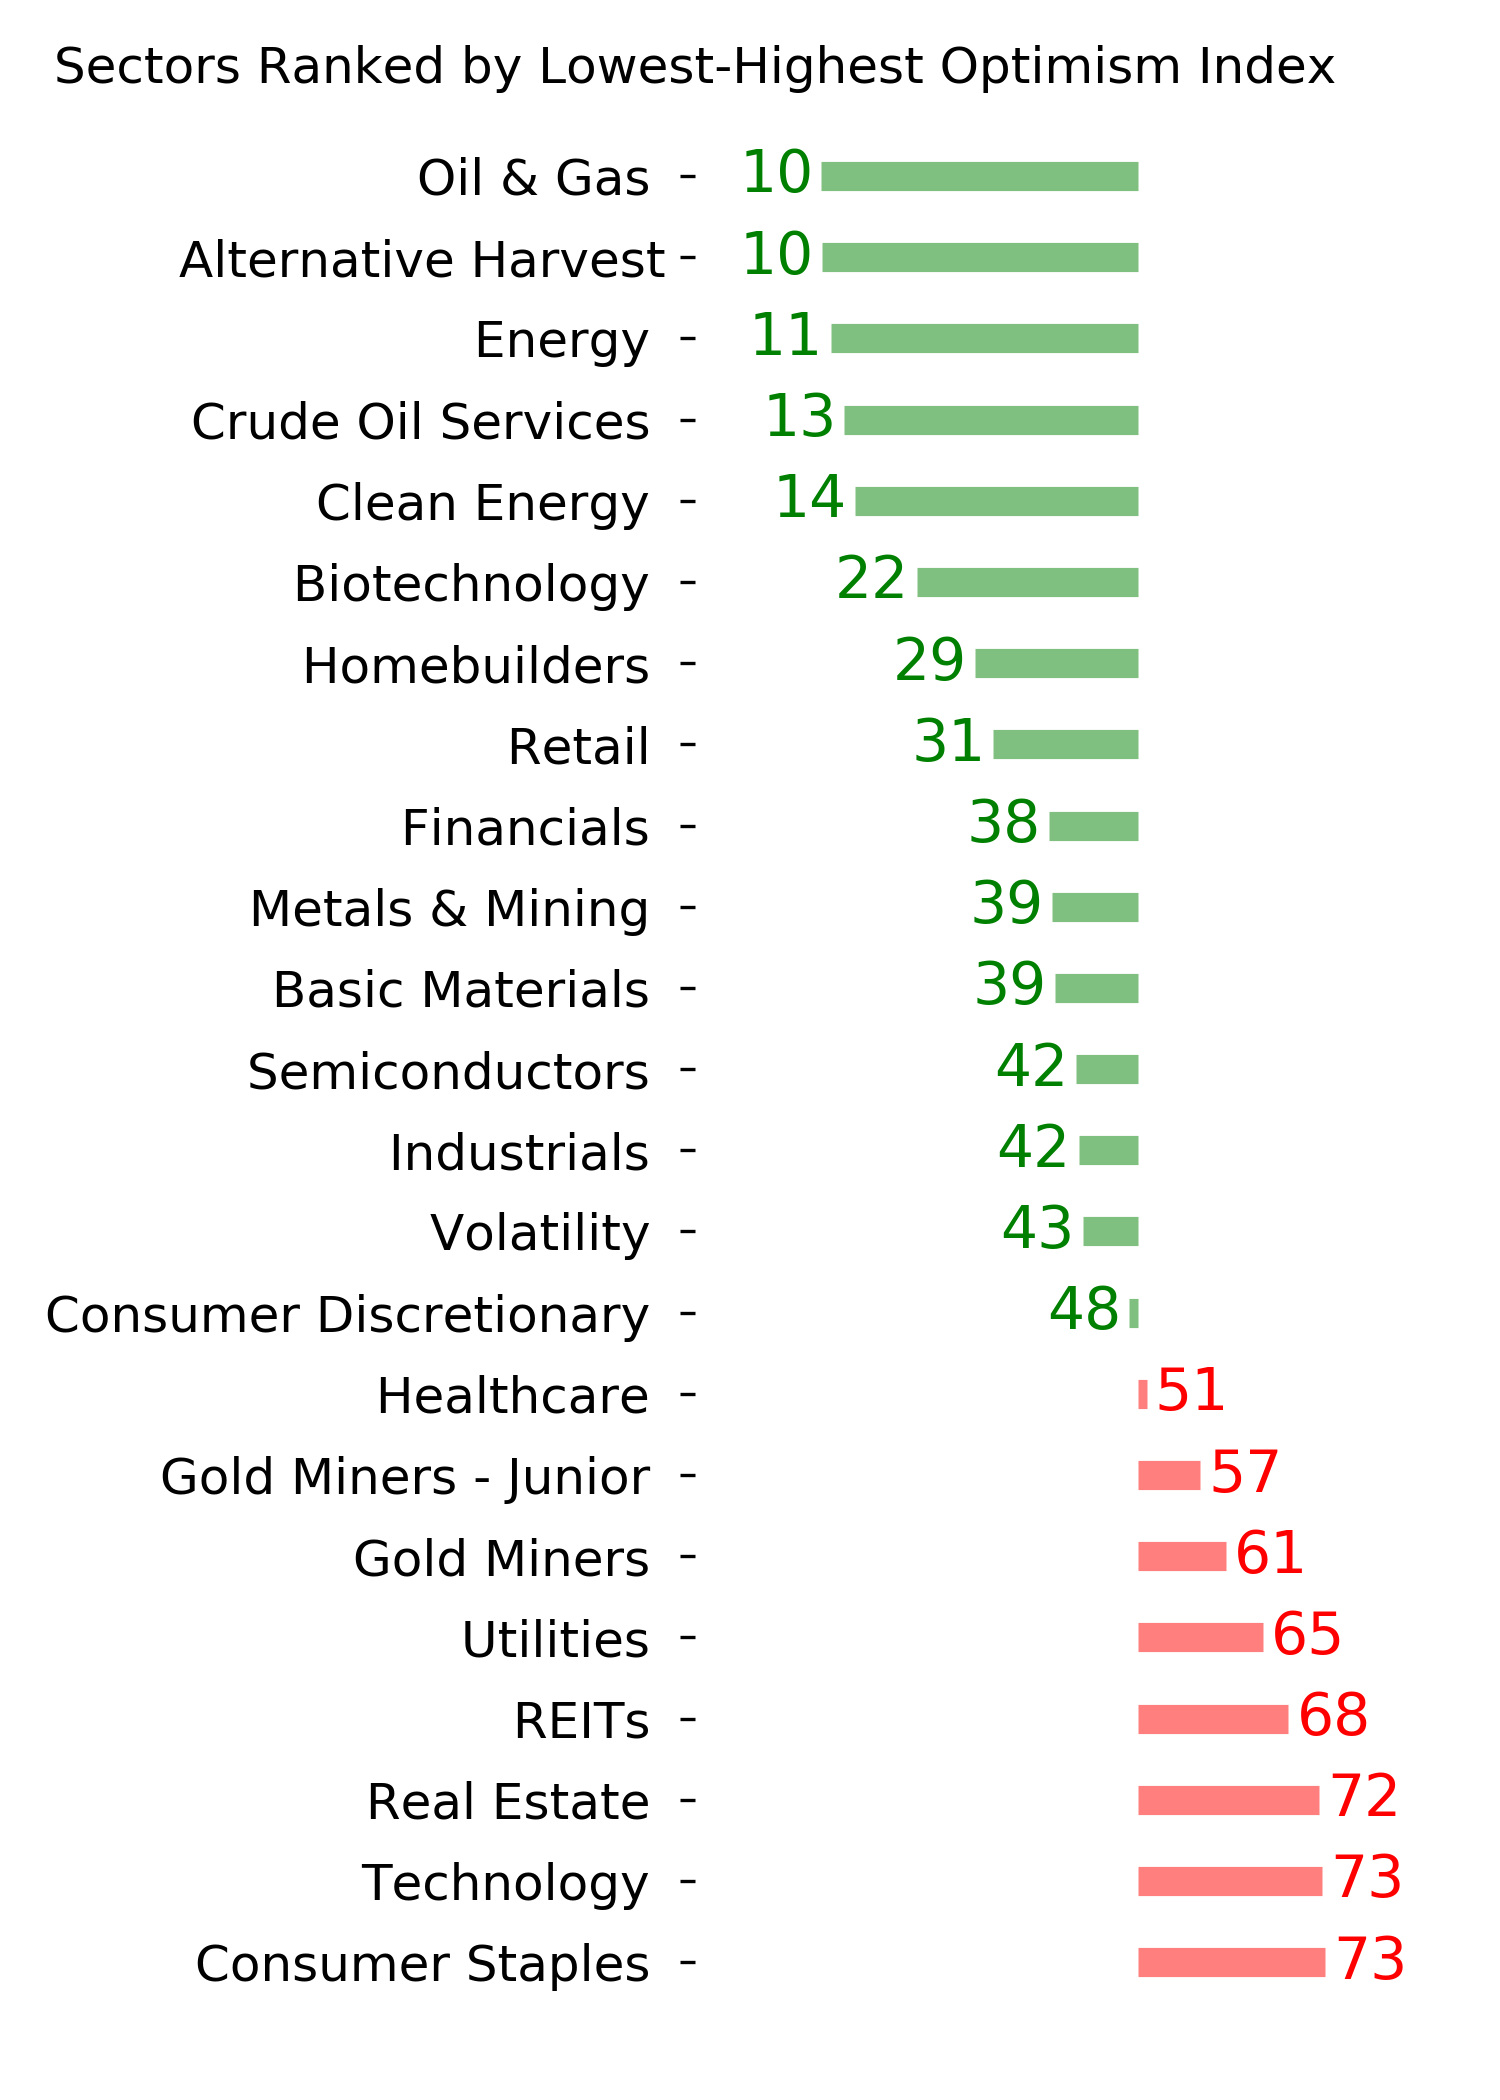
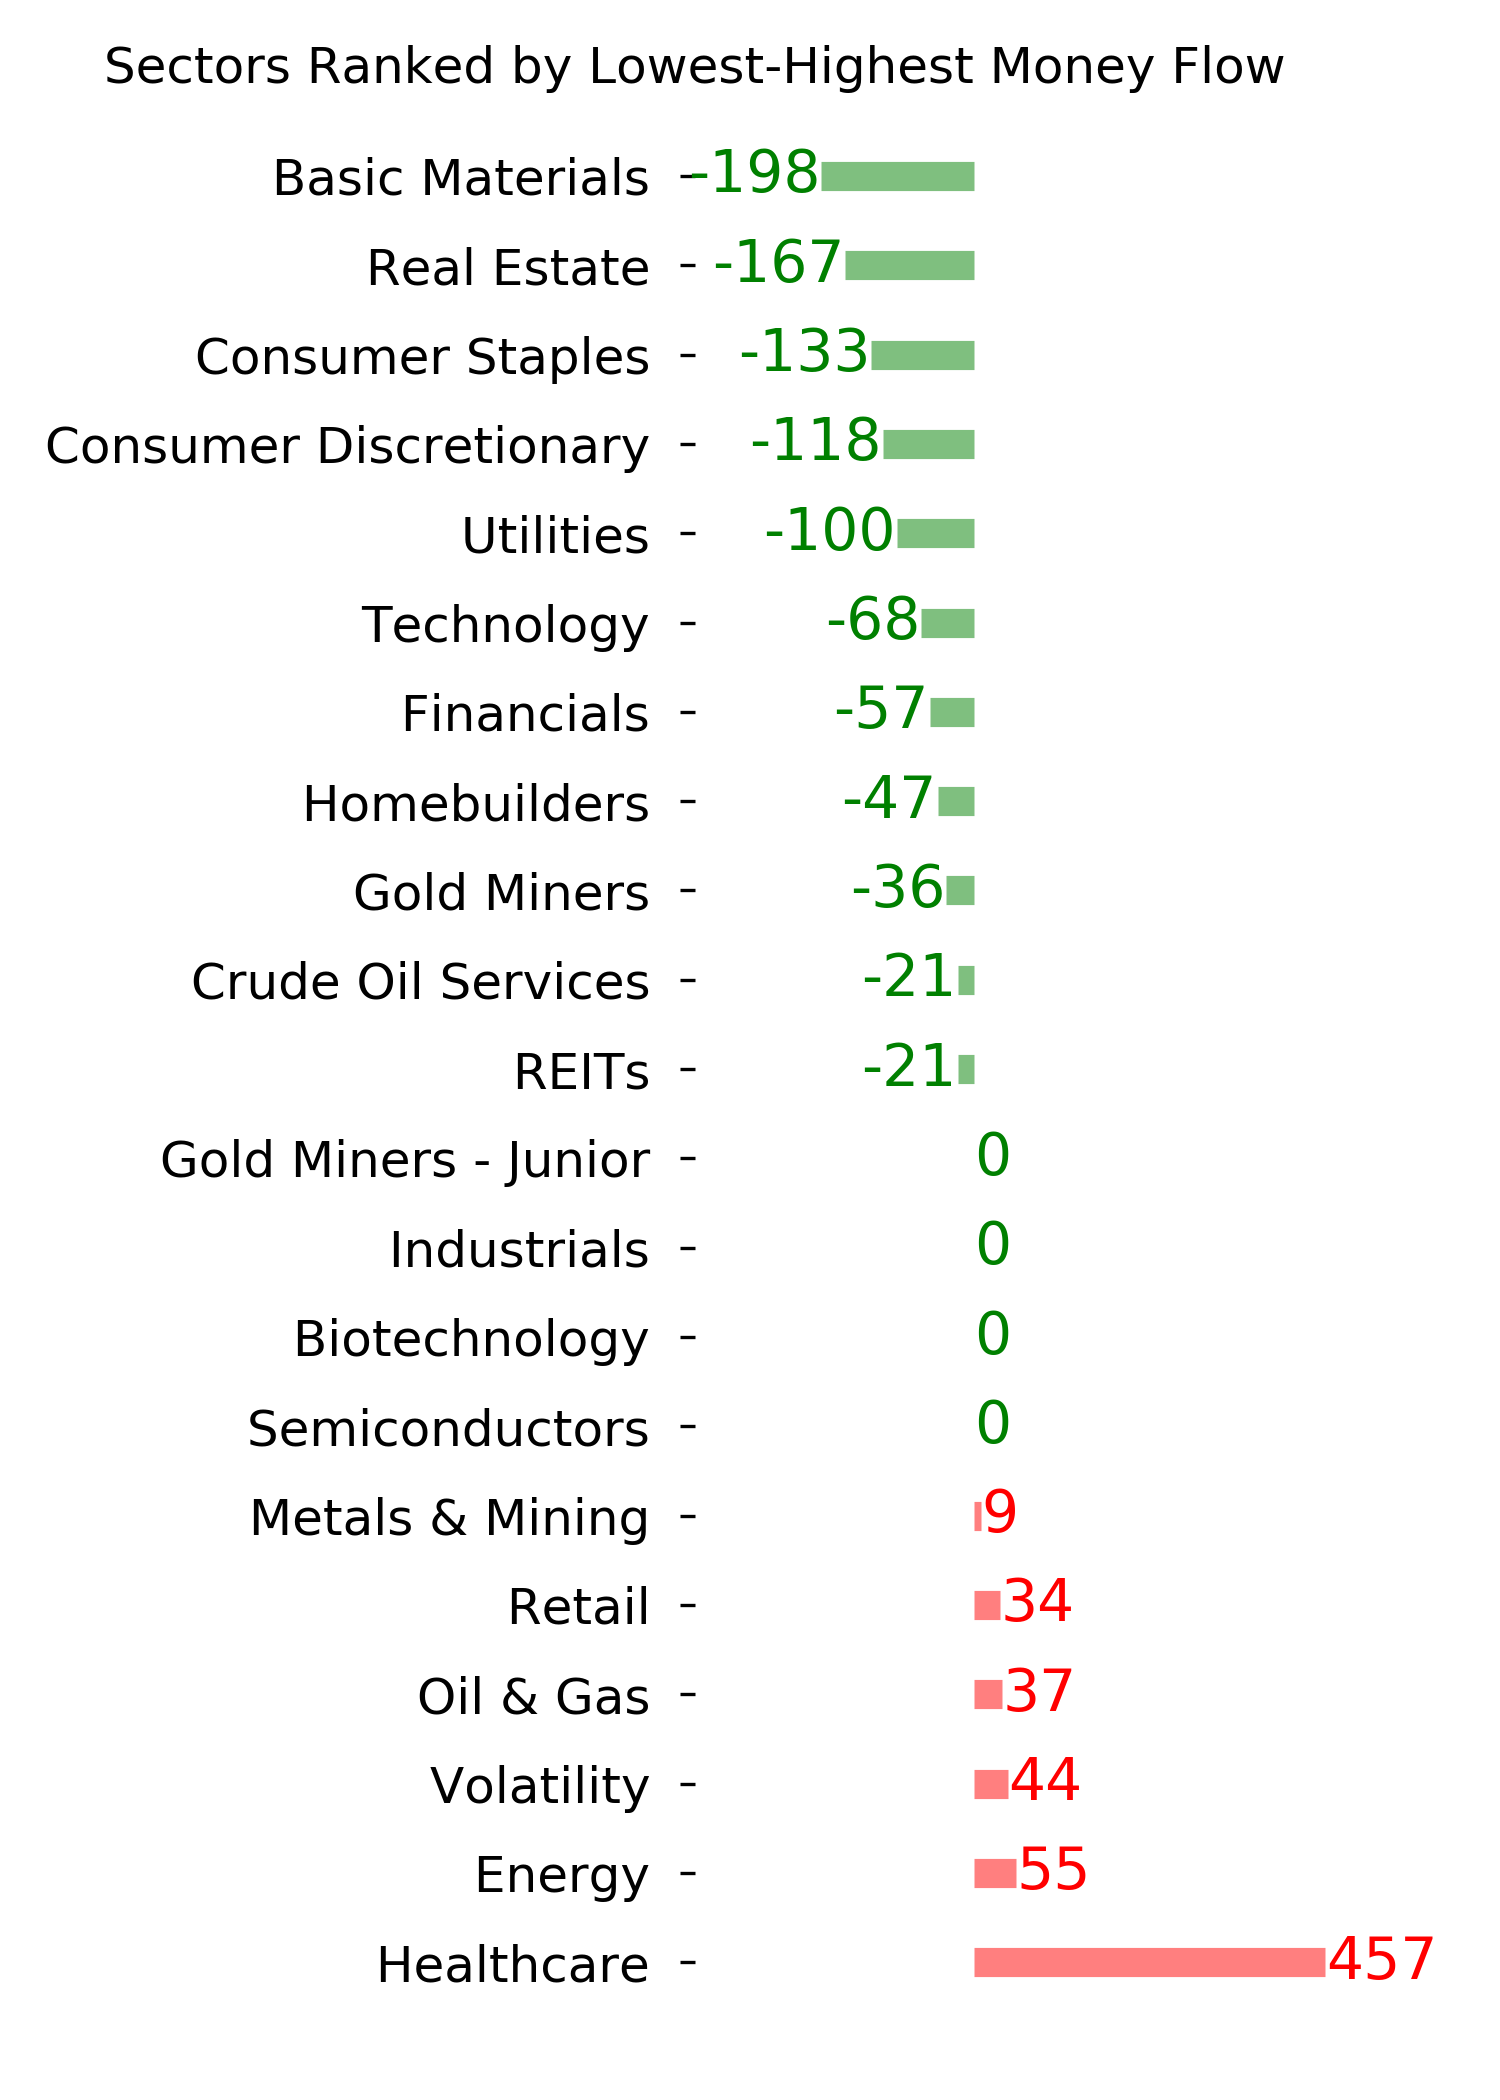
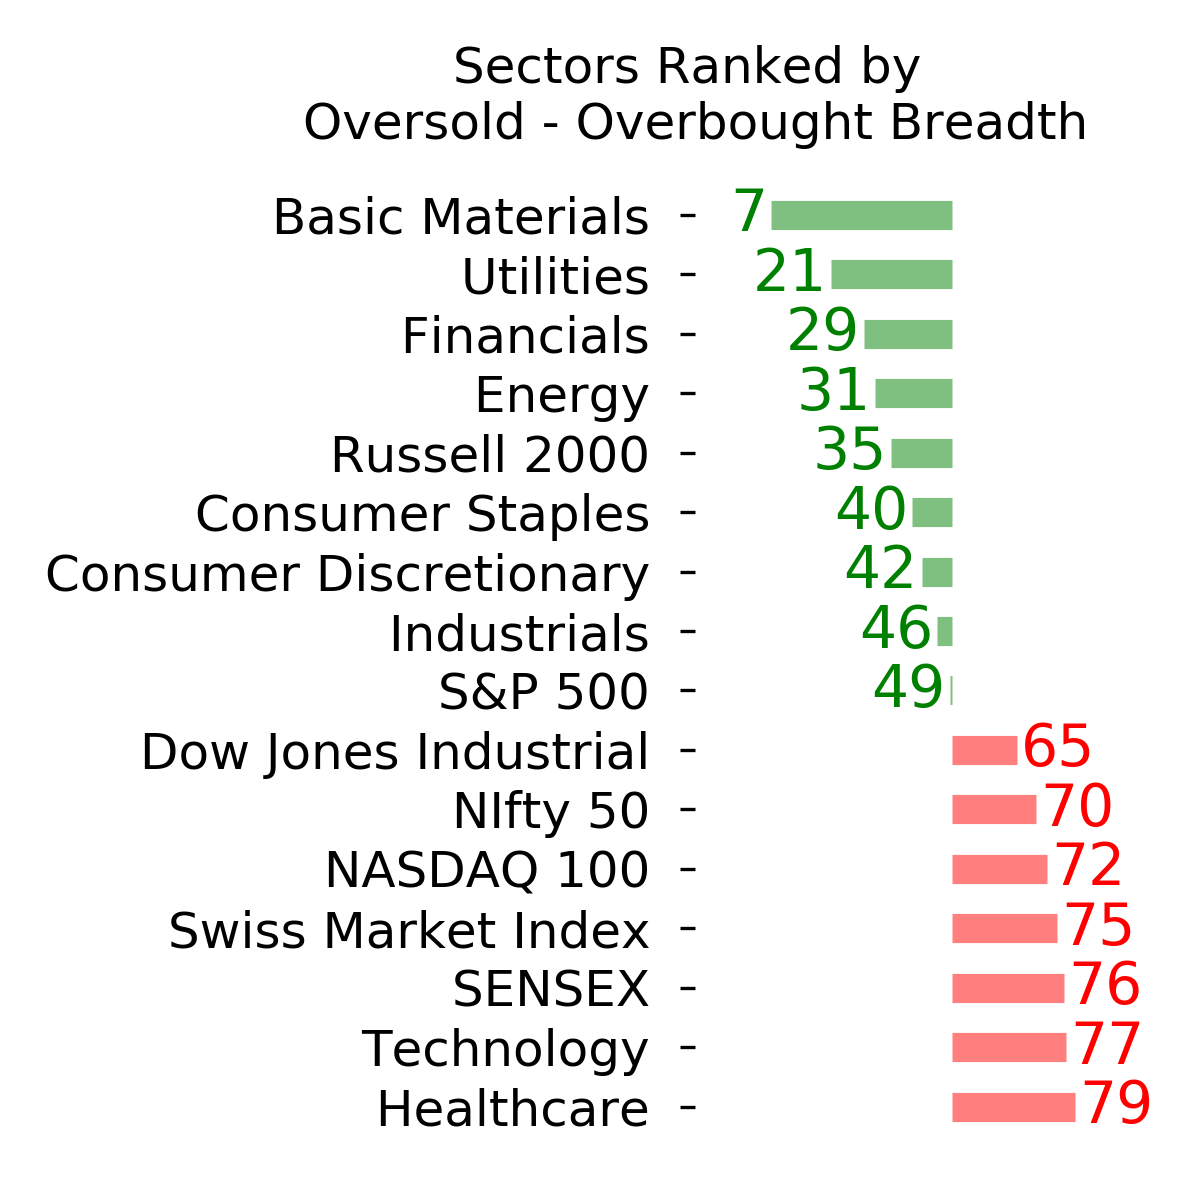
Ranks
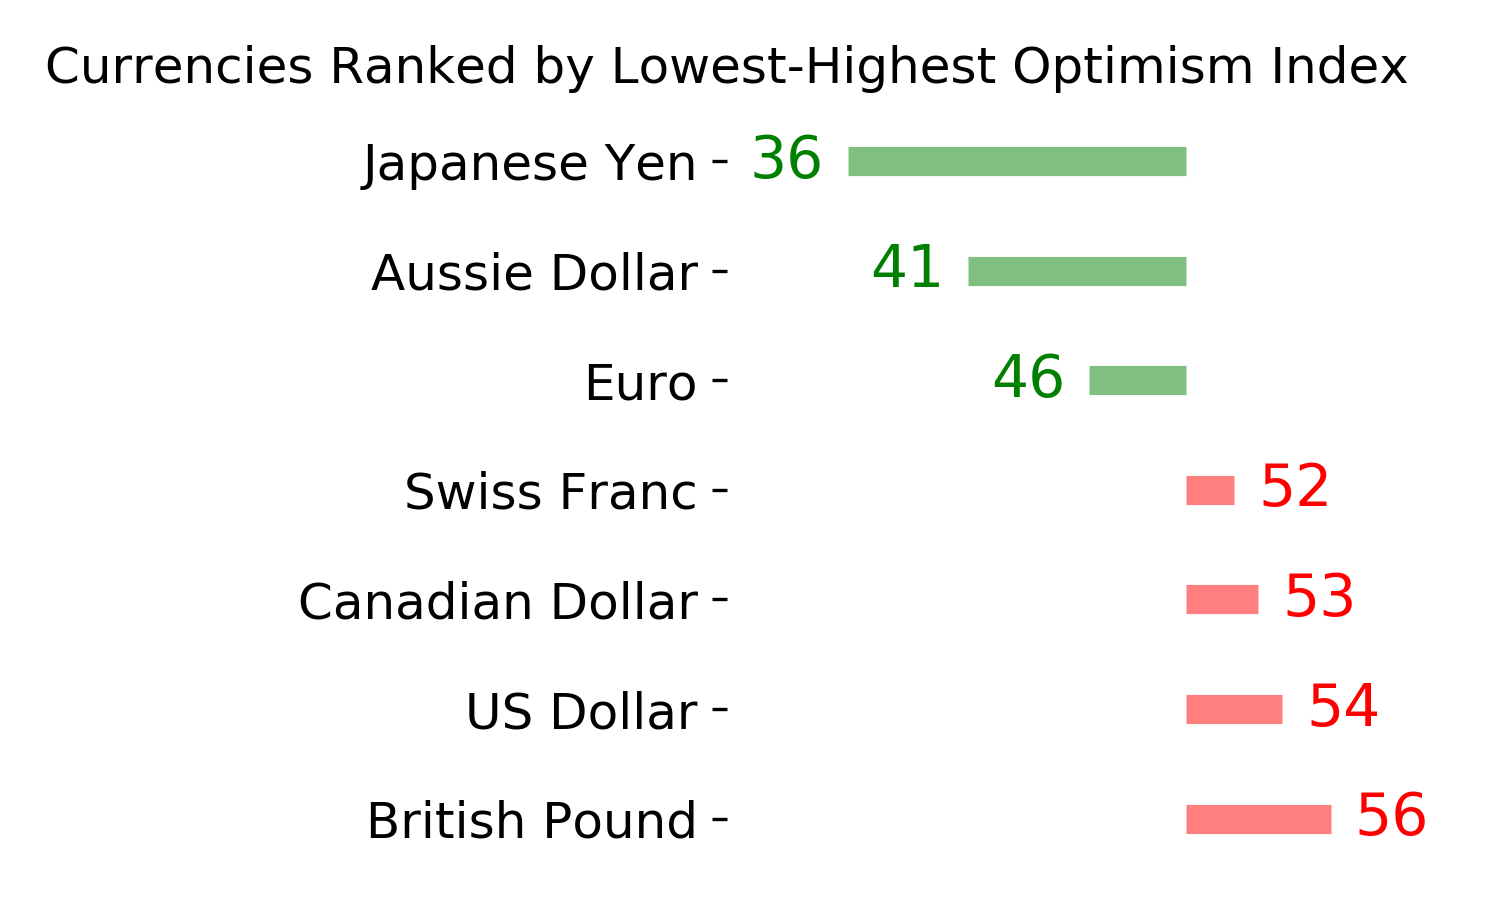
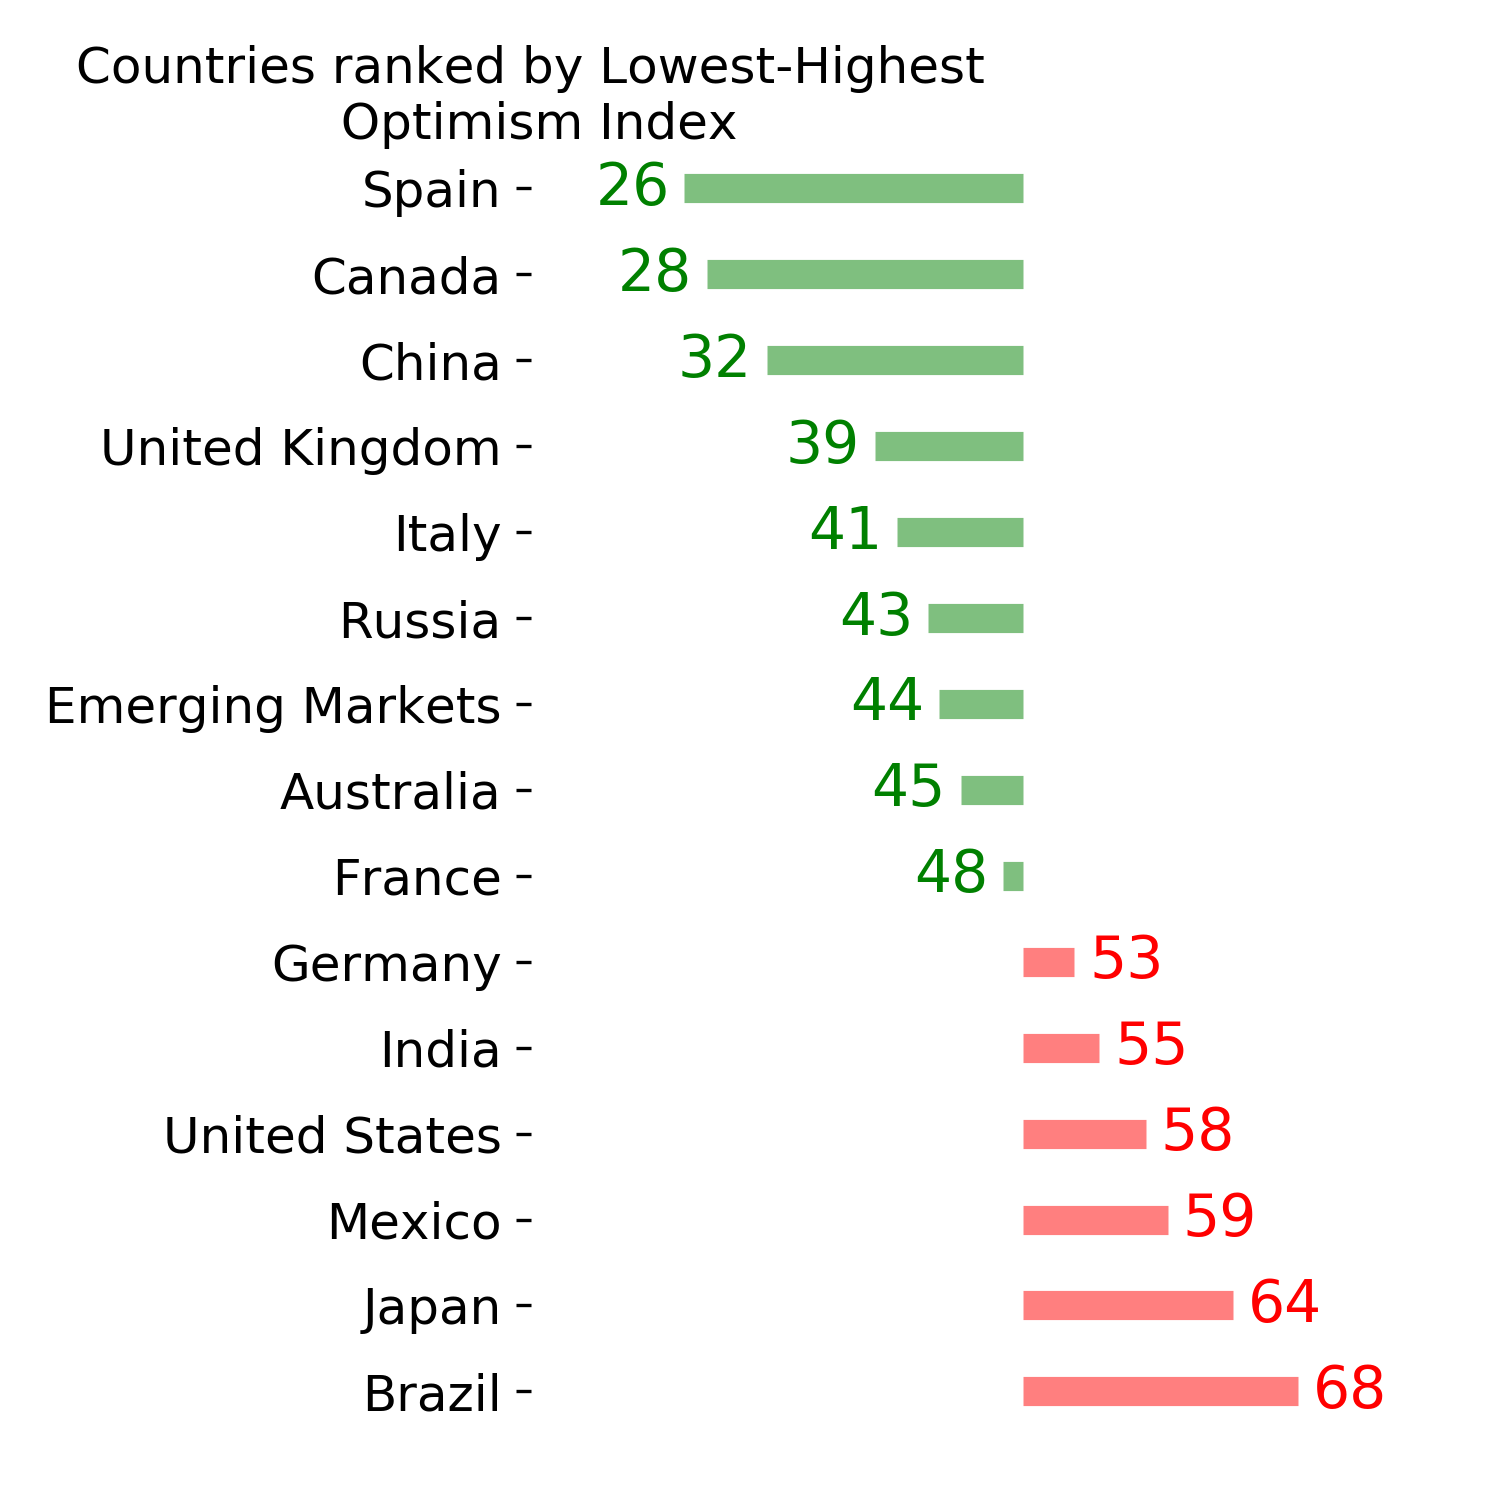
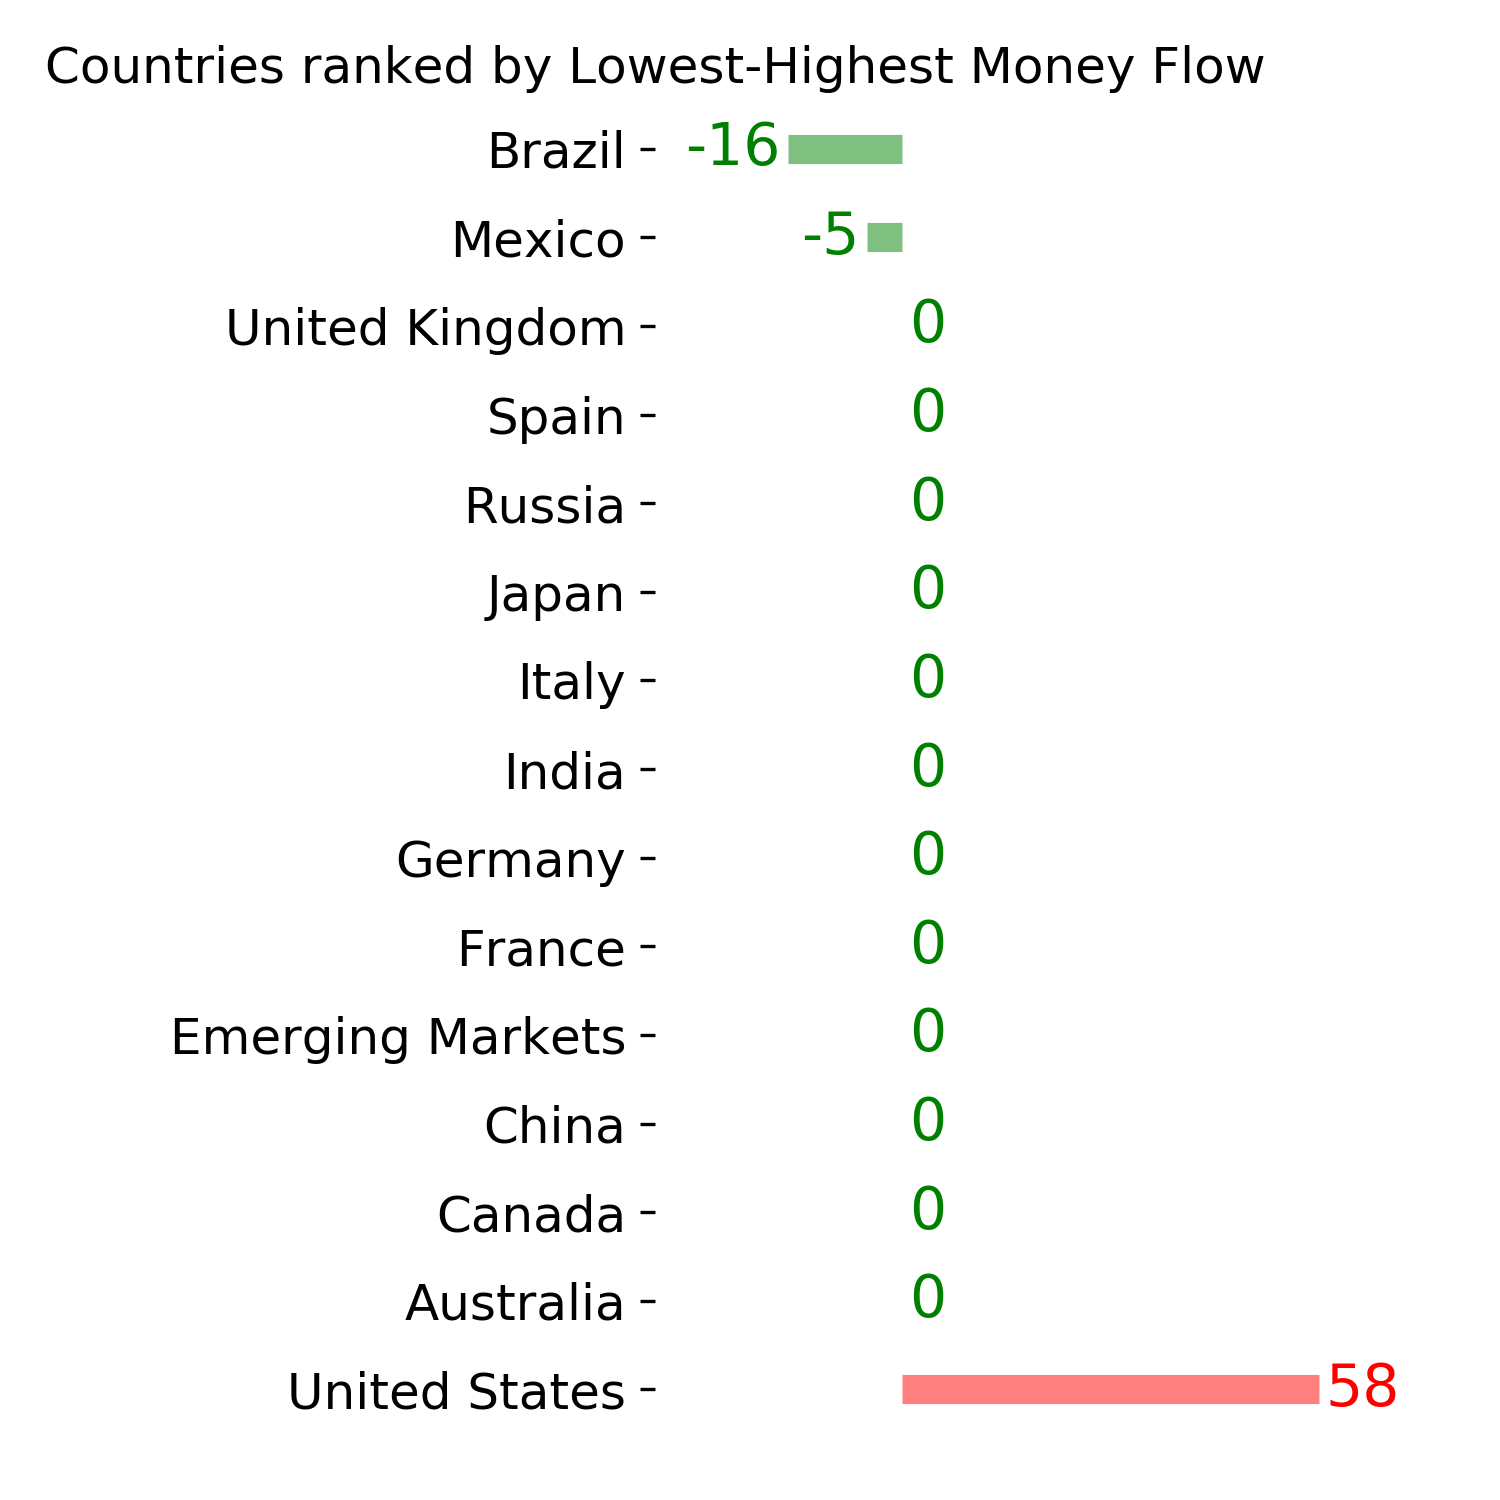
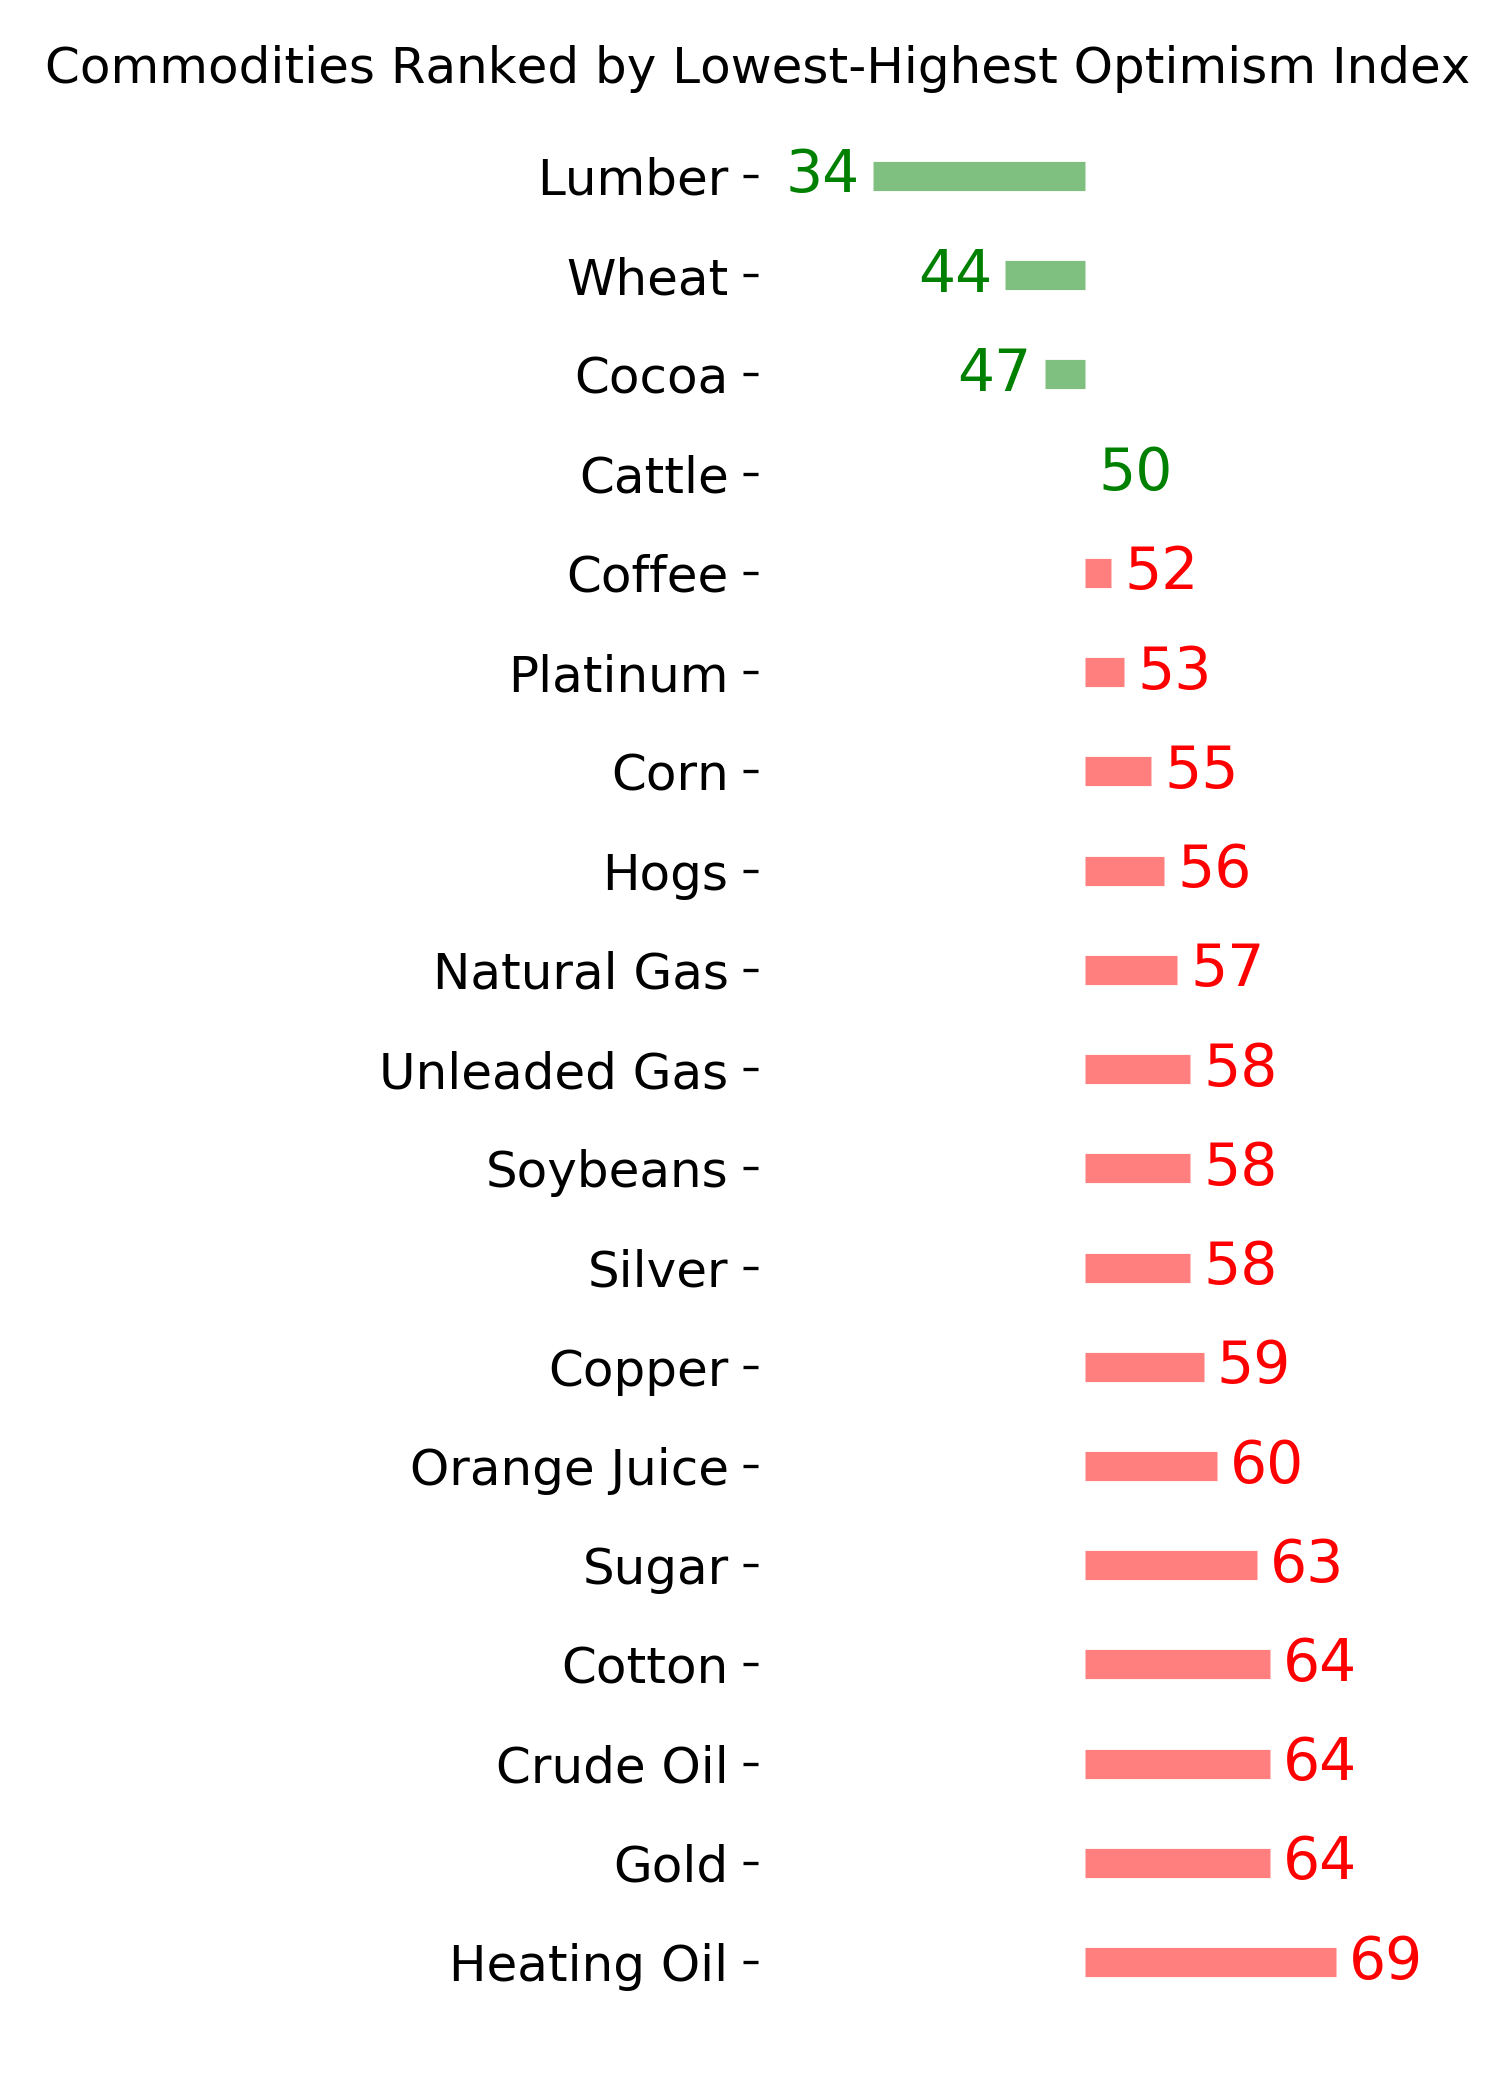
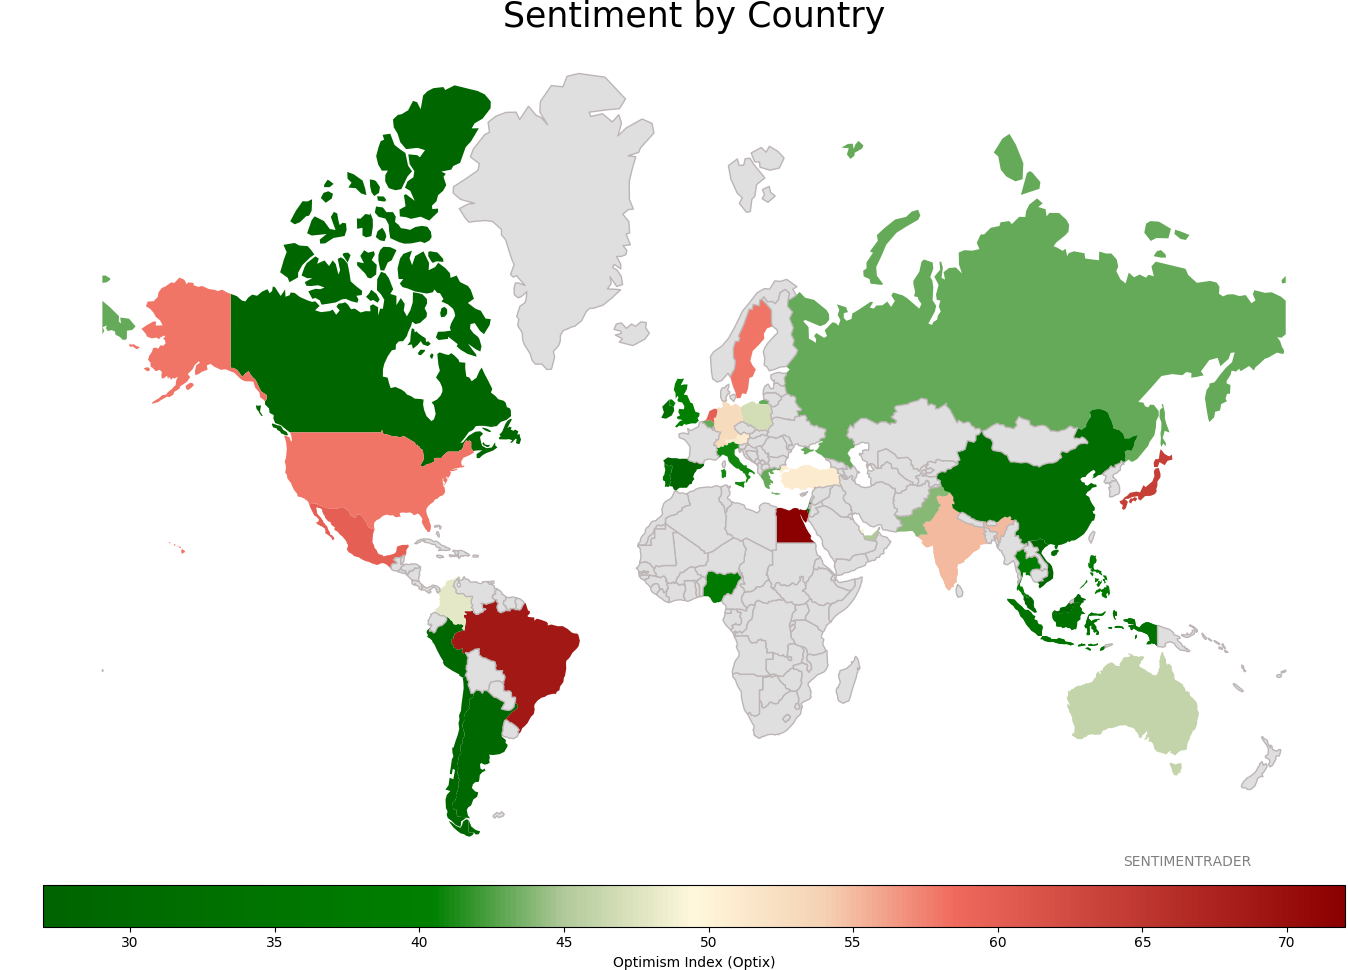
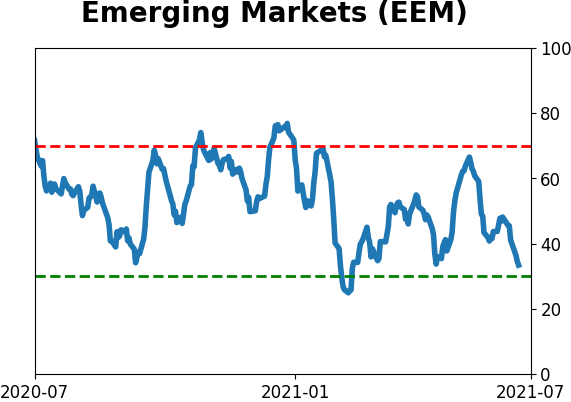
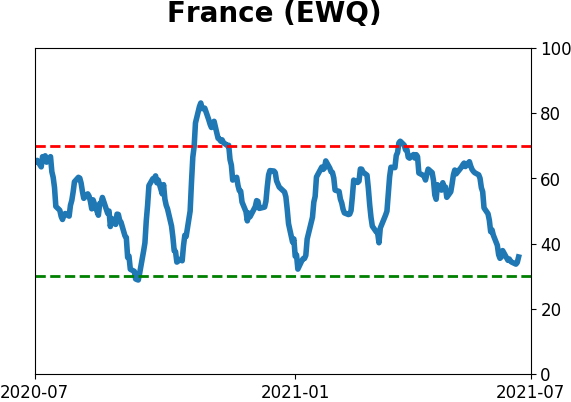
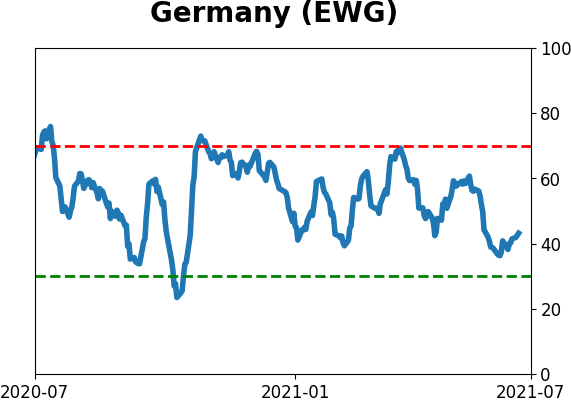
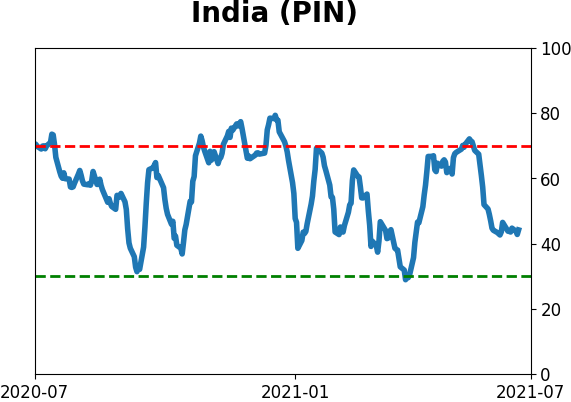
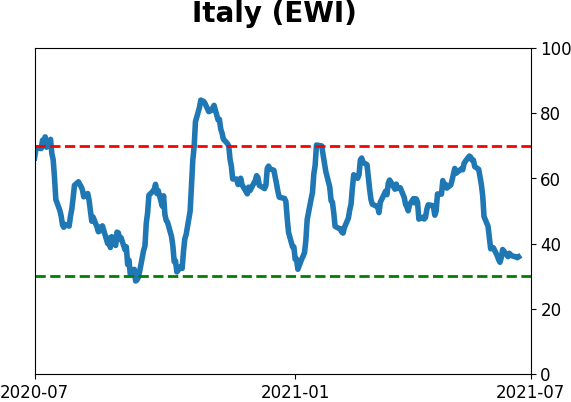
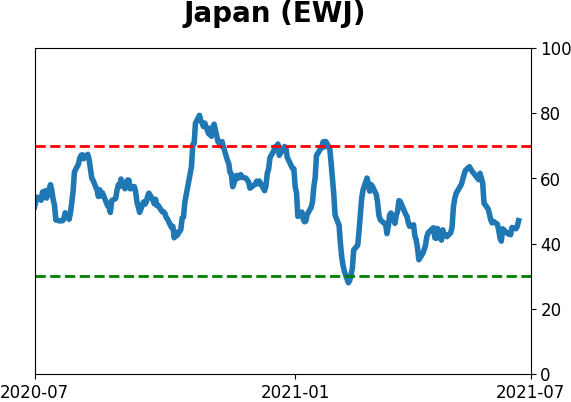
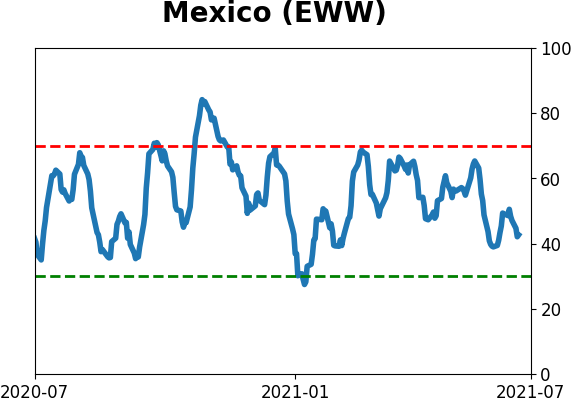
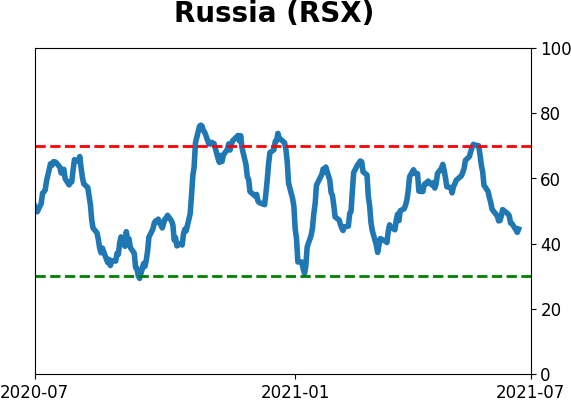
Sentiment Around The World
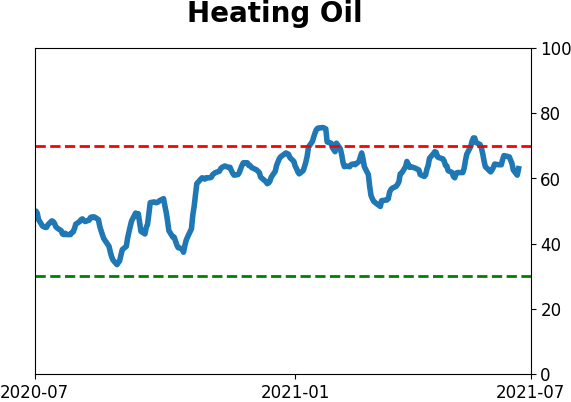
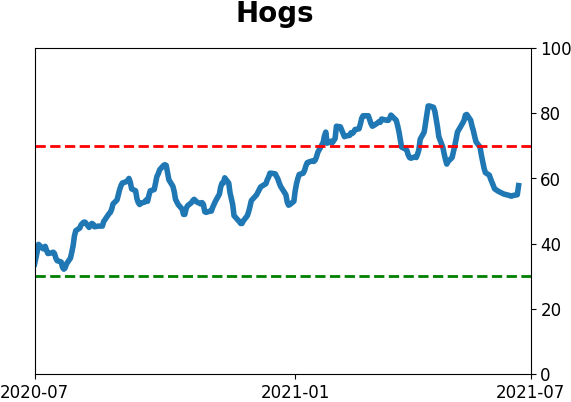
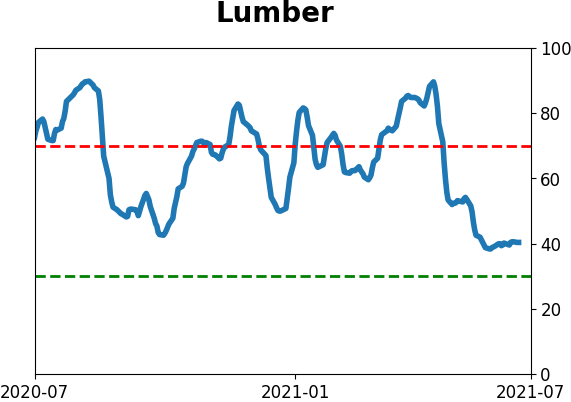
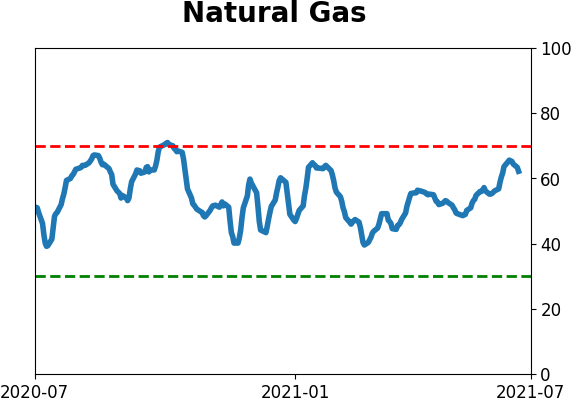
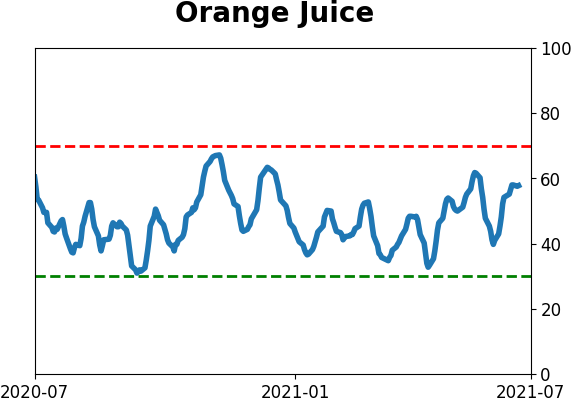
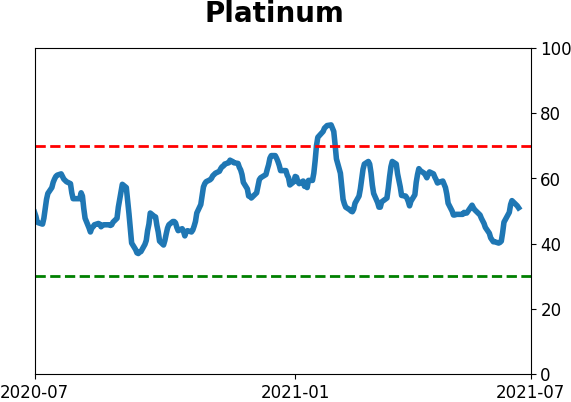
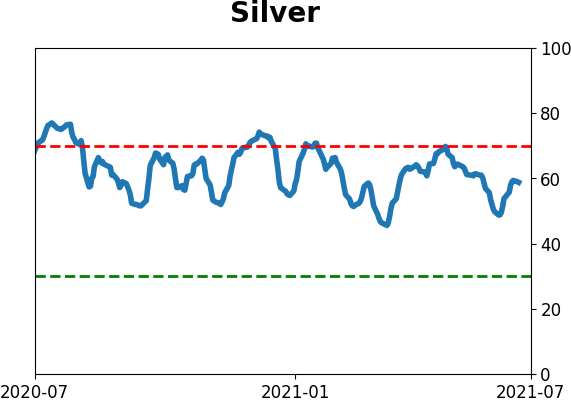
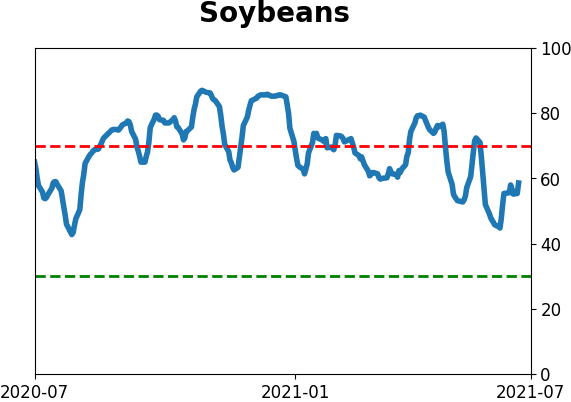
Optimism Index Thumbnails
|
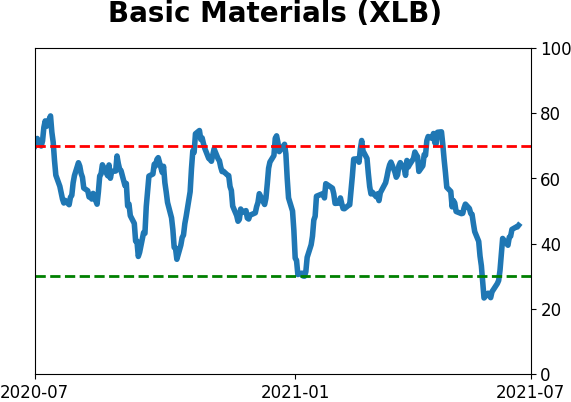
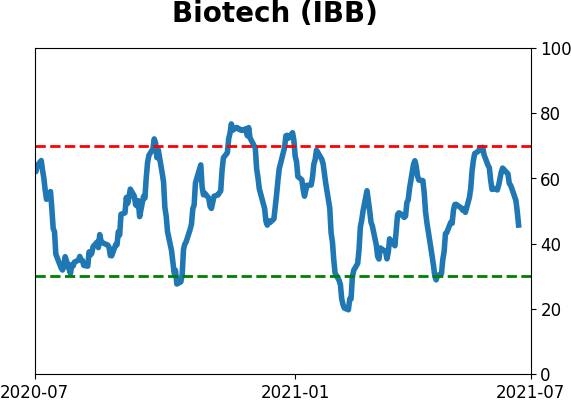
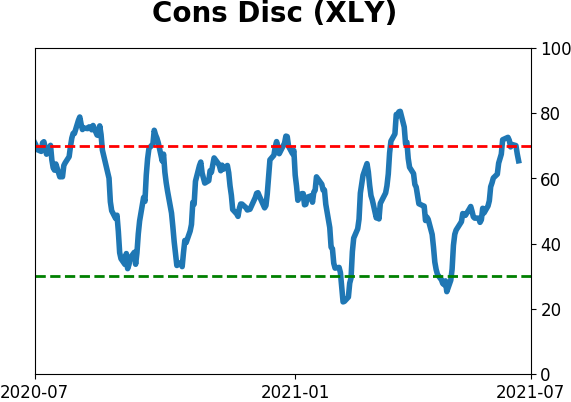
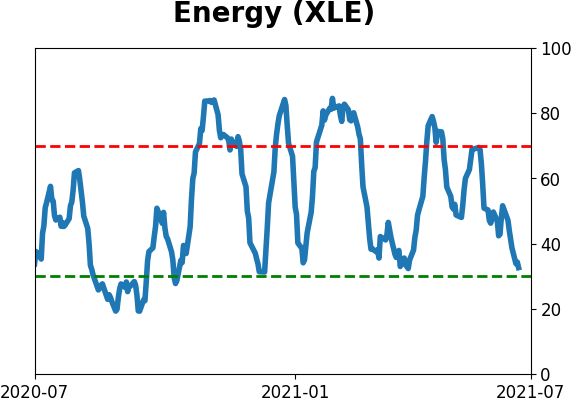
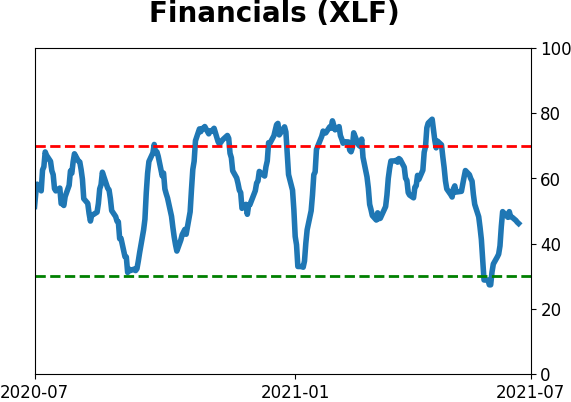
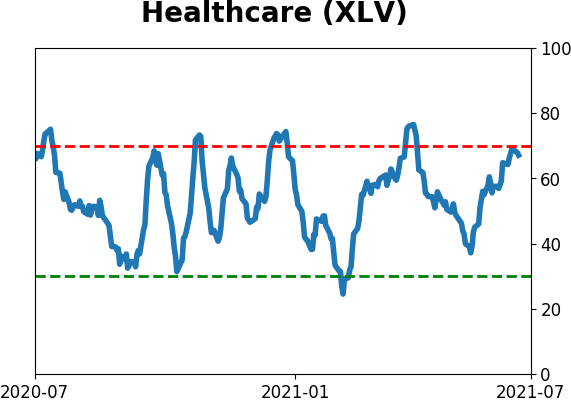
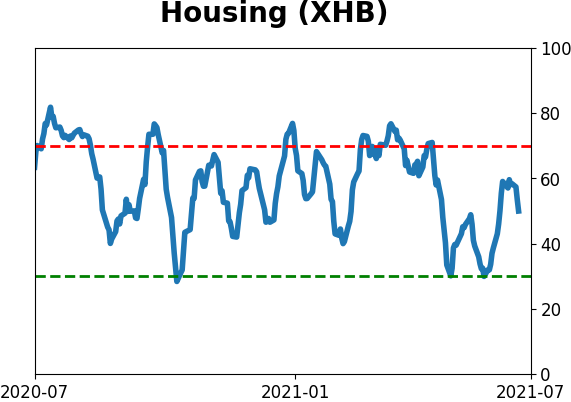
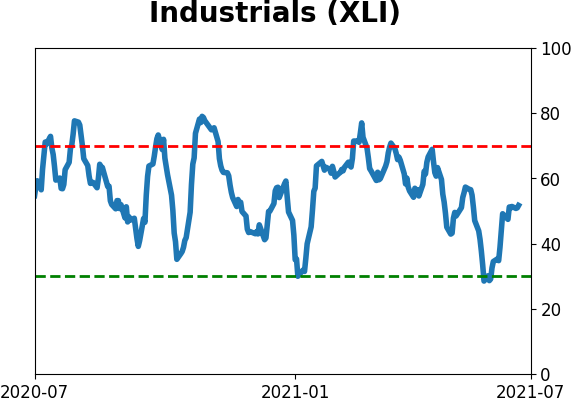
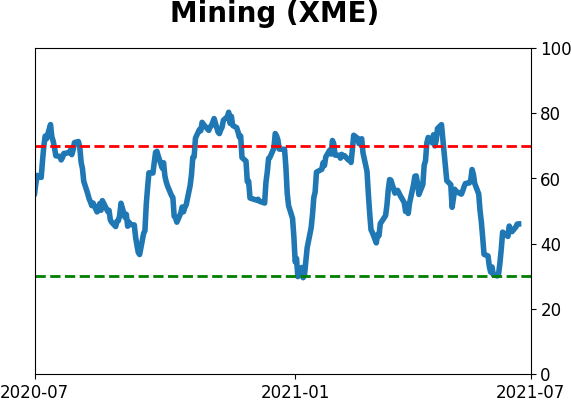
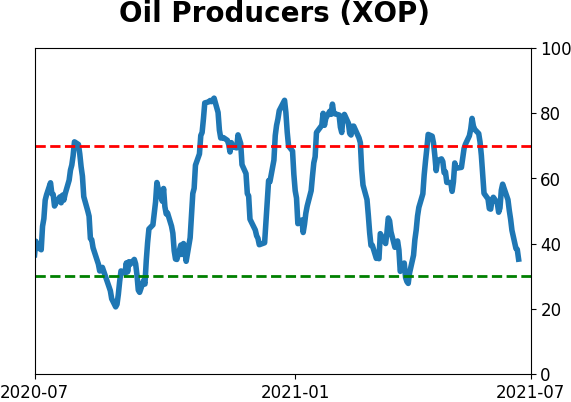
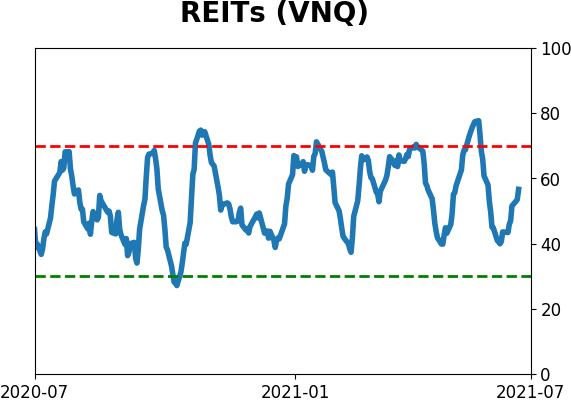
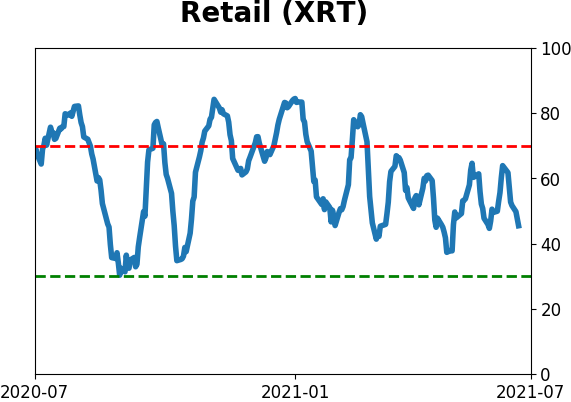
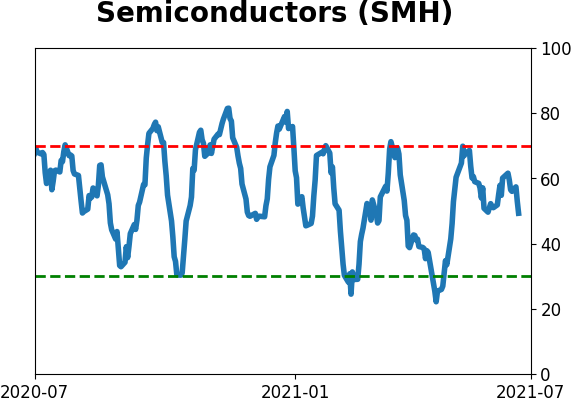
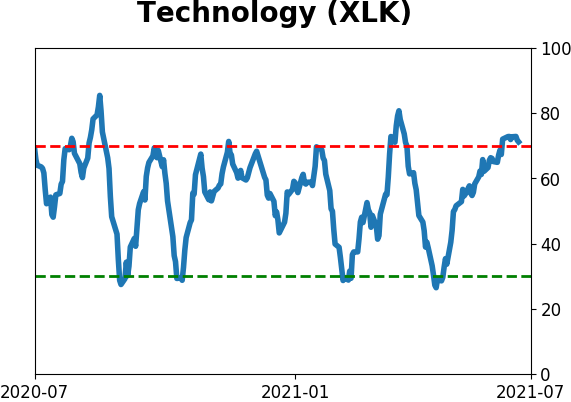
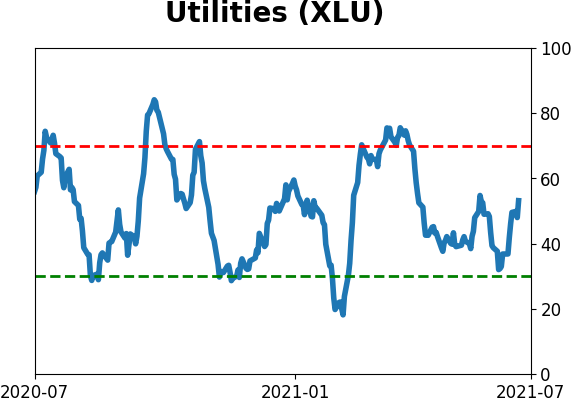
Sector ETF's - 10-Day Moving Average
|
|
|
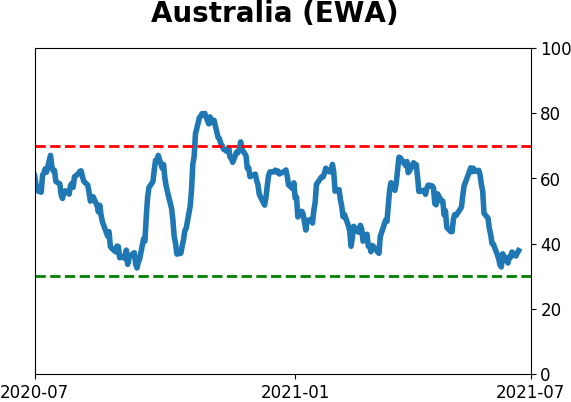
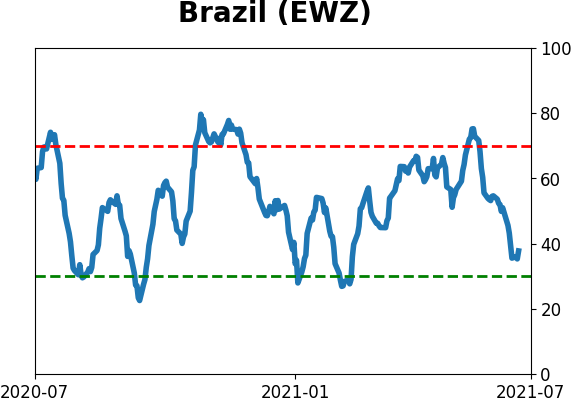
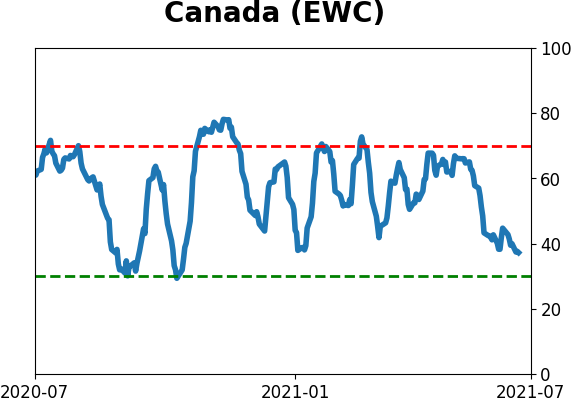
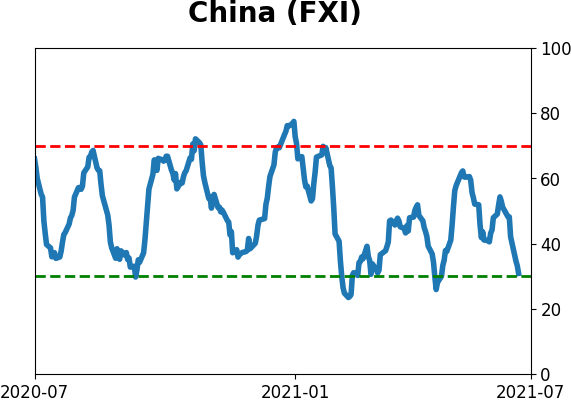
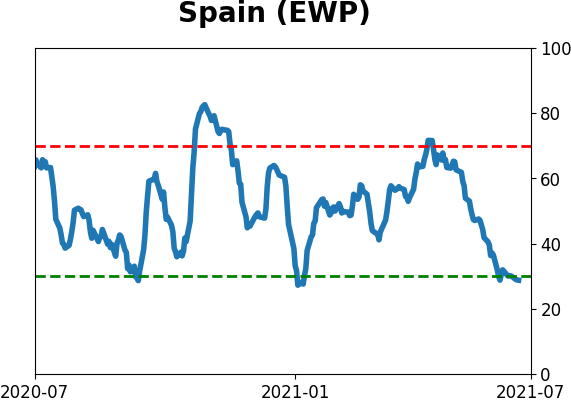
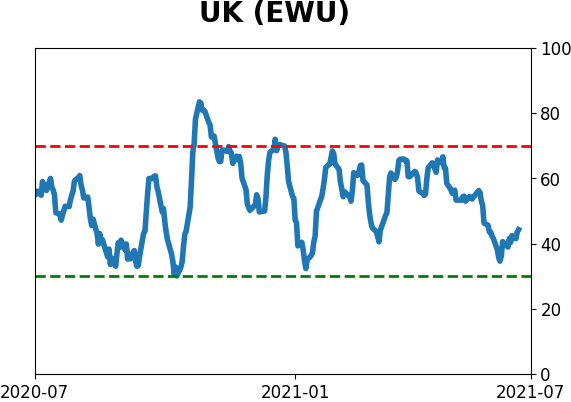
Country ETF's - 10-Day Moving Average
|
|
|
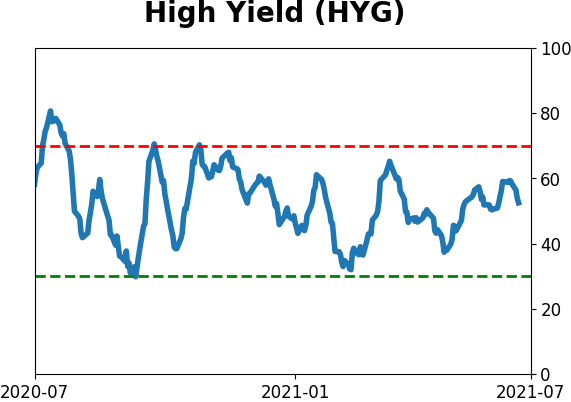
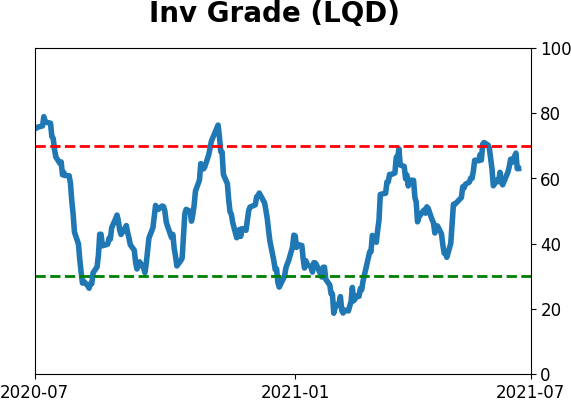
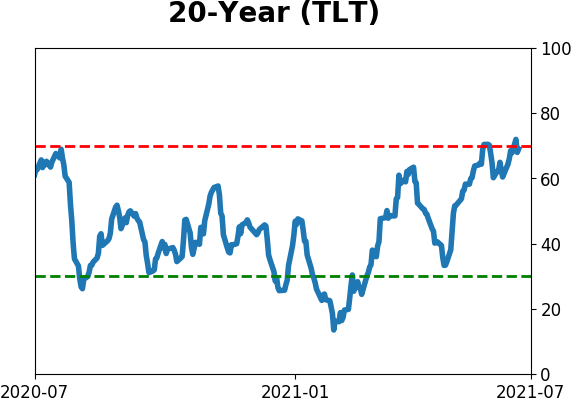
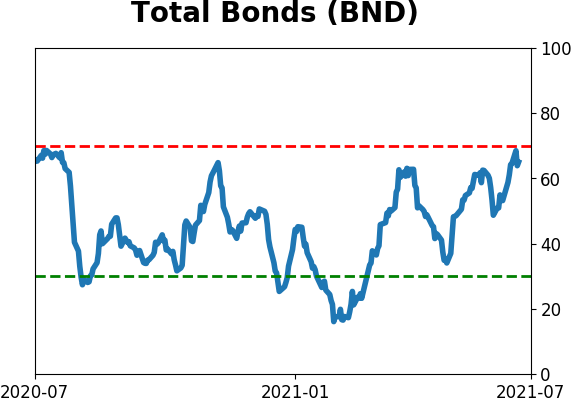
Bond ETF's - 10-Day Moving Average
|
|
|
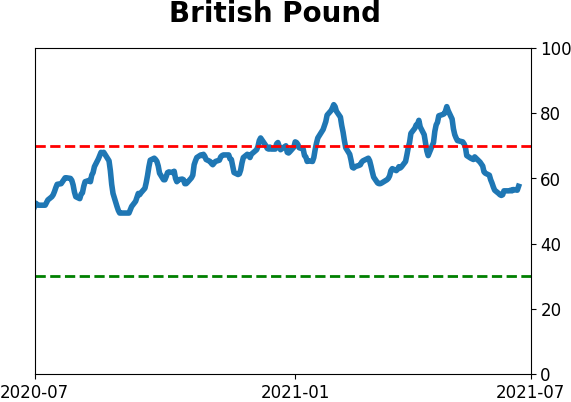
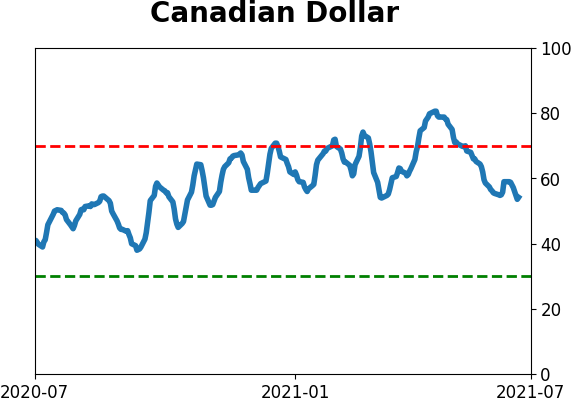
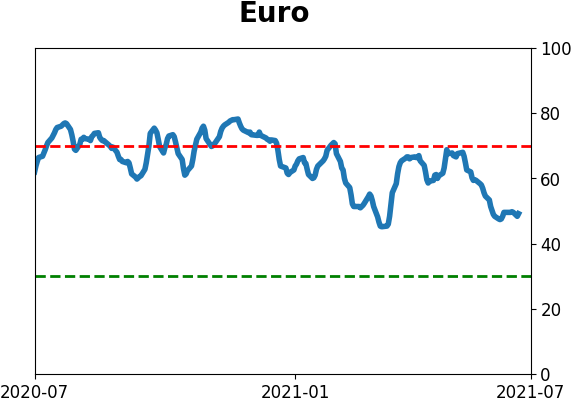
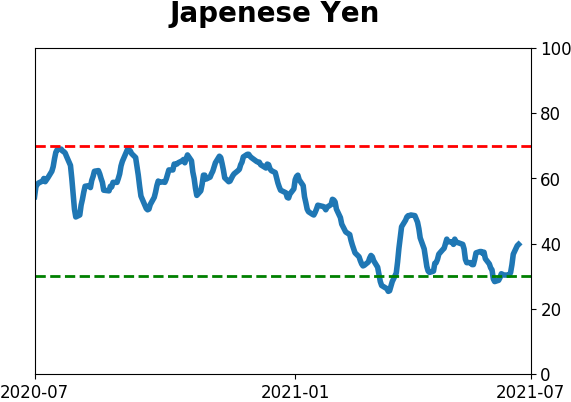
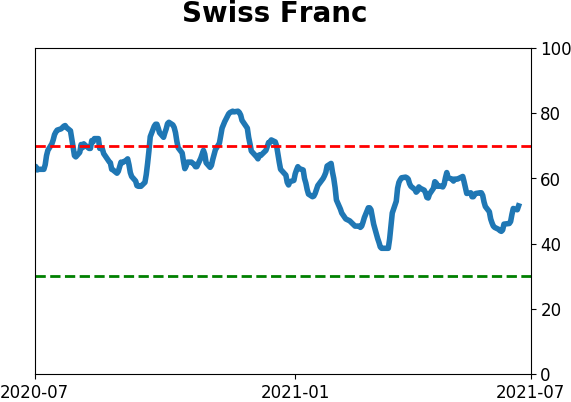
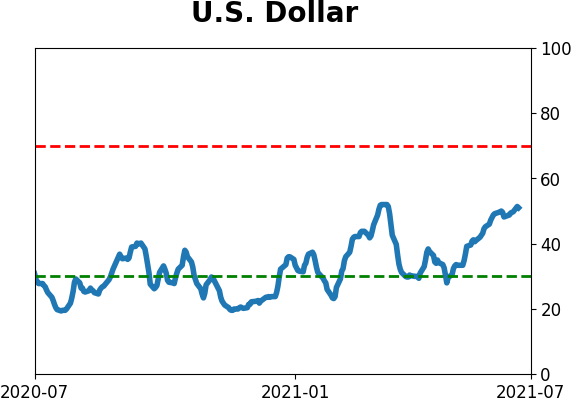
Currency ETF's - 5-Day Moving Average
|
|
|
Commodity ETF's - 5-Day Moving Average
|
|