Headlines
|
|
As Nasdaq indexes rallied, oddities have risen:
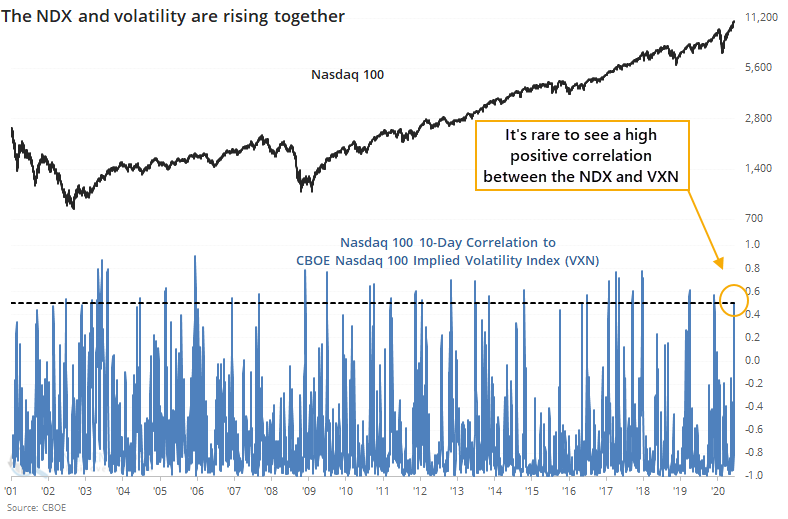
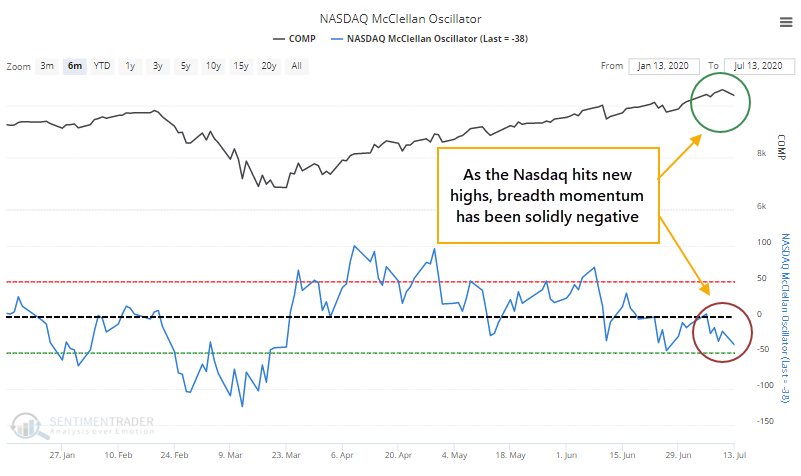
Even as the Nasdaq 100 (and broader Nasdaq) rallied to record highs, options traders have been pricing in higher volatility going forward, so there has been a positive correlation between the NDX and VXN. Breadth momentum has slowed, too, so the McClellan Oscillator was negative. Combined with Monday's price reversal, it suggests caution.
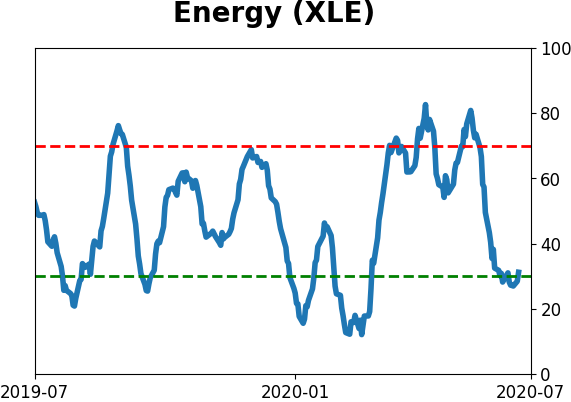
Energy stocks show another washout:
By late last week, every energy stock was trading below its 10-, 50-, and 200-day moving average. Other times the sector saw a complete lack of uptrends, it typically rallied in the months ahead. Same for when there were very quick changes in medium-term trends like we've seen over the past 30 days, as insiders keep buying.
Bottom Line:
- Weight of the evidence has been suggesting flat/lower stock prices short- to medium-term, though that turned more neutral as stocks pulled back recently; still suggesting higher prices long-term
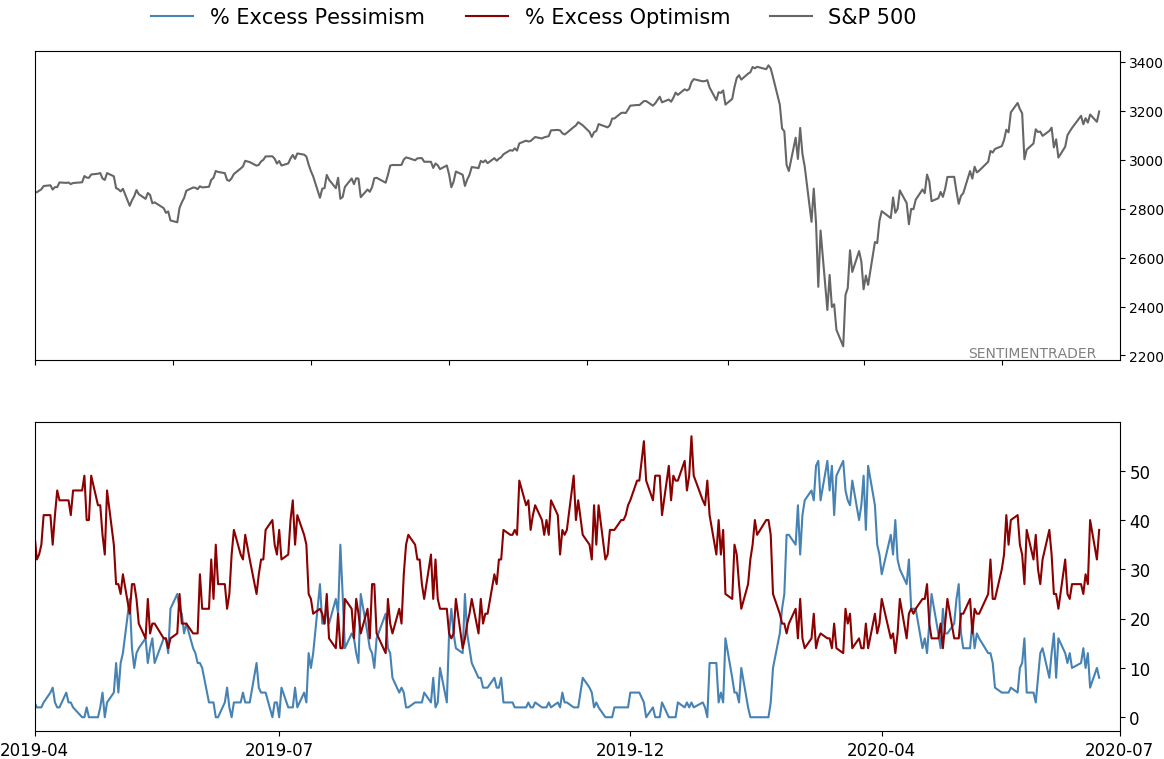
- Indicators show high and declining optimism, as Dumb Money Confidence neared 80% in early June with signs of reckless speculation, historic buying pressure, then even more speculation during what appears to be an unhealthy market environment
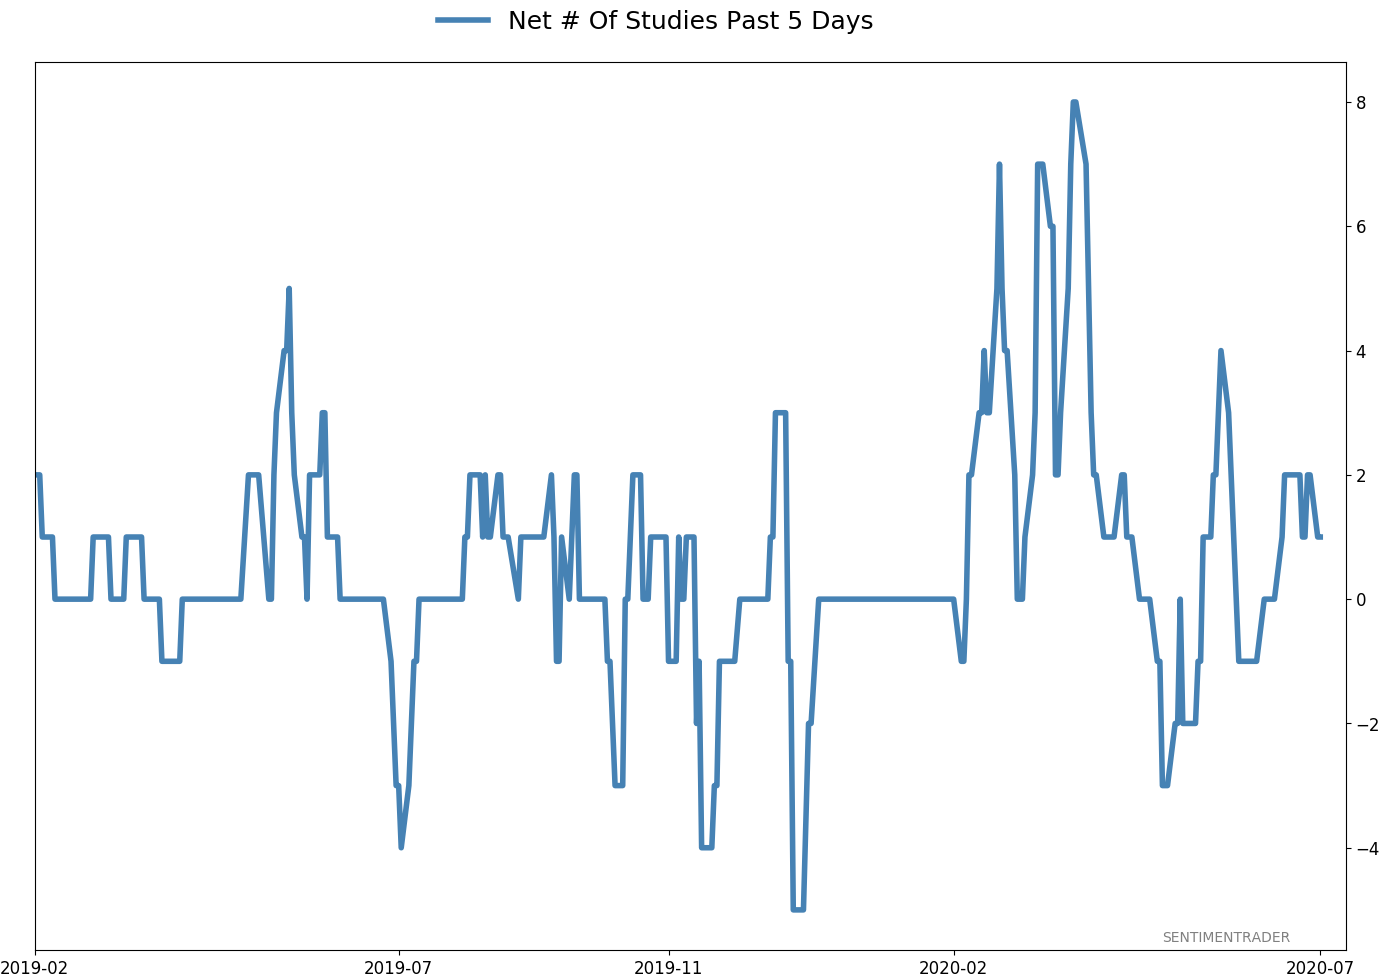
- Active Studies show a heavy positive skew over the medium- to long-term; breadth thrusts, recoveries, and trend changes have an almost unblemished record at preceding higher prices over a 6-12 month time frame
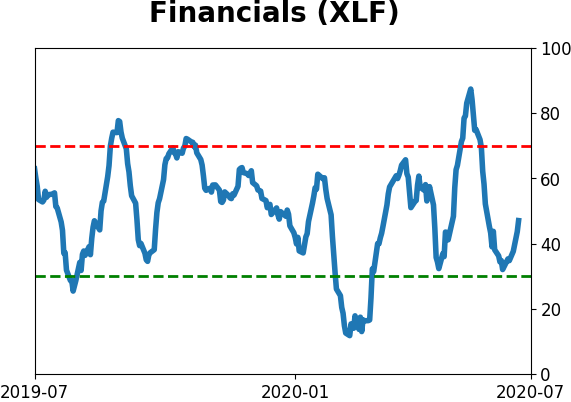
- Signs of extremely skewed preference for tech stocks nearing exhaustion, especially relative to industrials and financials (here and here)
- Indicators and studies for other markets are mixed with no strong conclusion, though it's not a great sign for Treasuries that hedgers are net short.
|
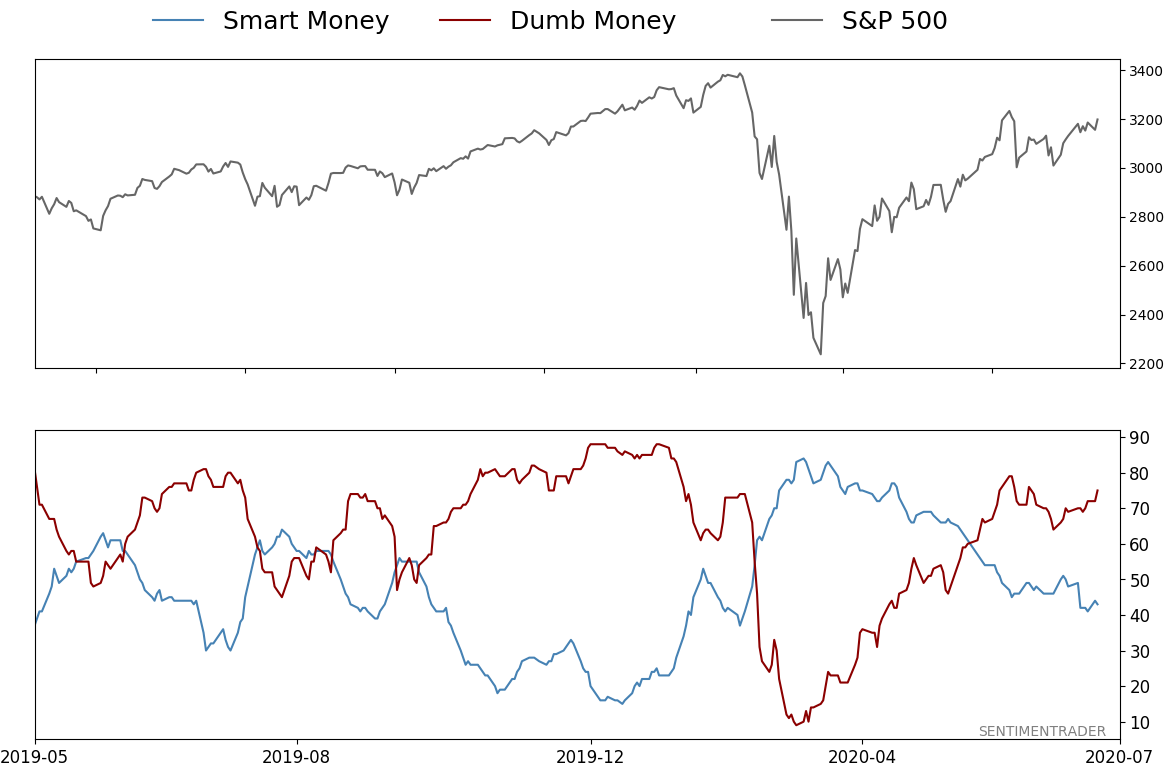
Smart / Dumb Money Confidence
|
Smart Money Confidence: 43%
Dumb Money Confidence: 75%
|
|
Risk Levels
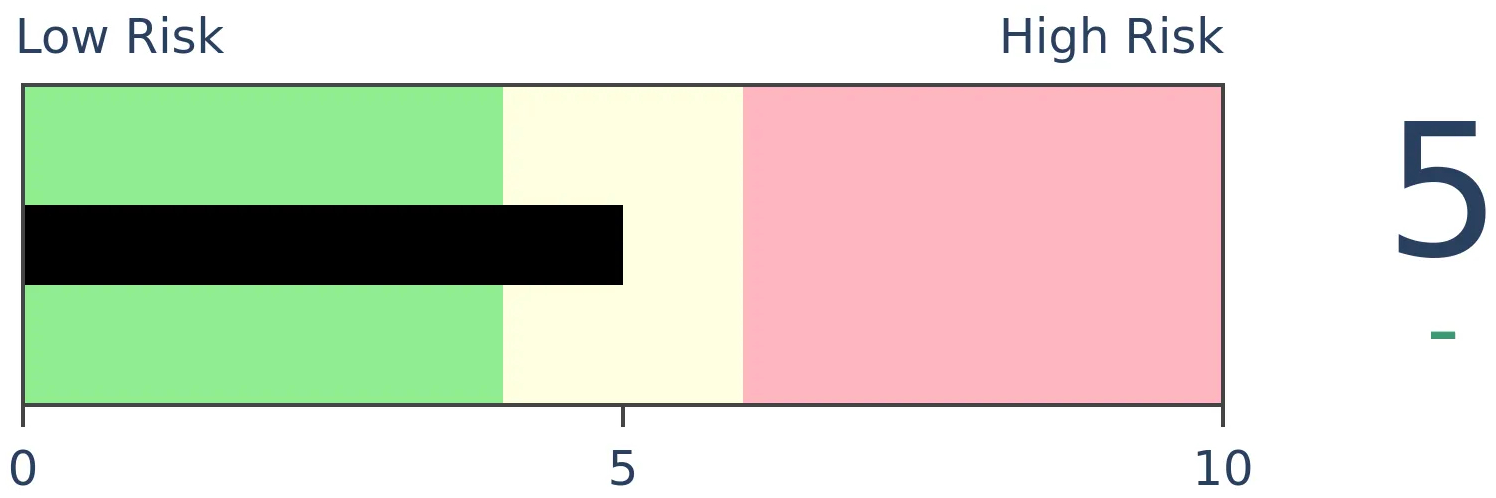
Stocks Short-Term
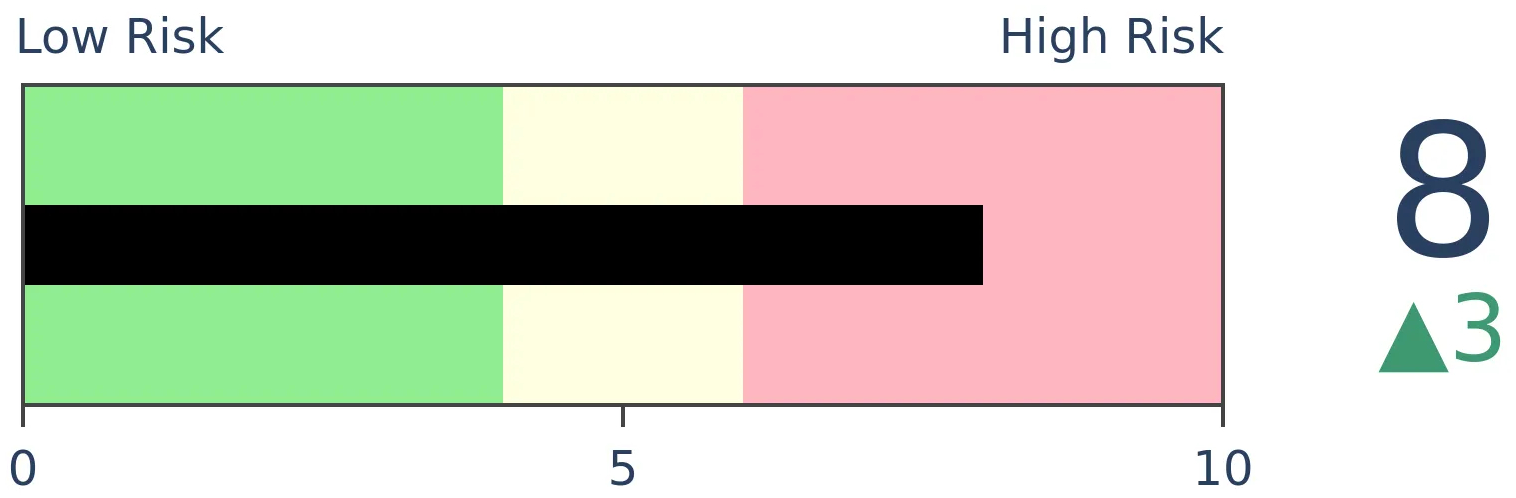
|
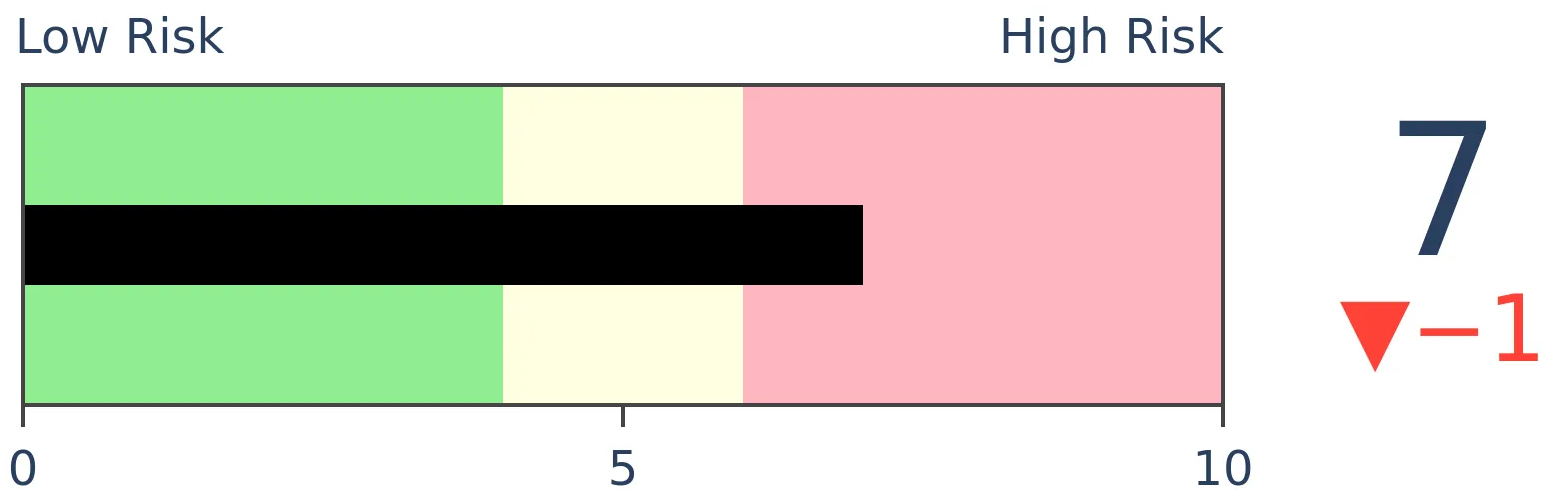
Stocks Medium-Term
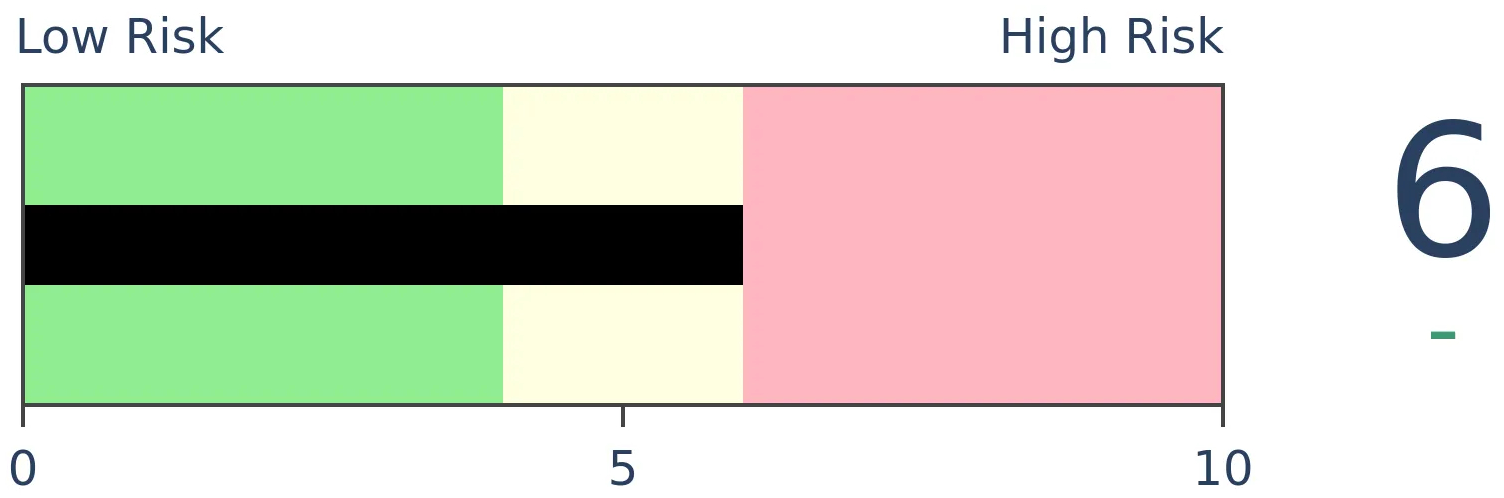
|
|
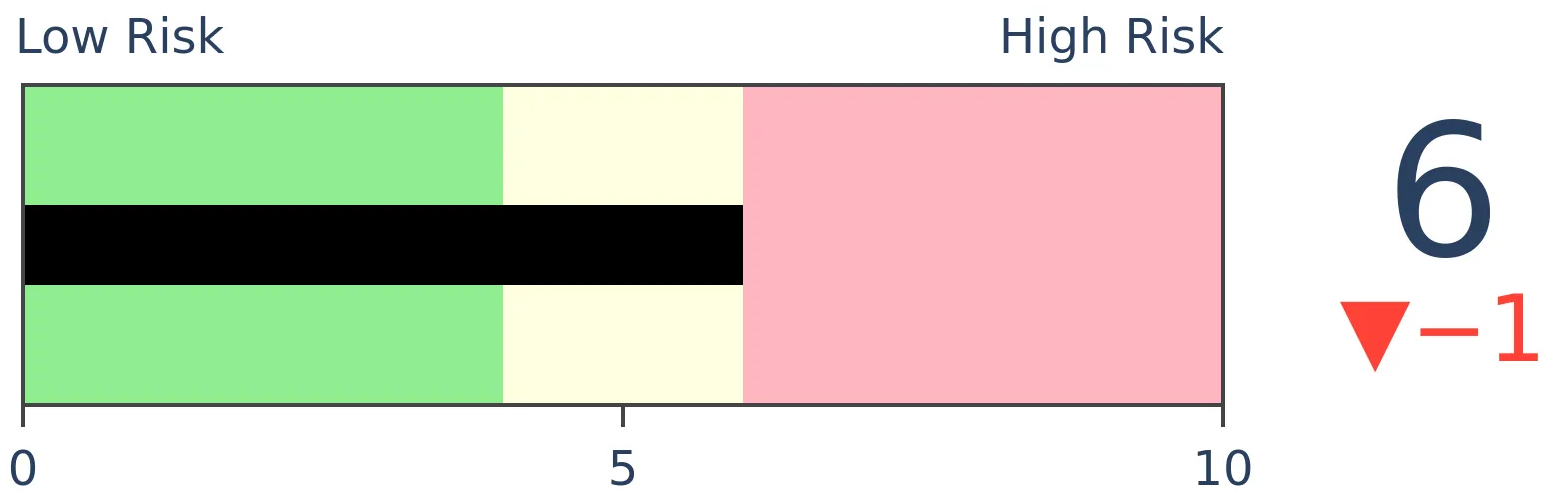
Bonds
|
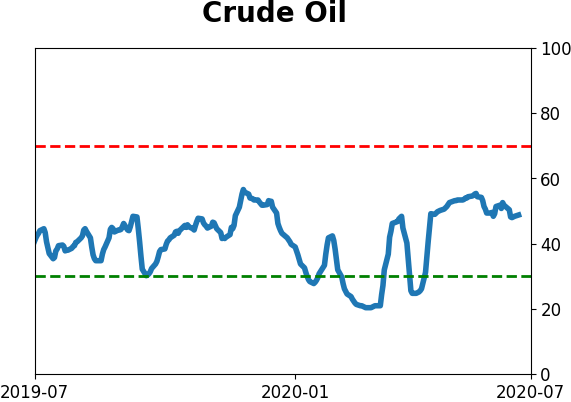
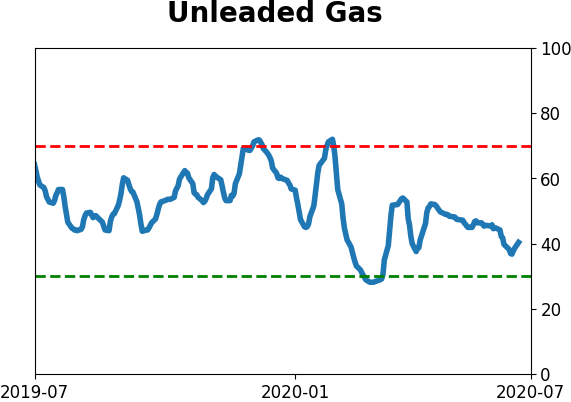
Crude Oil
|
|
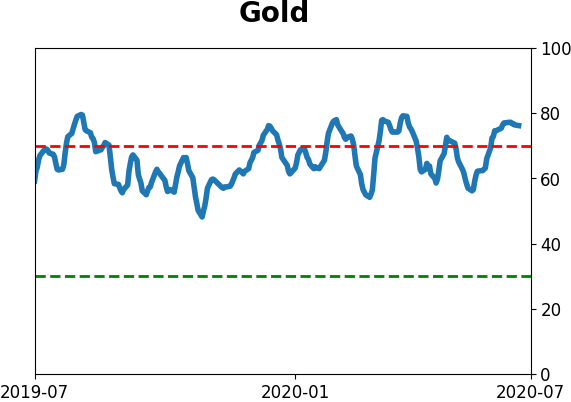
Gold

|
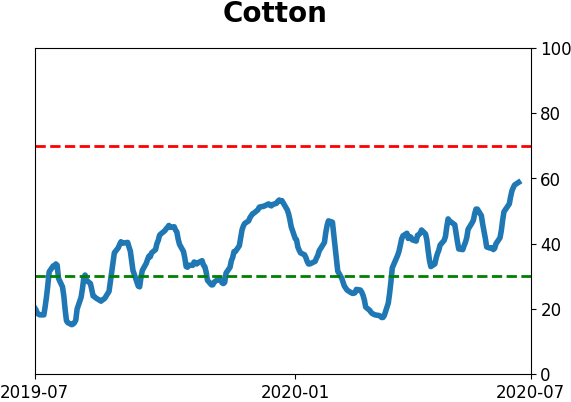
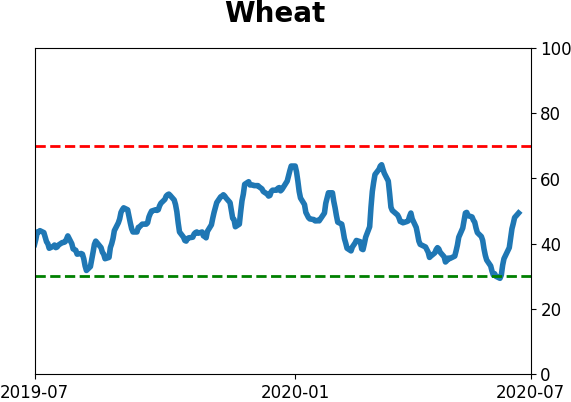
Agriculture
|
|
Research
BOTTOM LINE
Even as the Nasdaq 100 (and broader Nasdaq) rallied to record highs, options traders have been pricing in higher volatility going forward, so there has been a positive correlation between the NDX and VXN. Breadth momentum has slowed, too, so the McClellan Oscillator was negative. Combined with Monday's price reversal, it suggests caution.
FORECAST / TIMEFRAME
None
|
At the end of 2016, we looked at what had become yet another odd market development. Stocks were rising, and so was the VIX "fear gauge." That is based on options traders' anticipation of future volatility, and in the stock market, volatility = lower prices with a high degree of consistency.
We entered a historic momentum market soon after that, which rolled over the slight negative implications of the S&P's positive correlation to the VIX. Maybe we're on the cusp of the same thing now, as Jesse Felder notes that it's happening in tech stocks.
The Nasdaq 100 (NDX) is hitting new highs, but options traders are pricing in more volatility as we enter earnings season, with the NDX's version of the "fear gauge" (the VXN) rising in recent days. Entering Monday afternoon, the NDX was up more than 1%, and the VXN was up by more than 8%. That had never happened before.
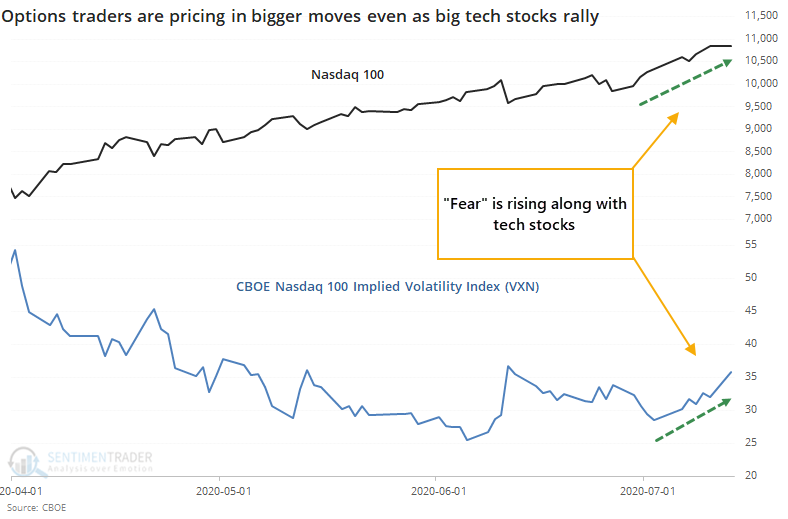
This behavior has pushed the correlation between them well into positive territory.
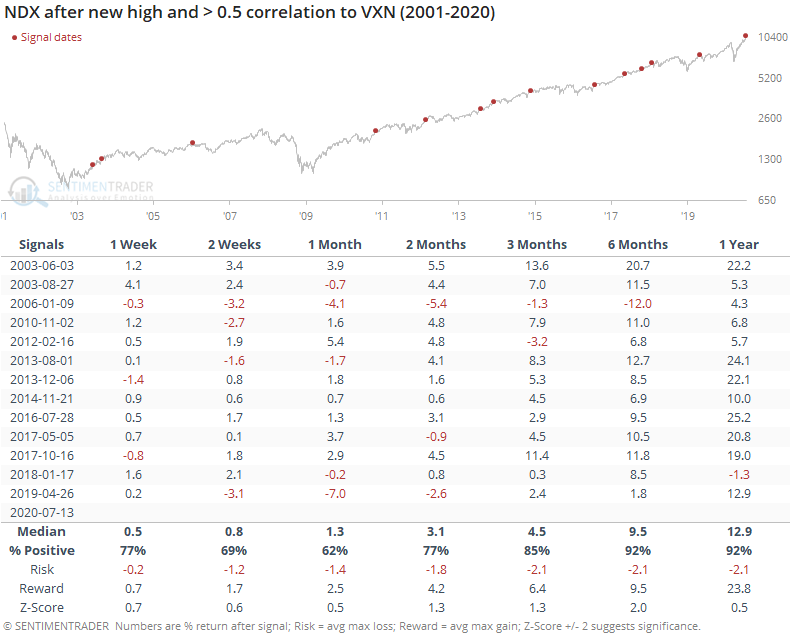
A high positive correlation between the NDX and VXN hasn't meant much for big tech stocks going forward, especially over the next 3-6 months, although the last two both preceded some shaky price action.
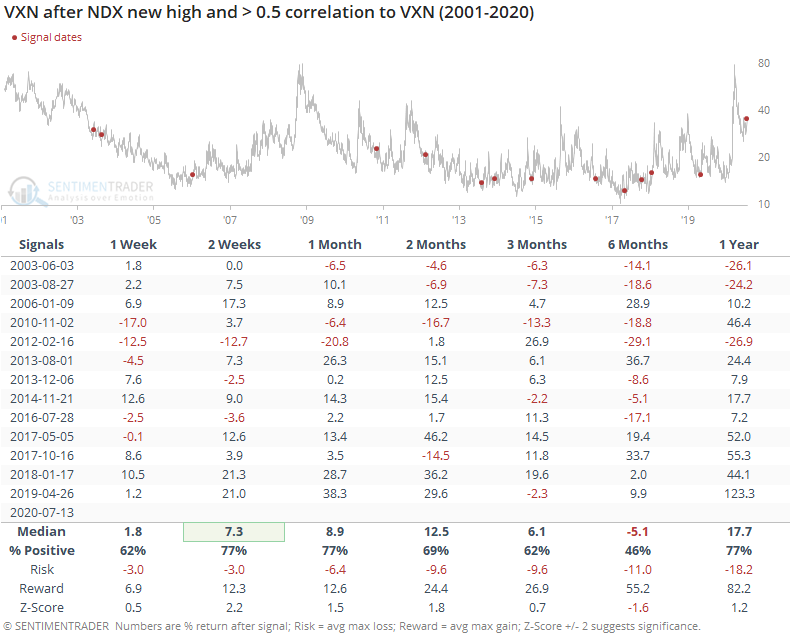
In the short-term, volatility continued to rise as the VXN typically jumped over the next 2-4 weeks.
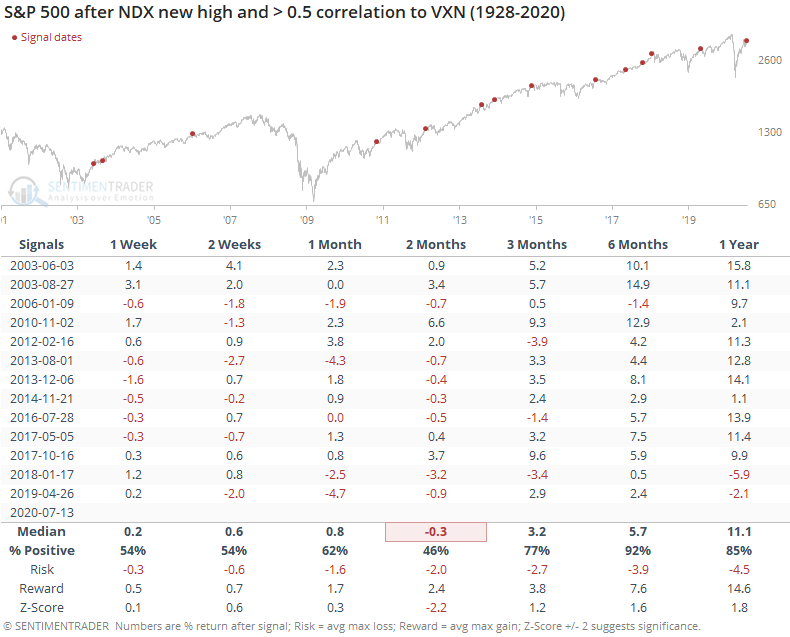
For the broader market, it was more negative. Over the next two months, the S&P 500 showed a well-below-average return, and a poor risk/reward ratio.
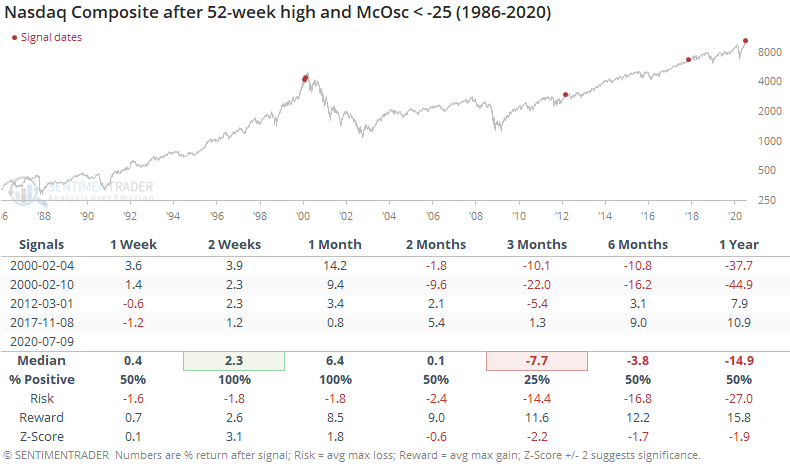
It's also odd that even while the Nasdaq Composite was setting record highs, momentum in breadth underlying that market has been poor. The McClellan Oscillator for the Nasdaq was below -25 even as the index was setting new highs.
That's only happened four other times since 1986. It certainly was not a good reason to sell tech stocks immediately, as the Composite added to its gains over the next 2-4 weeks. But those rallies also all ran into some trouble in the month(s) after that.
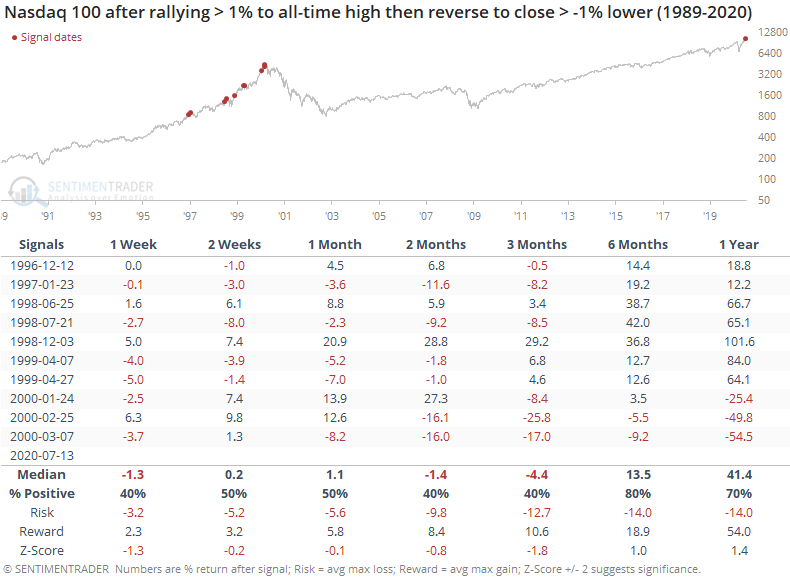
This is a little more troubling given Monday's rejection of a record high in the bigger tech stocks. As noted in yesterday's report, the Nasdaq 100 rallied more than 2% to an all-time high, only to reverse and close down by more than 1%. The only other day when that happened was March 7, 2000. Looking at smaller reversals, the tone over the next 2-3 months was still generally negative.
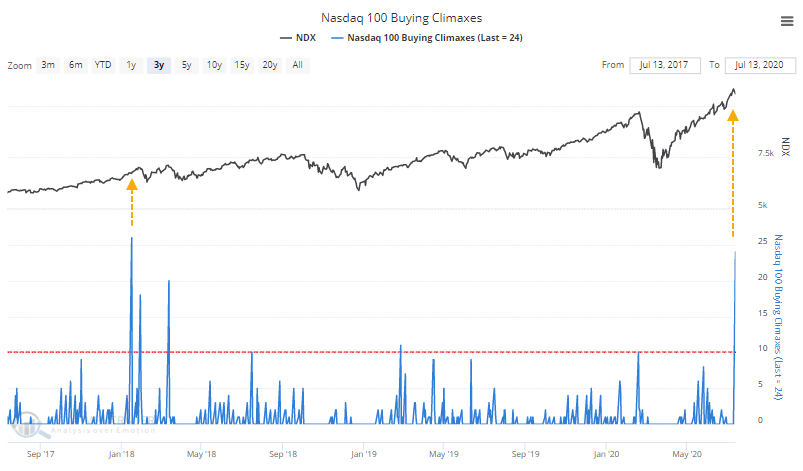
The reversal in the Nasdaq 100 coincided with the 2nd-largest number of buying climaxes in those stocks as well. Only early 2018 had more.
Overall, none of these oddities suggest an immediate worry. They're more of an environmental concern. The run in these stocks has been historic, and the momentum in many stocks underlying the move in the indexes is waning. Combined with reversals in some of them as we saw on Monday, it's a heads-up that we're unlikely to see them continue to run higher uninterrupted.
BOTTOM LINE
By late last week, every energy stock was trading below its 10-, 50-, and 200-day moving average. Other times the sector saw a complete lack of uptrends, it typically rallied in the months ahead. Same for when there were very quick changes in medium-term trends like we've seen over the past 30 days, as insiders keep buying.
FORECAST / TIMEFRAME
XLE -- Up, Medium-Term
|
We saw on Monday how financials have been lagging so badly in 2020, second only to energy among the worst-performing sectors.
By late last week, those energy stocks had gotten hit so hard that every member of the S&P 500 Energy sector was below its short-term 10-day moving average. And medium-term 50-day average. And long-term 200-day average.
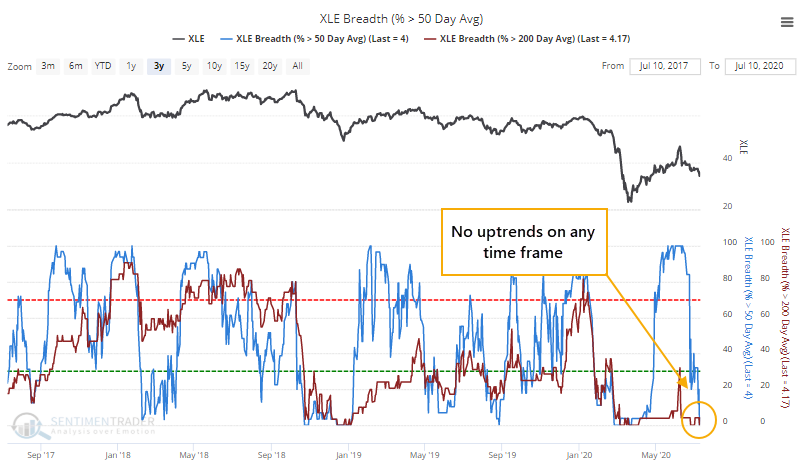
When every member of the index was below all three moving averages, it was usually near the ends of major declines.
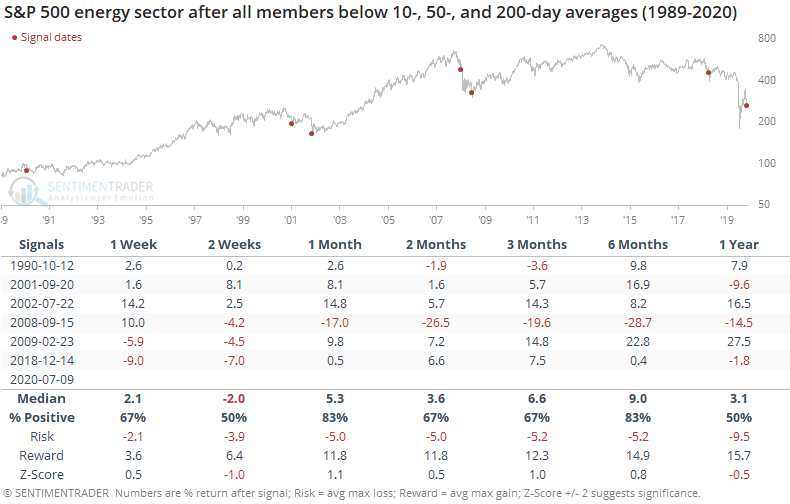
The only really painful failure was 2008 when it triggered in the middle of the financial crisis. All the others showed a positive return over the next 6 months, with a very good risk/reward ratio.
It's also worth noting how quickly the medium-term trend has reversed in many of the stocks. Within the past 30 days, more than 95% of them had been trading above their 50-day averages. That cycled all the way down so that fewer than 5% of them were above average by late last week, continuing into this week.
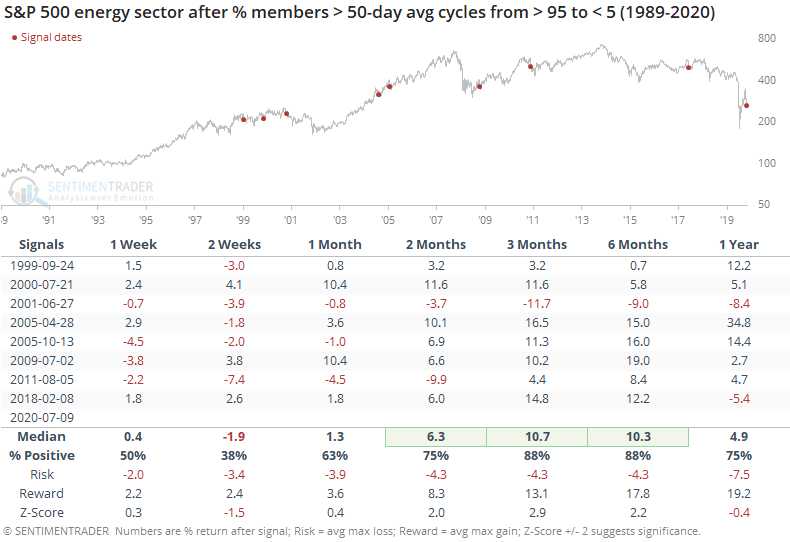
When the medium-term trends had fully cycled like this in the past, energy stocks rallied every time but once over the next 3-6 months, though that 2001 failure was painful.
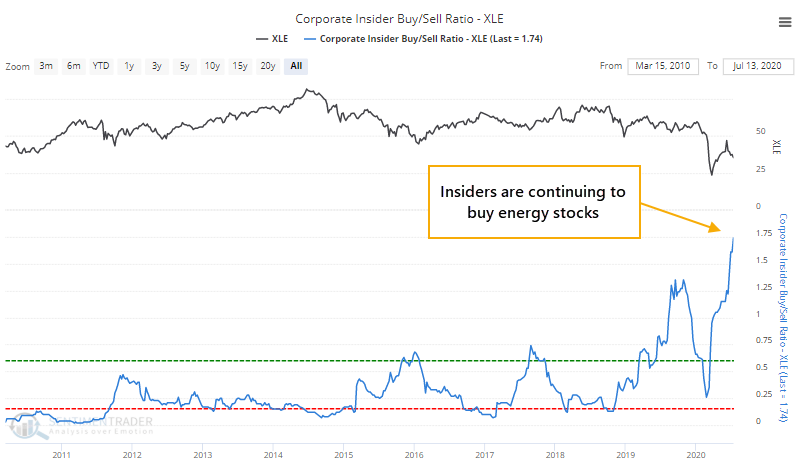
Another positive sign is that corporate insiders keep backing off selling shares. The buy/sell ratio among energy stocks moved to another decade-high over the past week.
At the end of February, breadth among energy stocks was as washed out as it had ever been. Other times it was that skewed, the sector rallied every time...except this one. The spat between Russia and Saudi Arabia overrode any historical precedent and the signal failed miserably. So there is always the chance that "something" can happen to violate historical precedent. Assuming the sector behaves at least somewhat in line with history, the current lack of uptrends among any of the stocks should be a decent medium-term positive.
Active Studies
| Time Frame | Bullish | Bearish | | Short-Term | 0 | 0 | | Medium-Term | 8 | 7 | | Long-Term | 44 | 1 |
|
Indicators at Extremes
Portfolio
| Position | Weight % | Added / Reduced | Date | | Stocks | 29.8 | Reduced 9.1% | 2020-06-11 | | Bonds | 0.0 | Reduced 6.7% | 2020-02-28 | | Commodities | 5.2 | Added 2.4%
| 2020-02-28 | | Precious Metals | 0.0 | Reduced 3.6% | 2020-02-28 | | Special Situations | 0.0 | Reduced 31.9% | 2020-03-17 | | Cash | 65.0 | | |
|
Updates (Changes made today are underlined)
In the first months of the year, we saw manic trading activity. From big jumps in specific stocks to historic highs in retail trading activity to record highs in household confidence to almost unbelievable confidence among options traders. All of that came amid a market where the average stock couldn't keep up with their indexes. There were signs of waning momentum in stocks underlying the major averages, which started triggering technical warning signs in late January. After stocks bottomed on the 23rd, they enjoyed a historic buying thrust and retraced a larger amount of the decline than "just a bear market rally" tends to. Those thrusts are the most encouraging sign we've seen in years. Through early June, we were still seeing thrusts that have led to recoveries in longer-term breadth metrics. The longer-term prospects for stocks (6-12 months) still look decent given the above. On a short- to medium-term basis, it was getting harder to make that case. Dumb Money Confidence spiked and there were multiple signs of a historic level of speculation. This is likely the lowest I will go given what I still consider to be compelling positives over a longer time frame. There is not a slam-dunk case to be made for either direction, so it will seem like a mistake whether stocks keep dropping (why didn't I sell more?) or if they turn and head higher (why did I let short-term concerns prevail?). After nearly three decades of trading, I've learned to let go of the idea of perfection.
RETURN YTD: -4.8% 2019: 12.6%, 2018: 0.6%, 2017: 3.8%, 2016: 17.1%, 2015: 9.2%, 2014: 14.5%, 2013: 2.2%, 2012: 10.8%, 2011: 16.5%, 2010: 15.3%, 2009: 23.9%, 2008: 16.2%, 2007: 7.8%
|
|
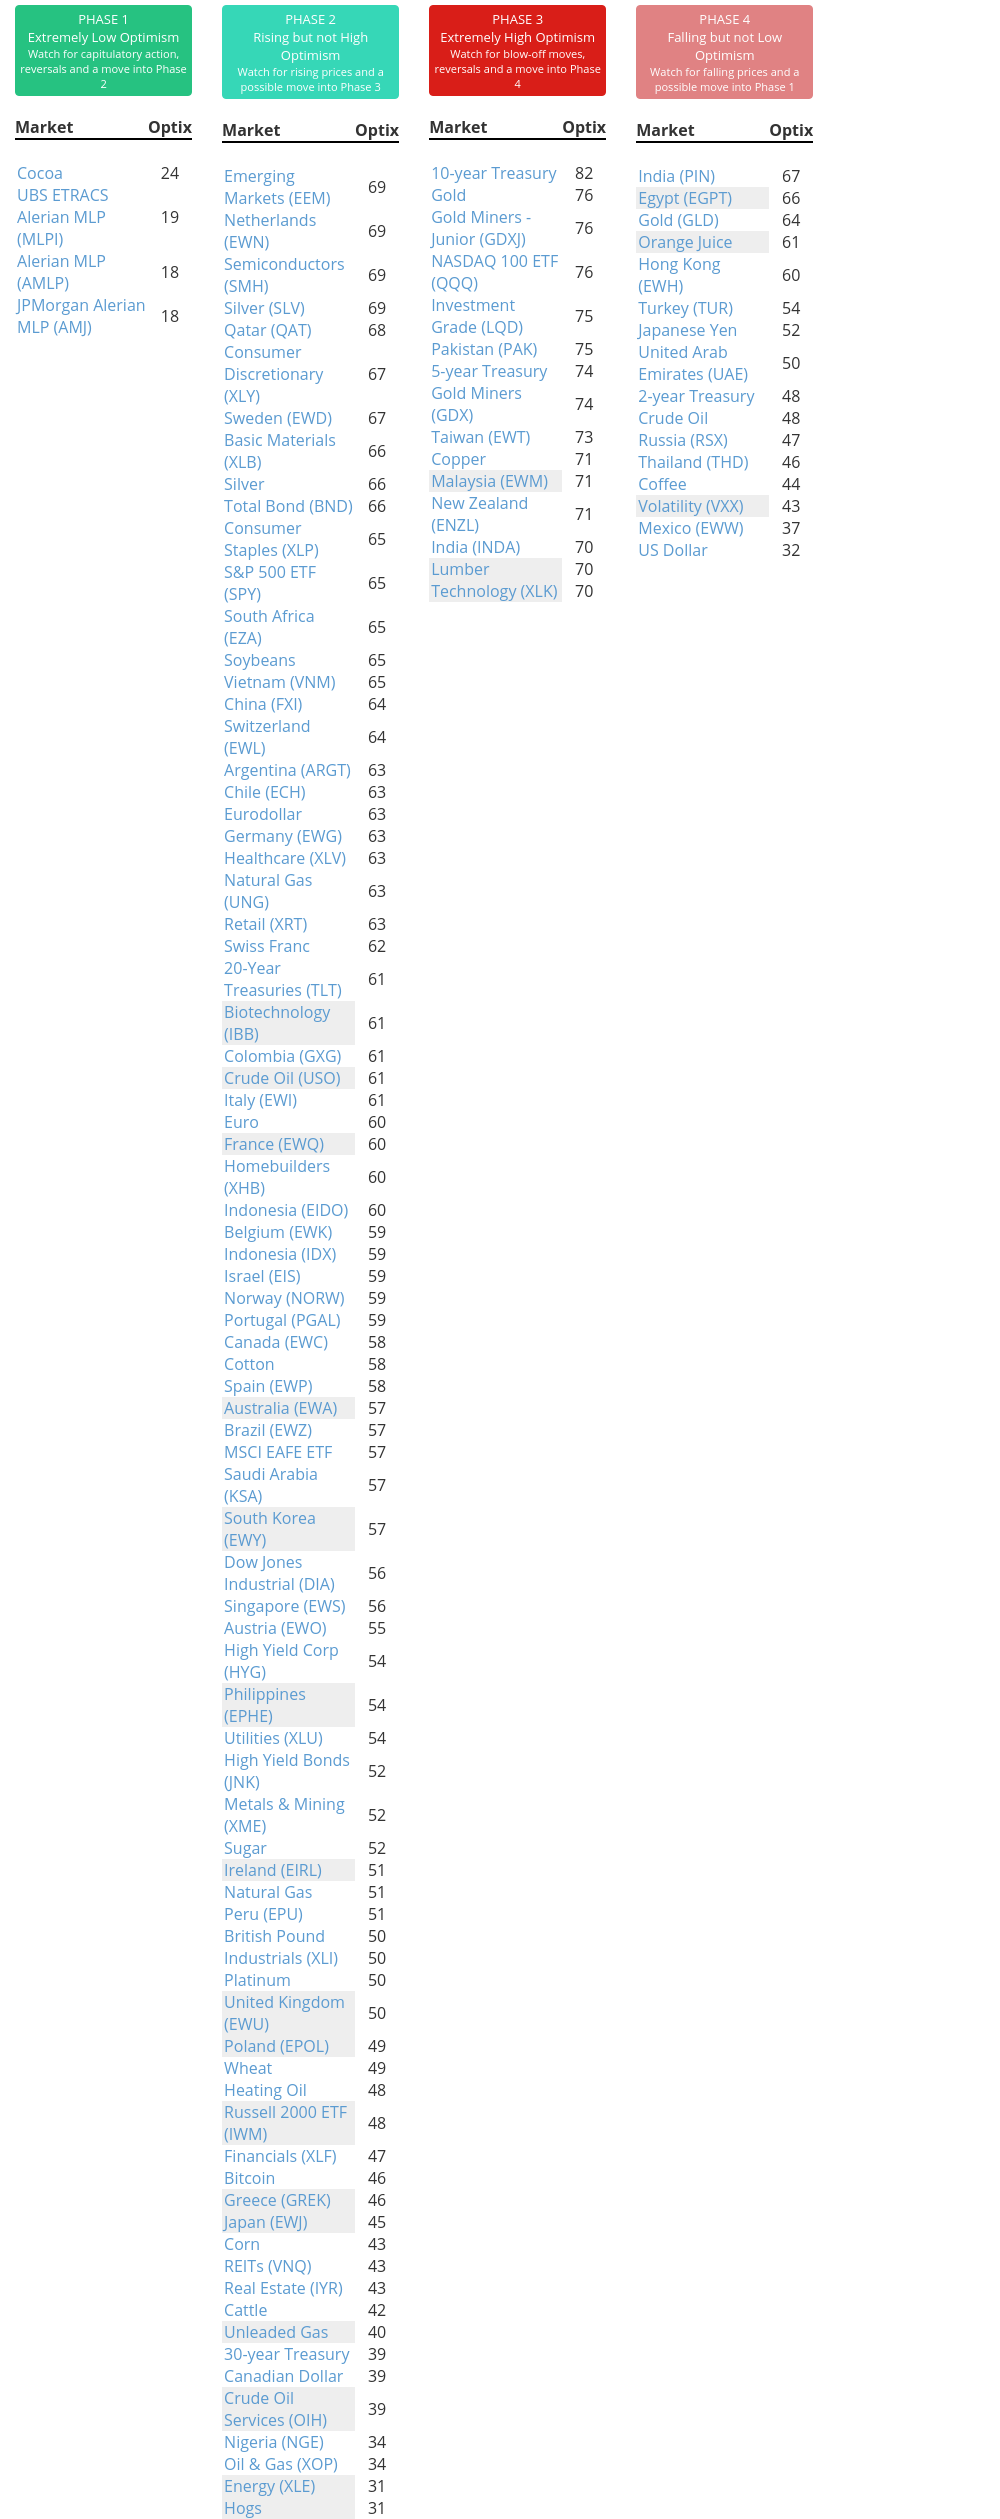
Phase Table
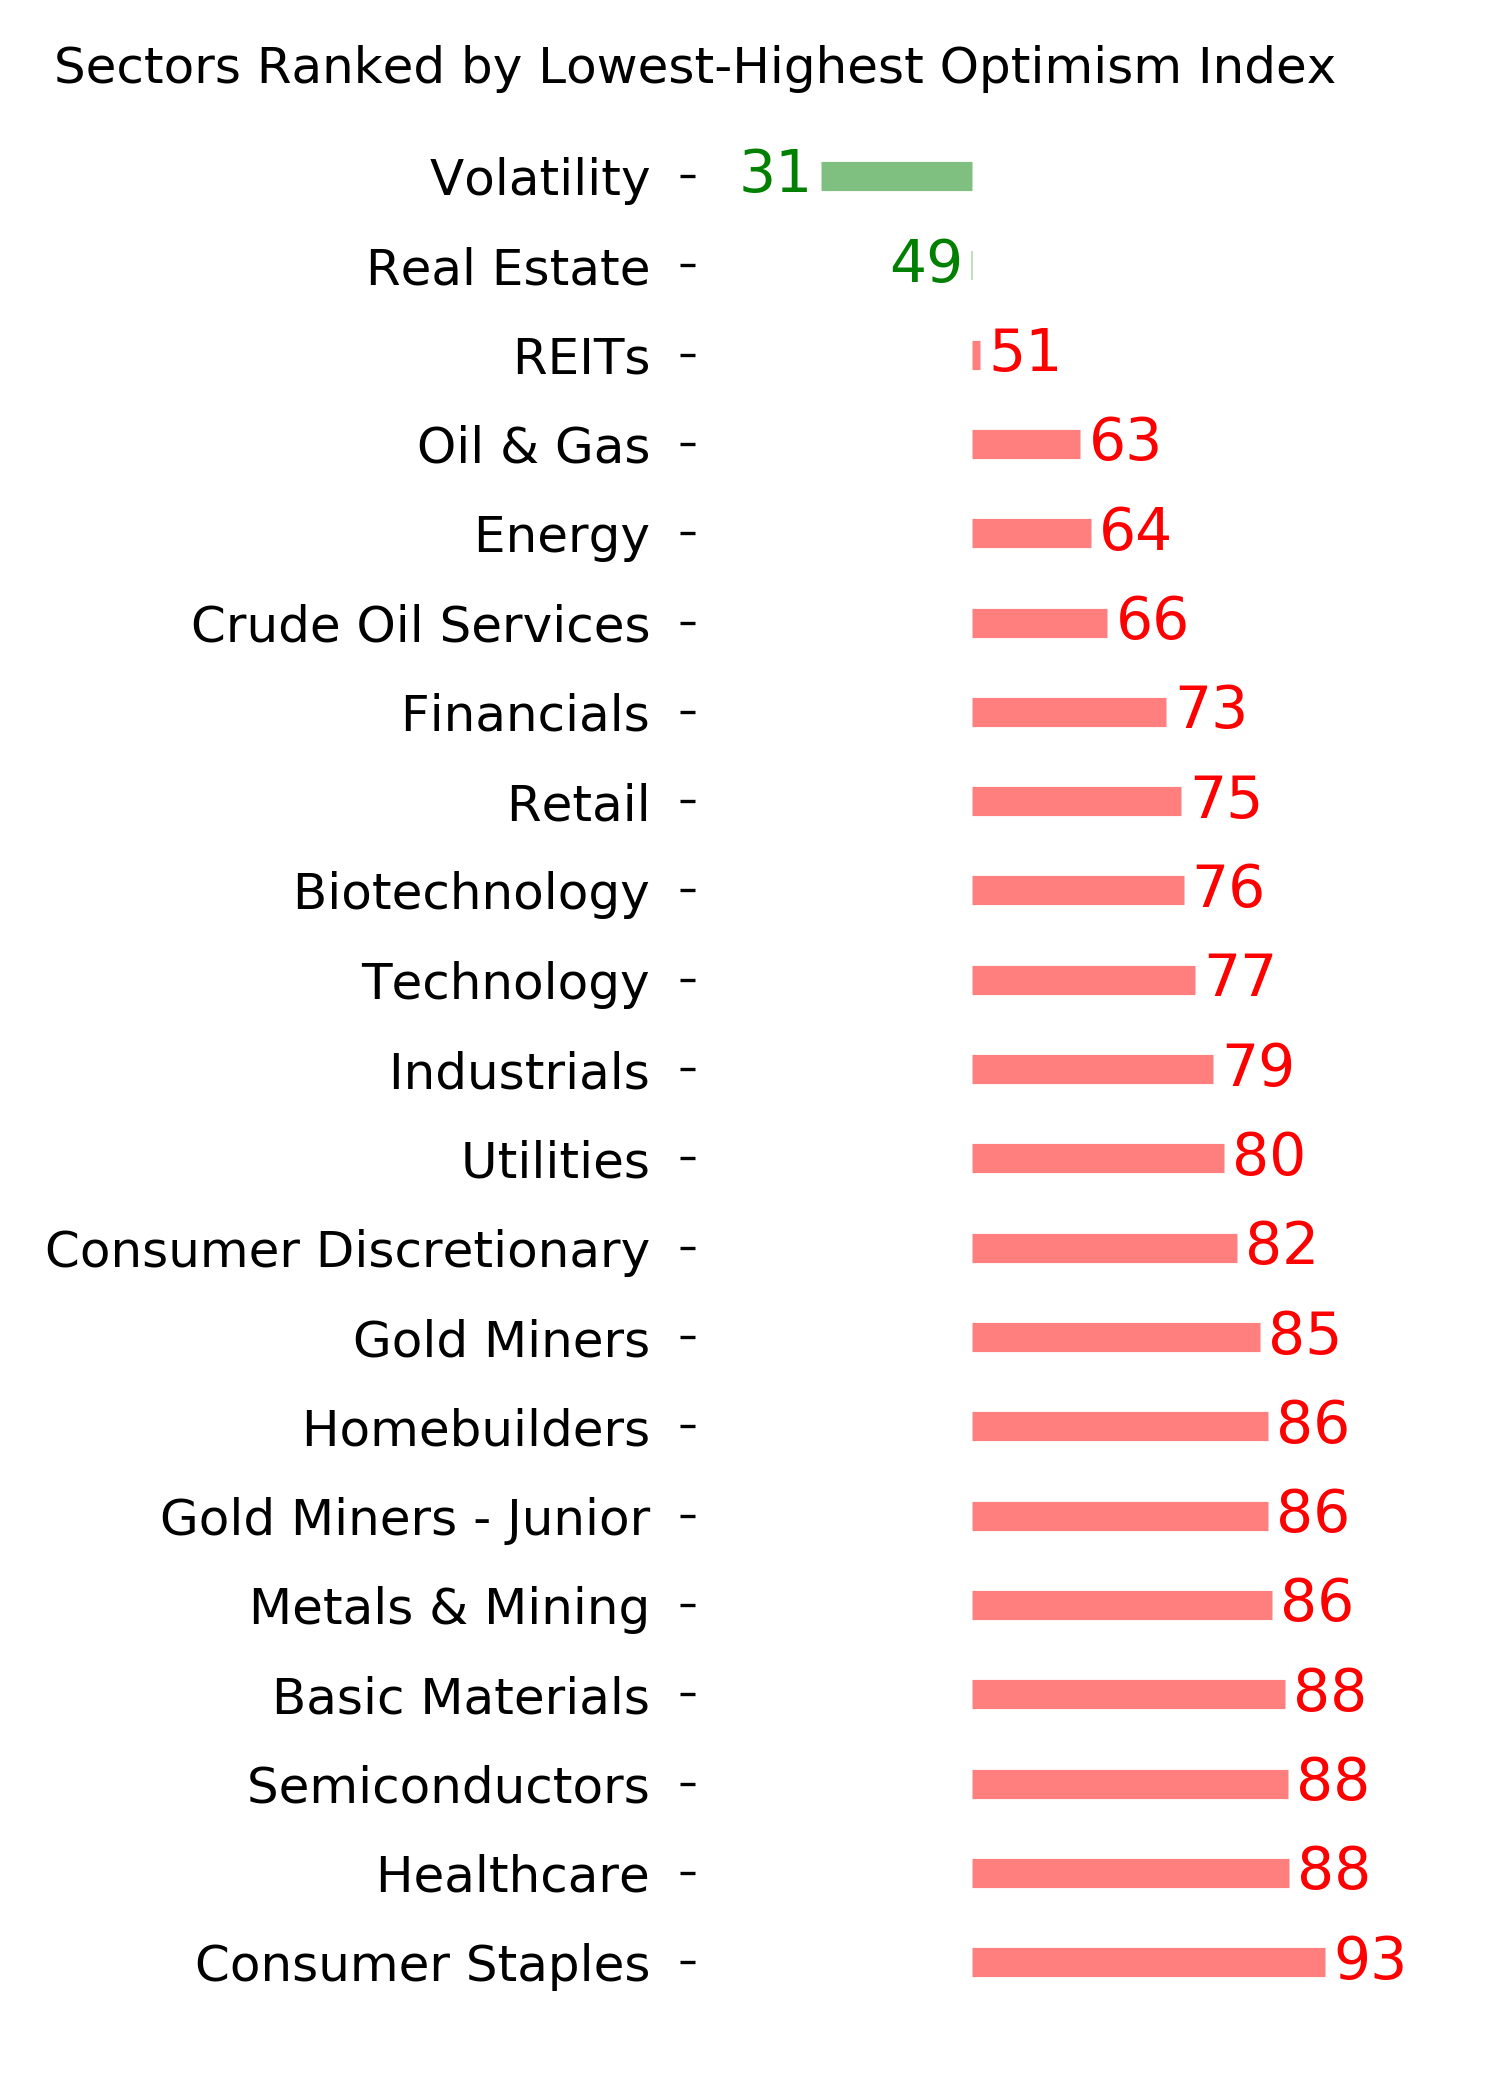
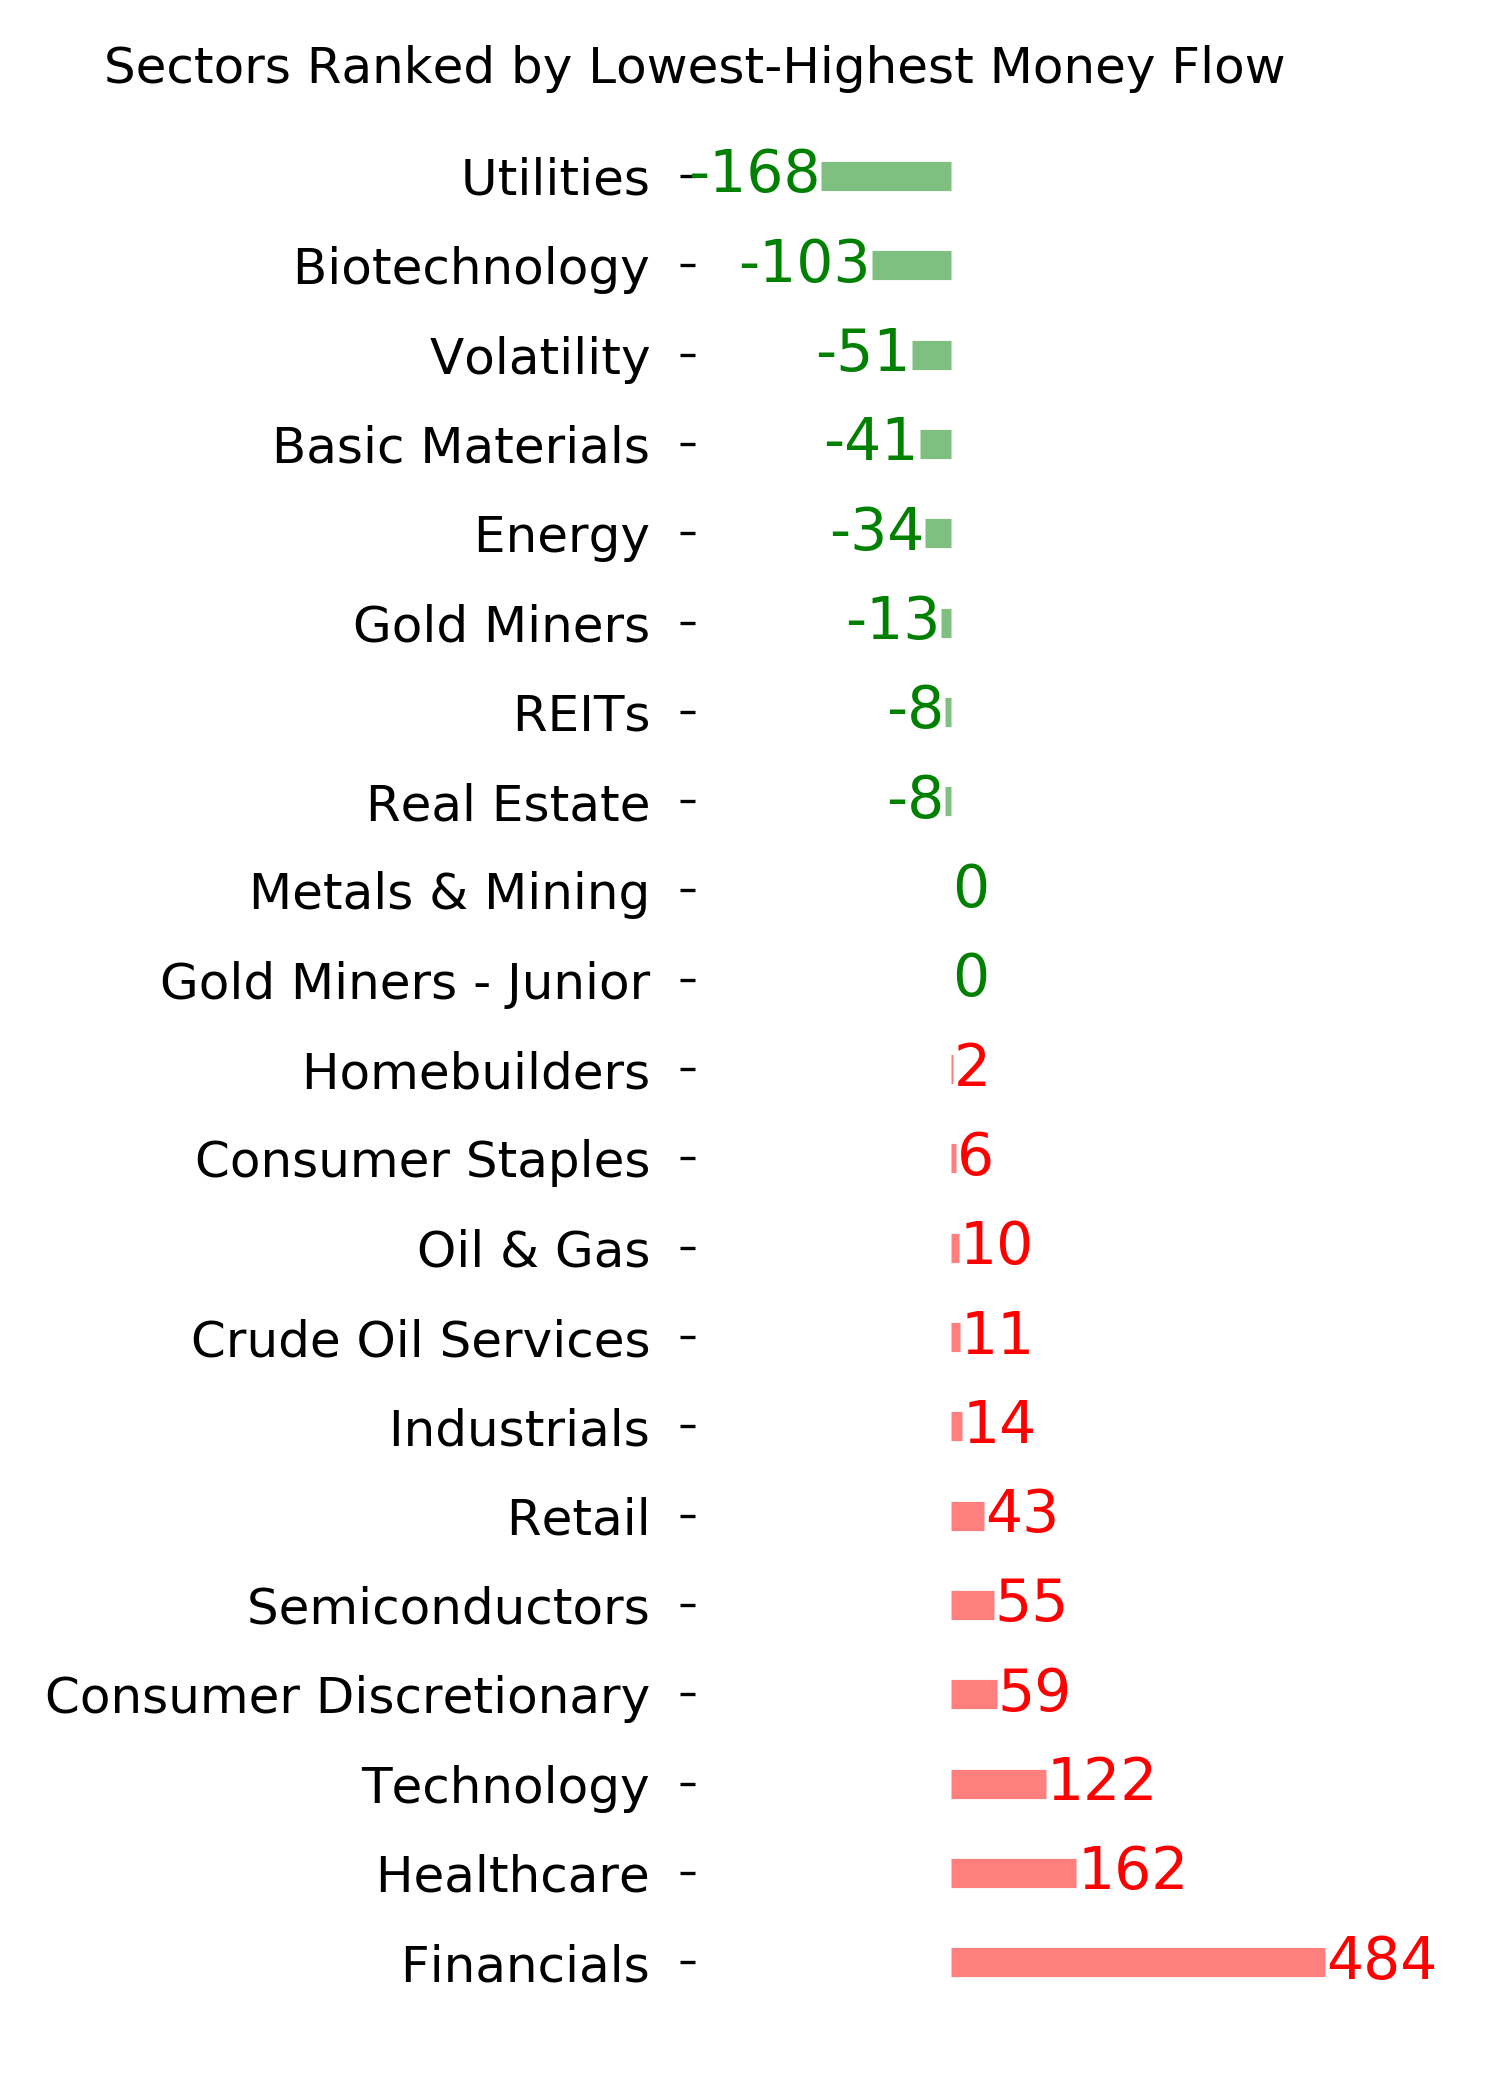
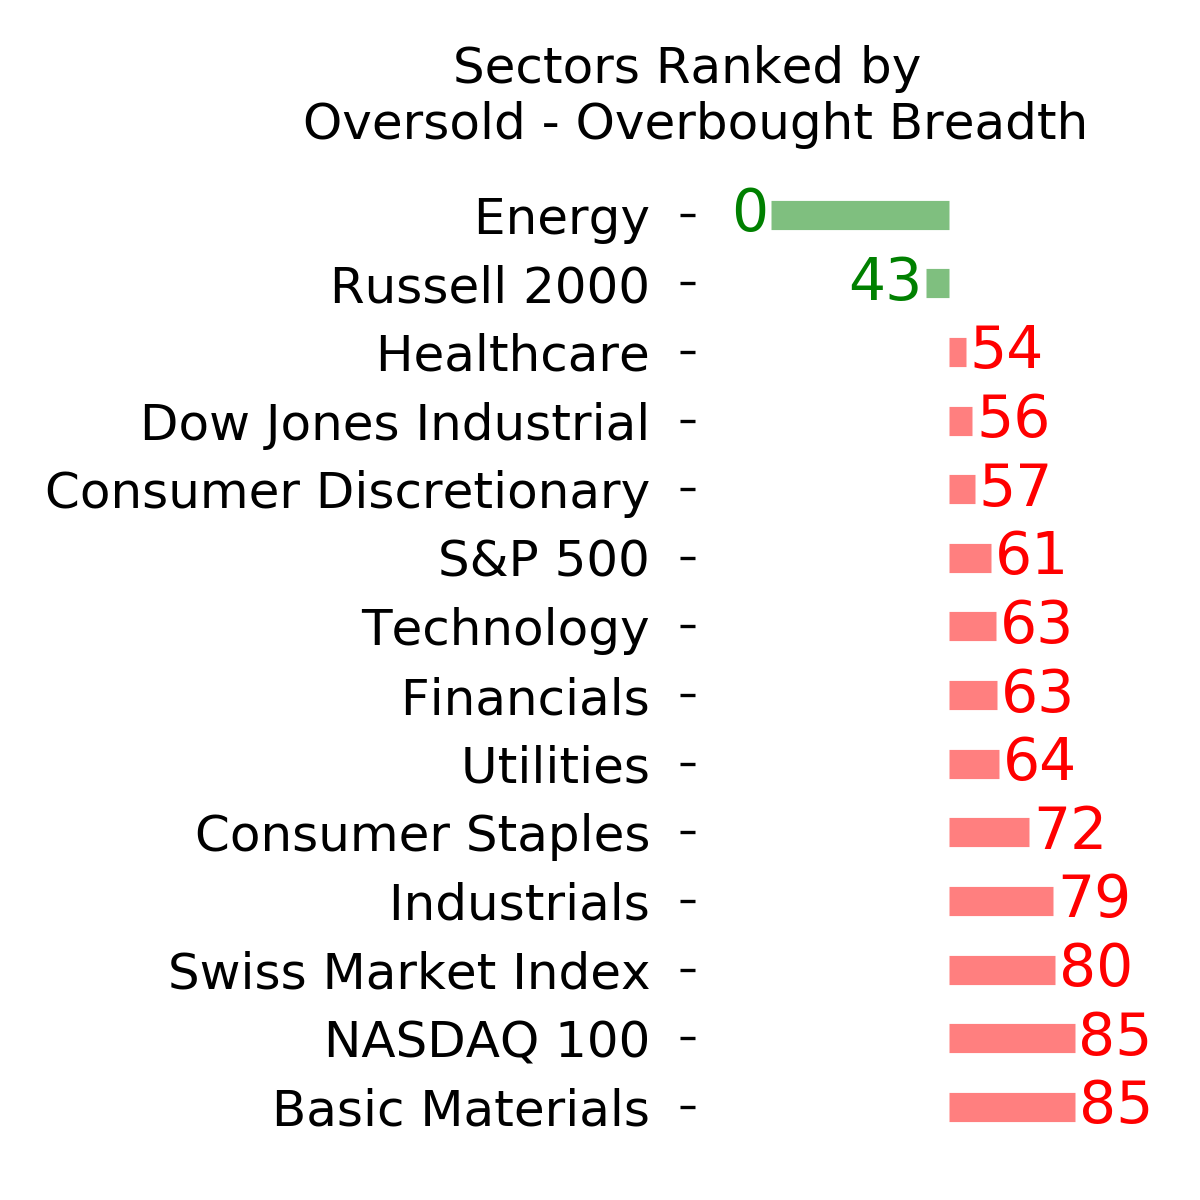
Ranks
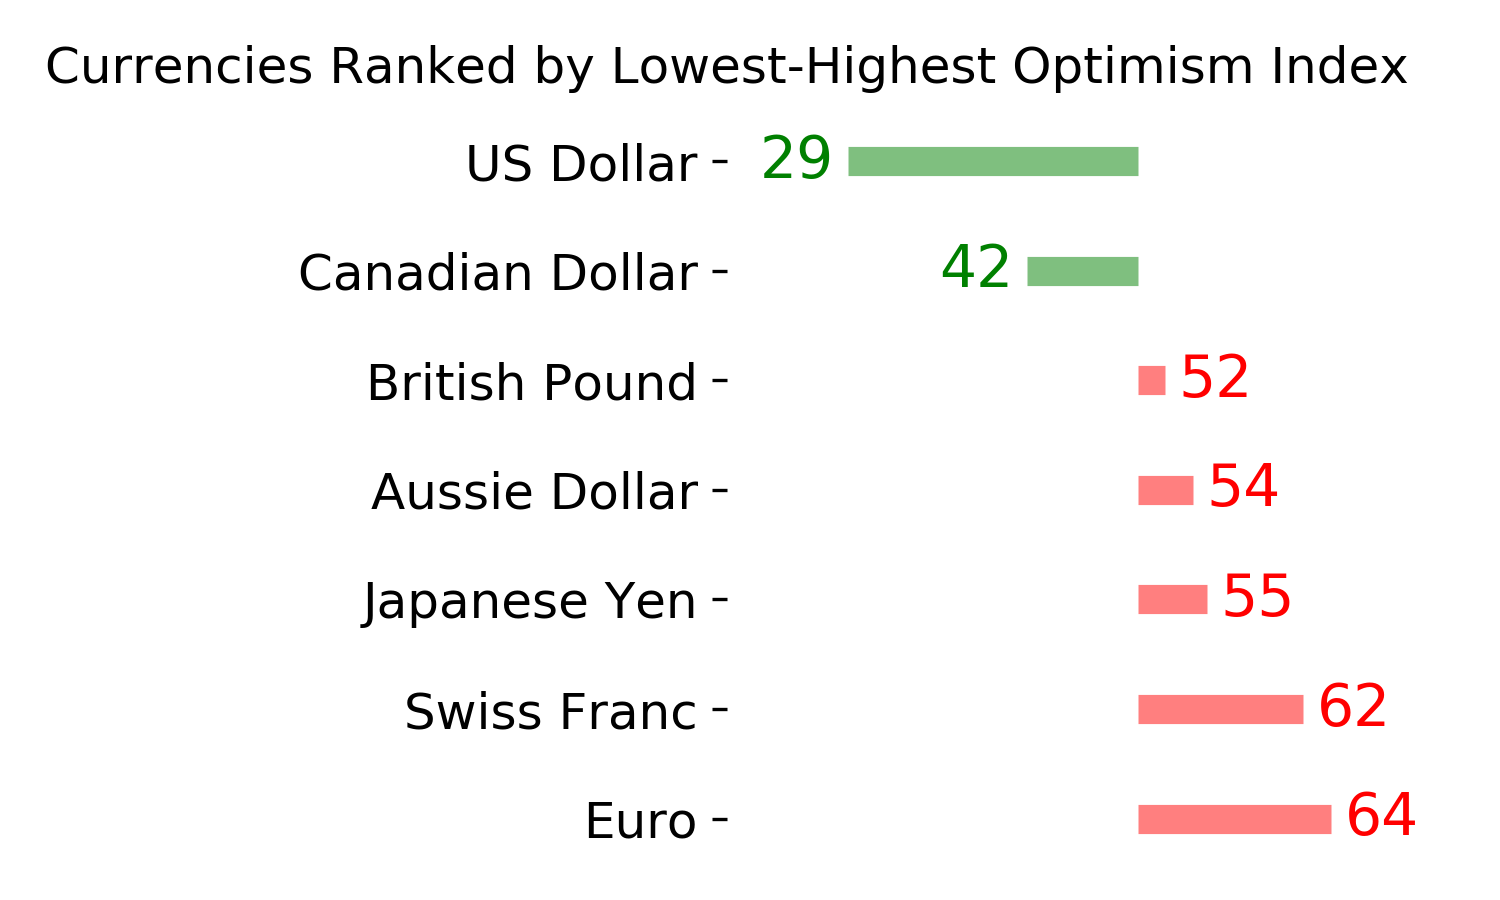
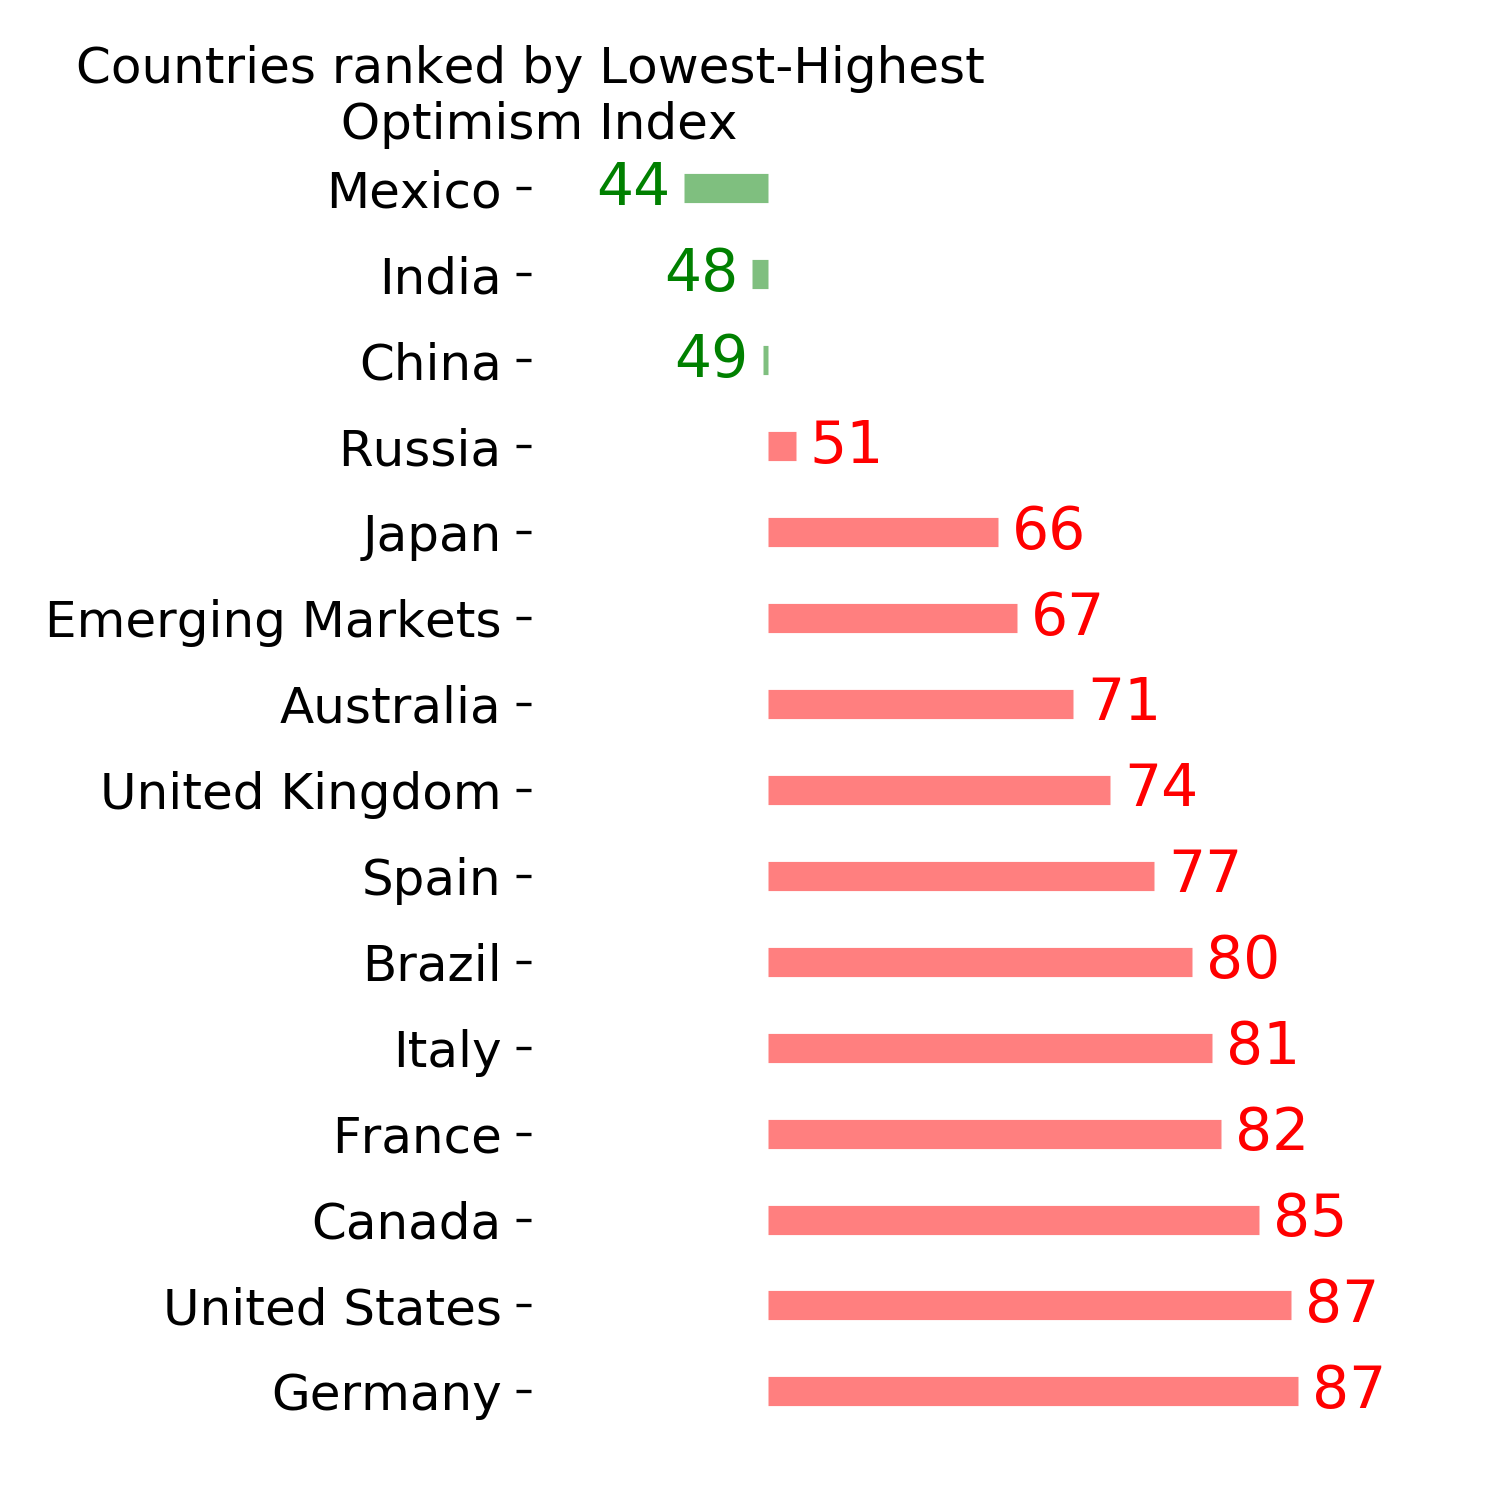
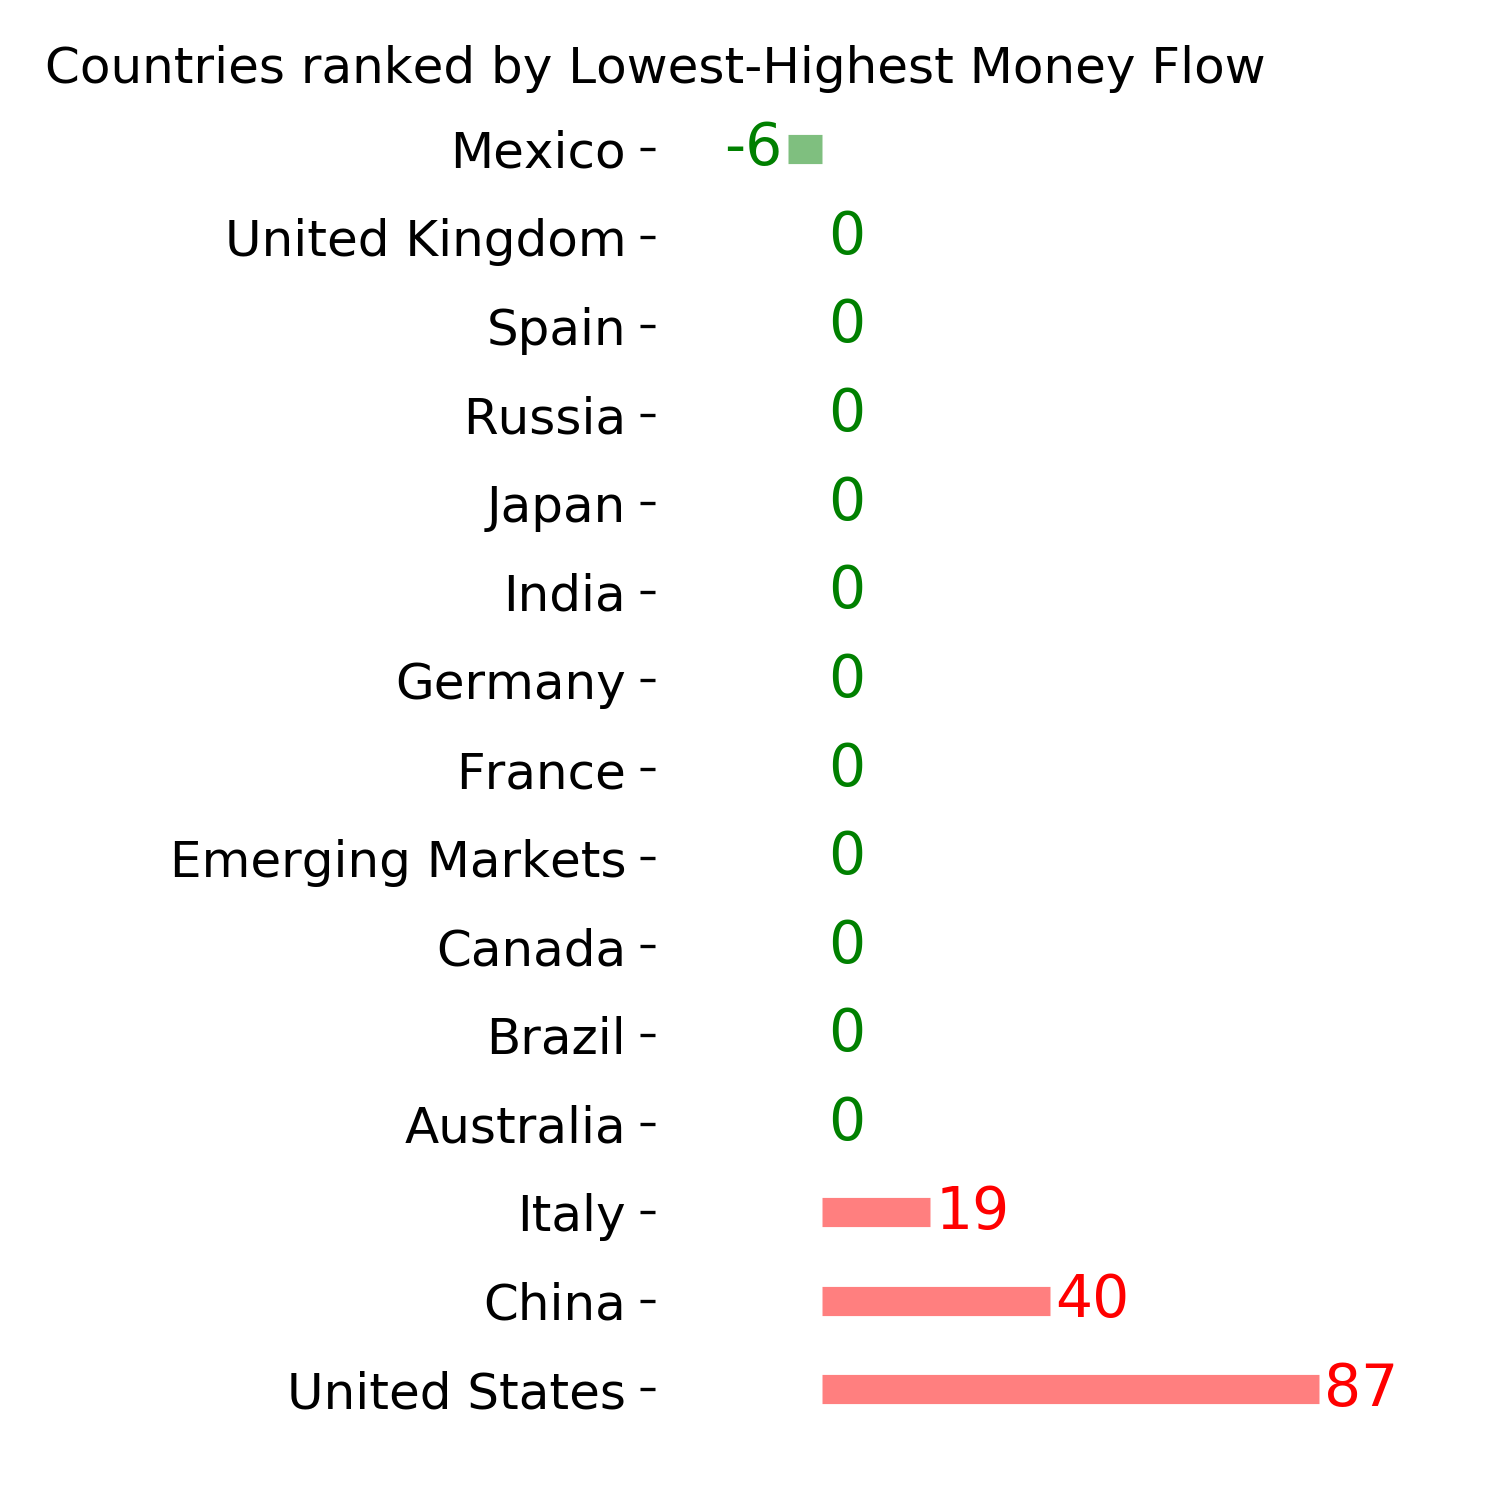
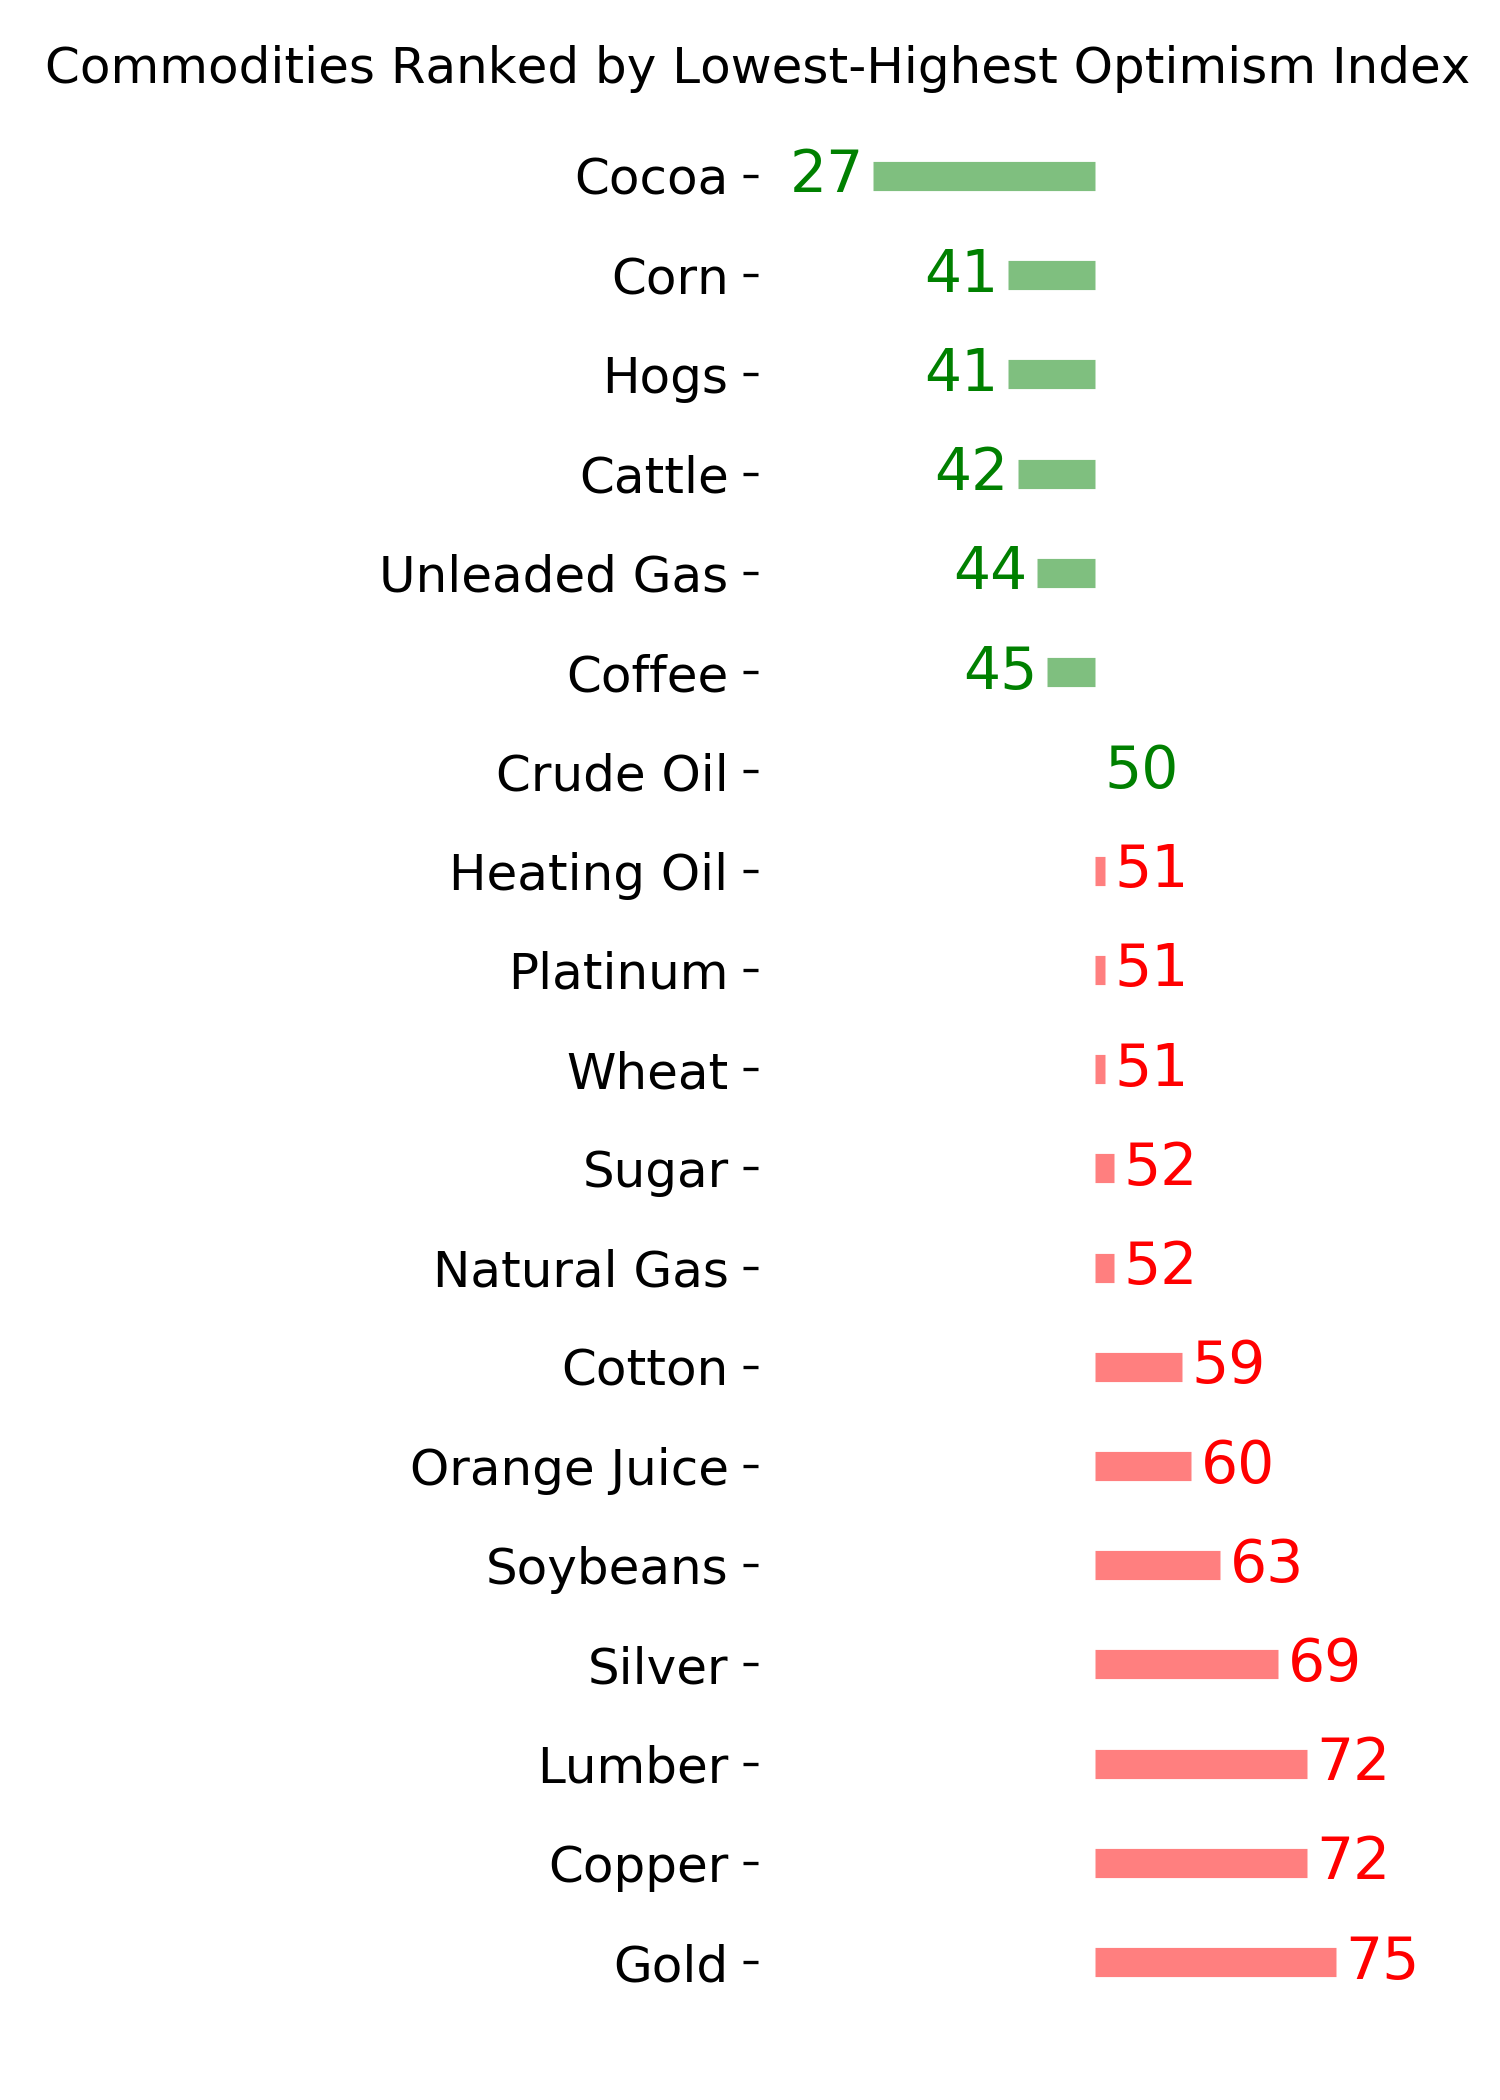
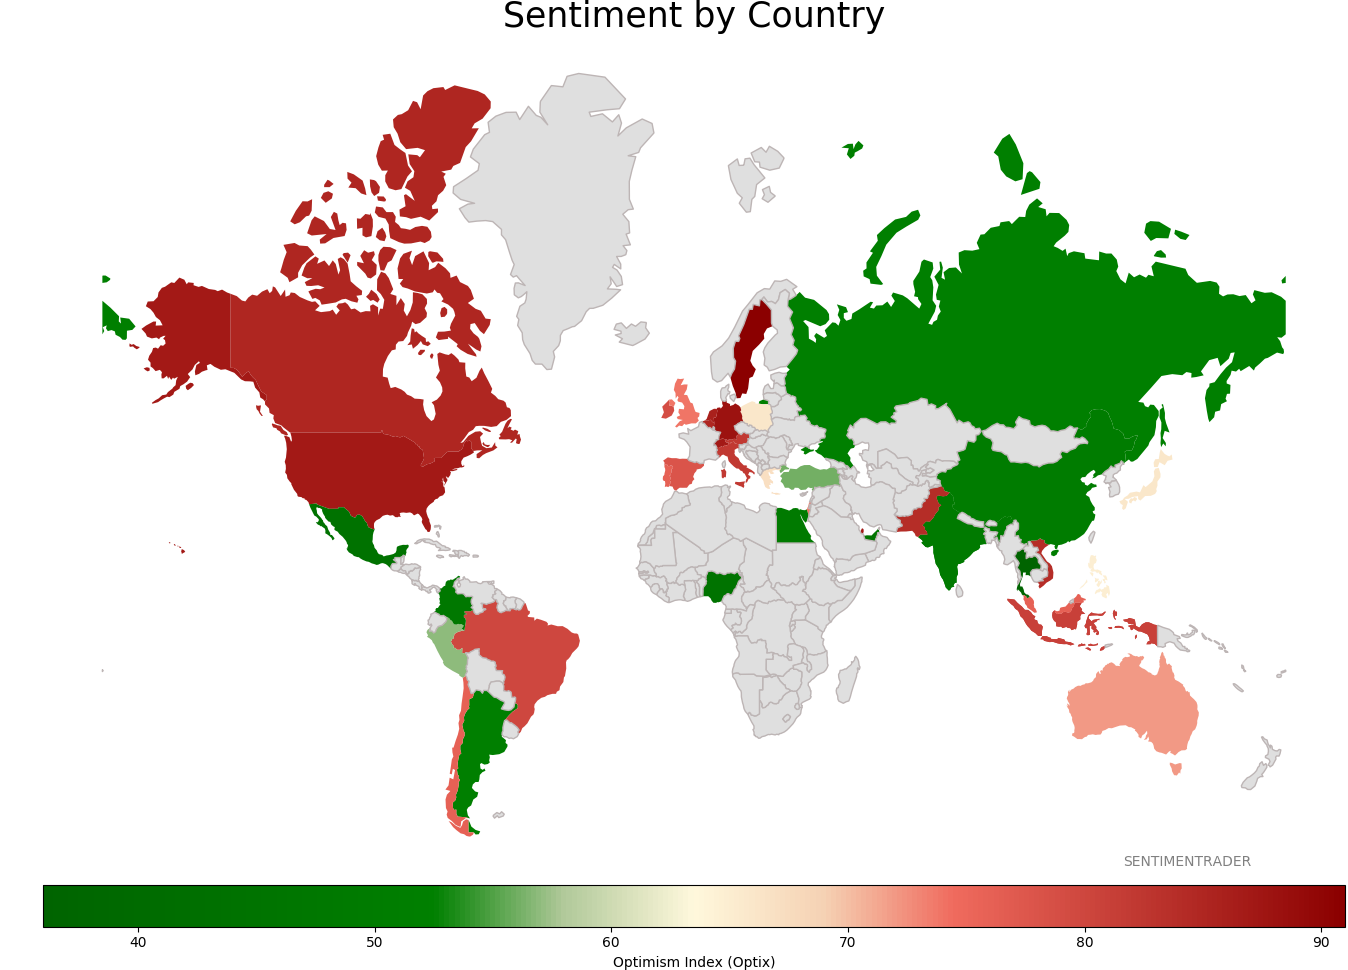
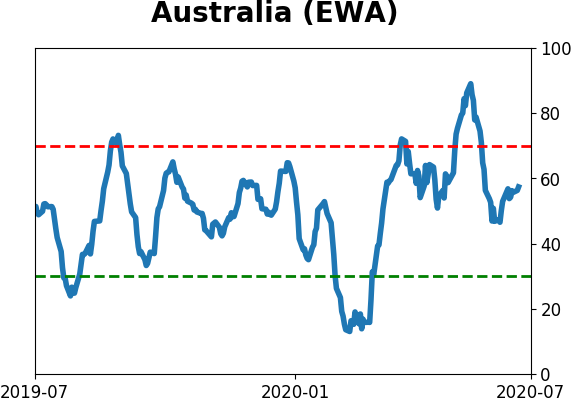
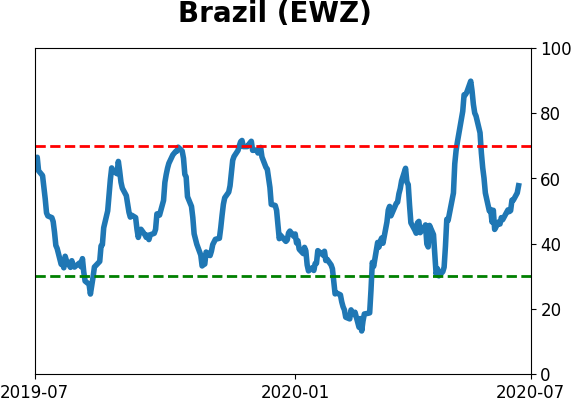
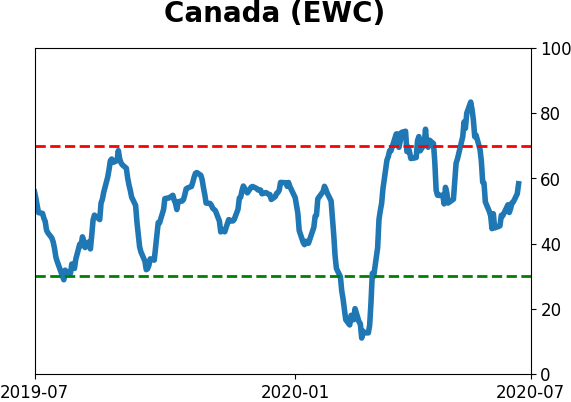
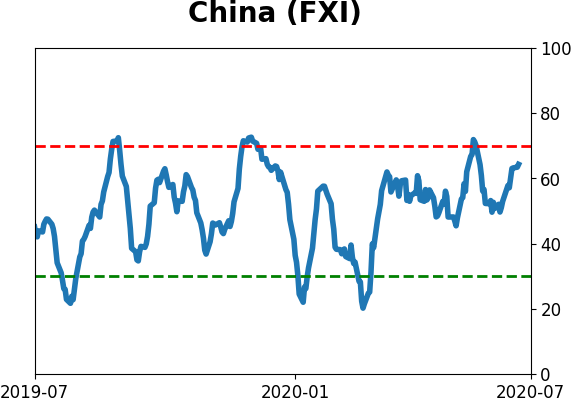
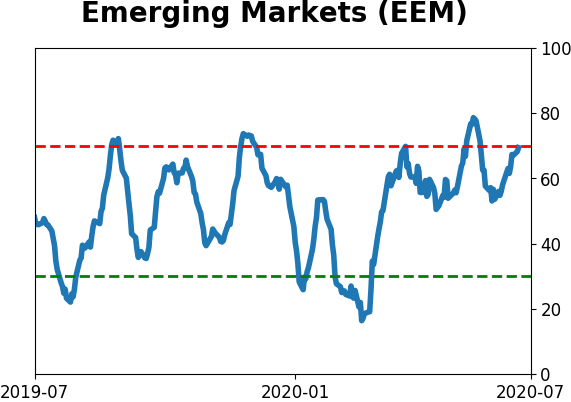
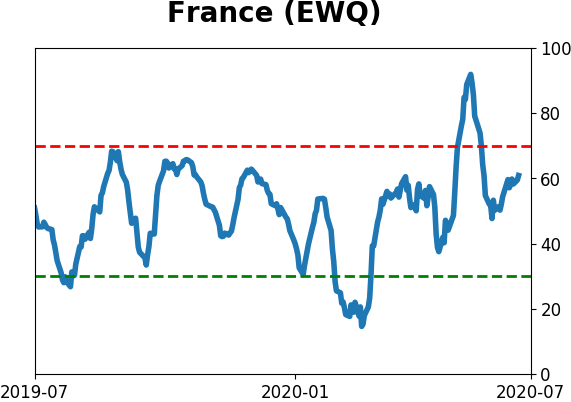
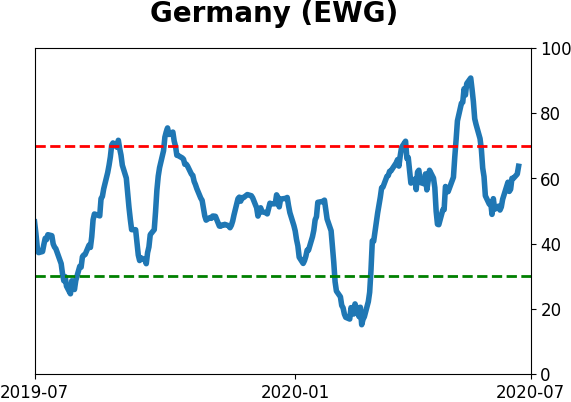
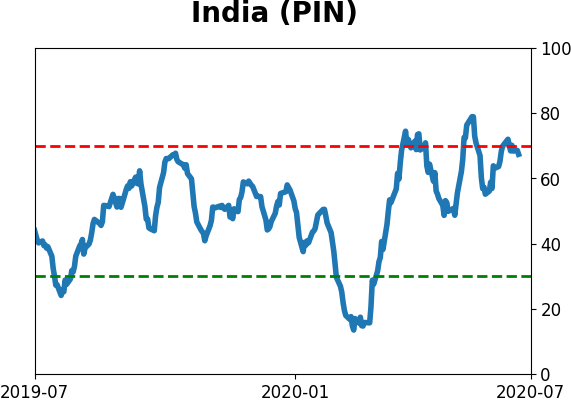
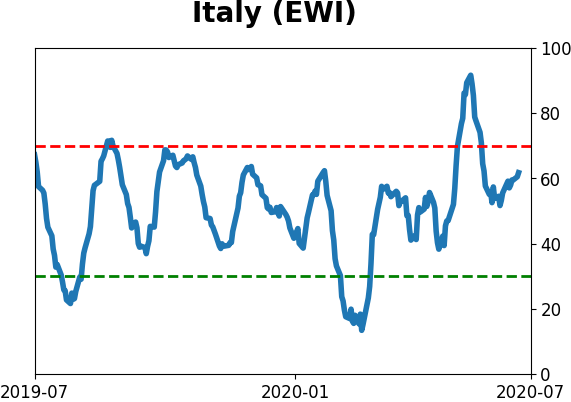
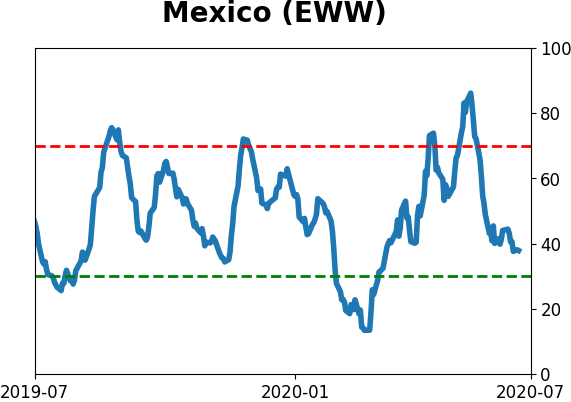
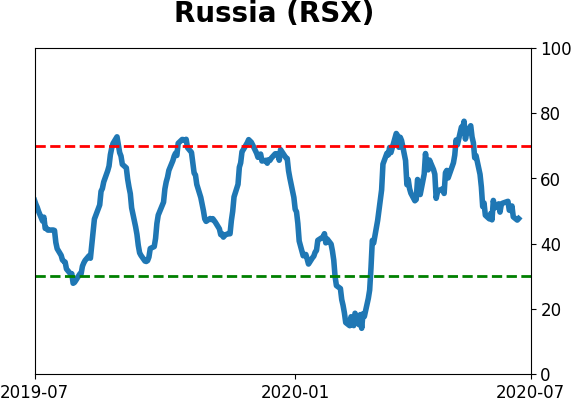
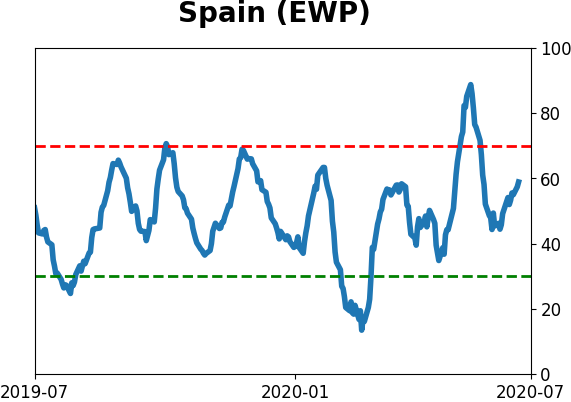
Sentiment Around The World
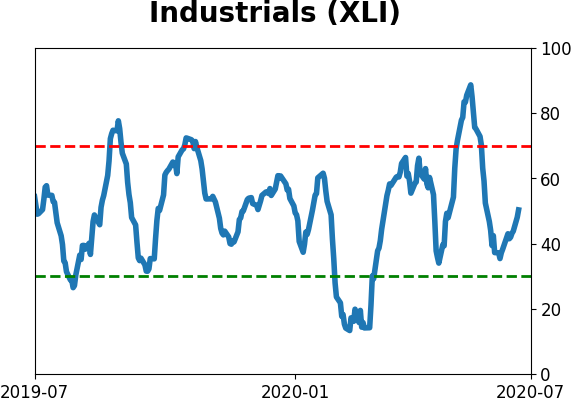
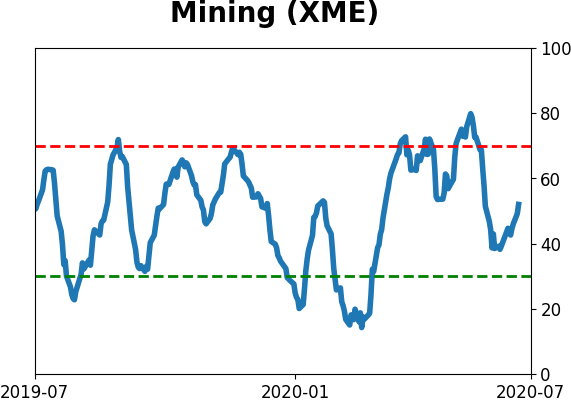
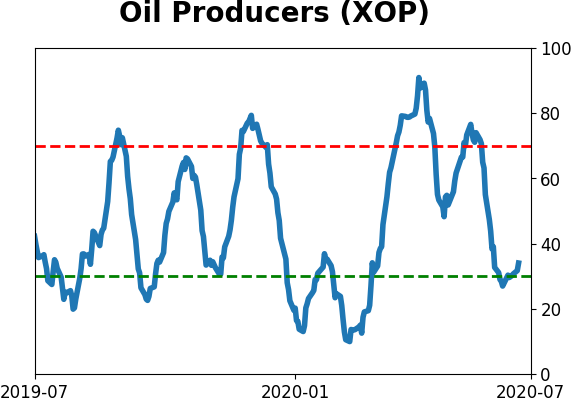
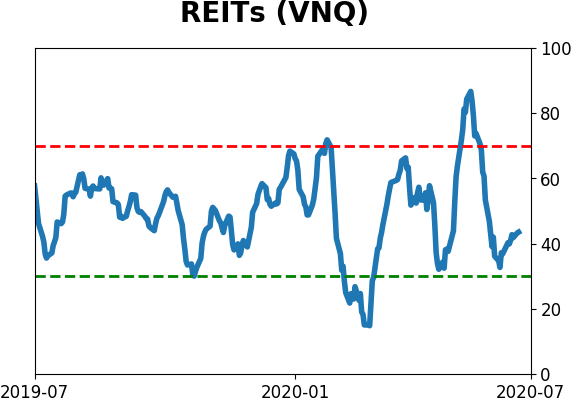
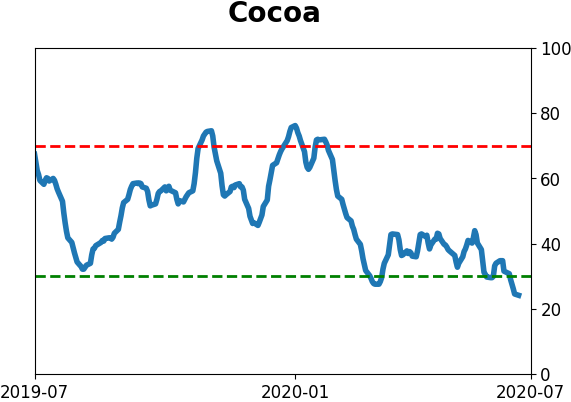
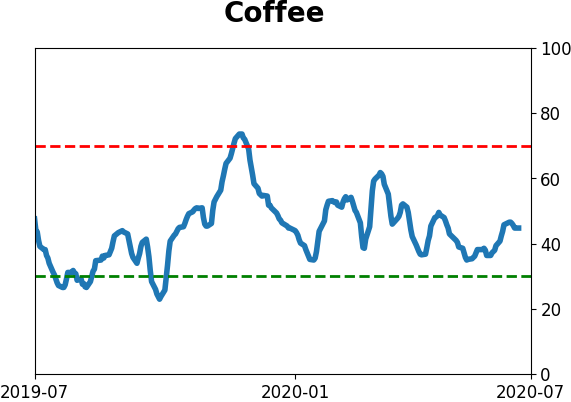
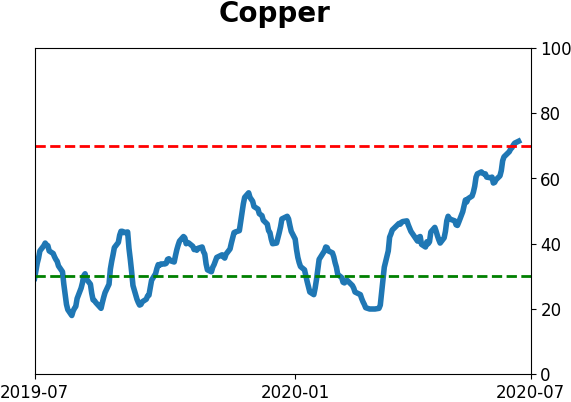
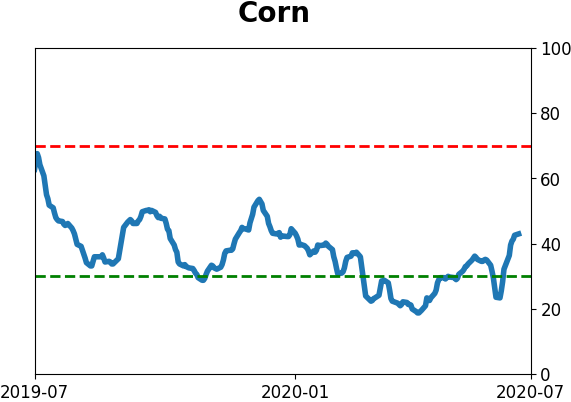
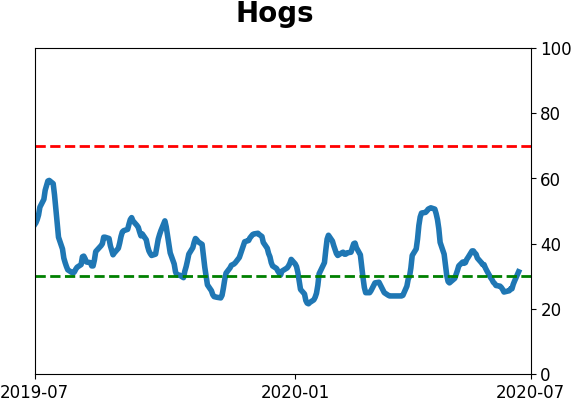
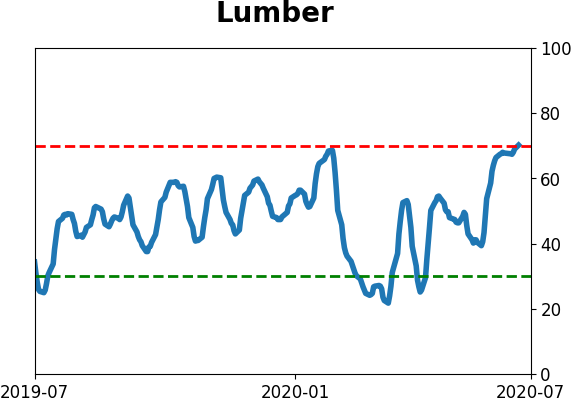
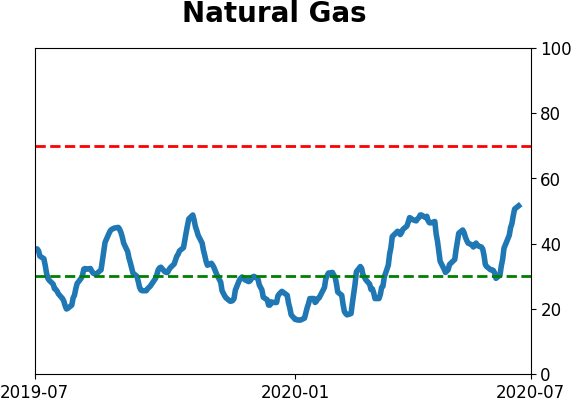
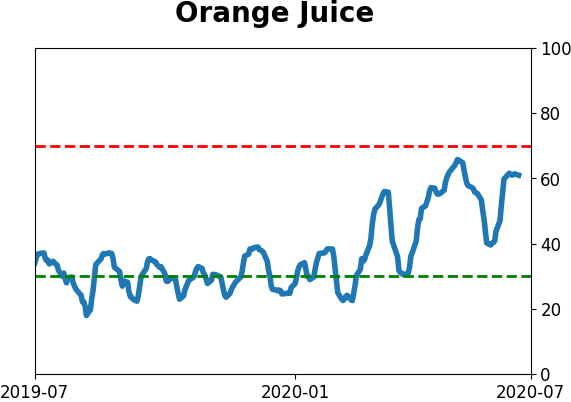
Optimism Index Thumbnails
|
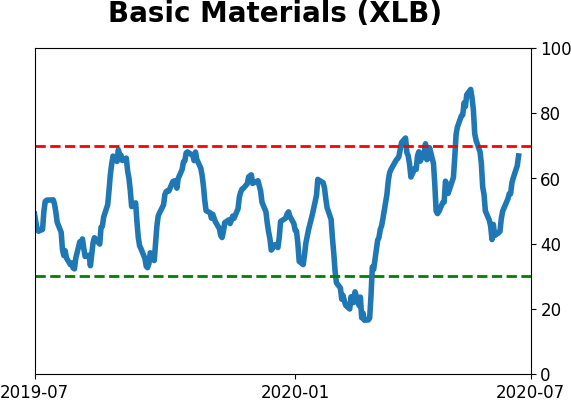
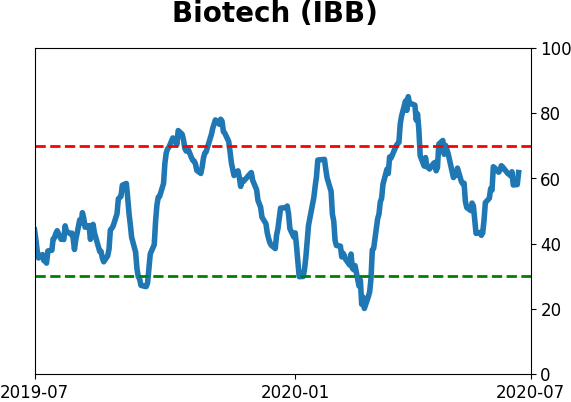
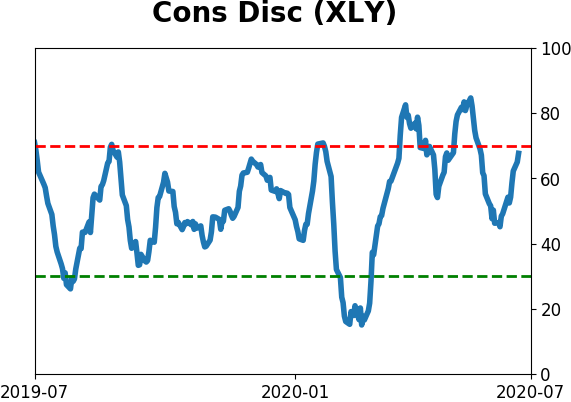
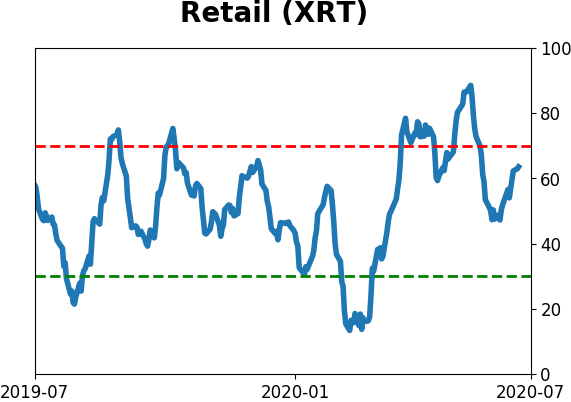
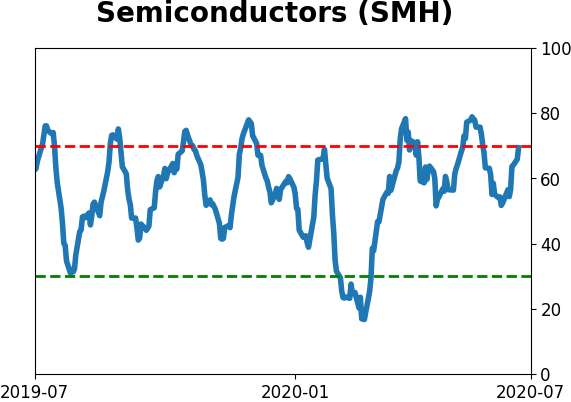
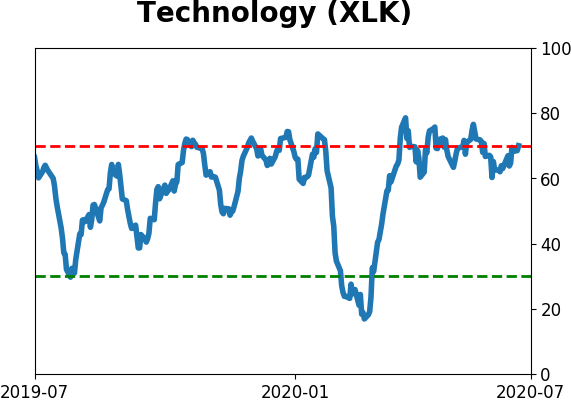
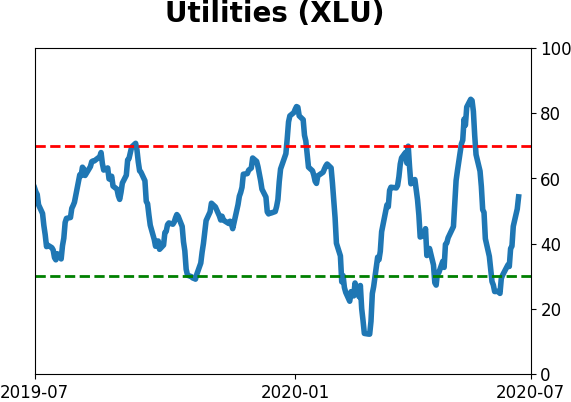
Sector ETF's - 10-Day Moving Average
|
|
|
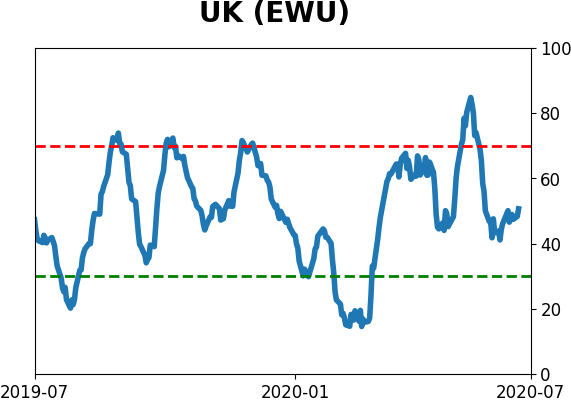
Country ETF's - 10-Day Moving Average
|
|
|
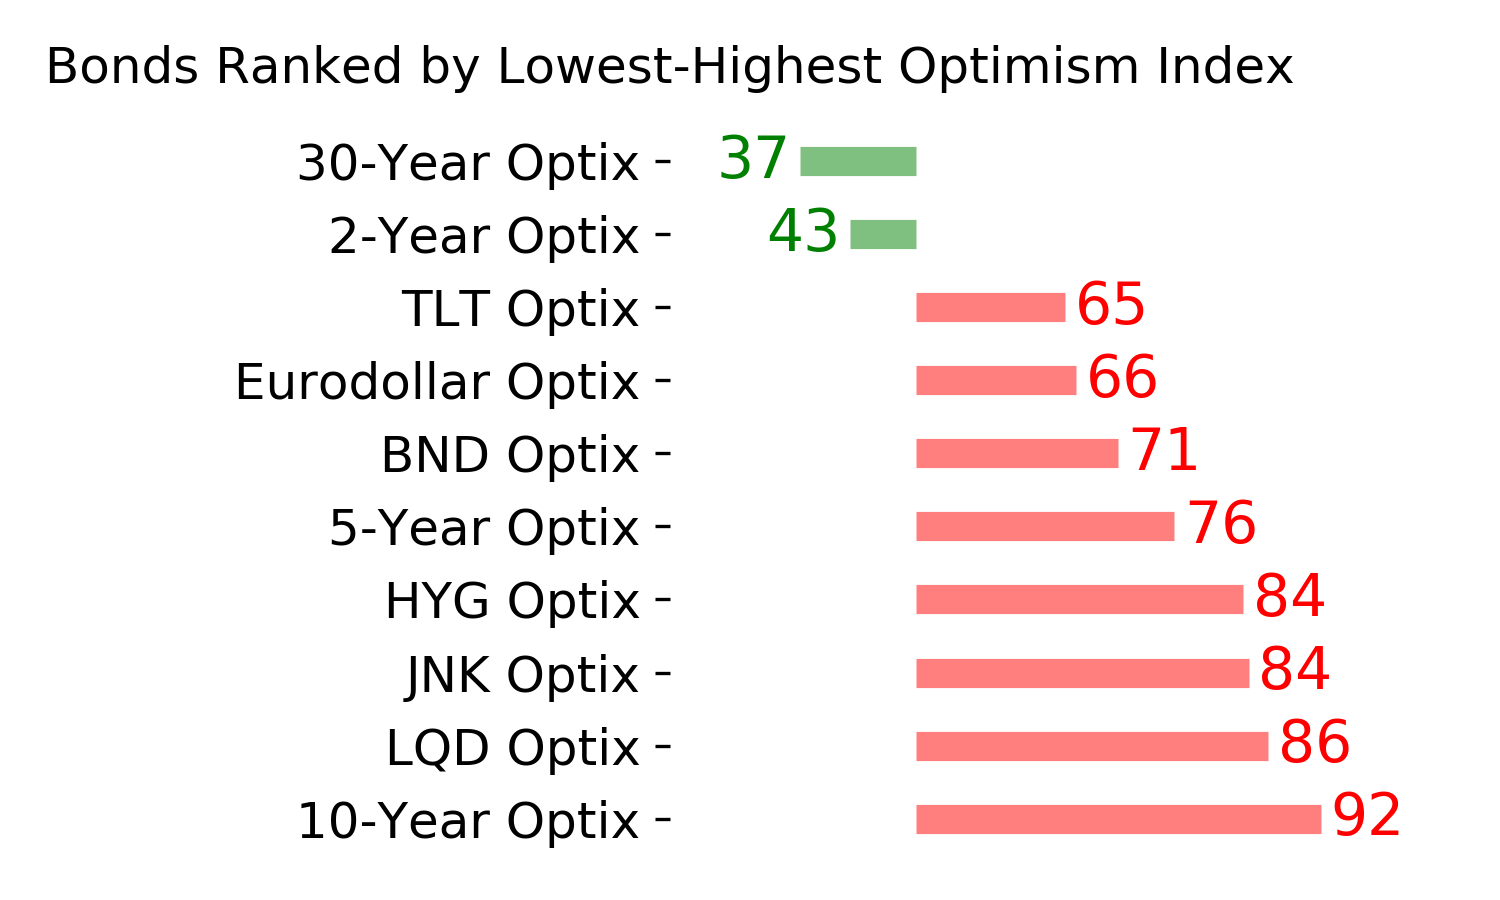
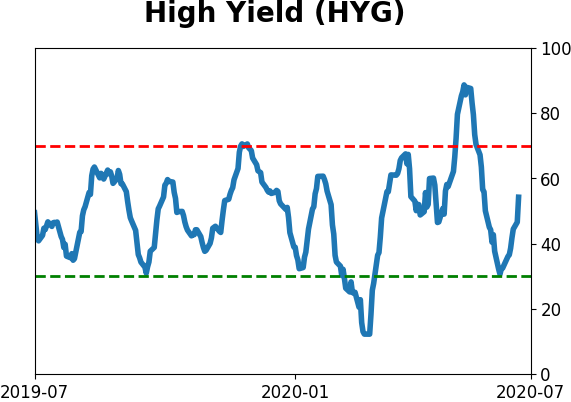
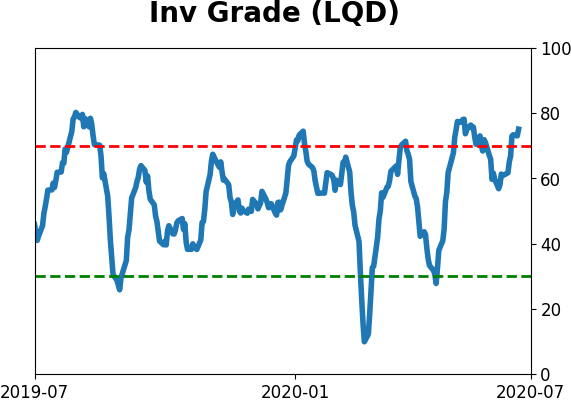
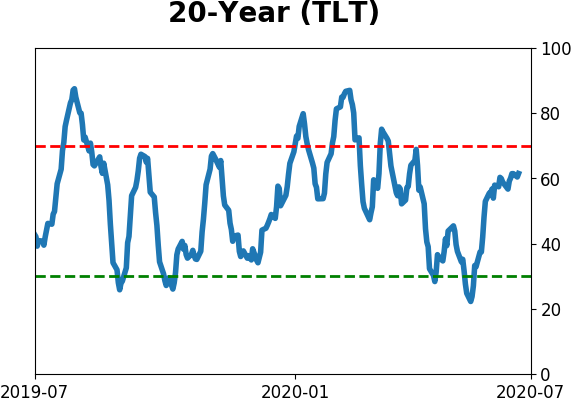
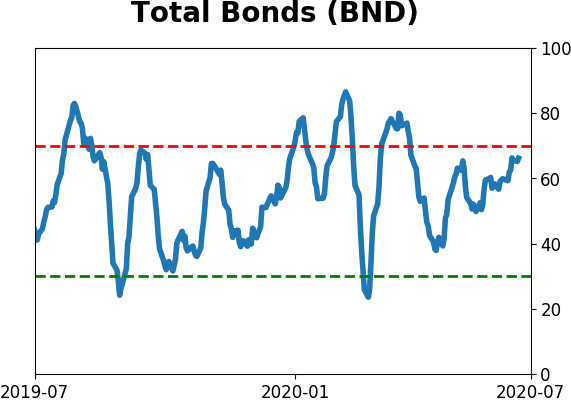
Bond ETF's - 10-Day Moving Average
|
|
|
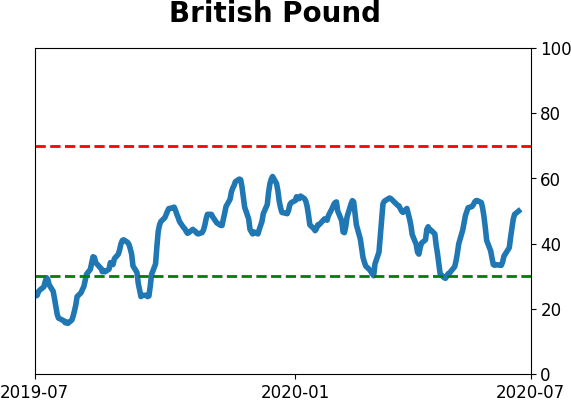
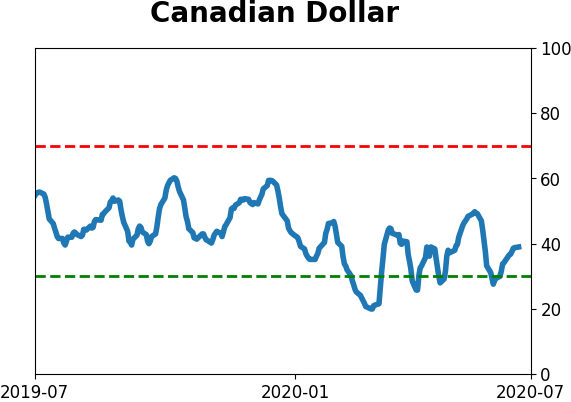
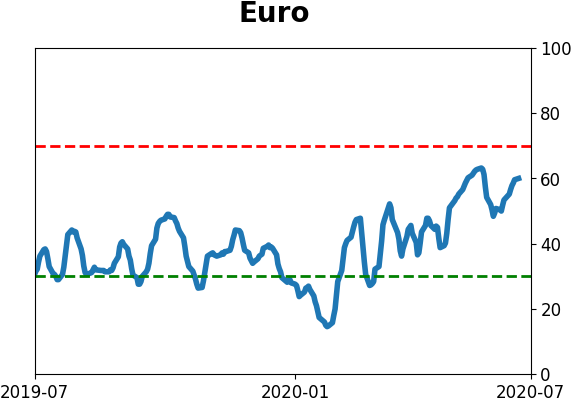
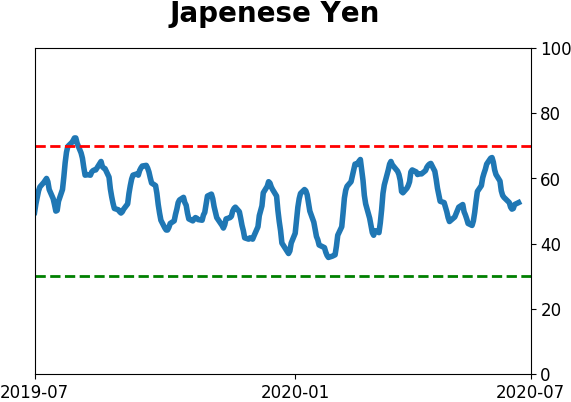
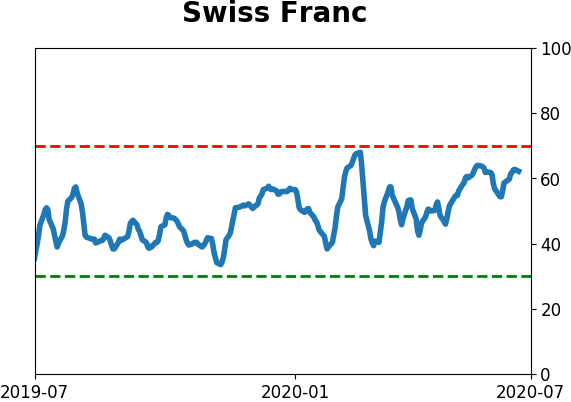
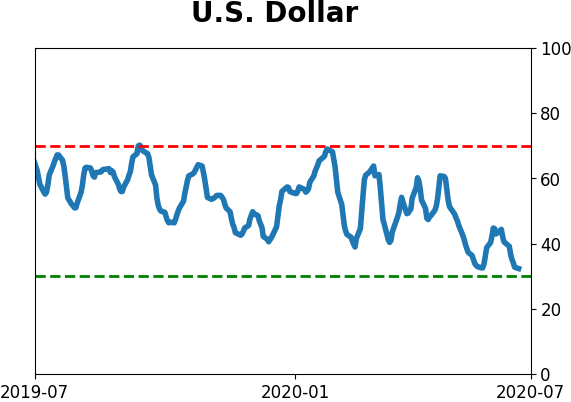
Currency ETF's - 5-Day Moving Average
|
|
|
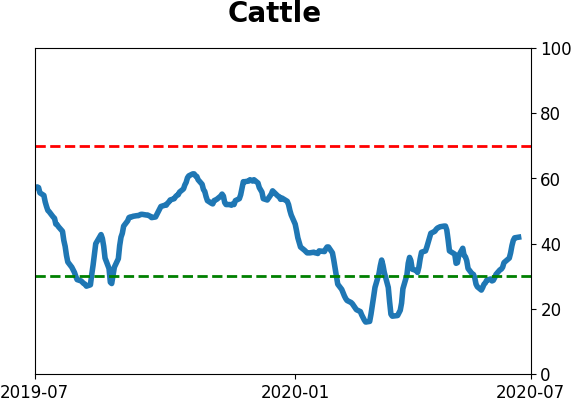
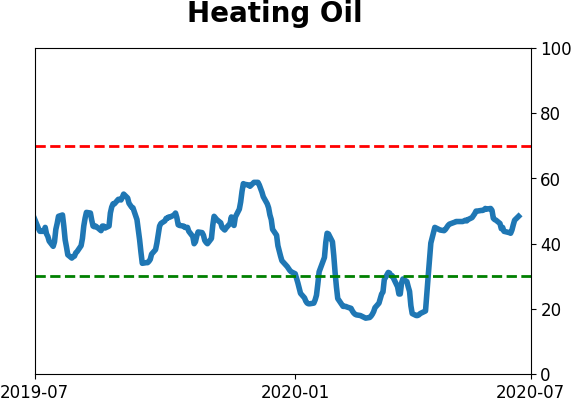
Commodity ETF's - 5-Day Moving Average
|
|