Headlines
|
|
As Stocks Double, A Record Run with Record Low Participation:
The S&P 500 has now doubled from its pandemic low in the 2nd-fastest doubling in the index's history. It has also enjoyed a historic cluster of days hitting record highs. And yet, fewer than 60% of its stocks have yet managed to even climb above their 50-day moving averages.
Bottom Line:
See the Outlook & Allocations page for more details on these summaries STOCKS: Hold
The speculative frenzy in February is wrung out. Internal dynamics have mostly held up, with some exceptions. Many of our studies still show a mixed to poor short-term view, with medium- and long-term ones turning more positive. BONDS: Hold
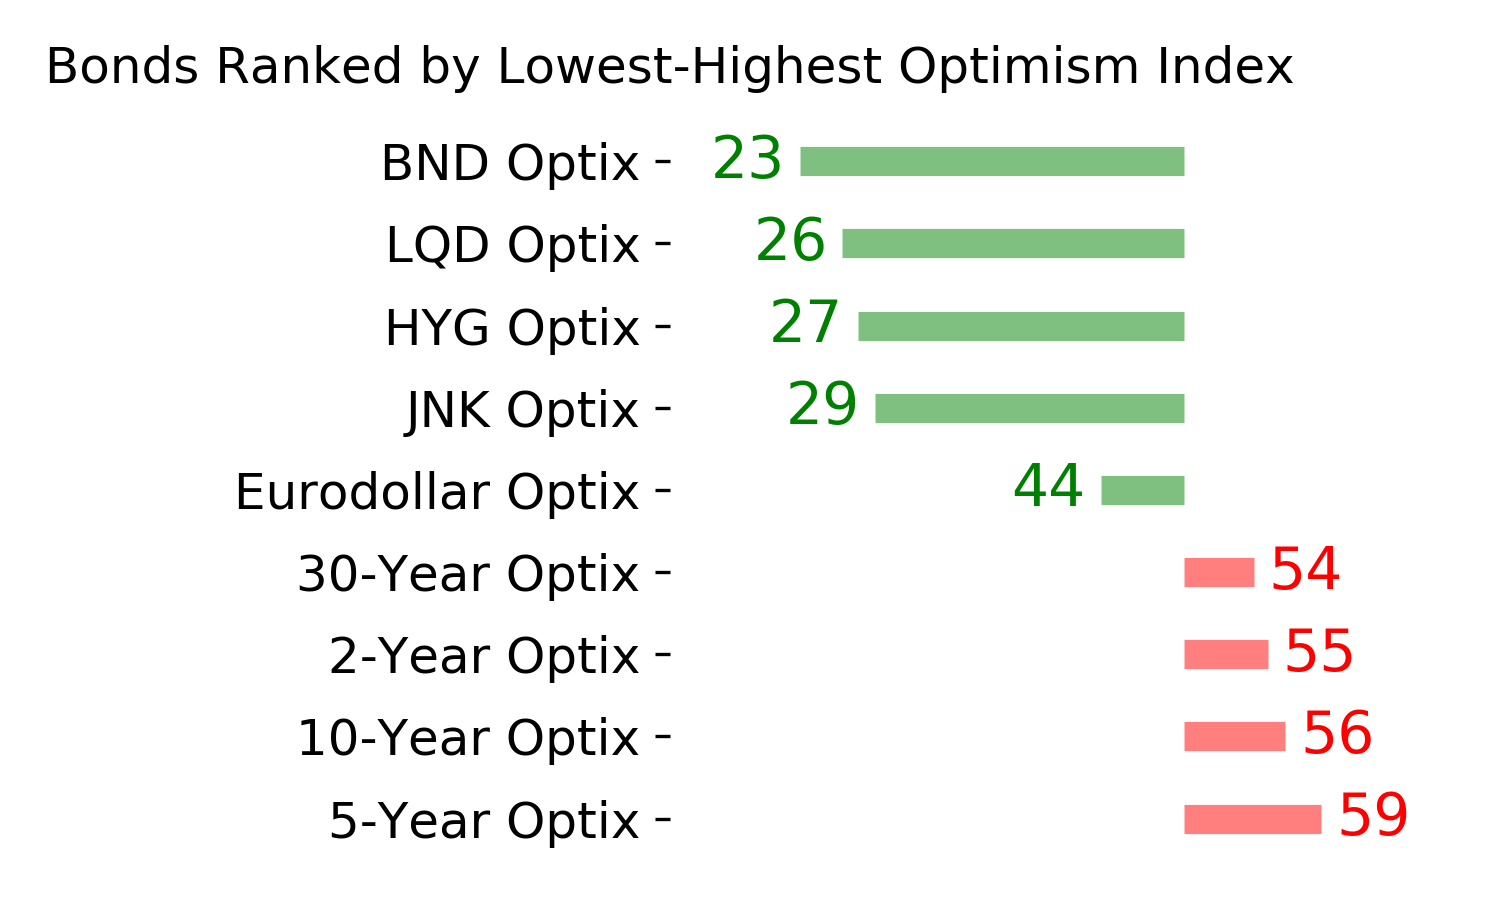
Various parts of the market got hit in March, with the lowest Bond Optimism Index we usually see during healthy environments. After a shaky couple of weeks, the broad bond market has modestly recovered. Not a big edge here either way. GOLD: Hold
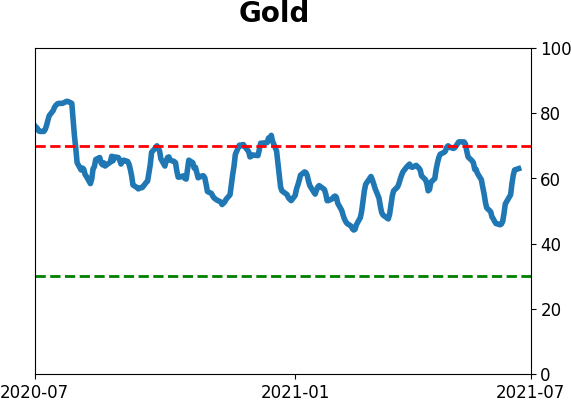
Gold and miners have done very well, recovering above long-term trend lines. The issue is that both have tended to perform poorly after similar situations - will have to wait and see how it plays out.
|
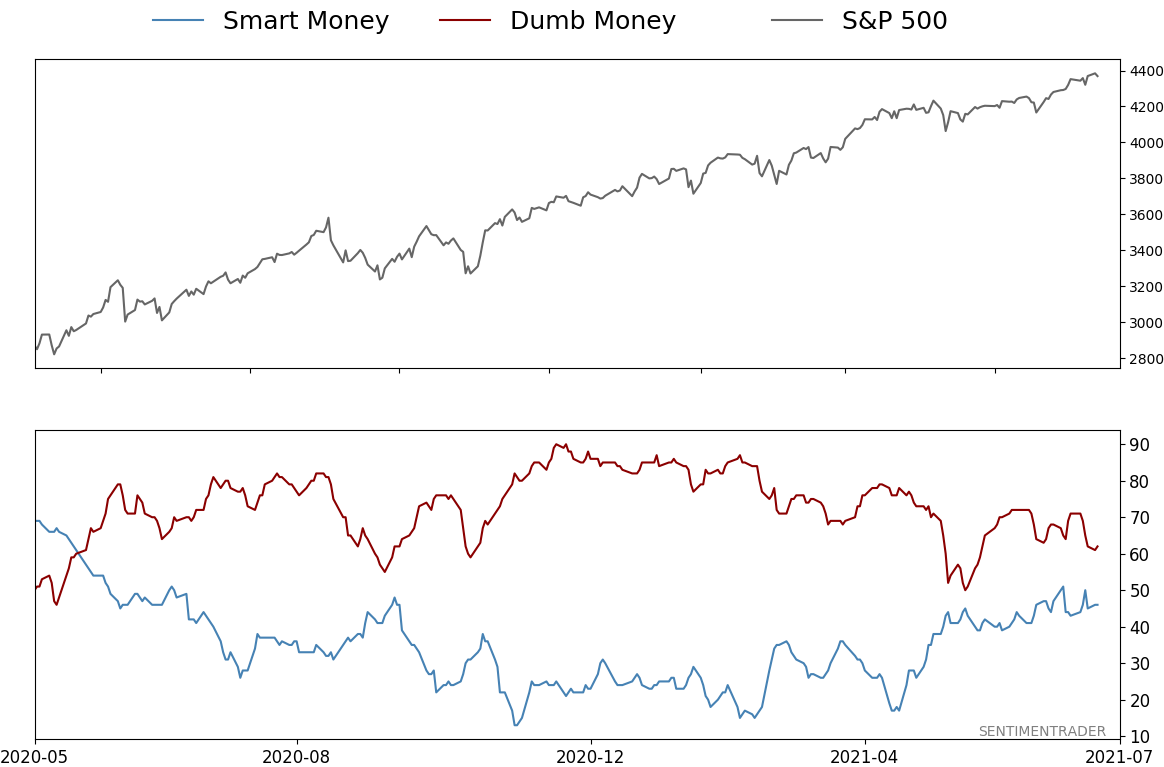
Smart / Dumb Money Confidence
|
Smart Money Confidence: 46%
Dumb Money Confidence: 62%
|
|
Risk Levels
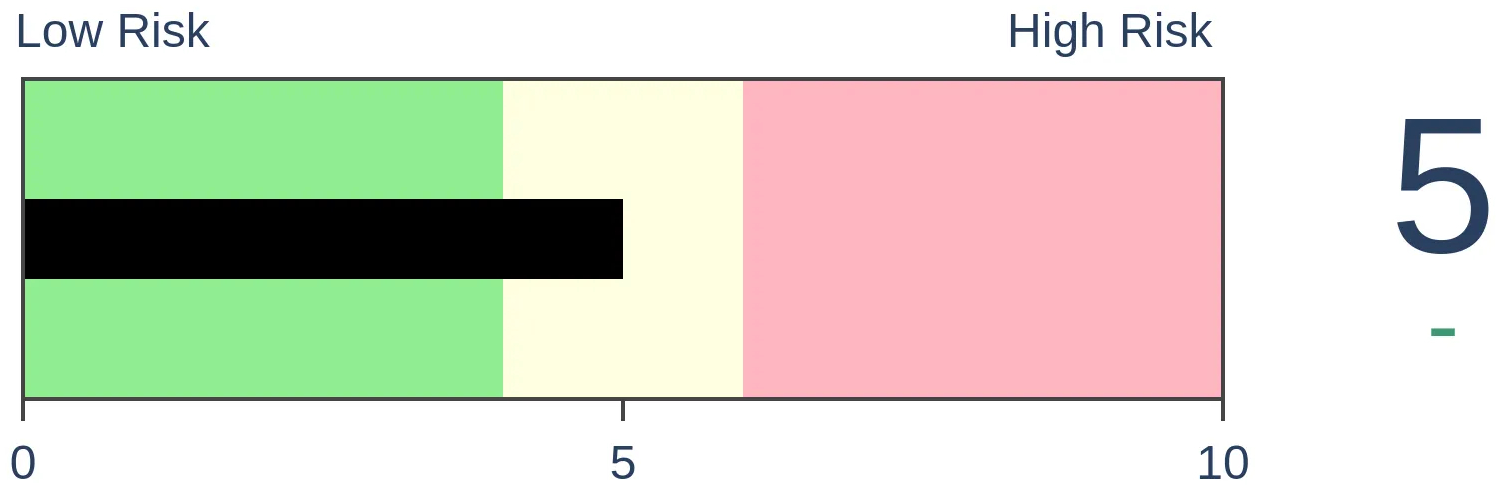
Stocks Short-Term
|
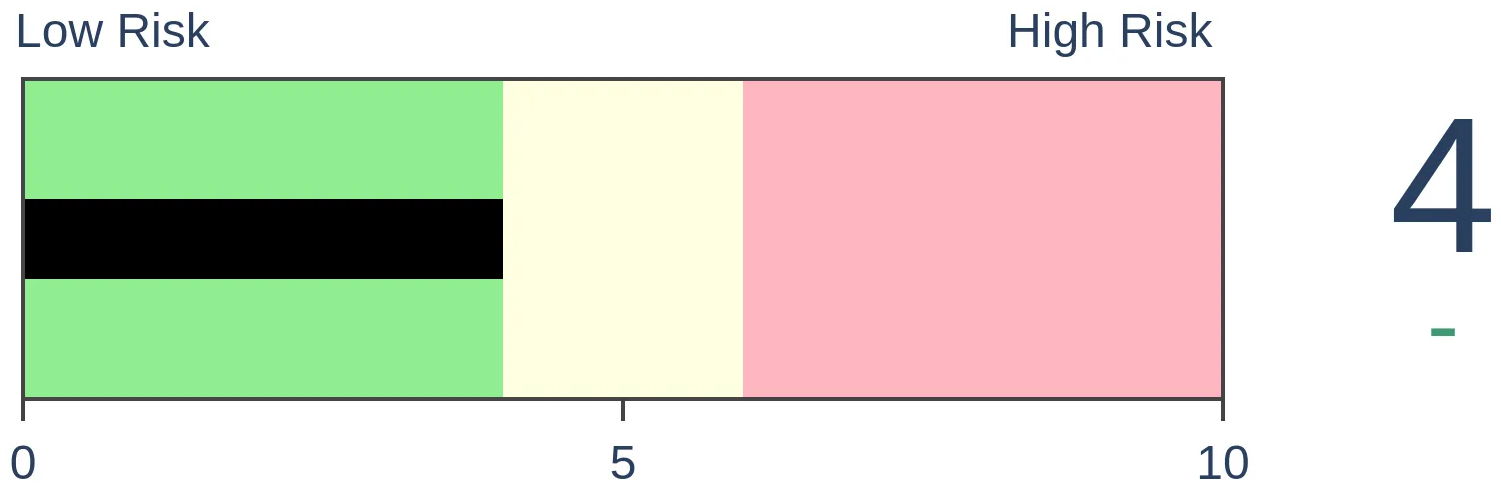
Stocks Medium-Term
|
|
Bonds
|
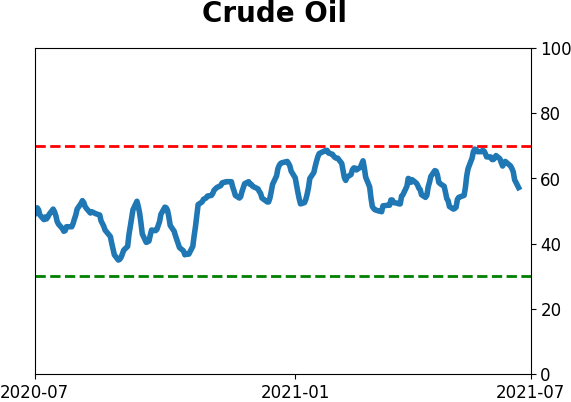
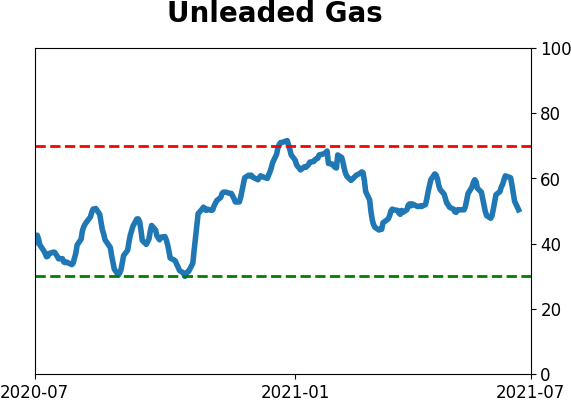
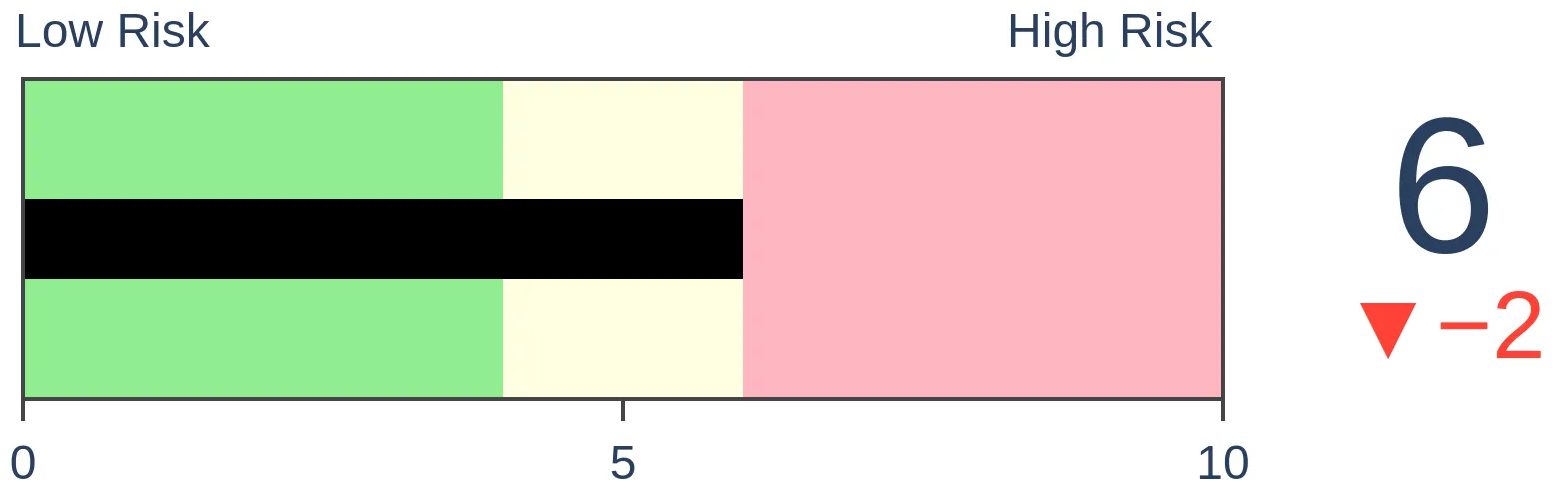
Crude Oil
|
|
Gold

|
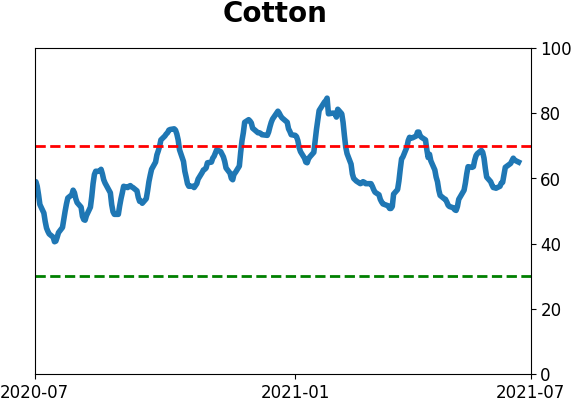
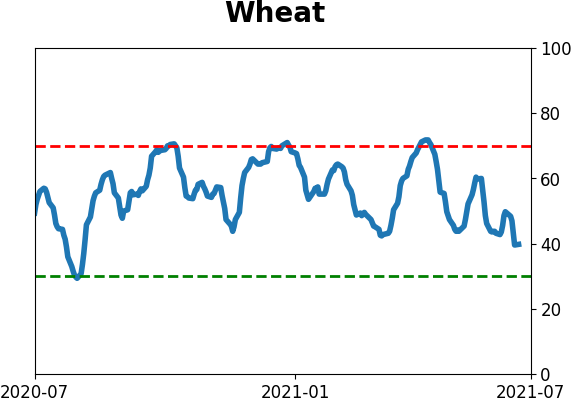
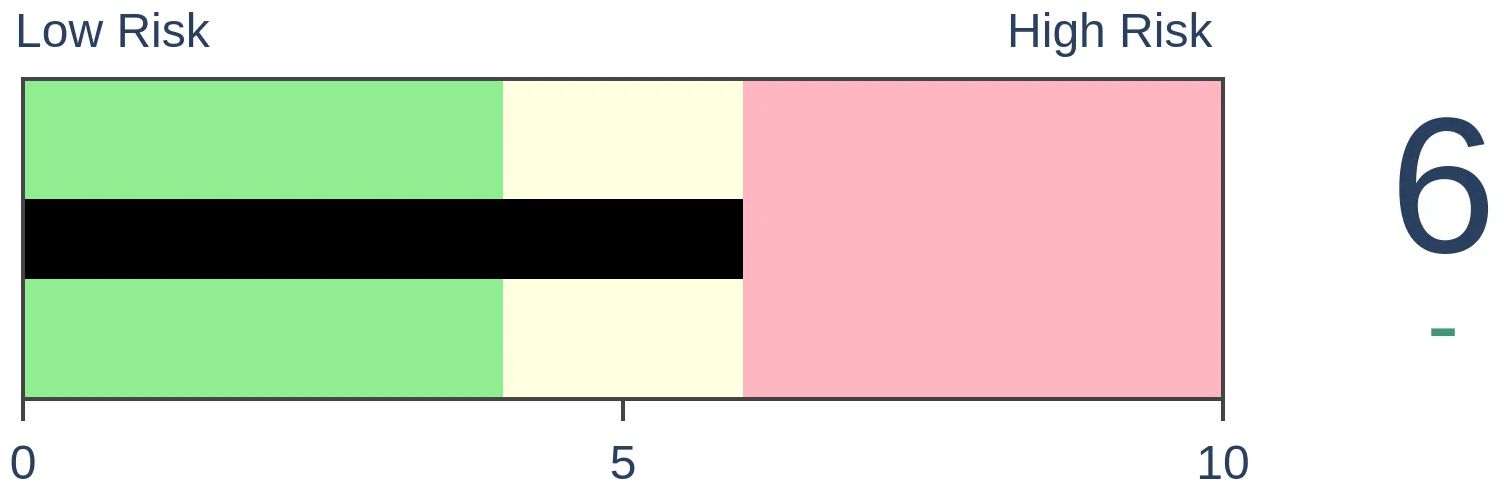
Agriculture

|
|
Research
BOTTOM LINE
The S&P 500 has now doubled from its pandemic low in the 2nd-fastest doubling in the index's history. It has also enjoyed a historic cluster of days hitting record highs. And yet, fewer than 60% of its stocks have yet managed to even climb above their 50-day moving averages.
FORECAST / TIMEFRAME
SPY -- Down, Medium-Term
|
It seems like it's taken forever, but in reality, it was almost no time at all.
The most-benchmarked index in the world has now doubled from its pandemic low. After falling to 2,191 on March 23 of last year, the S&P 500 closed at 4,384 on Monday. This marks the third time that the index has doubled from a multi-year low over the past two decades.
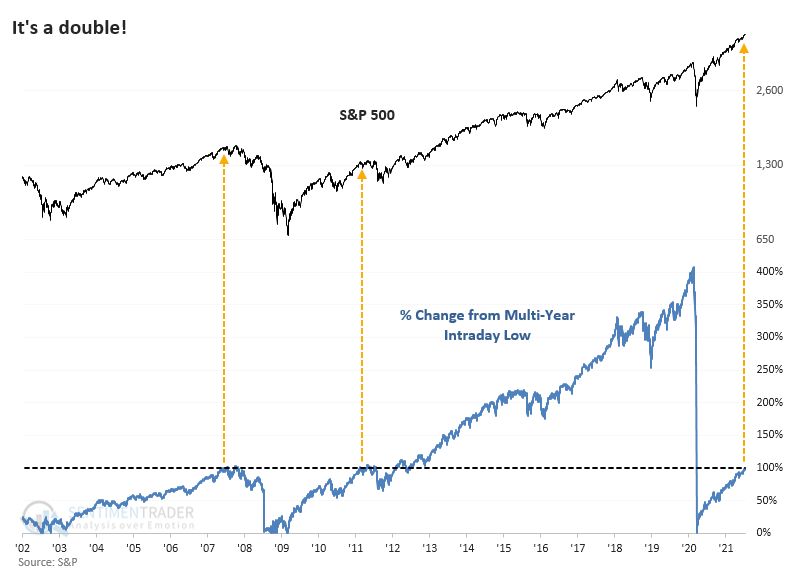
For what it's worth (maybe not much), the other two times the S&P reached its doubling point preceded a correction and a bear market. Going back to 1928, this is the 2nd-fastest doubling off of a multi-year low, eclipsed only by a breathtaking rally in 1932. These are the only two times it managed to double in under 400 trading sessions.
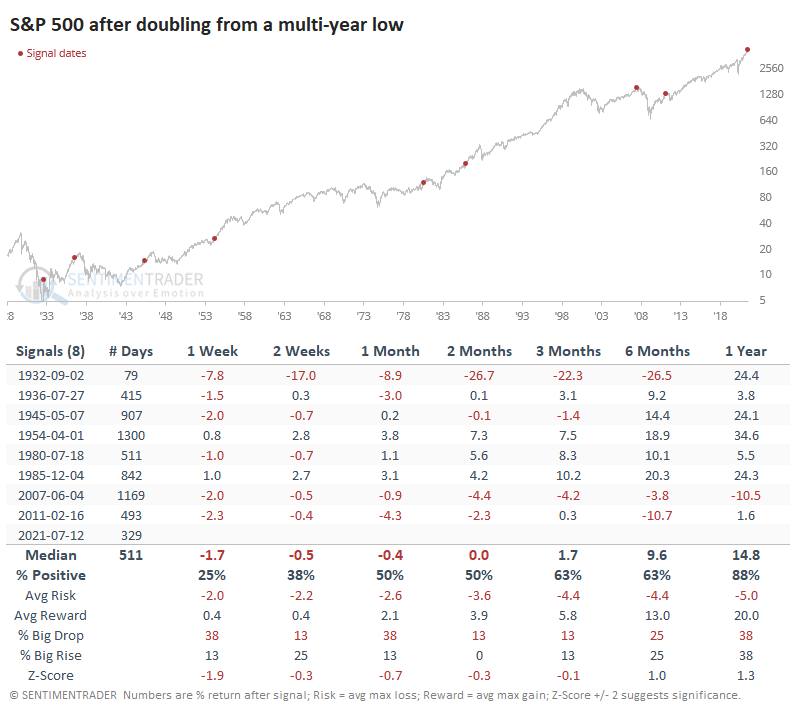
It's doubtful whether investors pay much attention to this metric, so there's little reason why it should matter much to future returns. As we've seen time and again, however, trying to find a reason for moves is just an academic exercise, and often what seems to make sense doesn't work, anyway.
After the other doublings, the S&P continued to rally heartily in 1954 and 1985. The others either saw short- to medium-term pullbacks or had shorter-term gains erased as investors took a breather.
The double is due in part to a remarkable run over the past three weeks. The S&P closed at a record high on 10 out of the past 15 sessions for the first time in more than a year.
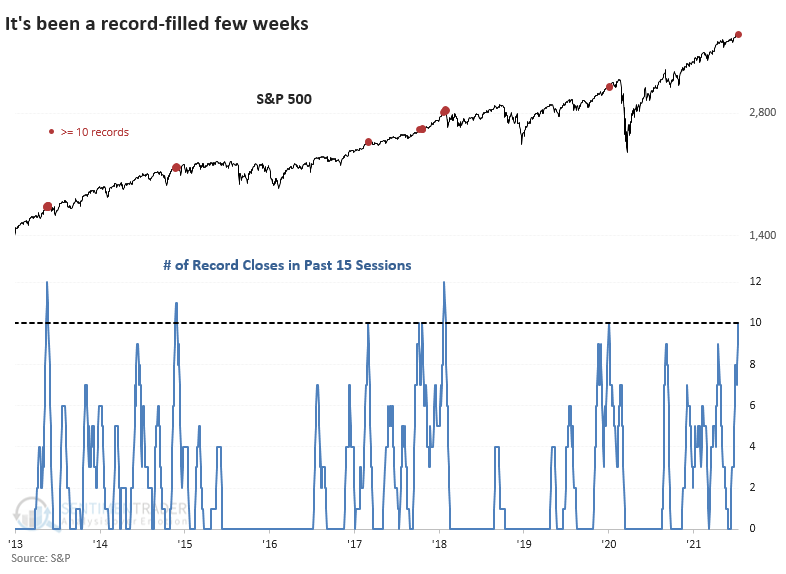
The other time the index enjoyed a run like this was just before the pandemic struck. Even without that outlier, the S&P did have some trouble holding onto its momentum over the medium-term.
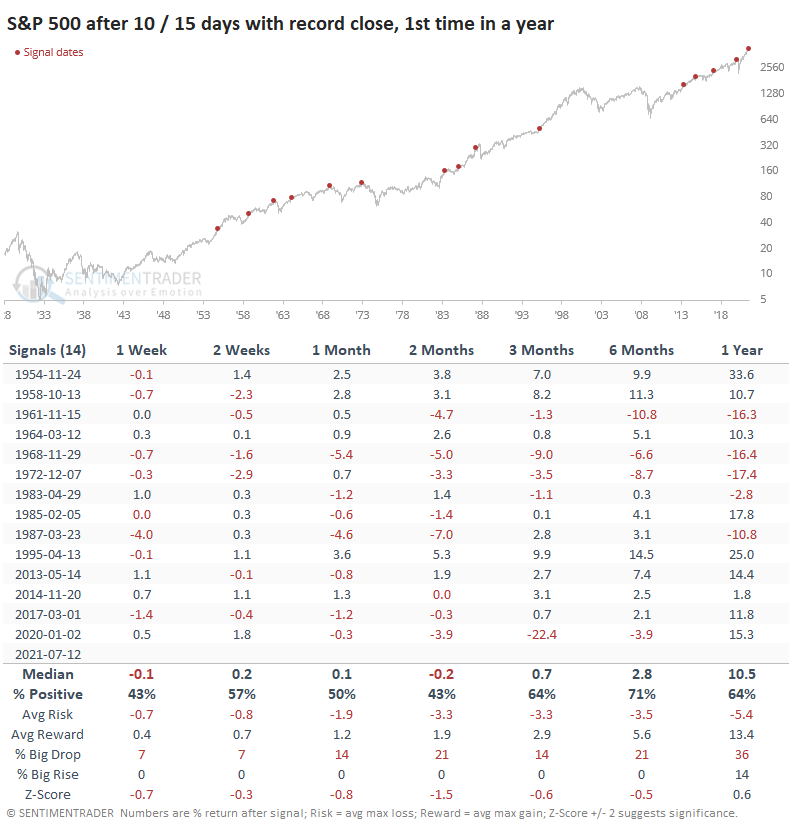
In the 1950's, both signals preceded strong gains. Since then, the only time the S&P managed to rally strongly over the next couple of months was in 1995. All of the others saw either a decline or weak gain.
The great run in the index is still hiding some issues under the surface, as there's the issue with relatively few stocks managing to climb above their 50-day moving averages. It hasn't been able to jump above 60% for weeks. We've been highlighting this since late June, and clearly, it hasn't mattered yet.
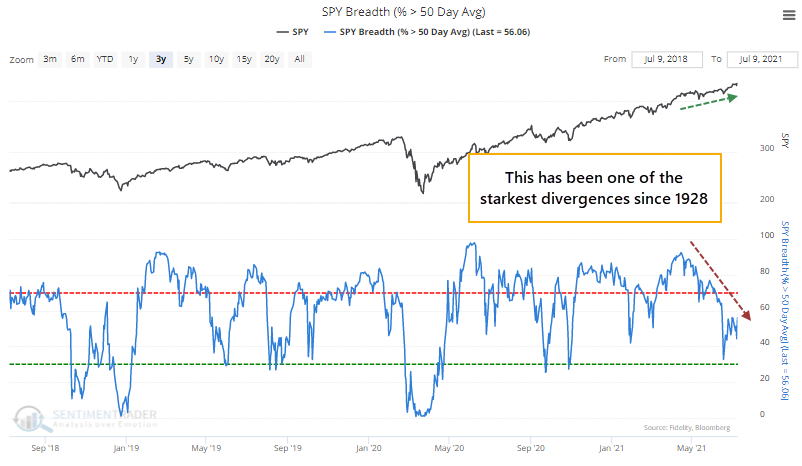
These kinds of clusters are very rare. The last time the S&P saw a flurry of new highs with fewer than 60% of issues above their 50-day averages was in 1999. Even going back to 1928, this is an extreme outlier.
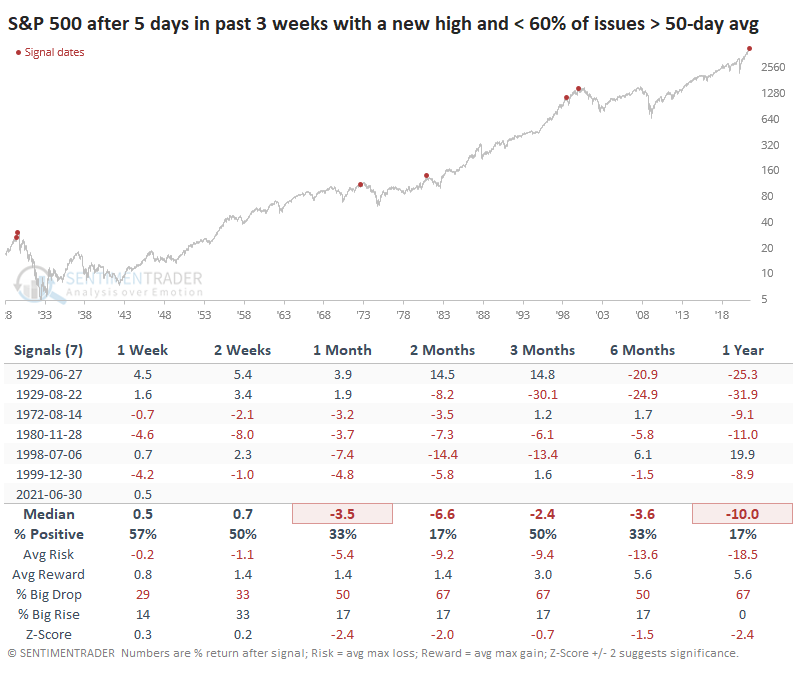
Stocks have been generating "extremely rare events" for months now, and still the indexes are sitting at or near new highs, so the oddities haven't mattered one whit. If the doubling of the S&P and excitement over good corporate earnings bring in even more buying pressure - an entirely plausible scenario during a momentum-driven market - then issues like this will continue to fail.
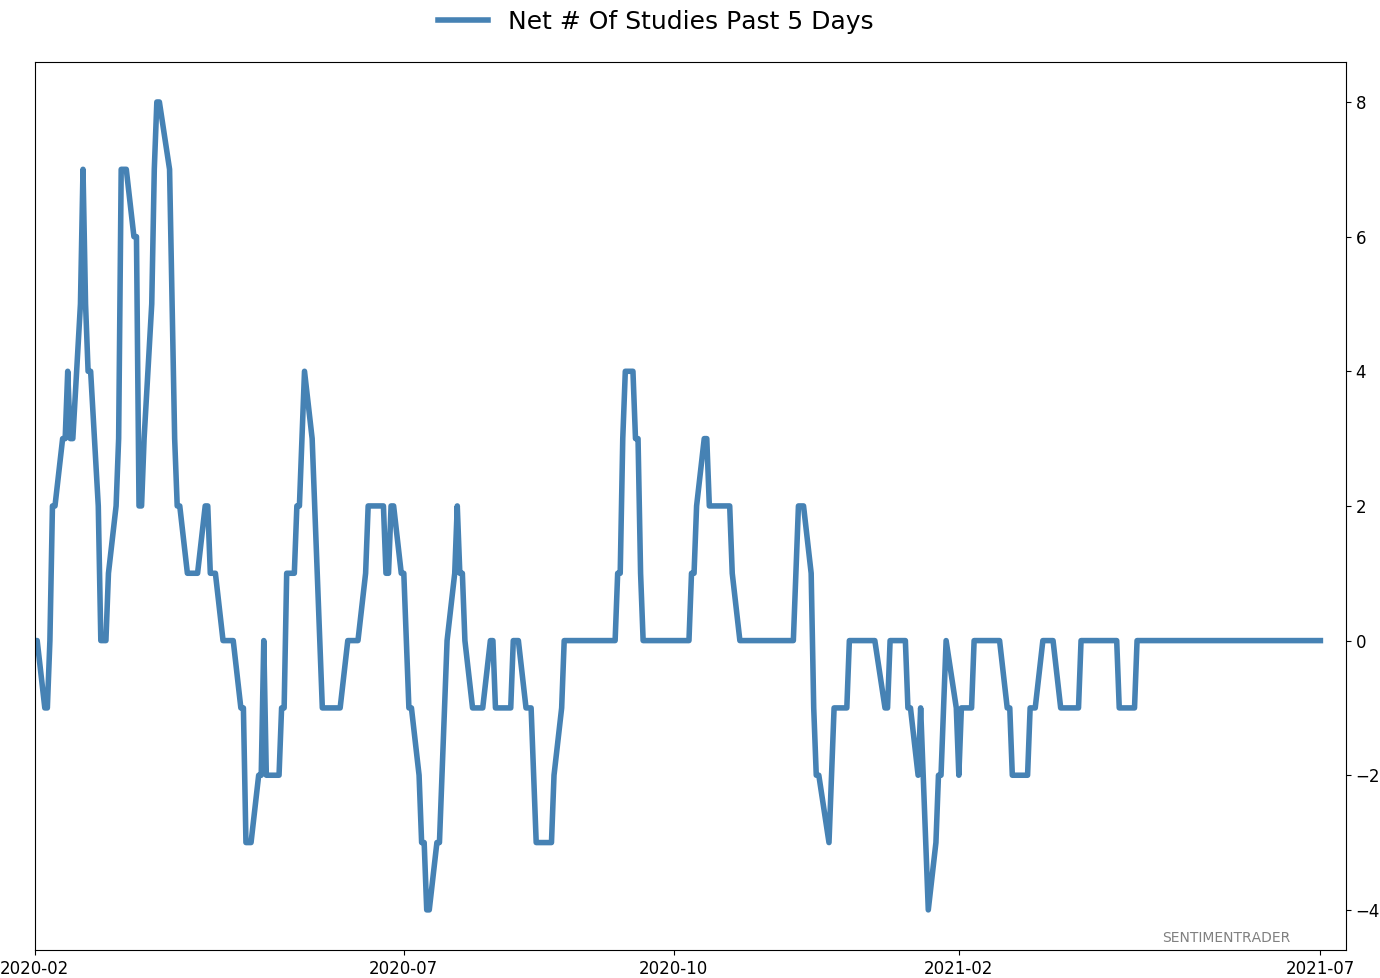
Active Studies
| Time Frame | Bullish | Bearish | | Short-Term | 0 | 1 | | Medium-Term | 2 | 3 | | Long-Term | 9 | 5 |
|
Indicators at Extremes
Portfolio
| Position | Description | Weight % | Added / Reduced | Date | | Stocks | RSP | 4.1 | Added 4.1% | 2021-05-19 | | Bonds | 23.9% BND, 6.9% SCHP | 30.7 | Reduced 7.1% | 2021-05-19 | | Commodities | GCC | 2.6 | Reduced 2.1%
| 2020-09-04 | | Precious Metals | GDX | 5.6 | Reduced 4.2% | 2021-05-19 | | Special Situations | 4.3% XLE, 2.2% PSCE | 7.6 | Reduced 5.6% | 2021-04-22 | | Cash | | 49.4 | | |
|
Updates (Changes made today are underlined)
Much of our momentum and trend work has remained positive for several months, with some scattered exceptions. Almost all sentiment-related work has shown a poor risk/reward ratio for stocks, especially as speculation drove to record highs in exuberance in February. Much of that has worn off, and most of our models are back toward neutral levels. There isn't much to be excited about here. The same goes for bonds and even gold. Gold has been performing well lately and is back above long-term trend lines. The issue is that it has a poor record of holding onto gains when attempting a long-term trend change like this, so we'll take a wait-and-see approach. RETURN YTD: 9.1% 2020: 8.1%, 2019: 12.6%, 2018: 0.6%, 2017: 3.8%, 2016: 17.1%, 2015: 9.2%, 2014: 14.5%, 2013: 2.2%, 2012: 10.8%, 2011: 16.5%, 2010: 15.3%, 2009: 23.9%, 2008: 16.2%, 2007: 7.8%
|
|
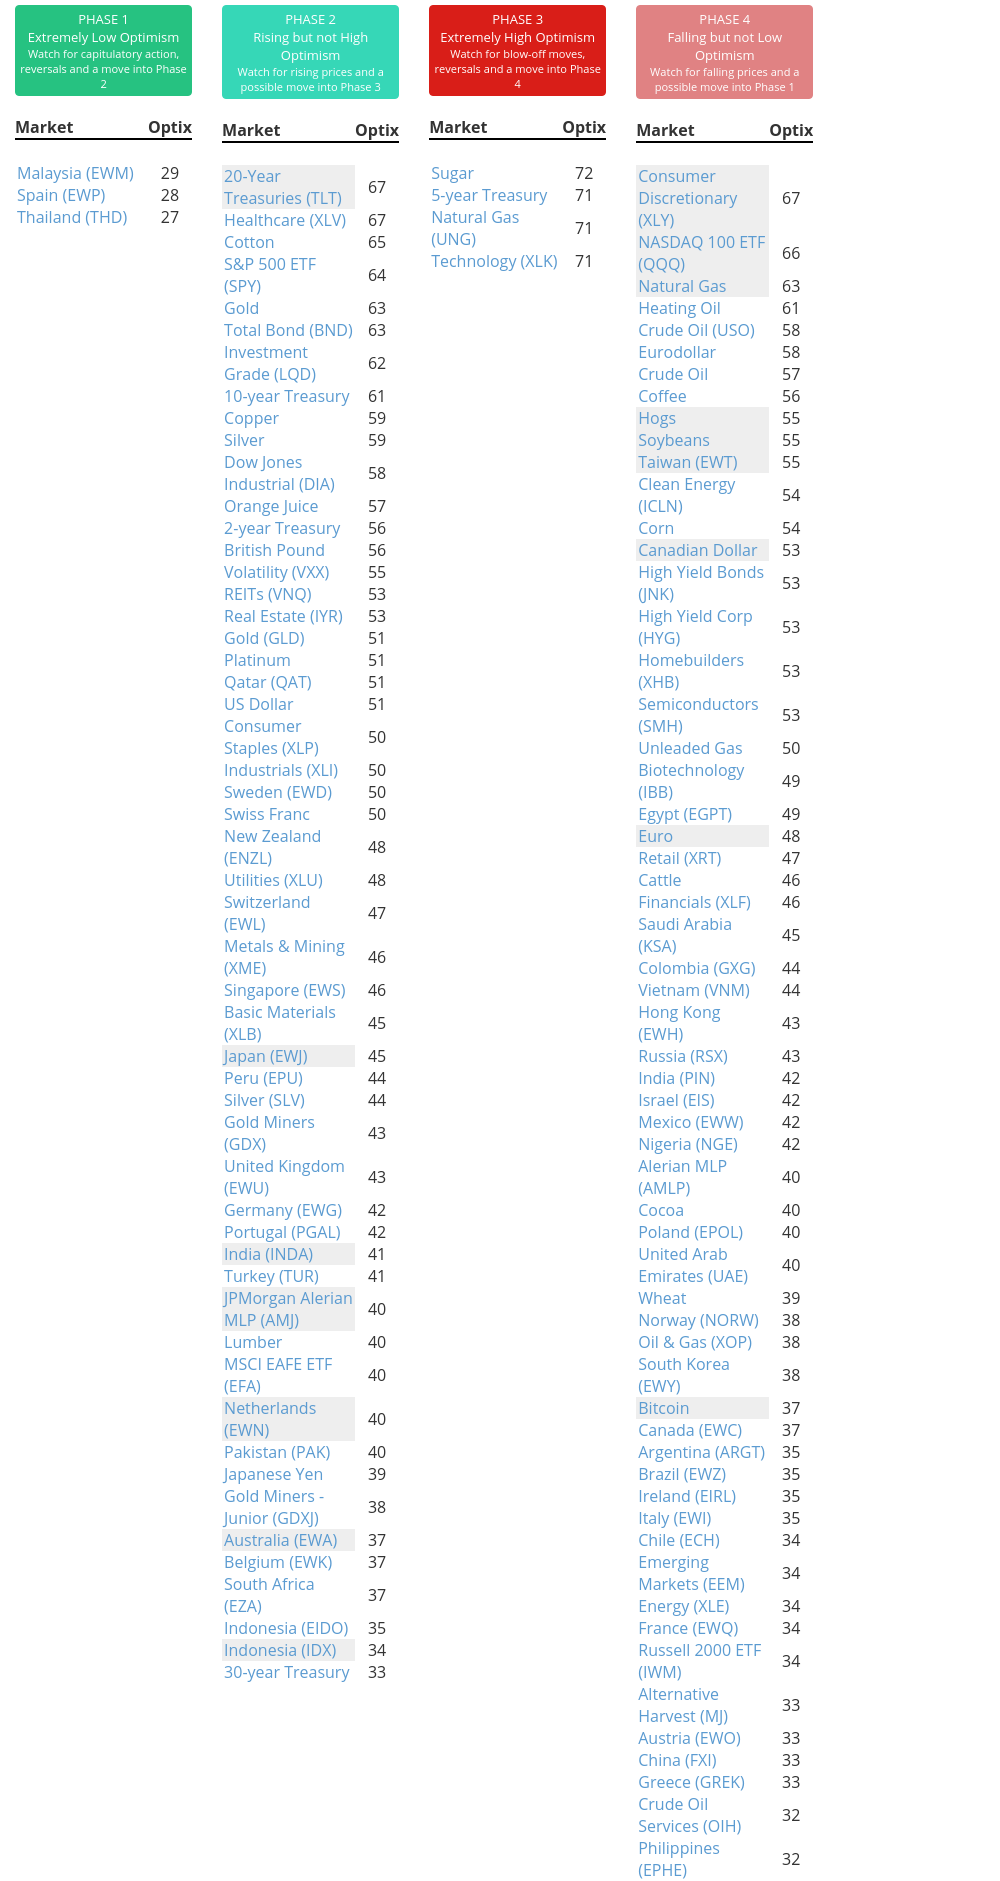
Phase Table
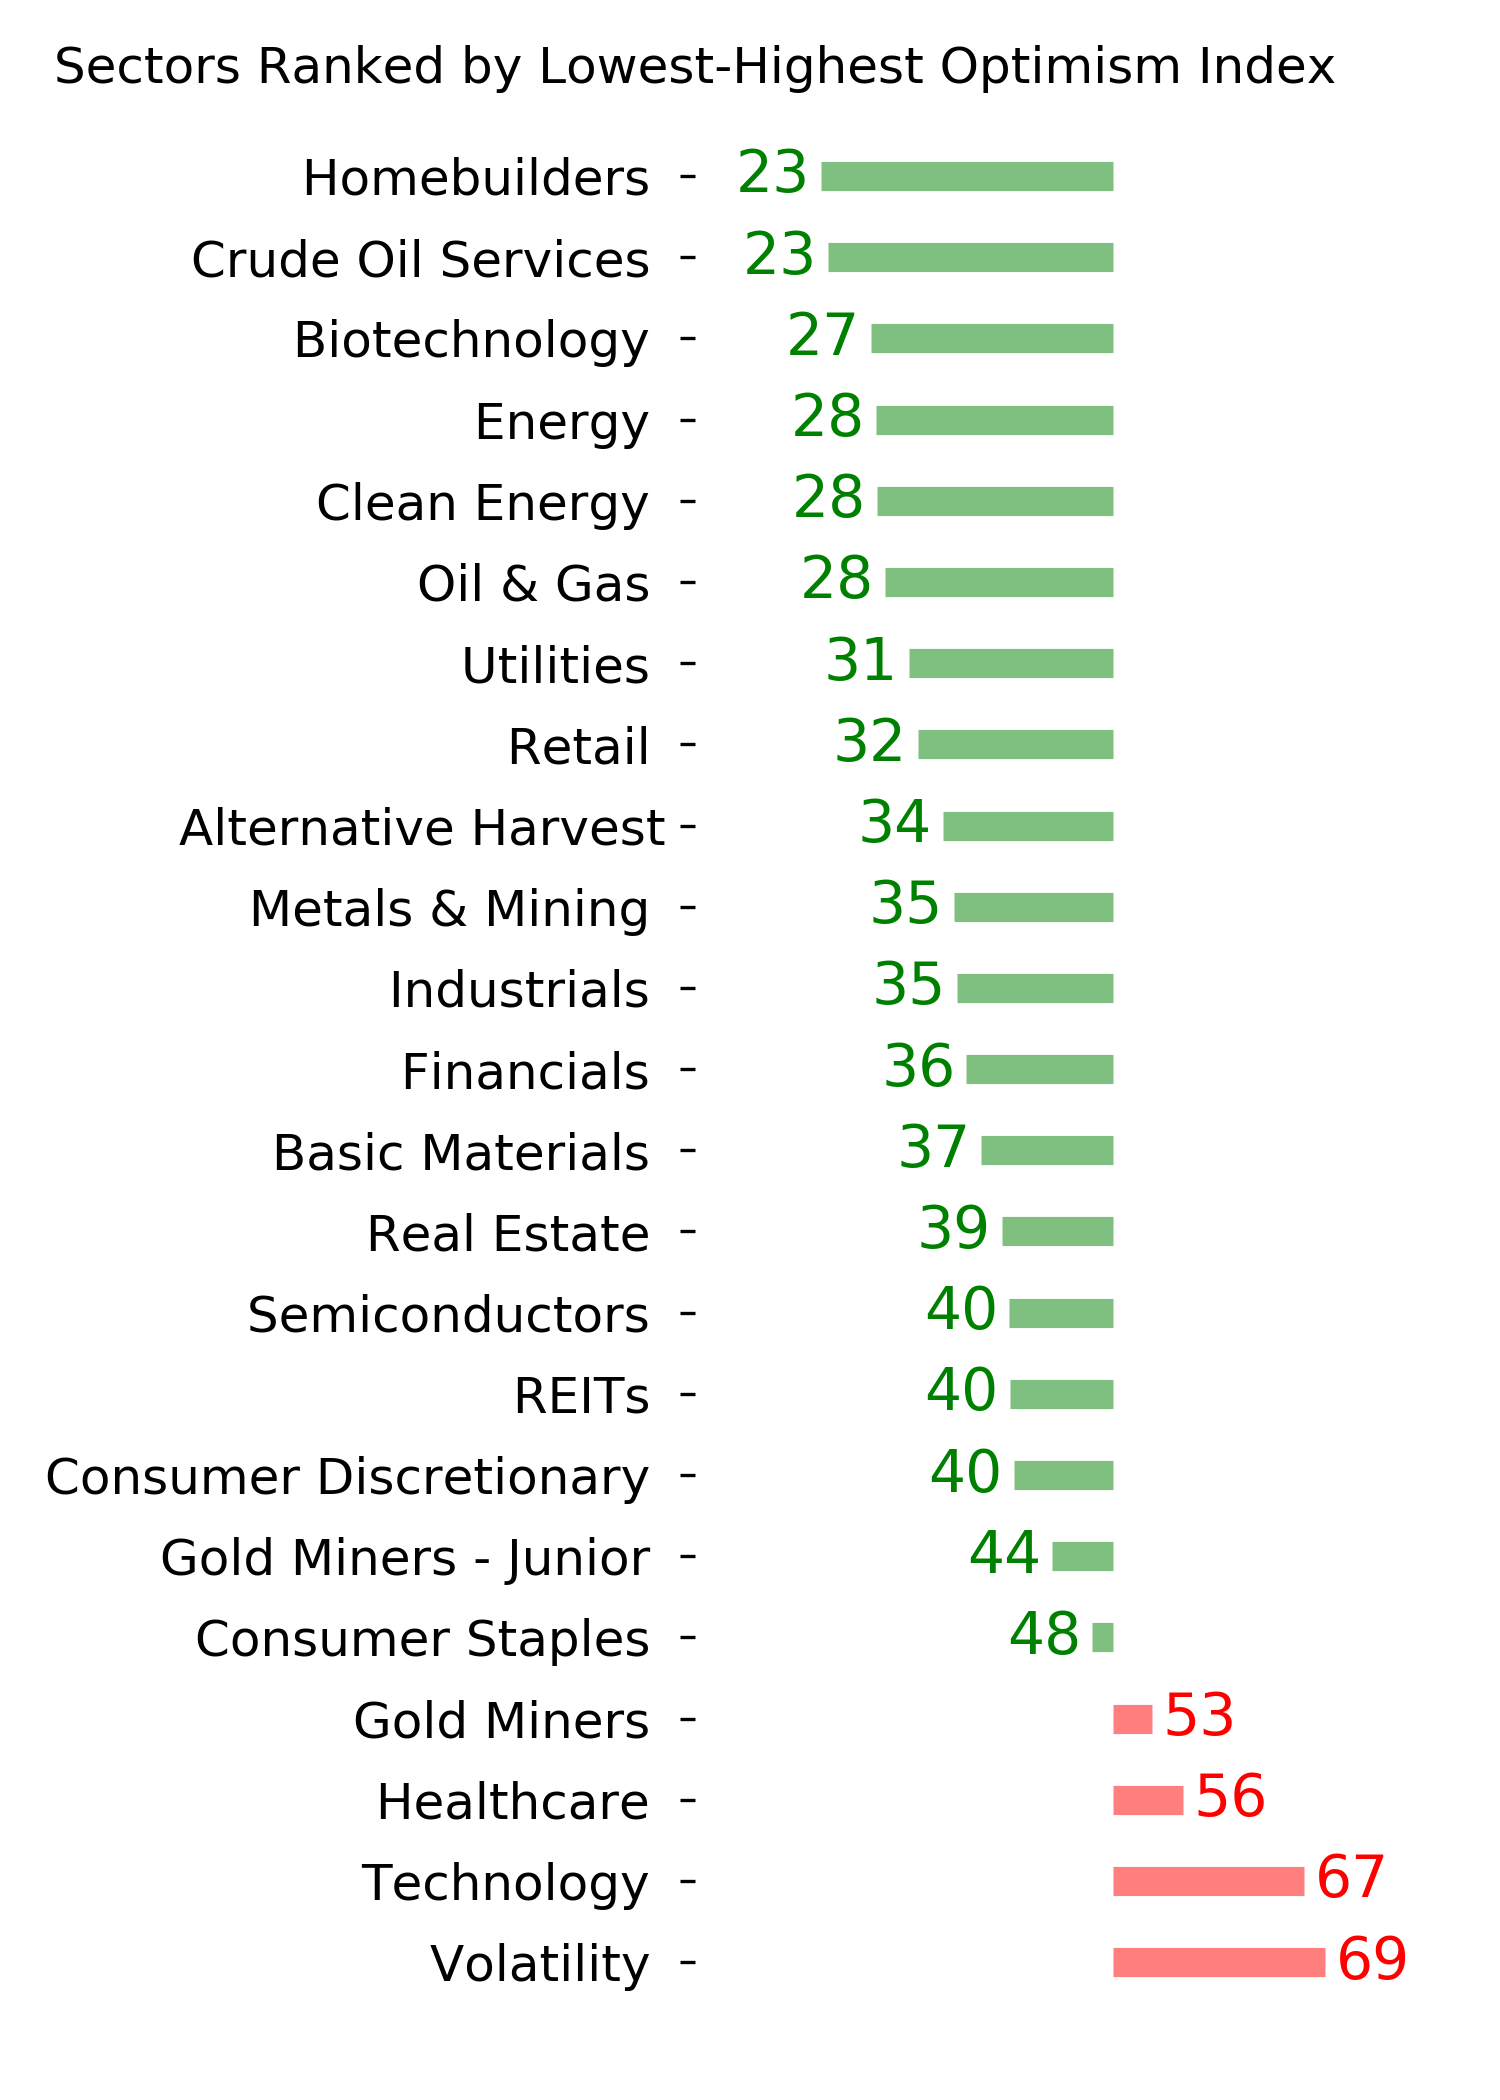
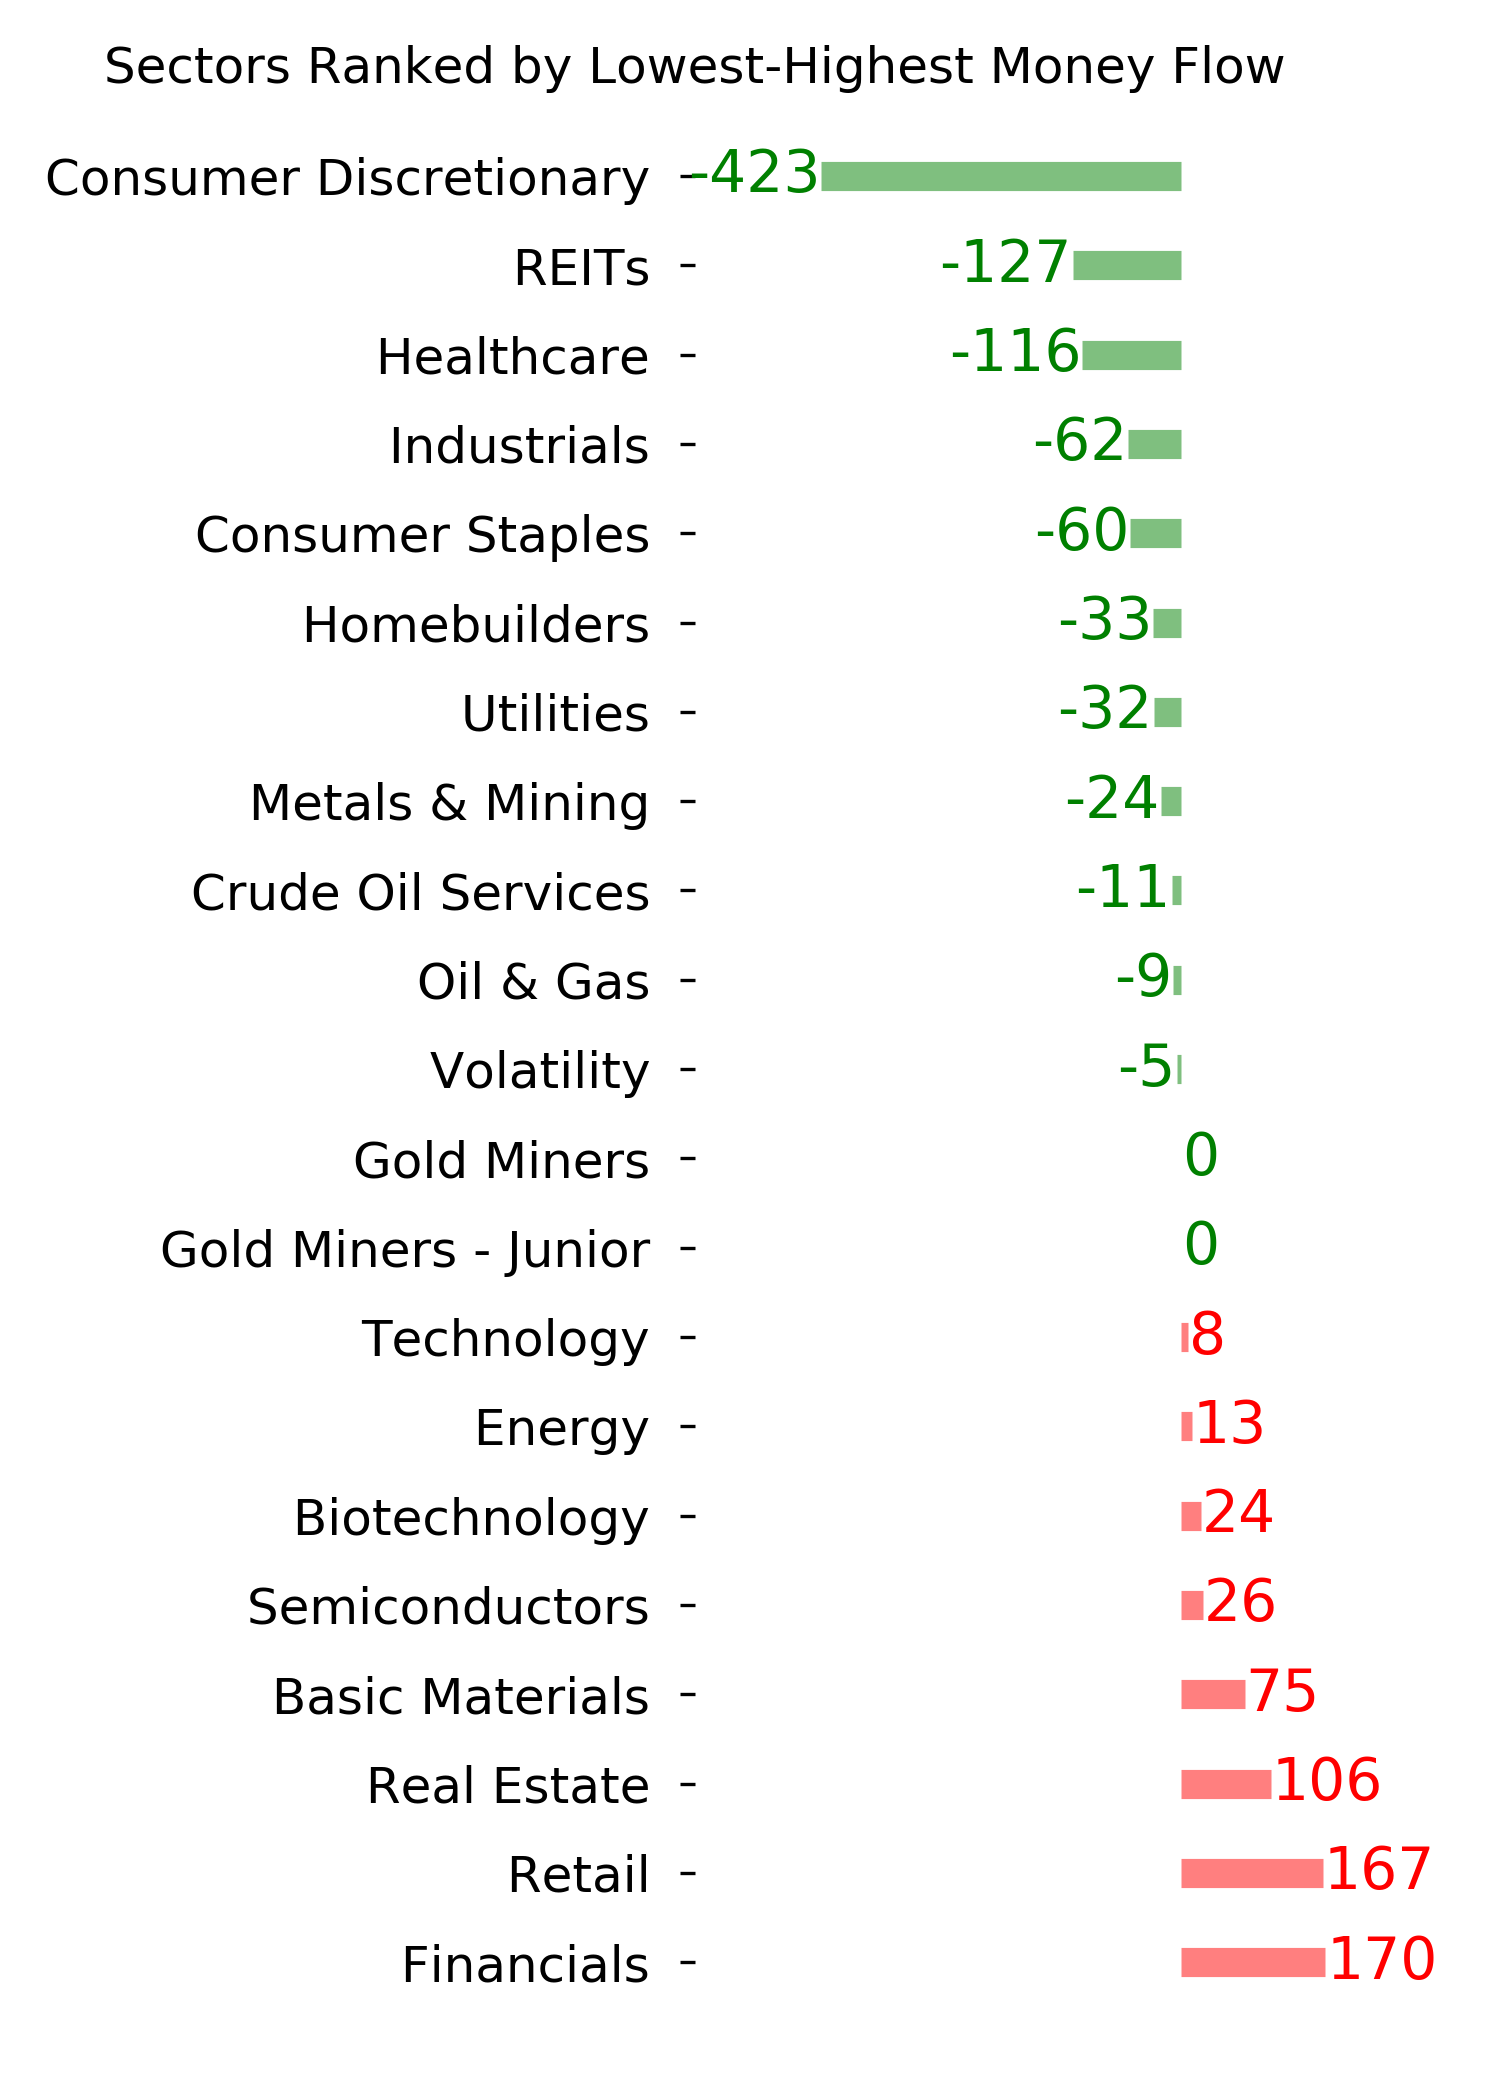
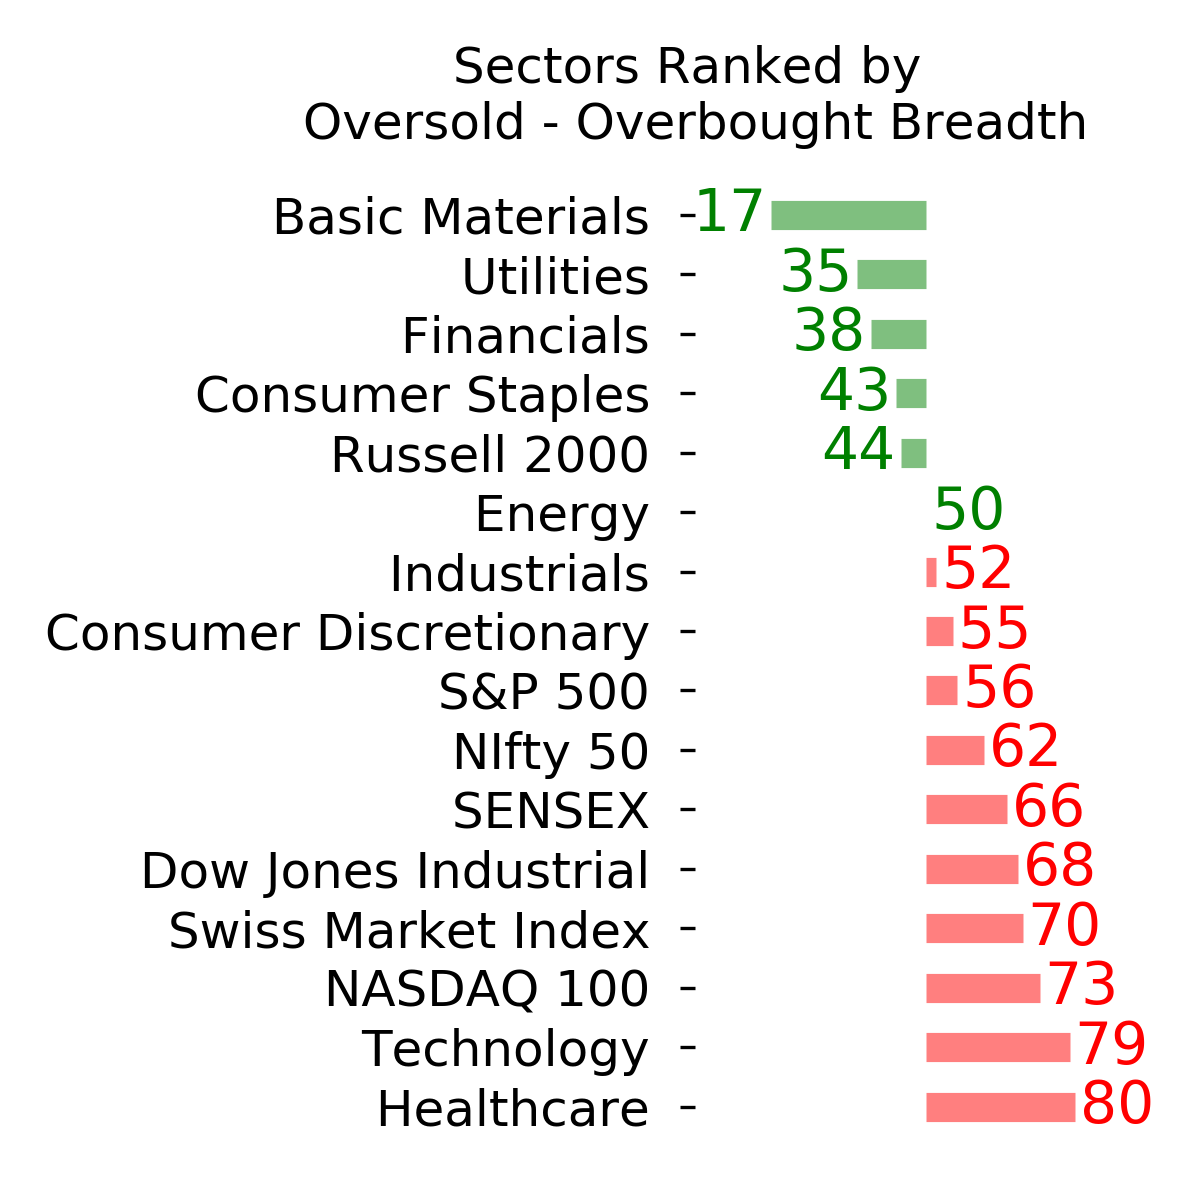
Ranks
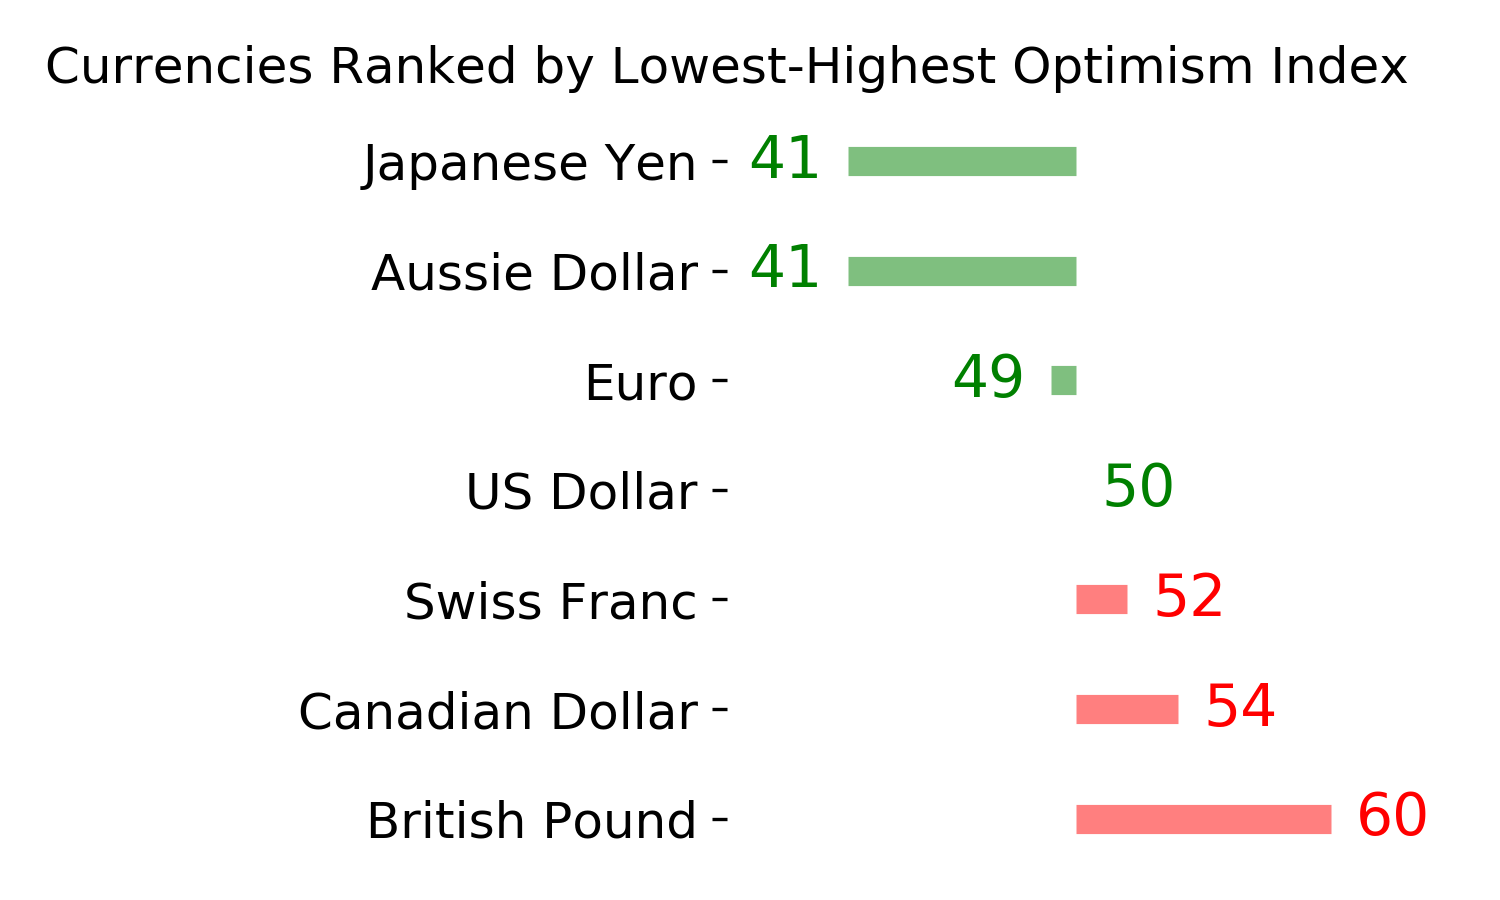
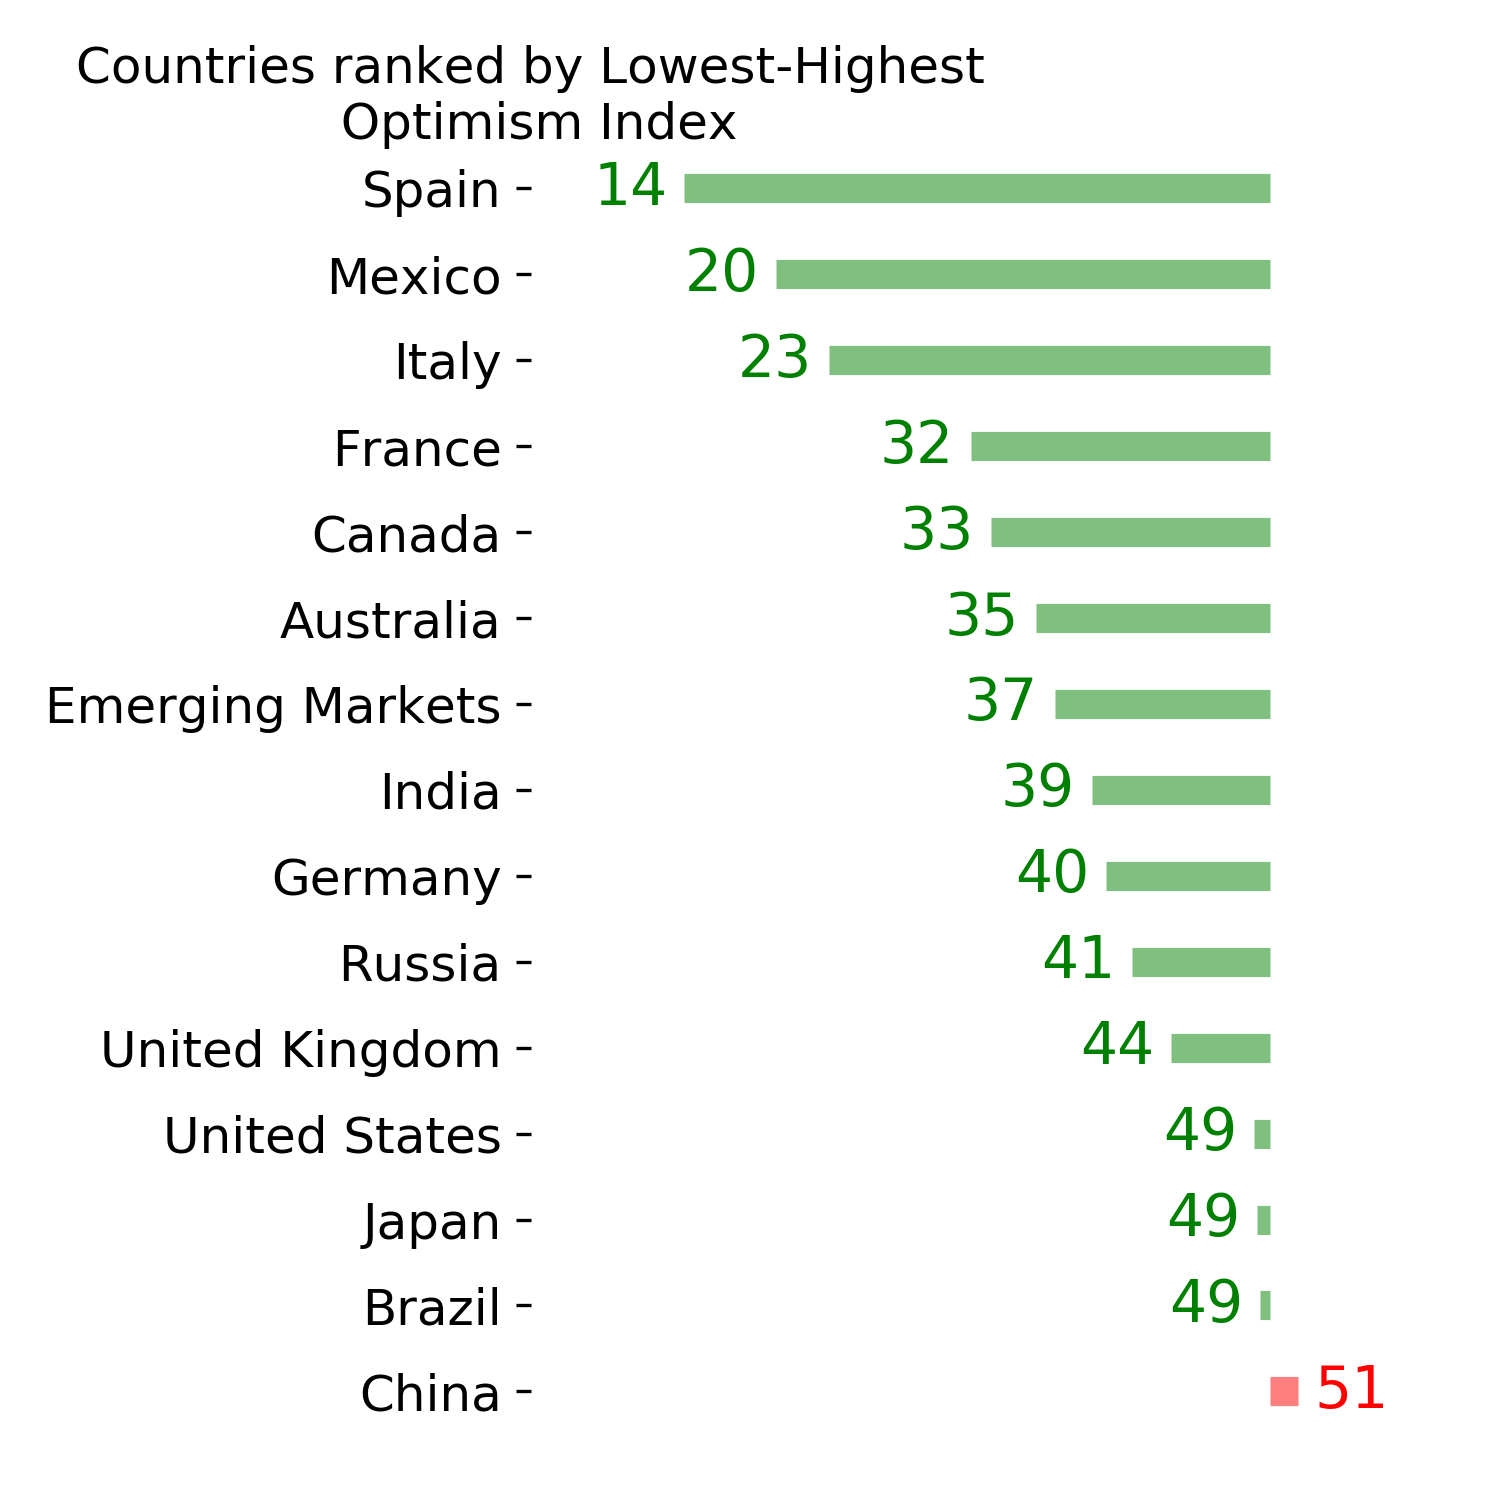
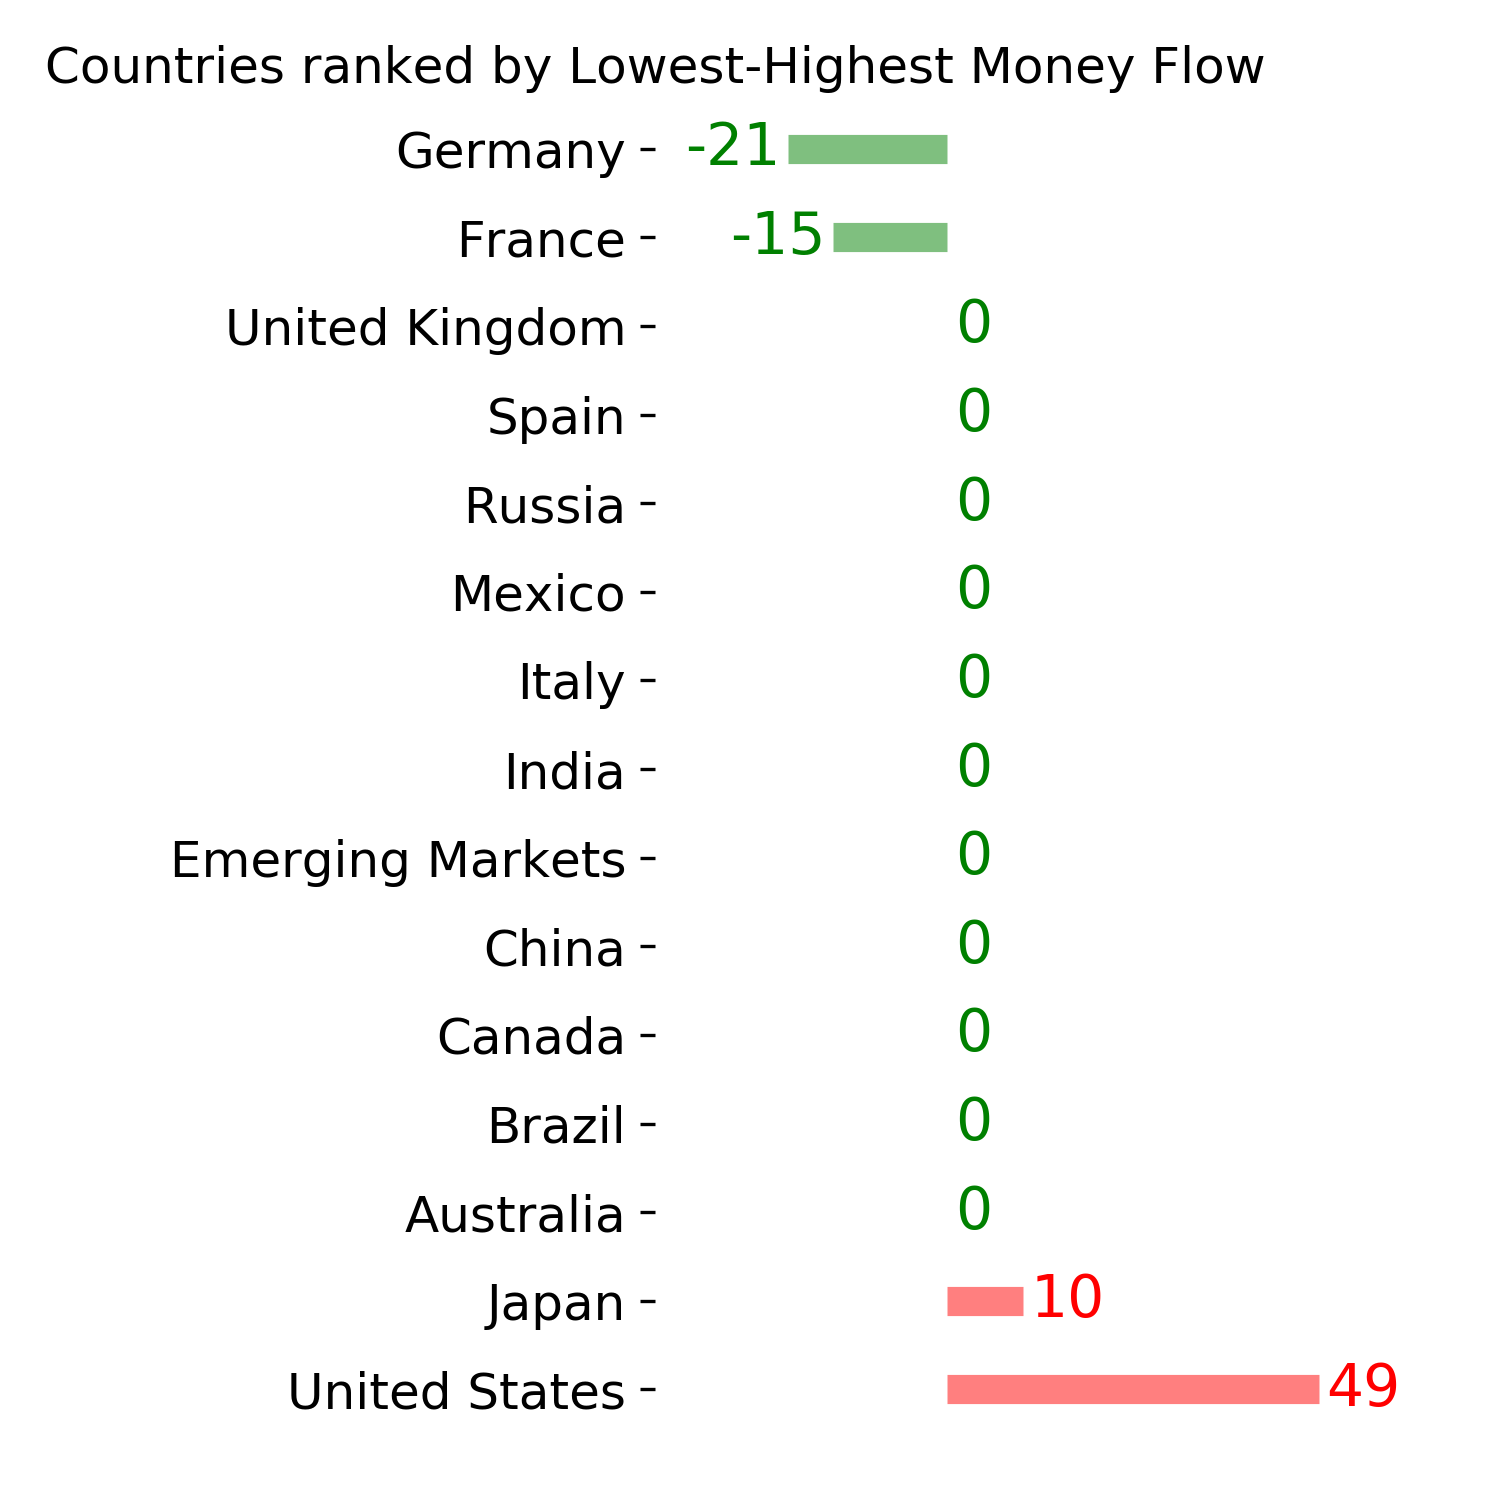
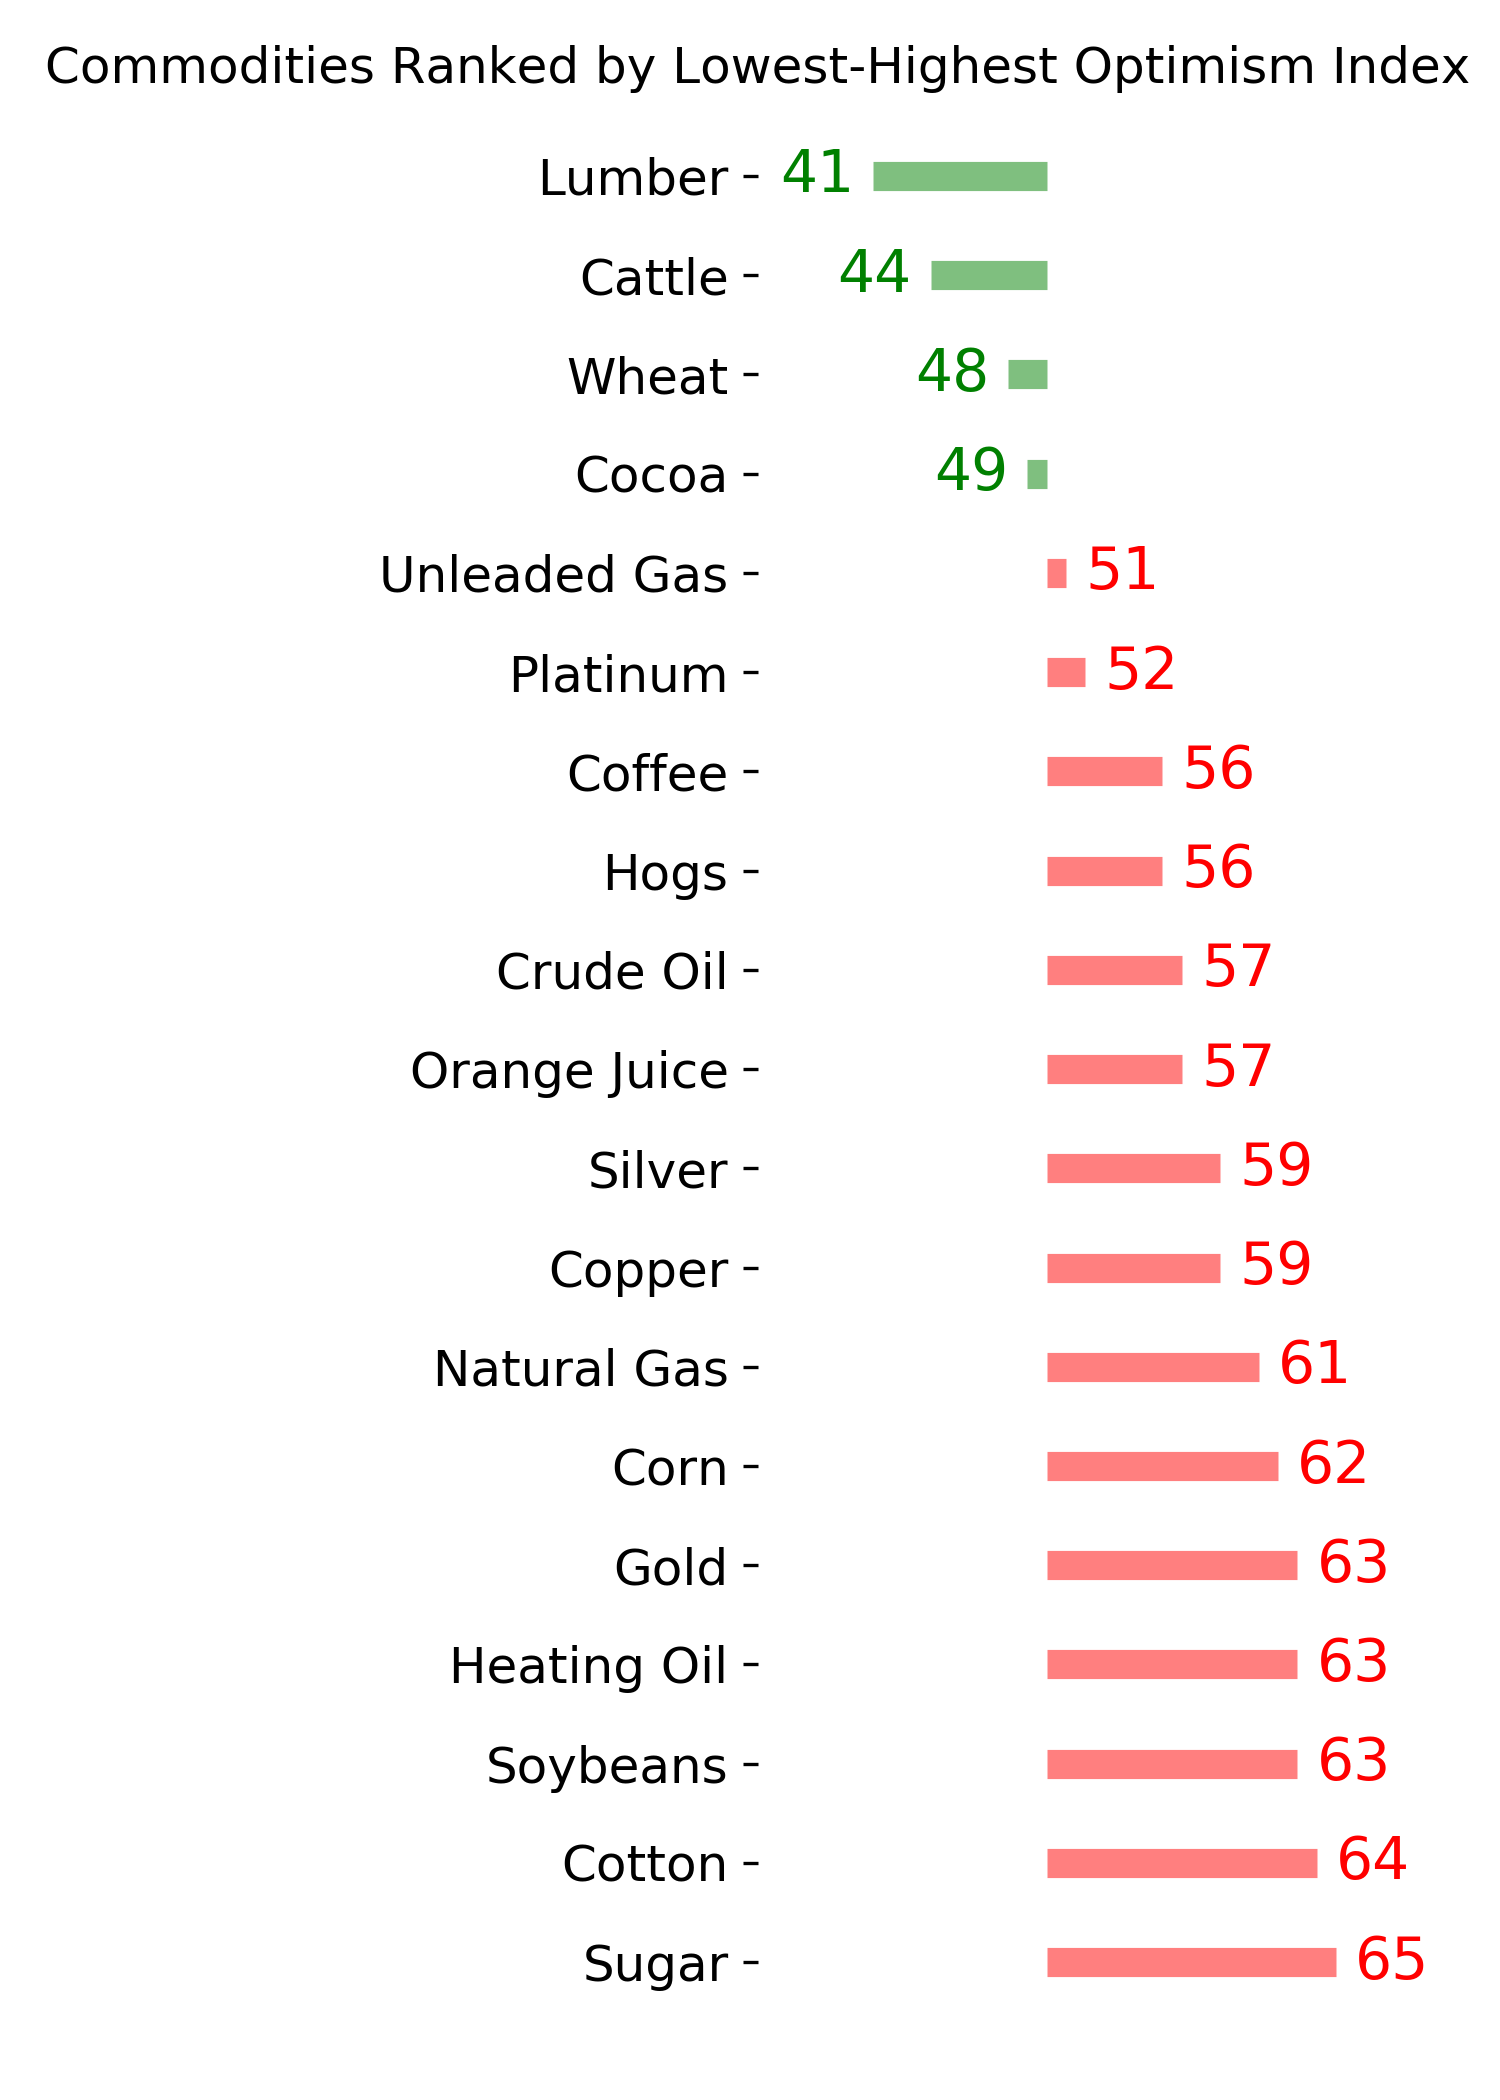
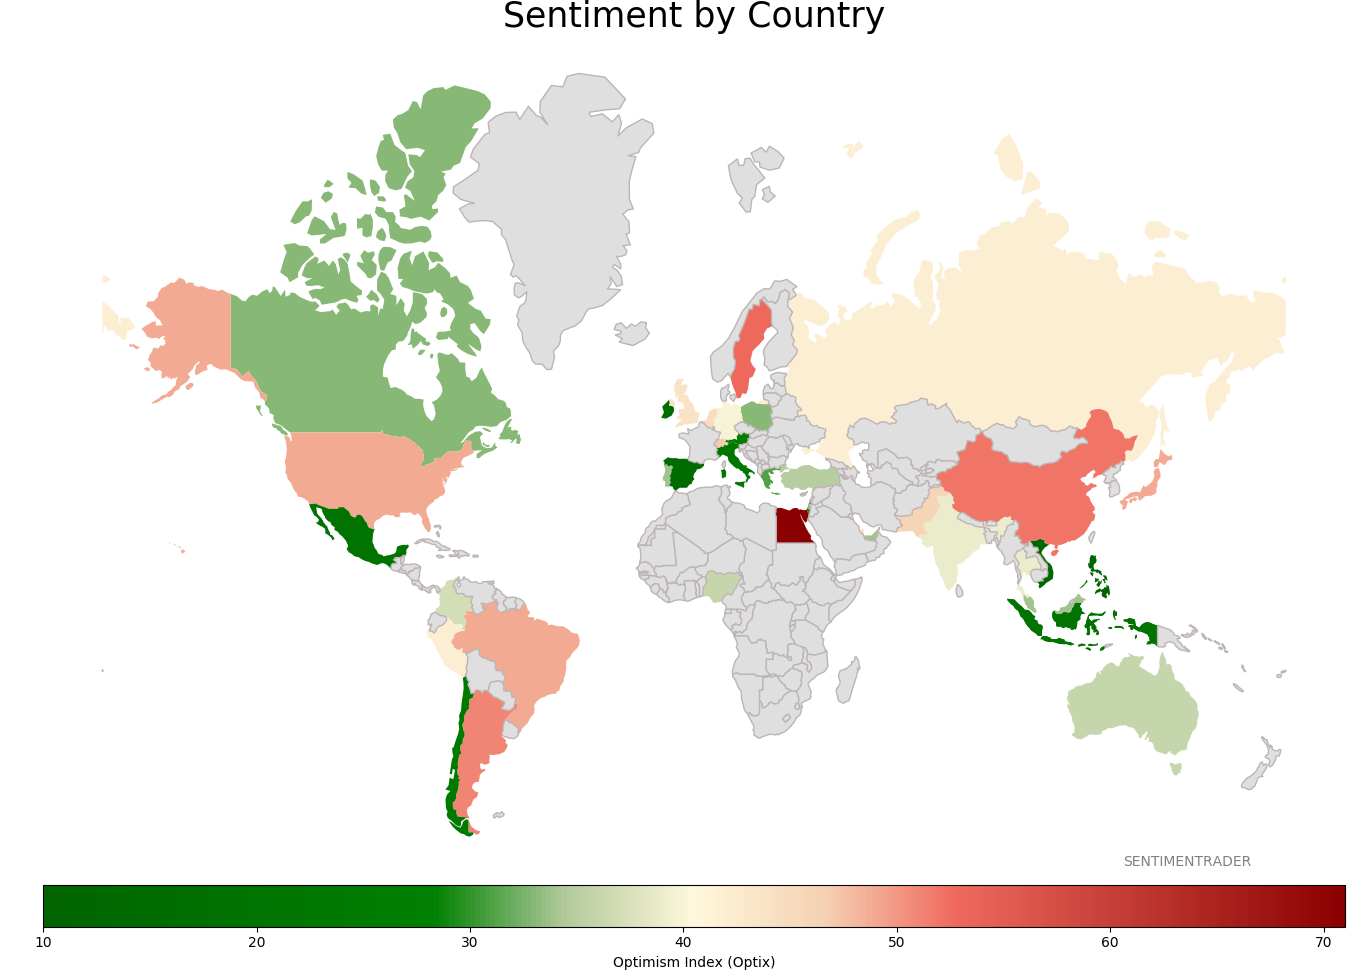
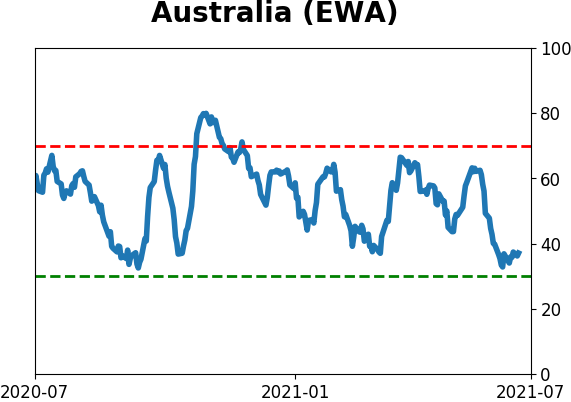
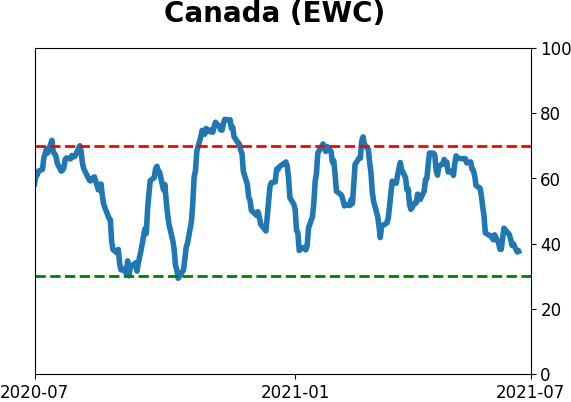
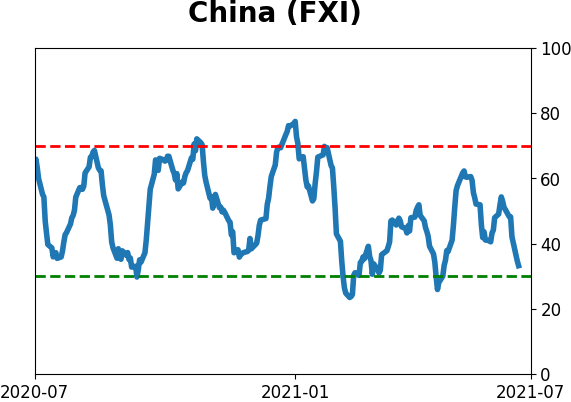
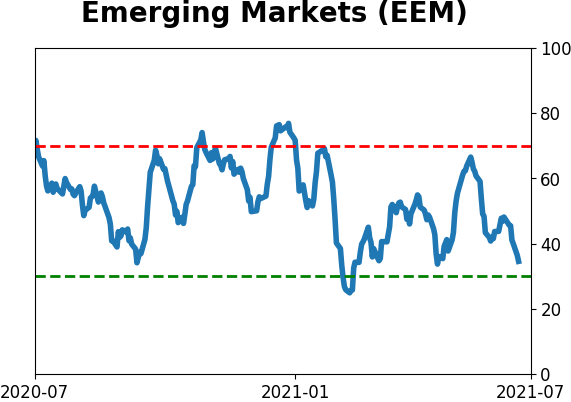
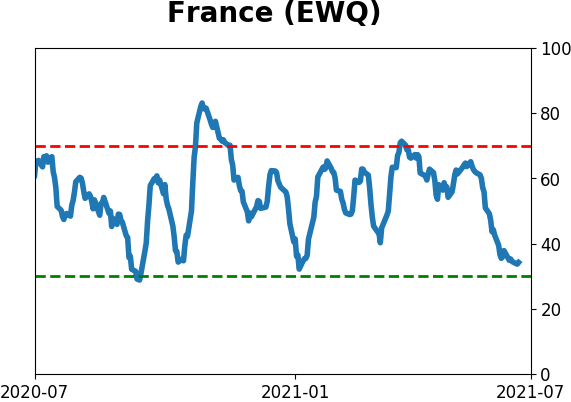
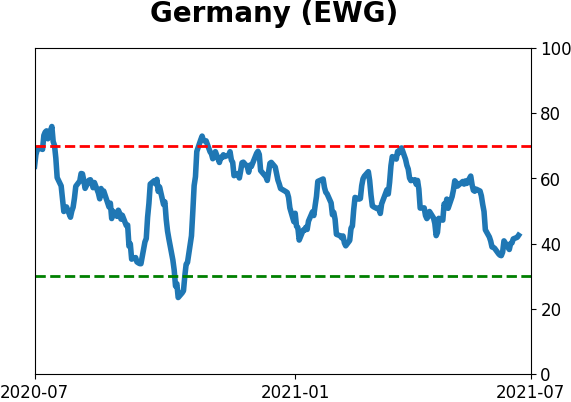
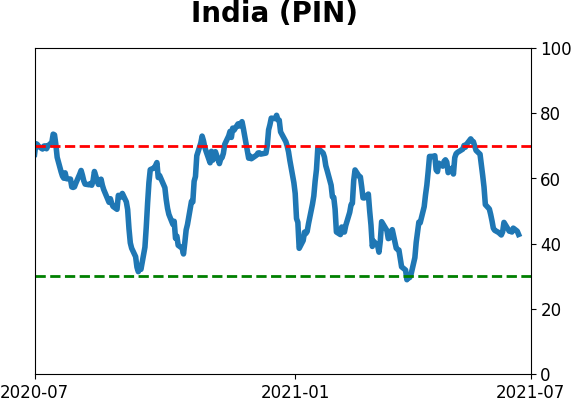
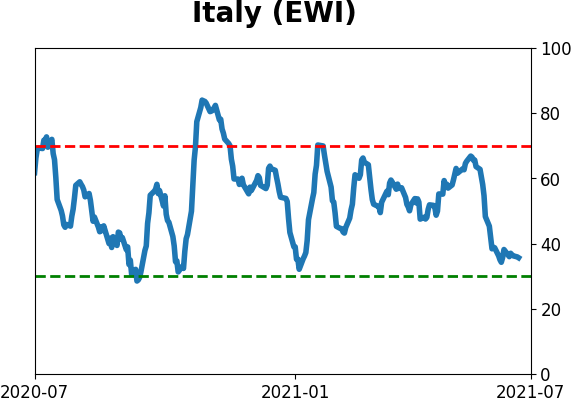
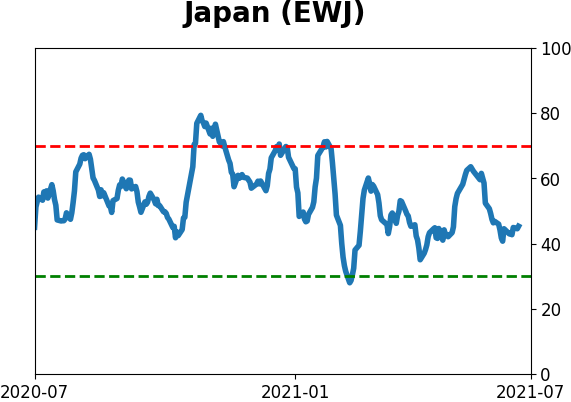
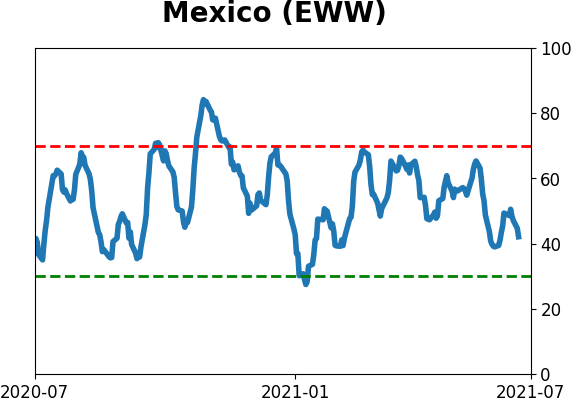
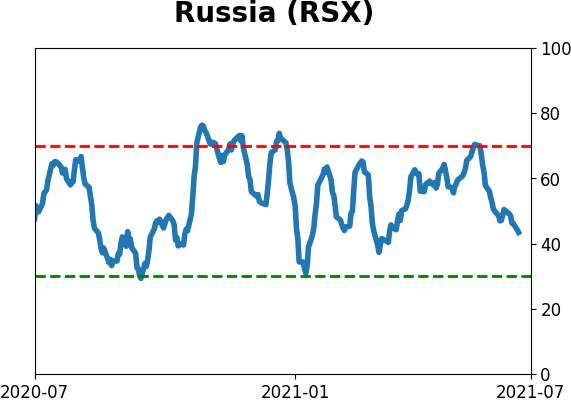
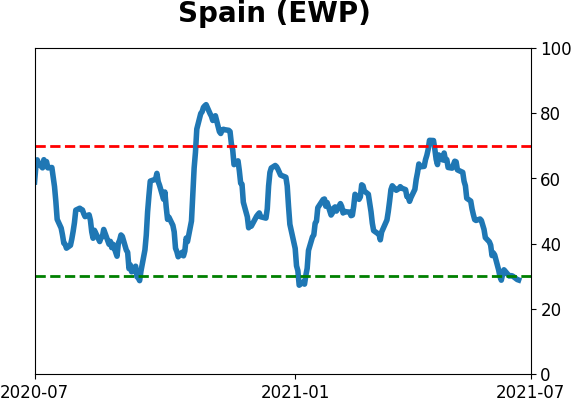
Sentiment Around The World
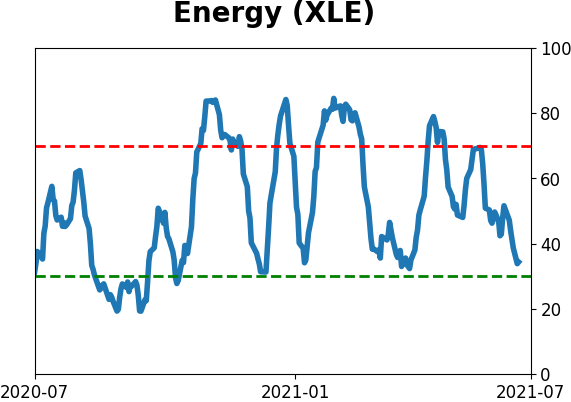
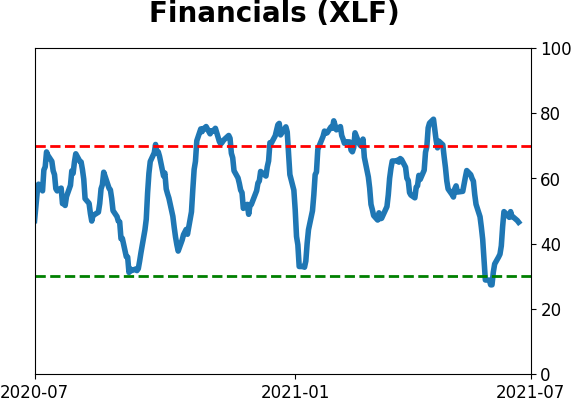
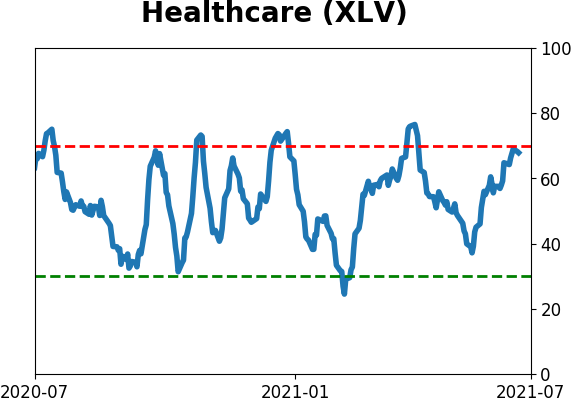
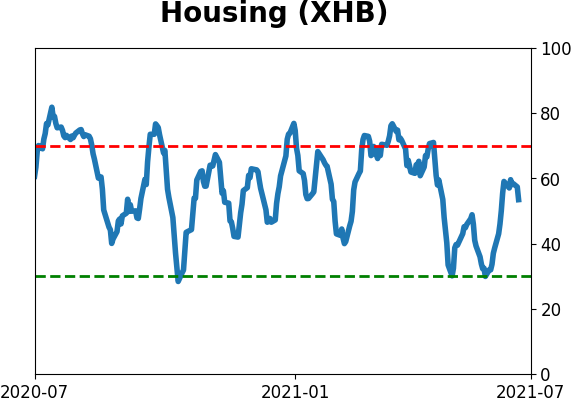
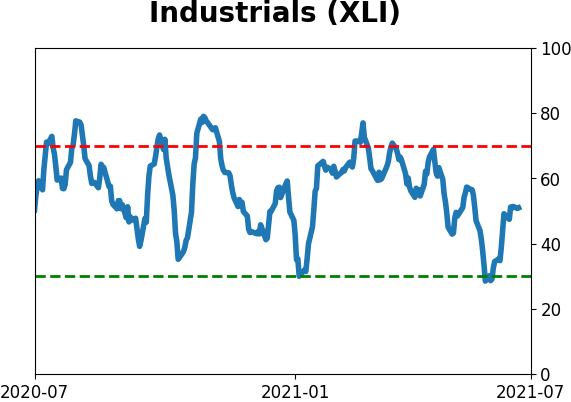
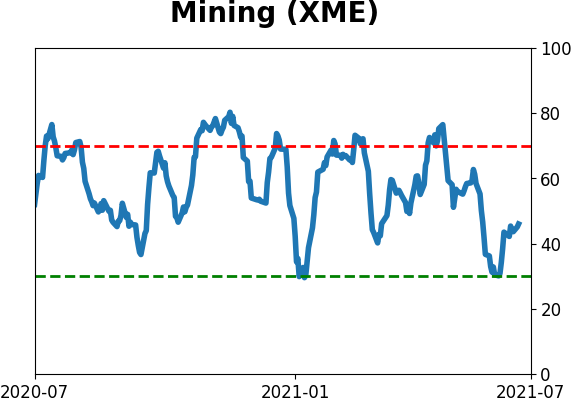
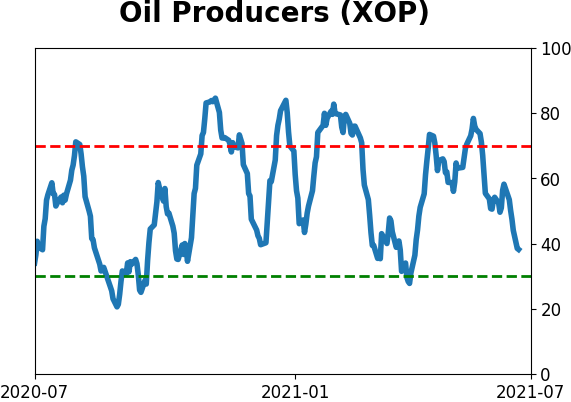
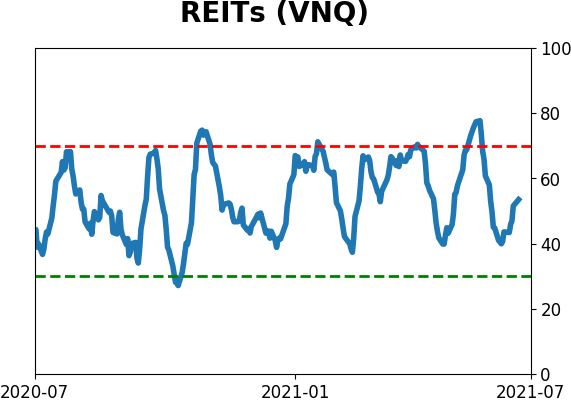
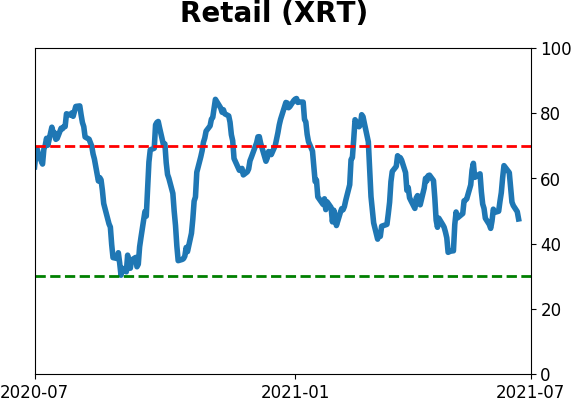
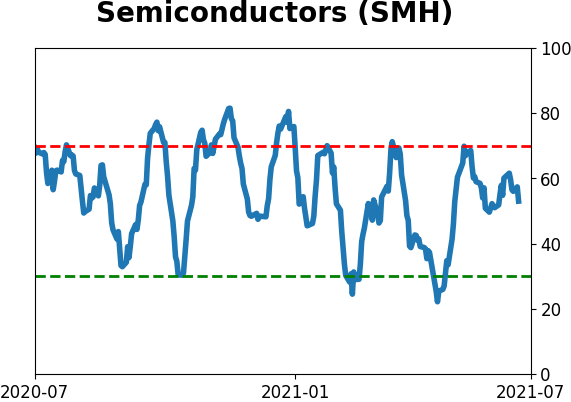
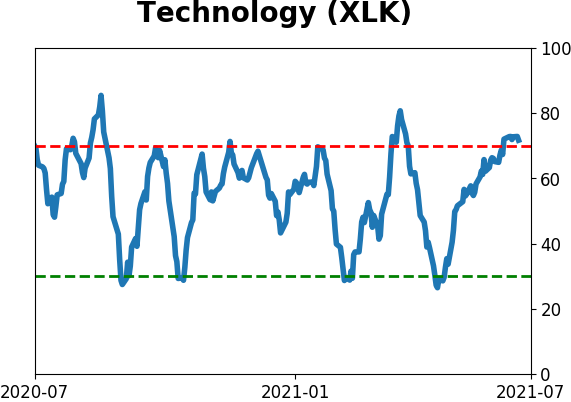
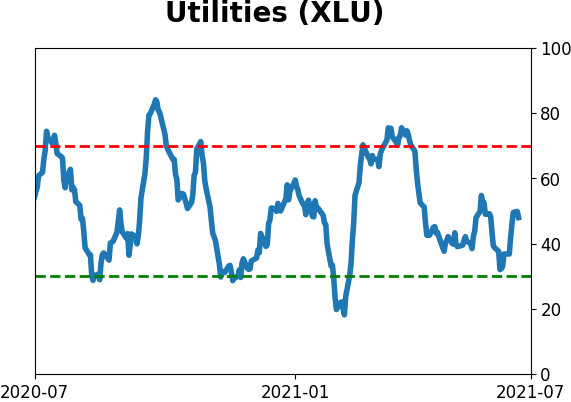
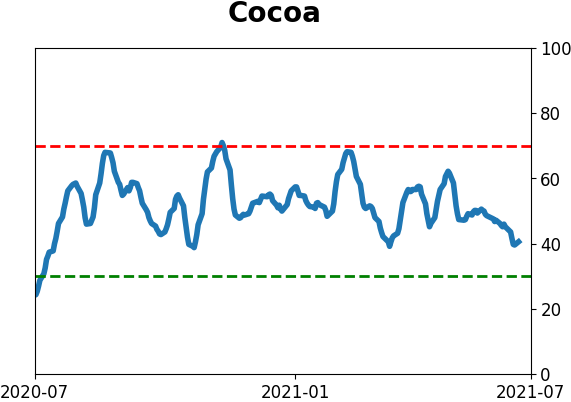
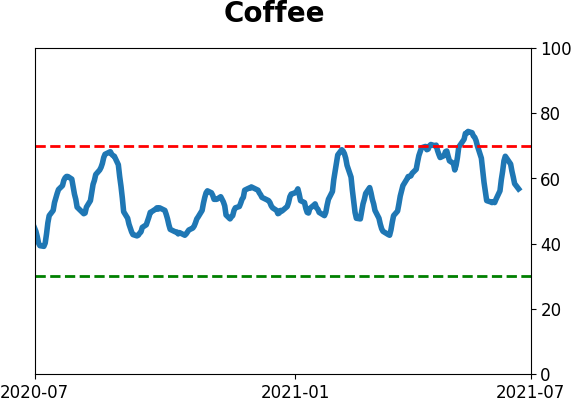
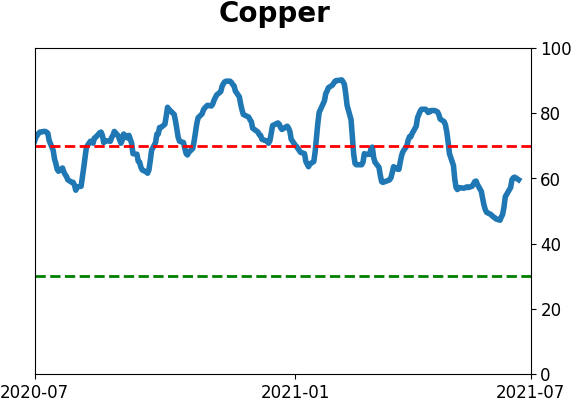
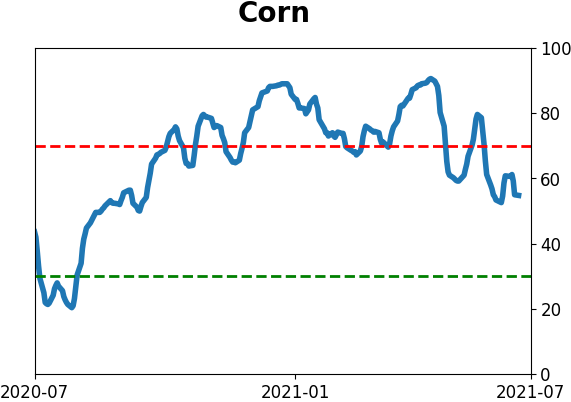
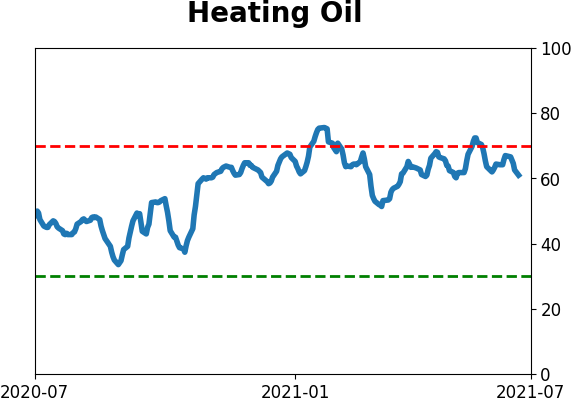
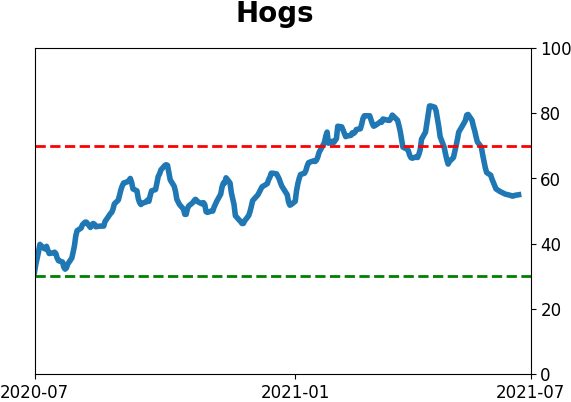
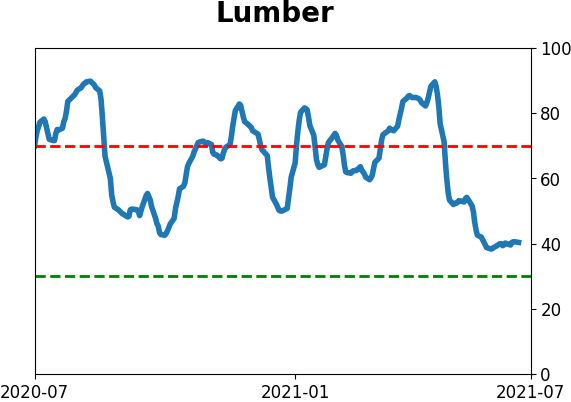
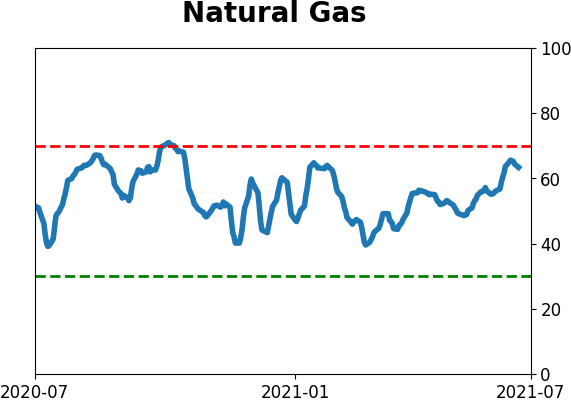
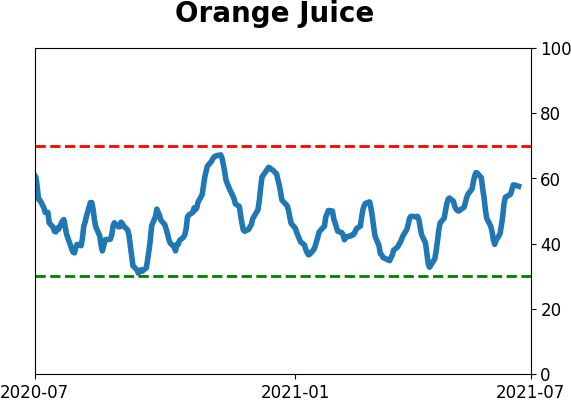
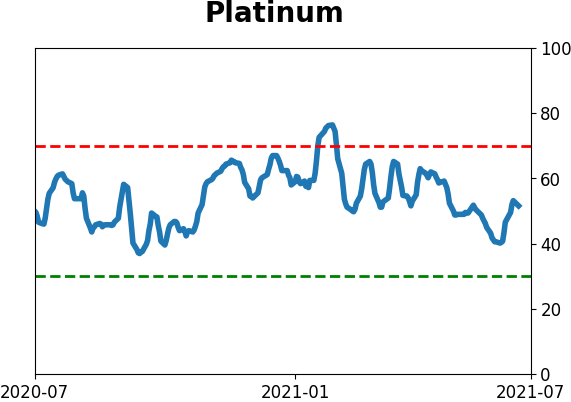
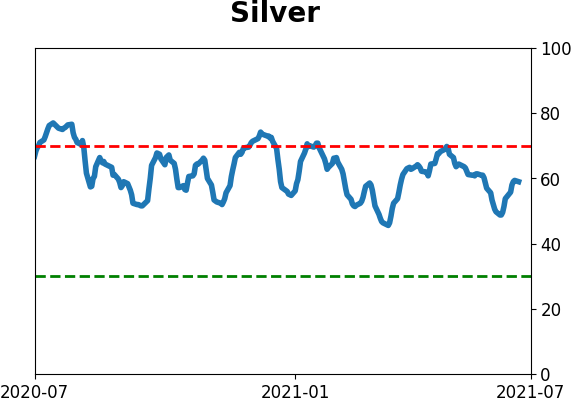
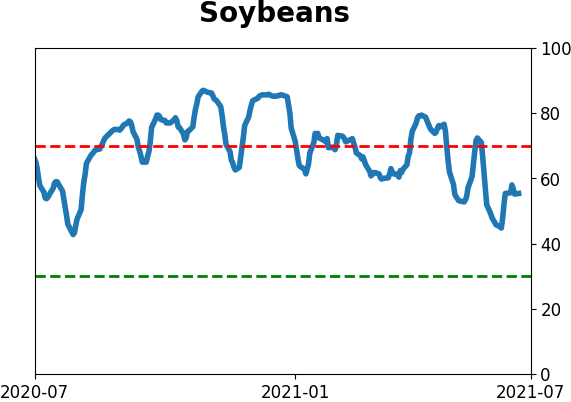
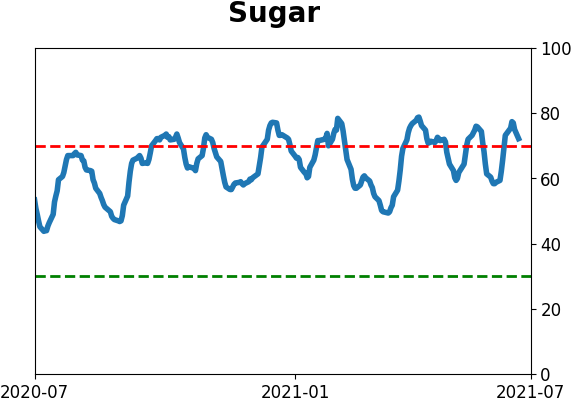
Optimism Index Thumbnails
|
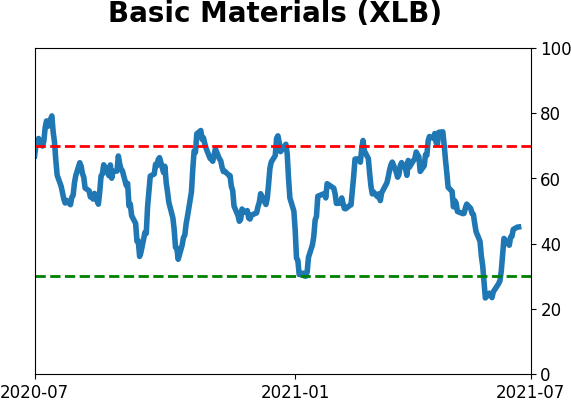
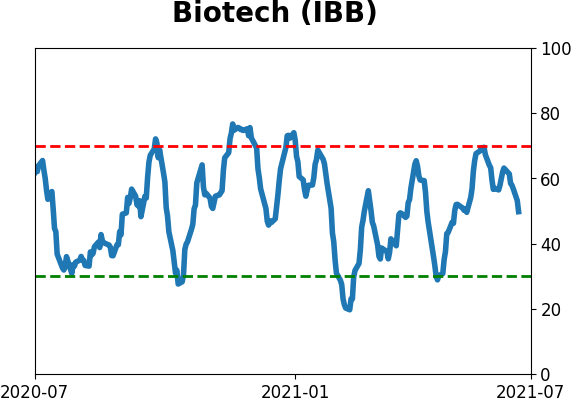
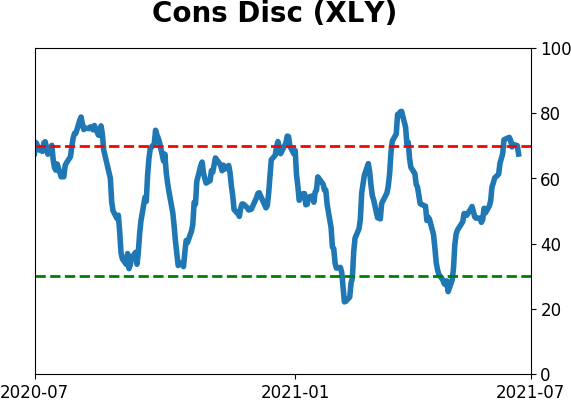
Sector ETF's - 10-Day Moving Average
|
|
|
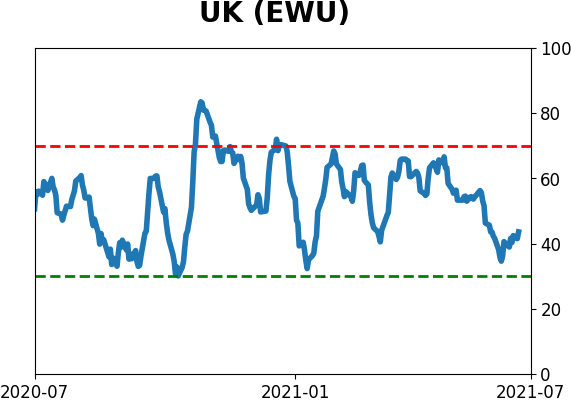
Country ETF's - 10-Day Moving Average
|
|
|
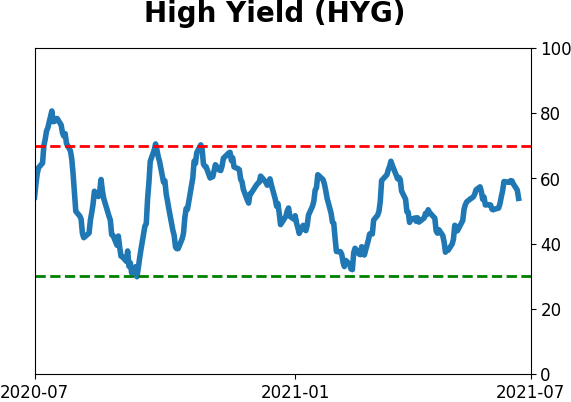
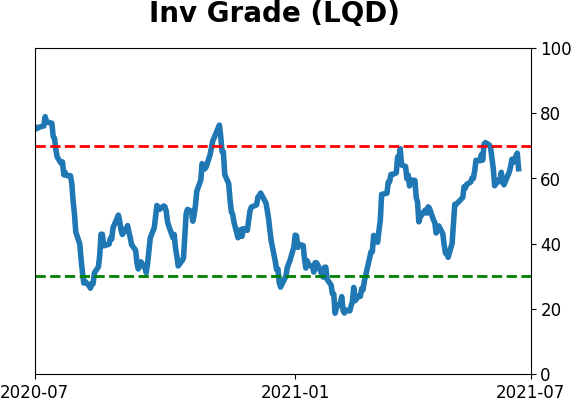
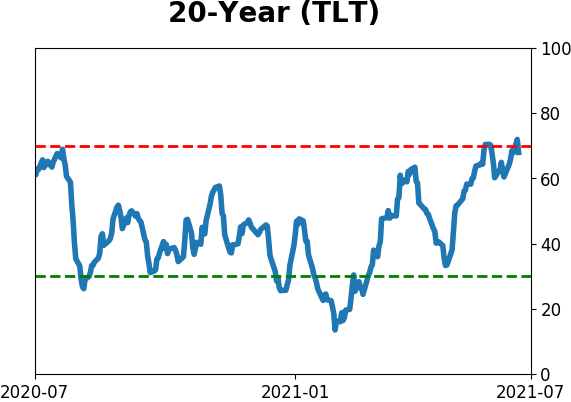
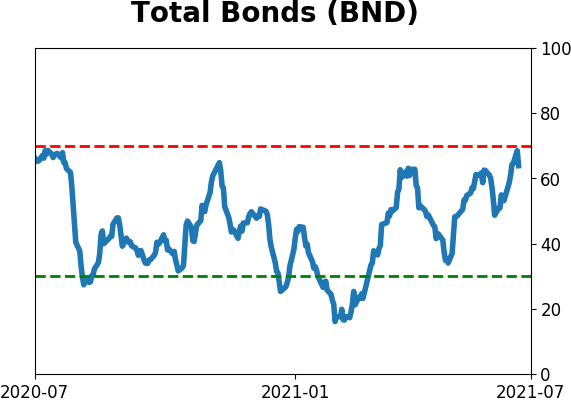
Bond ETF's - 10-Day Moving Average
|
|
|
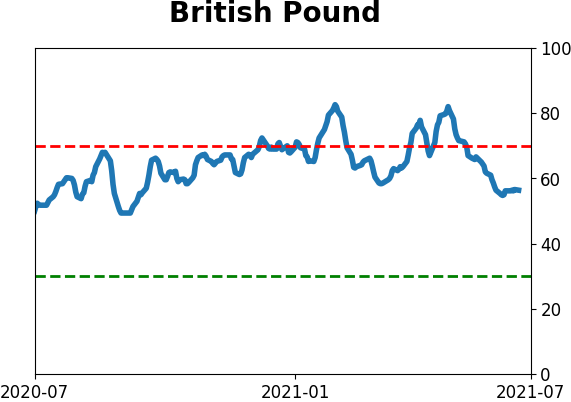
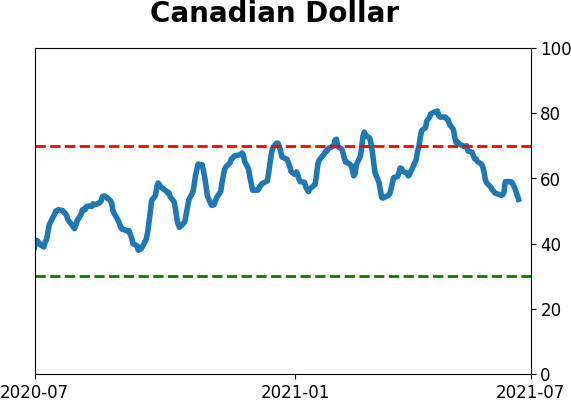
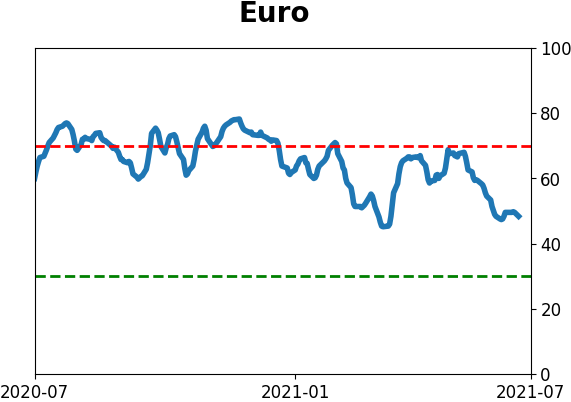
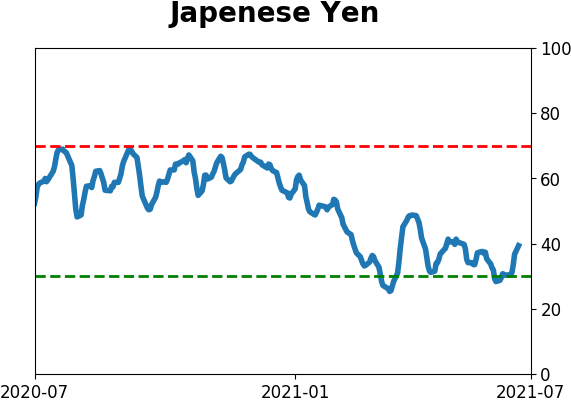
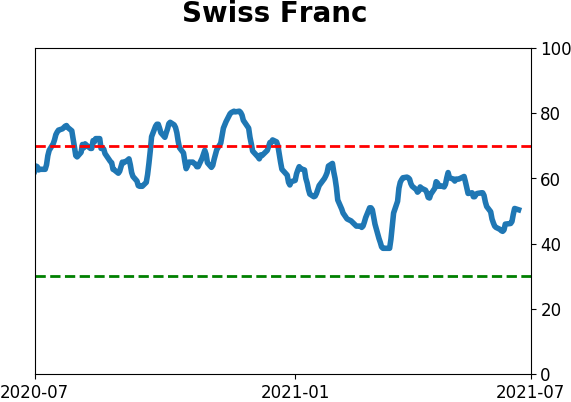
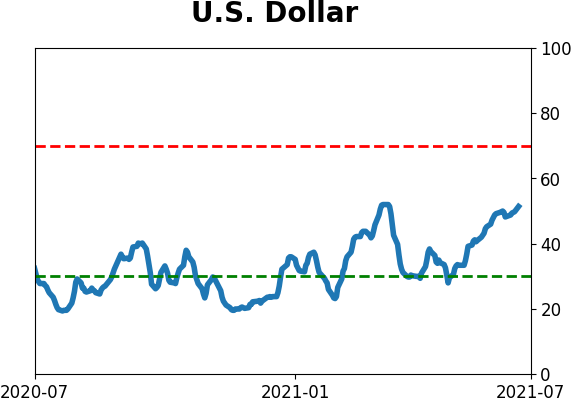
Currency ETF's - 5-Day Moving Average
|
|
|
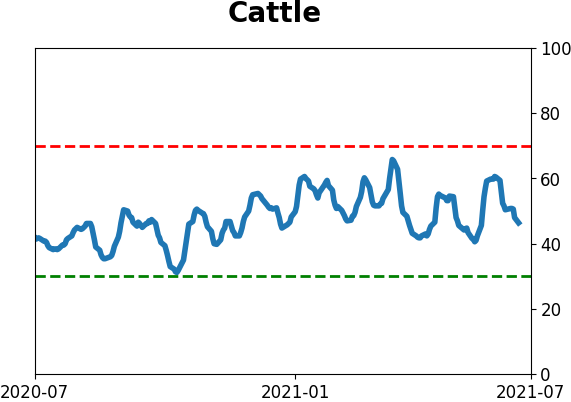
Commodity ETF's - 5-Day Moving Average
|
|