Headlines
|
|
Weekly Wrap for Jul 9 - Weak Treasury Bounce, Big Flows, Investment Grade Thrust:
This week, we saw a continued rush into equity funds from investors, and how that has preceded weaker returns. Value stocks have been getting pummeled, even though there is some fundamental 'recovery' support. Tech has rebounded nicely, and overseas indexes are badly underperforming. Treasuries have seen a weak dead cat bounce.
Bottom Line:
See the Outlook & Allocations page for more details on these summaries STOCKS: Hold
The speculative frenzy in February is wrung out. Internal dynamics have mostly held up, with some exceptions. Many of our studies still show a mixed to poor short-term view, with medium- and long-term ones turning more positive. BONDS: Hold
Various parts of the market got hit in March, with the lowest Bond Optimism Index we usually see during healthy environments. After a shaky couple of weeks, the broad bond market has modestly recovered. Not a big edge here either way. GOLD: Hold
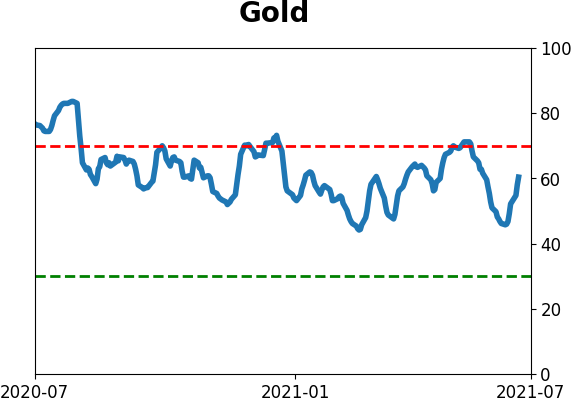
Gold and miners have done very well, recovering above long-term trend lines. The issue is that both have tended to perform poorly after similar situations - will have to wait and see how it plays out.
|
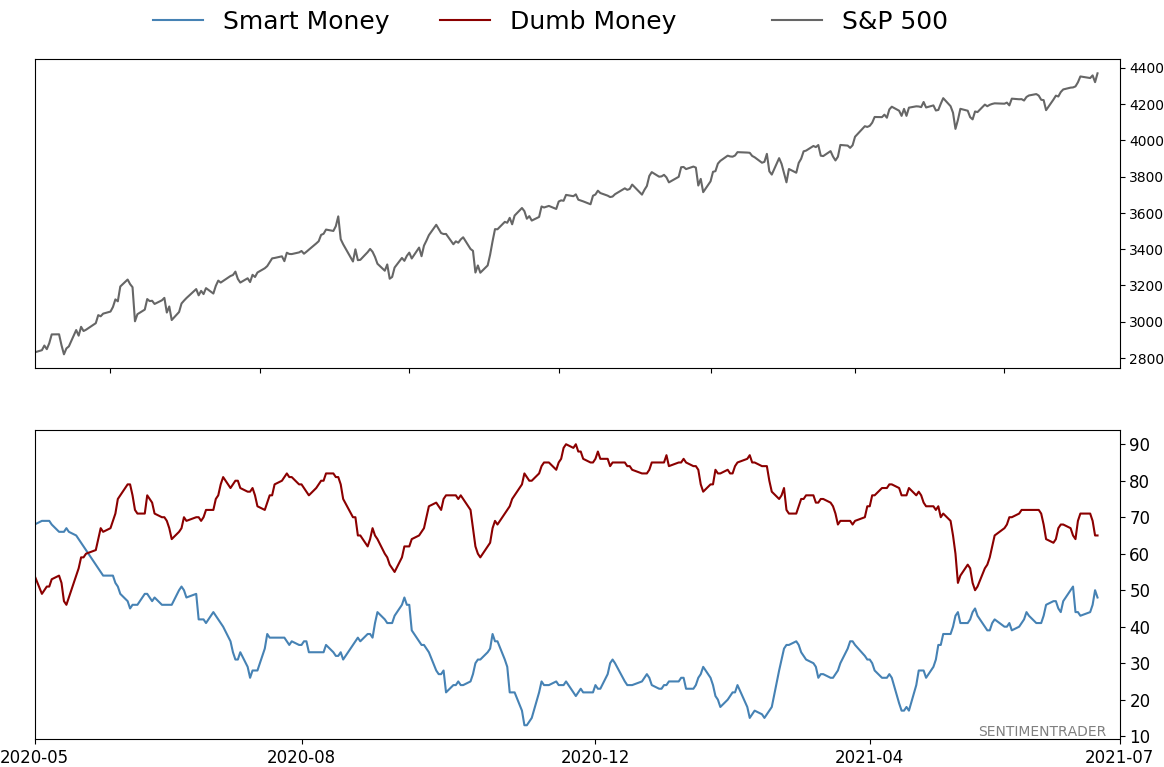
Smart / Dumb Money Confidence
|
Smart Money Confidence: 48%
Dumb Money Confidence: 65%
|
|
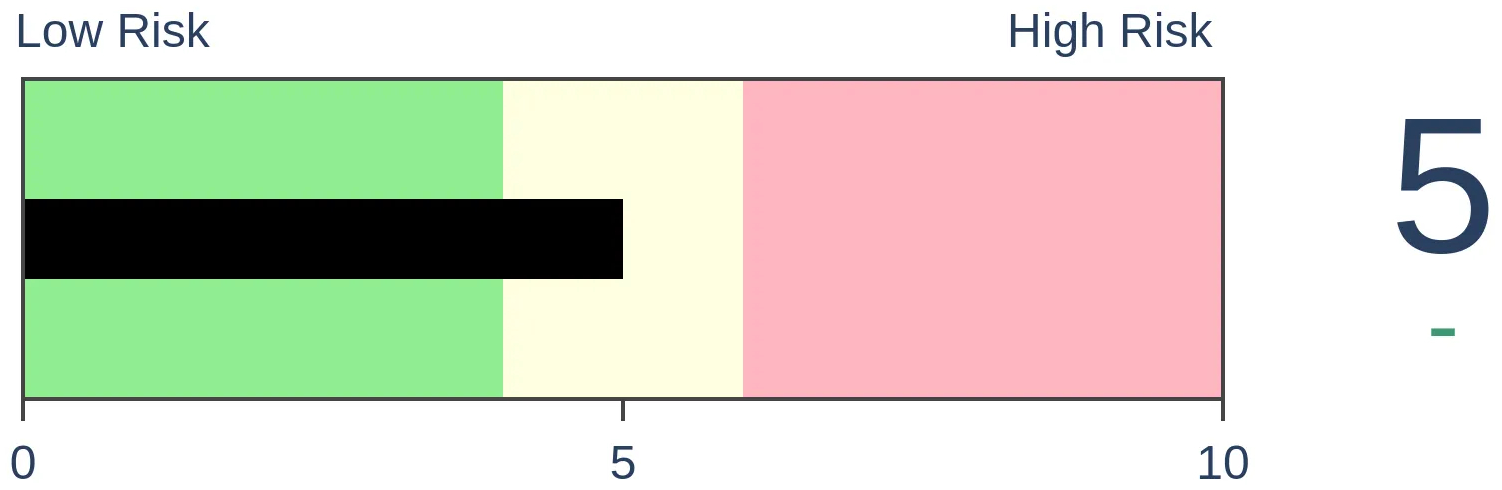
Risk Levels
Stocks Short-Term
|
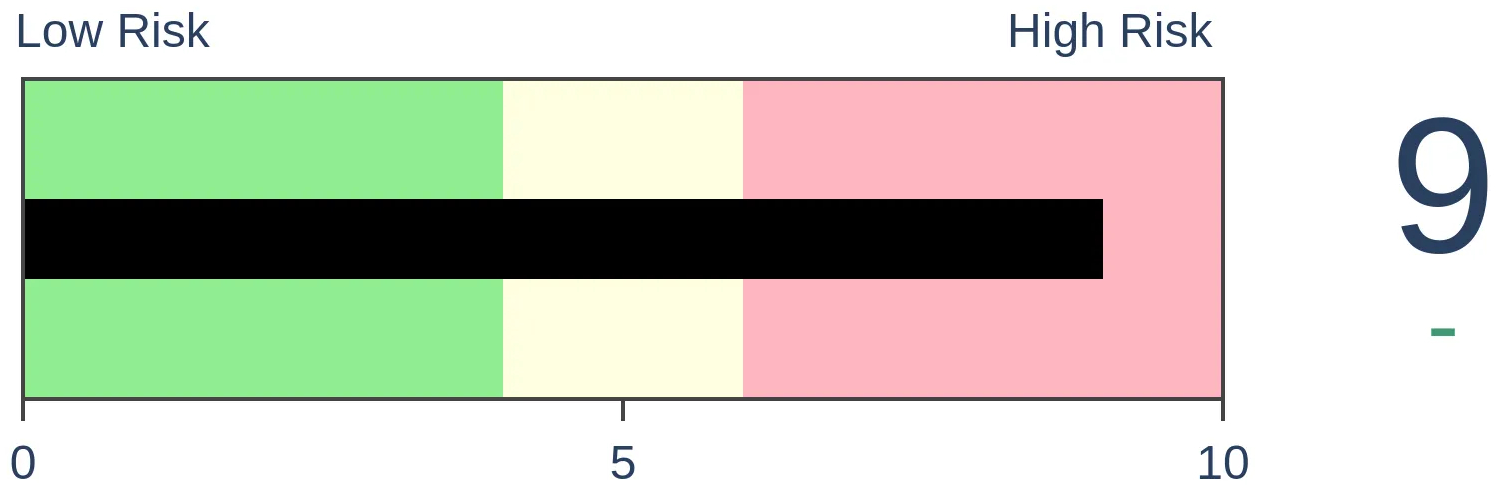
Stocks Medium-Term
|
|
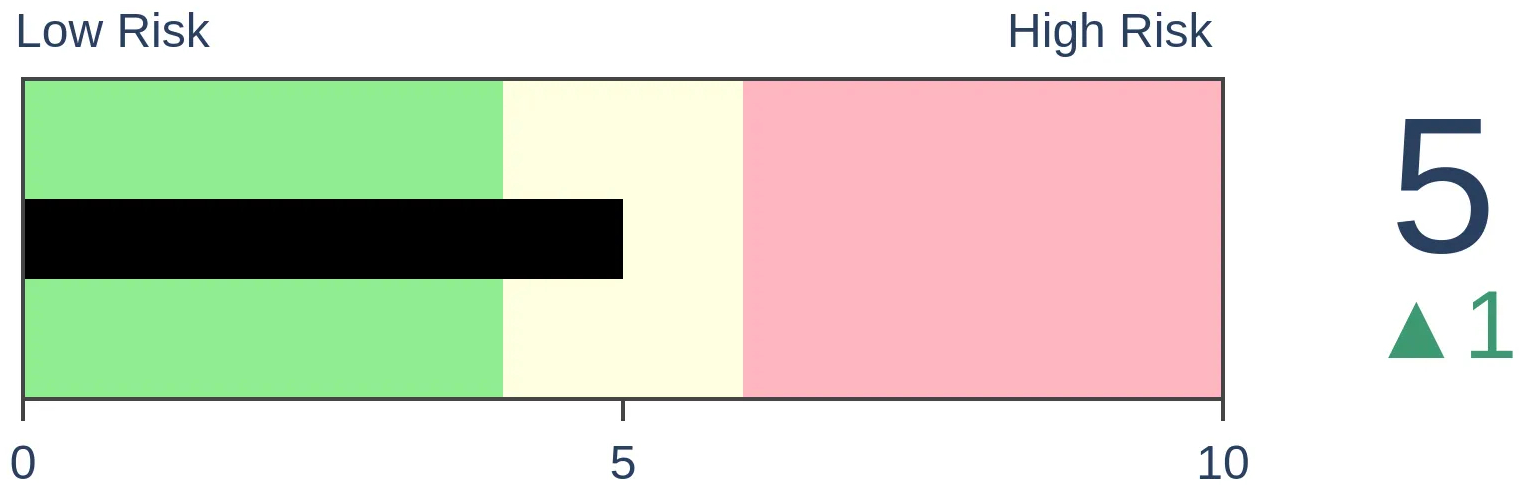
Bonds
|
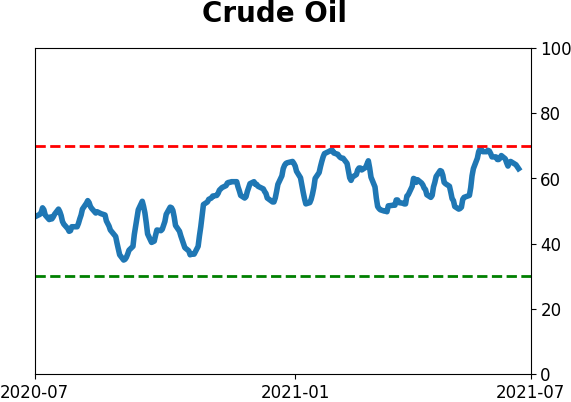
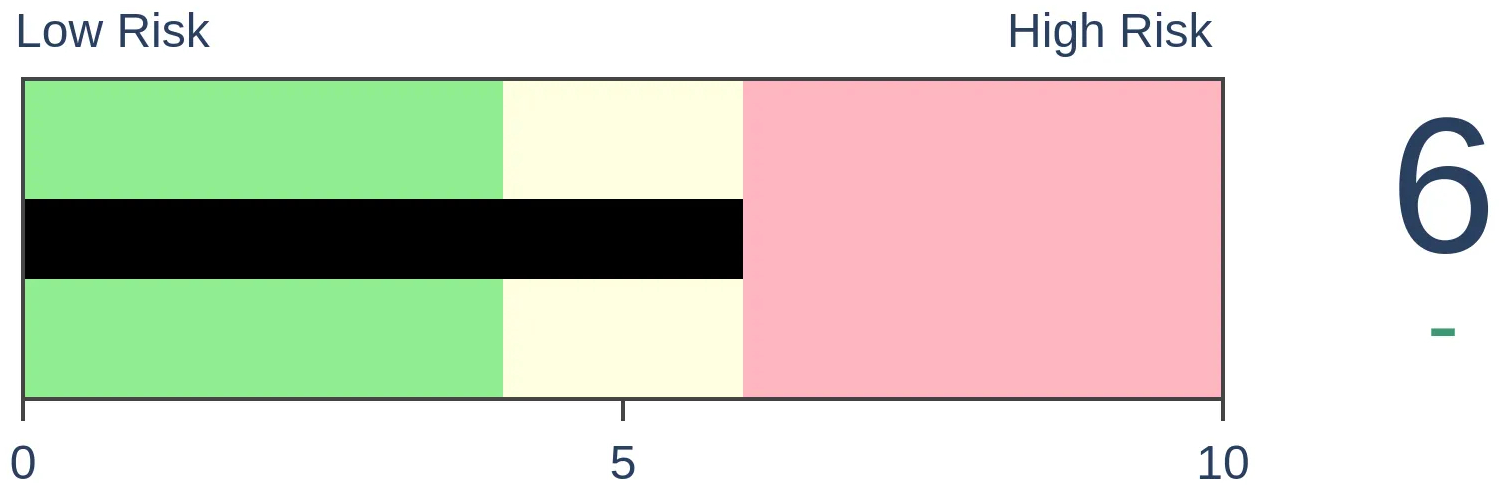
Crude Oil
|
|
Gold
|
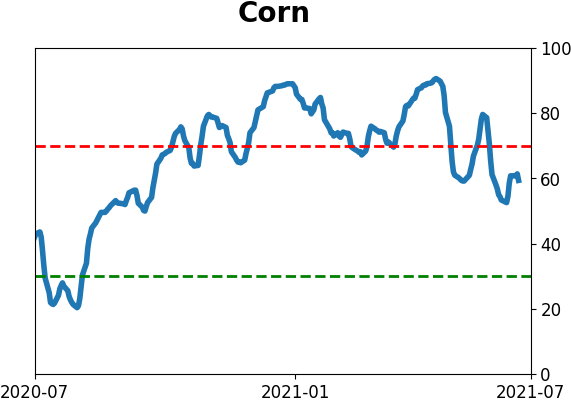
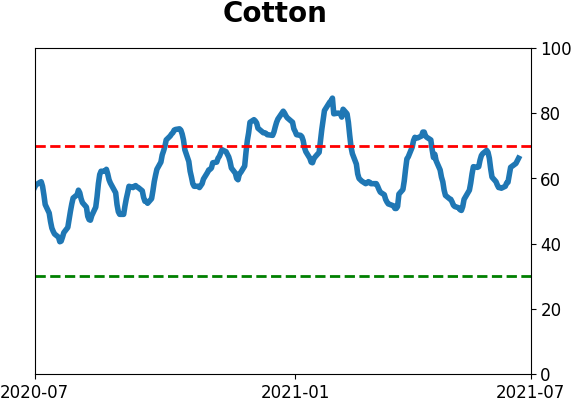
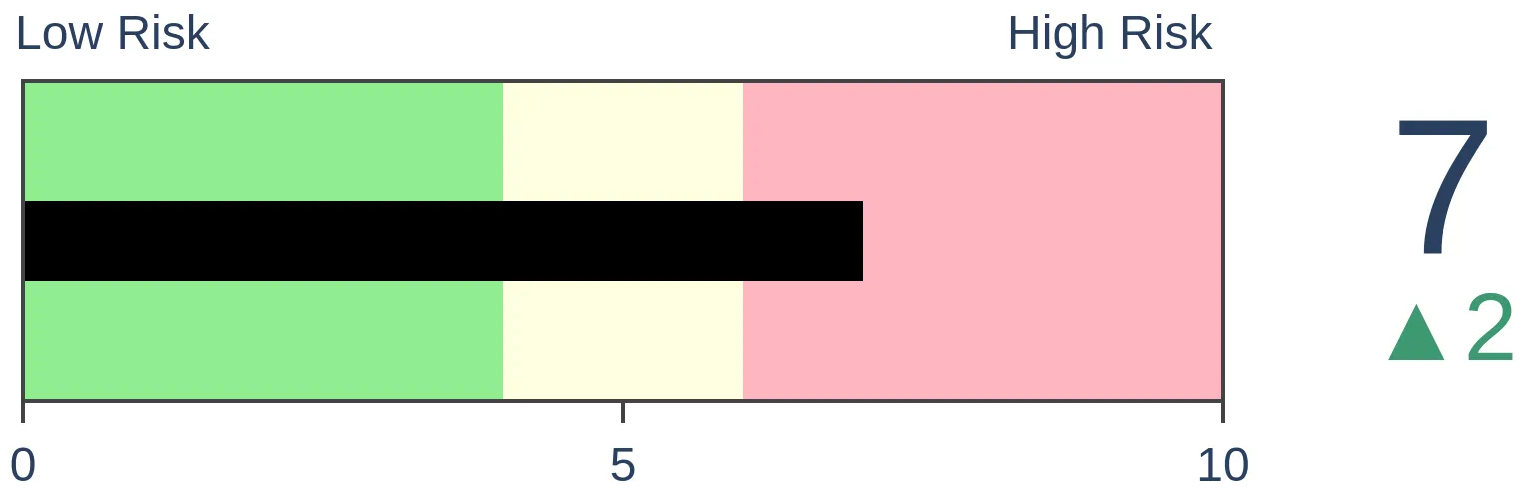
Agriculture
|
|
Research
BOTTOM LINE
This week, we saw a continued rush into equity funds from investors, and how that has preceded weaker returns. Value stocks have been getting pummeled, even though there is some fundamental 'recovery' support. Tech has rebounded nicely, and overseas indexes are badly underperforming. Treasuries have seen a weak dead cat bounce.
FORECAST / TIMEFRAME
None
|
The goal of the Weekly Wrap is to summarize our recent research. Some of it includes premium content (underlined links), but we're highlighting the key focus of the research for all. Sometimes there is a lot to digest, with this summary meant to highlight the highest conviction ideas we discussed. Tags will show any symbols and time frames related to the research.
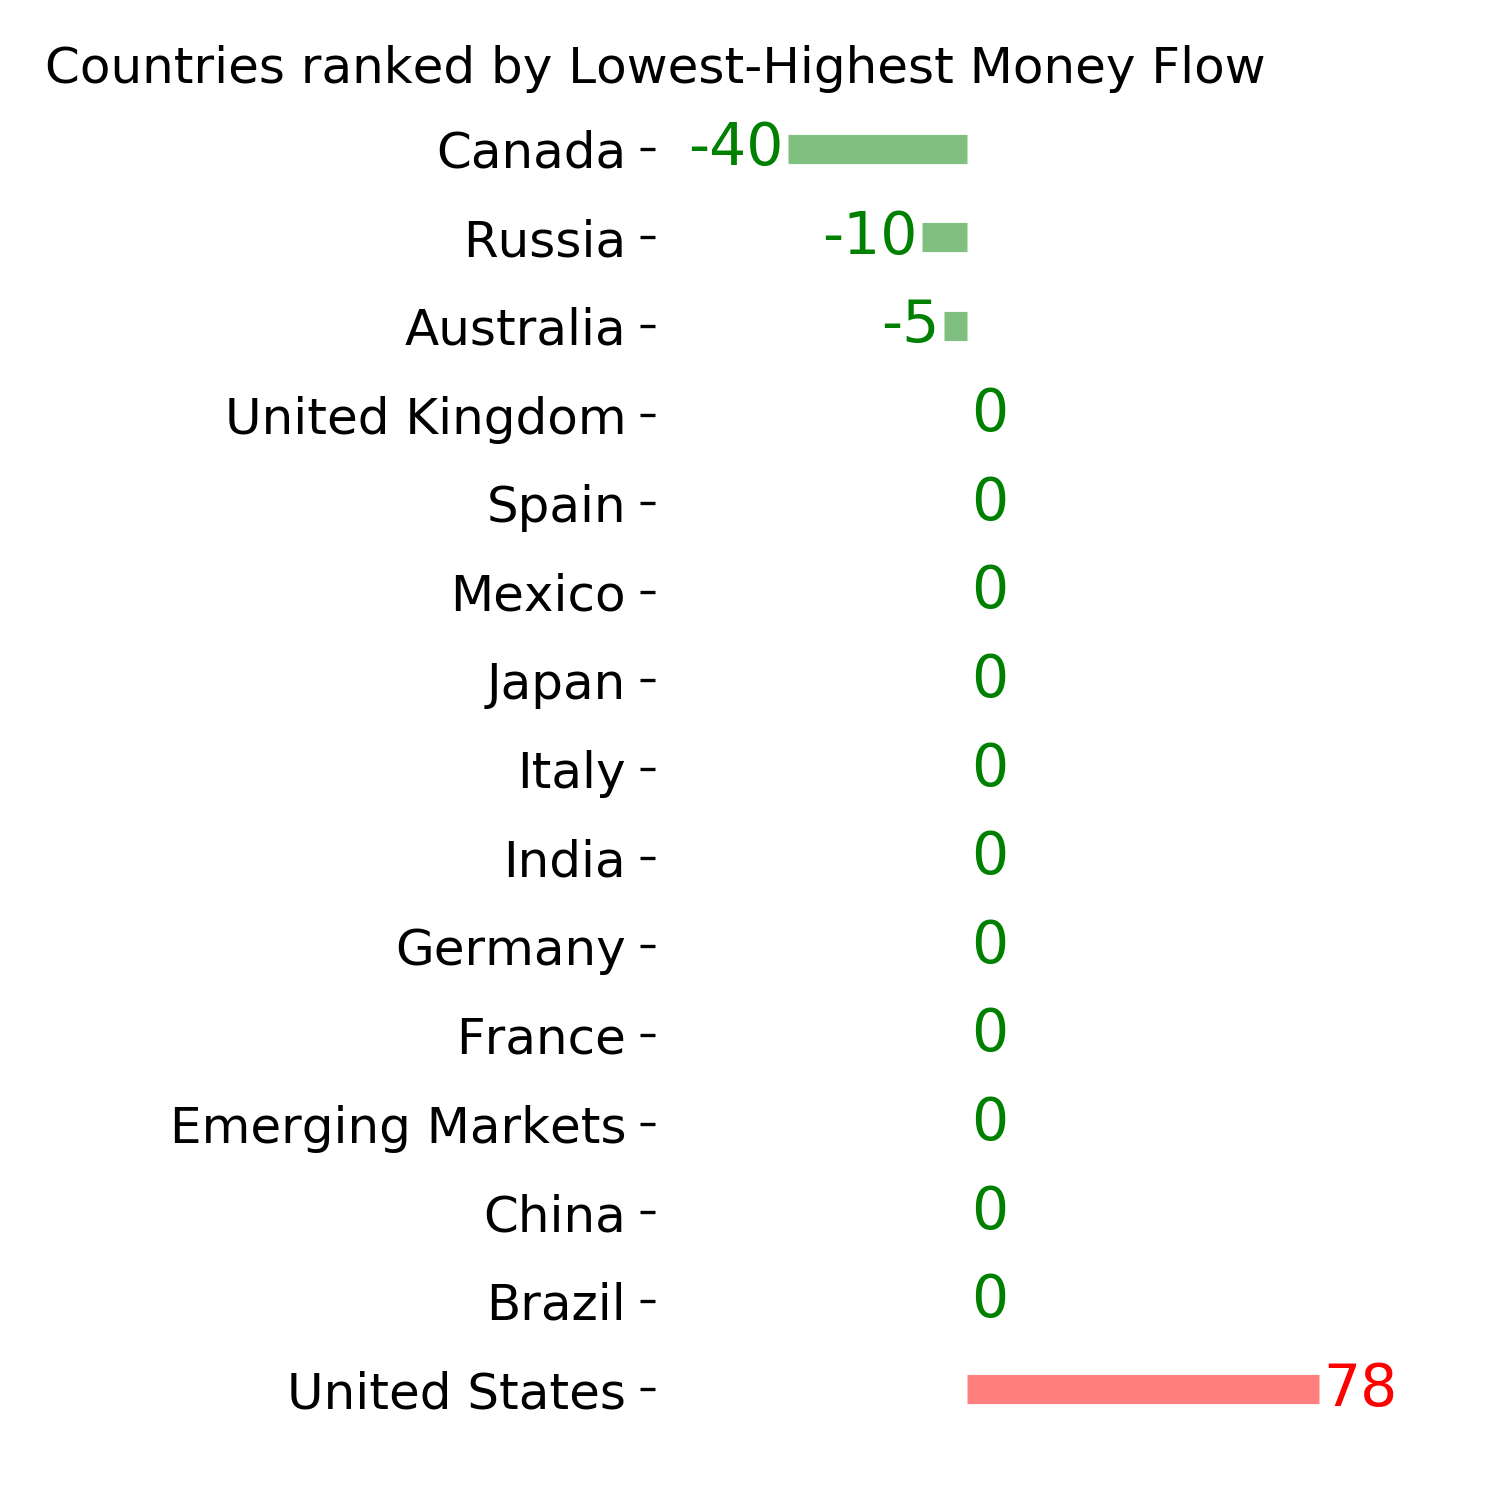
Stocks keep hitting records, there hasn't been even a pullback for six months, and investors are feeling good. And what do investors do when they're feeling good? They add to their bets.
According to Lipper, through June, equity mutual funds and ETFs have taken in more than $122 billion in assets. That's the best first half for flows in almost 20 years. This is a bit restrictive since it's only looking at flows through the first half of each year, but it's still more extreme than any other 6-month stretch in 20 years.
If we remove the calendar and look at every rolling 6-month period, and adjust fund flows for the total market capitalization of the U.S. stock market, then the past six months don't seem to be as much of a driver as other periods. It's less than half the extremes reached in 2003, 2011, and 2013.
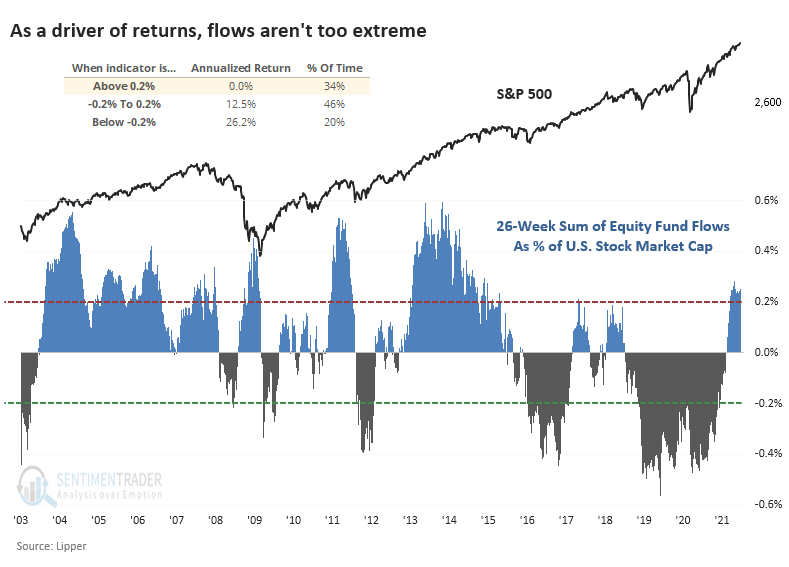
Still, there was a consistent contrary nature to investors' behavior. The higher the flow, the lower the S&P 500's annualized forward return. When it exceeded 0.2% of market cap, which it currently is, then the S&P 500's annualized future return was perfectly flat. That's far below the other periods when flows were less extreme or (especially) when there was an extreme outflow.
VALUE GETTING POUNDED
Much of what we've seen on the site for months has favored Value over Growth as the best opportunity to tilt a portfolio for forward returns without trying to predict overall market direction.
That's been working but took a big hit in June and continues even today. The total return ratio between the Russell 3000 Value Index versus the Growth Index tumbled more than 7.5% over the past month, one of the largest losses in years.
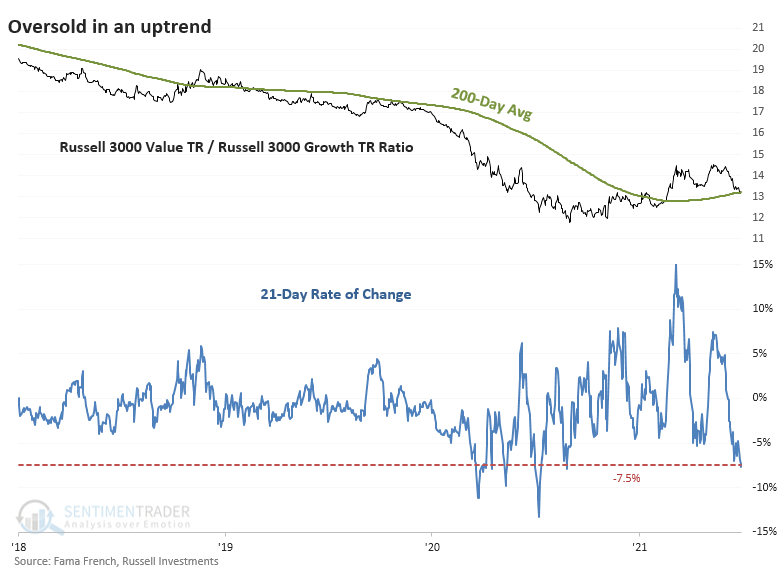
One difference with the recent losses is context - it's happening in an uptrend. Unlike the large rolling 1-month losses during much of 2020, the 200-day average of the Value/Growth Ratio is rising.
If we focus on large declines in the ratio only within uptrends, we can see that losses this large have typically resulted in the trend reasserting itself rather than sliding into another long-term downtrend.
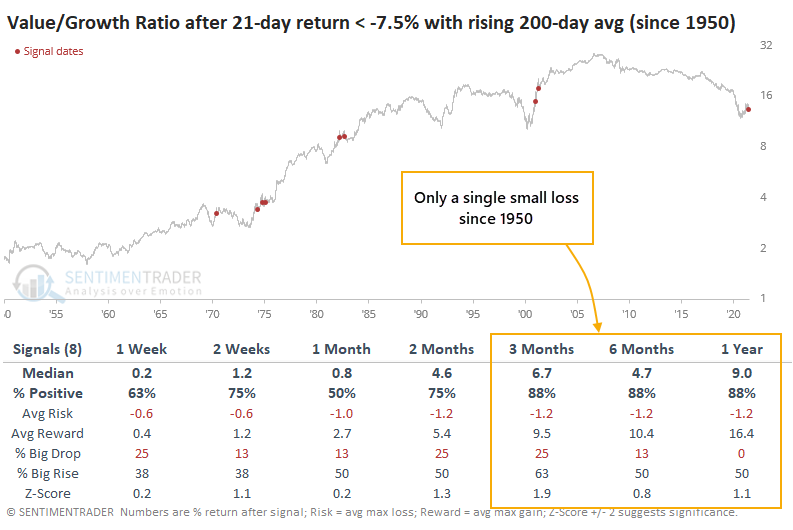
We'd consider this less of a signal for the broad market. It was more consistent for prospects in Value versus Growth stocks. Signals have been pointing that way for months, and the recent setback doesn't look like a reliable reason to abandon it.
SOME FUNDAMENTAL SUPPORT
Jay noted that most investors recognize a direct link between the state of the economy and the stock market's performance. And a majority of investors understand and generally accept the link between unemployment, new home construction, new car sales, etc., and the state of the overall economy. However, far fewer are aware of the usefulness of Heavy Truck Sales (HTS) as a leading economic and stock market indicator.
The chart below displays HTS minus its 18-month moving average.
- Readings above 0 mean HTS is ABOVE its 18-month average, i.e., "Favorable"
- Readings below 0 mean HTS is BELOW its 18-month average. i.e., "Unfavorable"
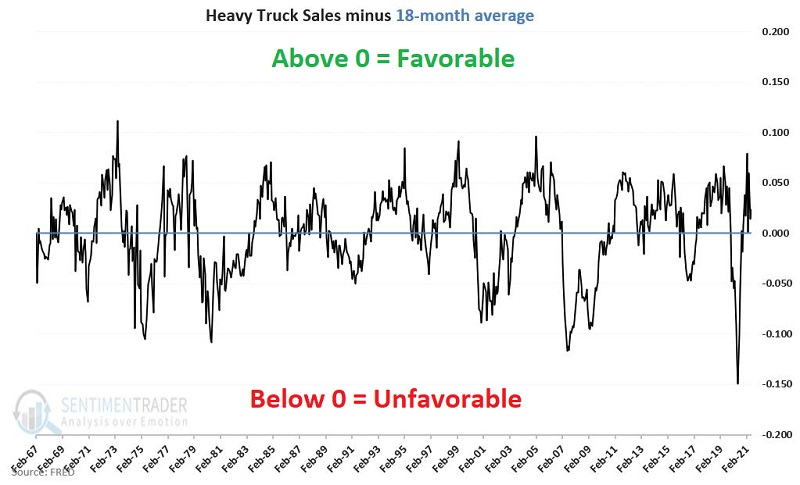
When these sales are above trend, we expect the economy and the stock market to perform well. When below 0, we expect that - at times - there will be trouble, and the results for the economy and the stock markets will not be as good.
Does this theory hold up in reality? To track the course of the economy, we will use the Coincident Economic Indicators (CEI) data series. At the end of each month, we note the status of our HTS indicator and then the rise or fall in CEI for the next month.
The table below displays the monthly performance for CEI depending on whether our HTS indicator is above or below its 18-month average.
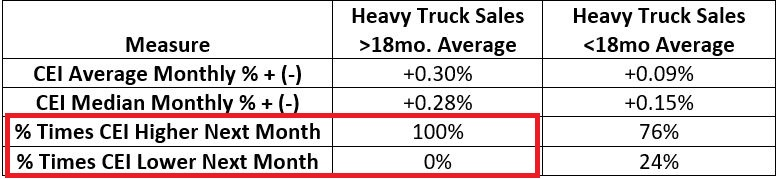
Key things to note in the table above:
- CEI performed significantly better when HTS > 18-month average (average +0.30% versus +0.09%)
- CEI has not experienced a monthly contraction when HTS > 18-month average
- A down-trending HTS indicator preceded all calendar months that witnessed a contraction in CEI
The implication: As long as Heavy Truck Sales are above their 18-month average, there has historically been almost no risk of a recession.
THE BOND MARKET IS SHOWING SUPPORT, TOO
Dean noted that investment-grade bonds registered a new breadth thrust buy signal at the close of trading on Thursday.
The model uses market breadth data to identify trend changes in advance of price action alone. When the corporate bond market is healthy and shows thrusts like this, it has been an excellent sign for the stock market.
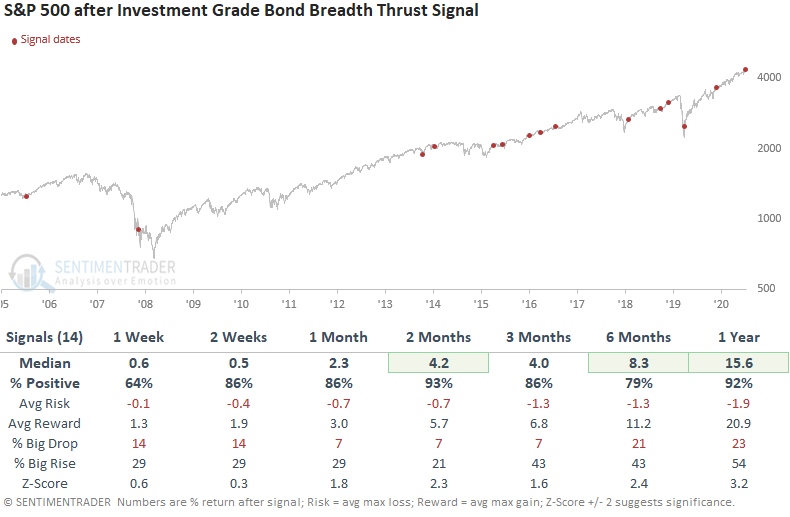
While it's useful to watch breadth data for bonds and the message it can provide related to the economy, credit conditions, and the stock market, we have to keep in mind that the data history is limited.
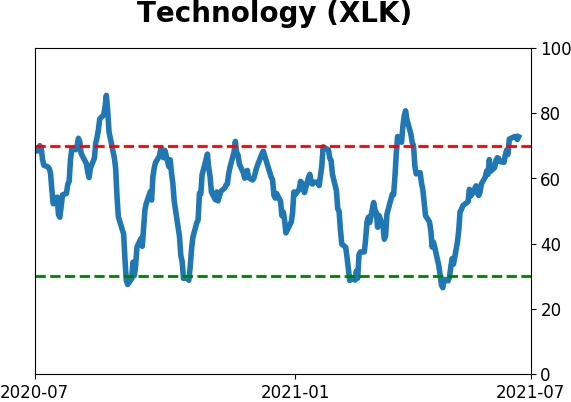
STOCKS AND SECTORS - INFO TECH
Dean updated his absolute and relative trend following indicators for domestic and international ETFs.
The relative trend score for the technology sector improved with an increase of six points on a week-over-week basis. Short-term price momentum is strong, with the sector closing above its 10-day moving average for 21 consecutive days. The improvement in the growth-oriented technology sector came at the expense of value-oriented groups like energy, industrials, and materials.
The chart and table below show other times when the technology sector reached this many days above average after trading below its 10-day average for 15 consecutive days to show similar reversals.
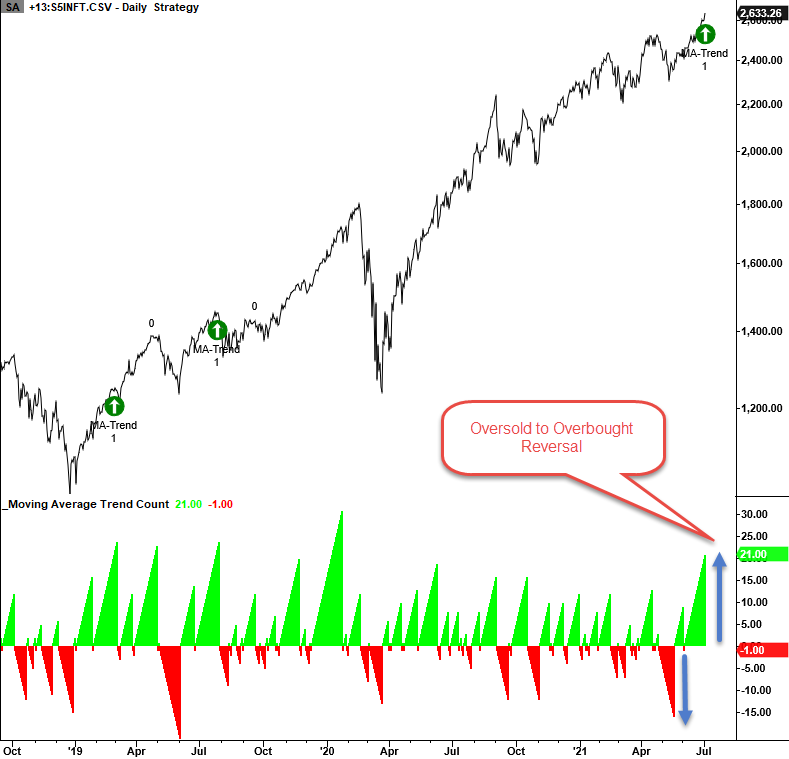
The returns look weak in the short term with better, but not eye-catching, results starting in the 2-month timeframe.
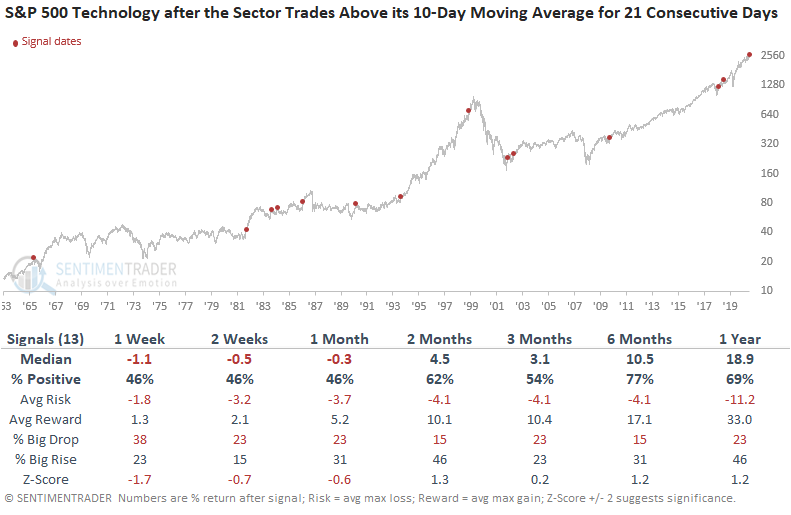
Over the next year, the group averaged a return of nearly 19%.
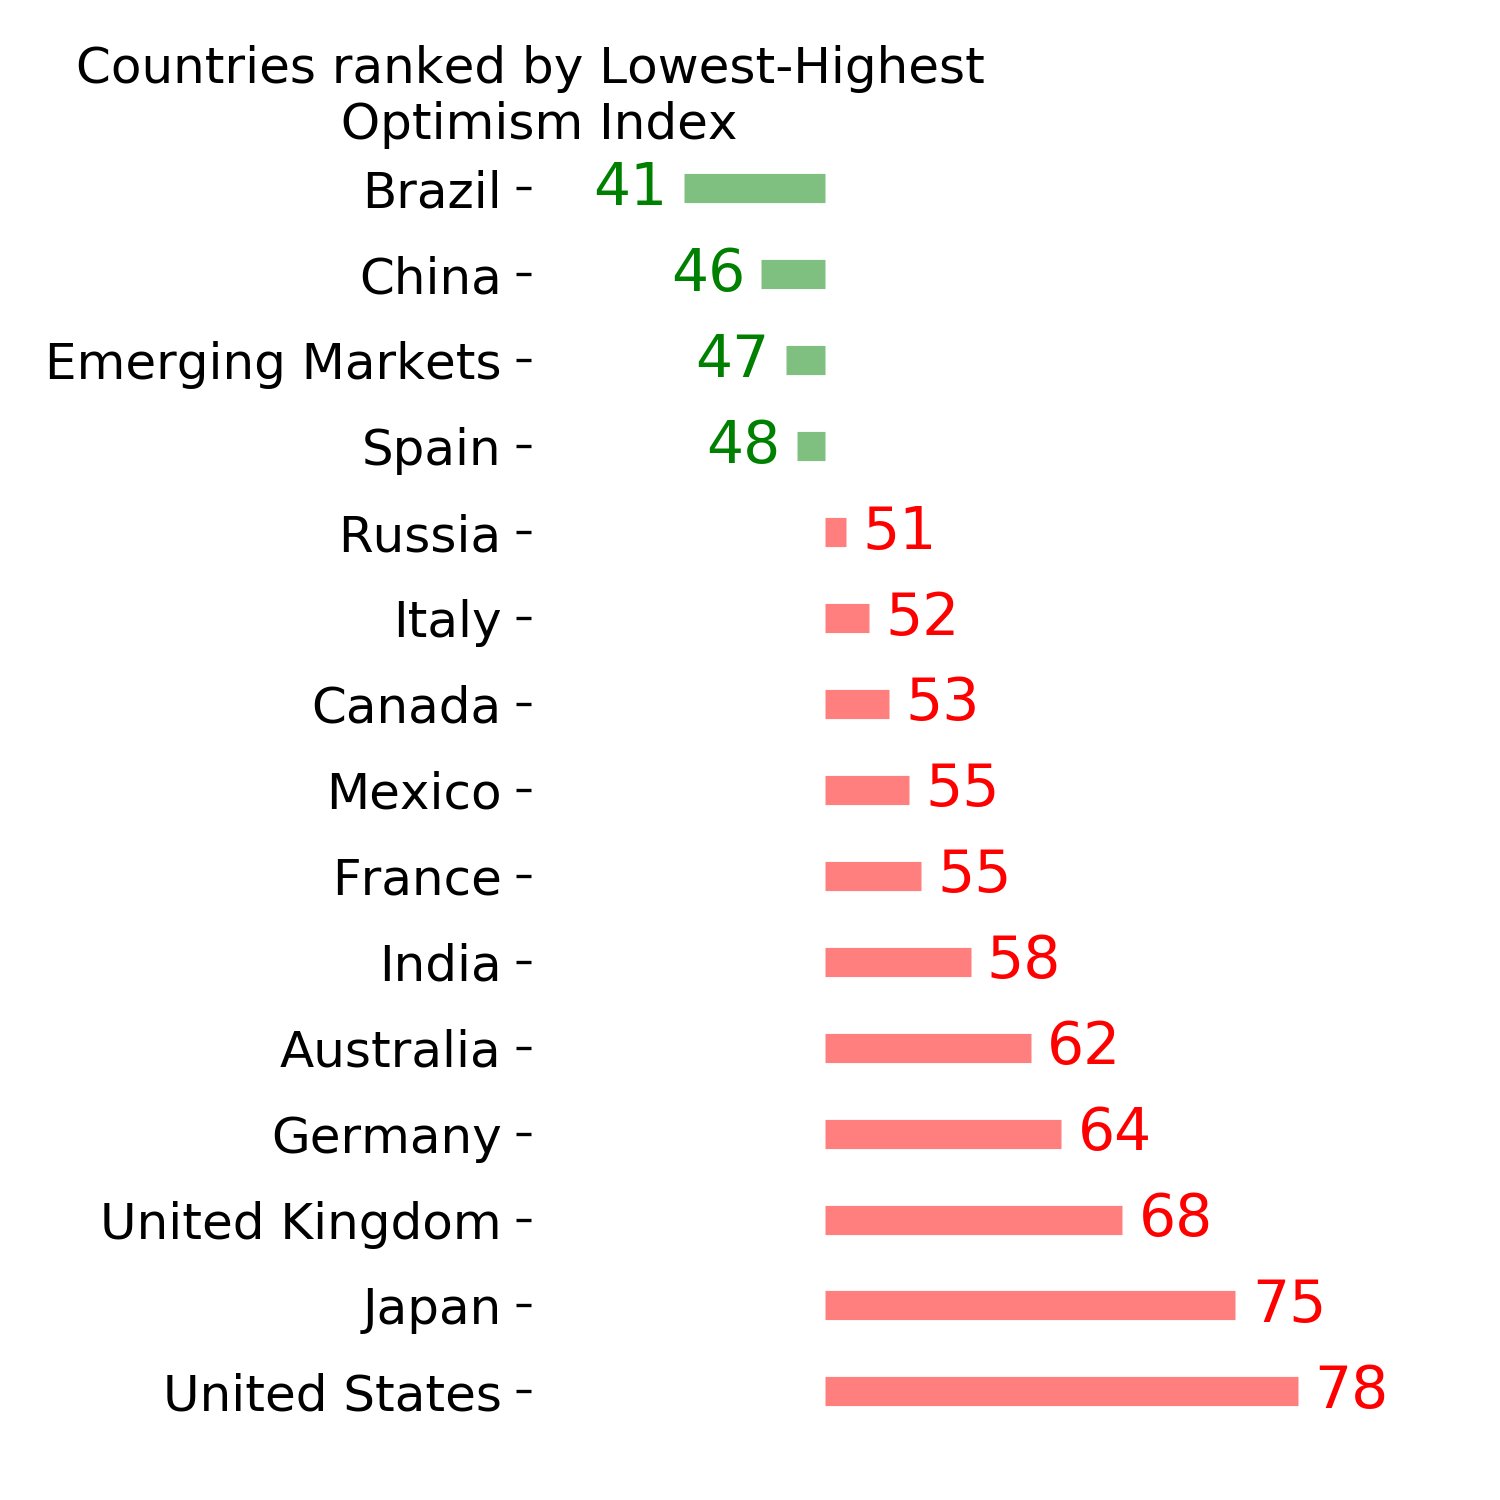
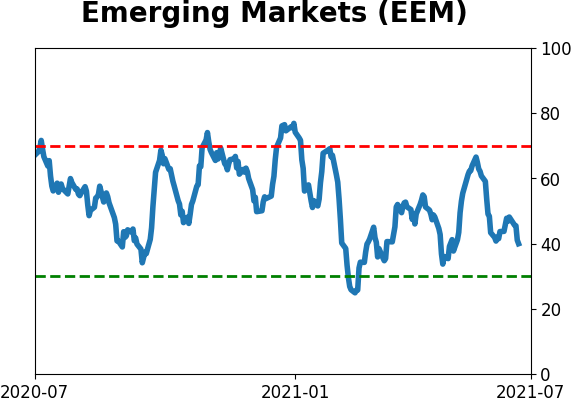
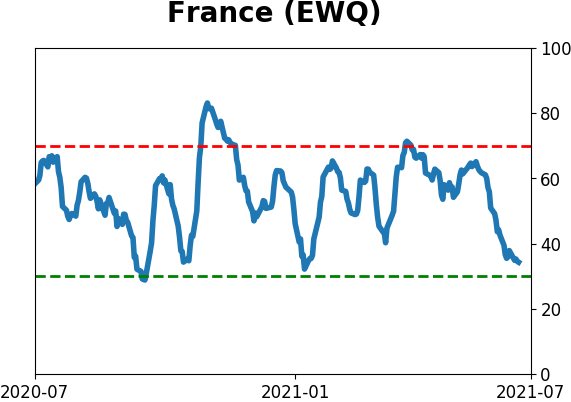
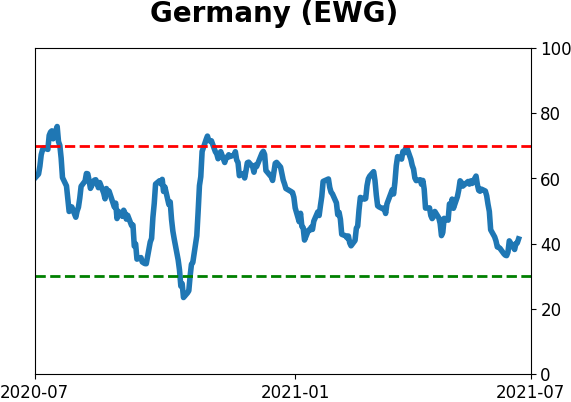
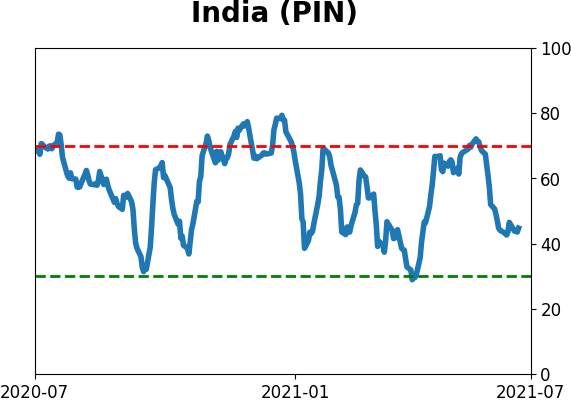
STOCKS AND SECTORS - NON-U.S. MARKETS
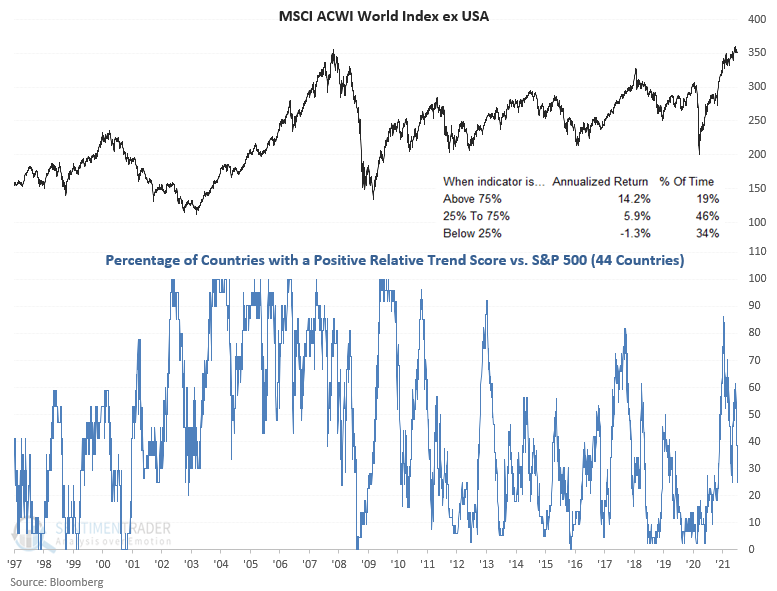
The percentage of countries with a positive relative trend score versus the S&P 500 decreased to a level that suggests flat to negative returns for regions around the globe.
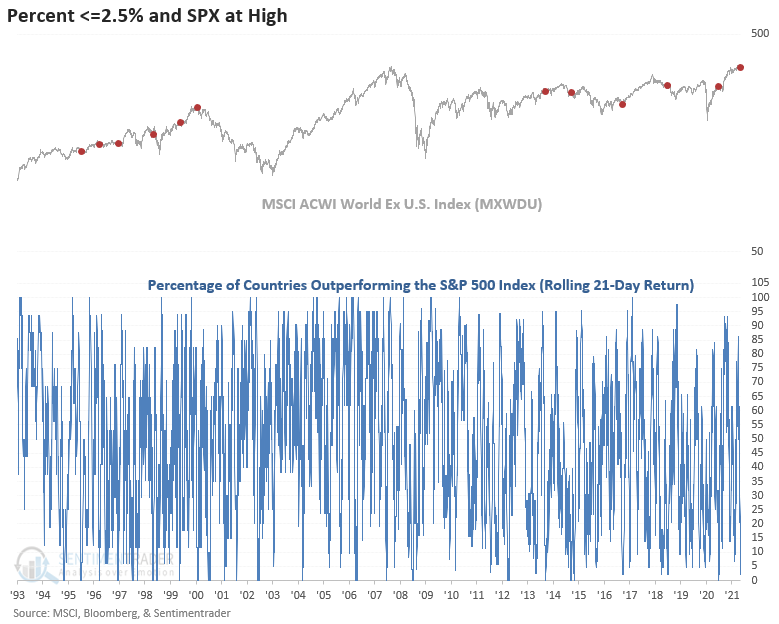
In a note last week, Dean highlighted that the percentage of S&P 500 members outperforming the index on a rolling 21-day basis had fallen to a historically low level of 30%. The underperformance trends are even more substantial when applying the same analysis to the 44 countries in the weekly absolute and relative trend update.
As of early July, only 2.27% of the ETFs outperform the S&P 500 on a rolling 21-day basis. These weak global relative trends occur as the S&P 500 is trading at an all-time high.
Let's conduct a study to assess the forward return outlook for domestic and global indexes when 2.5% or fewer countries outperform the S&P 500 index on a rolling 21-day basis as the S&P 500 simultaneously closes at a 252-day high.
The 2-13 week performance looks weak, and the 6-12 months results, while healthy, don't look as good as the S&P 500.
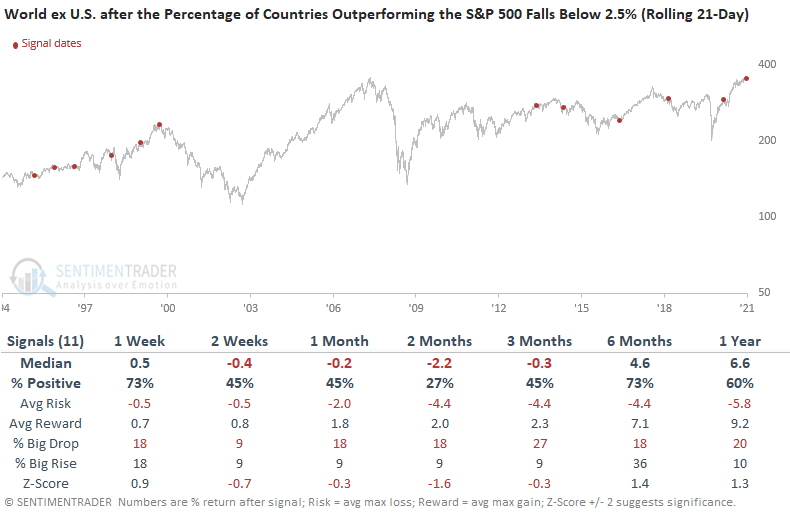
These signals also showed poor future returns for Emerging Markets, Value, and Growth stocks.
STOCKS AND SECTORS - REAL ESTATE
Jay highlighted the idea that it is fairly common knowledge that the stock market's performance is tied closely to that of the economy. On the other hand, the Real Estate sector is typically thought of as a very different asset class. And in many ways, it is. But in the end, its performance is also extremely dependent on the state of the overall economy.
At the end of each month, he compared the latest reading for The Conference Board Leading Economic Indicators Index (LEI) to its 18-month average to measure the economy.
- If the latest reading is ABOVE the 18-month average, then the Economy is considered Favorable
- If the latest reading is BELOW the 18-month average, then the Economy is considered Unfavorable
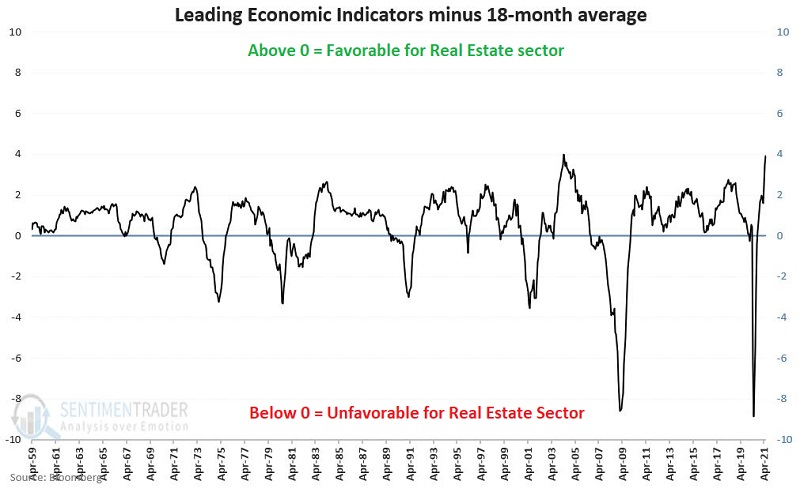
The chart below displays the cumulative growth of $1,000 invested in the S&P 500 Real Estate Sector Index ONLY during those months when the economy was deemed Favorable at the end of the preceding month.
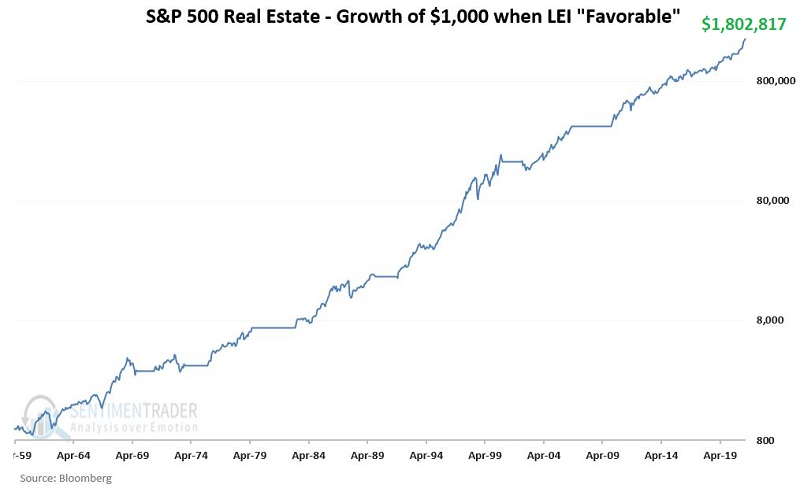
Out of 13 favorable periods, Real Estate showed a positive return 11 times, with an average gain of 89%, versus an essentially flat return during unfavorable periods. Since the LEI is still above its 18-month average and likely will be for some time, this is a tailwind for the Real Estate sector.
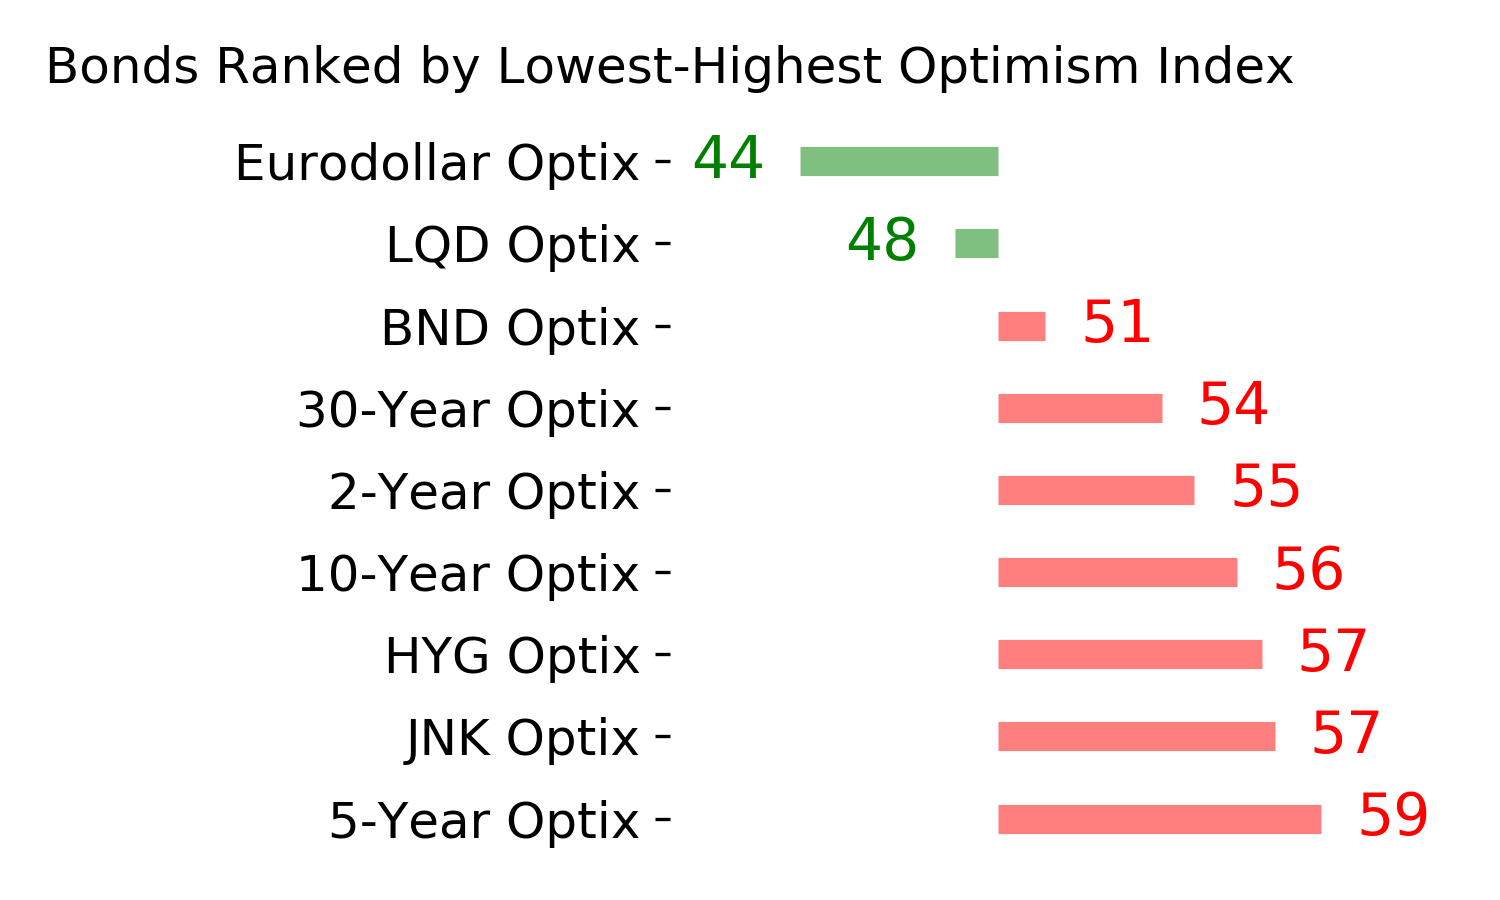
| BONDS |
|  |
|
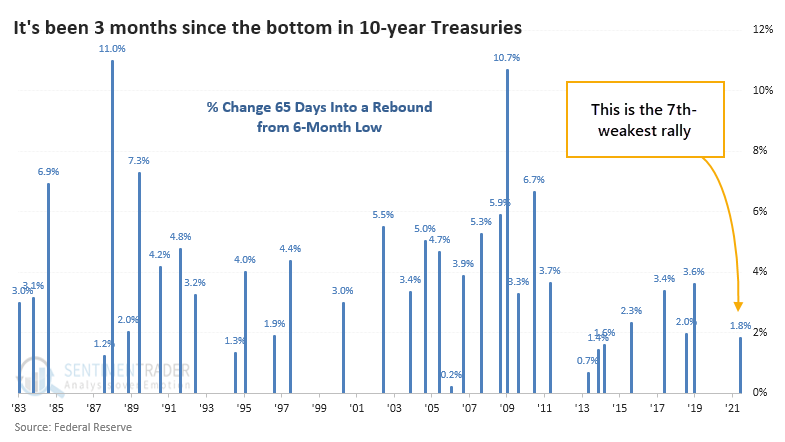
The imminent return of inflation has quieted down quite a bit in recent weeks as economic data has been mixed and yields retreated from their highs. If yields are declining, that means note and bond prices are rising.
For 10-year Treasury notes, the rally off the bottom has gone 65 days. What's notable about this rally, though, is that it has a 'dead cat' feel to it. Note prices haven't even bounced 2% from the low, making it the 7th-weakest rally since futures began trading 30 years ago.
As for what this might mean, the table below shows every time when 10-year notes rallied for 65 days off of a 6-month low, but with a price gain of less than 3%.
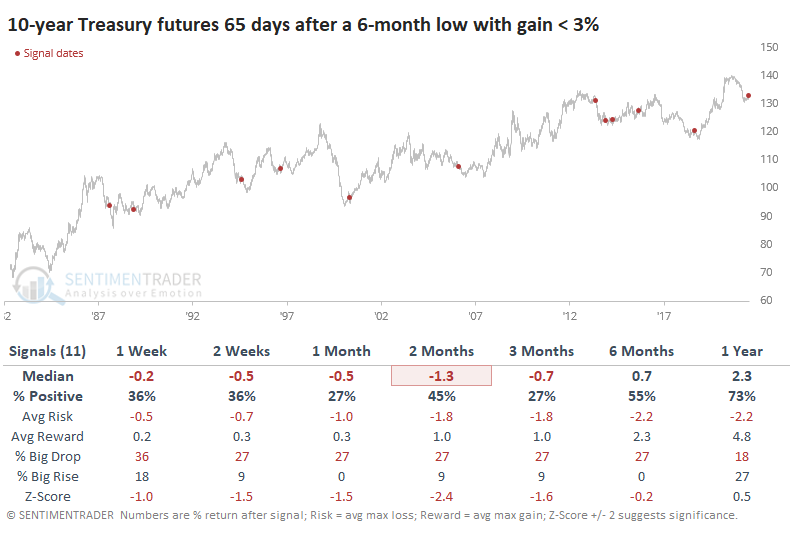
When we contrast that to times when notes had stronger rallies, at least 3.5%, then there was quite a big difference in forward returns.
Last week, Jay outlined a contrarian setup in bonds. That study showed some potential for weak short-term returns but stronger long-term ones, and this is further confirmation of that potential.
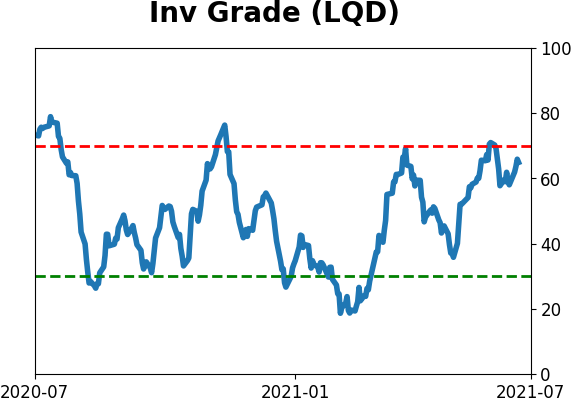
INVESTMENT-GRADE BOND BREADTH THRUST
Investment-grade bonds registered a new breadth thrust buy signal at the close of trading on Thursday, according to Dean. The signal now flips his investment-grade timing model to the long side after being on the sidelines since January.
In a nutshell, the corporate bond timing model uses market breadth data to identify trend changes in advance of price action alone. The investment-grade bond timing model is more sensitive to movements in treasury yields, whereas high-yield bonds will be more sensitive to economic/credit conditions. The recent decline in yields is playing a role in the new signal.
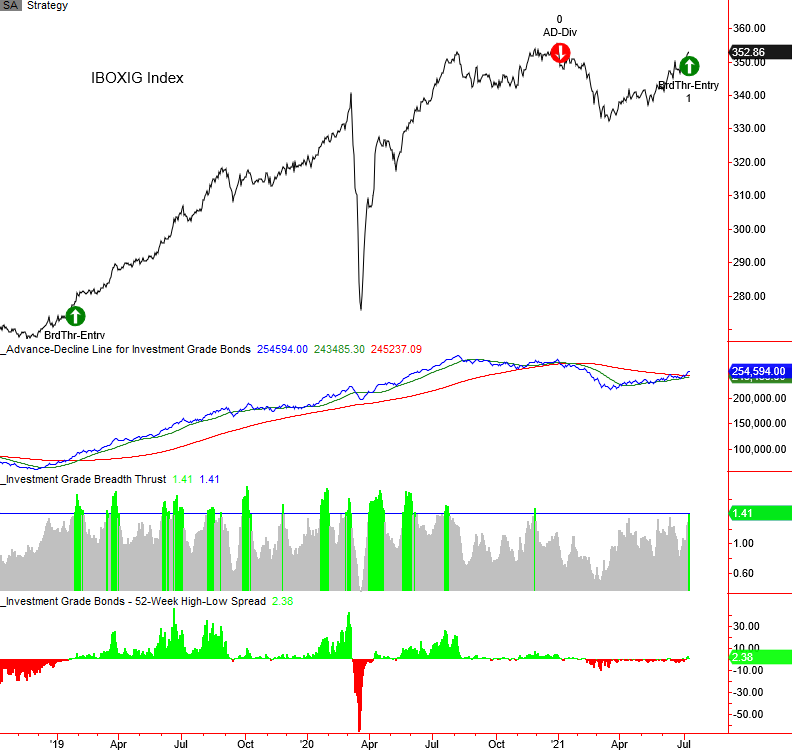
If we look at the buy signals on a standalone basis, they led to gains in investment-grade bond prices over the next 40 days after 10 out of 14 signals, with a heavily positive ratio of average gain to average loss.
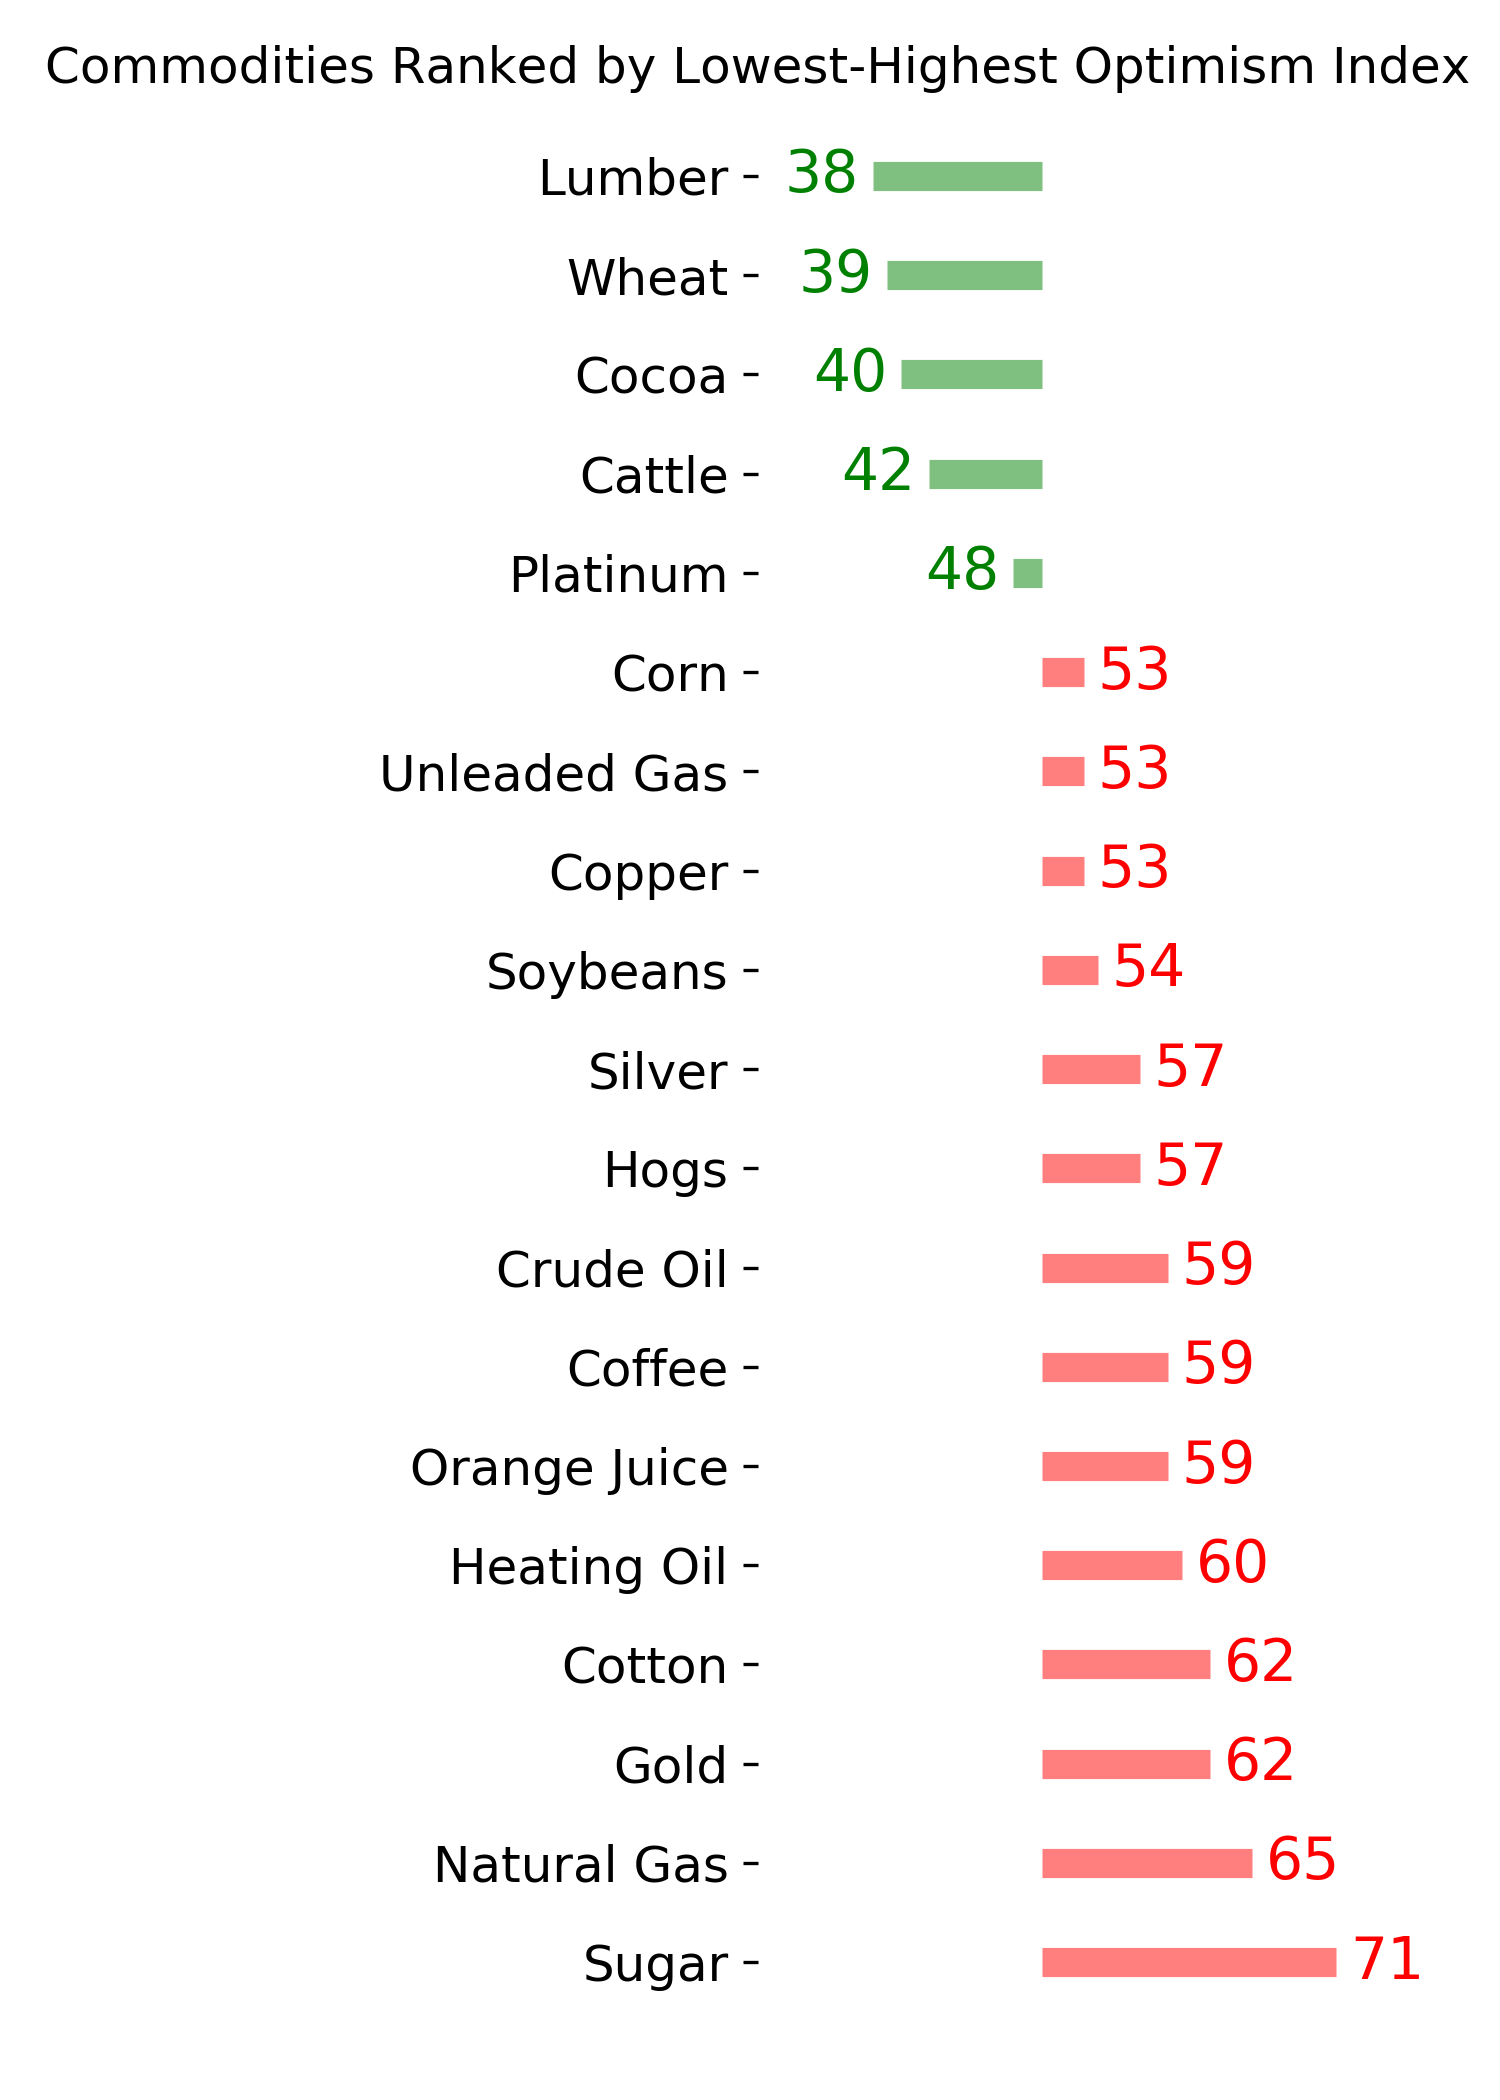
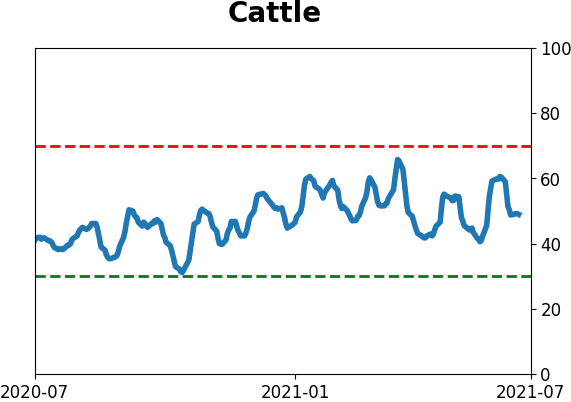
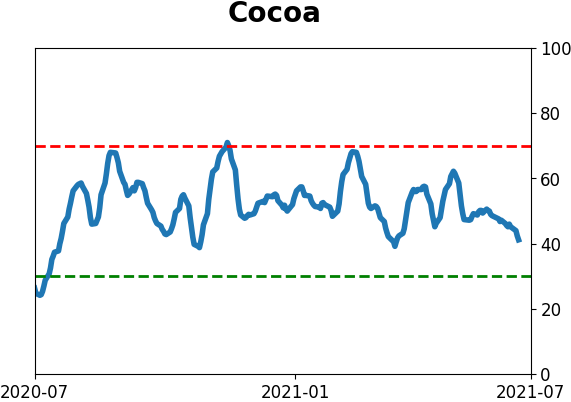
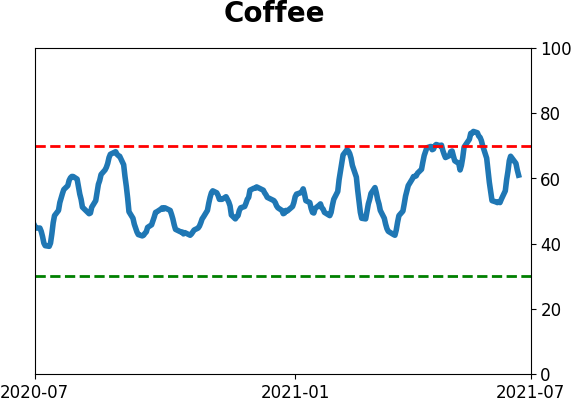
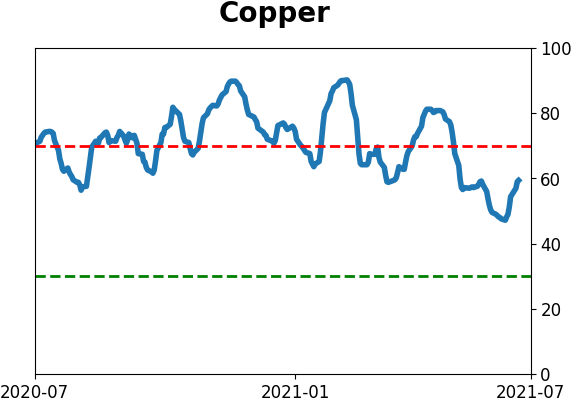
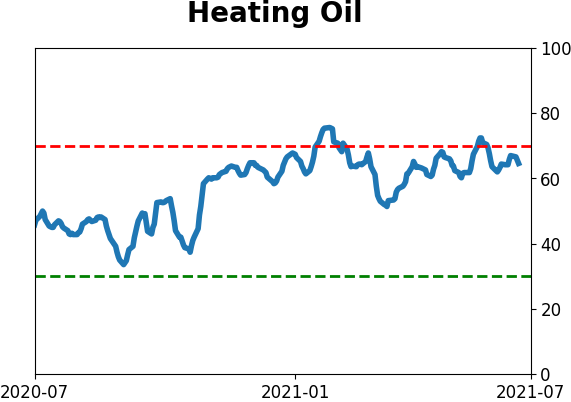
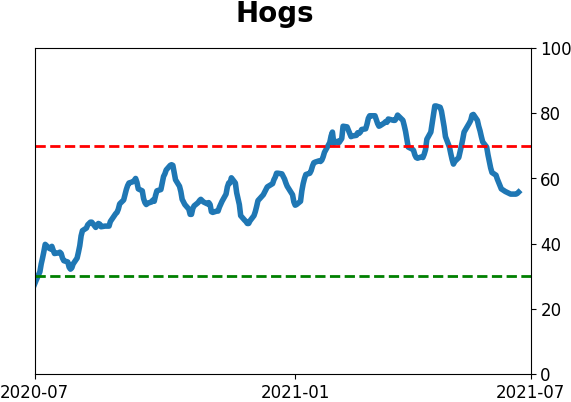
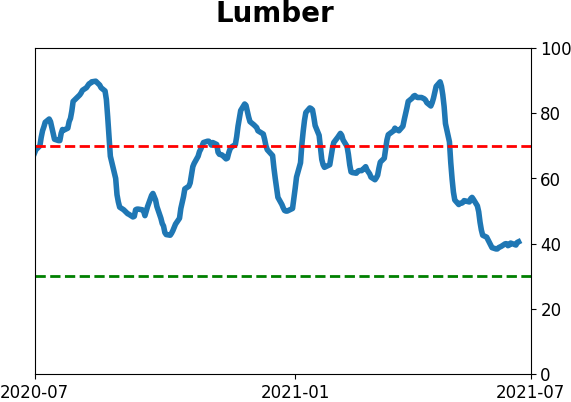
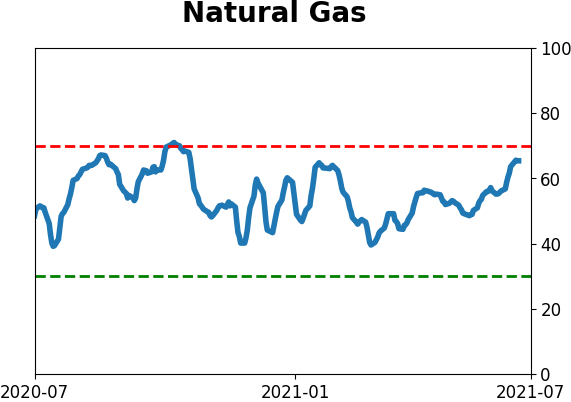
| COMMODITIES |
|  |
|
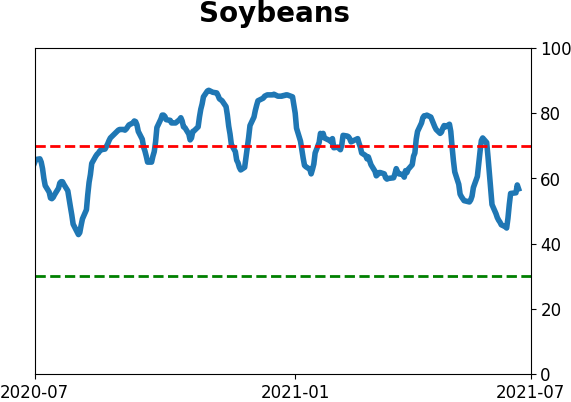
Jay shined a light on soybeans.
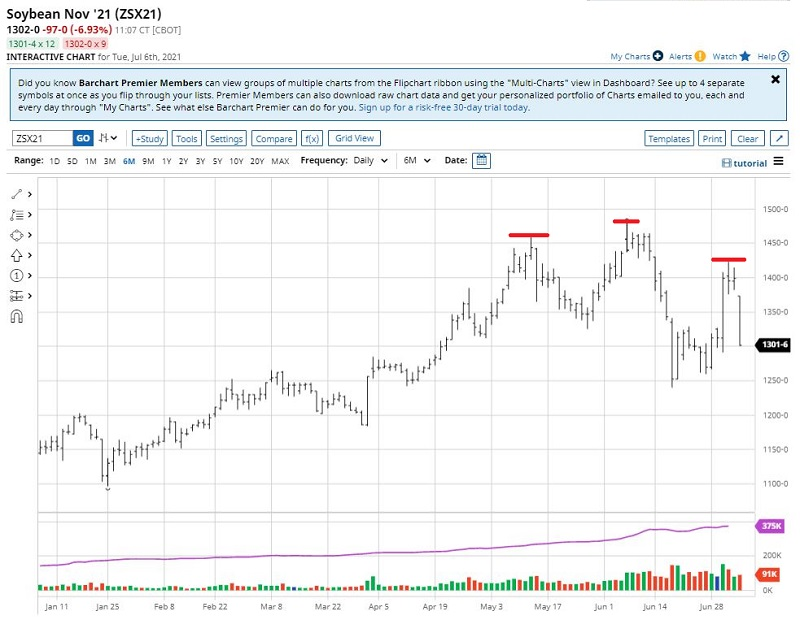
Let's start with the good news. The November soybean futures contract is in an established uptrend above a rising 200-day moving average. But there are other reasons to maybe not pile into the long side of beans at the moment.
The chart below (courtesy: Barchart.com) displays a daily bar chart for November 2021 soybean futures. Some traders may see a potential head-and-shoulders pattern forming. If nothing else, price tried hard to rally last week, and that rally has failed to follow through. Prices are collapsing in the short term.
The chart below displays the Annual Seasonal Trend for soybeans.
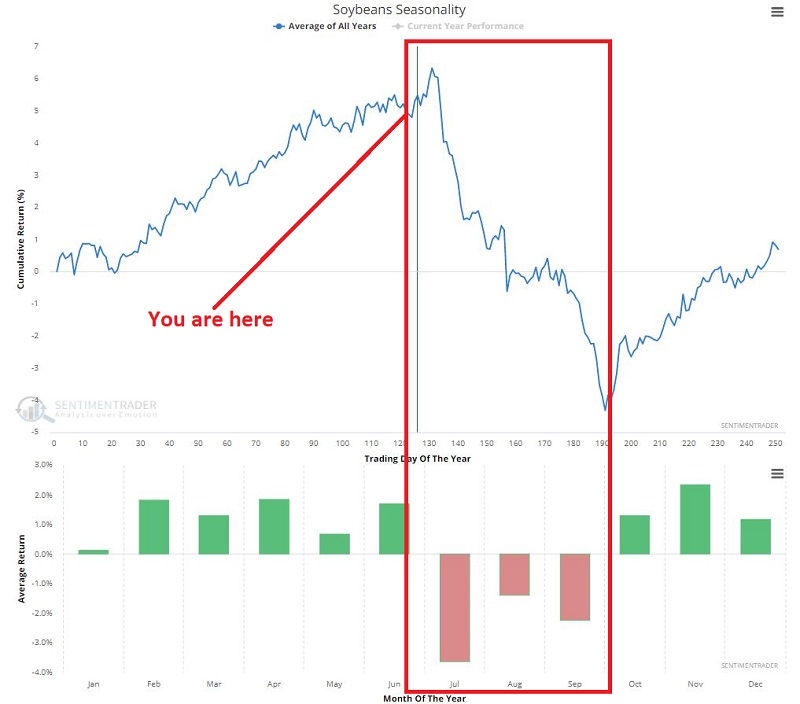
The implications in the chart above are pretty straightforward. July has historically been the worst month for beans, and in fact, July, August, AND September have all showed historical weakness.
Since 1959, from Trading Day of the Year #132 through #191, beans showed:
- A gain 19 times (31% of the time)
- A median gain of +$1,938
- A median loss of -$3,625
There is no reason soybeans cannot continue their current trend and move higher in the months ahead. But for a trader looking to put the odds on their side, it should be noted that we are entering a period when seasonal headwinds can offer a formidable opposing force. In the worst case, if the normal seasonal trend asserts itself, the current decline could be merely a prelude of things to come.
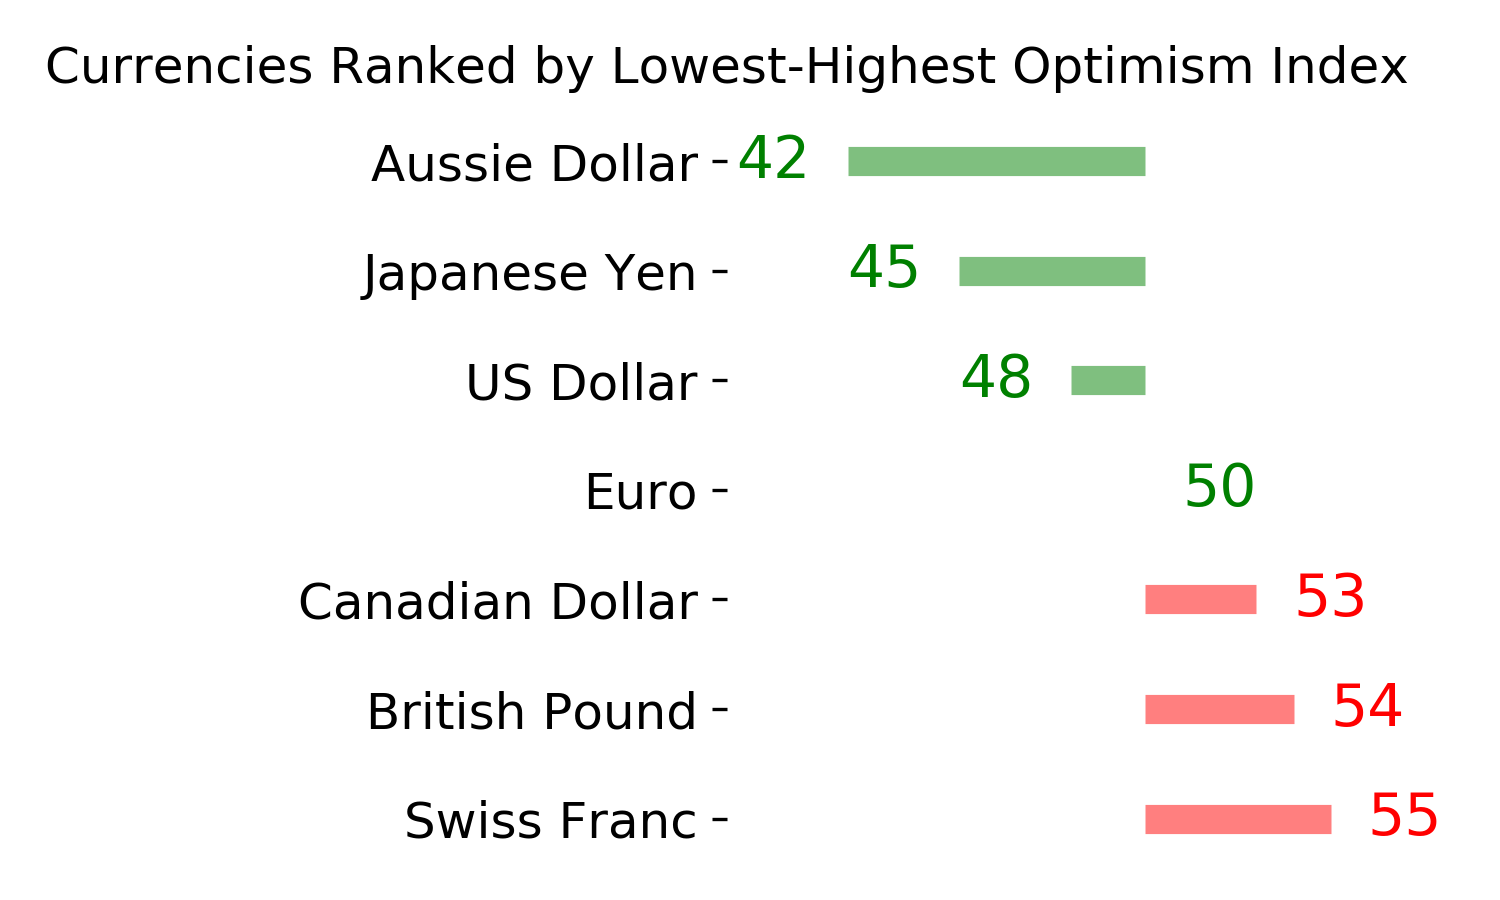
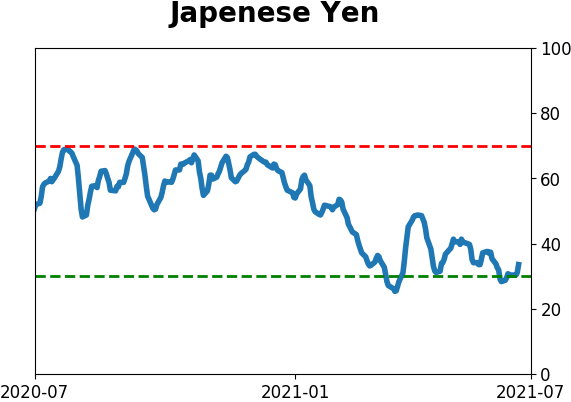
YEN SEASONALITY
Jay also noted that the Annual Seasonal Trend for the Japanese Yen is generally positive through the summer and fall months. For example, the chart below displays the year-by-year $ gain/loss for yen futures held long during the favorable period every year since 1976, from Trading Day of the Year (TDY) #135 through day #203.
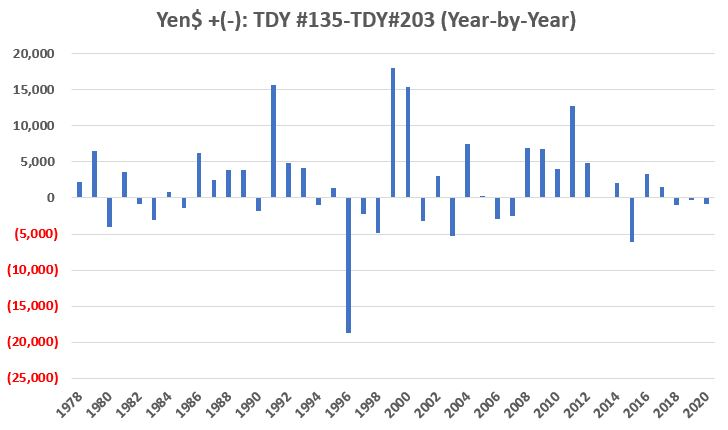
The yen showed a gain during 60% of the years, with an average $ gain of +$5,462 versus an average $ loss of -$3,542. Nothing is certain, of course, but the coming months have been a tailwind for the yen.
Active Studies
| Time Frame | Bullish | Bearish | | Short-Term | 0 | 1 | | Medium-Term | 2 | 2 | | Long-Term | 9 | 5 |
|
Indicators at Extremes
Portfolio
| Position | Description | Weight % | Added / Reduced | Date | | Stocks | RSP | 4.1 | Added 4.1% | 2021-05-19 | | Bonds | 23.9% BND, 6.9% SCHP | 30.7 | Reduced 7.1% | 2021-05-19 | | Commodities | GCC | 2.6 | Reduced 2.1%
| 2020-09-04 | | Precious Metals | GDX | 5.6 | Reduced 4.2% | 2021-05-19 | | Special Situations | 4.3% XLE, 2.2% PSCE | 7.6 | Reduced 5.6% | 2021-04-22 | | Cash | | 49.4 | | |
|
Updates (Changes made today are underlined)
Much of our momentum and trend work has remained positive for several months, with some scattered exceptions. Almost all sentiment-related work has shown a poor risk/reward ratio for stocks, especially as speculation drove to record highs in exuberance in February. Much of that has worn off, and most of our models are back toward neutral levels. There isn't much to be excited about here. The same goes for bonds and even gold. Gold has been performing well lately and is back above long-term trend lines. The issue is that it has a poor record of holding onto gains when attempting a long-term trend change like this, so we'll take a wait-and-see approach. RETURN YTD: 9.3% 2020: 8.1%, 2019: 12.6%, 2018: 0.6%, 2017: 3.8%, 2016: 17.1%, 2015: 9.2%, 2014: 14.5%, 2013: 2.2%, 2012: 10.8%, 2011: 16.5%, 2010: 15.3%, 2009: 23.9%, 2008: 16.2%, 2007: 7.8%
|
|
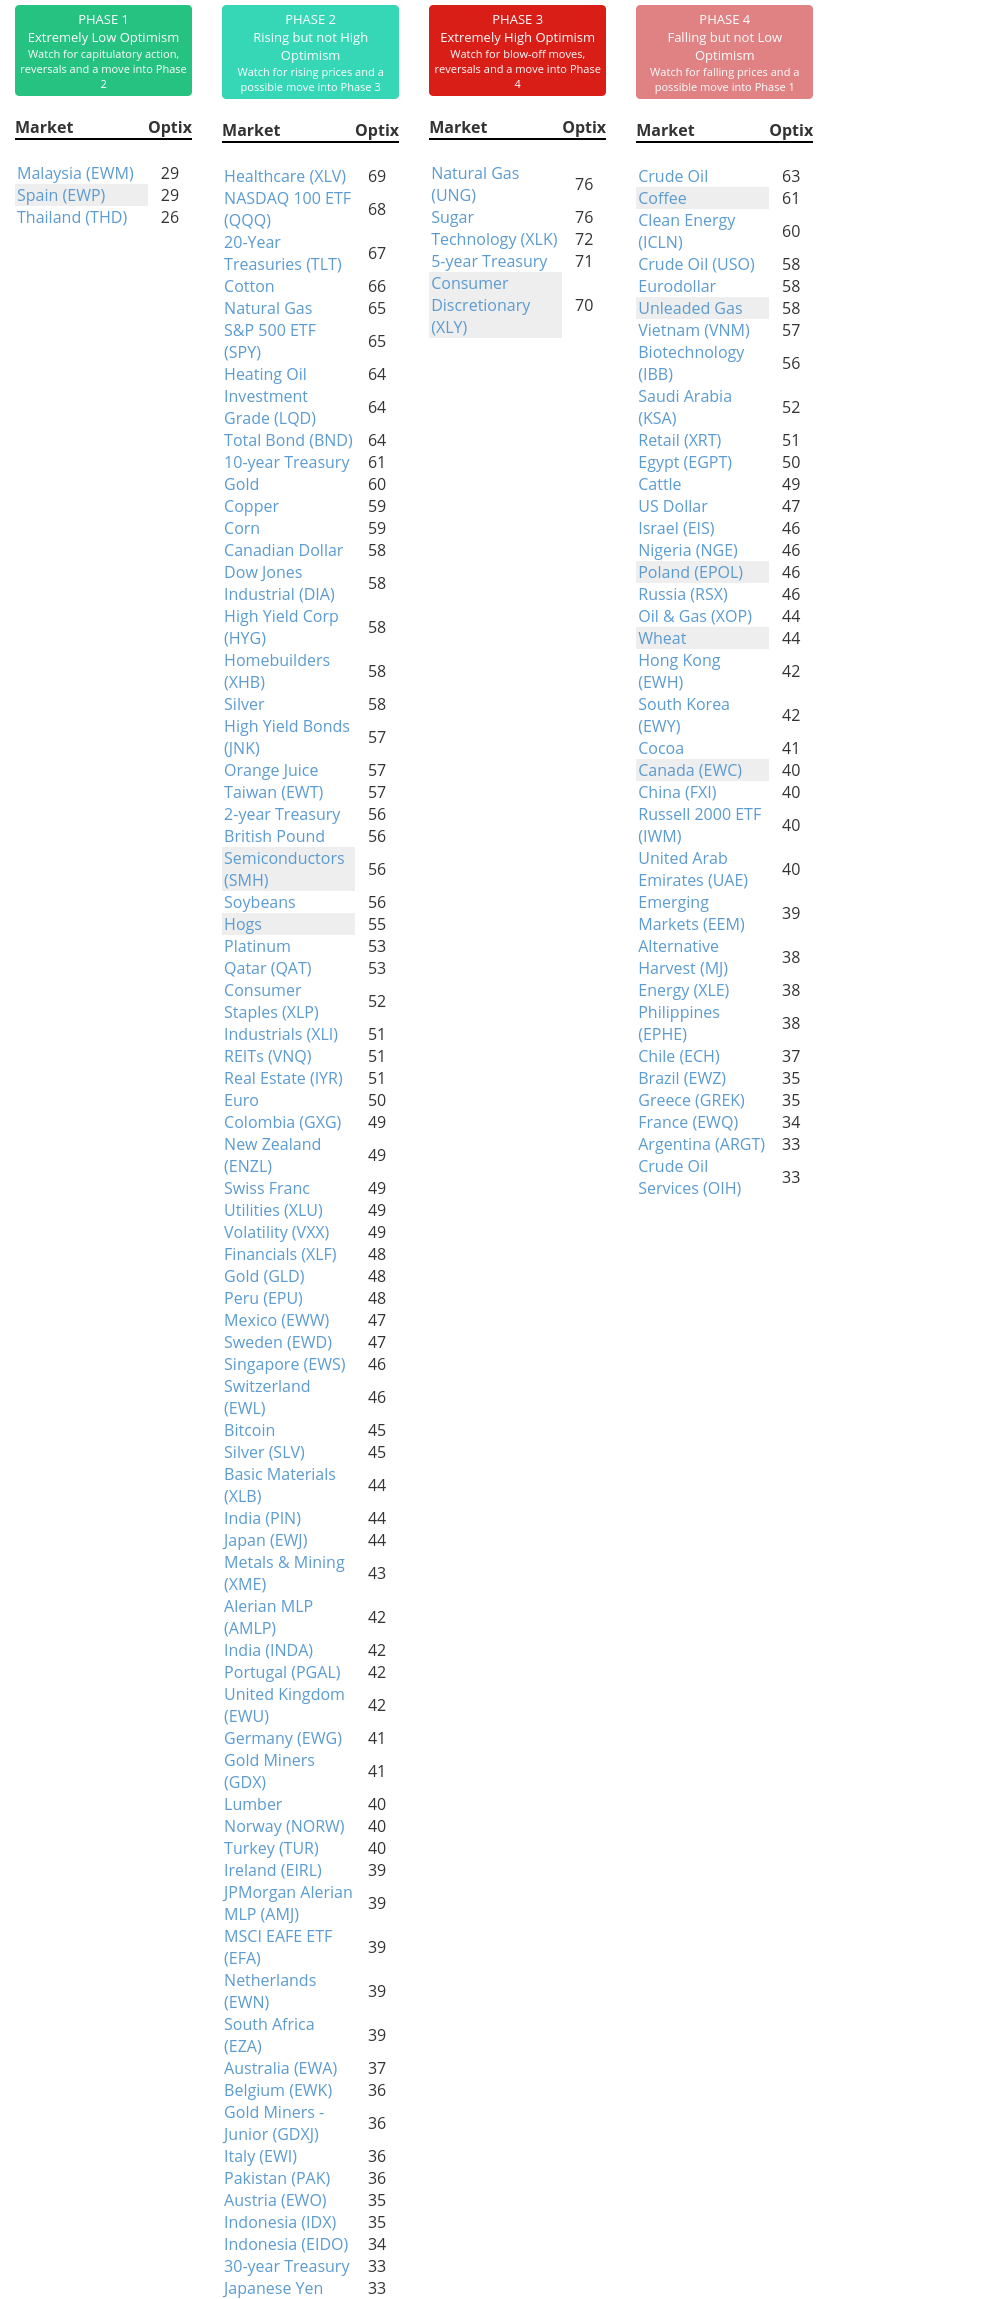
Phase Table
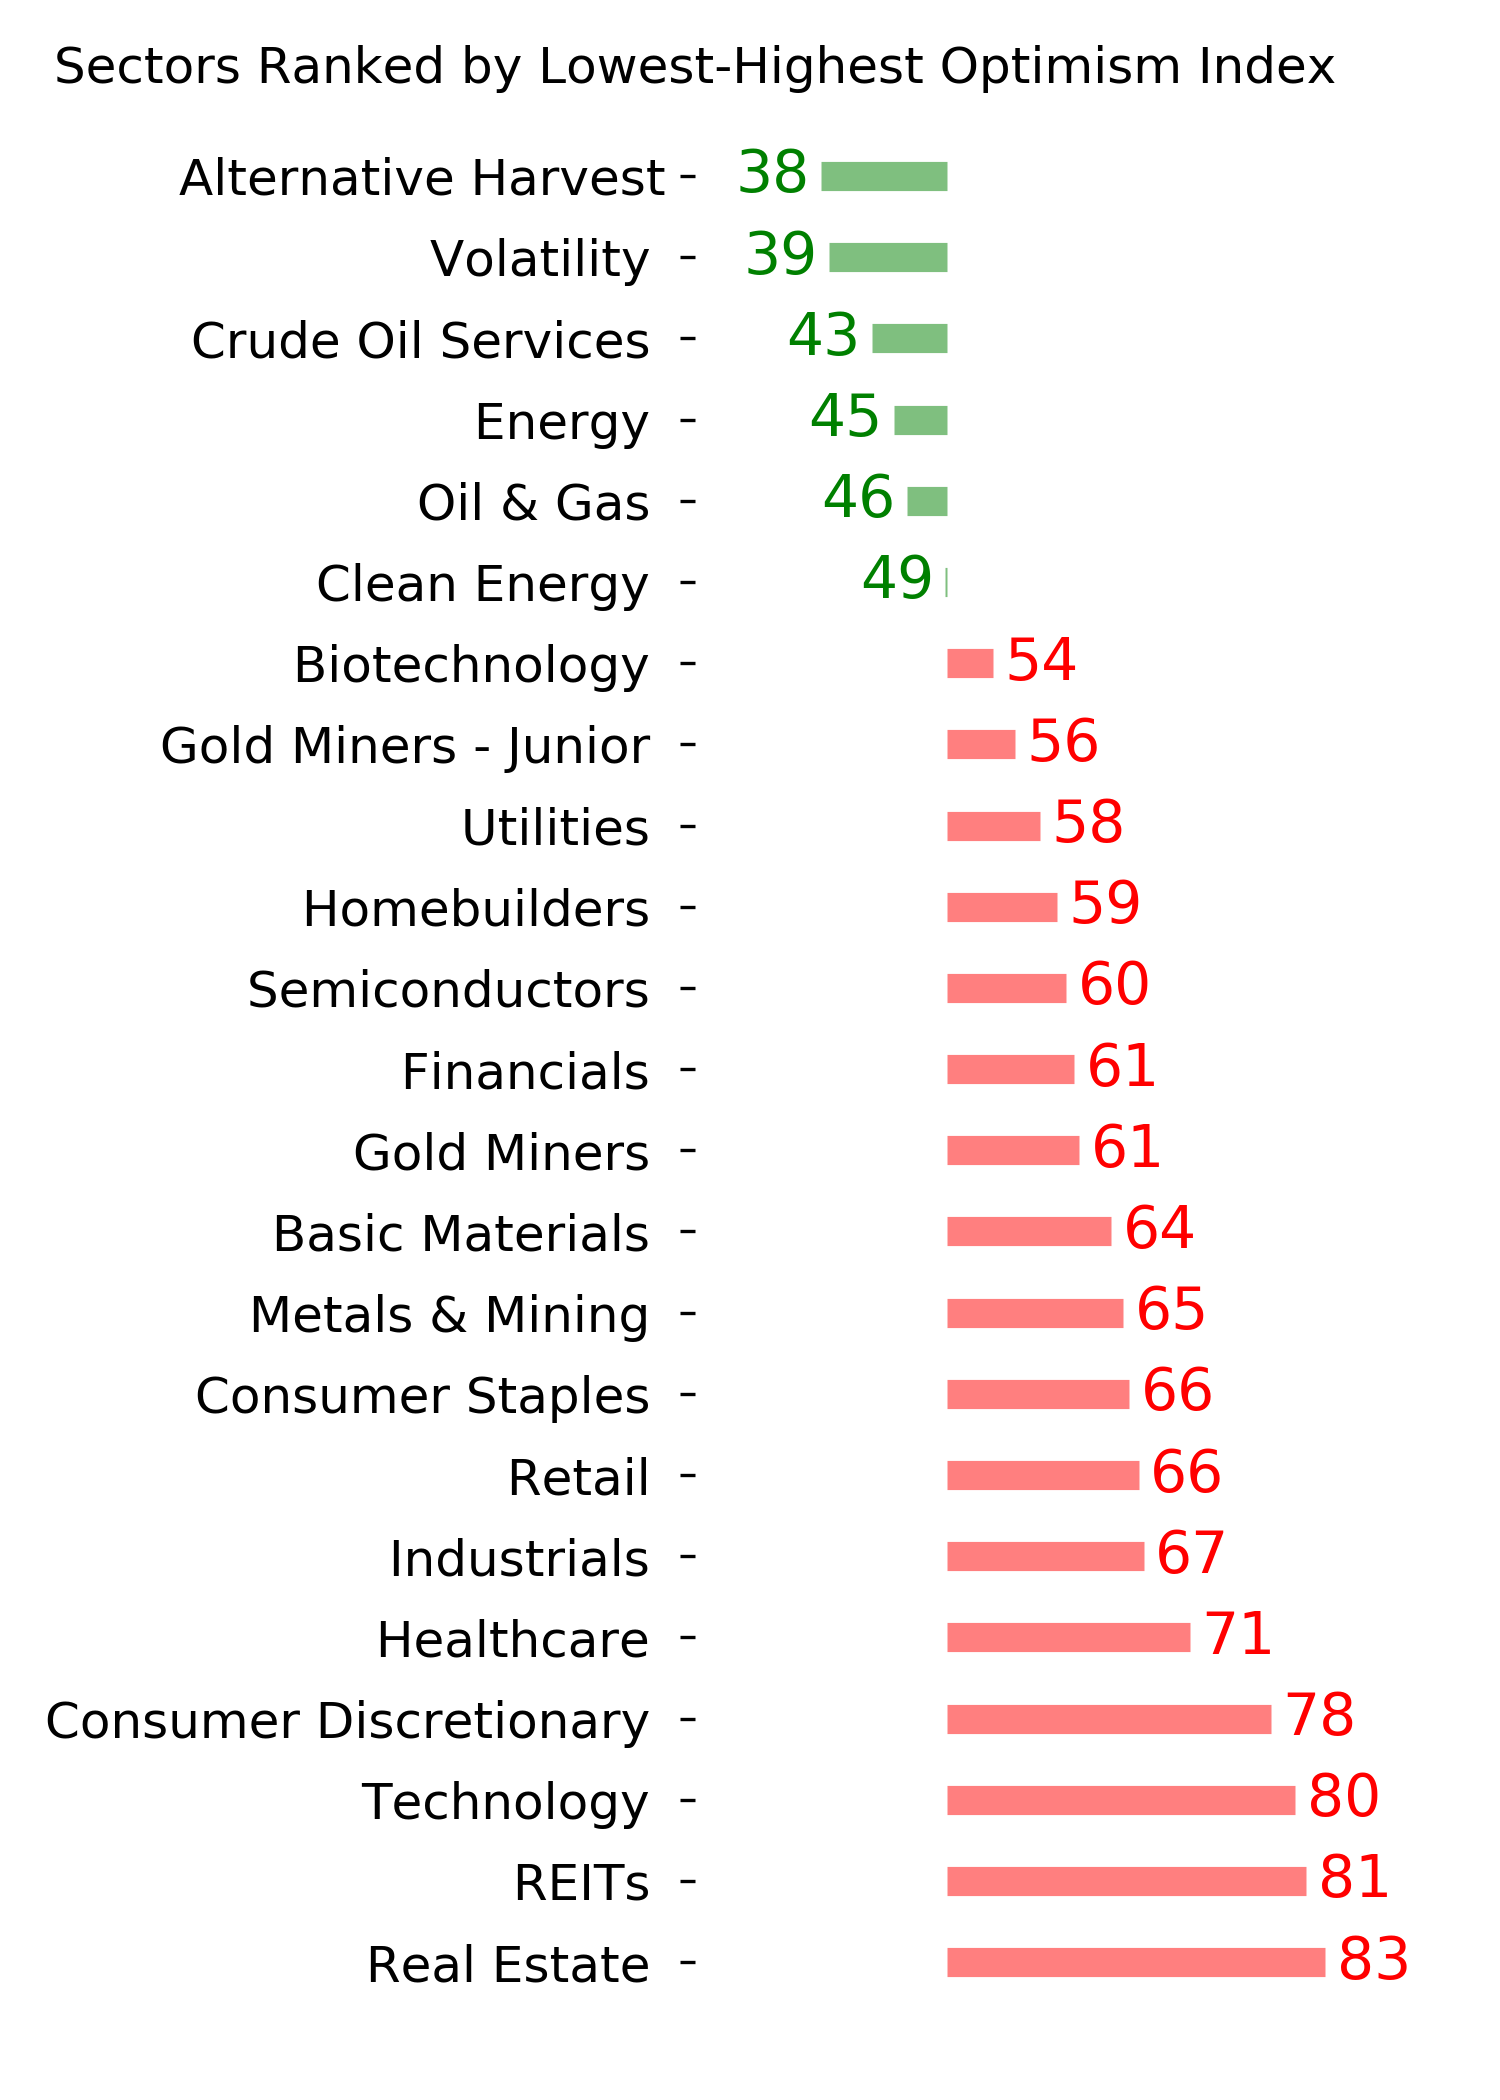
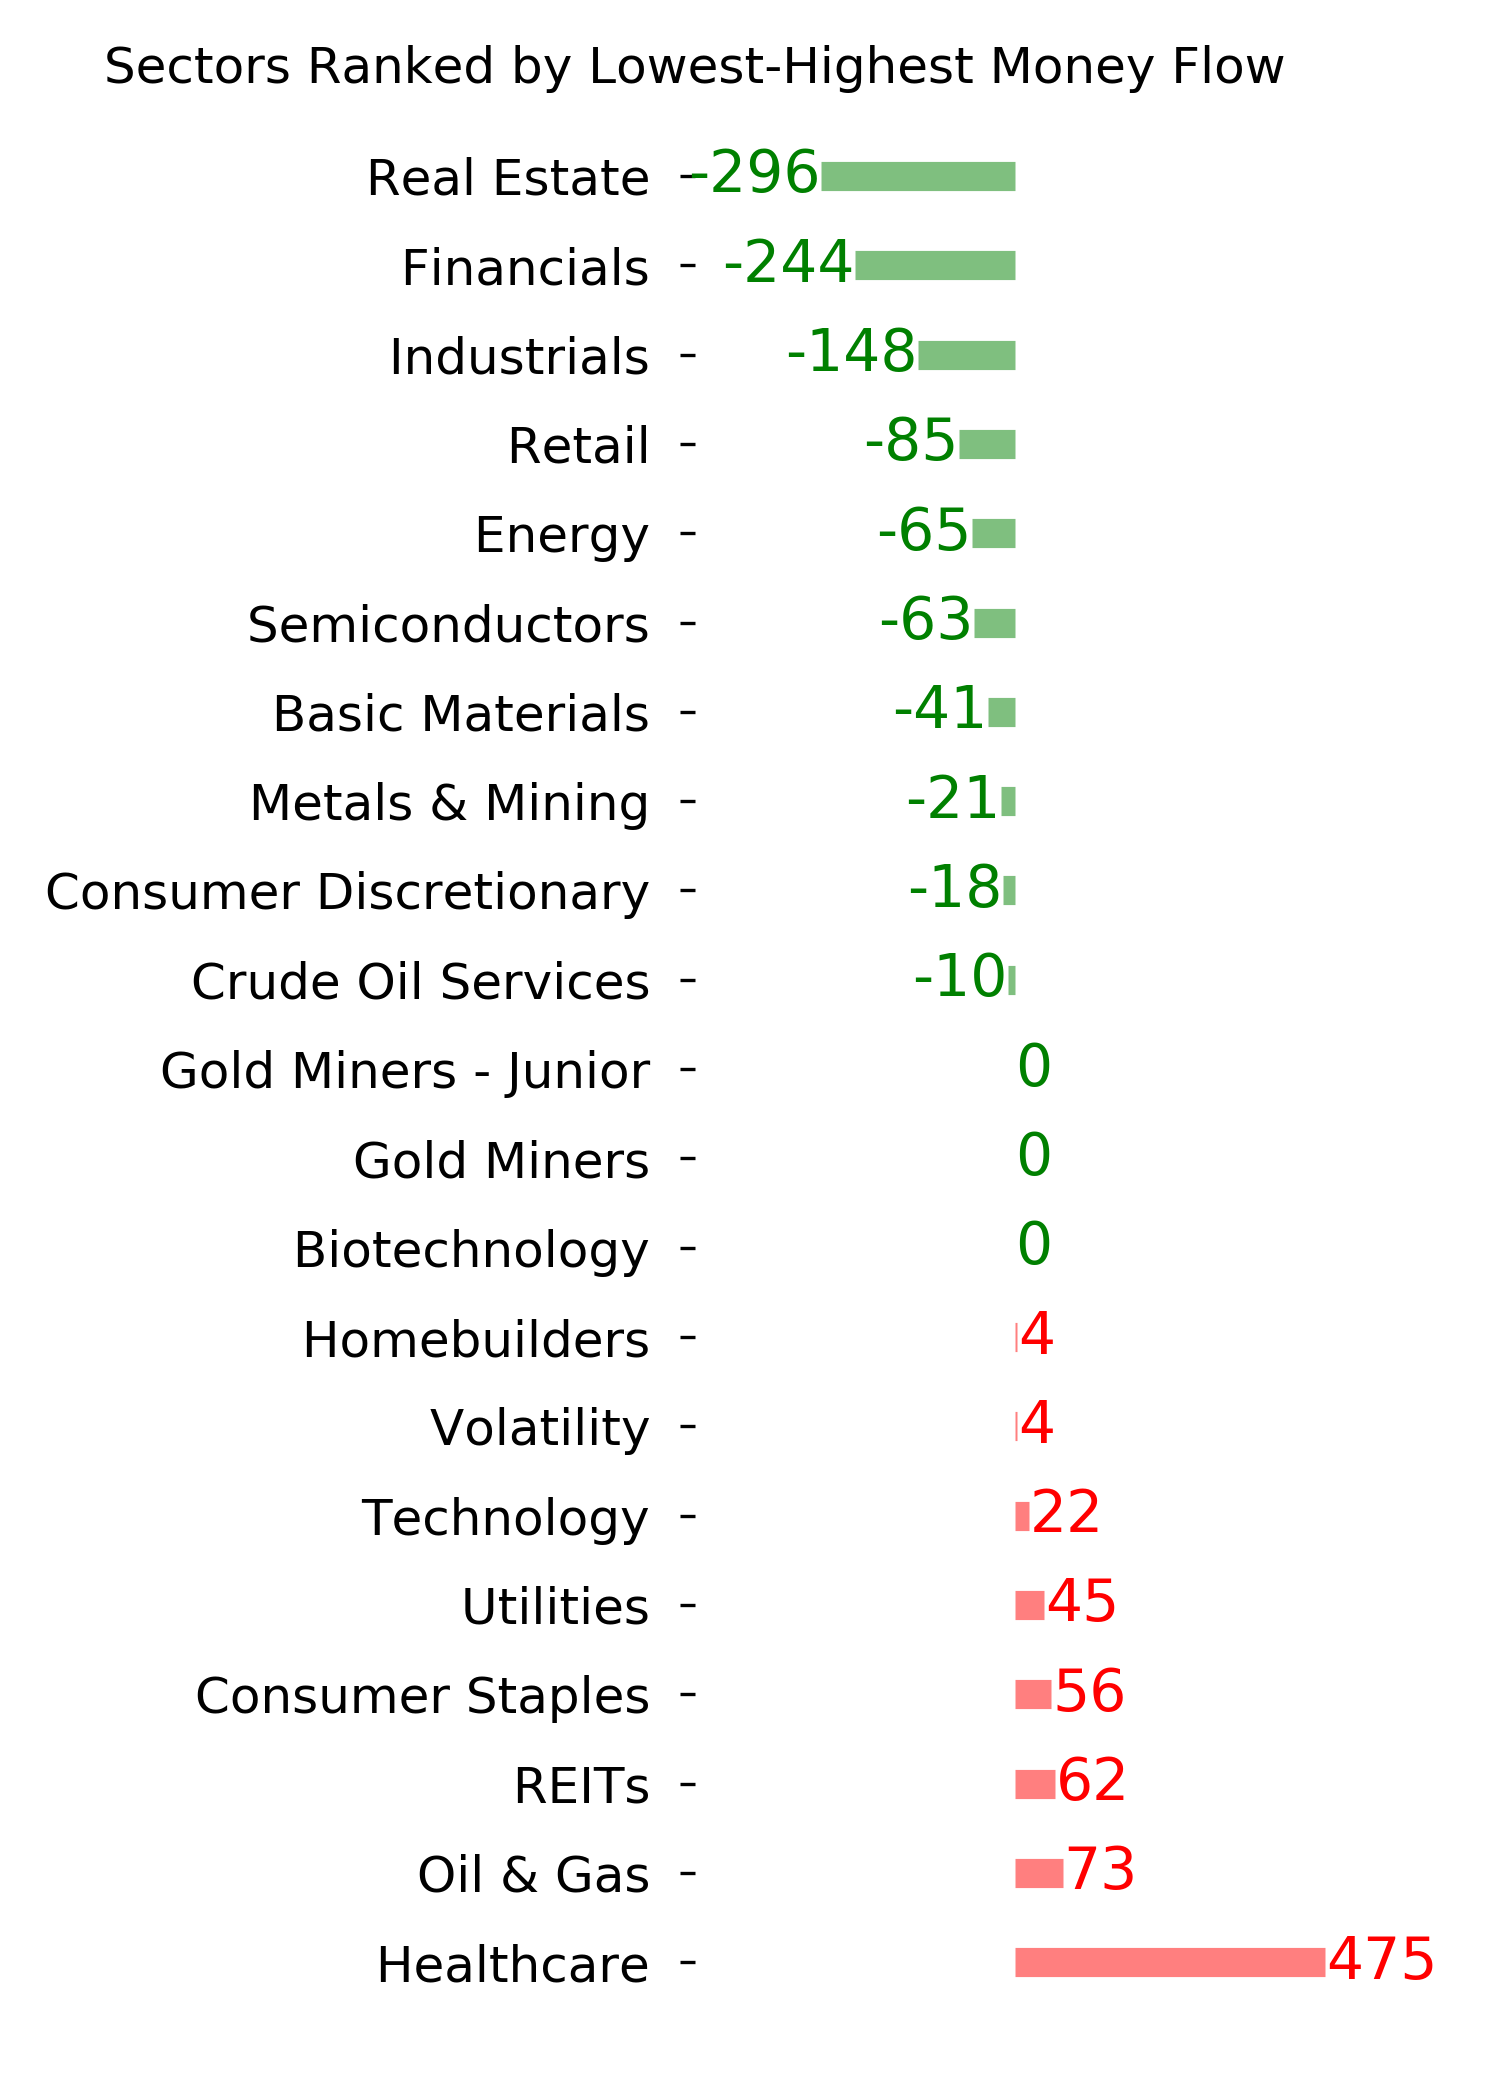
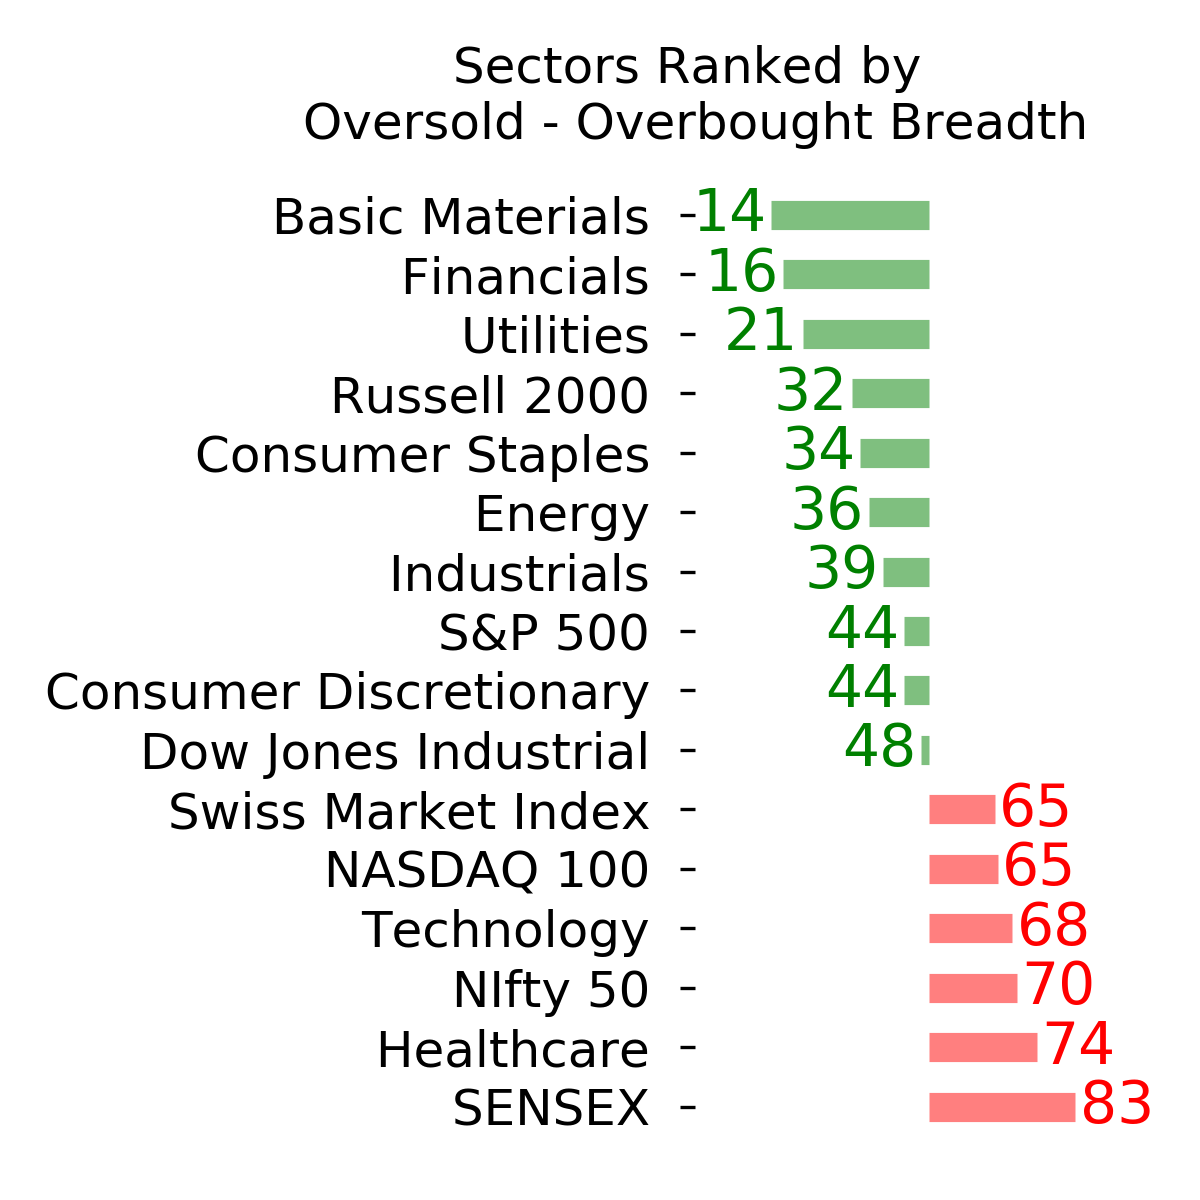
Ranks
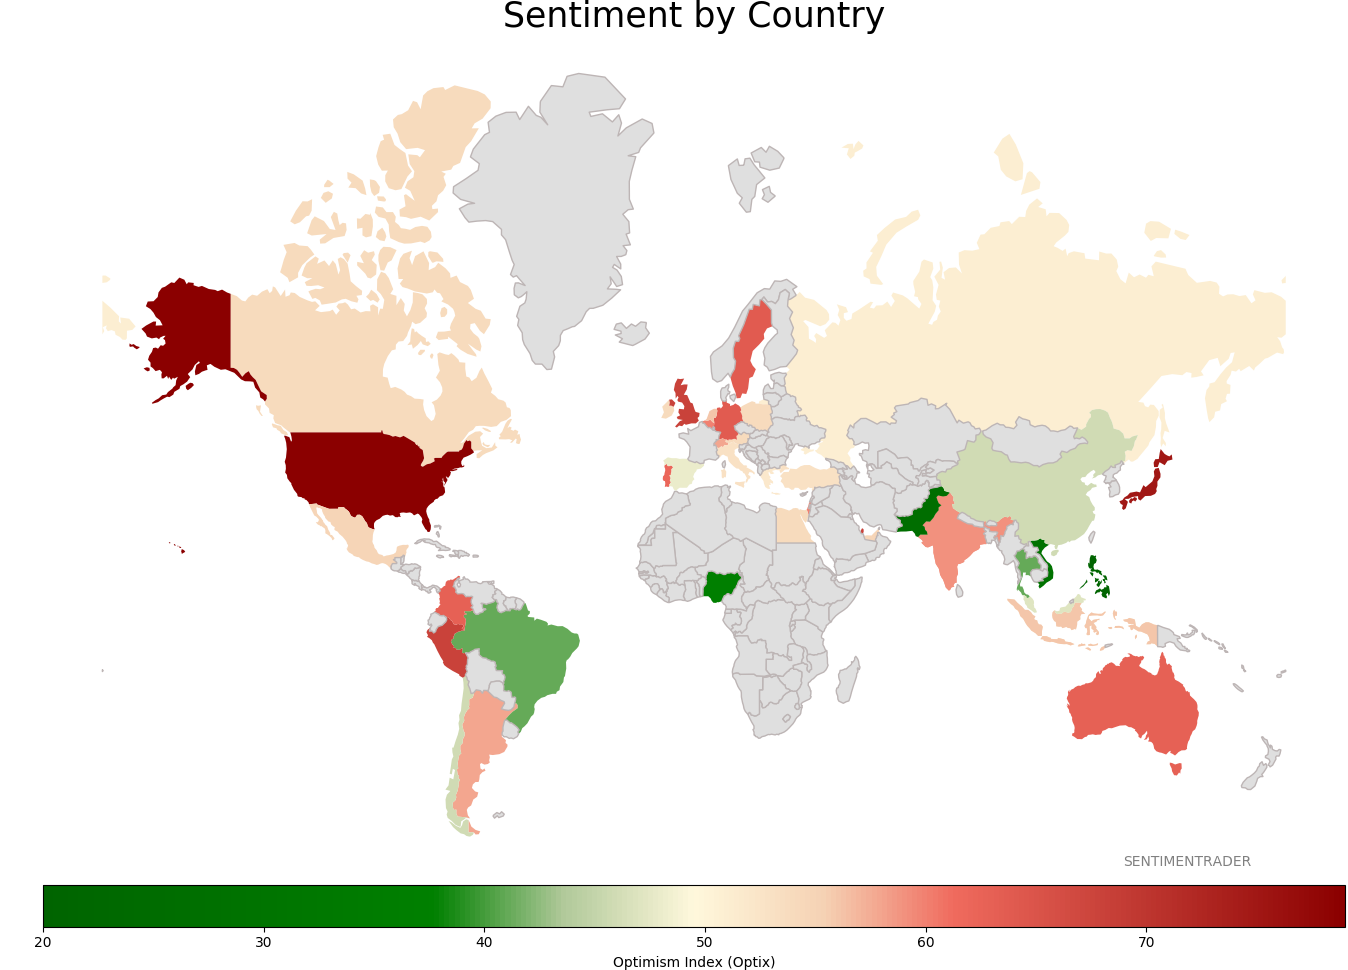
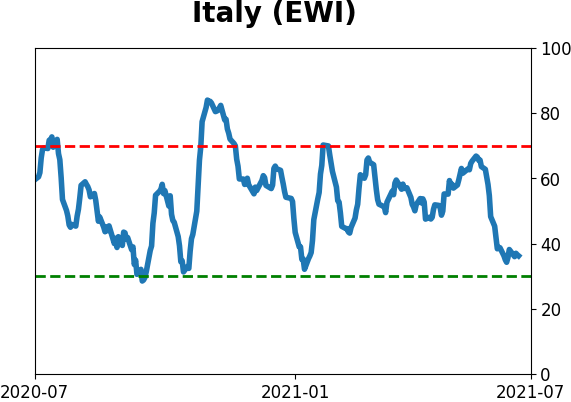
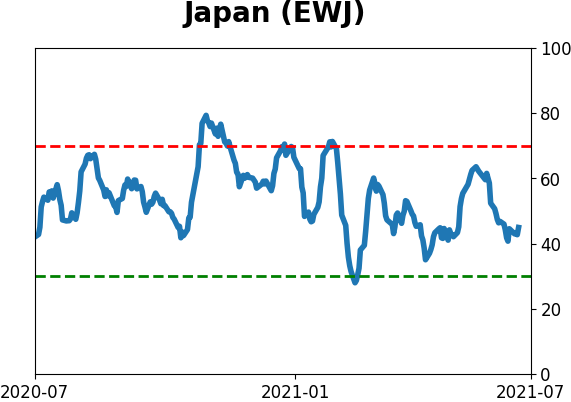
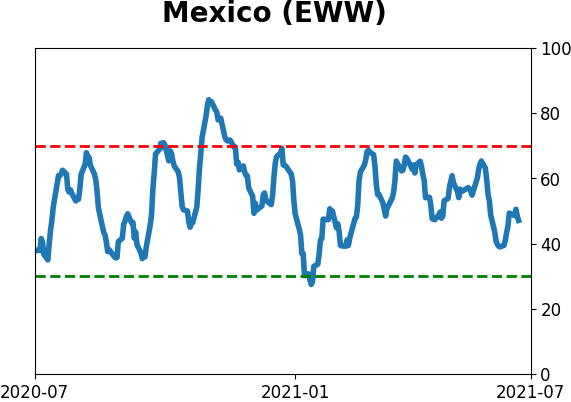
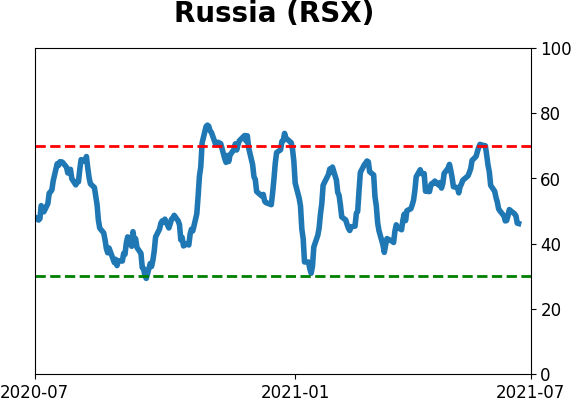
Sentiment Around The World
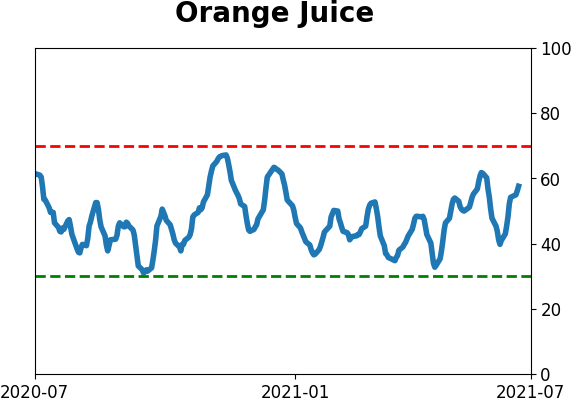
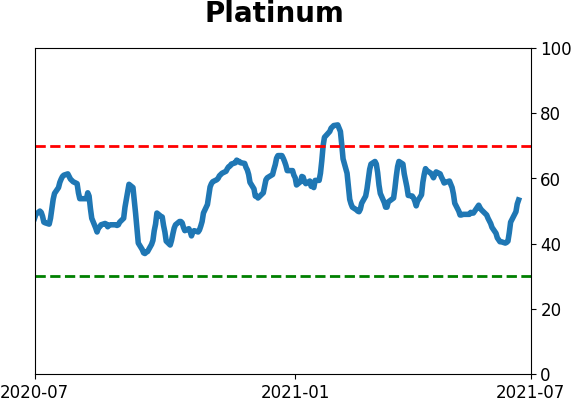
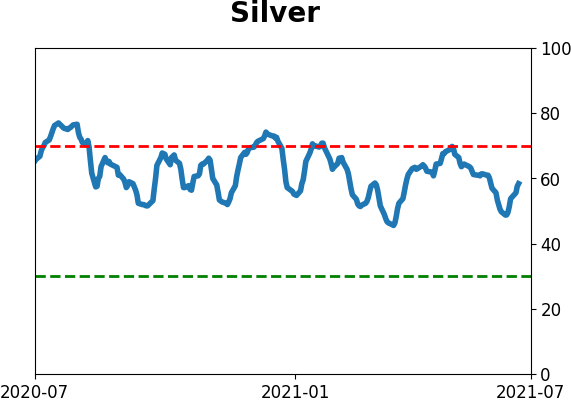
Optimism Index Thumbnails
|
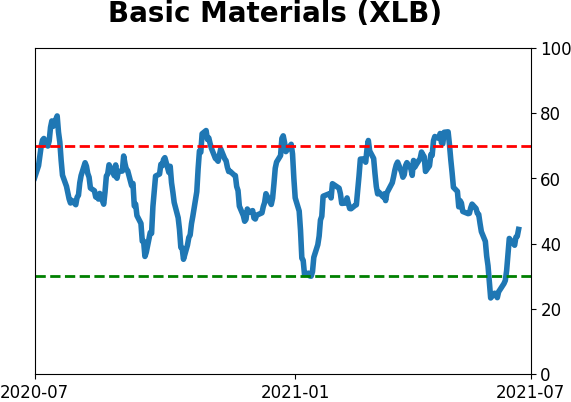
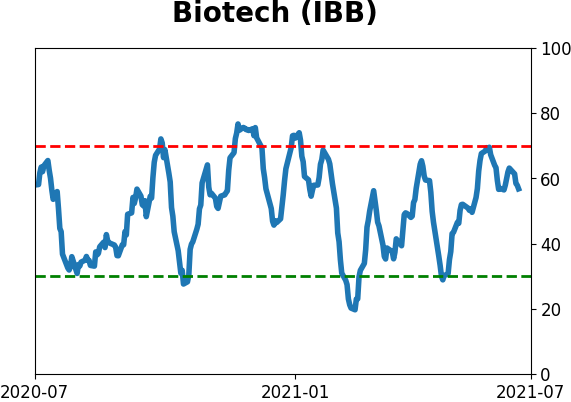
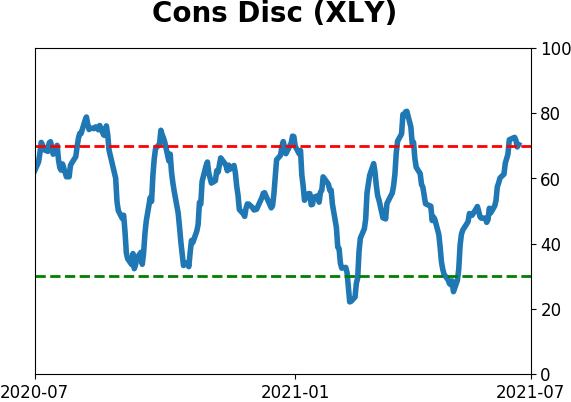
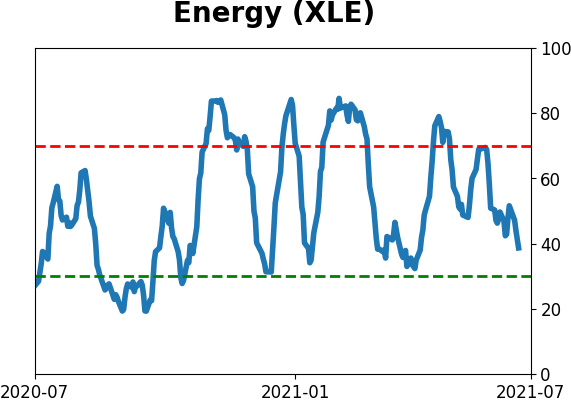
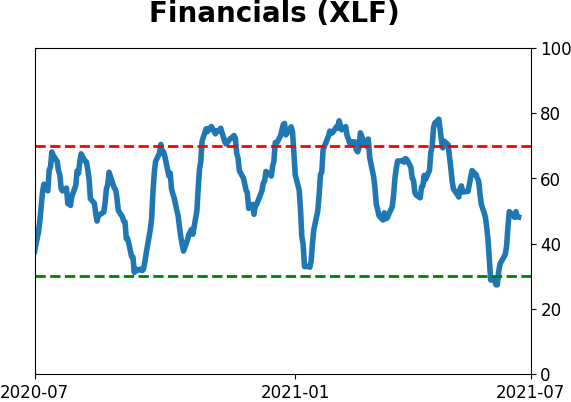
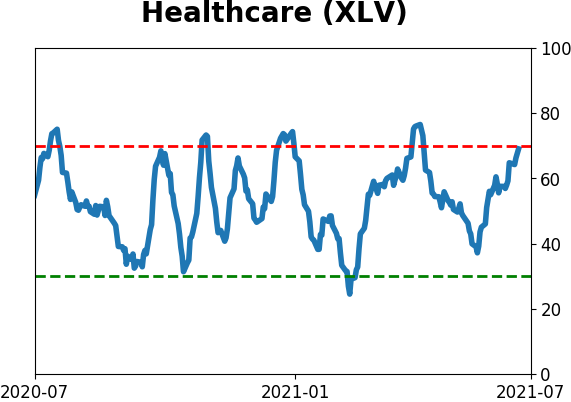
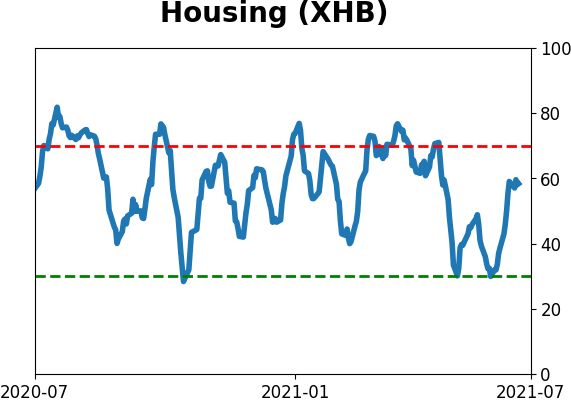
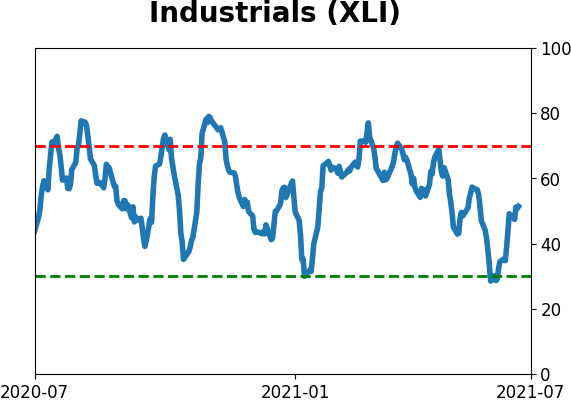
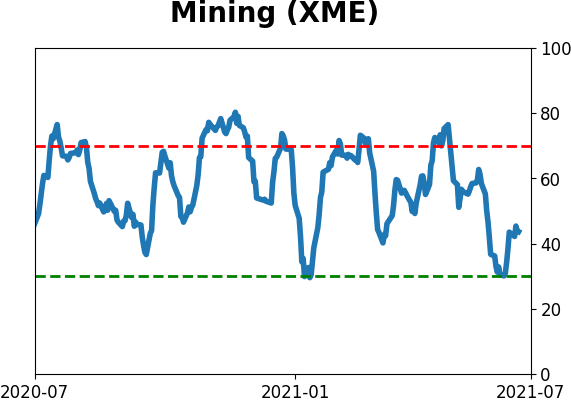
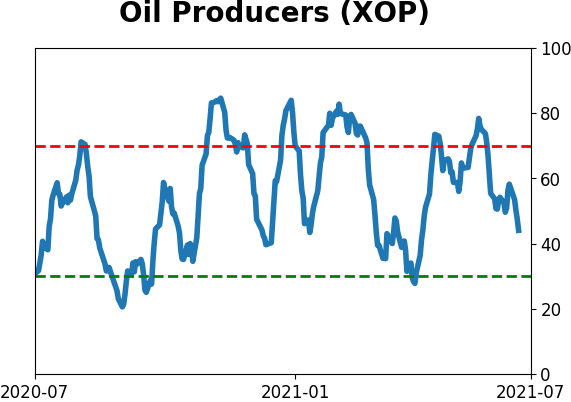
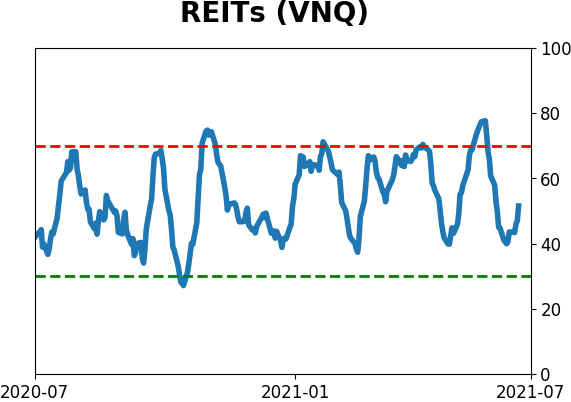
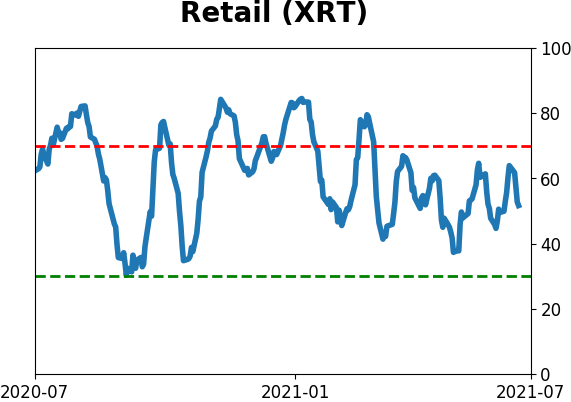
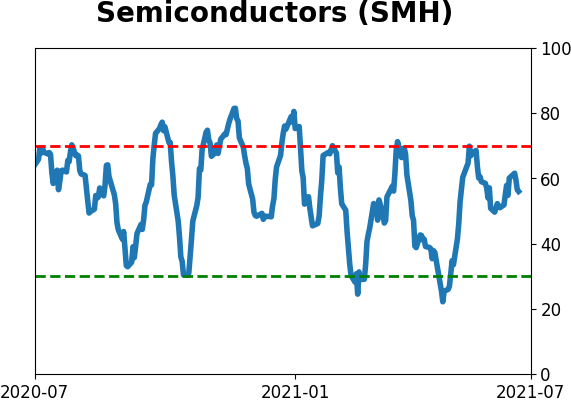
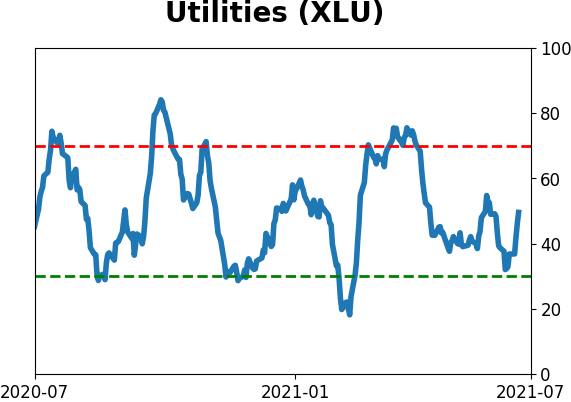
Sector ETF's - 10-Day Moving Average
|
|
|
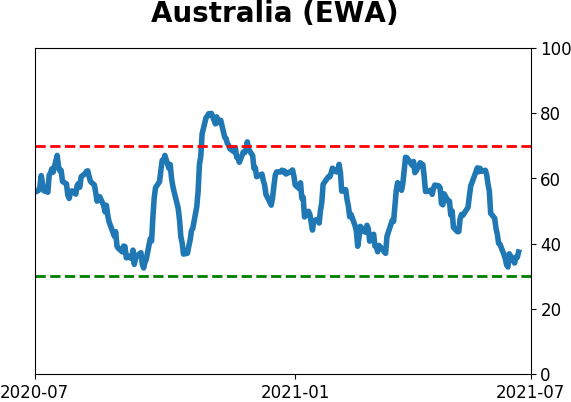
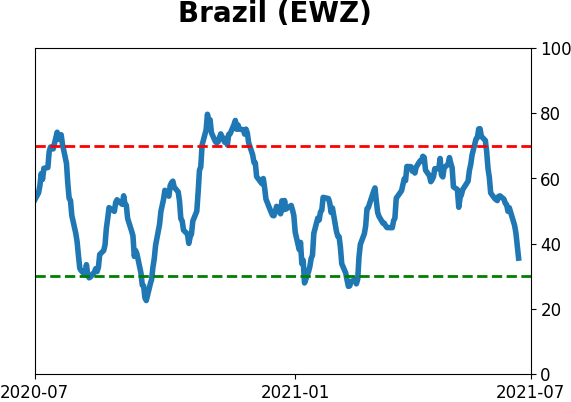
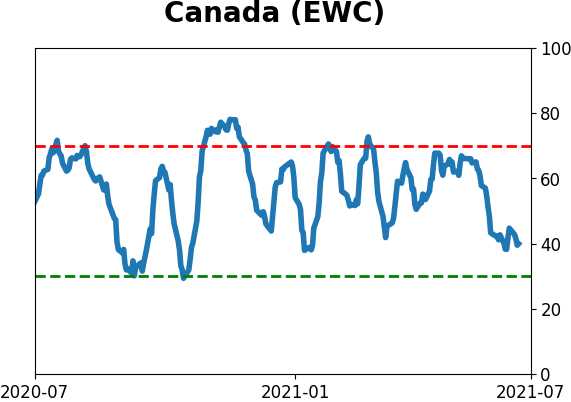
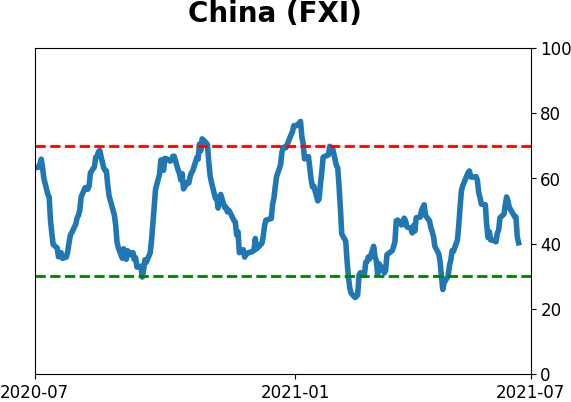
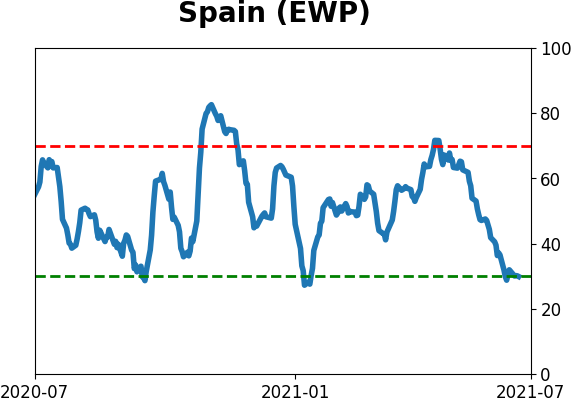
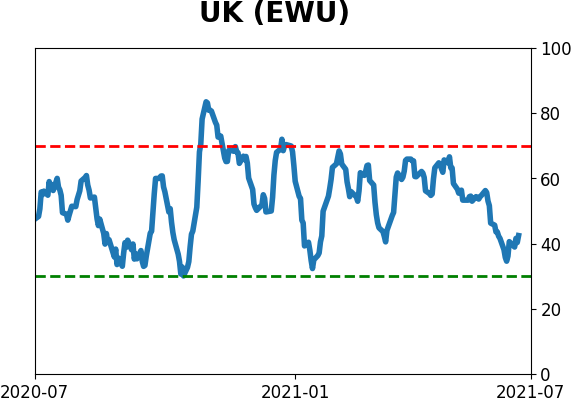
Country ETF's - 10-Day Moving Average
|
|
|
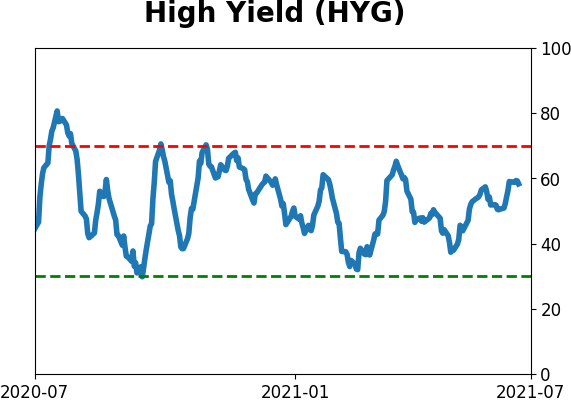
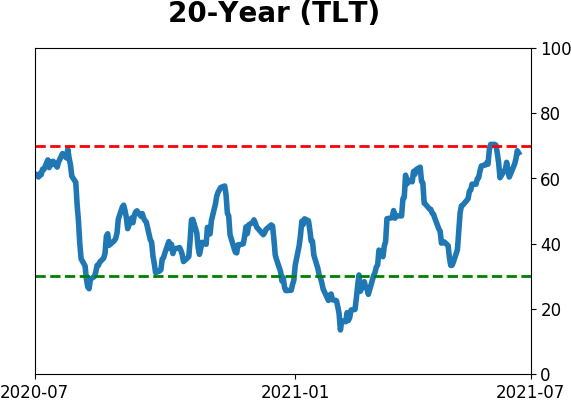
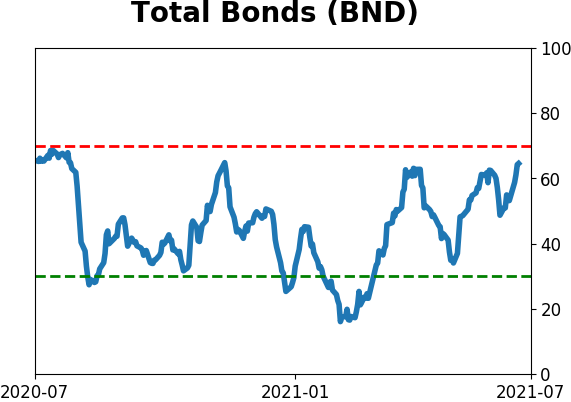
Bond ETF's - 10-Day Moving Average
|
|
|
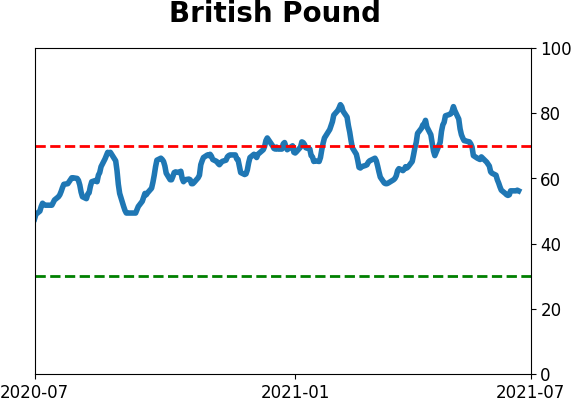
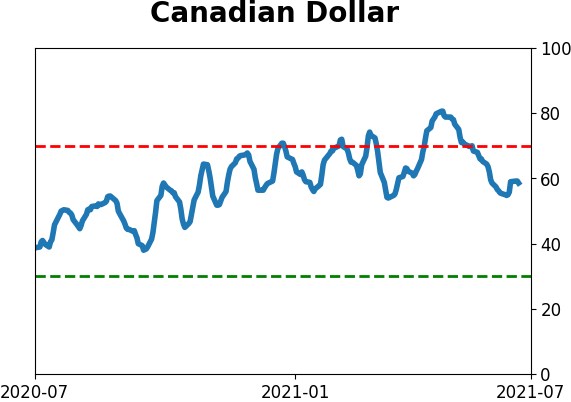
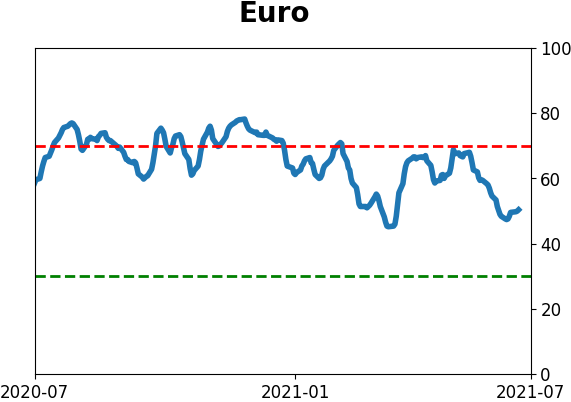
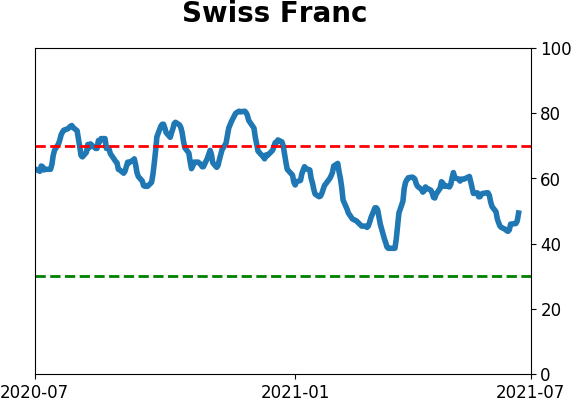
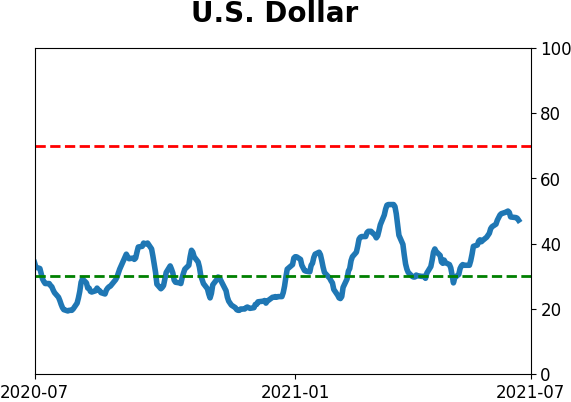
Currency ETF's - 5-Day Moving Average
|
|
|
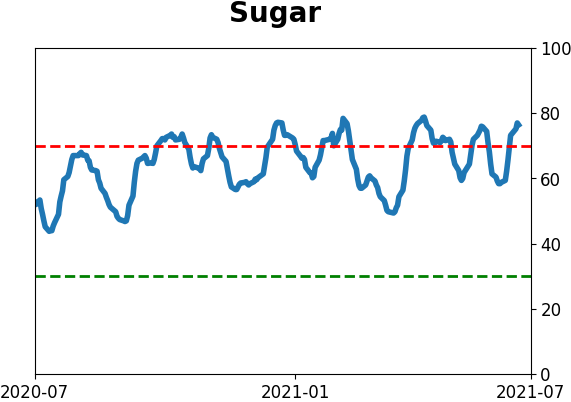
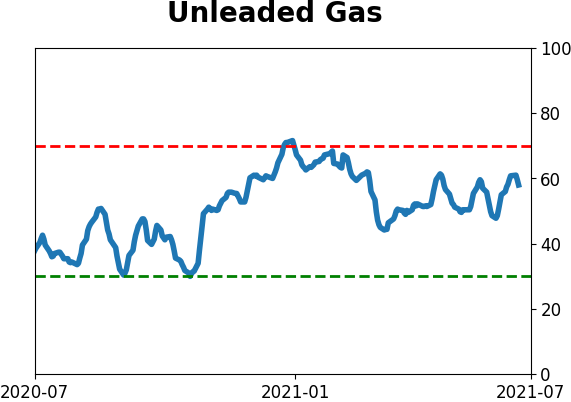
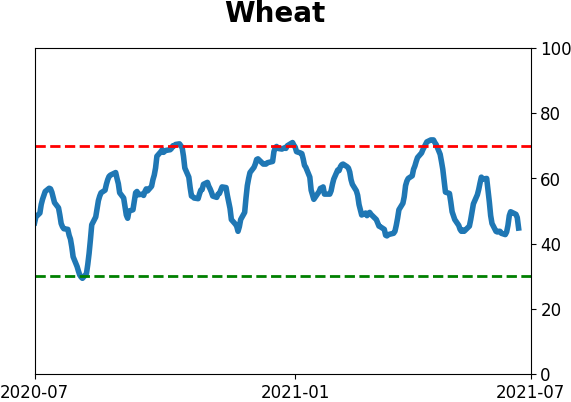
Commodity ETF's - 5-Day Moving Average
|
|