Headlines
|
|
It's just so weak under the surface:
It's no longer a secret that breadth has been weak. Indexes like the S&P 500 and Nasdaq Composite have consistently closed at record highs while the average stock has struggled. The divergences have reached historic proportions, and the few precedents show any further short-term gains have almost always been given back.
|
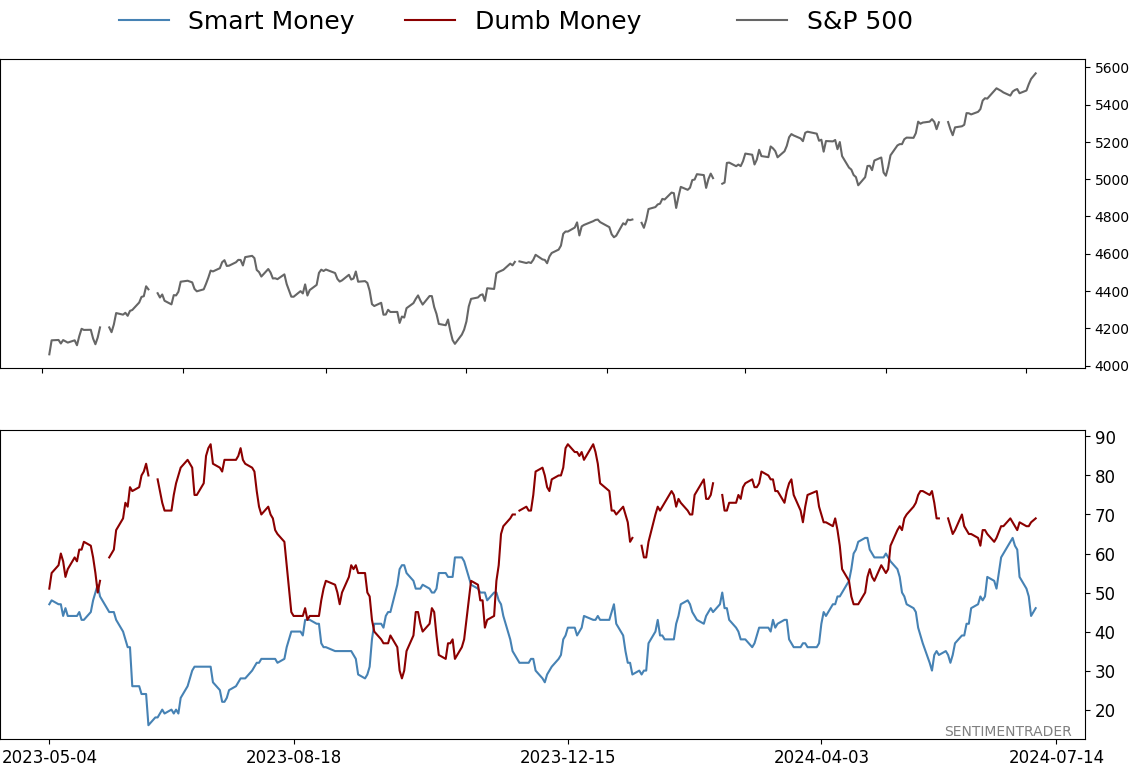
Smart / Dumb Money Confidence
|
Smart Money Confidence: 46%
Dumb Money Confidence: 69%
|
|
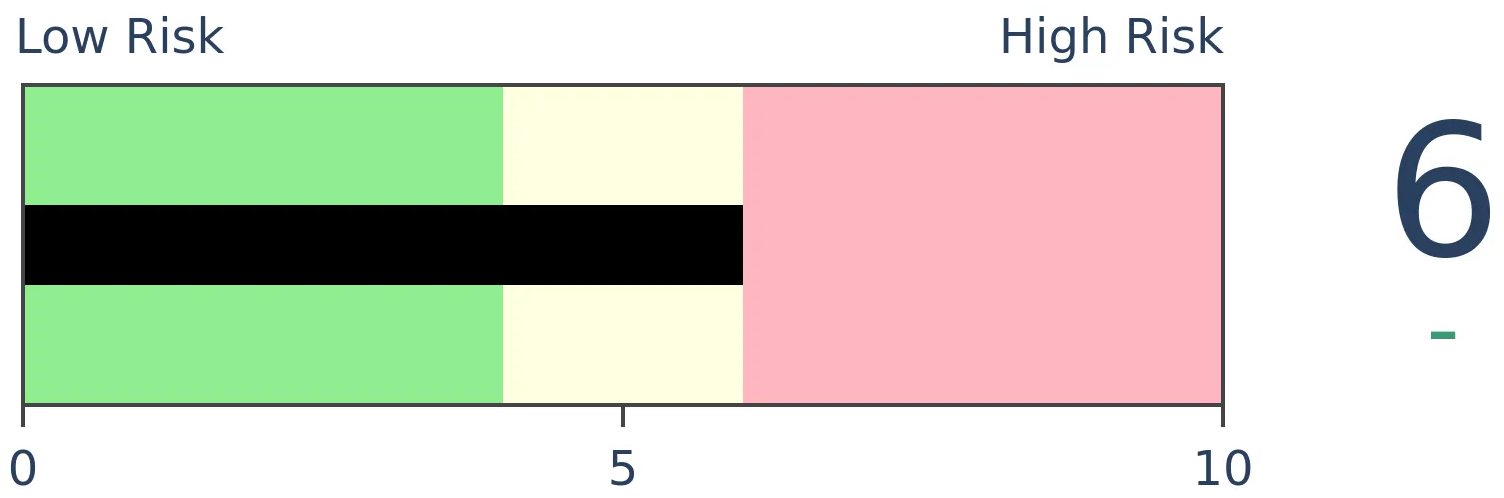
Risk Levels
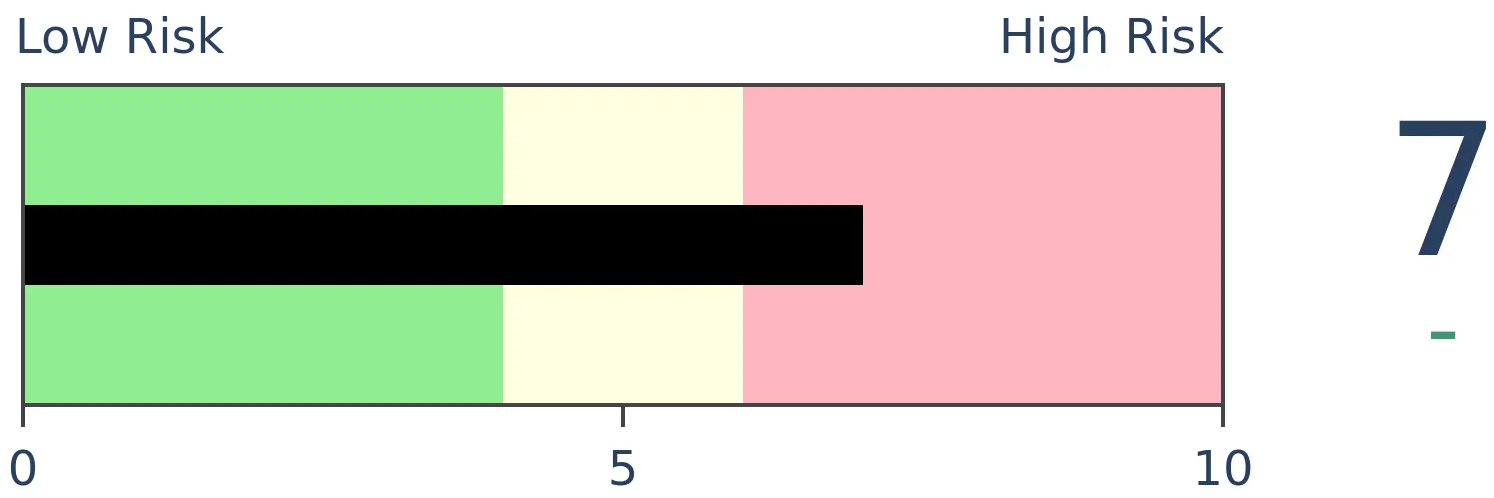
Stocks Short-Term
|
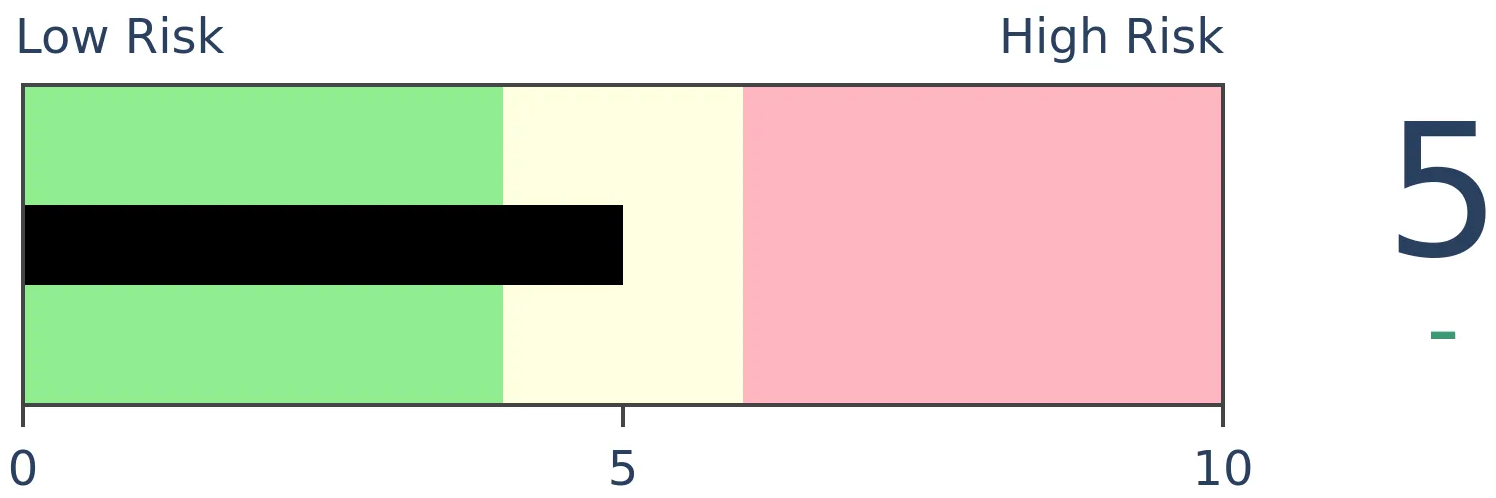
Stocks Medium-Term
|
|
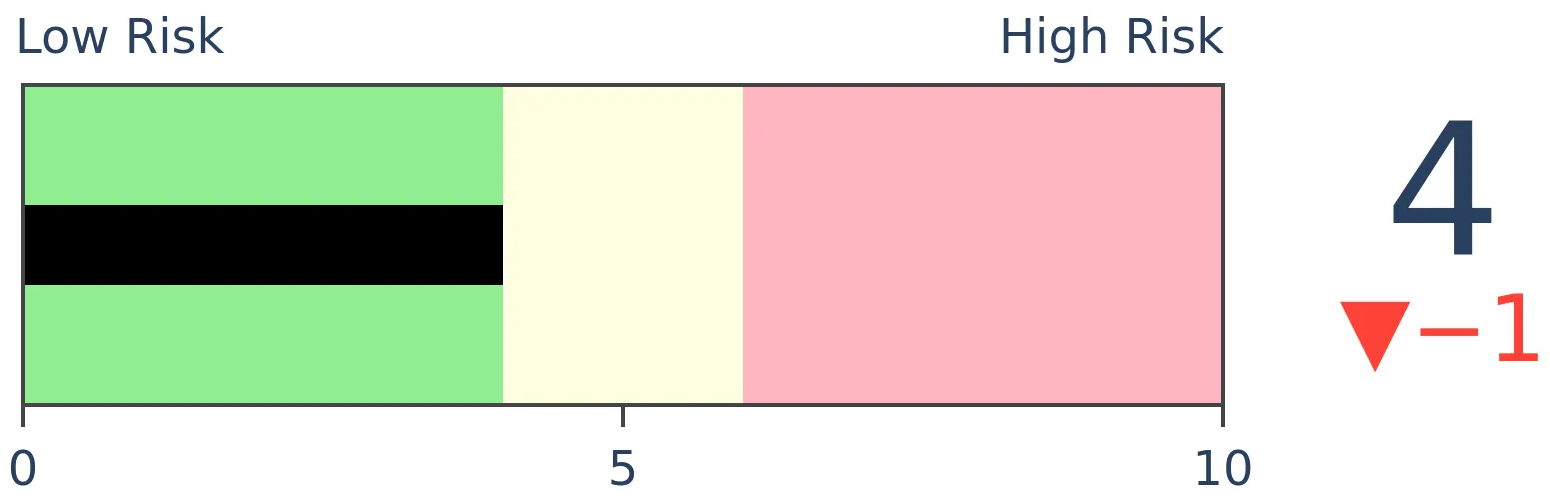
Bonds

|
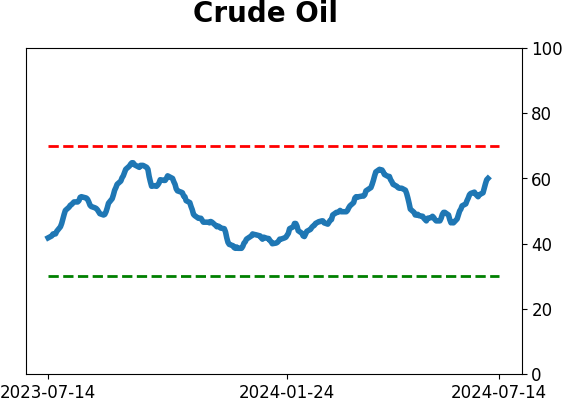
Crude Oil
|
|
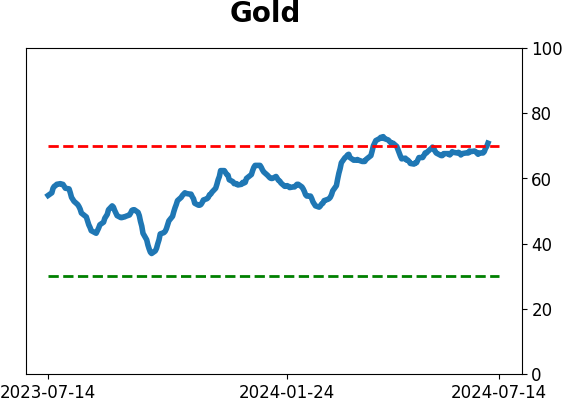
Gold

|
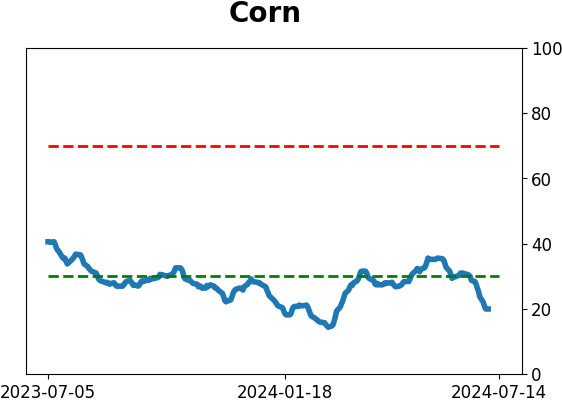
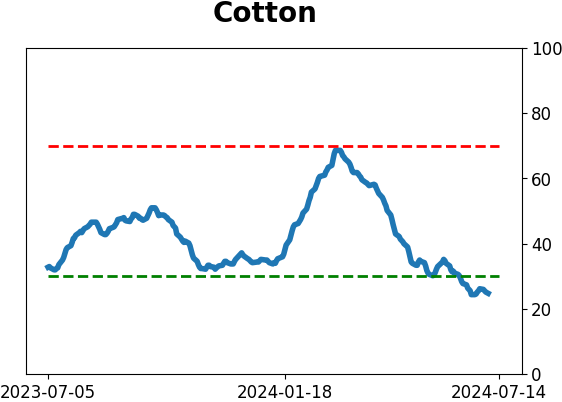
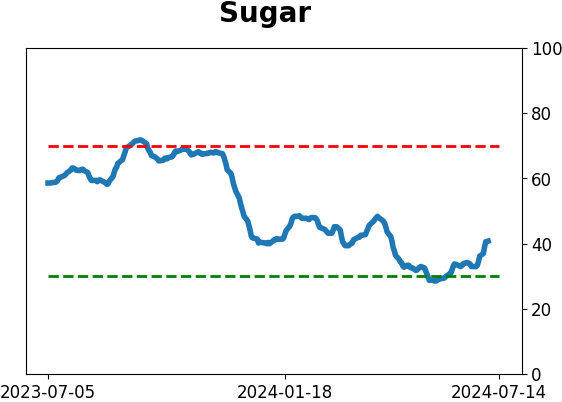
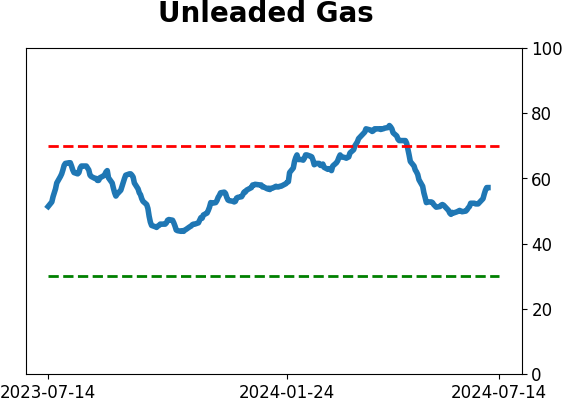
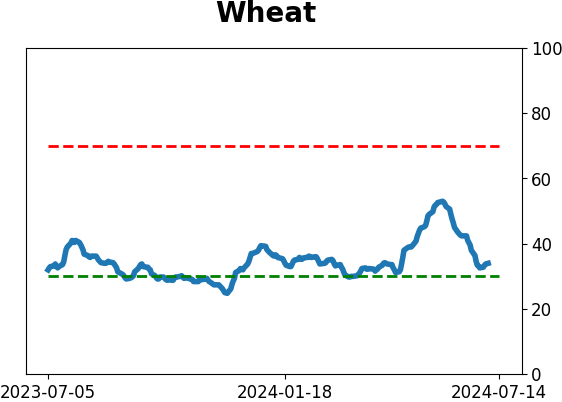
Agriculture
|
|
Research
By Jason Goepfert
BOTTOM LINE
It's no longer a secret that breadth has been weak. Indexes like the S&P 500 and Nasdaq Composite have consistently closed at record highs while the average stock has struggled. The divergences have reached historic proportions, and the few precedents show any further short-term gains have almost always been given back.
FORECAST / TIMEFRAME
None
|
Key points:
- The NYSE McClellan Oscillator and Summation Index have been historically weak over the past month
- It's the same story on the Nasdaq, though even weaker
- Similar behavior showed a strong tendency toward giving back any short-term gains
It's just so weak
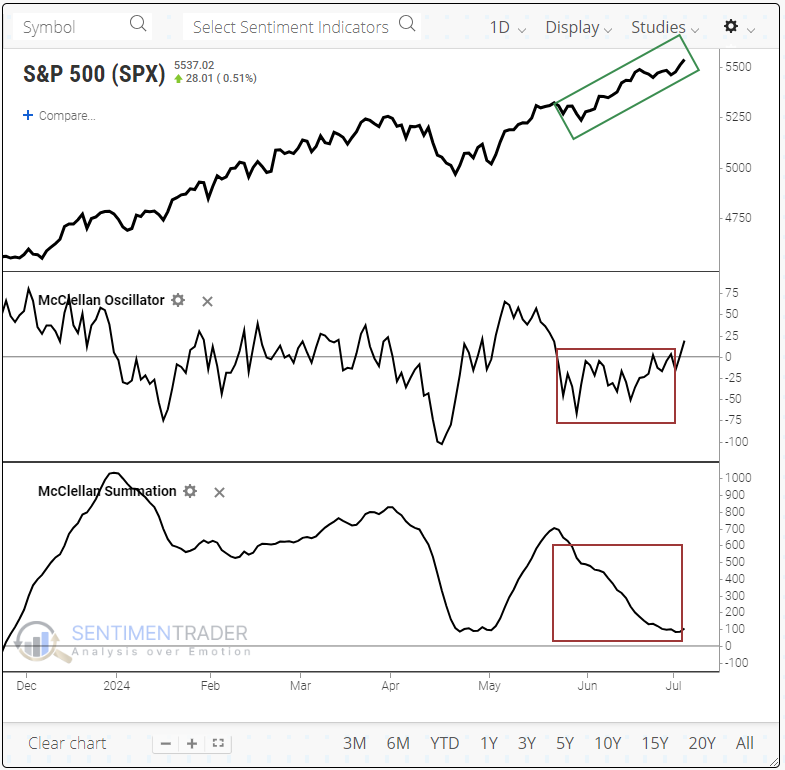
The average stock isn't keeping up with the averages. We know that, and have for over a month, yet the S&P 500 and Nasdaq Composite continue to power to record highs. That's not unprecedented - negative divergences can continue for weeks or even months - but it's stretching the realm of historical comparisons.
This is in direct contrast to when we looked at participation in January when it had reached escape velocity.
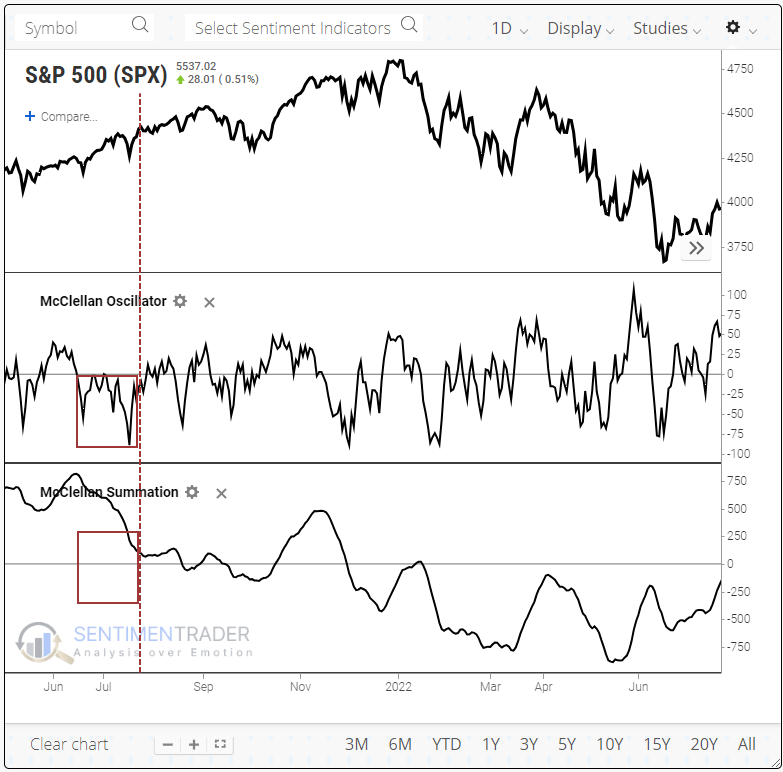
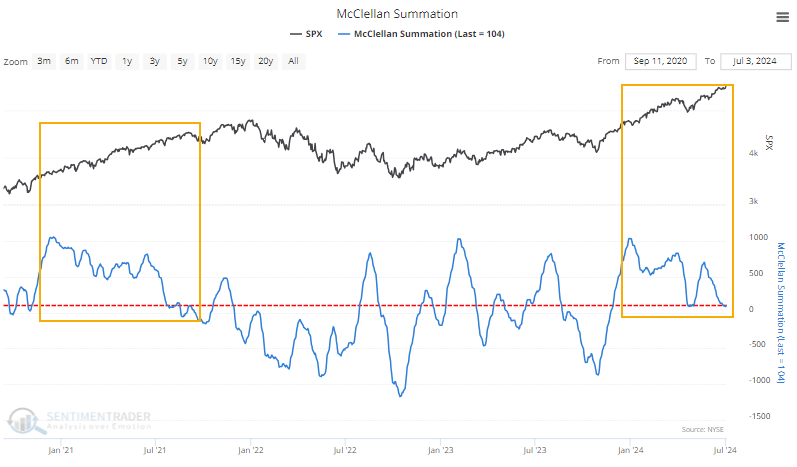
Participation on the NYSE has been so weak that the maximum McClellan Oscillator reading over the prior 28 days had barely been positive before a little jolt later in the week. These persistently weak readings pushed the Summation Index lower, to around 100. That's about the same level it was at in April when the S&P was about 500 points lower.
On July 26, 2021, a similar structure played out. There was a burst of internal momentum during a kick-off rally, which gradually petered out as the index continued to rally.
Taking a closer look at that time frame, the S&P 500 didn't peak immediately, but it struggled to hold its gains before suffering a mild pullback, another thrust to new highs, and then the bear market.
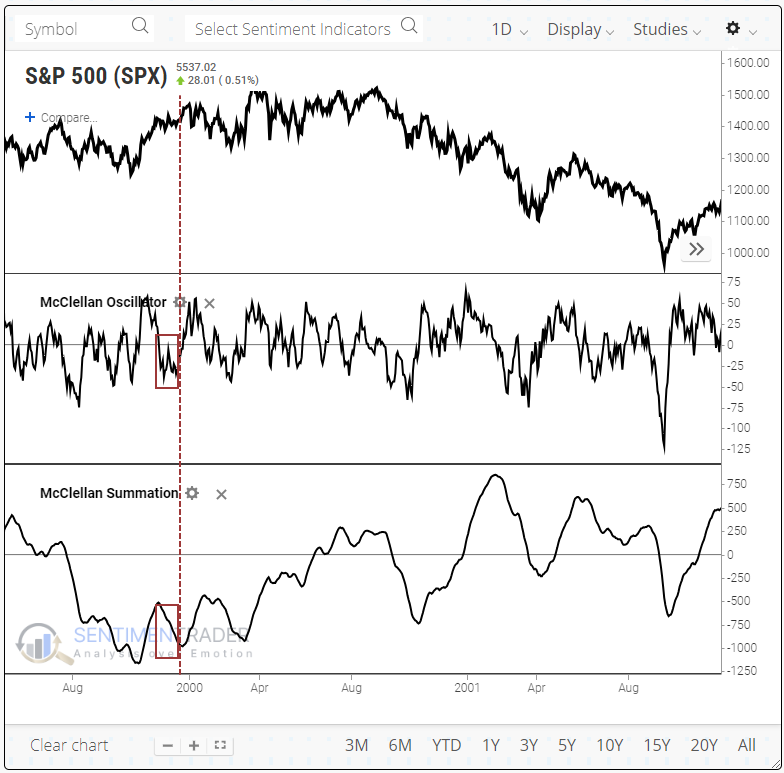
There has been only one other precedent since 1962, and that was on December 21, 1999. The S&P's future path looked somewhat similar - a brief rally, a pullback, another thrust to new highs, and then the bear market.
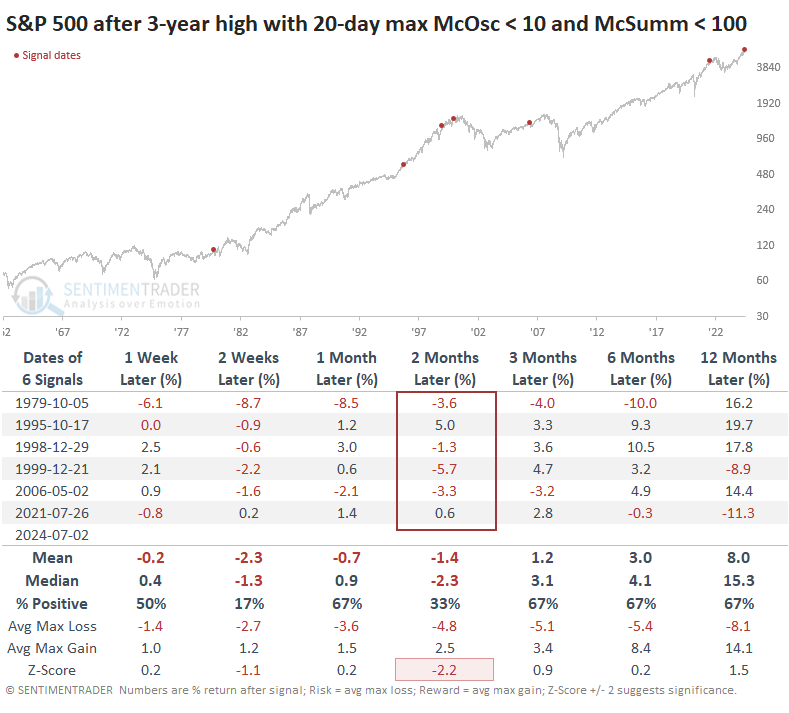
It's hard to rely on a sample size of two, but the readings are so unbelievably weak that even if we relax the parameters, it's hard to find many precedents. When we do, we still find relatively weak results over the next couple of months. Only 1995 stands out as showing sustained upside momentum. Bulls are hoping that that single economic soft-landing precedent is the one that's about to repeat.
Same thing on the Nasdaq
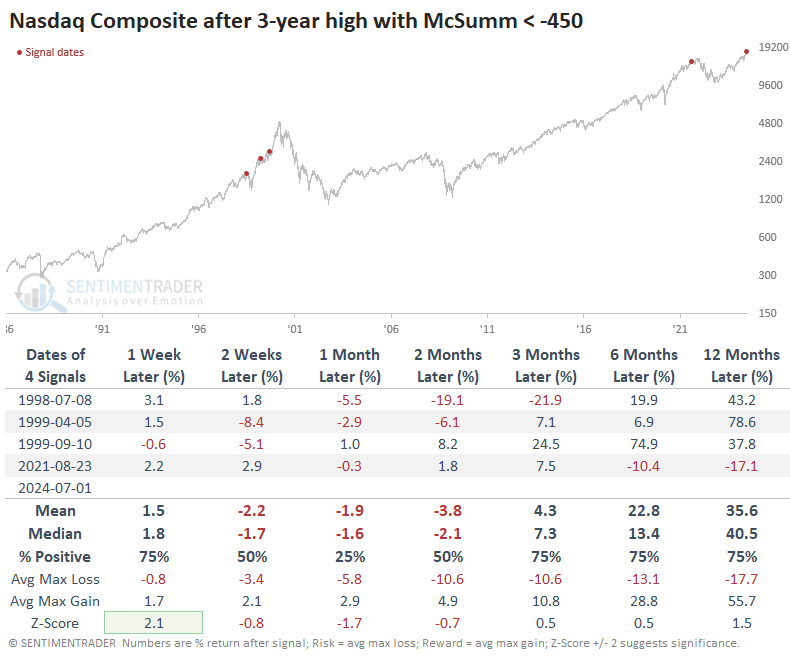
A similar pattern is playing out on the Nasdaq exchange, which we've noted for over a month has been especially troublesome. Over there, the McClellan Summation Index is not only tepid but deeply negative - the kind of reading commonly seen after deep pullbacks or corrections. Again, 2021 stands out as having a similar structure.
The only other times the stocks behaved this way over the past 30 years were in 1998 and 1999.
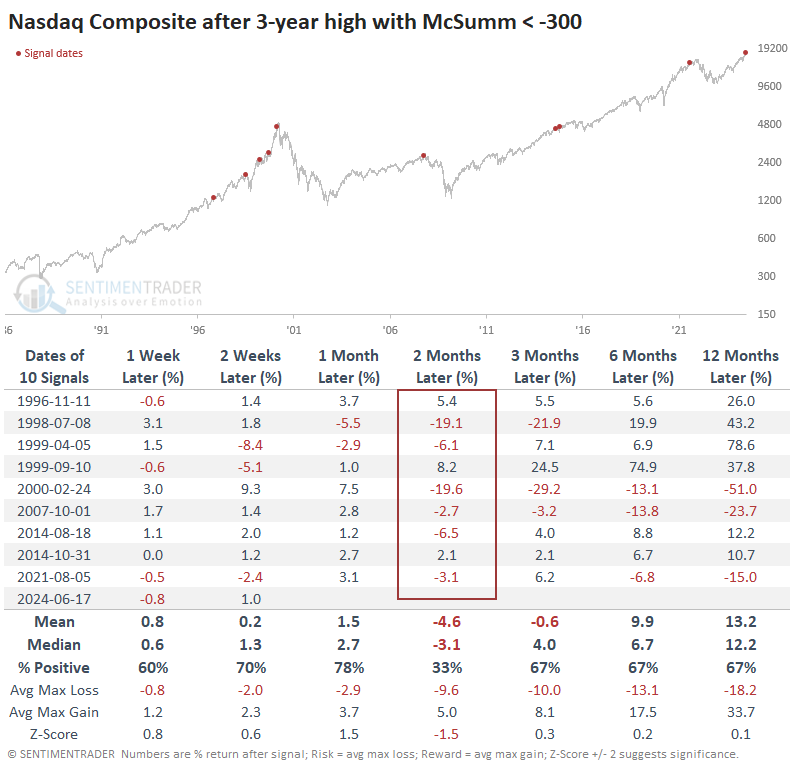
If we relax these parameters, there were a few more precedents. Unfortunately, one of those was the peak before the global financial crisis and the very peak of the internet bubble. But at least there was a relatively innocuous signal in 1996.
What the research tells us...
A handful of strong stocks can mask underlying weakness in capitalization-weighted indexes for a long time. Divergences between them and most other stocks can continue for months before anything bad happens, and something bad doesn't necessarily have to happen.
Bulls always want to hope investors discover sector rotation and cycle into lagging stocks, which will prop up the whole market. Of course, that can happen. We don't speculate much about what can happen since the possibilities are endless. We focus more on what has usually happened because human emotion is the most consistent factor in markets. And that tells us that when investors tire of chasing the few leaders, the average stock doesn't "catch up," rather the indexes show a strong tendency to "catch down."
Indicators at Extremes
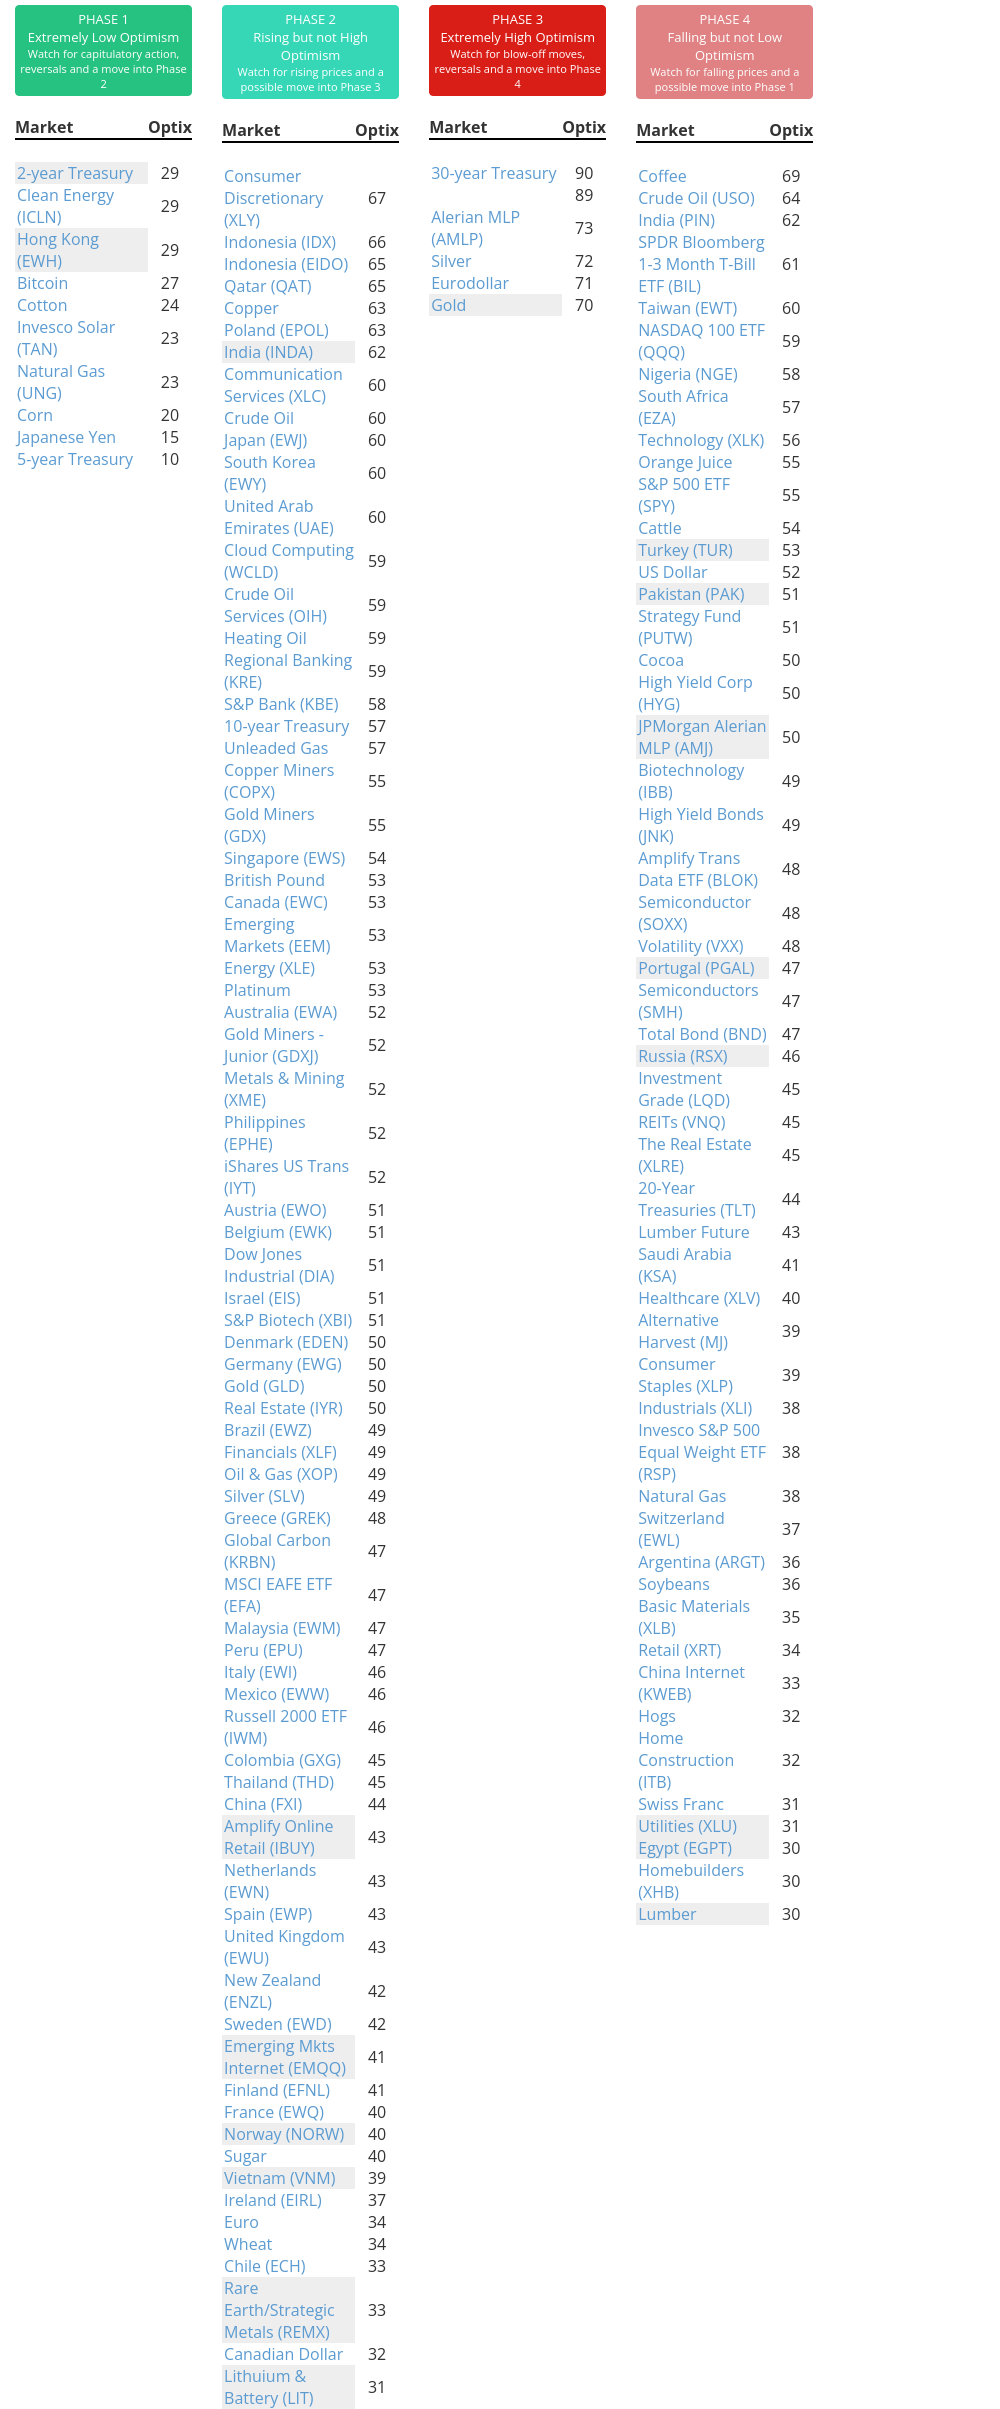
Phase Table
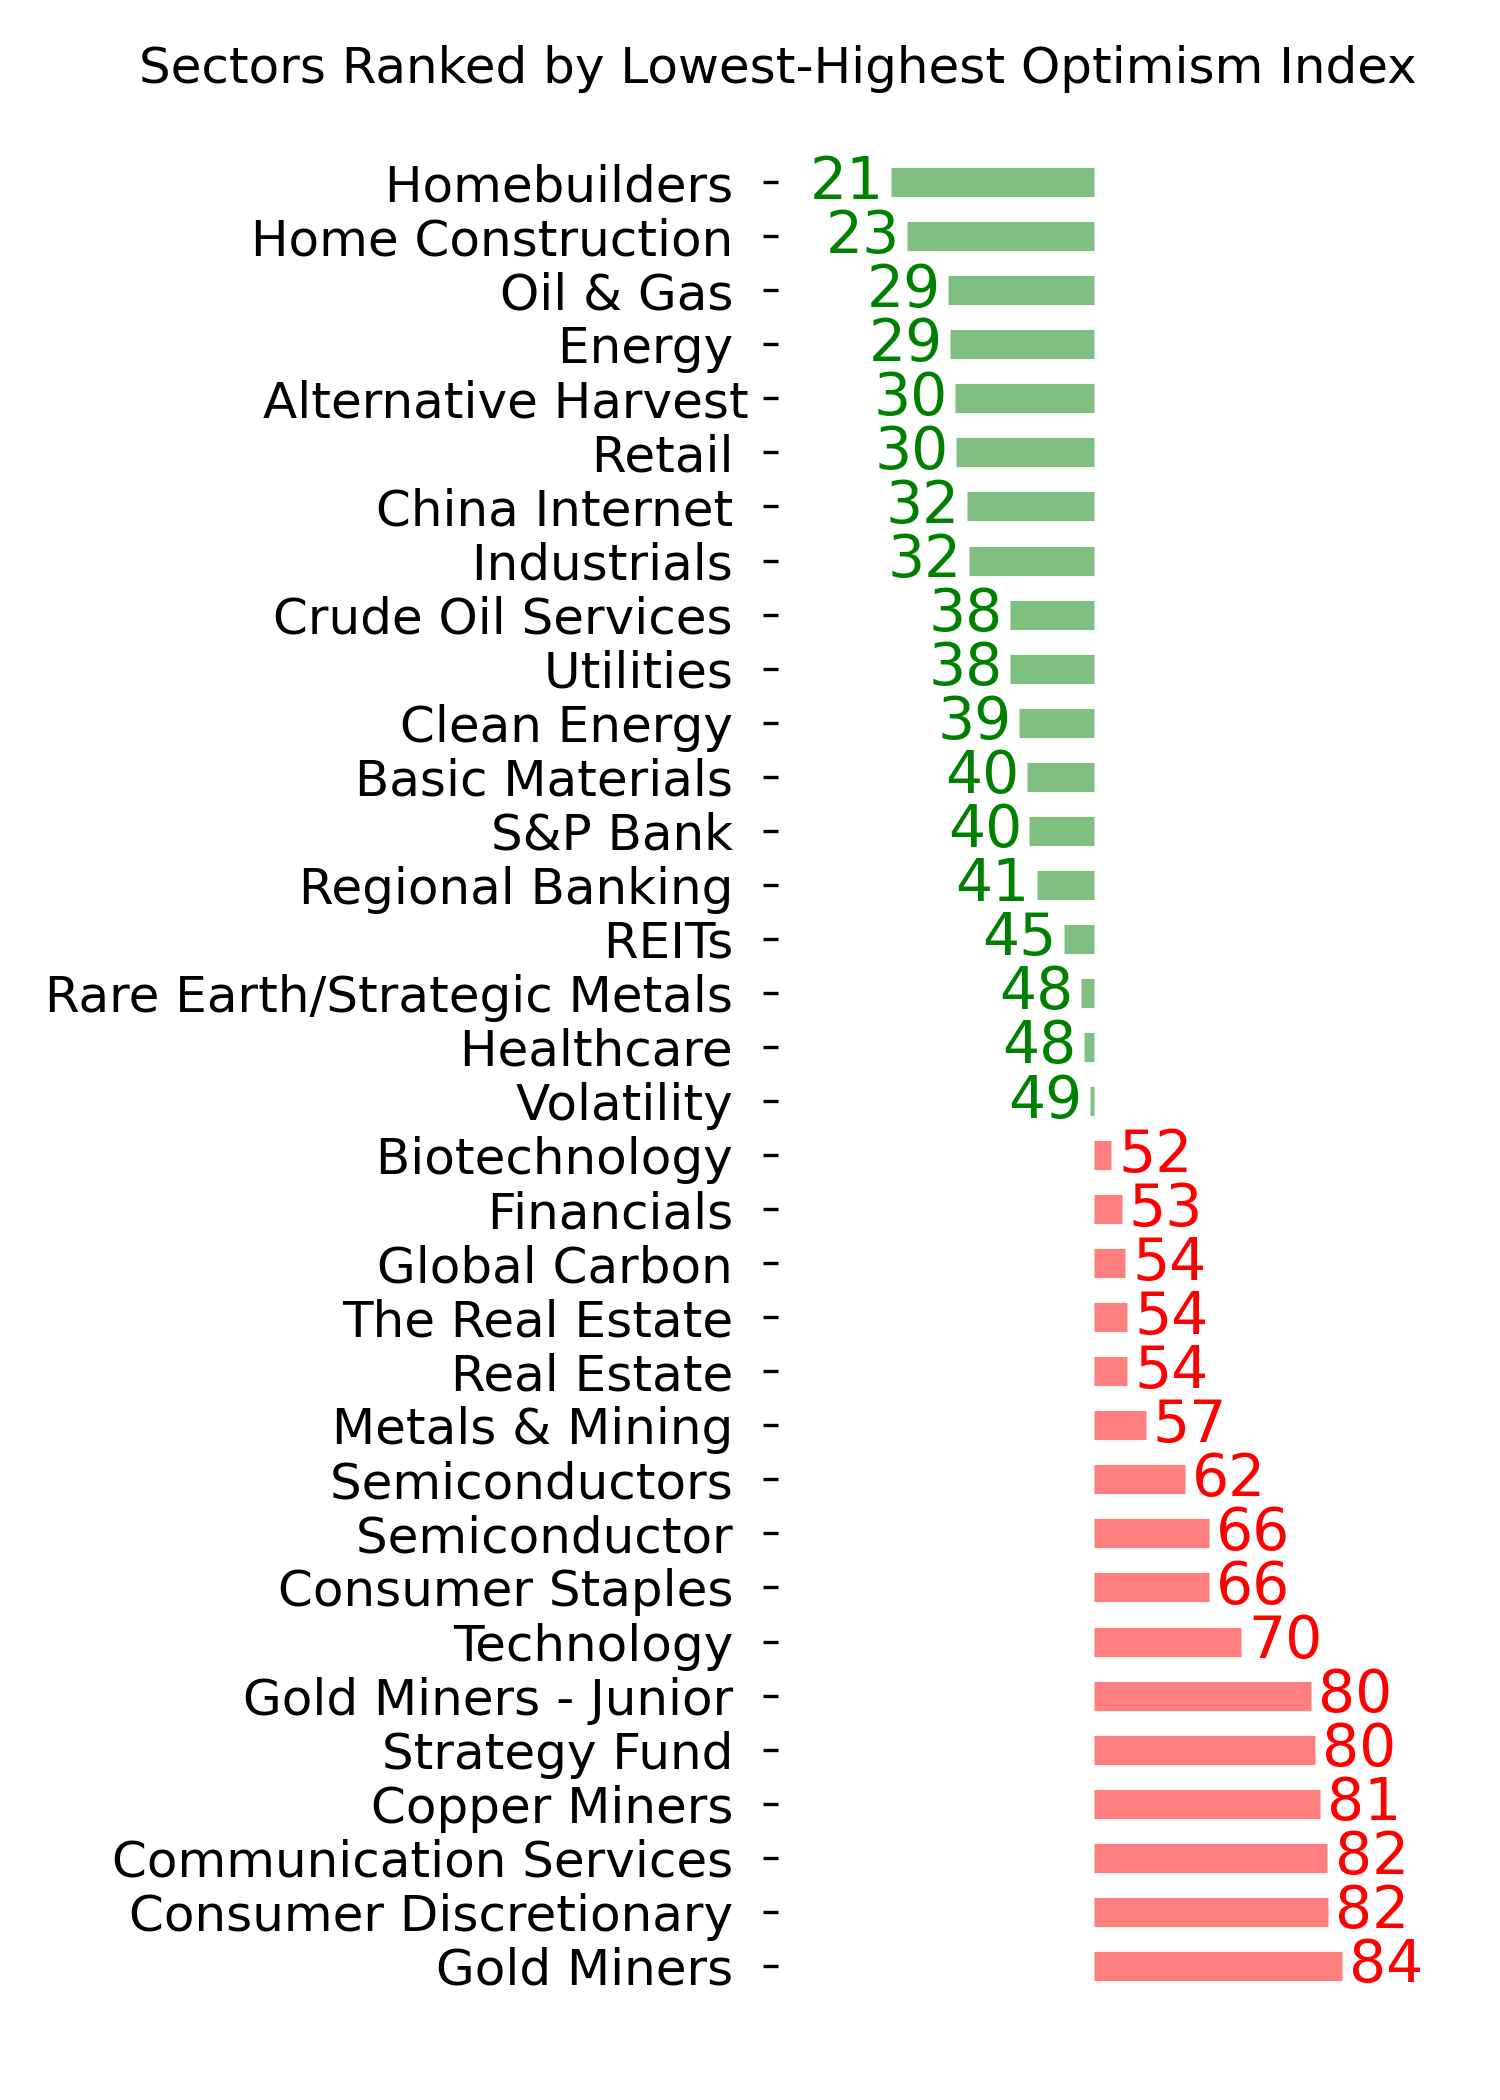
Ranks
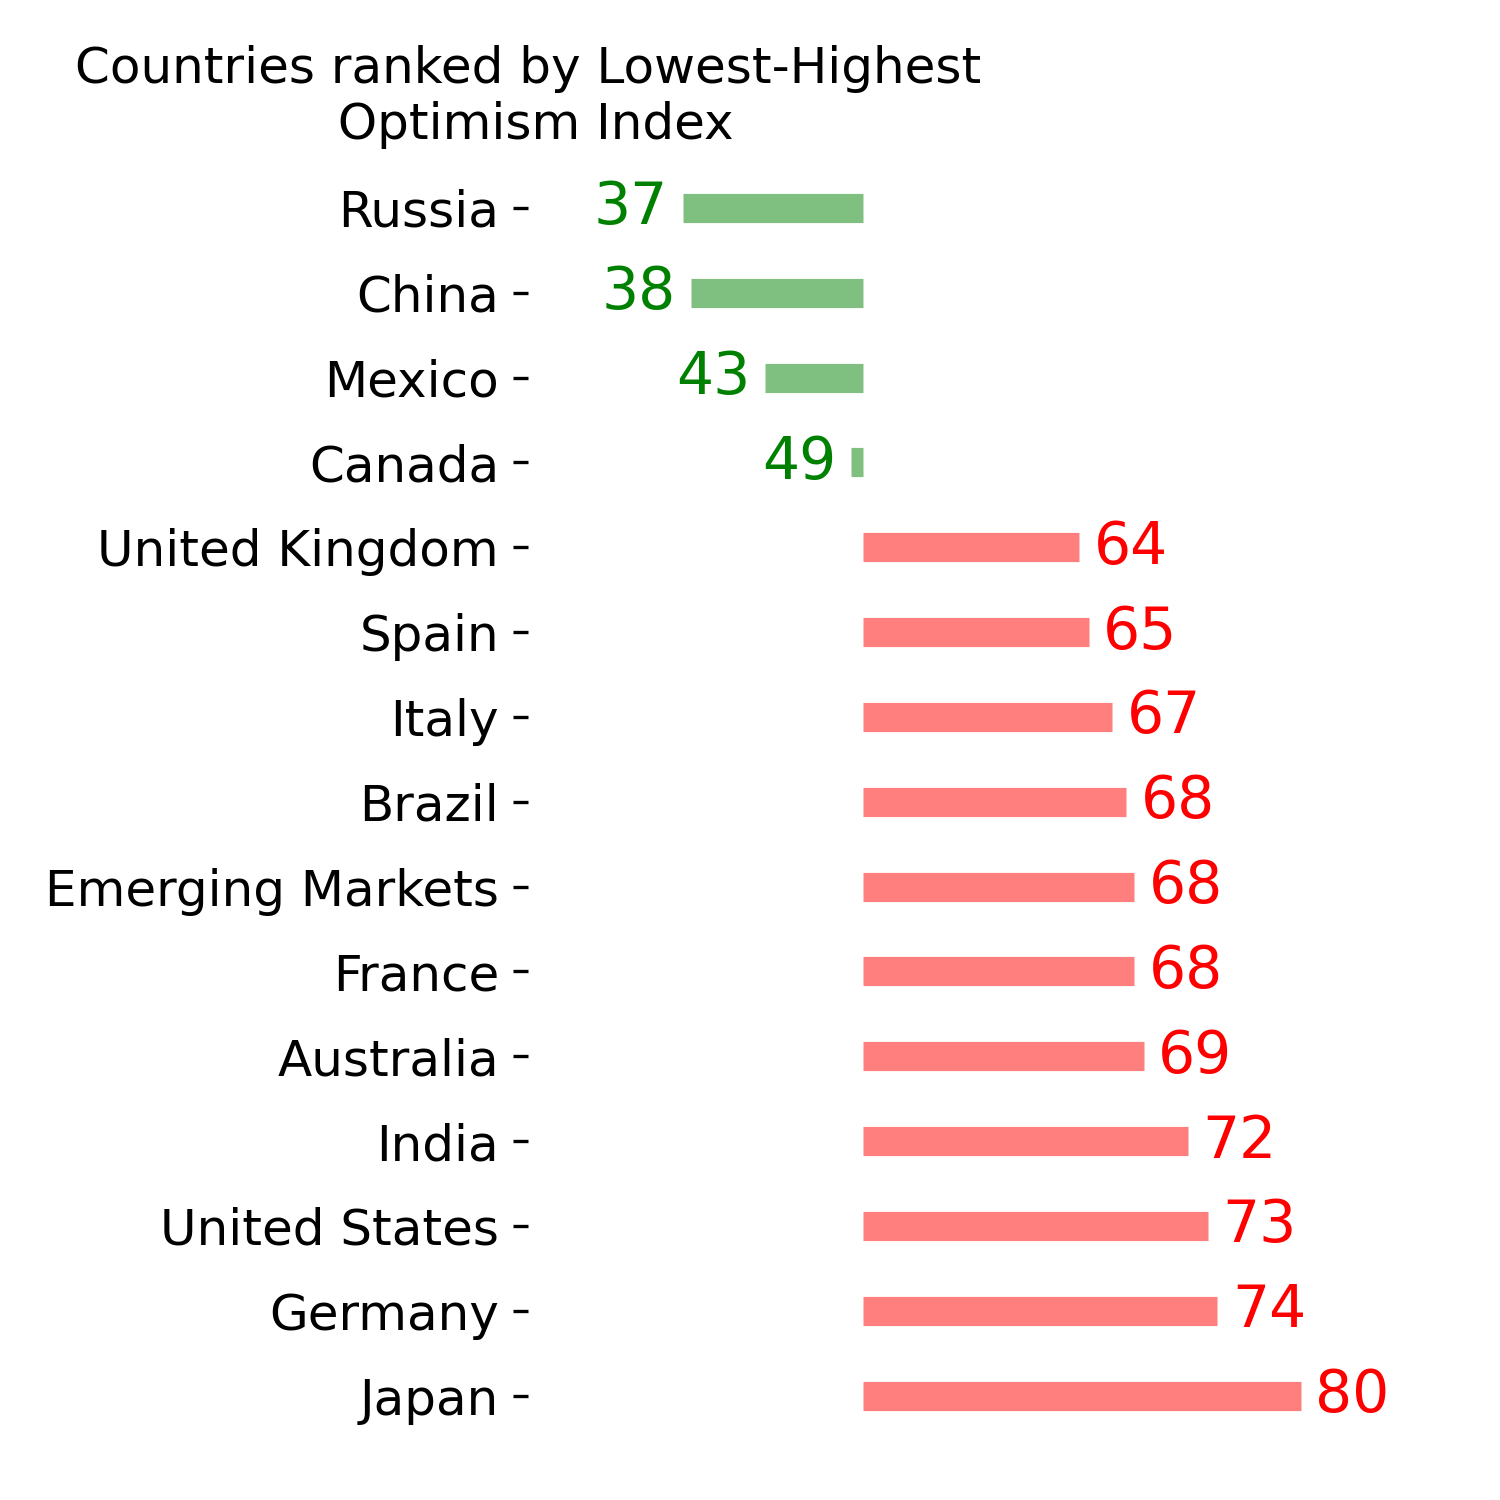
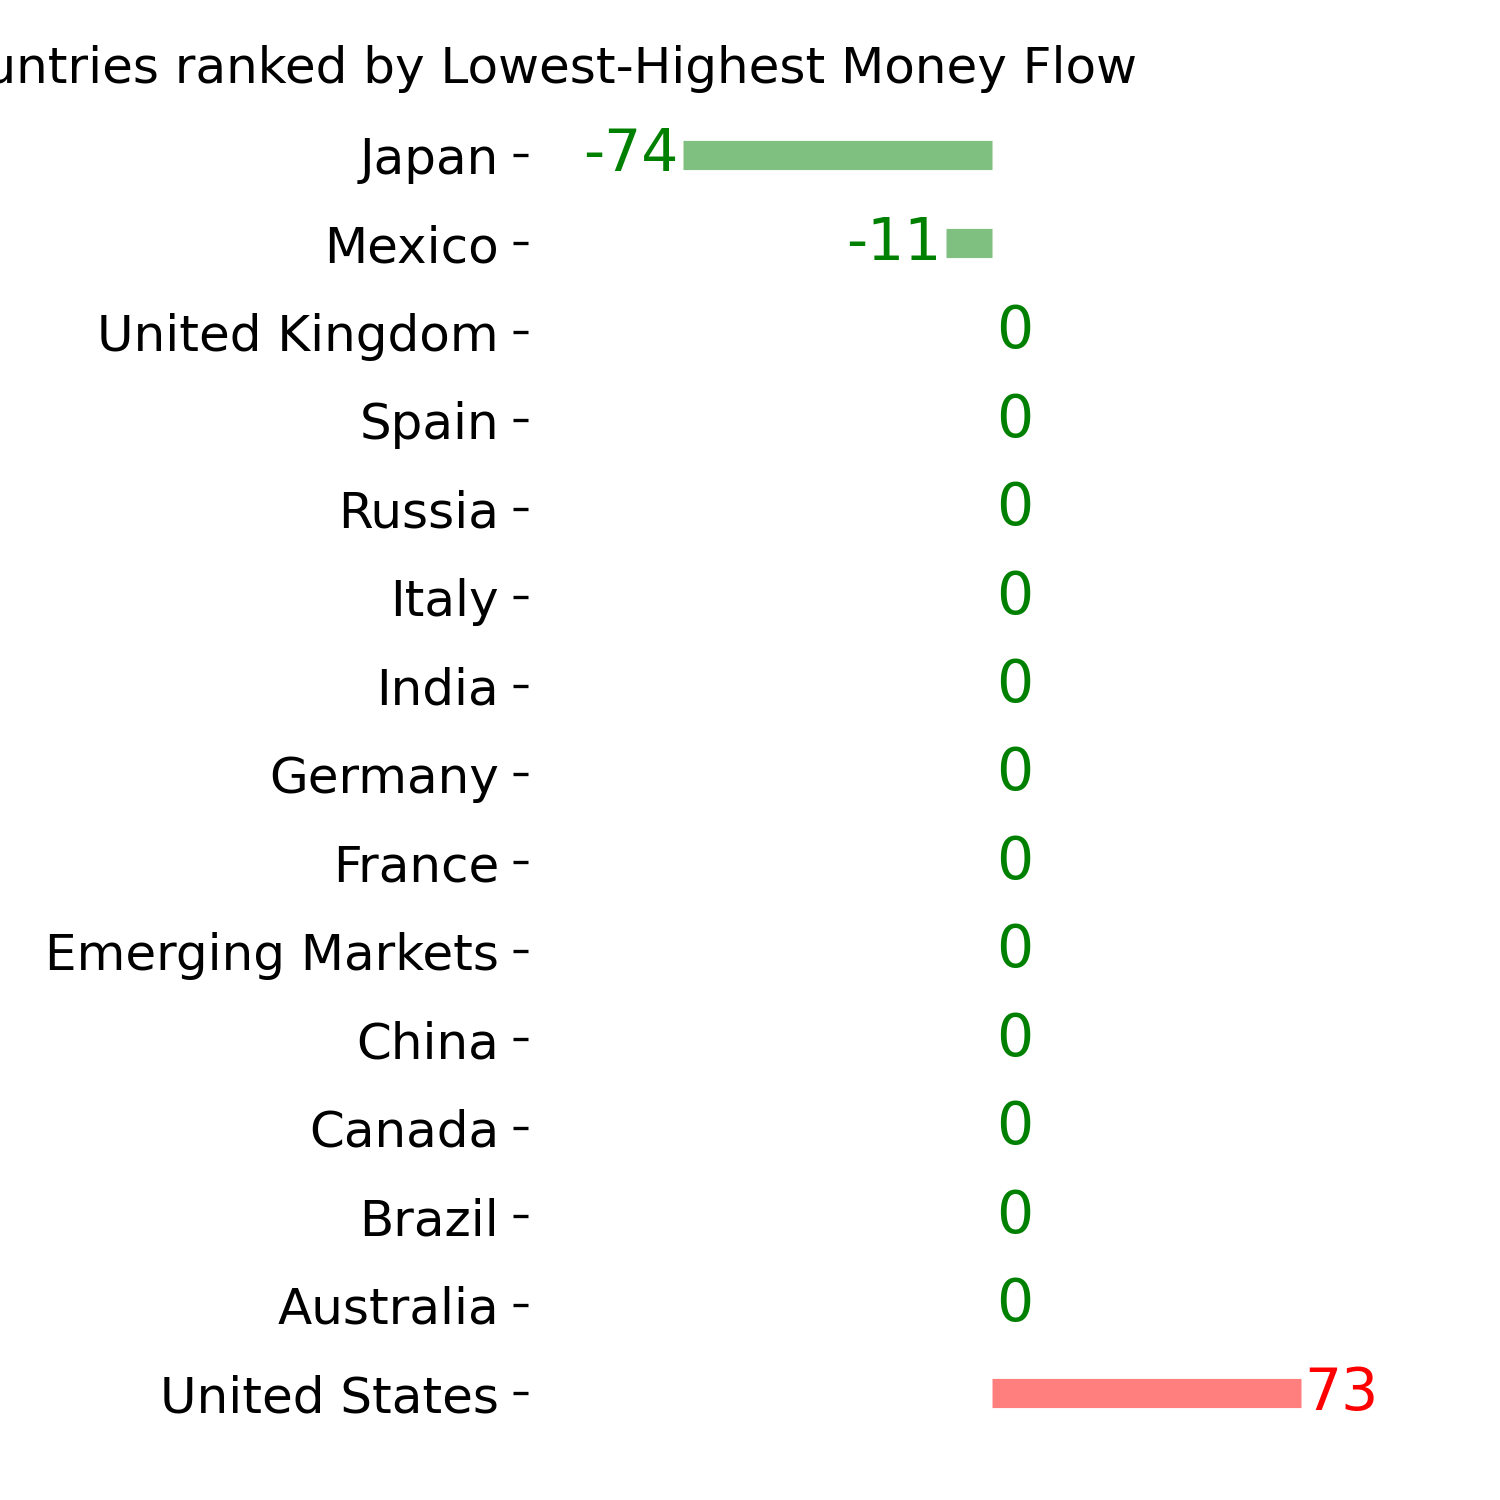
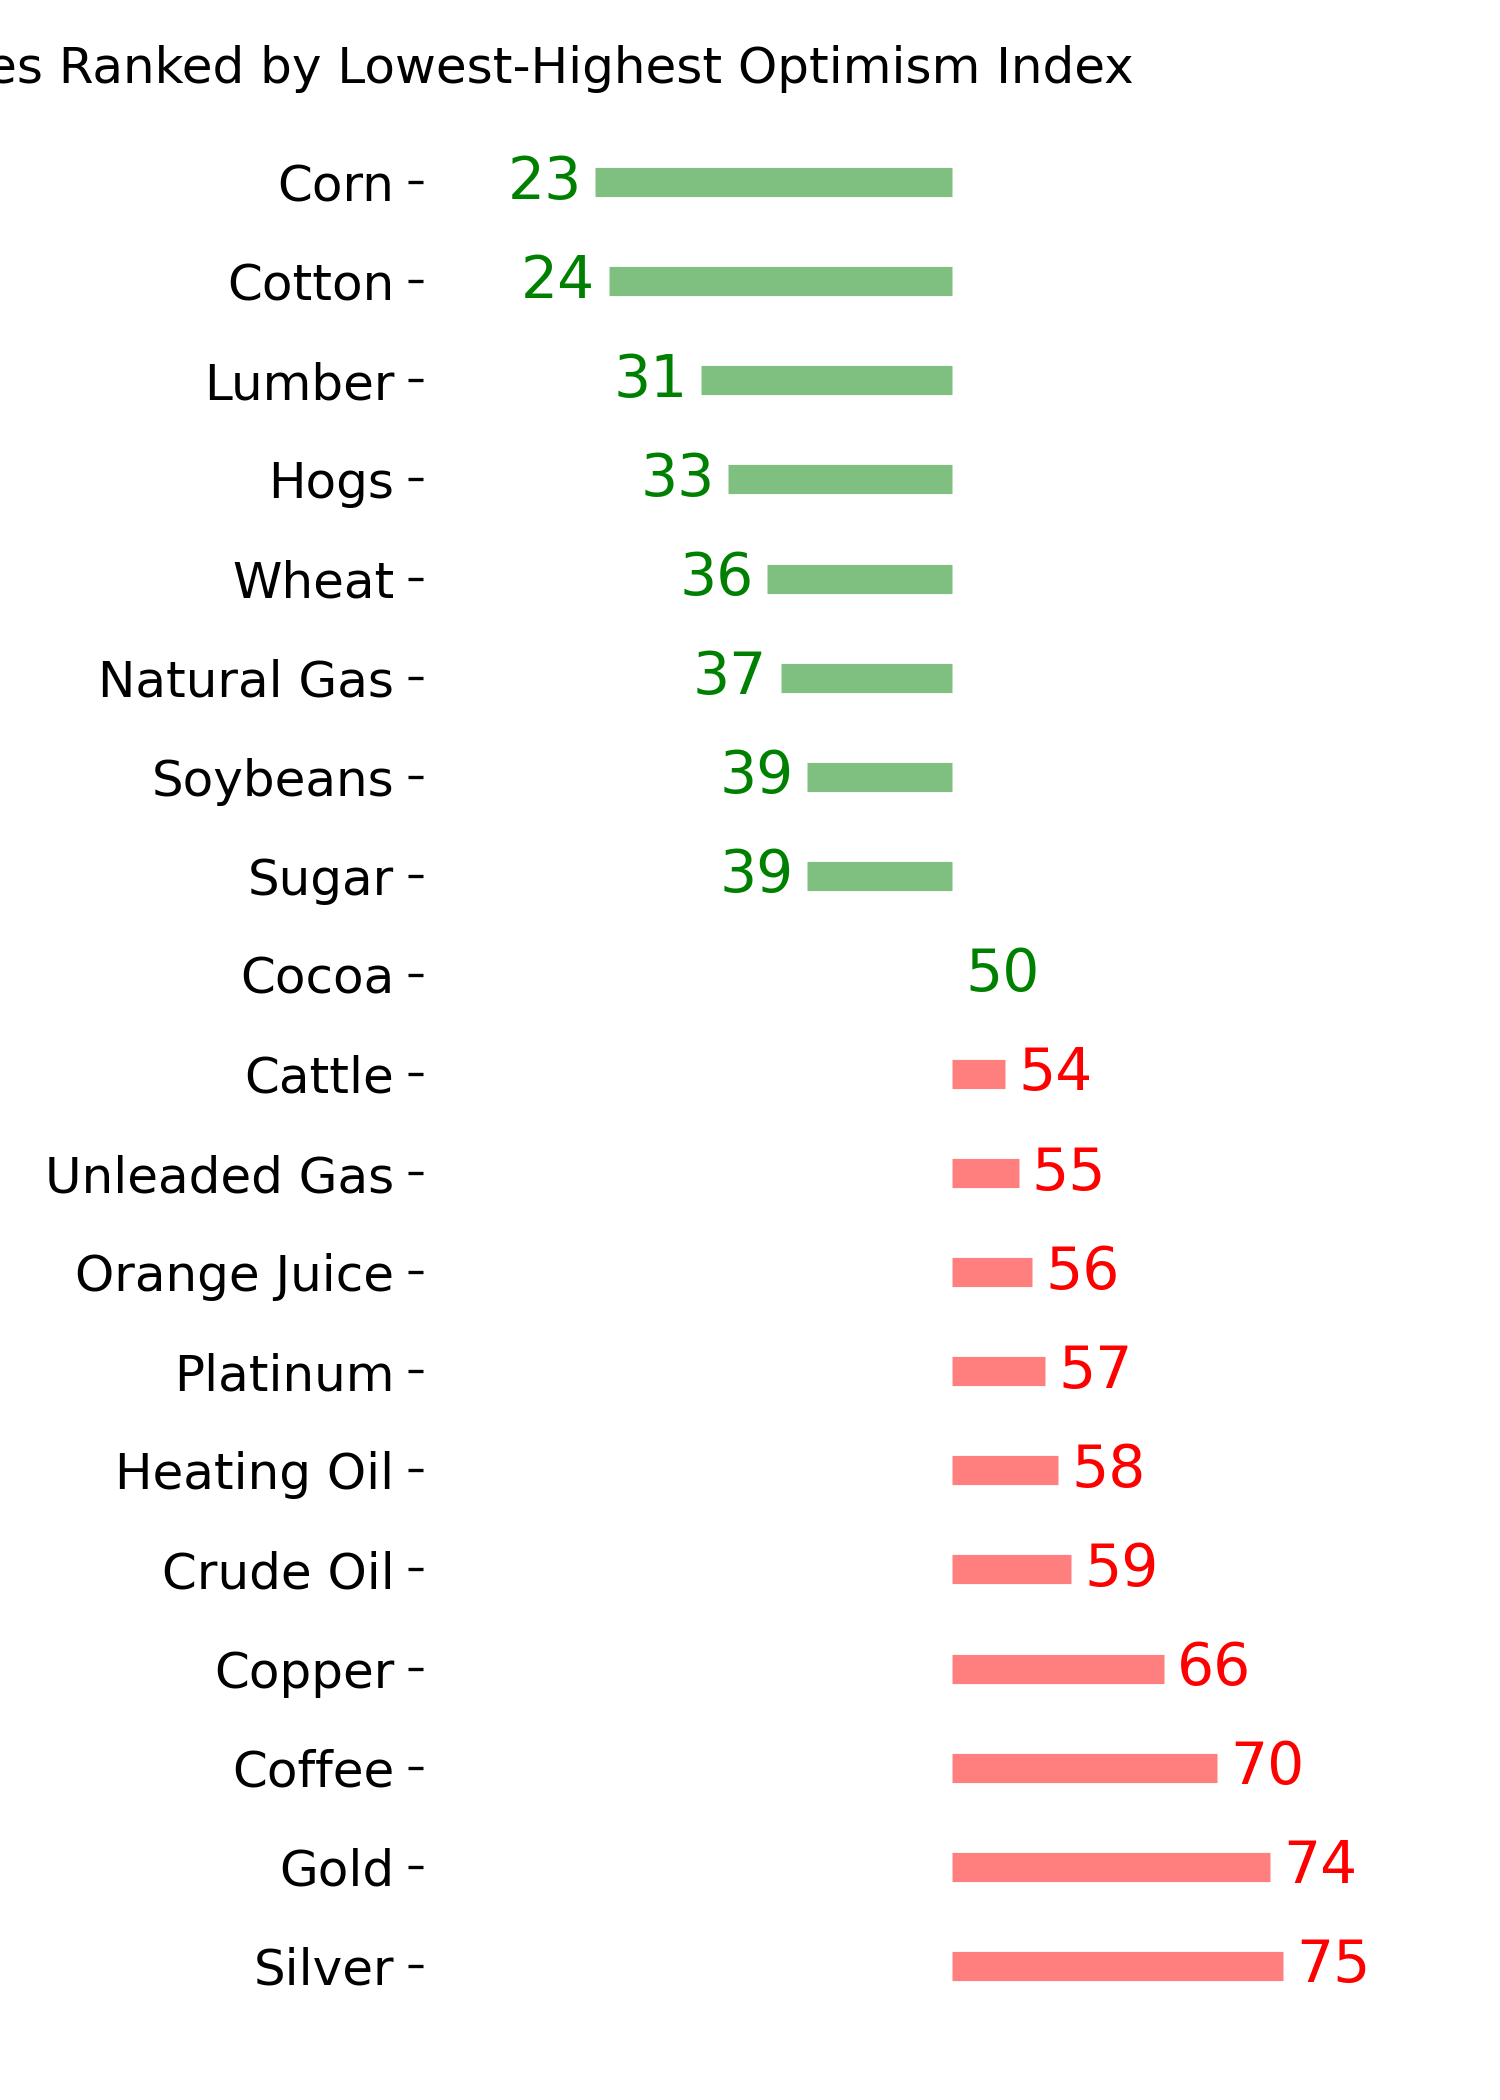
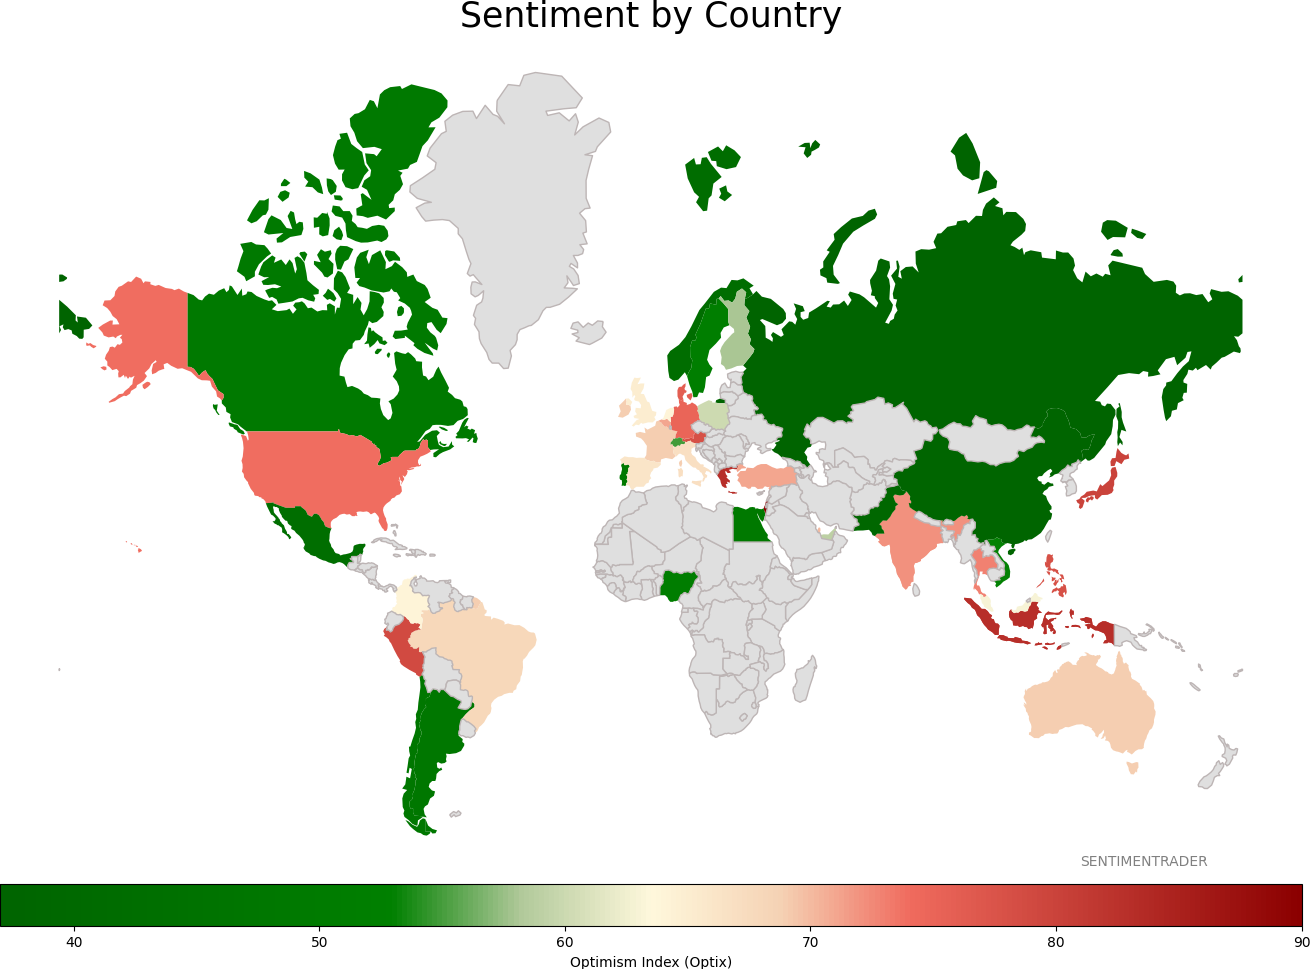
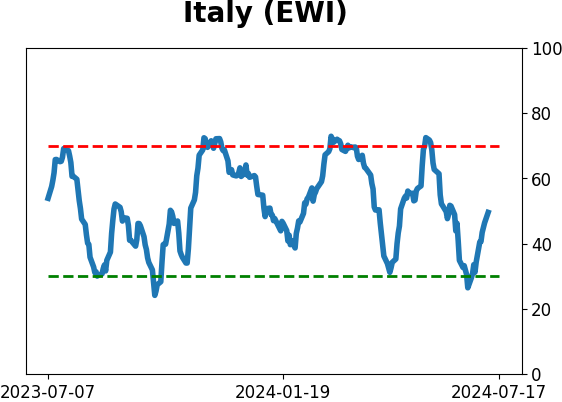
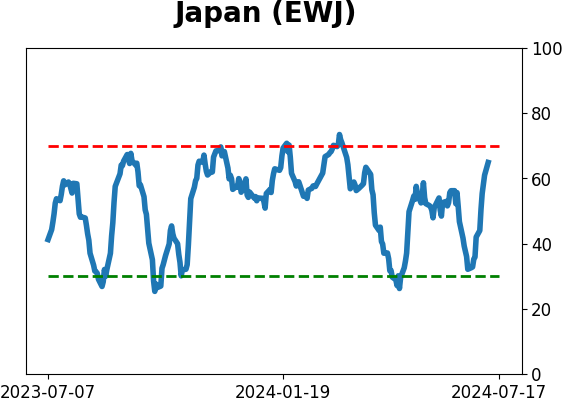
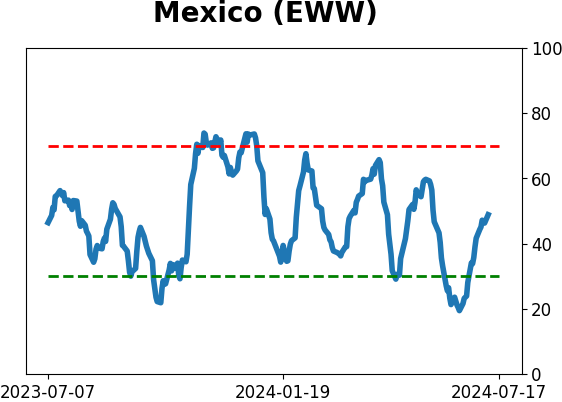
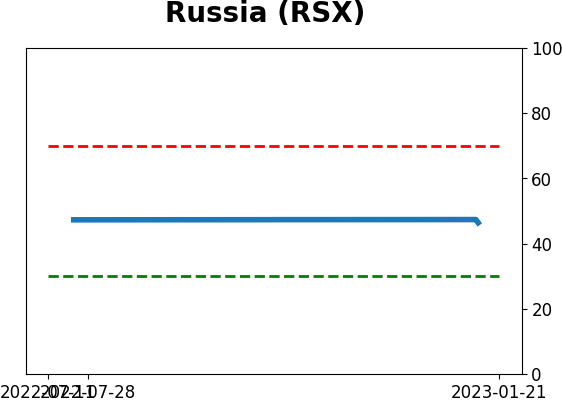
Sentiment Around The World
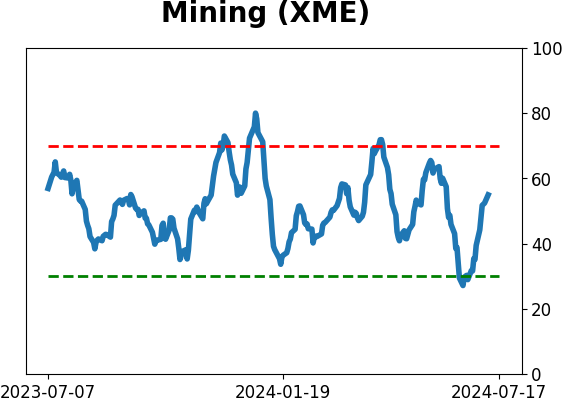
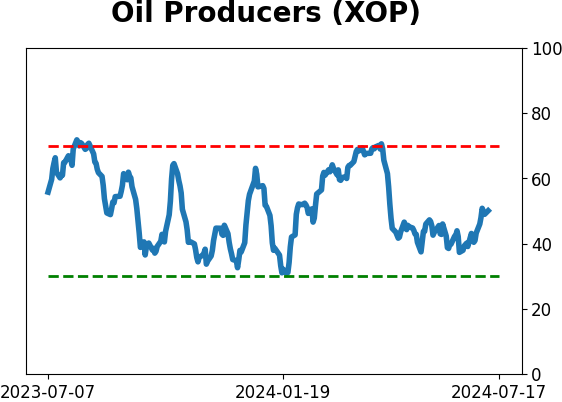
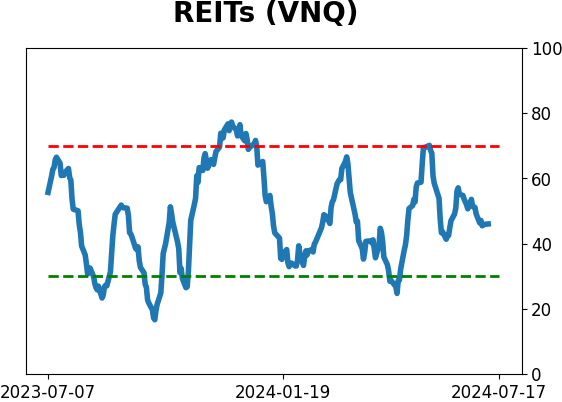
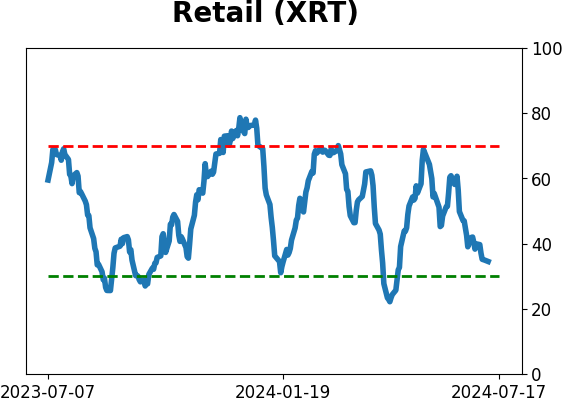
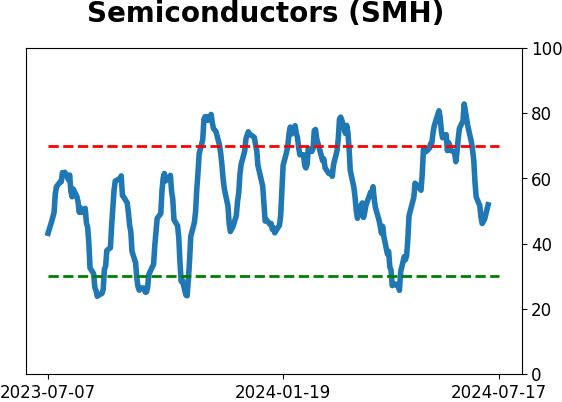
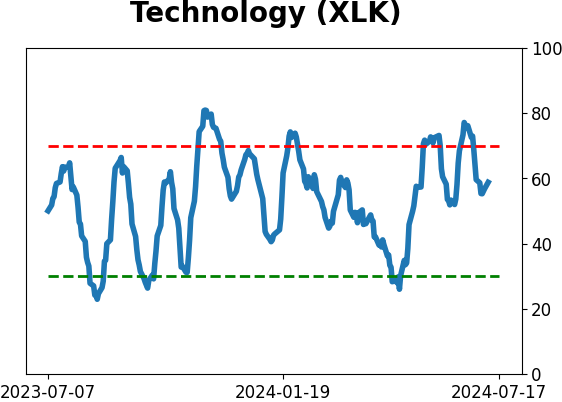
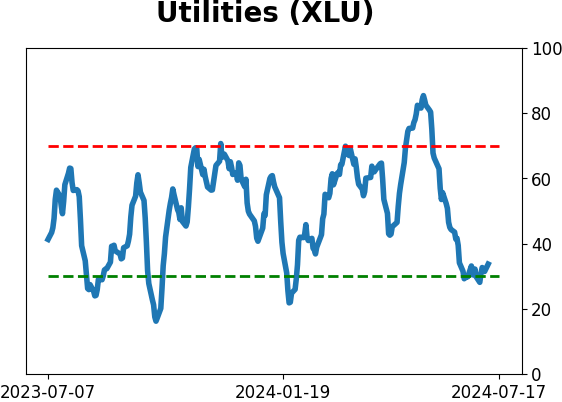
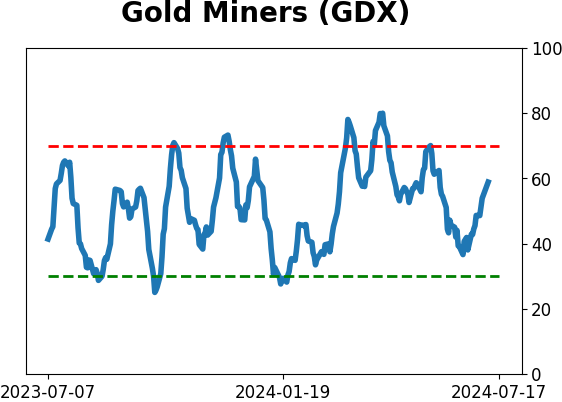
Optimism Index Thumbnails
|
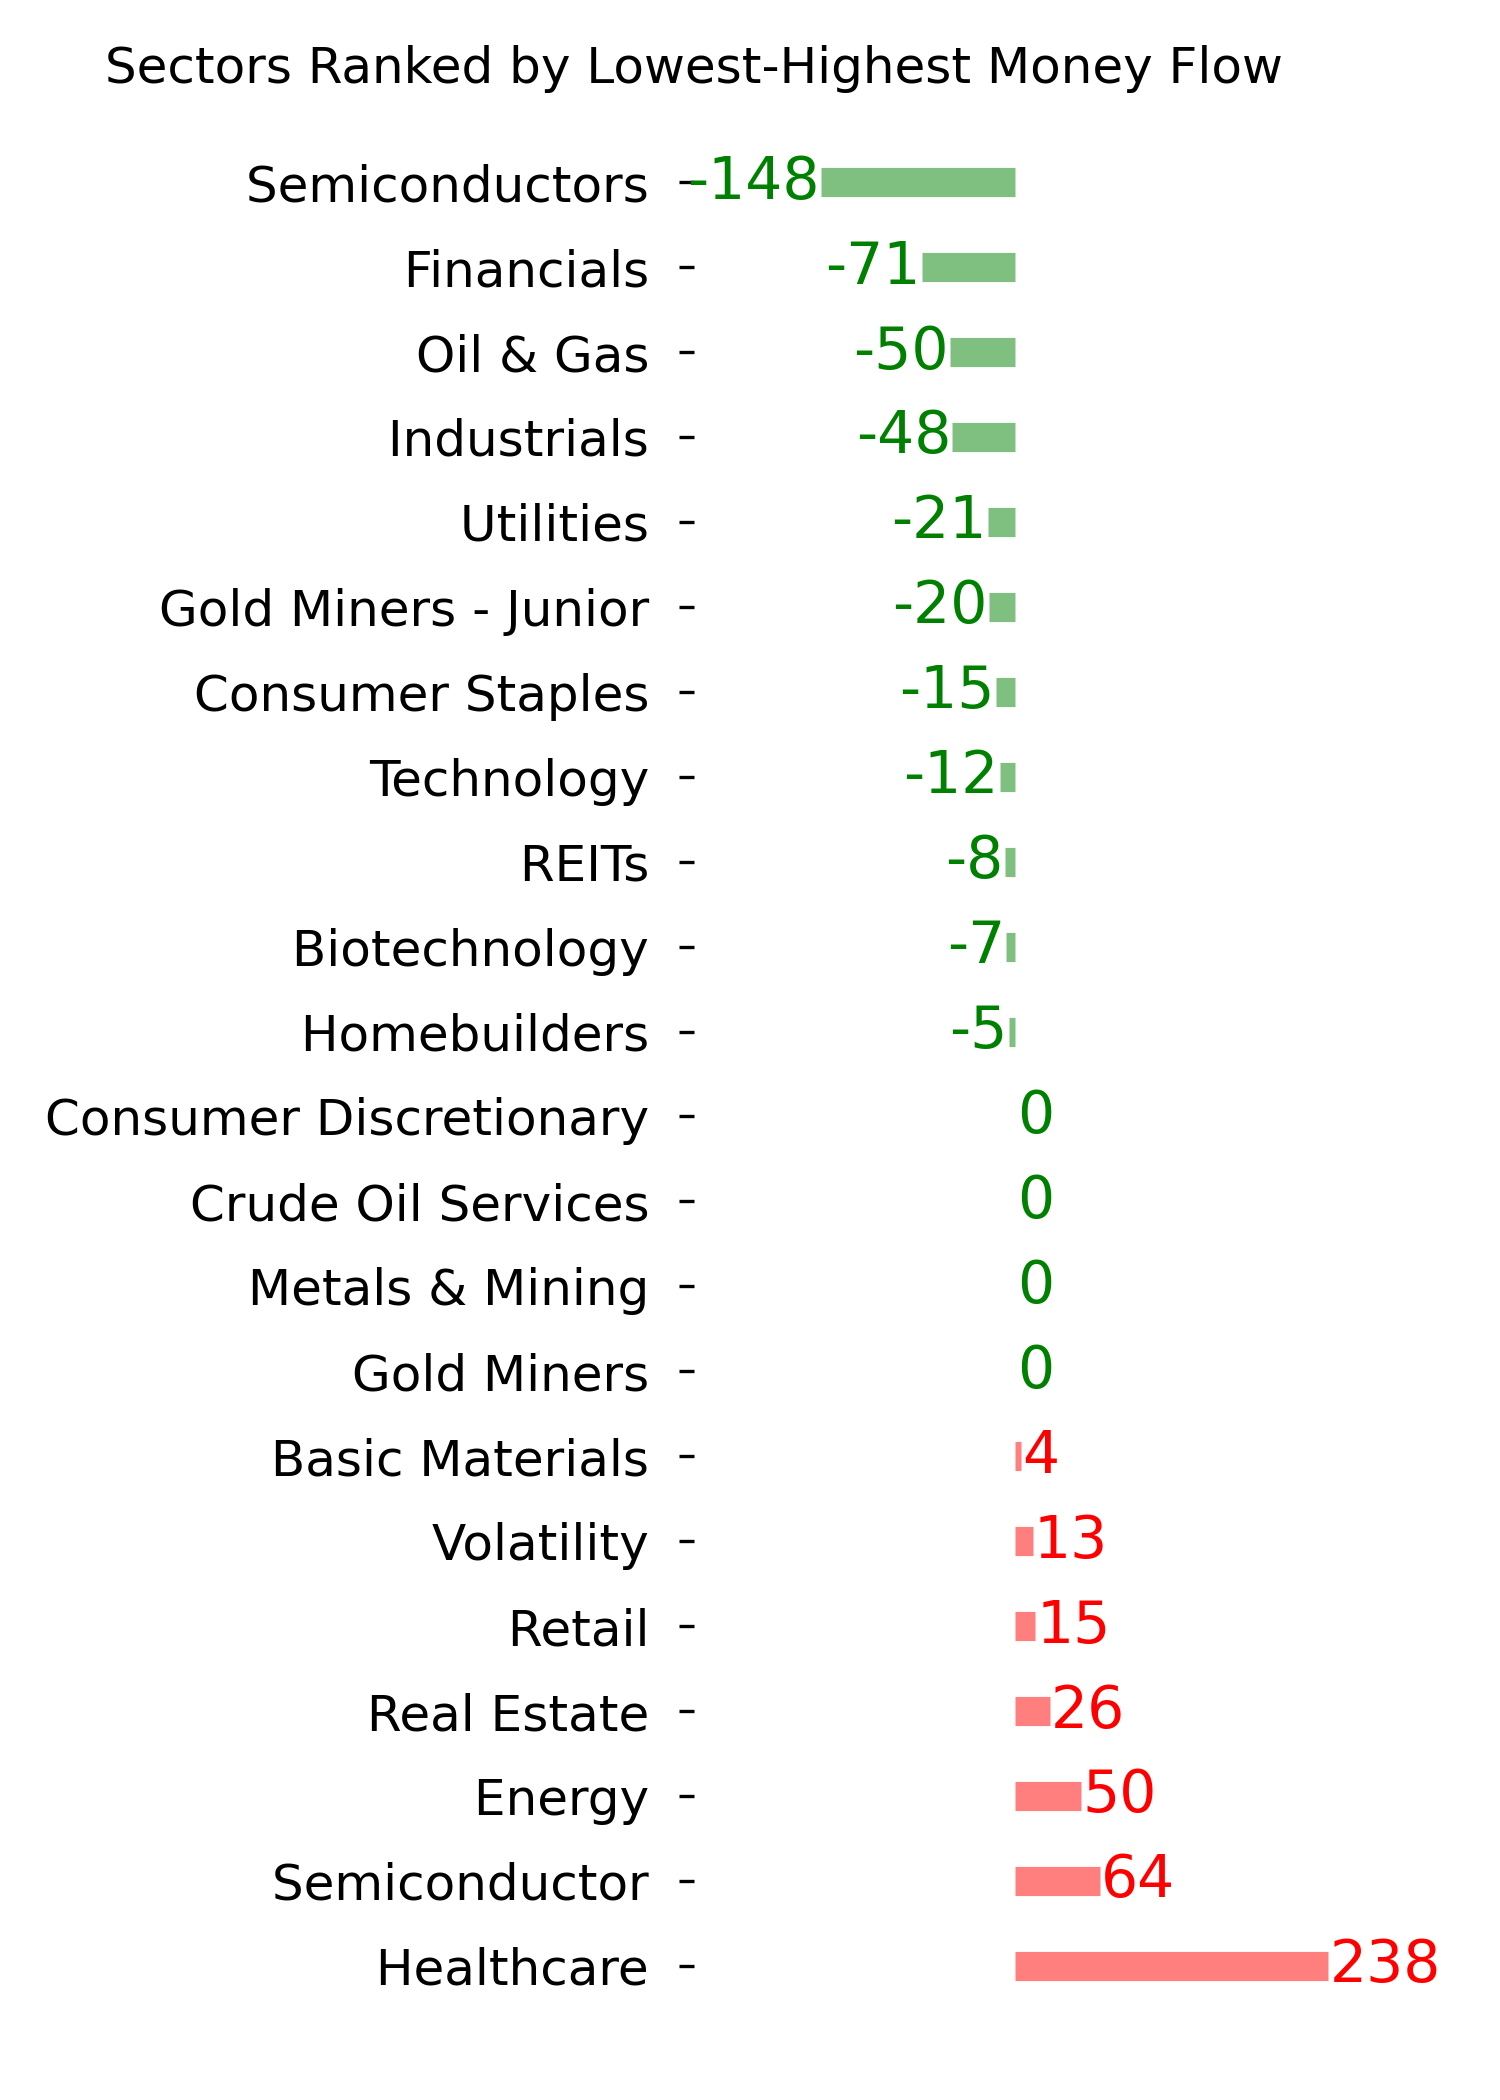
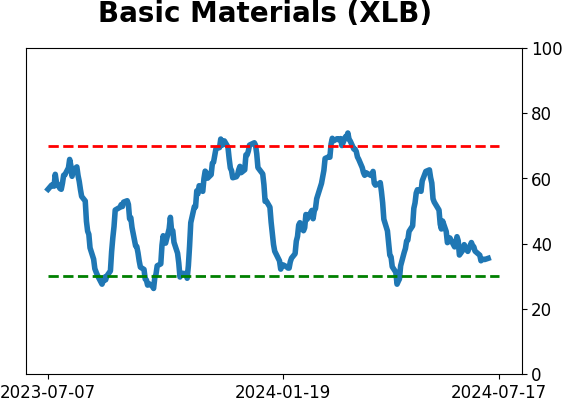
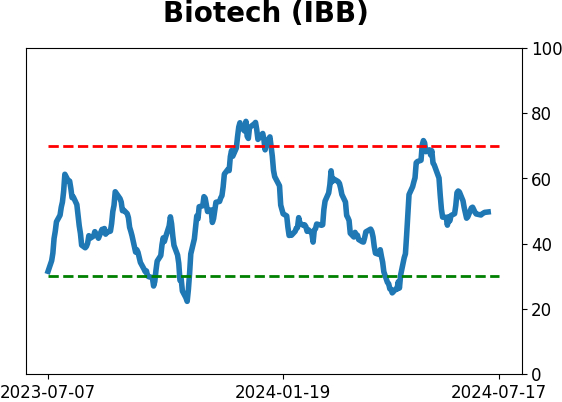
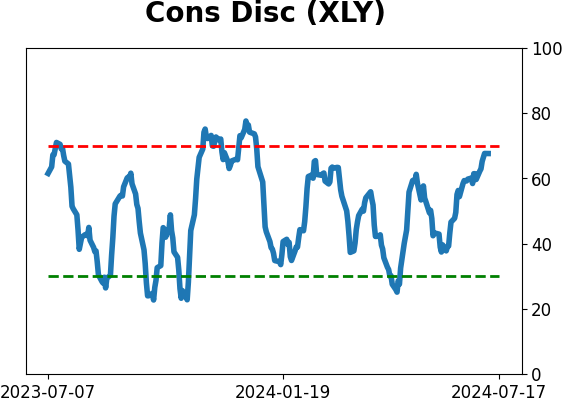
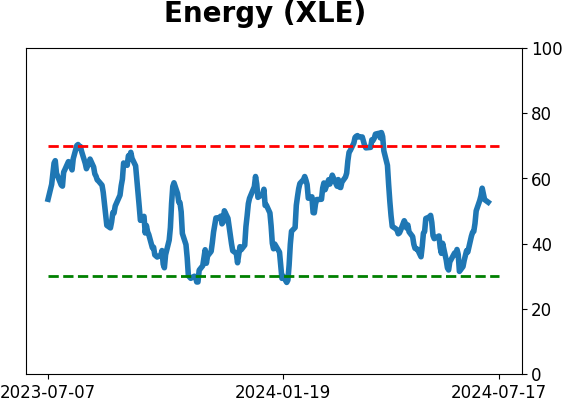
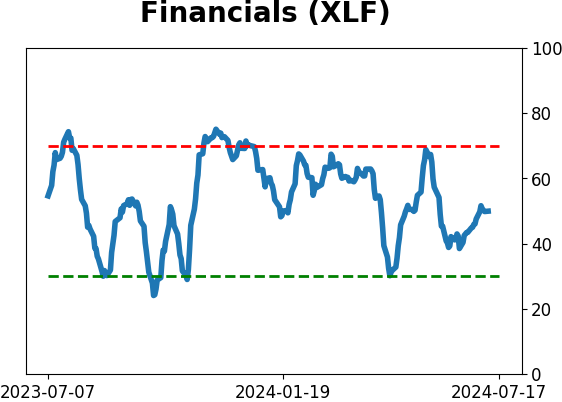
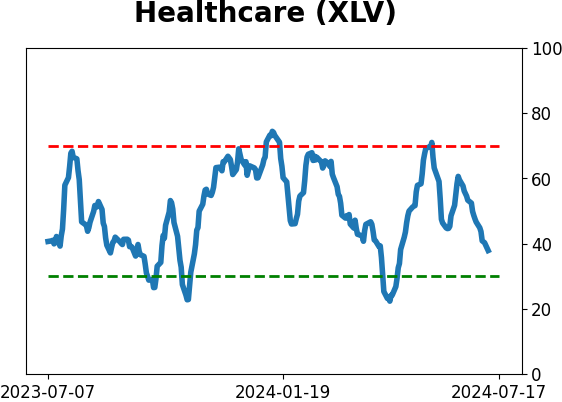
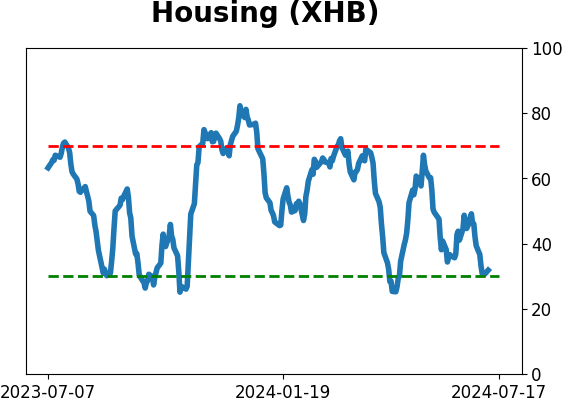
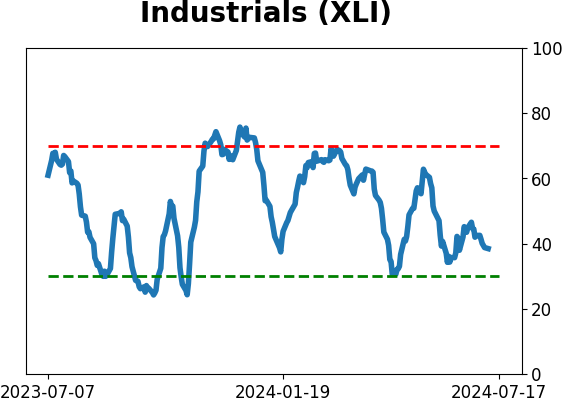
Sector ETF's - 10-Day Moving Average
|
|
|
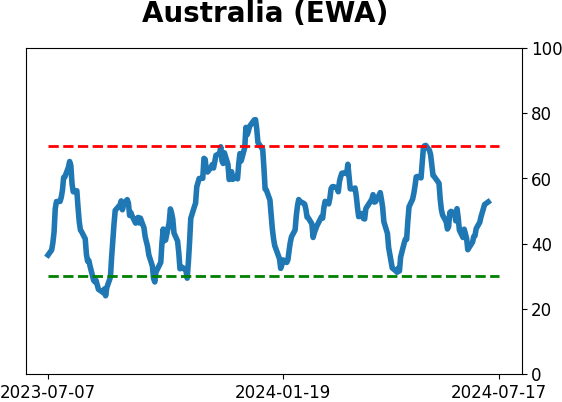
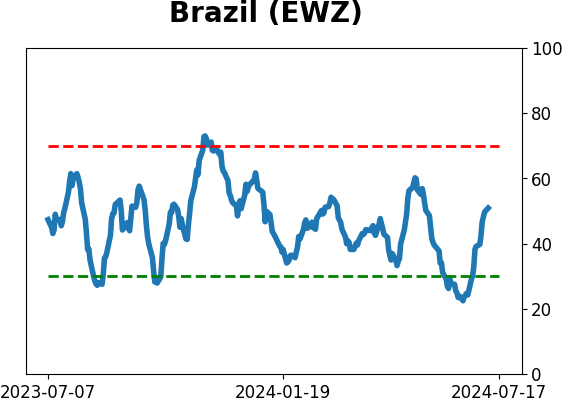
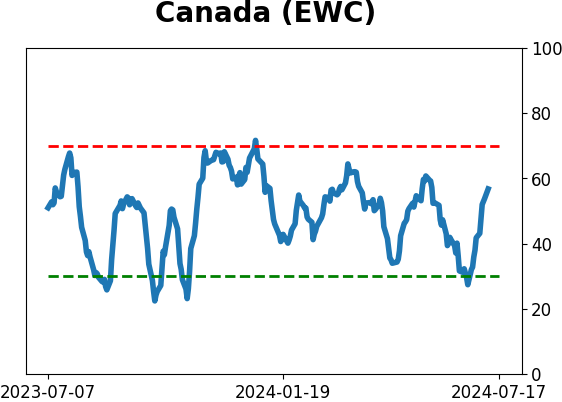
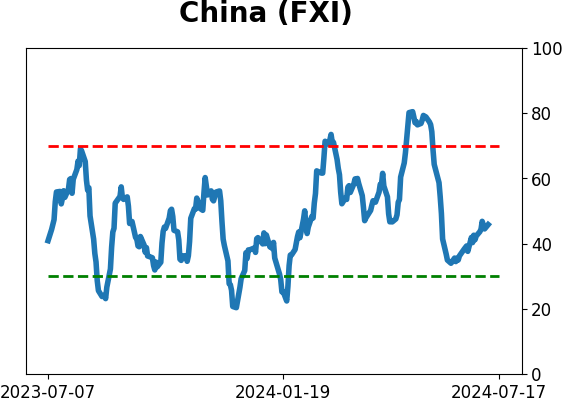
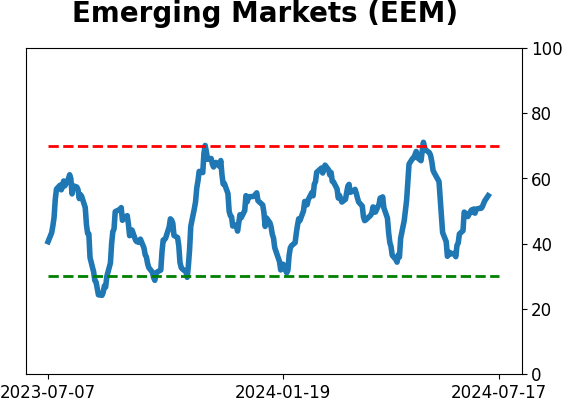
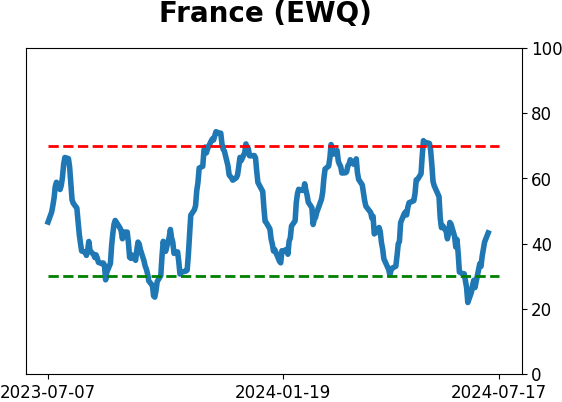
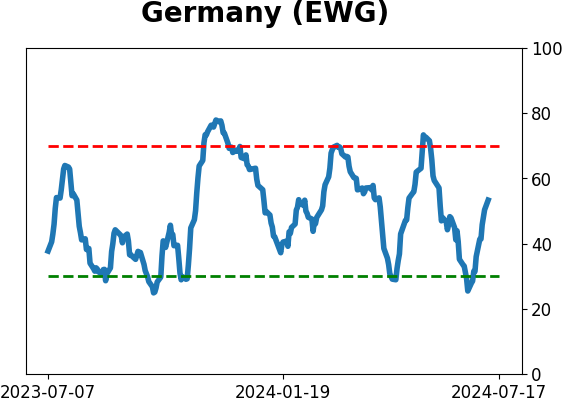
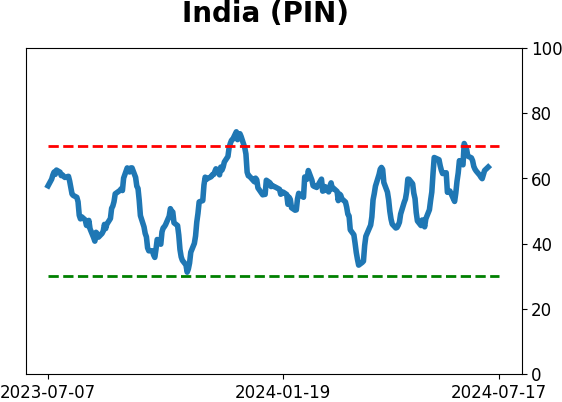
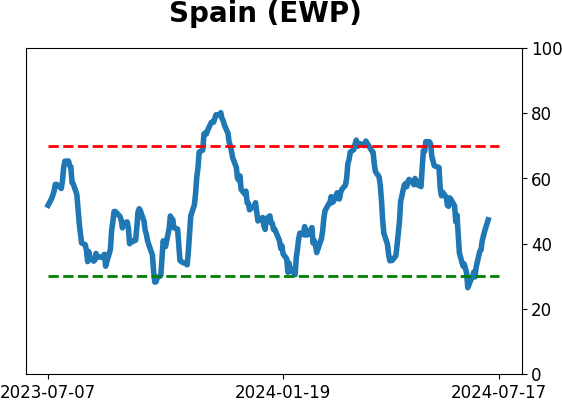
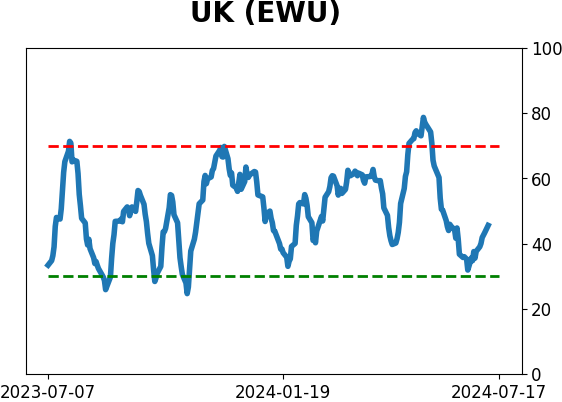
Country ETF's - 10-Day Moving Average
|
|
|
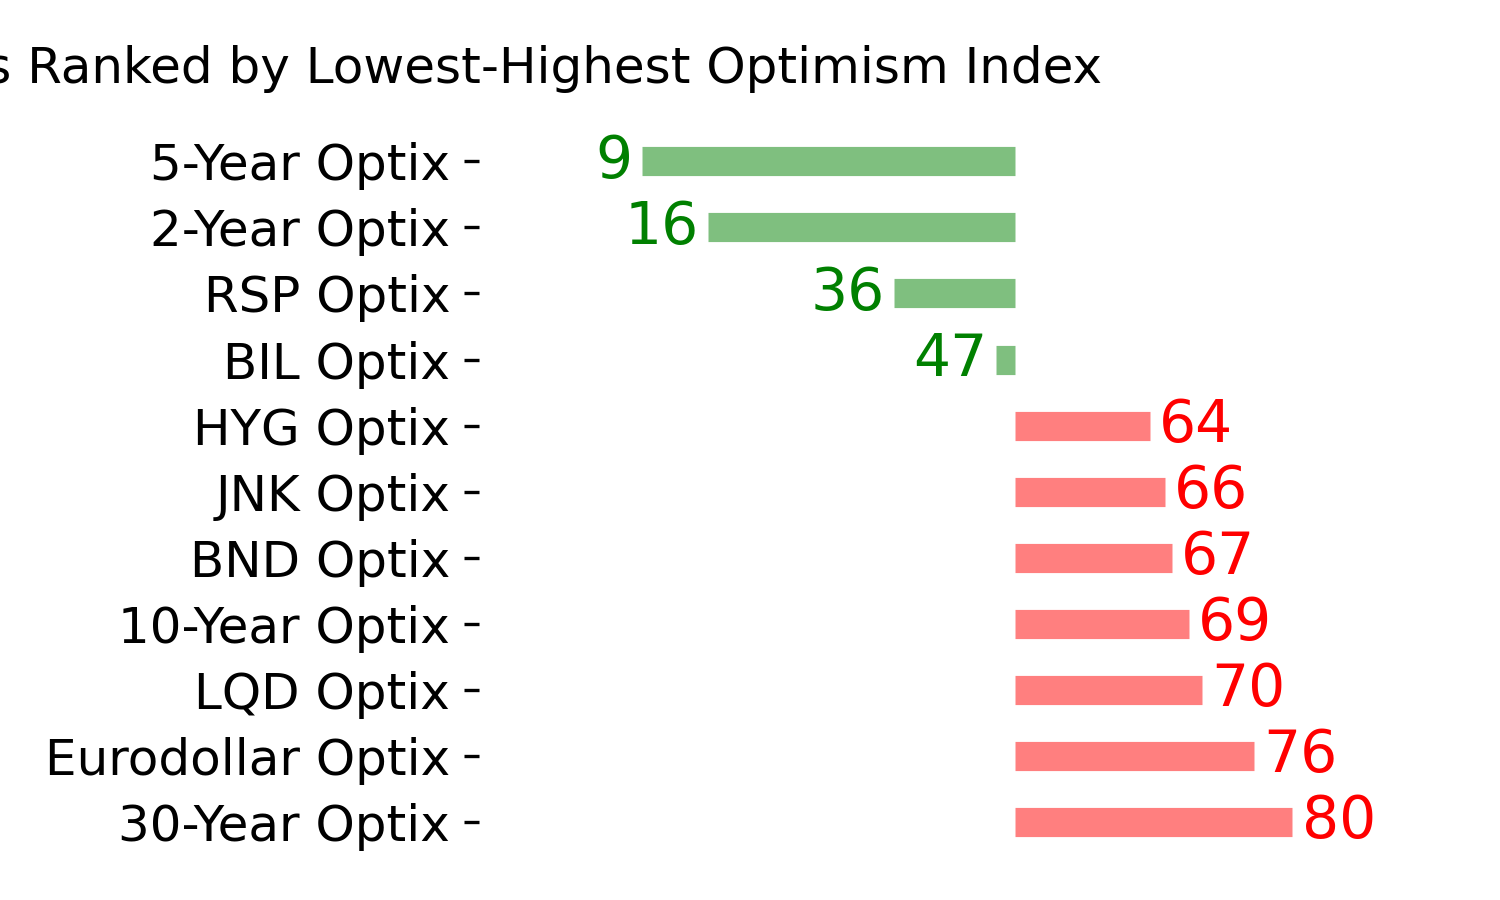
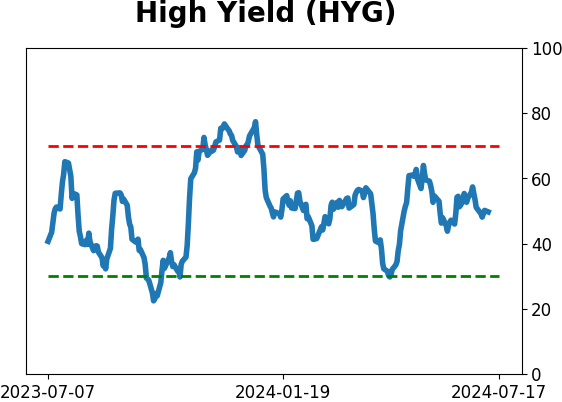
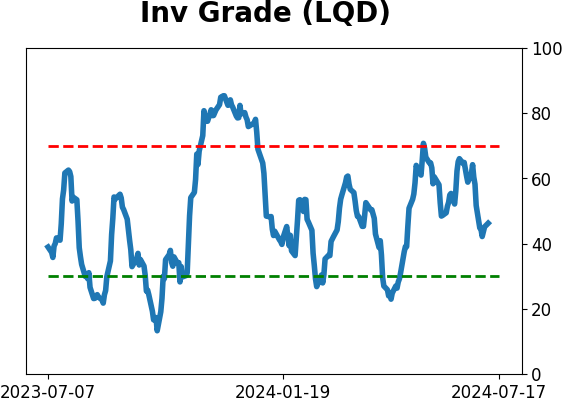
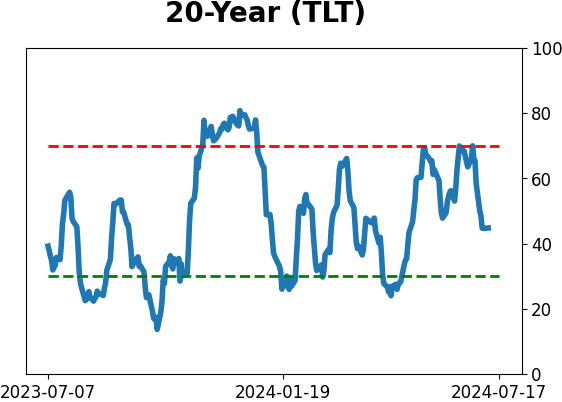
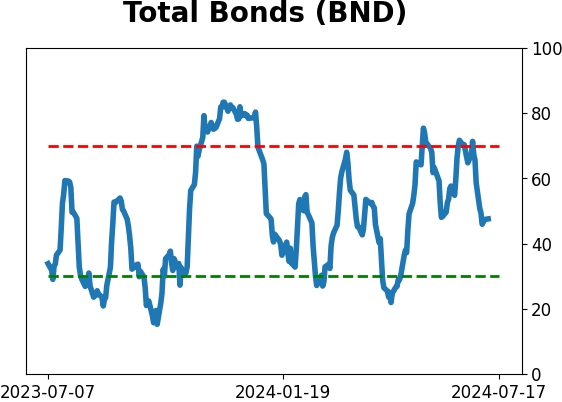
Bond ETF's - 10-Day Moving Average
|
|
|
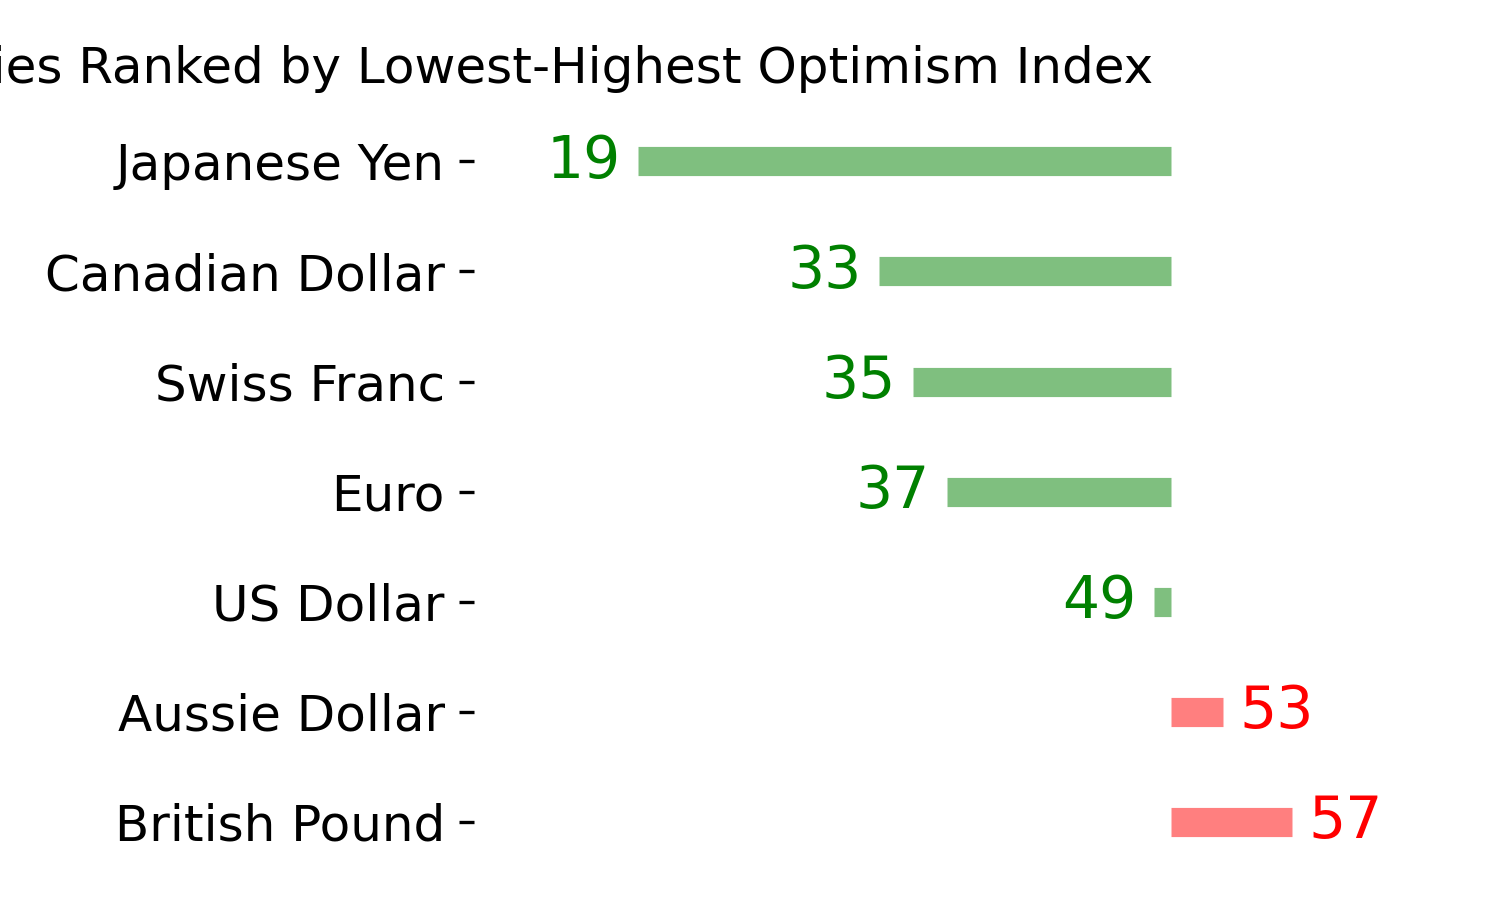
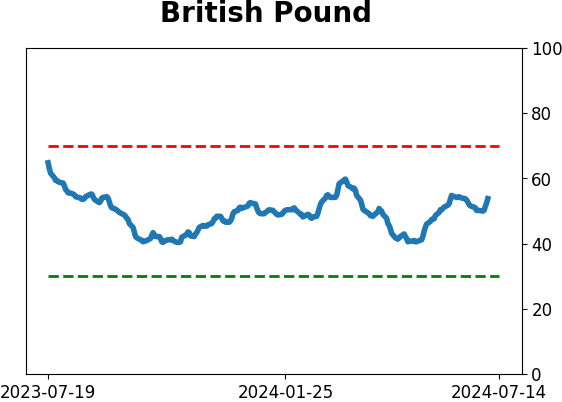
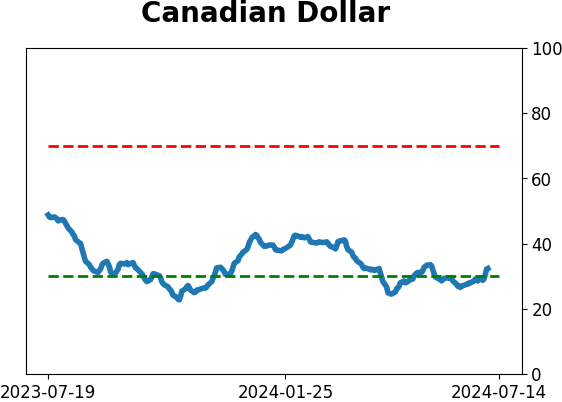
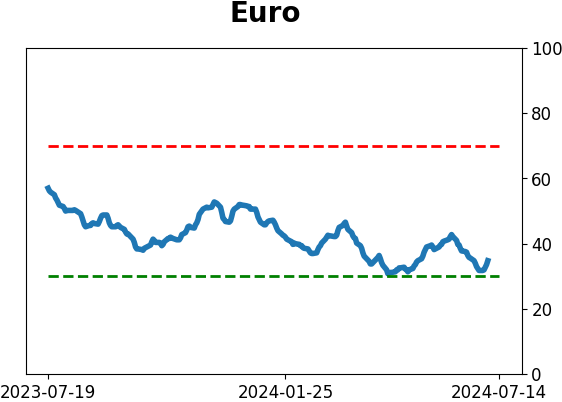
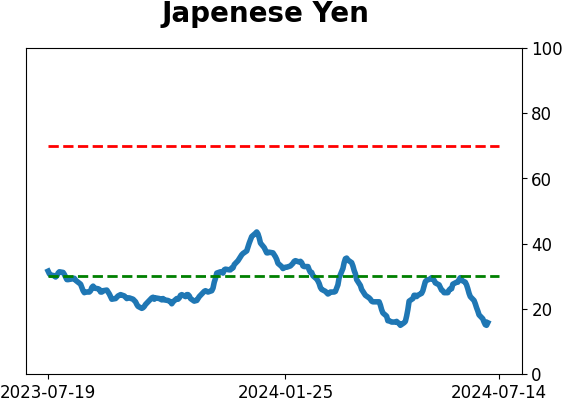
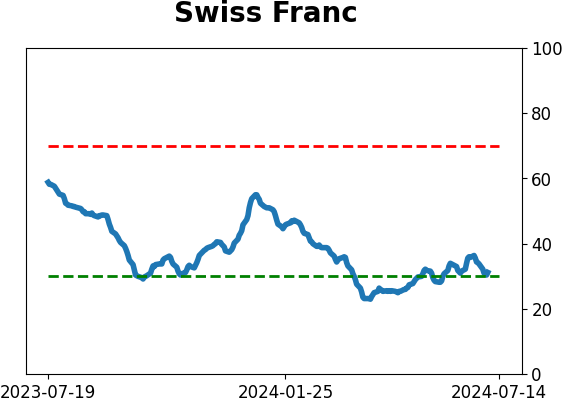
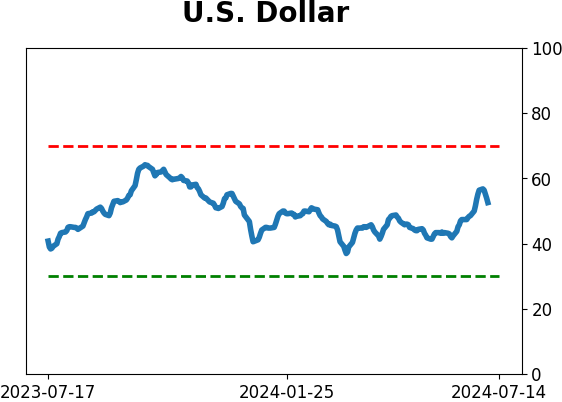
Currency ETF's - 5-Day Moving Average
|
|
|
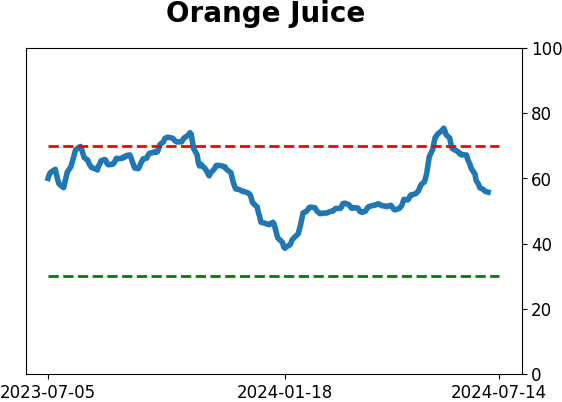
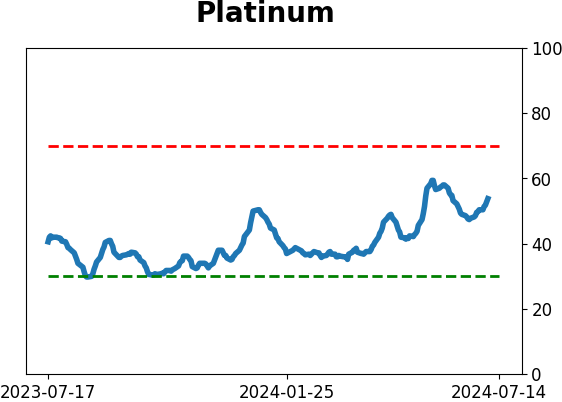
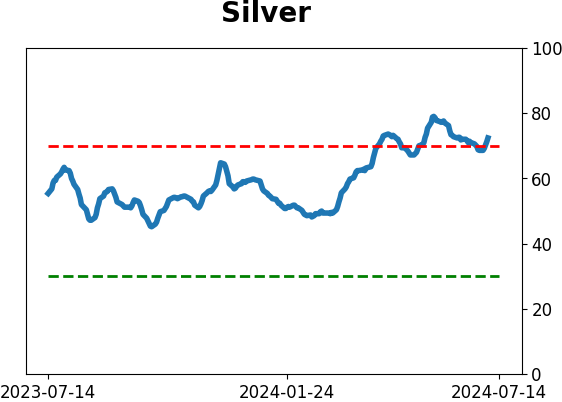
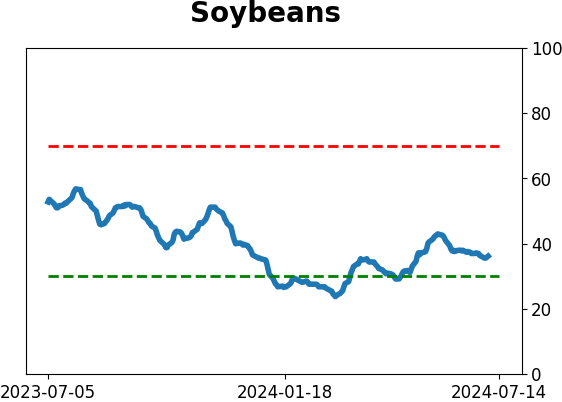
Commodity ETF's - 5-Day Moving Average
|
|