Headlines
|
|
The Value to Growth Dynamic Looks Oversold:
Over the past month, the ratio of Value to Growth stocks has tumbled. But that's within the context of a new longer-term uptrend, and previous drops have tended to resolve in the direction of the longer-term trend.
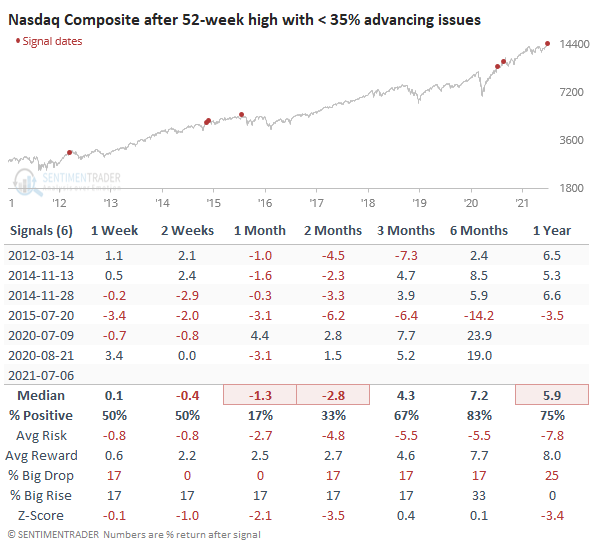
Participation problems: At sporadic times over the past 6 months, there have been odd days when the indexes rallied but with relatively few stocks going along for the ride. For the most part, those oddities didn't matter, as the indexes just kept plugging along. We're starting to see some more severe, and protracted, divergences now, which may morph into a real issue. Even on Tuesday, the Nasdaq Composite closed at a new high but with only 31% of stocks advancing. That's the lowest out of any of the 1,080 days when the Composite has closed at a new high since 1984.
Bottom Line:
See the Outlook & Allocations page for more details on these summaries STOCKS: Hold
The speculative frenzy in February is wrung out. Internal dynamics have mostly held up, with some exceptions. Many of our studies still show a mixed to poor short-term view, with medium- and long-term ones turning more positive. BONDS: Hold
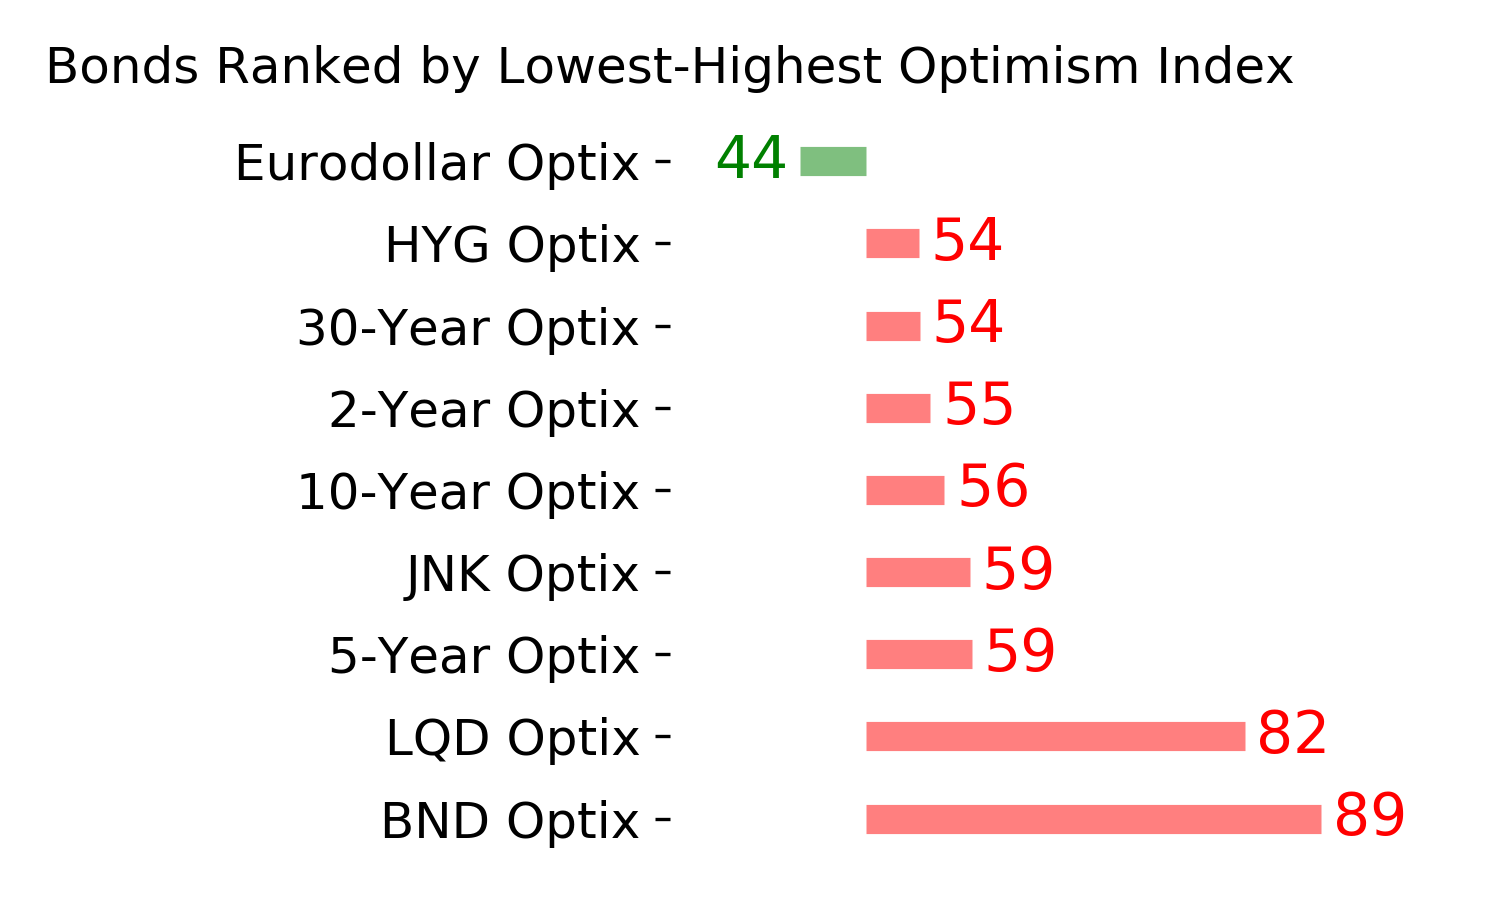
Various parts of the market got hit in March, with the lowest Bond Optimism Index we usually see during healthy environments. After a shaky couple of weeks, the broad bond market has modestly recovered. Not a big edge here either way. GOLD: Hold
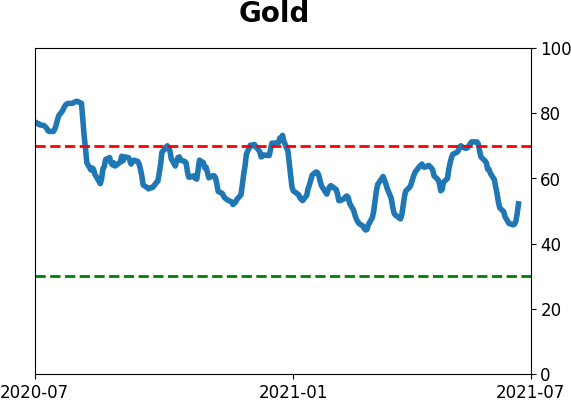
Gold and miners have done very well, recovering above long-term trend lines. The issue is that both have tended to perform poorly after similar situations - will have to wait and see how it plays out.
|
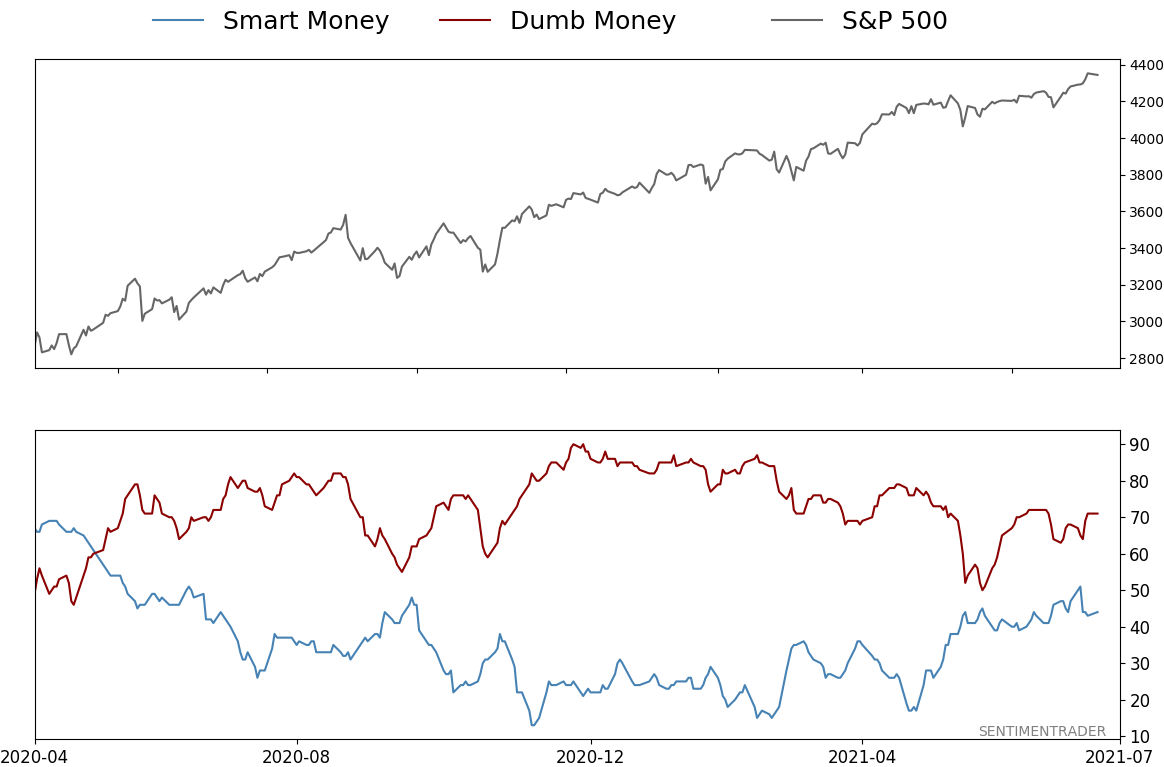
Smart / Dumb Money Confidence
|
Smart Money Confidence: 44%
Dumb Money Confidence: 71%
|
|
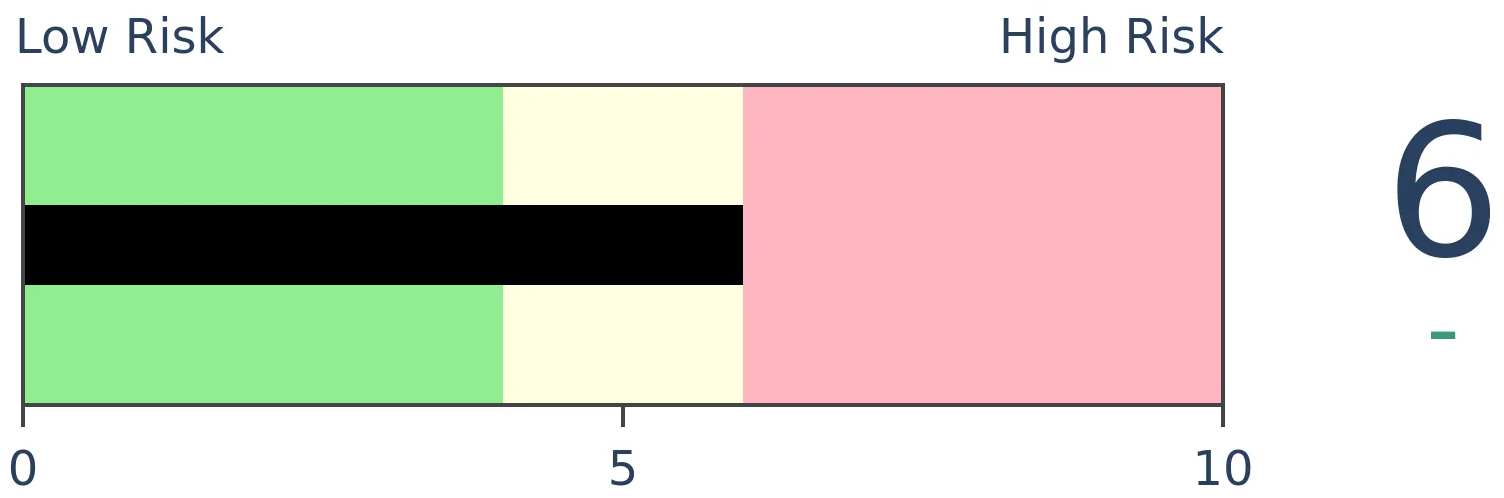
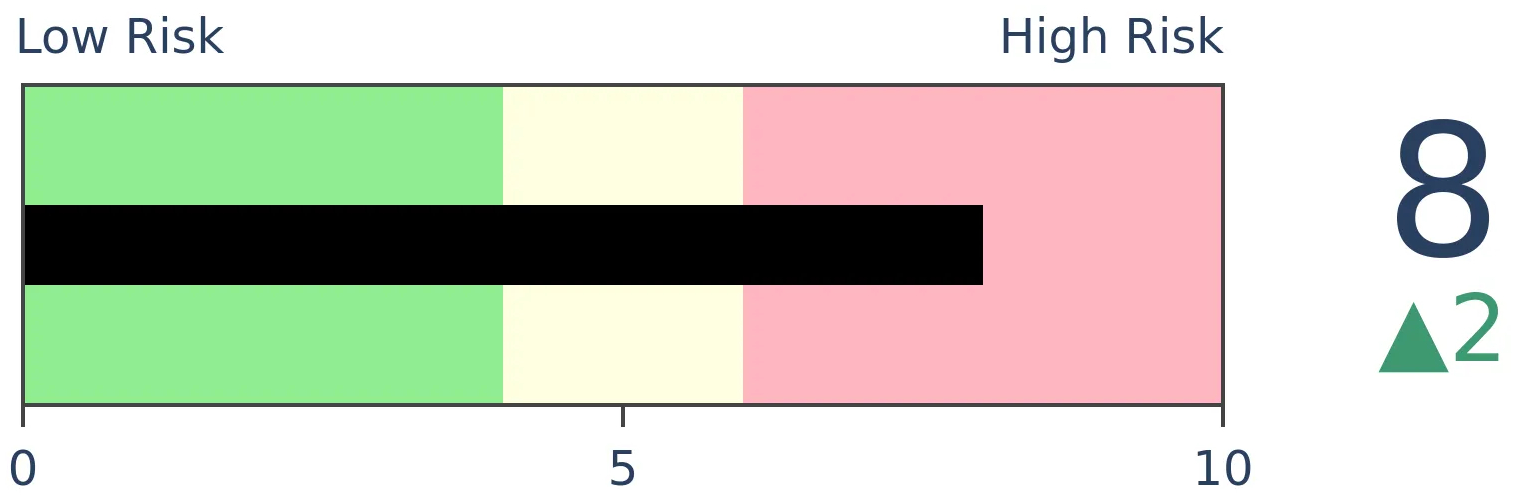
Risk Levels
Stocks Short-Term

|
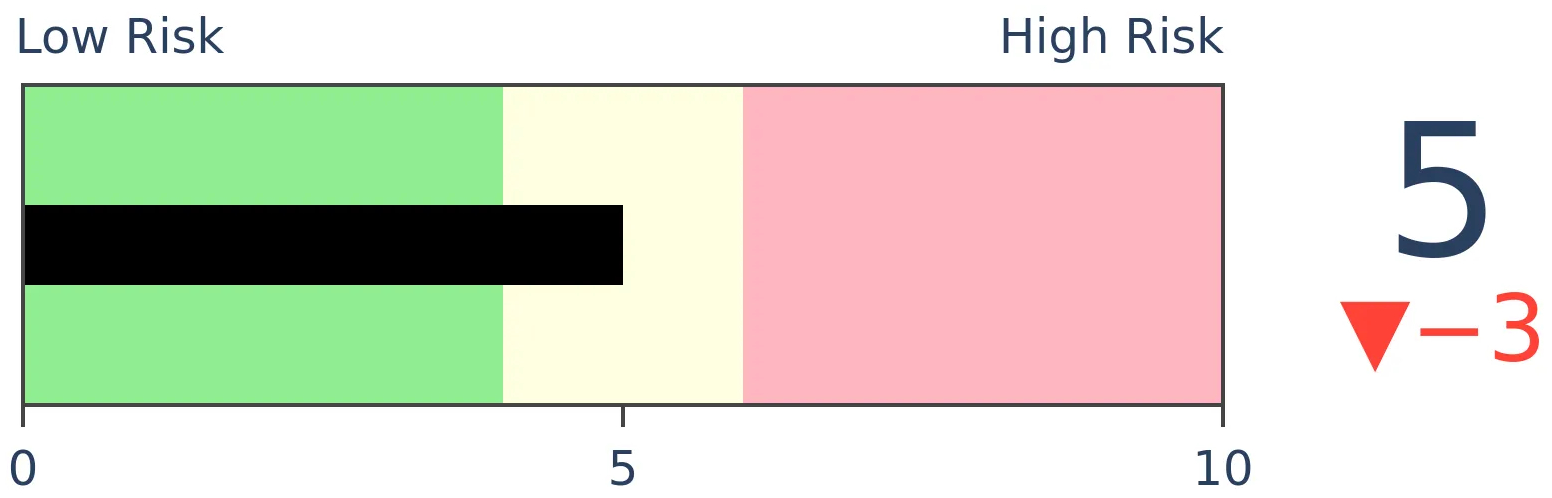
Stocks Medium-Term
|
|
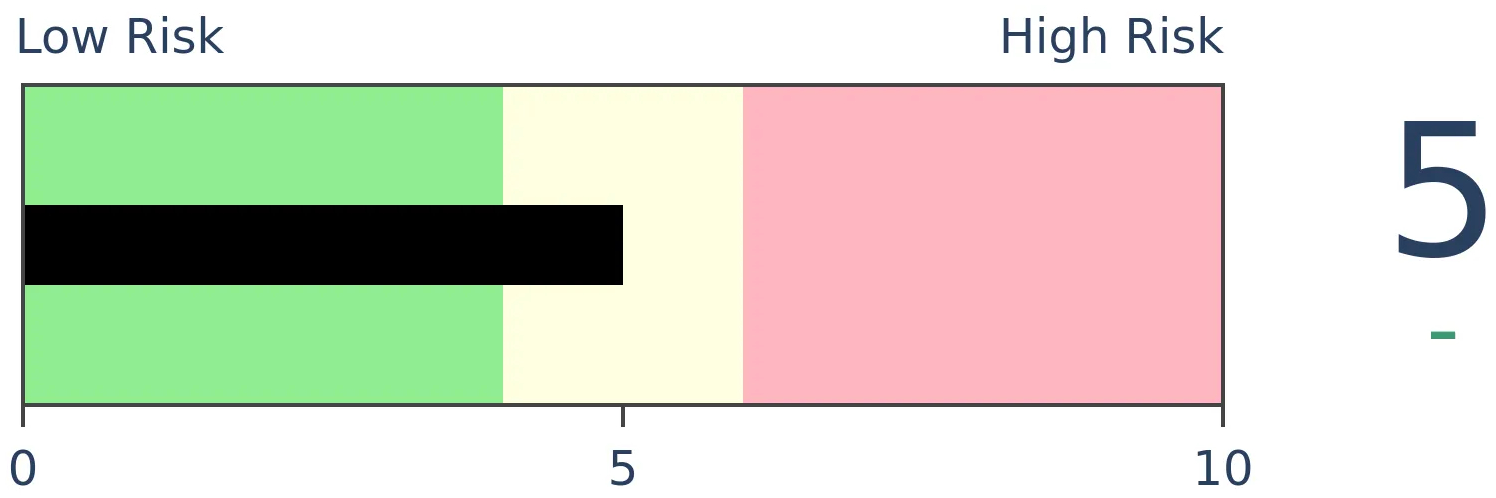
Bonds
|
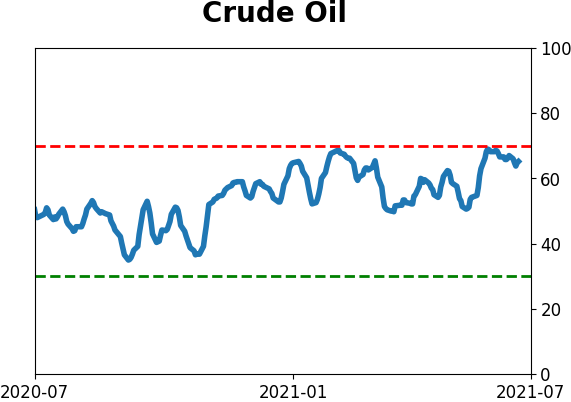
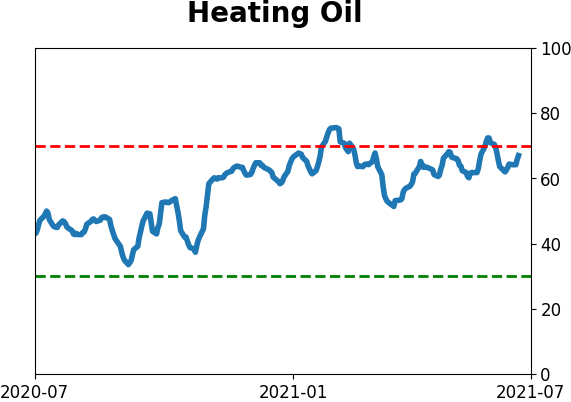
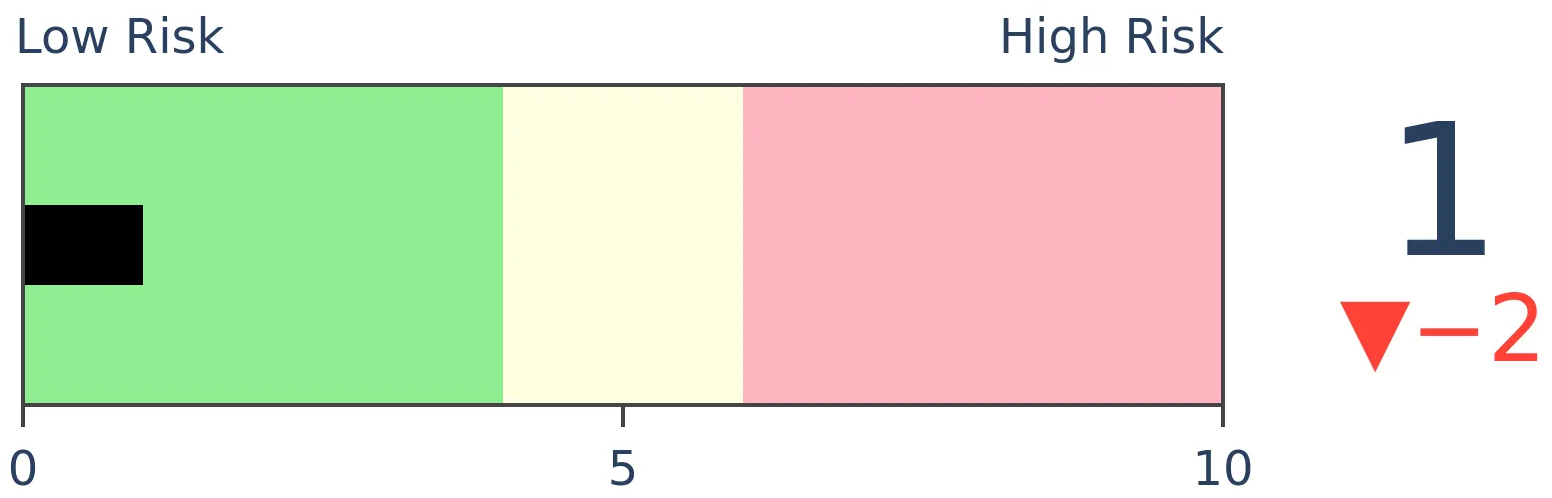
Crude Oil
|
|
Gold
|
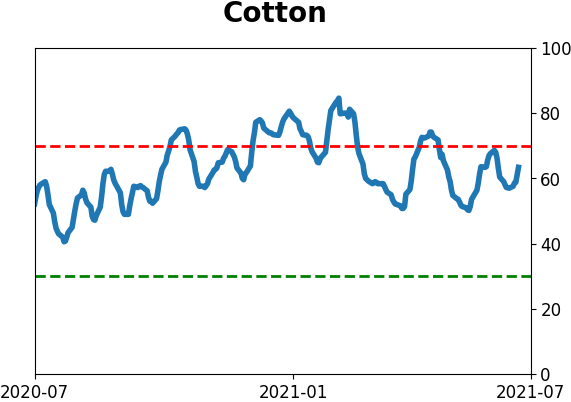
Agriculture
|
|
Research
BOTTOM LINE
Over the past month, the ratio of Value to Growth stocks has tumbled. But that's within the context of a new longer-term uptrend, and previous drops have tended to resolve in the direction of the longer-term trend.
FORECAST / TIMEFRAME
None
|
Much of what we've seen on the site for months has favored Value over Growth as the best opportunity to tilt a portfolio for forward returns without trying to predict overall market direction.
That's been working but took a big hit in June and continues even today. The total return ratio between the Russell 3000 Value Index versus the Growth Index tumbled more than 7.5% over the past month, one of the largest losses in years.
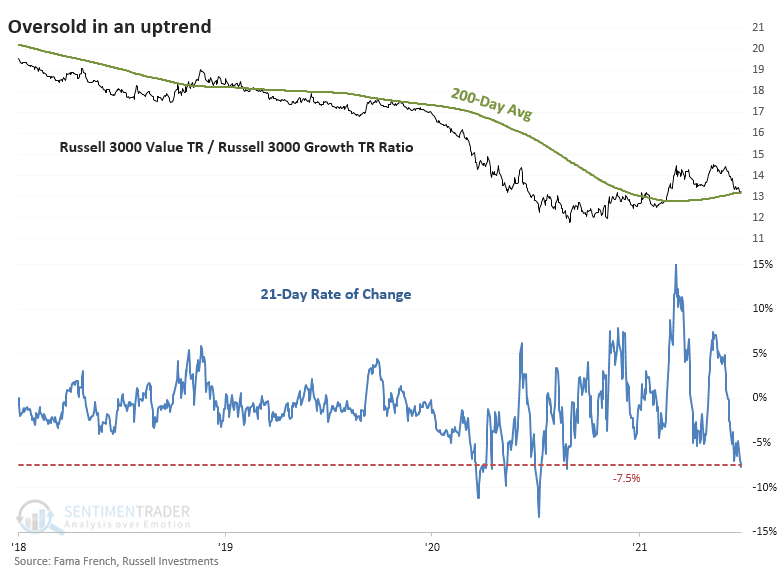
One difference with the recent losses is context - it's happening in an uptrend. Unlike the large rolling 1-month losses during much of 2020, the 200-day average of the Value/Growth Ratio is rising.
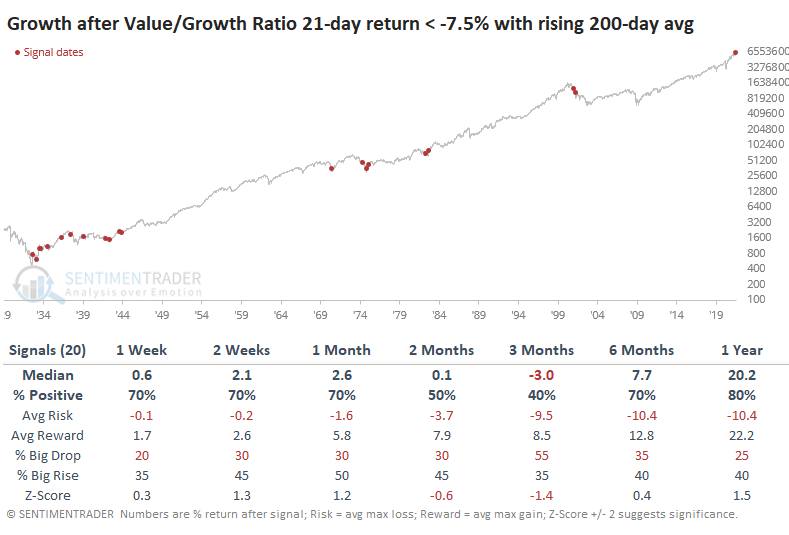
TIME FOR VALUE TO REASSERT ITSELF
If we focus on large declines in the ratio only within uptrends, we can see that losses this large have typically resulted in the trend reasserting itself rather than sliding into another long-term downtrend.
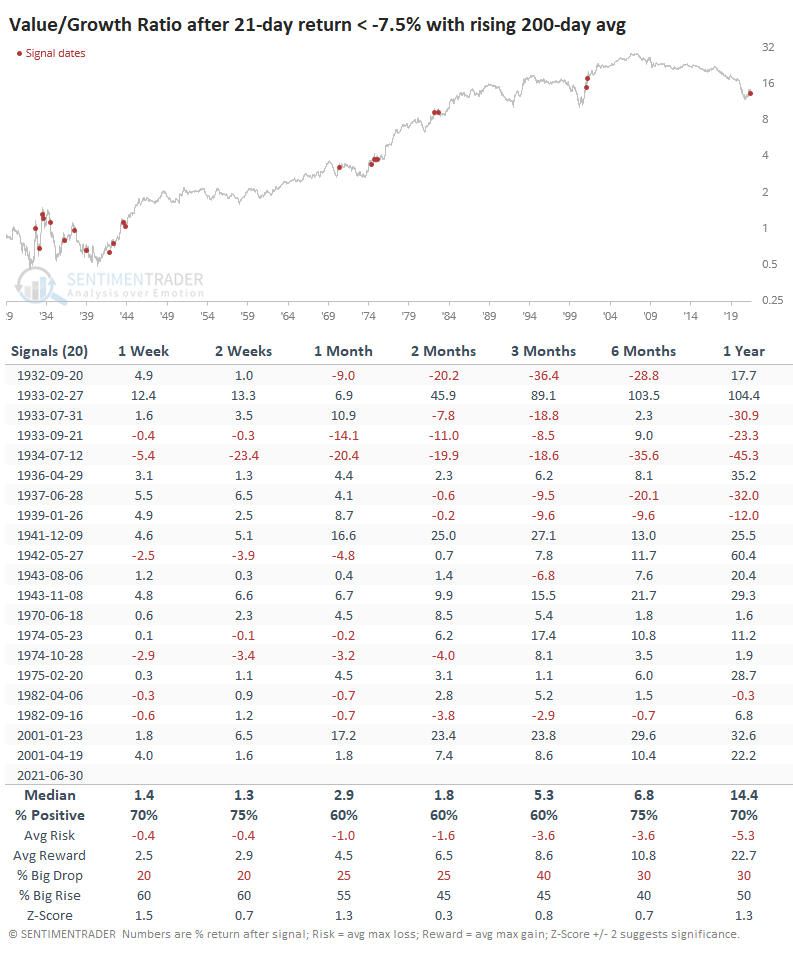
The ratio was extremely volatile in the 1930s, so many of the precedents were triggered then. If we focus on modern markets, say since 1950, then things clear up a bit.
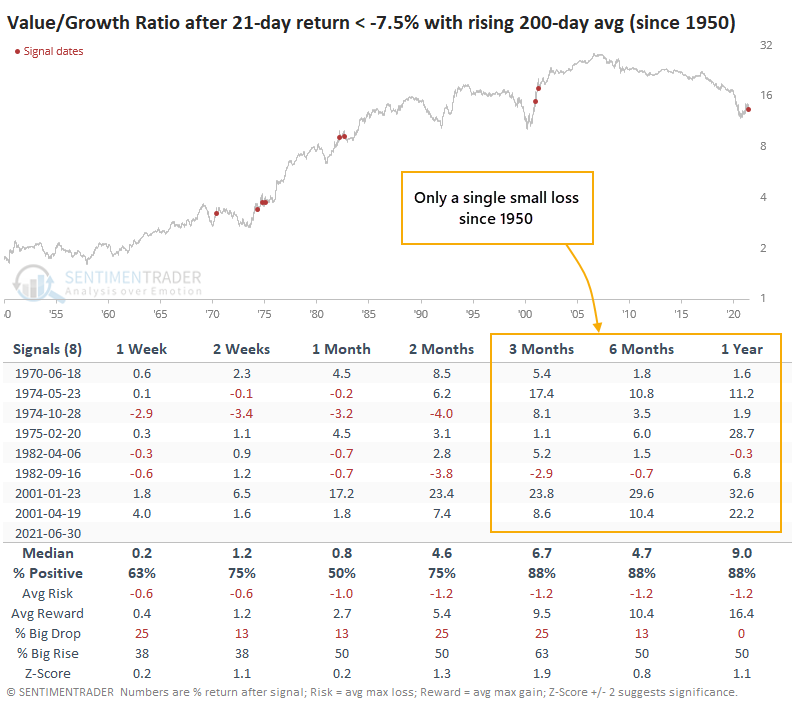
When looking at each factor's total return across all the signals, Value clearly showed better performance.
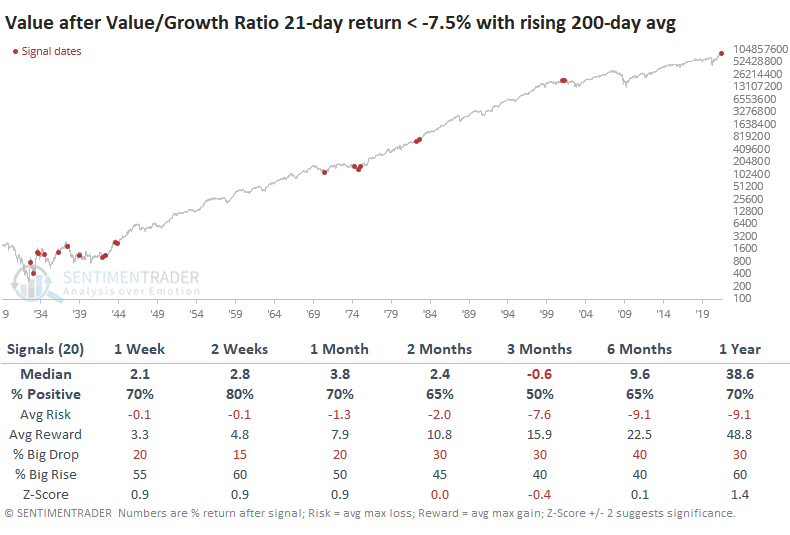
Returns in Growth were less consistent, with a significantly lower median return and higher risk combined with smaller reward.
MAYBE (?) A WARNING FOR THE BROADER MARKET
For the overall market, defined by the S&P 500, it was a mixed signal, with inferior returns since 1950. The only signal that preceded large and sustained gains - and it was a biggie - was 1982.
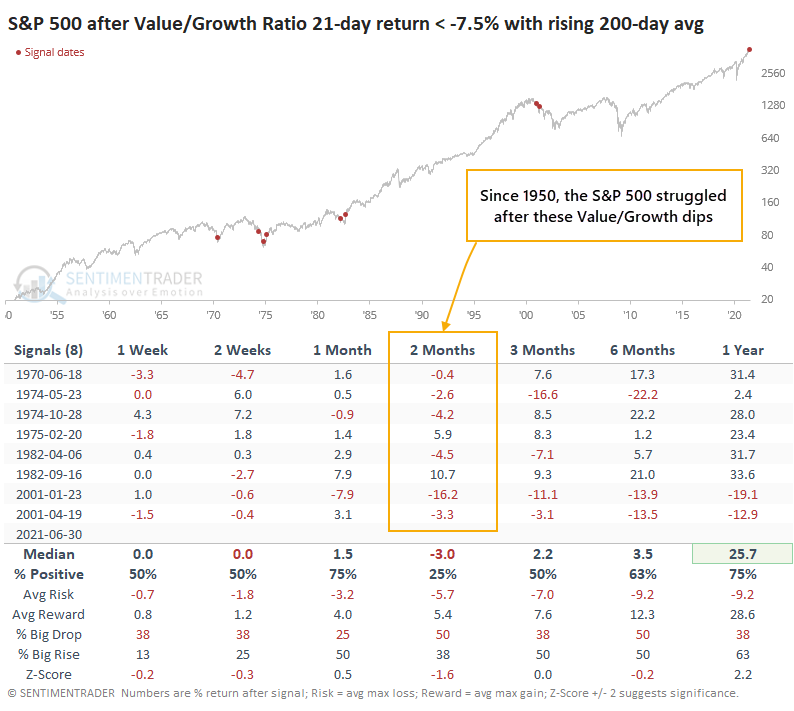
We'd consider this less of a signal for the broad market. It was more consistent for prospects in Value versus Growth stocks. Signals have been pointing that way for months, and the recent setback doesn't look like a reliable reason to abandon it.
Active Studies
| Time Frame | Bullish | Bearish | | Short-Term | 0 | 1 | | Medium-Term | 2 | 2 | | Long-Term | 9 | 5 |
|
Indicators at Extremes
Portfolio
| Position | Description | Weight % | Added / Reduced | Date | | Stocks | RSP | 4.1 | Added 4.1% | 2021-05-19 | | Bonds | 23.9% BND, 6.9% SCHP | 30.7 | Reduced 7.1% | 2021-05-19 | | Commodities | GCC | 2.6 | Reduced 2.1%
| 2020-09-04 | | Precious Metals | GDX | 5.6 | Reduced 4.2% | 2021-05-19 | | Special Situations | 4.3% XLE, 2.2% PSCE | 7.6 | Reduced 5.6% | 2021-04-22 | | Cash | | 49.4 | | |
|
Updates (Changes made today are underlined)
Much of our momentum and trend work has remained positive for several months, with some scattered exceptions. Almost all sentiment-related work has shown a poor risk/reward ratio for stocks, especially as speculation drove to record highs in exuberance in February. Much of that has worn off, and most of our models are back toward neutral levels. There isn't much to be excited about here. The same goes for bonds and even gold. Gold has been performing well lately and is back above long-term trend lines. The issue is that it has a poor record of holding onto gains when attempting a long-term trend change like this, so we'll take a wait-and-see approach. RETURN YTD: 9.3% 2020: 8.1%, 2019: 12.6%, 2018: 0.6%, 2017: 3.8%, 2016: 17.1%, 2015: 9.2%, 2014: 14.5%, 2013: 2.2%, 2012: 10.8%, 2011: 16.5%, 2010: 15.3%, 2009: 23.9%, 2008: 16.2%, 2007: 7.8%
|
|
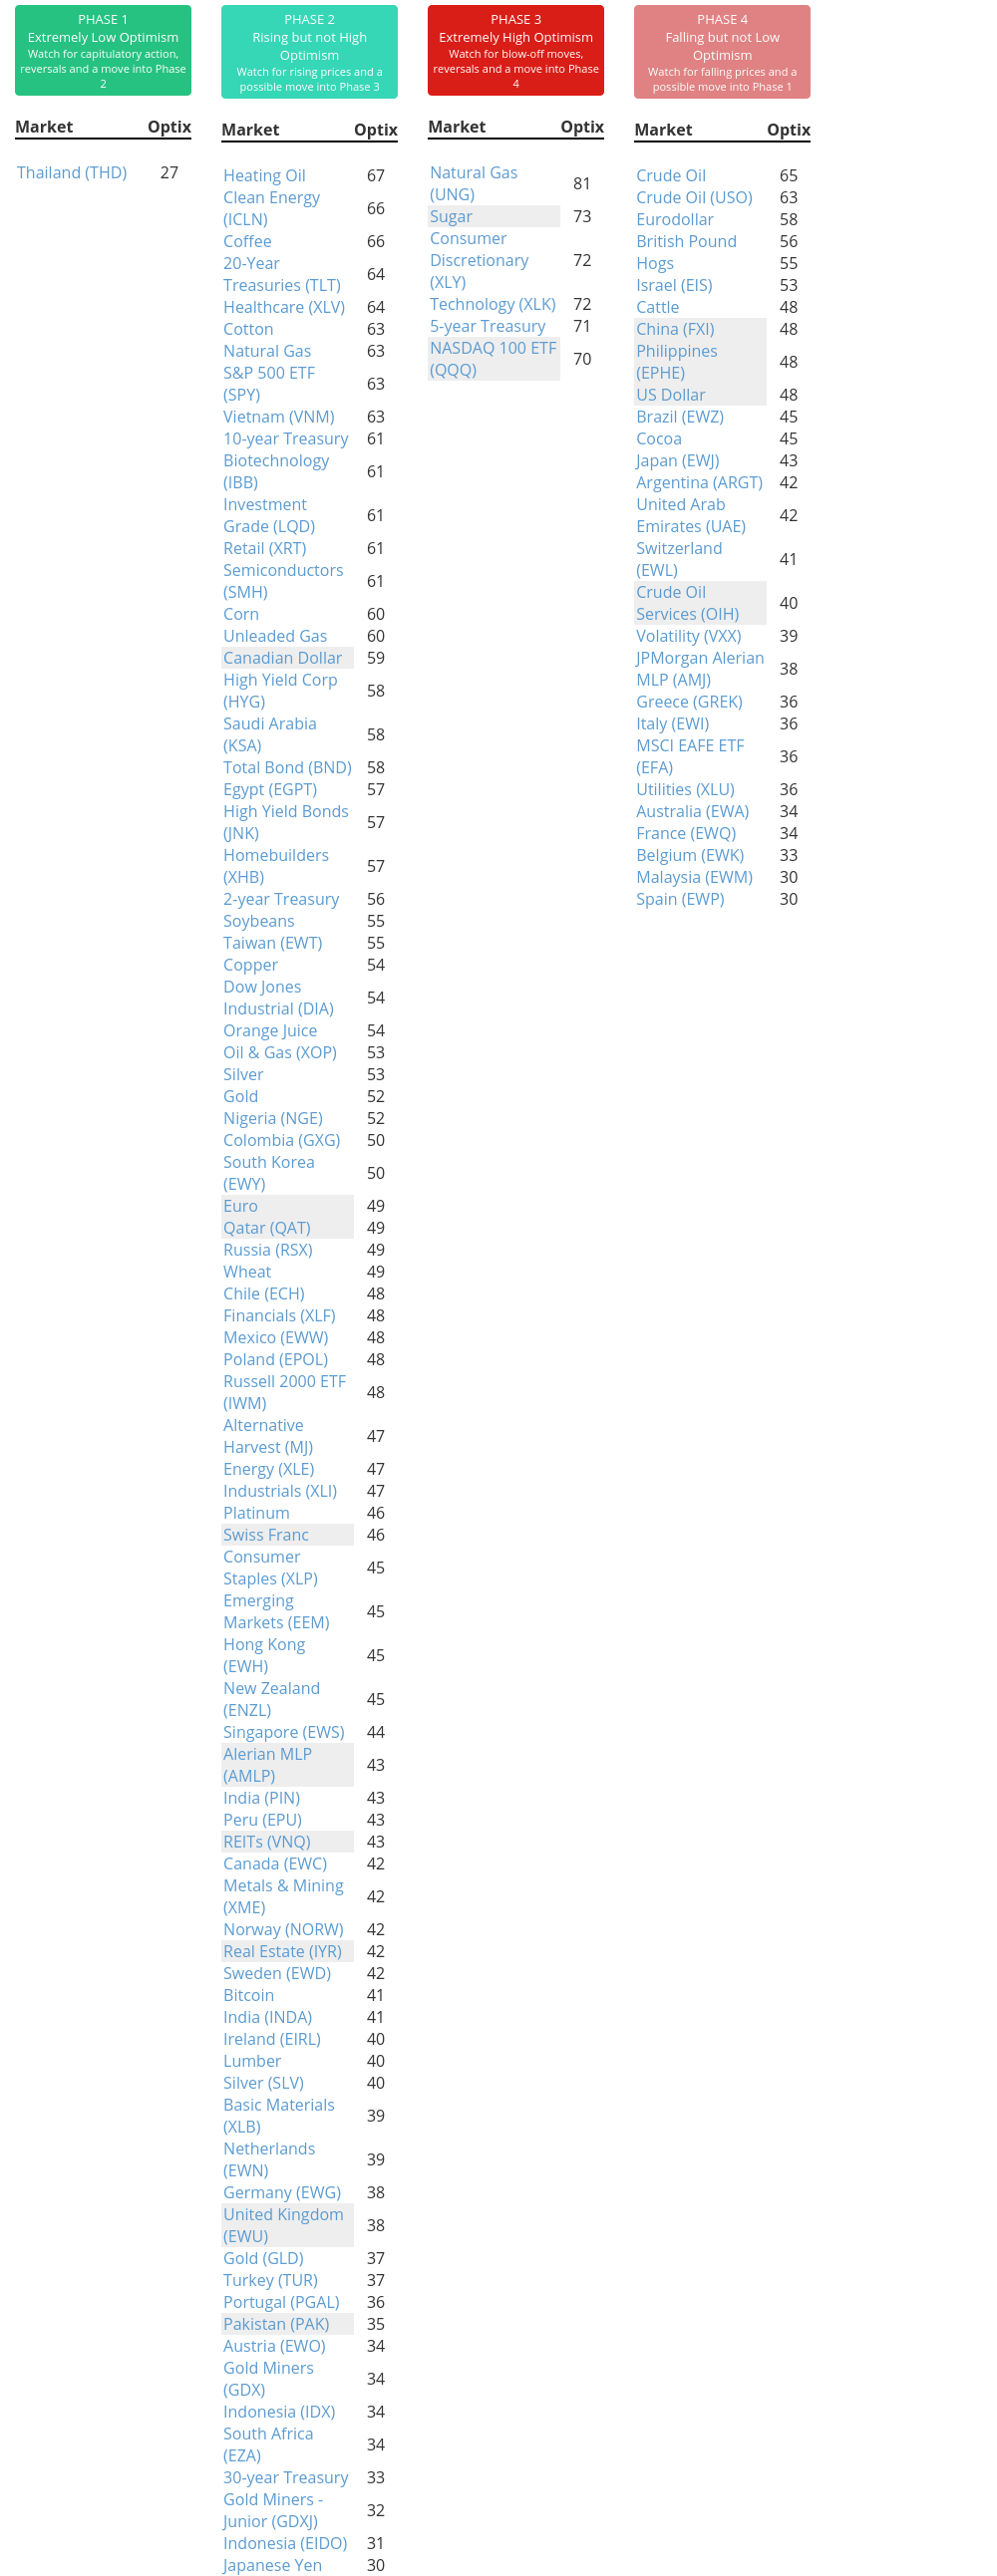
Phase Table
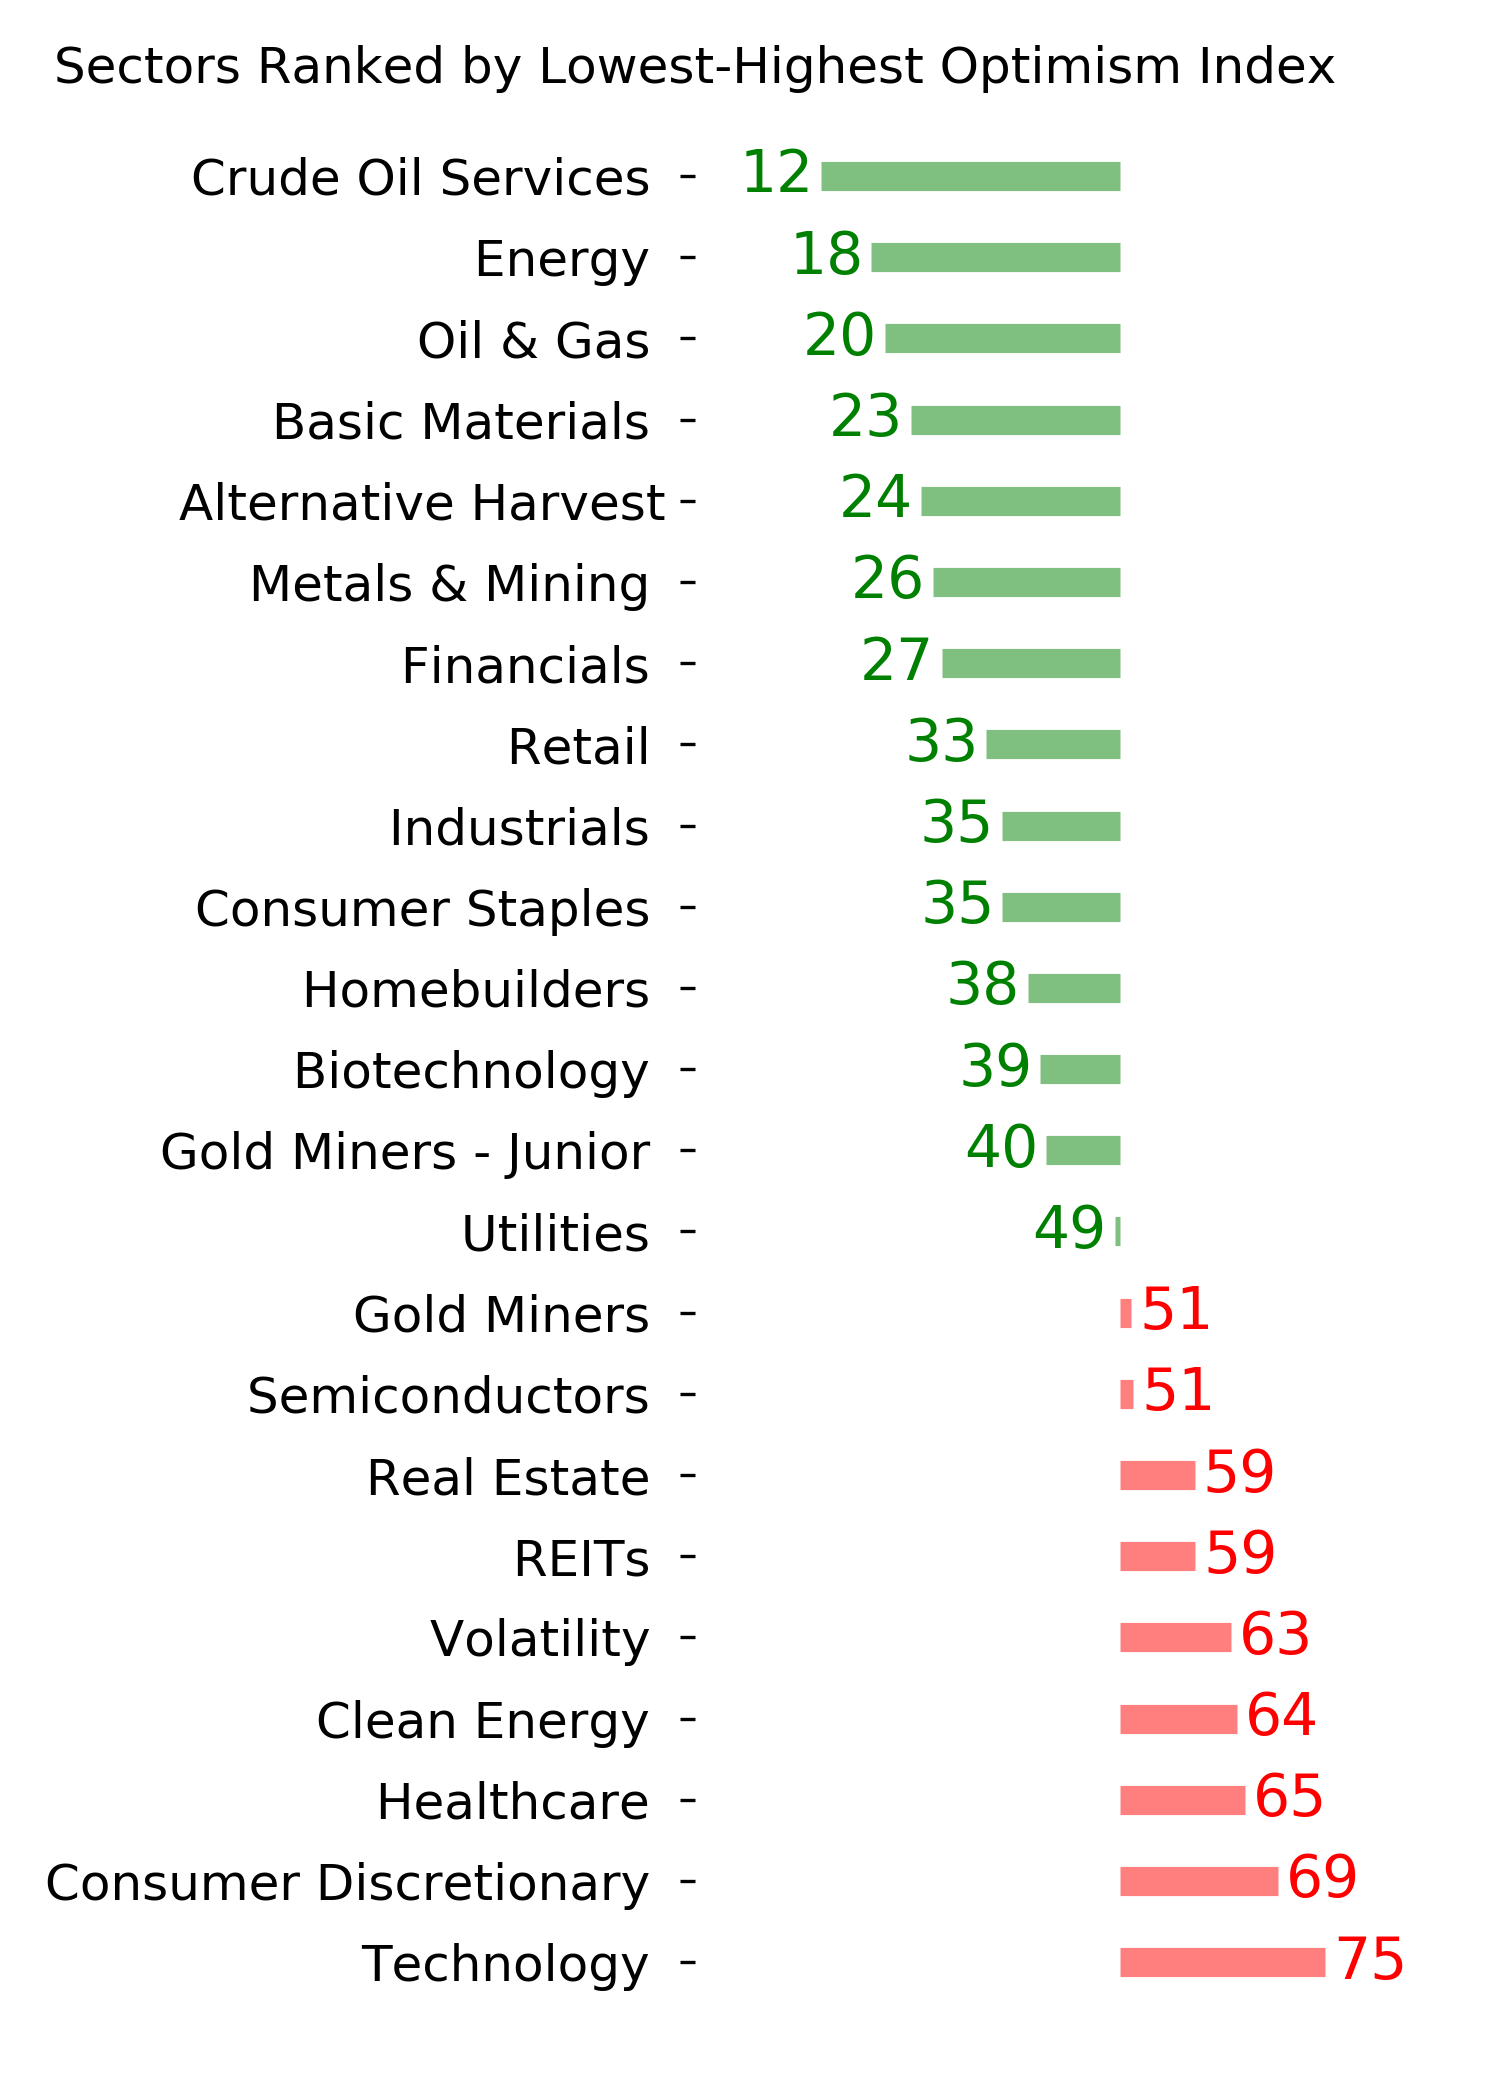
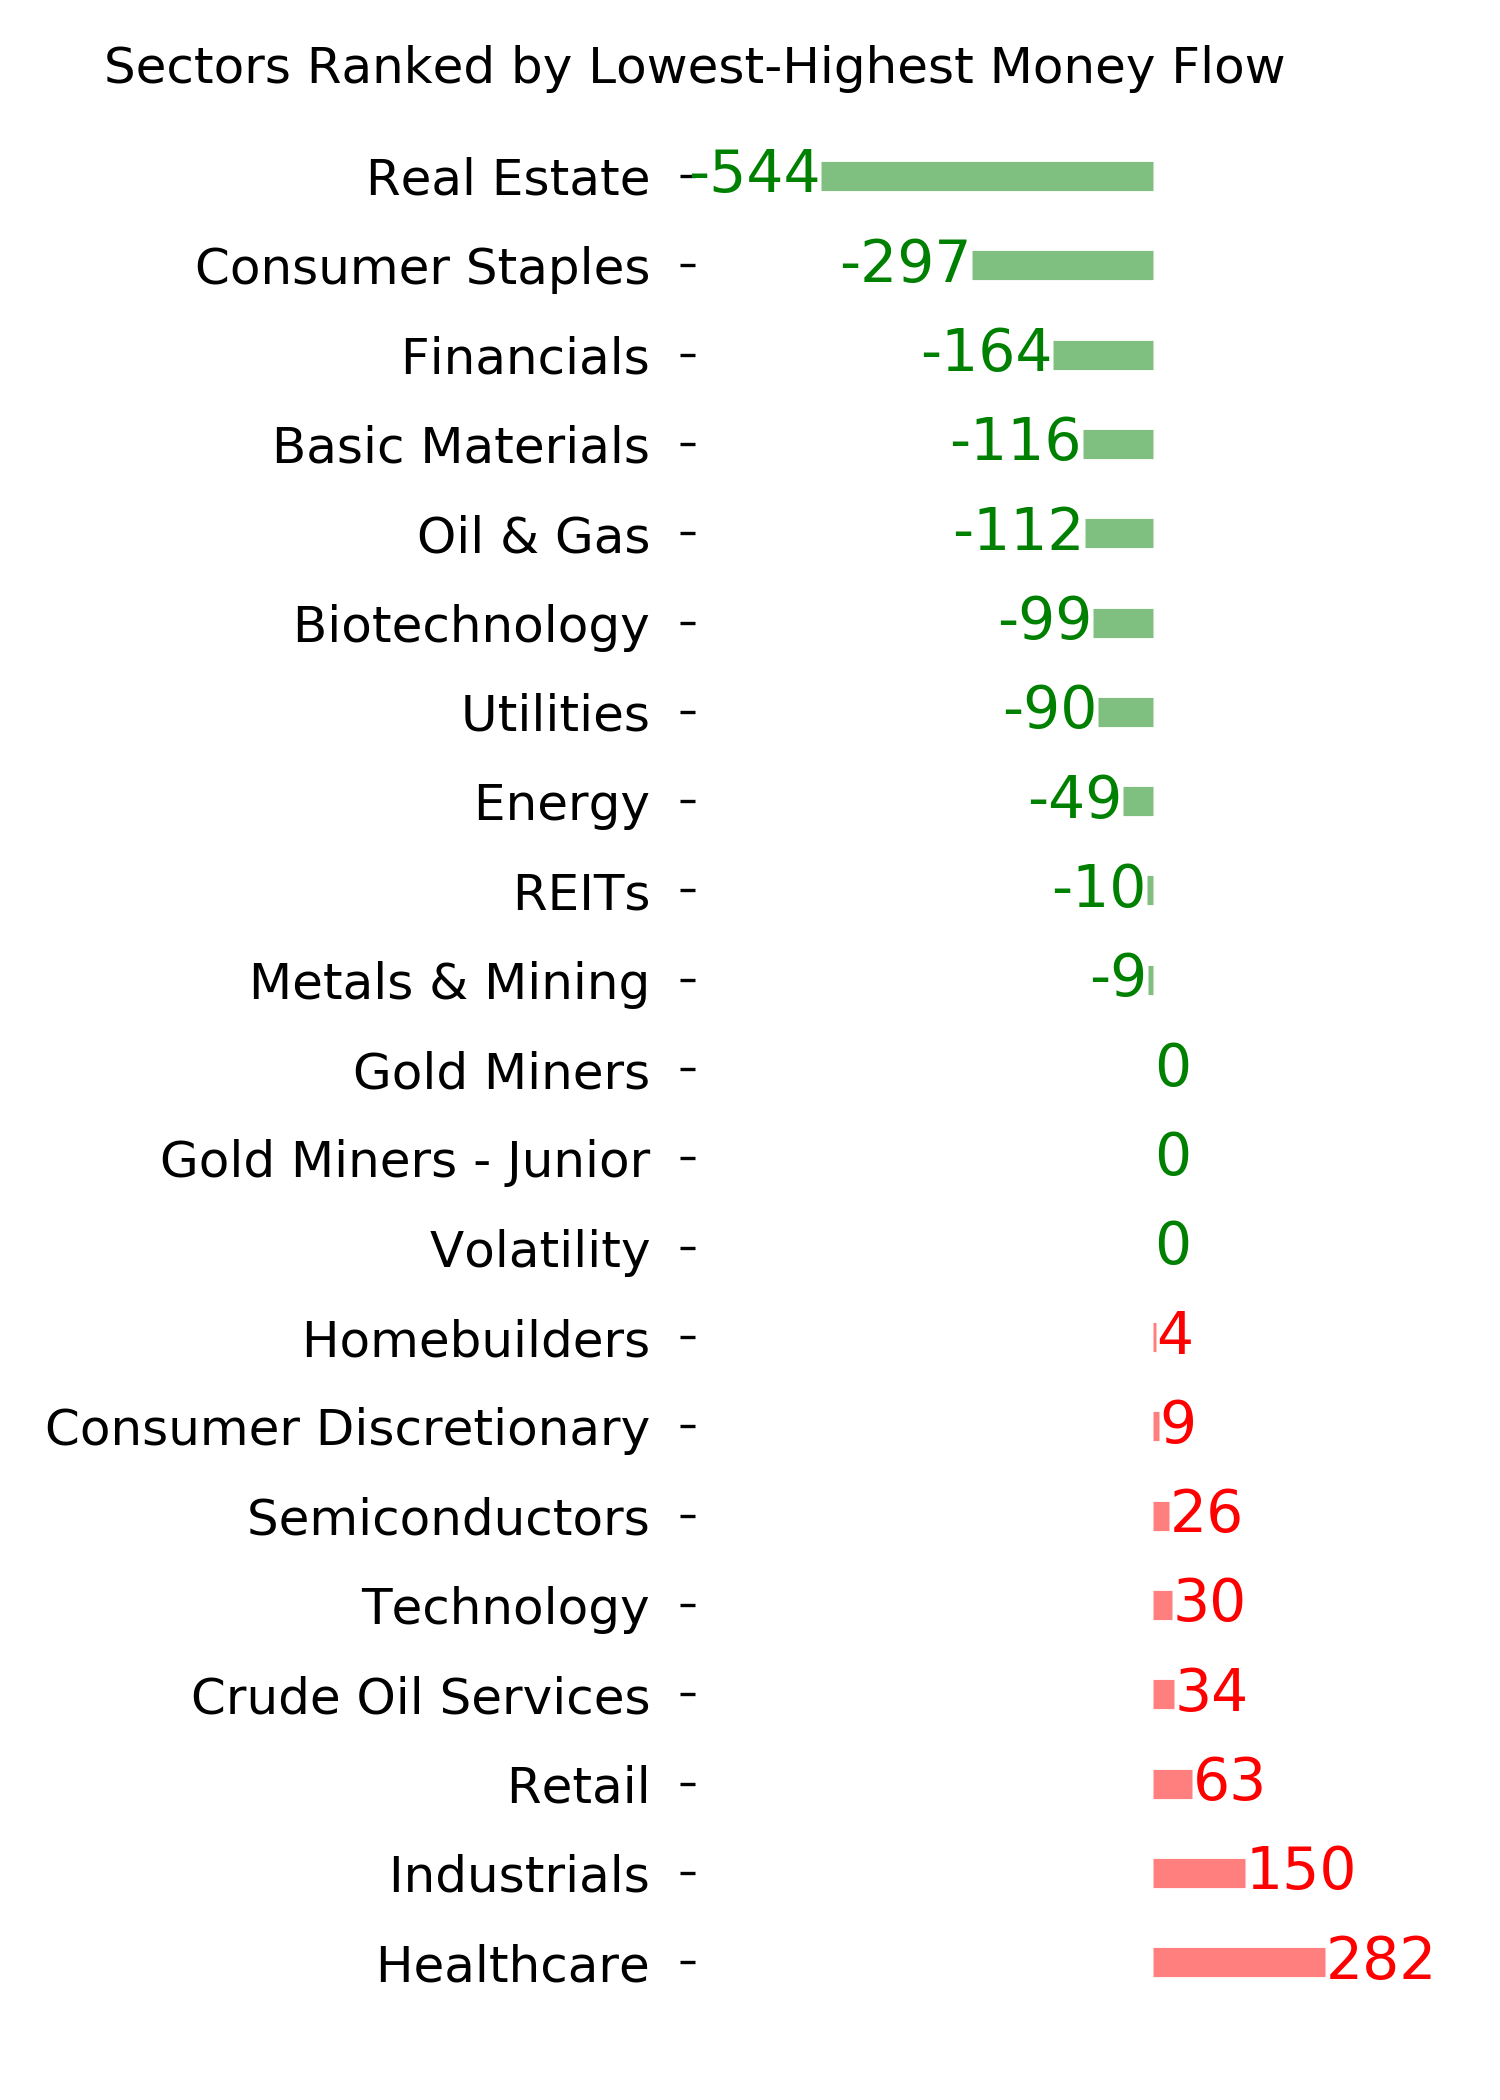
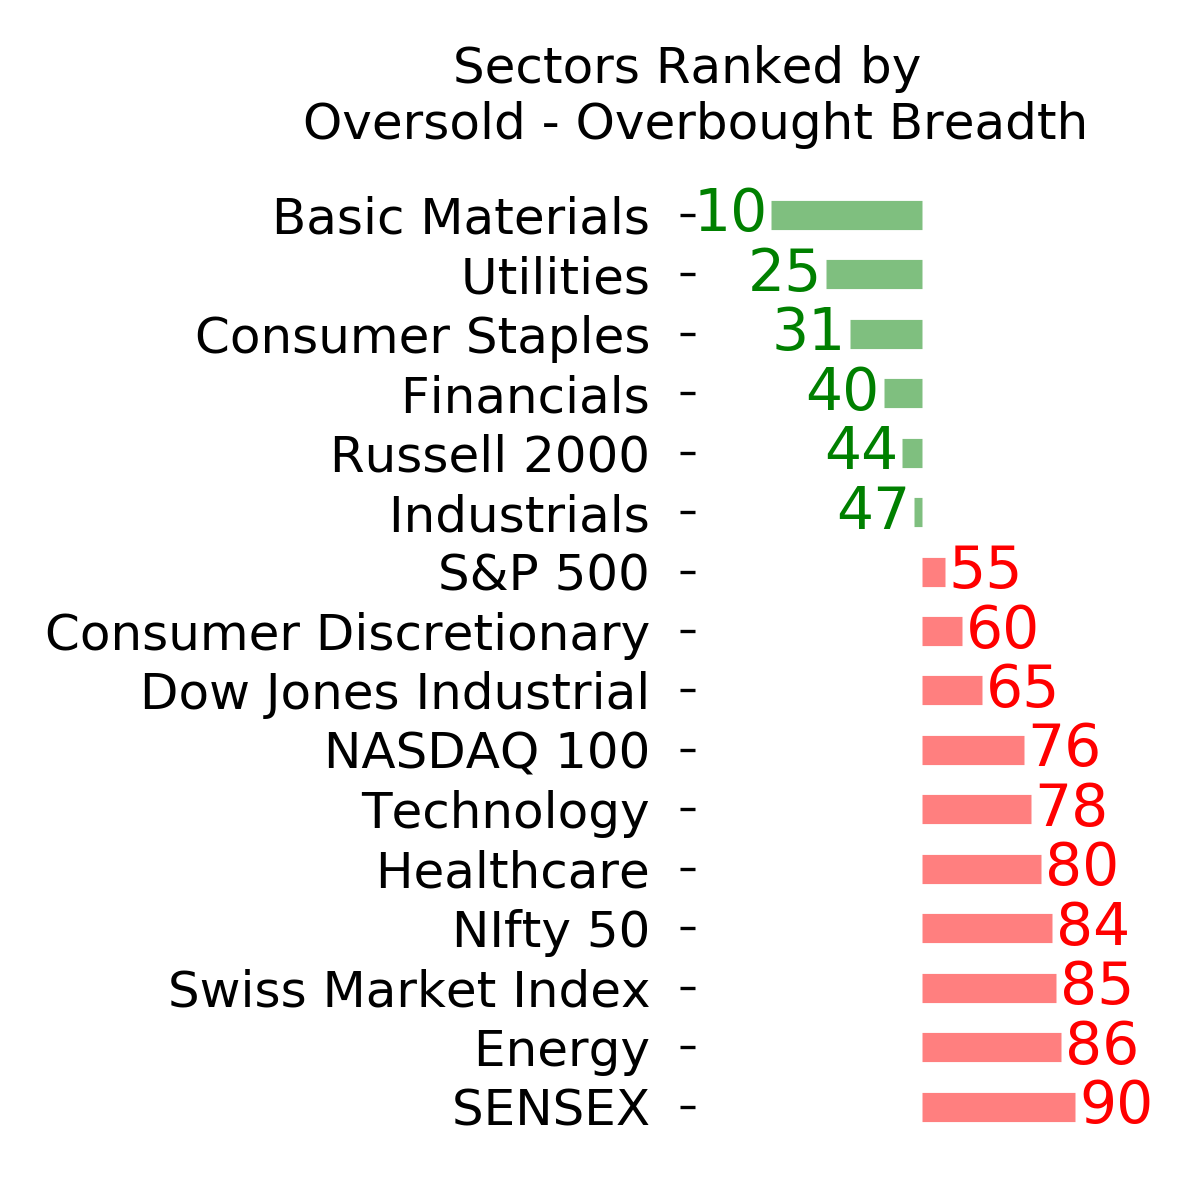
Ranks
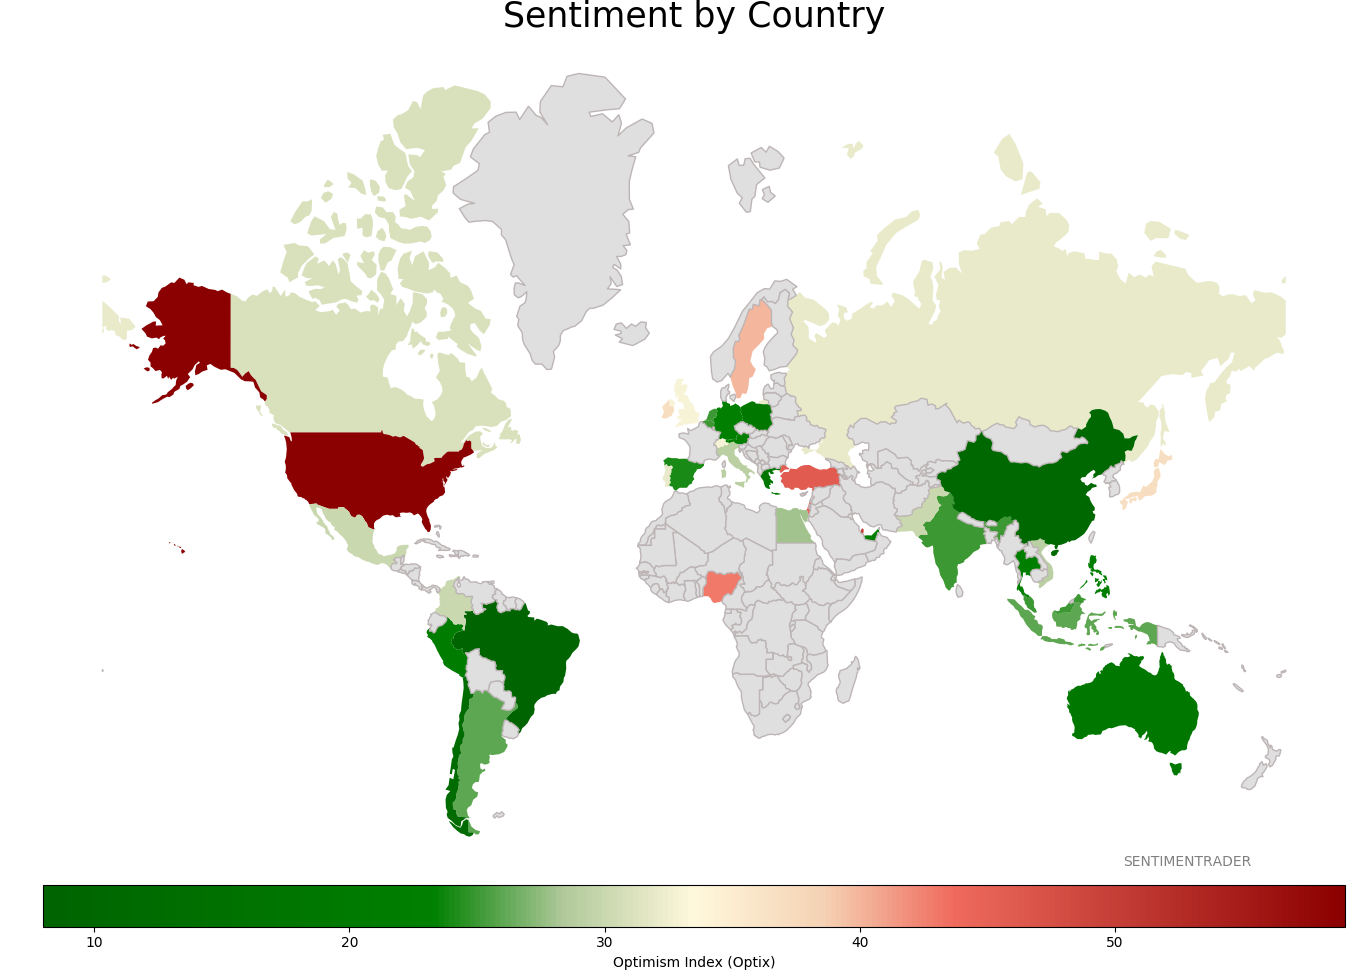
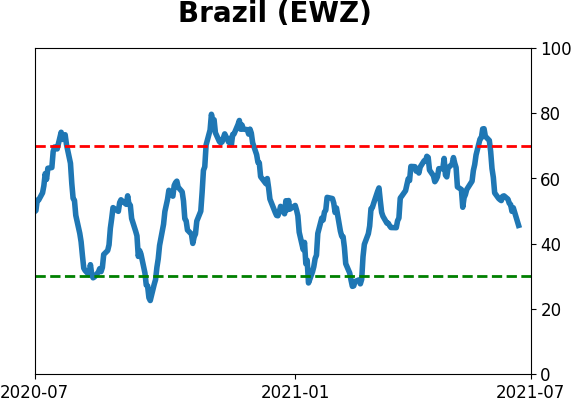
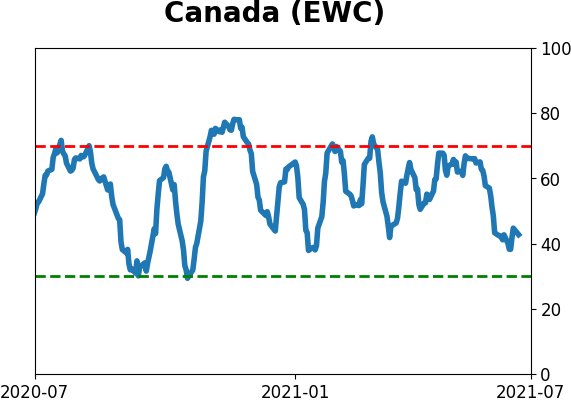
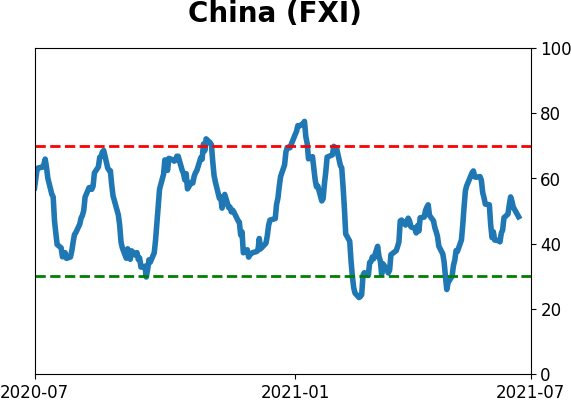
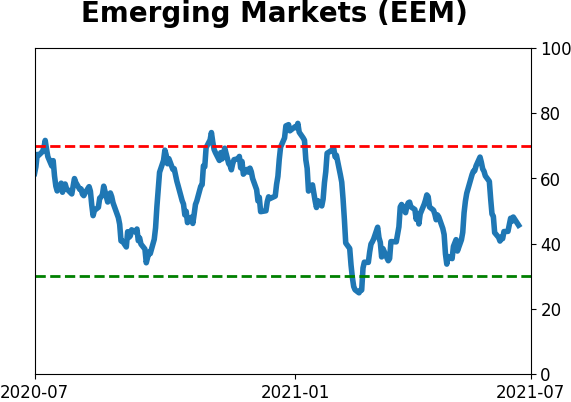
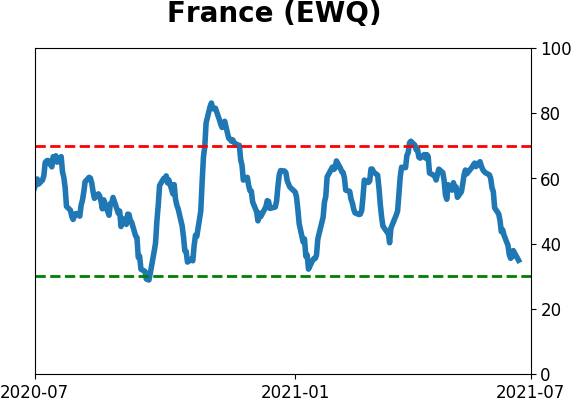
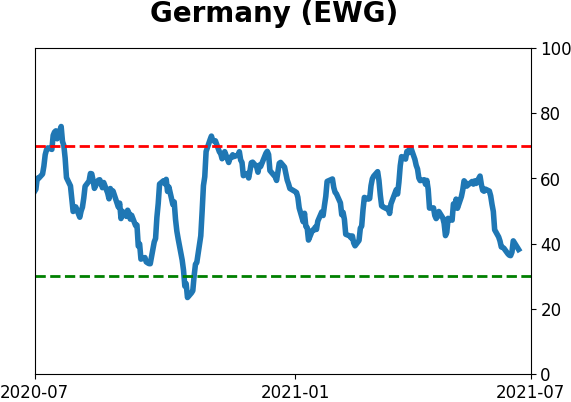
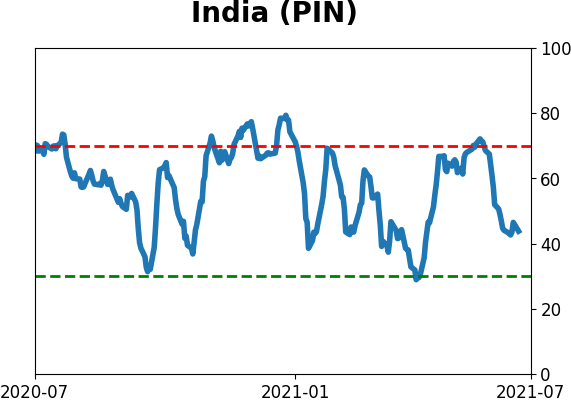
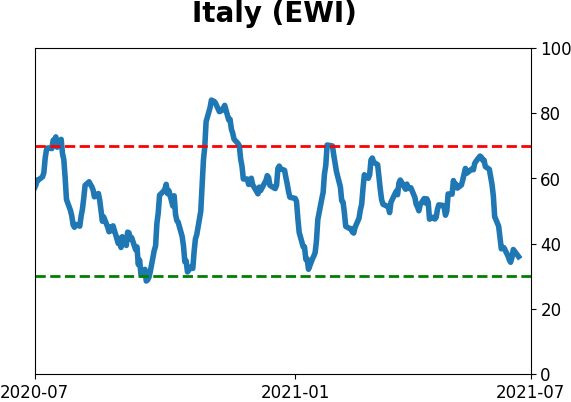
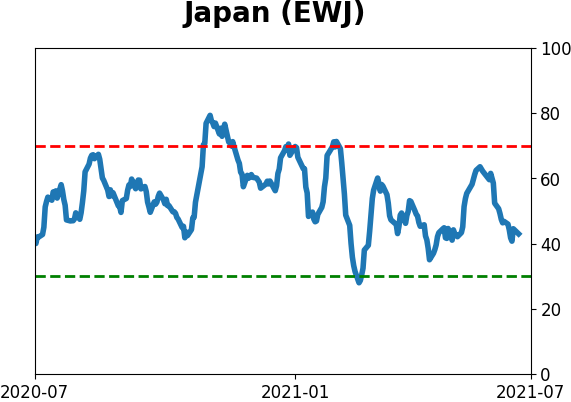
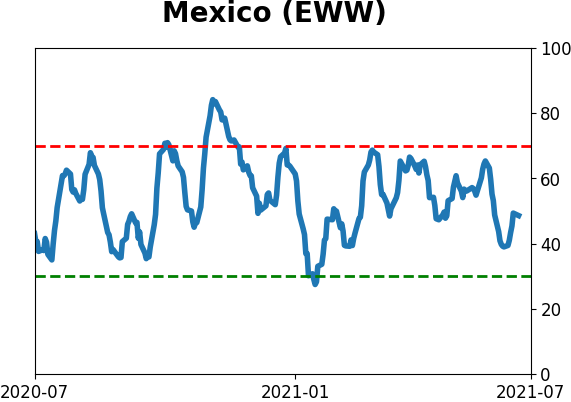
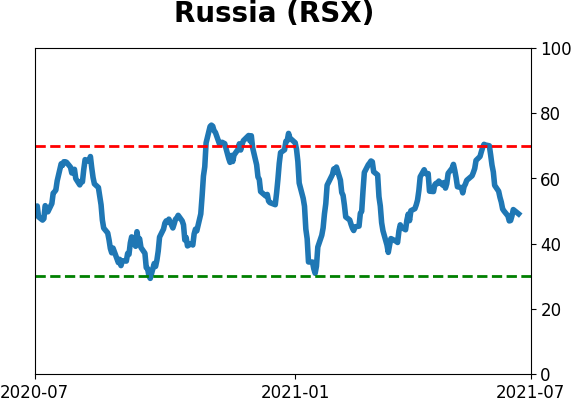
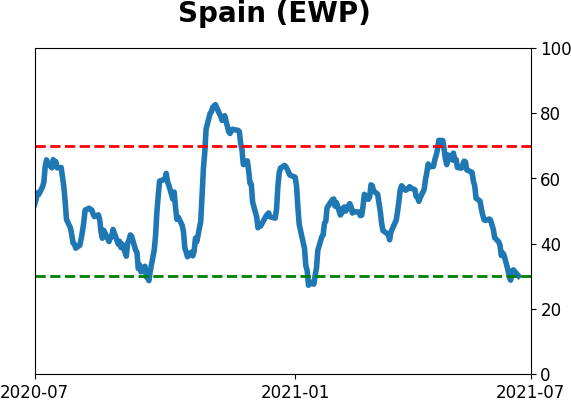
Sentiment Around The World
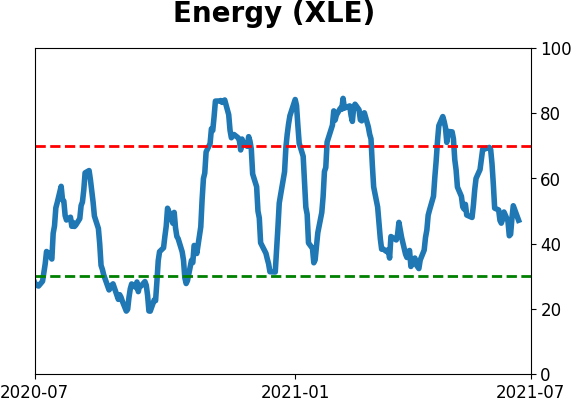
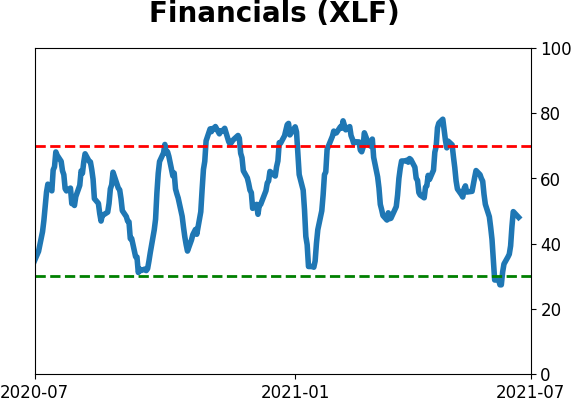
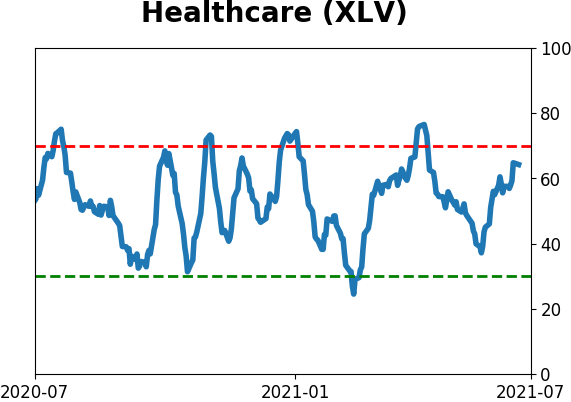
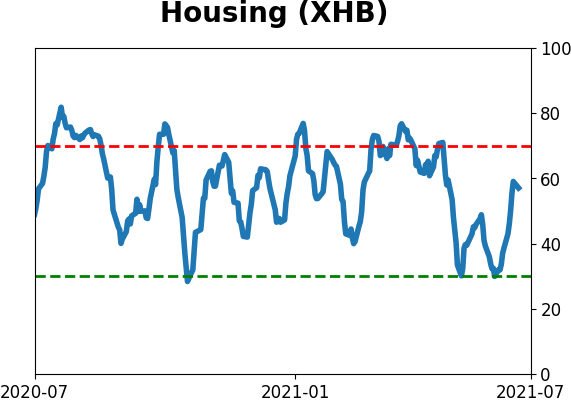
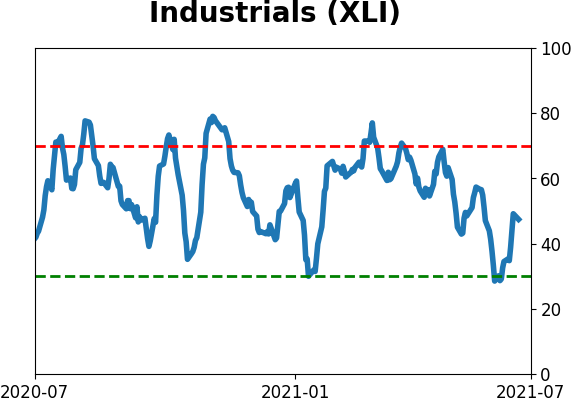
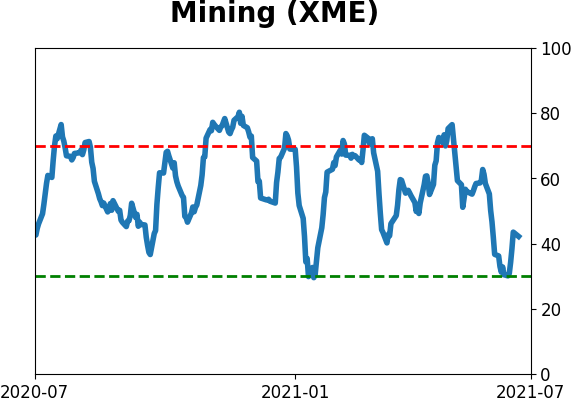
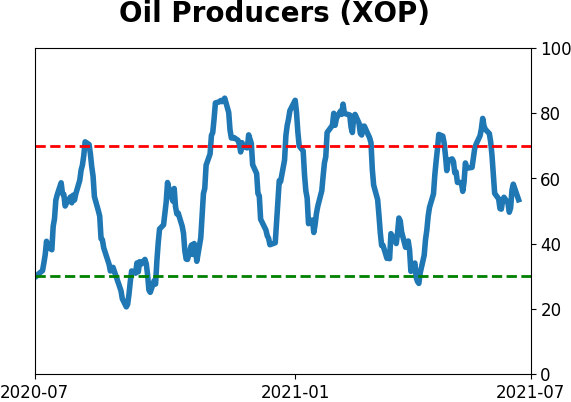
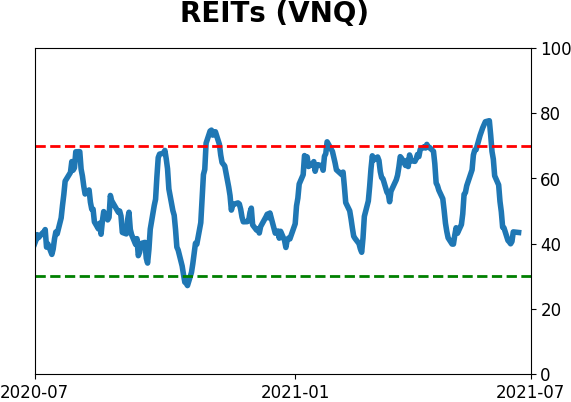
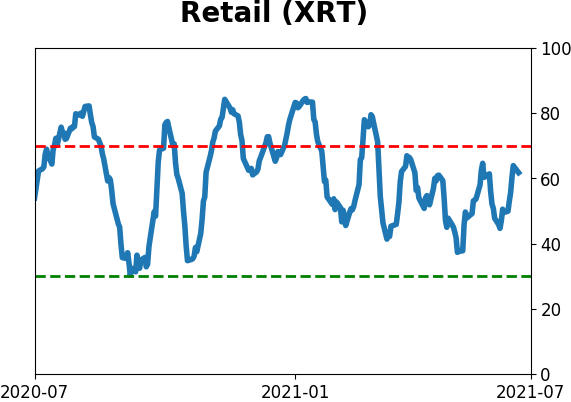
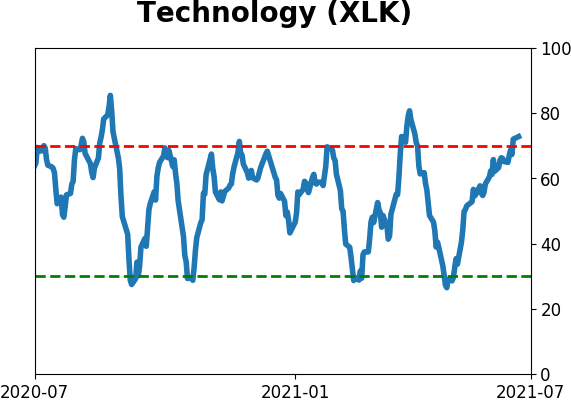
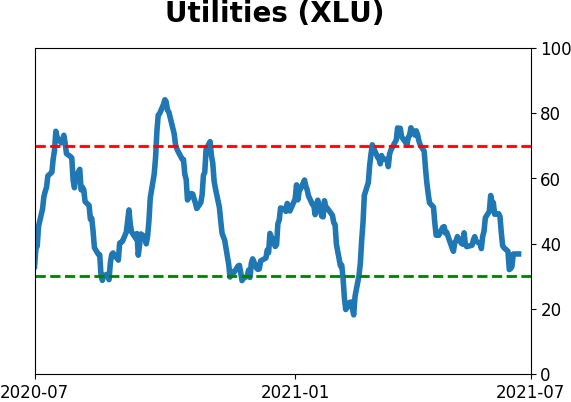
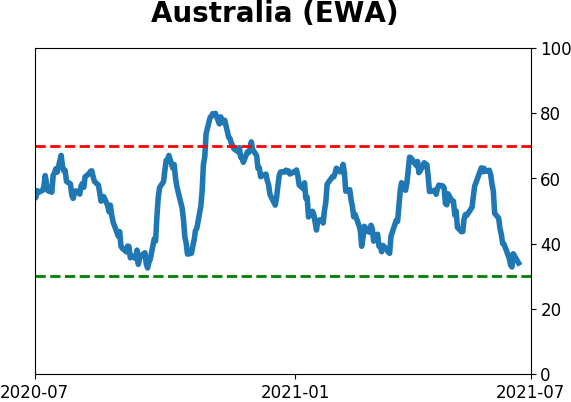
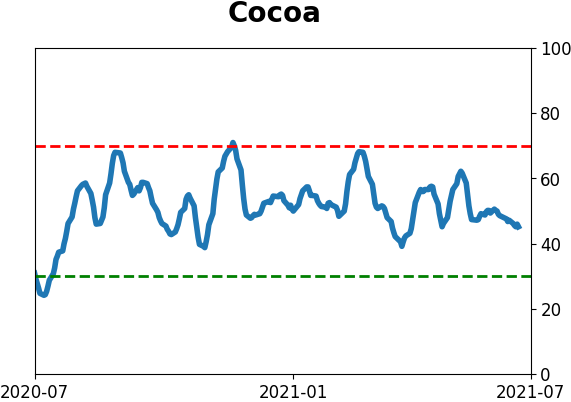
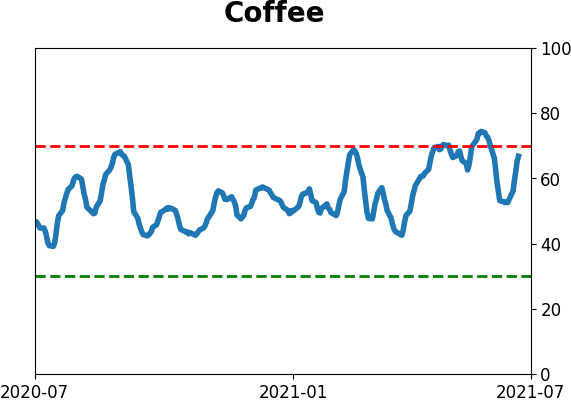
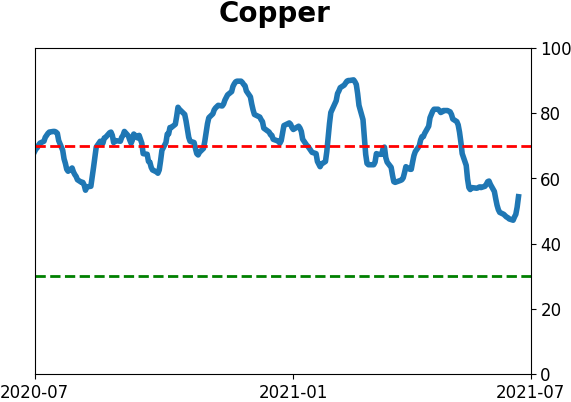
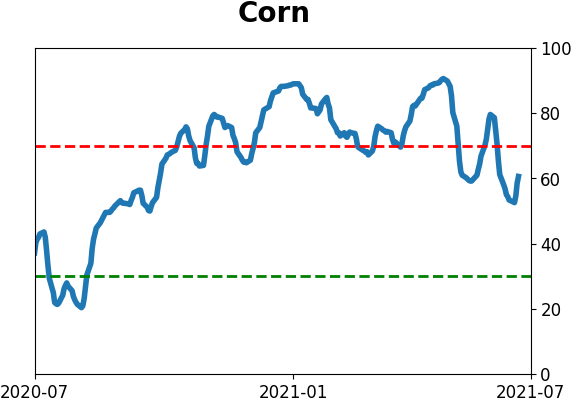
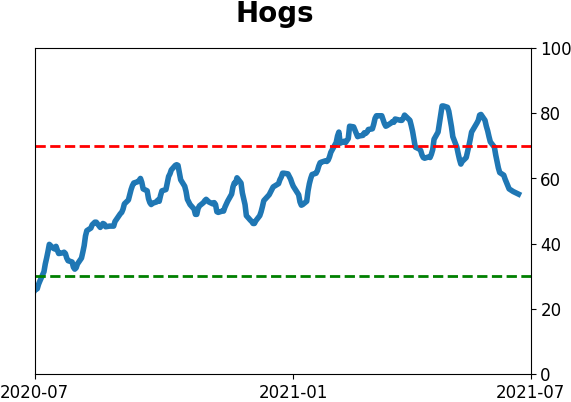
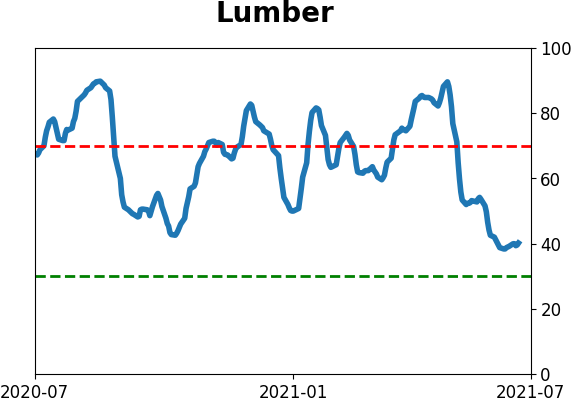
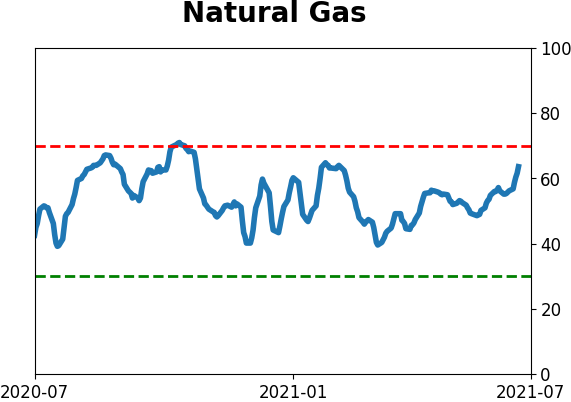
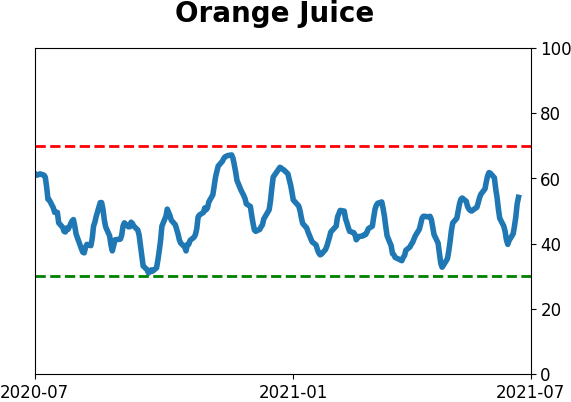
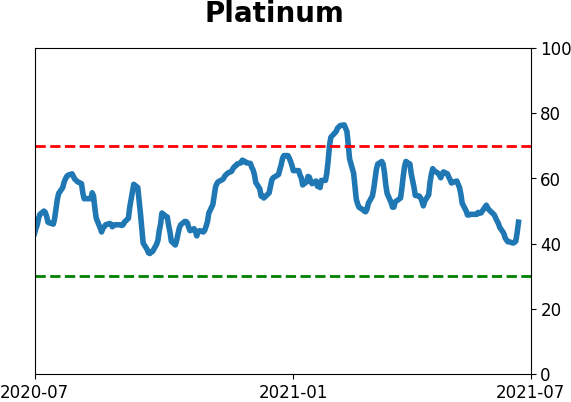
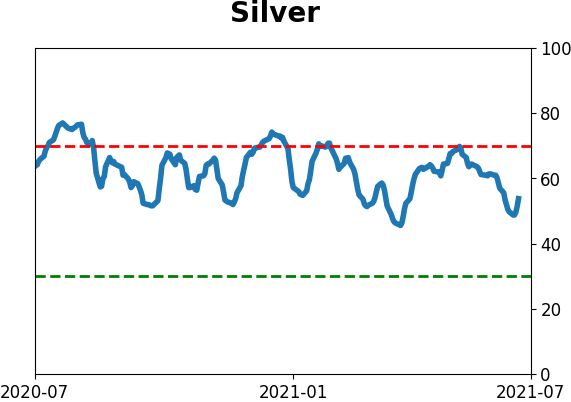
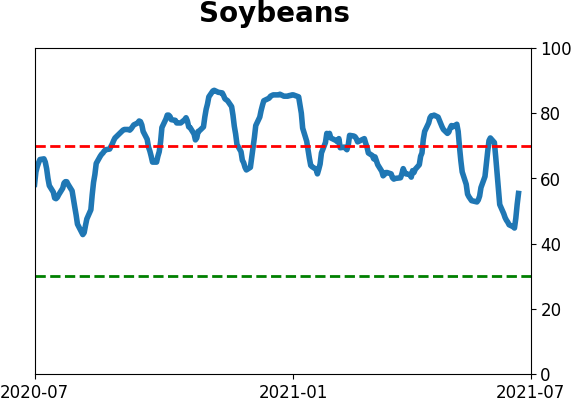
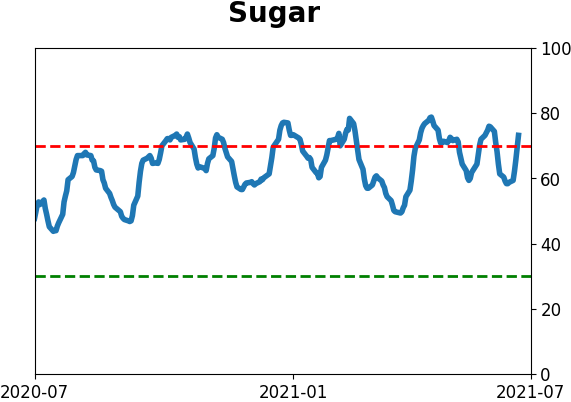
Optimism Index Thumbnails
|
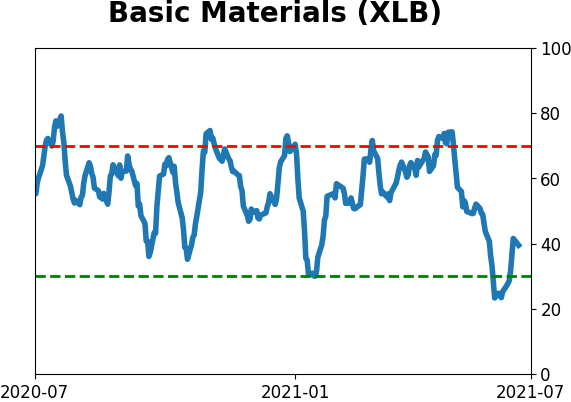
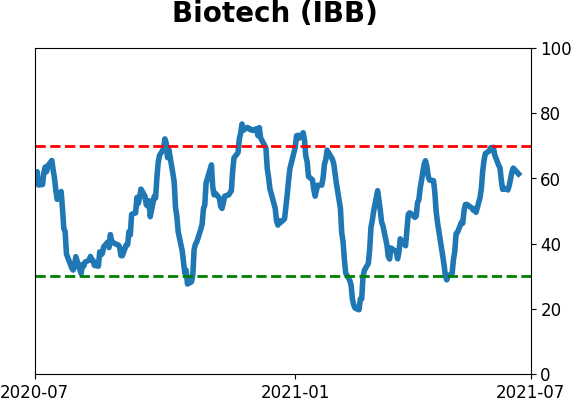
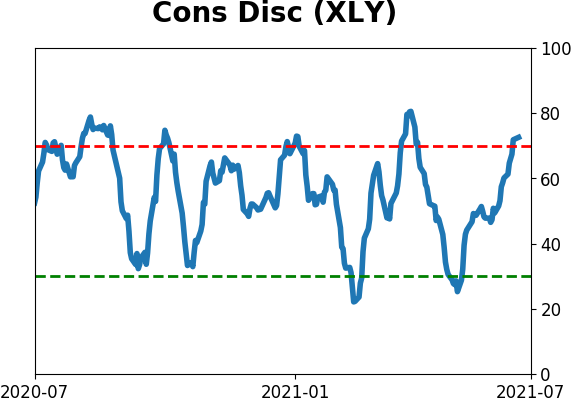
Sector ETF's - 10-Day Moving Average
|
|
|
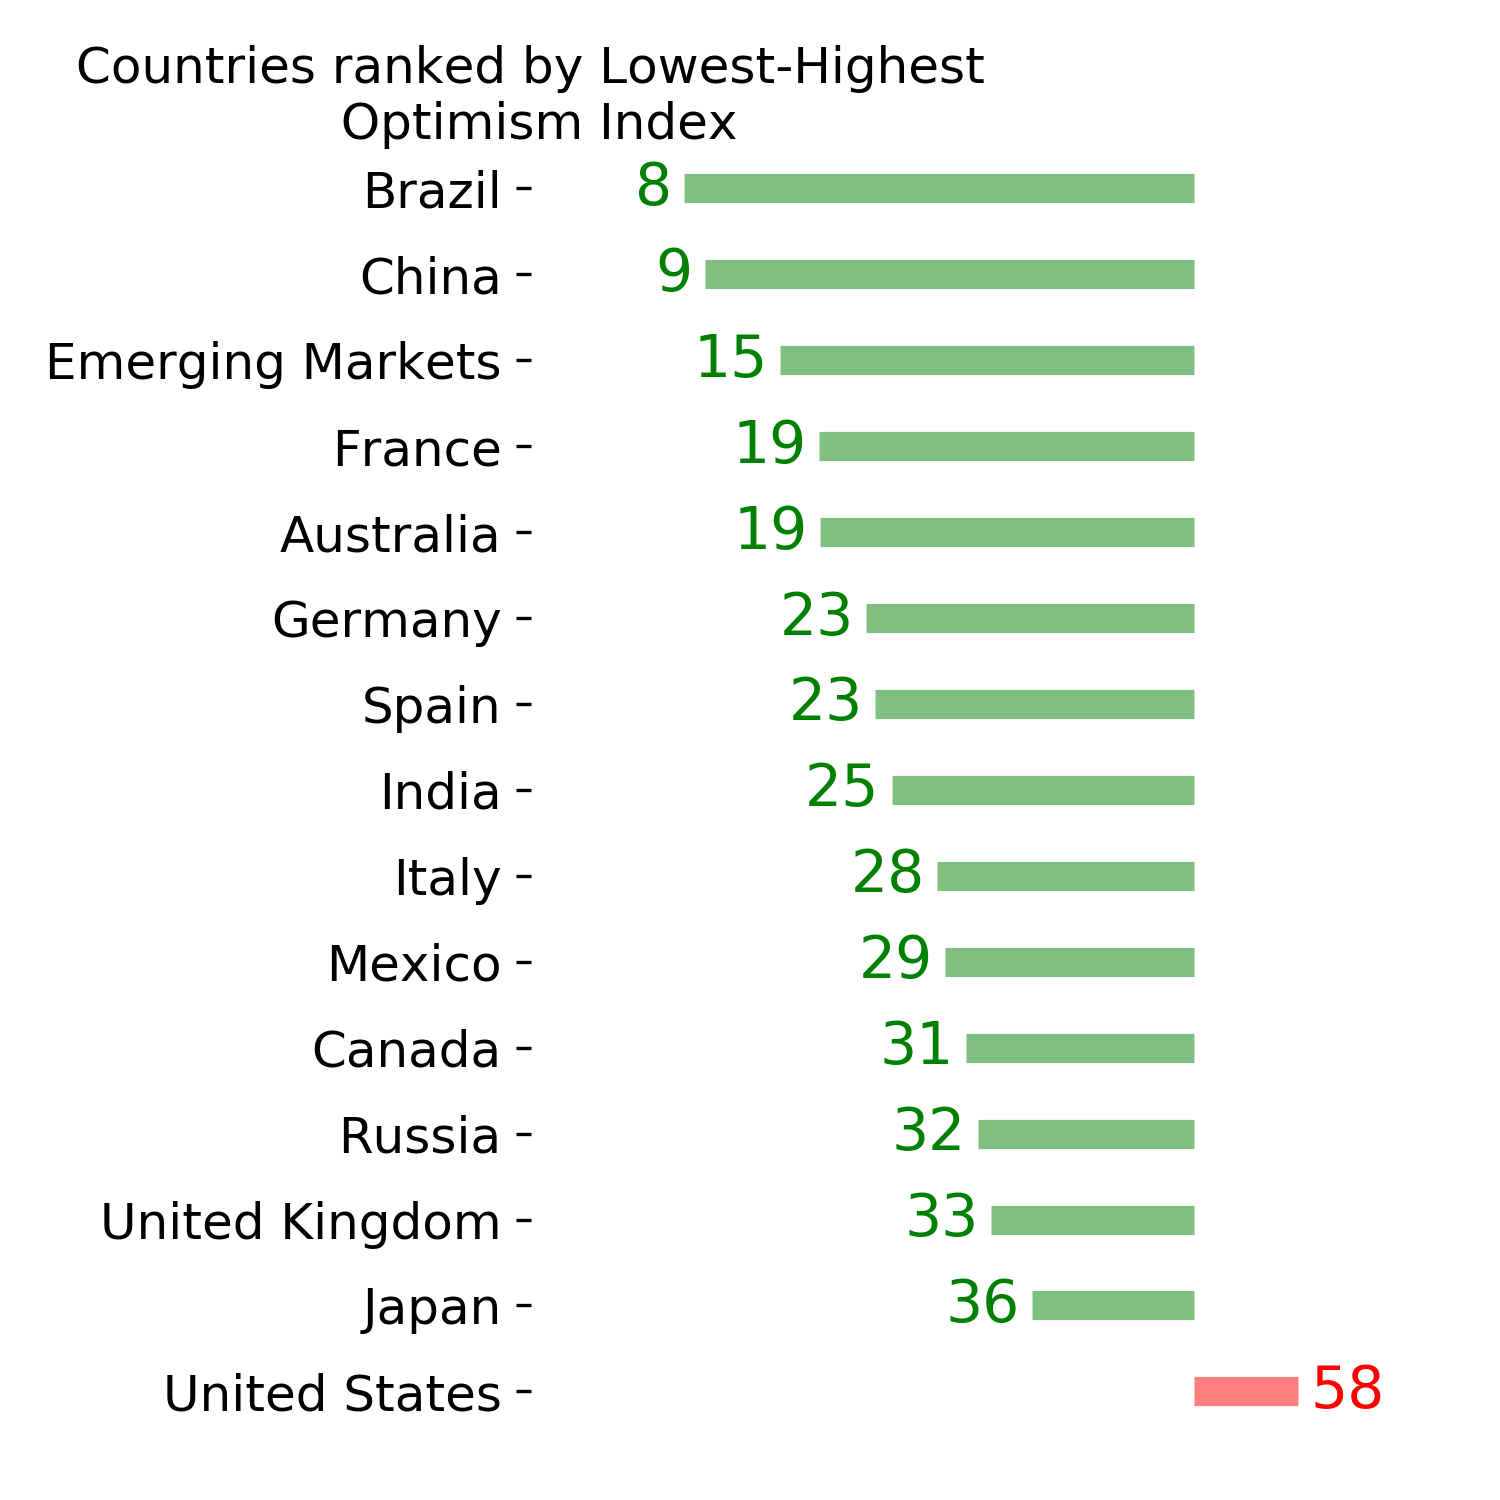
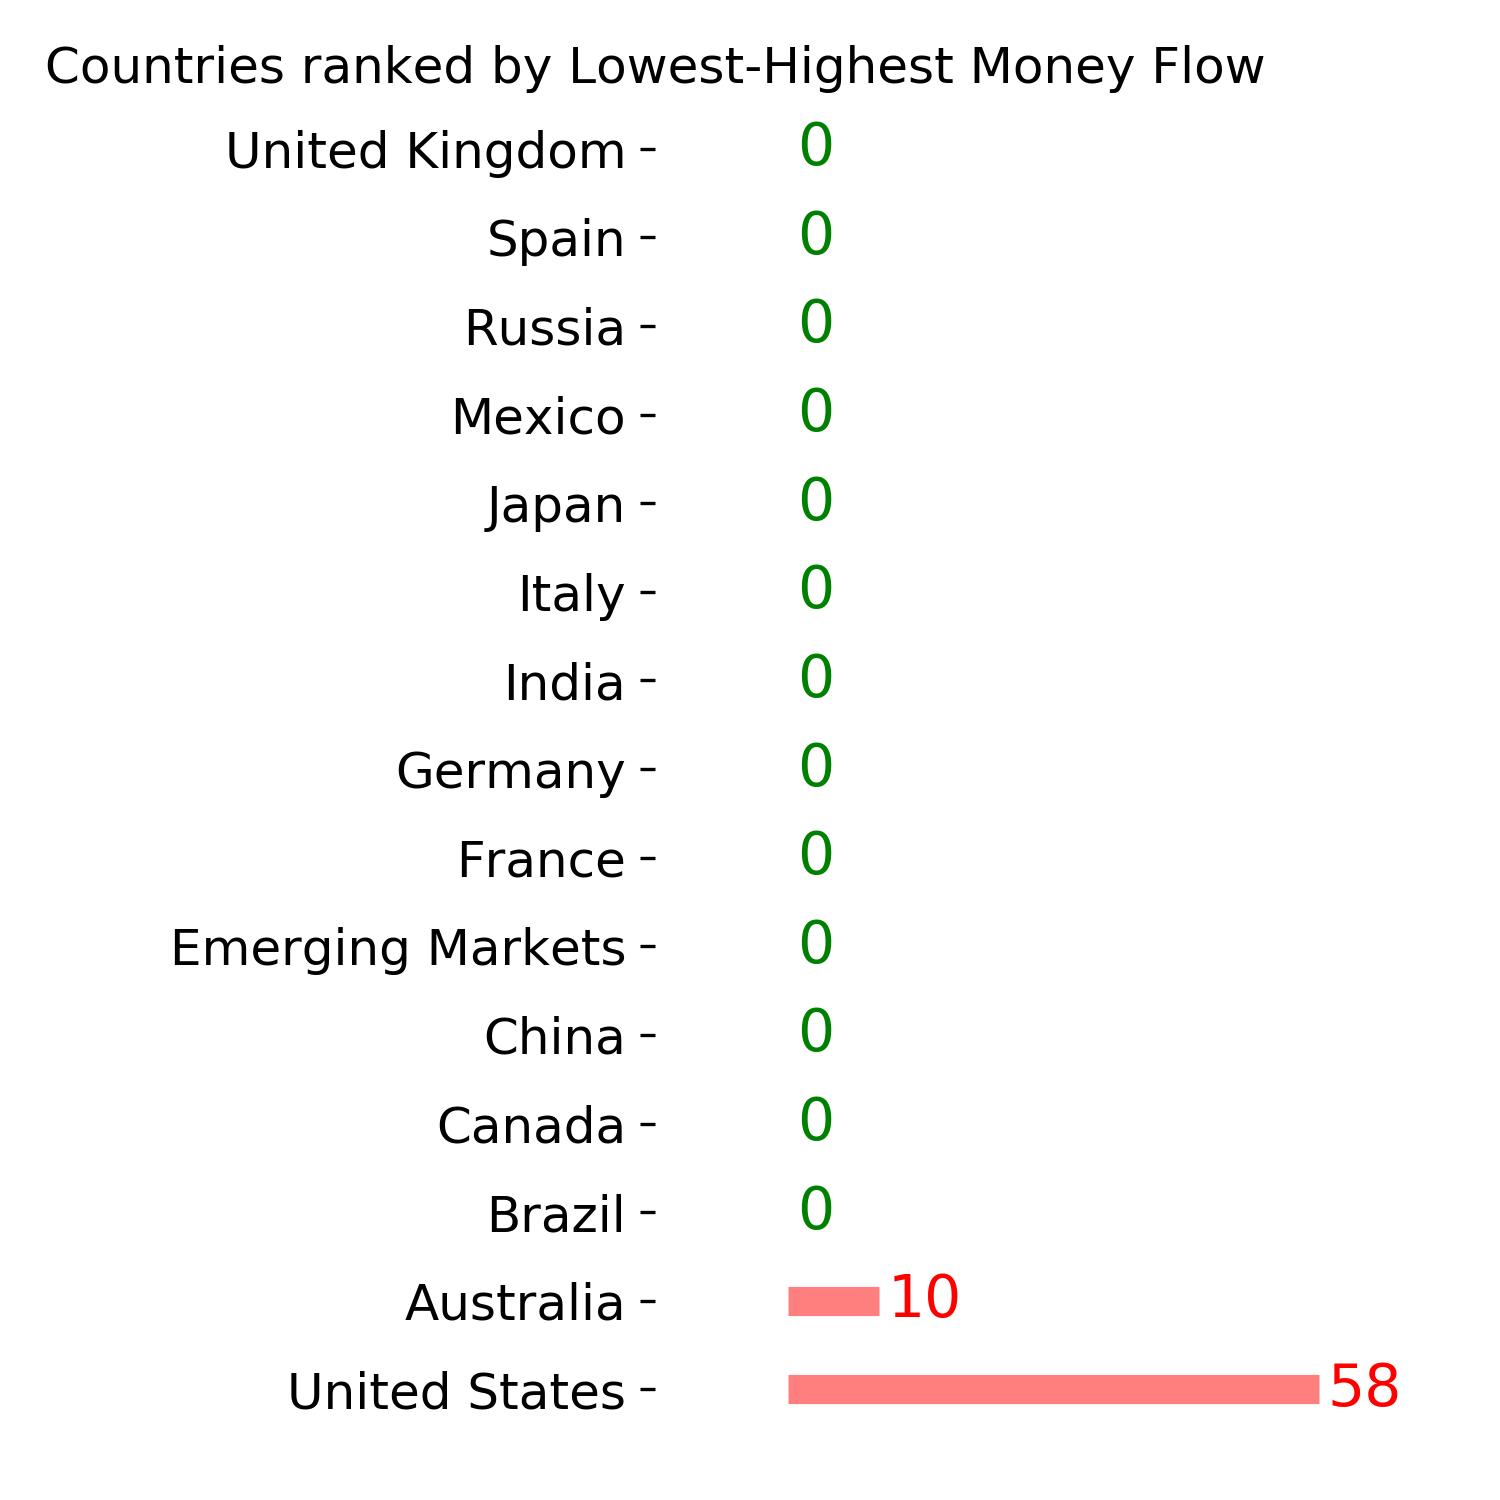
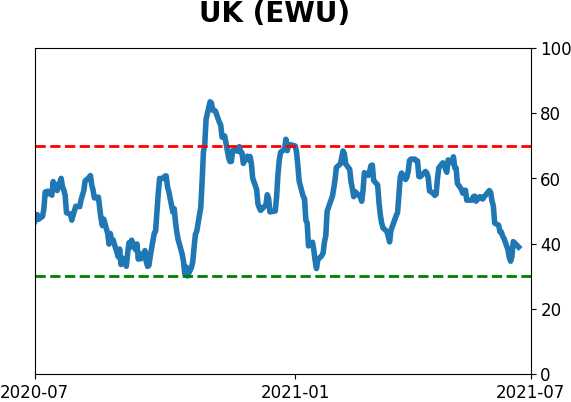
Country ETF's - 10-Day Moving Average
|
|
|
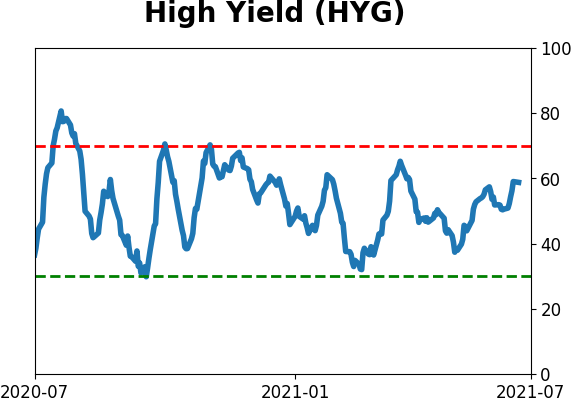
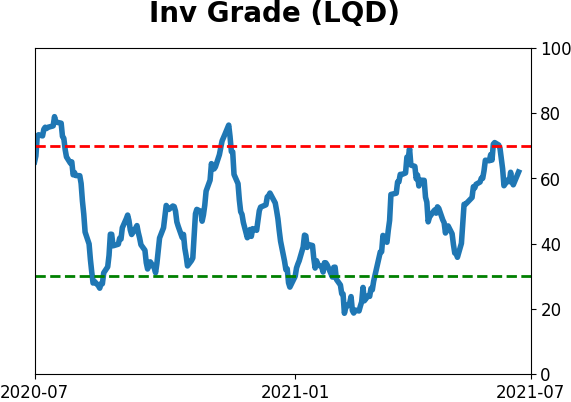
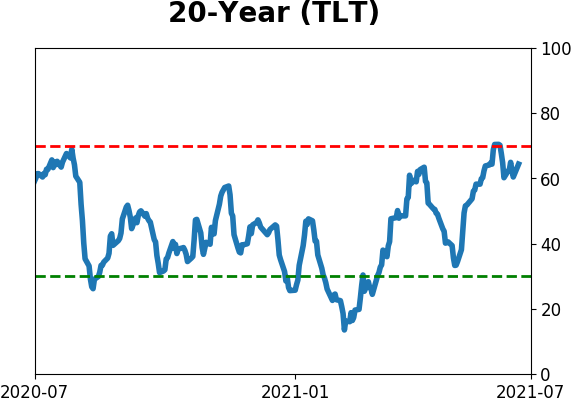
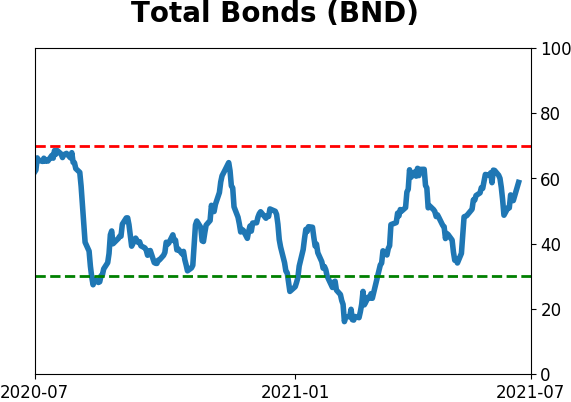
Bond ETF's - 10-Day Moving Average
|
|
|
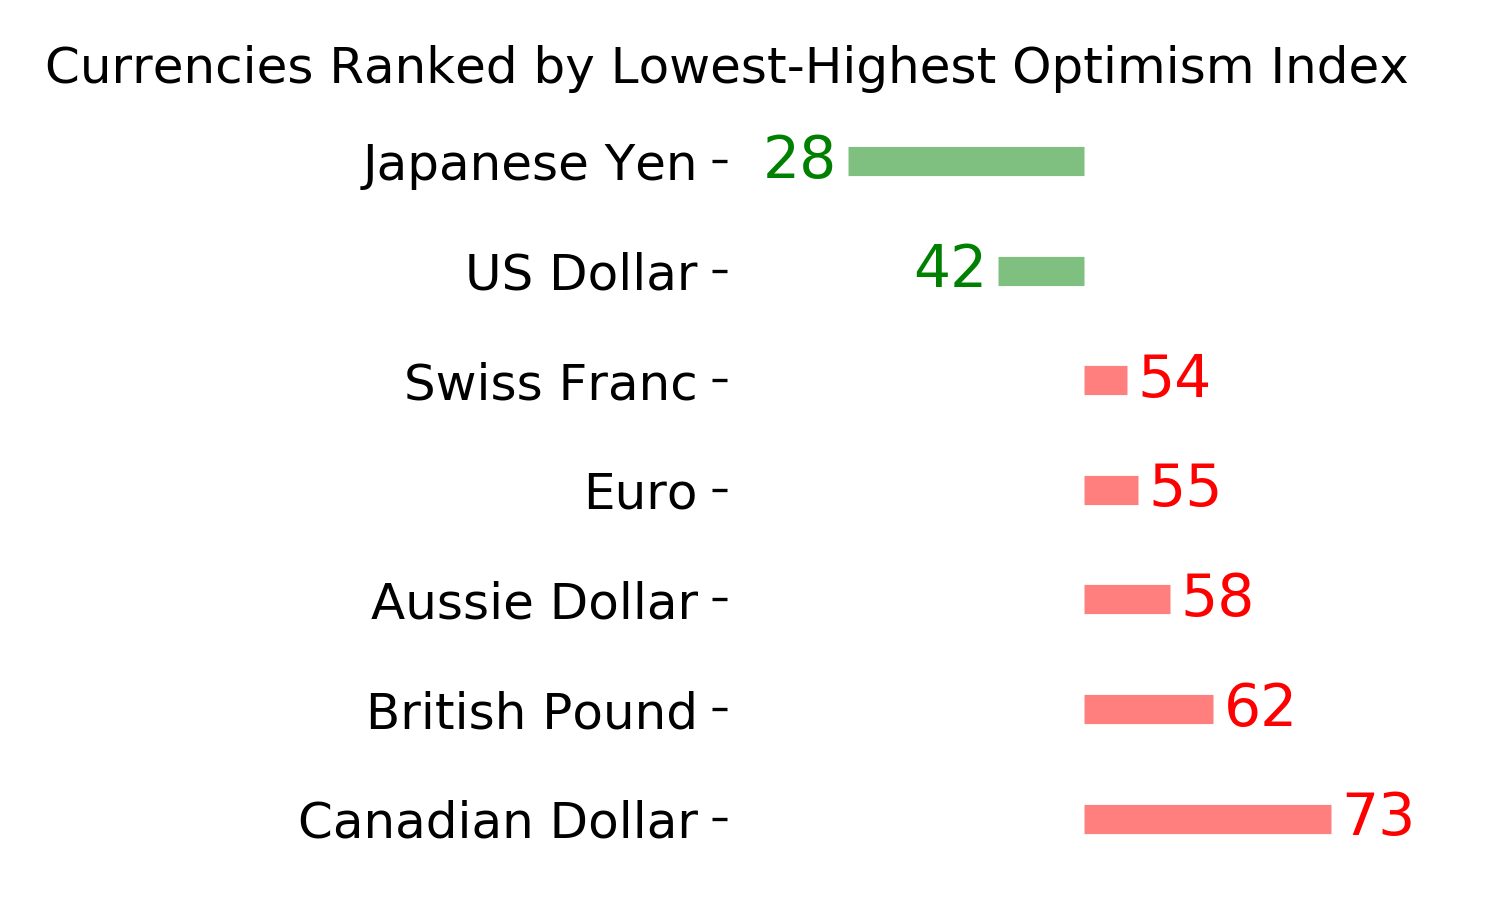
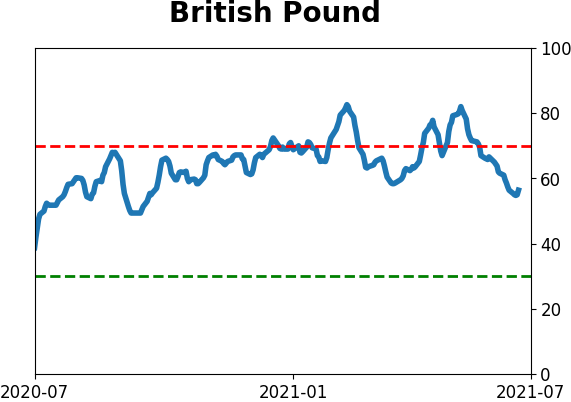
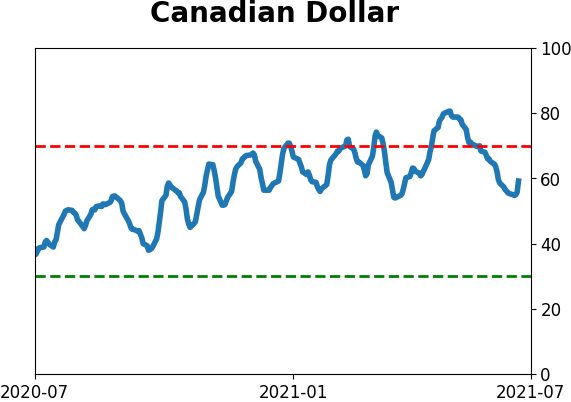
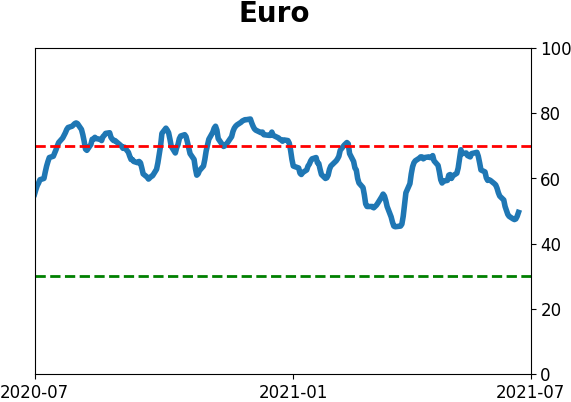
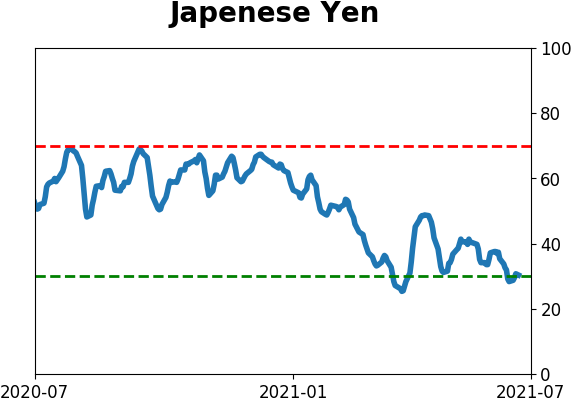
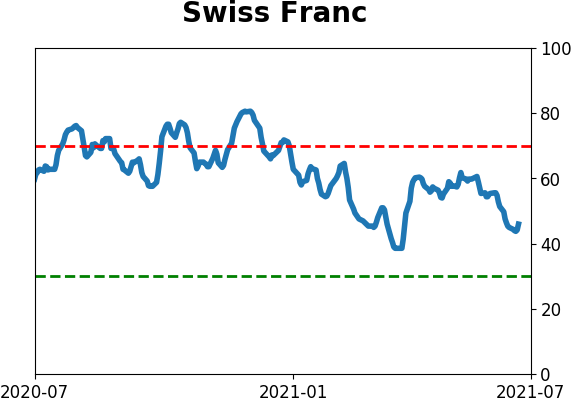
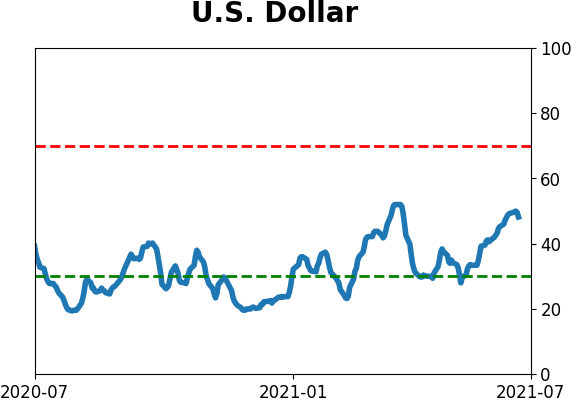
Currency ETF's - 5-Day Moving Average
|
|
|
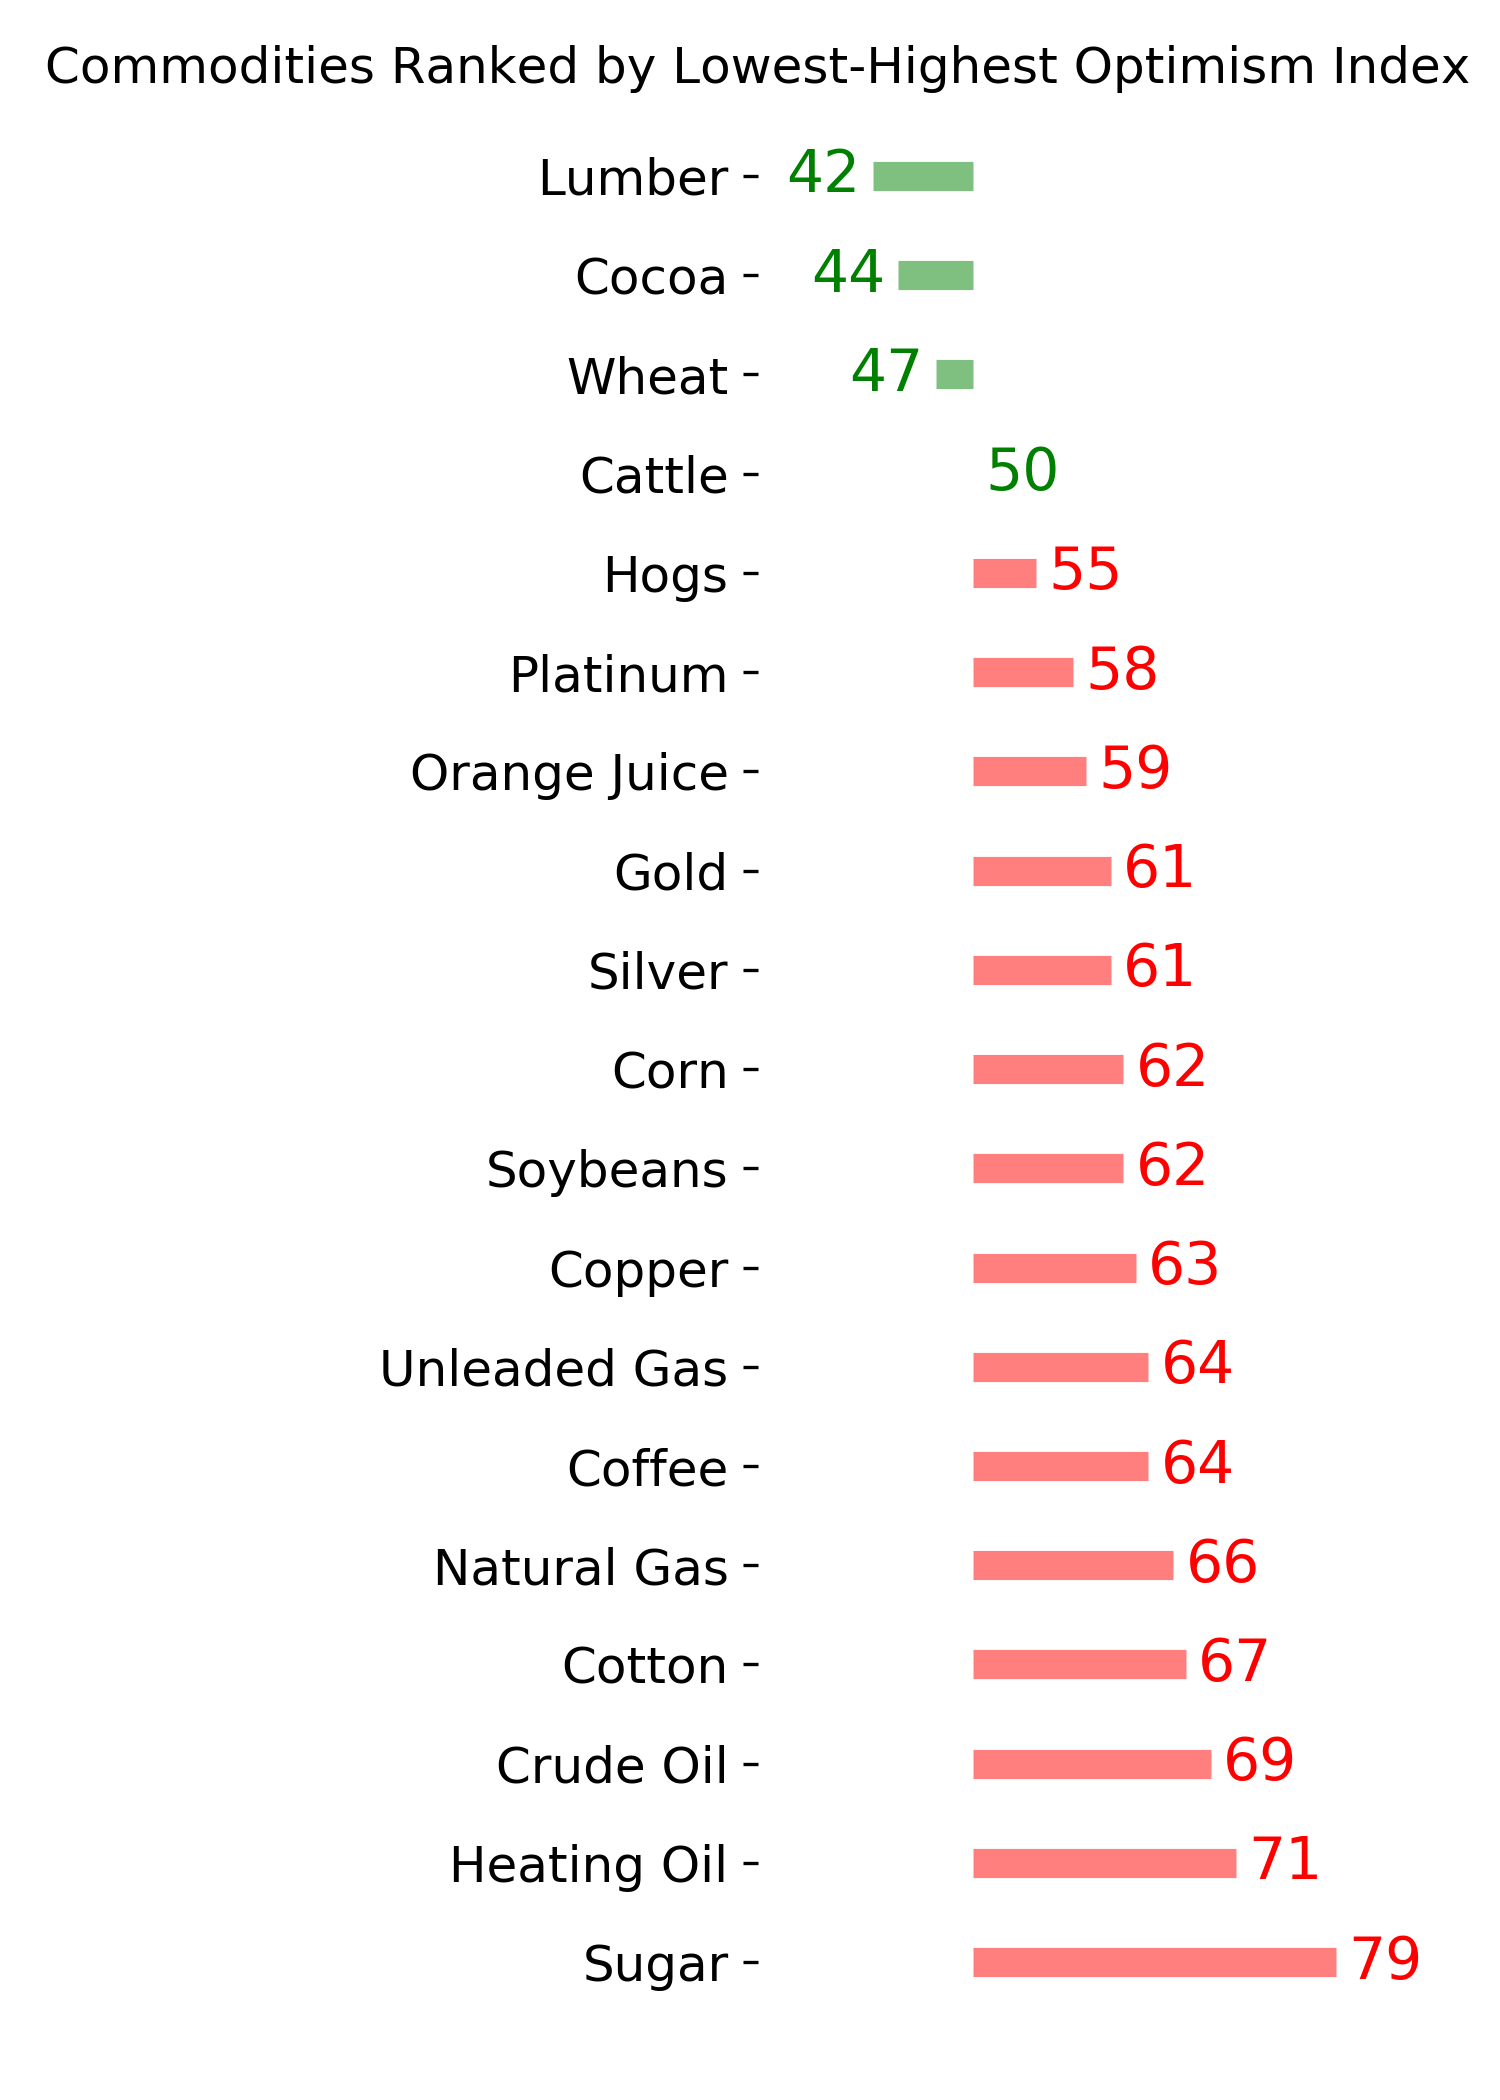
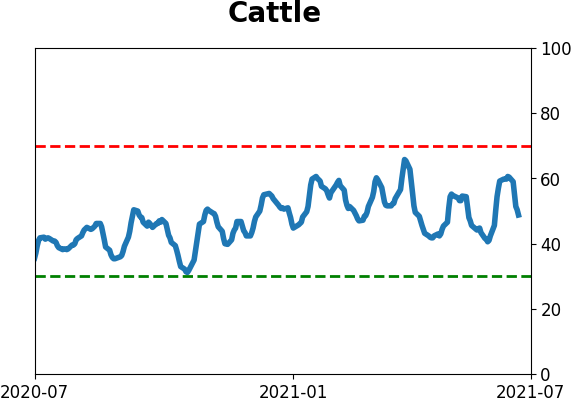
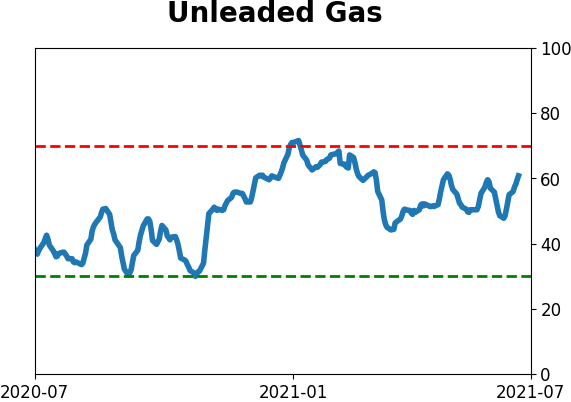
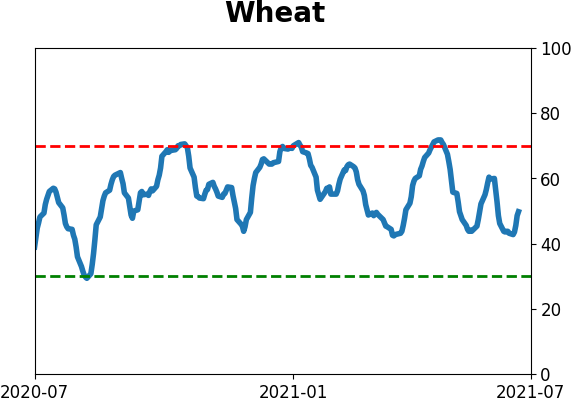
Commodity ETF's - 5-Day Moving Average
|
|