Headlines
|
|
Gold miner selling triggers a Panic Breadth Composite extreme:
Gold bugs should be used to disappointment, but the latest round of selling has to be especially painful. It comes on the heels of what had been impressive momentum, which had a good track record of continuing. Not this time, and last week the selling pressure was enough to trigger a true extreme in a Panic Breadth Composite.
|
Smart / Dumb Money Confidence
|
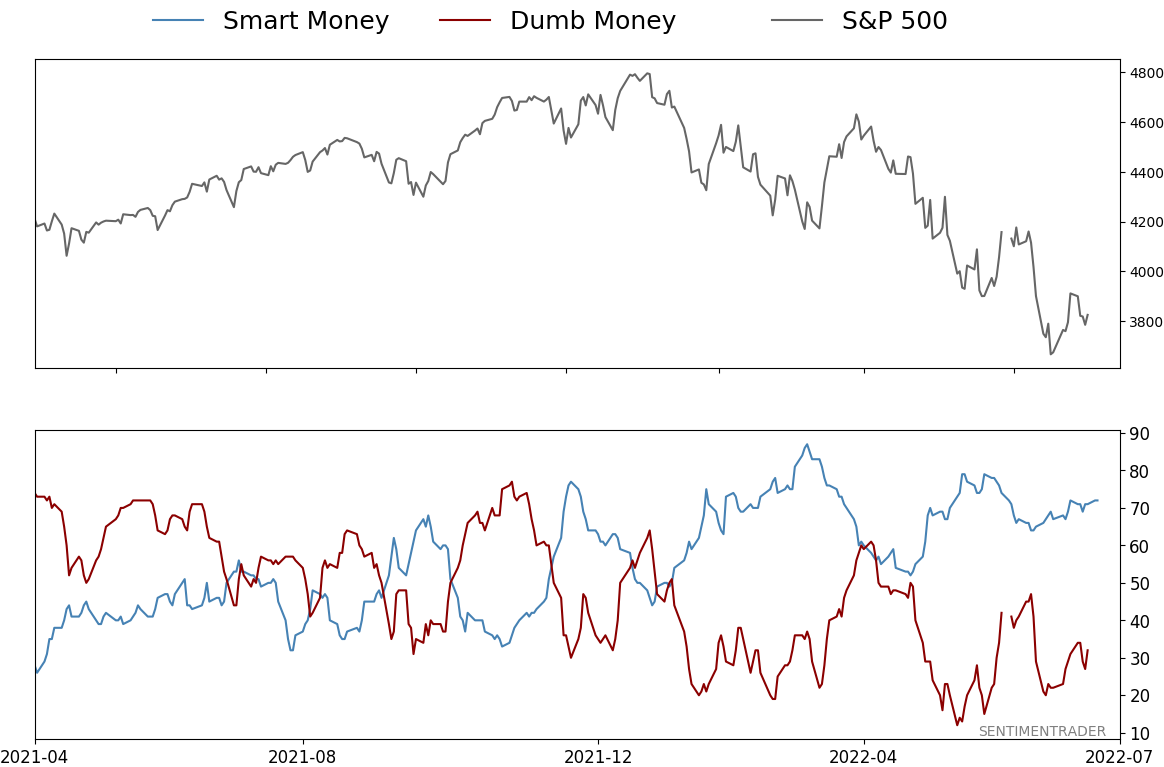
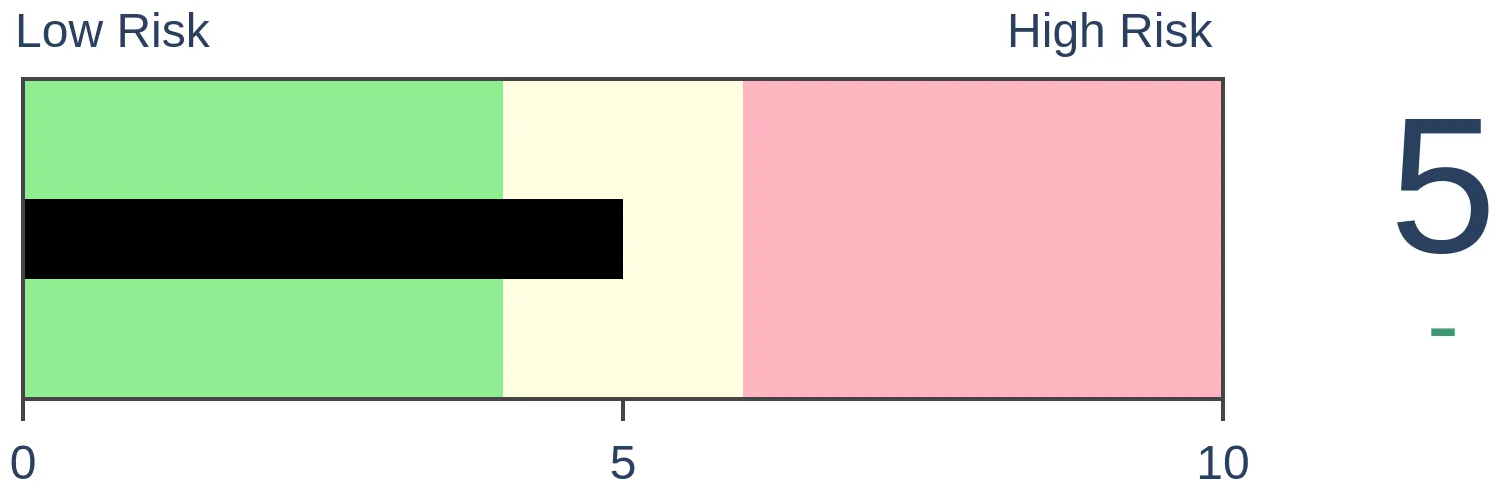
Smart Money Confidence: 72%
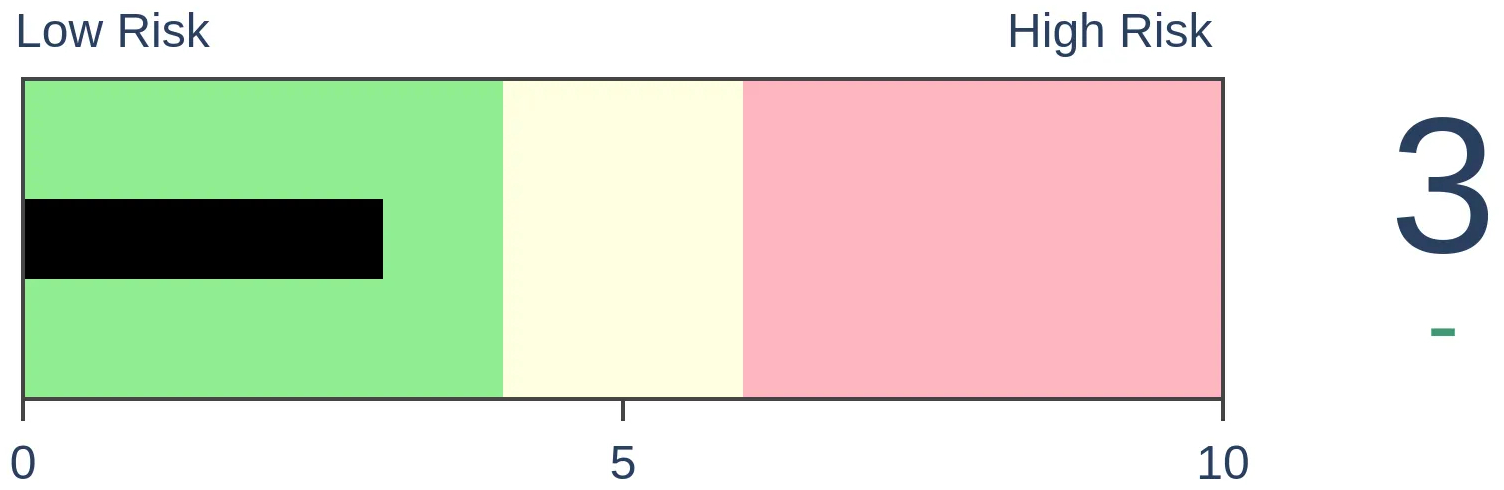
Dumb Money Confidence: 32%
|
|
Risk Levels
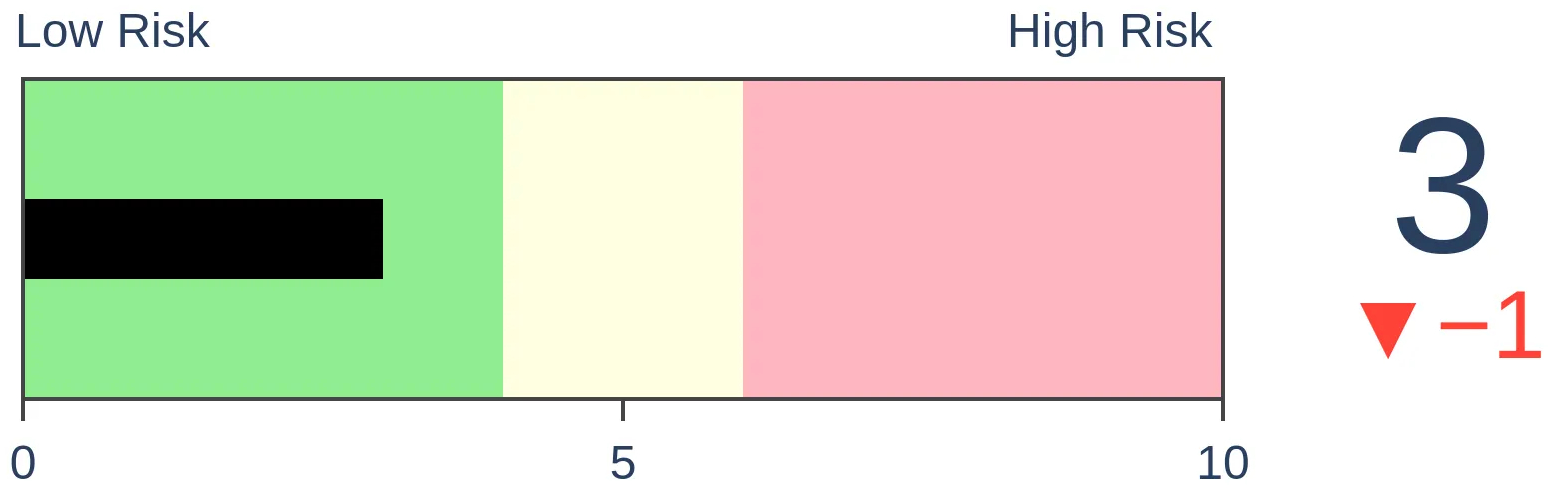
Stocks Short-Term
|
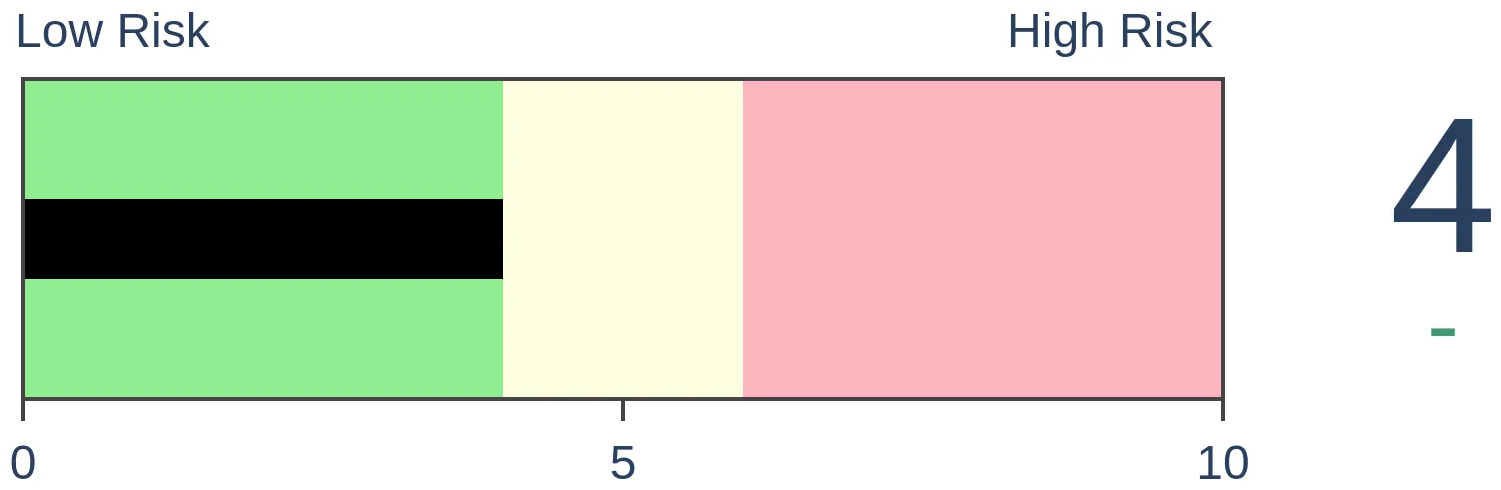
Stocks Medium-Term
|
|
Bonds

|
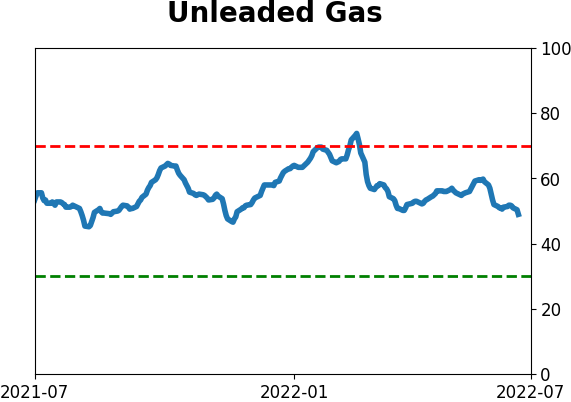
Crude Oil

|
|
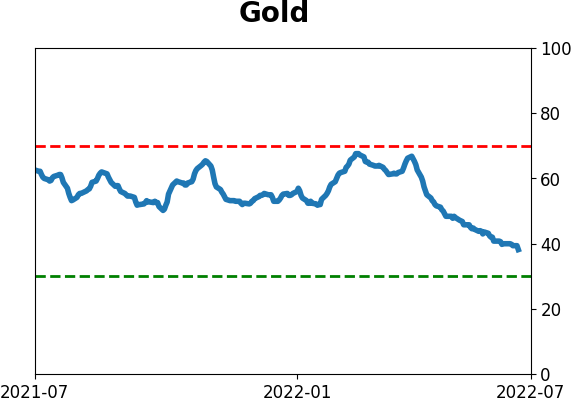
Gold
|
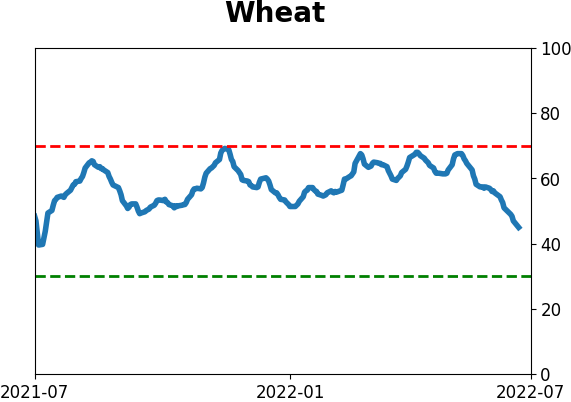
Agriculture
|
|
Research
By Jason Goepfert
BOTTOM LINE
Gold bugs should be used to disappointment, but the latest round of selling has to be especially painful. It comes on the heels of what had been impressive momentum, which had a good track record of continuing. Not this time, and last week the selling pressure was enough to trigger a true extreme in a Panic Breadth Composite.
FORECAST / TIMEFRAME
None
|
Key points:
- Selling pressure in gold mining stocks has been unrelenting, and few of them are now in uptrends
- Last week, selling pressure was enough to trigger one of the highest Panic Breadth Composites in nearly 40 years
- Similar selling preceded multi-week rebounds, but each of them ultimately failed
No letup in disappointments for gold bugs
You gotta feel for gold bugs. The original "bitcoin bros," gold bugs tend to have a fevered passion for their preferred investment. And usually, right when they start to get excited about a new uptrend, reality comes knocking.
Gold miners enjoy a huge upside run maybe once a decade. All other times, short-term rallies get sold almost immediately. That's what we're seeing now.
A little over a month ago, the selling pressure in these stocks was getting notable, and a Panic Breadth Composite got to a high level. Historical comparisons showed that if buyers showed interest over the next few weeks, it boded well for the sector long-term.
They did not show interest.
Since that note, gold miners have pretty much been on a one-way ride south. Miners started a bull market in 2018, and there was only once when sellers were so persistent that every one of the stocks fell below their 50-day moving average. That was the pandemic puke when everything got sold. Now, it's happened twice in less than two months. The overwhelming selling in May has only led to more selling.
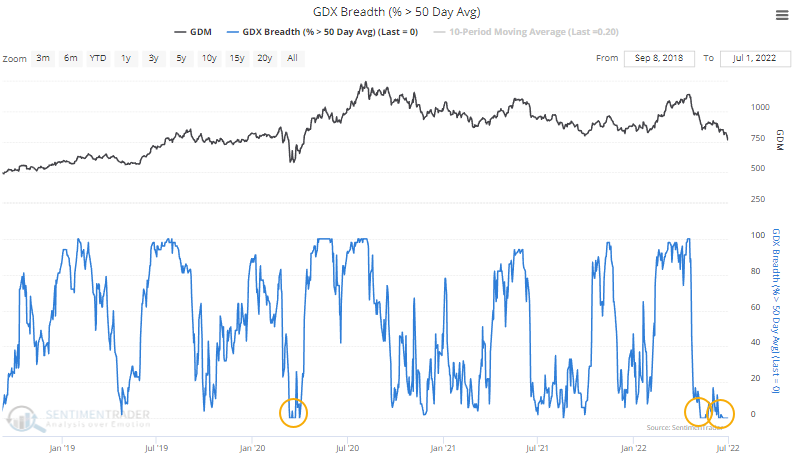
The 10-day average of this indicator is nearing zero for only the third time in the past 20 years.
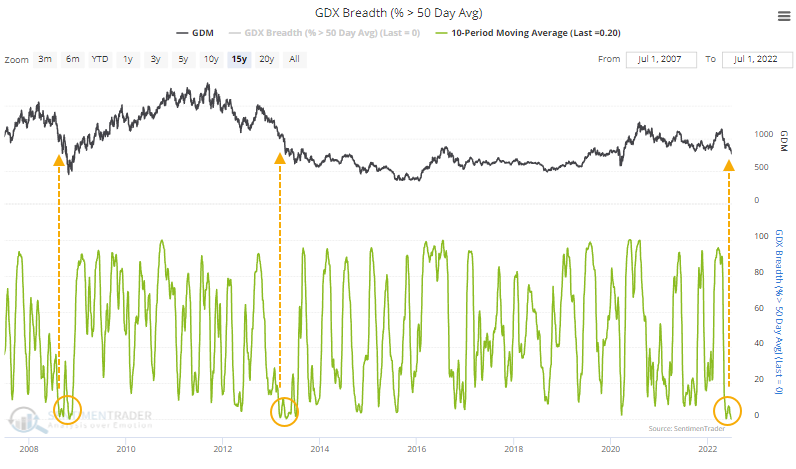
Neither one of the other periods marked an imminent and lasting low for gold miners. While the heaviest and most persistent selling might have been about at an end, indexes and funds like GDX had more losses in store.
This time, true panic
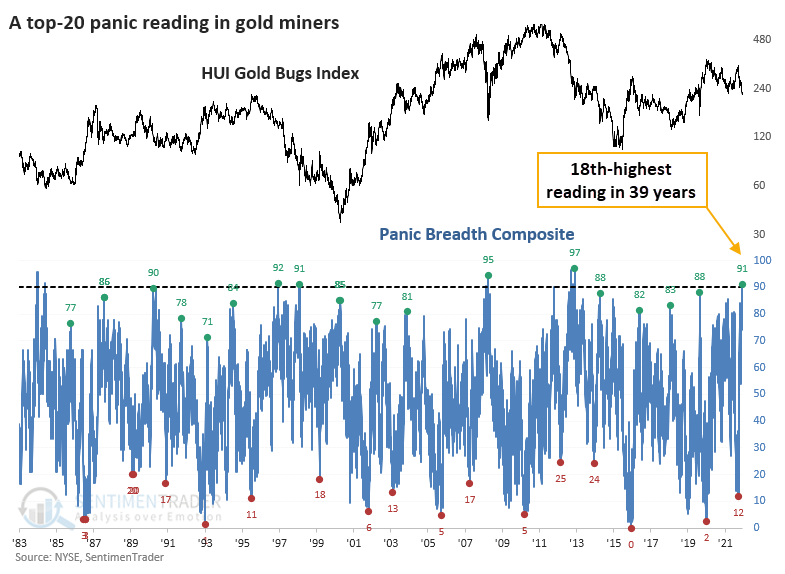
Using the same inputs and calculations for the Panic Breadth Composite that we did in May, the latest bout of selling surpassed anything from then. Or any other date in almost a decade.
On June 30, the Composite jumped above 90, suggesting the kind of overwhelming and broad-based selling of an entire sector that we don't see too often. For gold miners, that day ranked in the top 20 all-time, going back nearly 40 years.
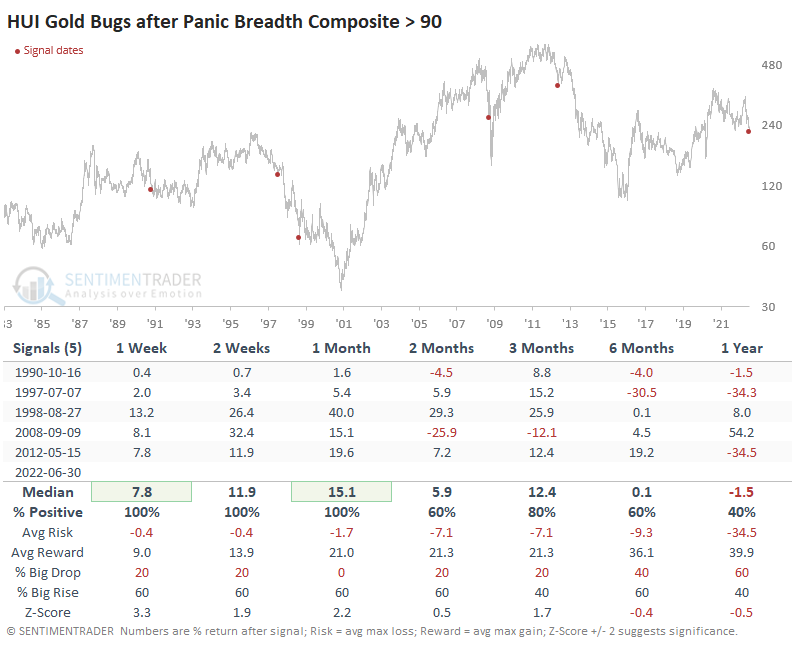
When dealing with a true historic extreme, by its nature, there aren't a lot of precedents to use as guides. This was no exception. Since our data begins in 1983, there have been only five comparable bouts of panic. The good news? Gold miners rallied over the next several weeks every time, showing significant gains. The bad news? Those rallies fizzled out and led to lower lows every time.
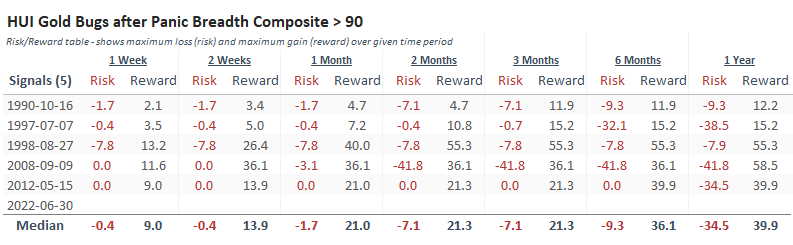
The Risk/Reward Table shows low risk up to a month later each time, except for 1998, which saw extreme two-way volatility.
What the research tells us...
When gold mining stocks shot higher and registered positive momentum this spring, they triggered impressive precedents. Miners pulled back in April, which should have been a good entry to take advantage of what looked like a good setup. It failed miserably so far, leading to the mini-panic in May and what we could reasonably argue is outright panic last week. It's always iffy to rely on such tiny sample sizes, especially for a market that is highly correlated to a market that is easily overwhelmed by other factors. But the few precedents we have suggest that the sector should see a multi-week rebound from the latest bout of selling pressure. What happens after that, though, is a lot less certain.
Indicators at Extremes
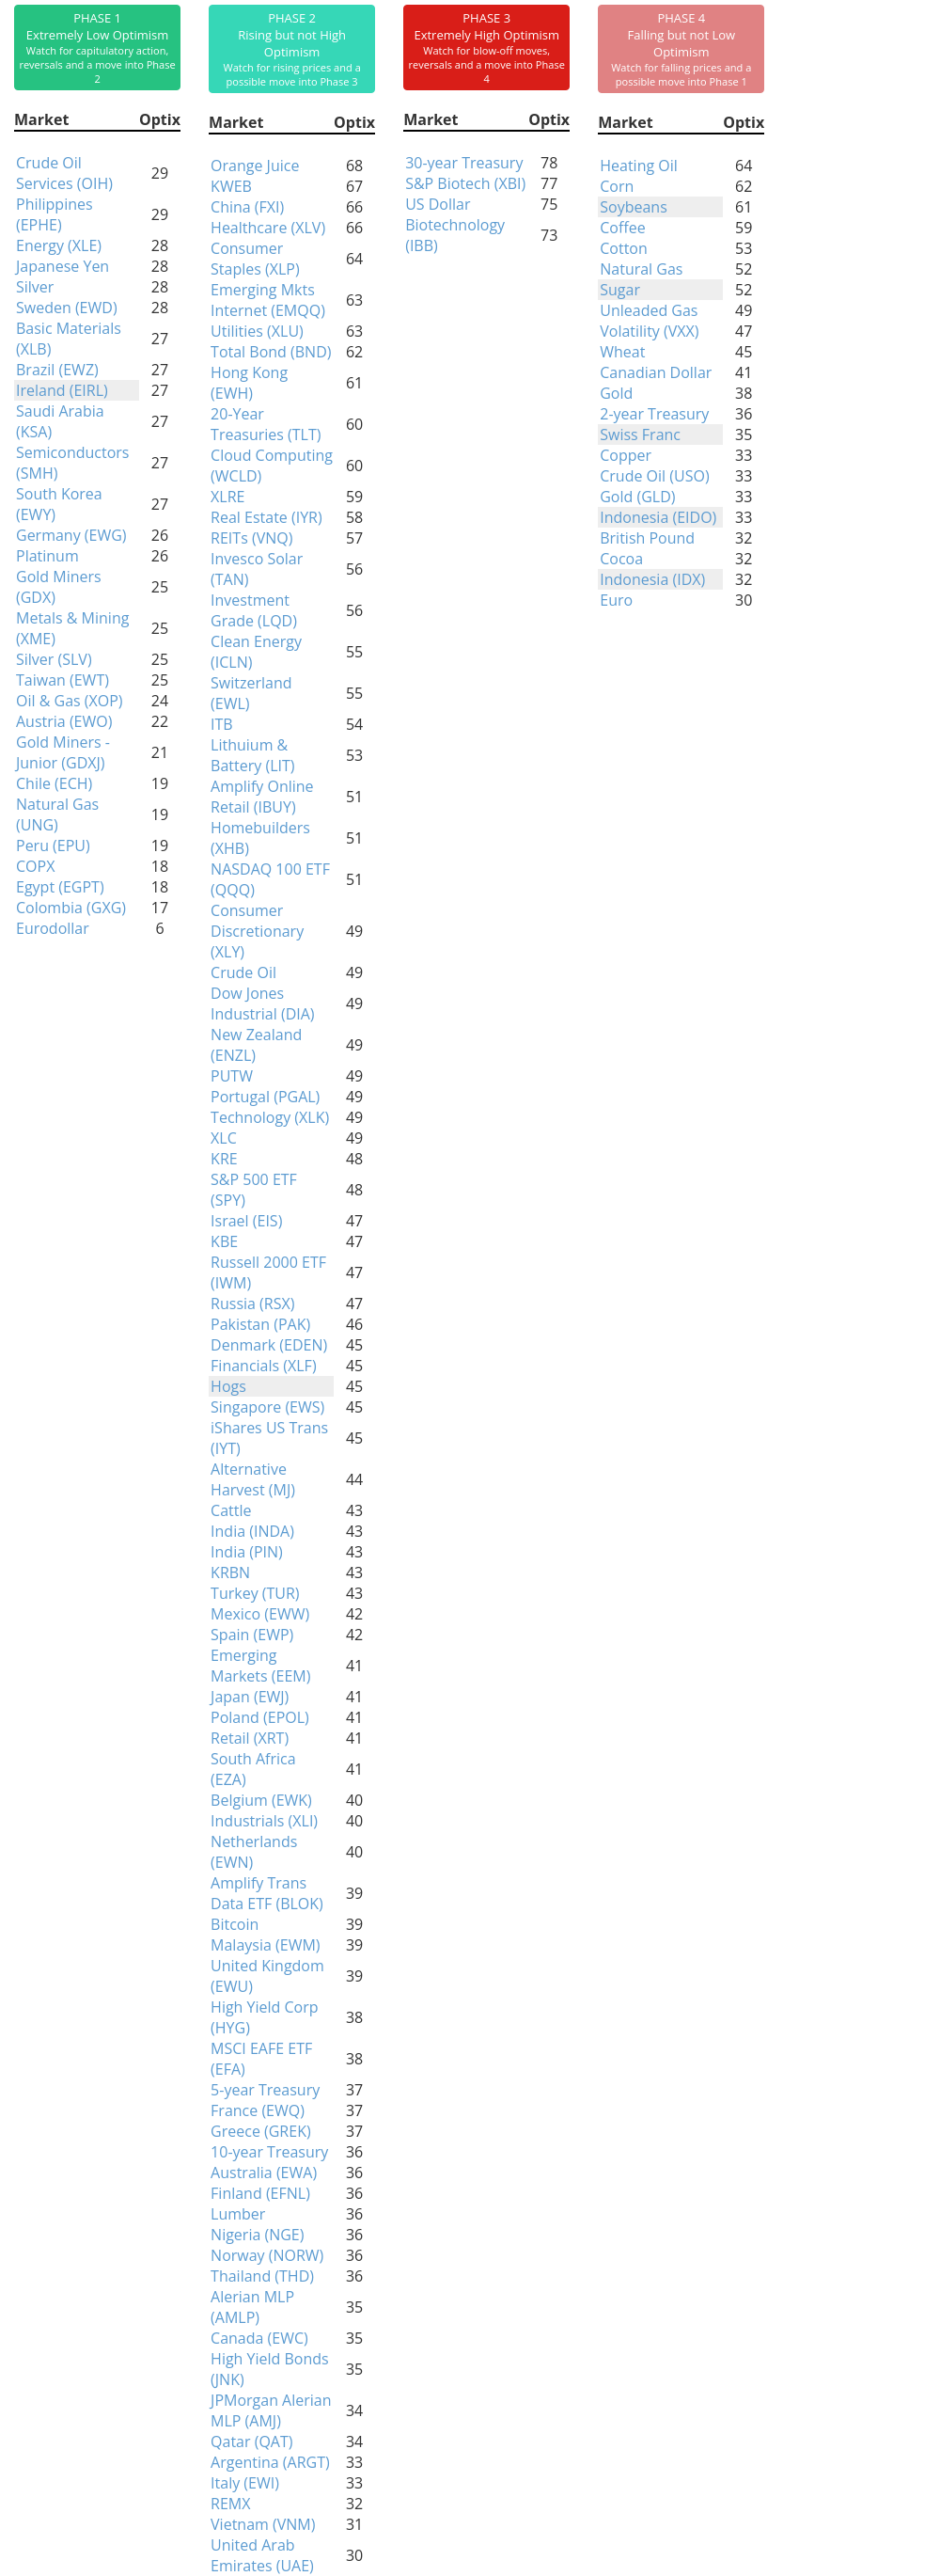
Phase Table
Ranks
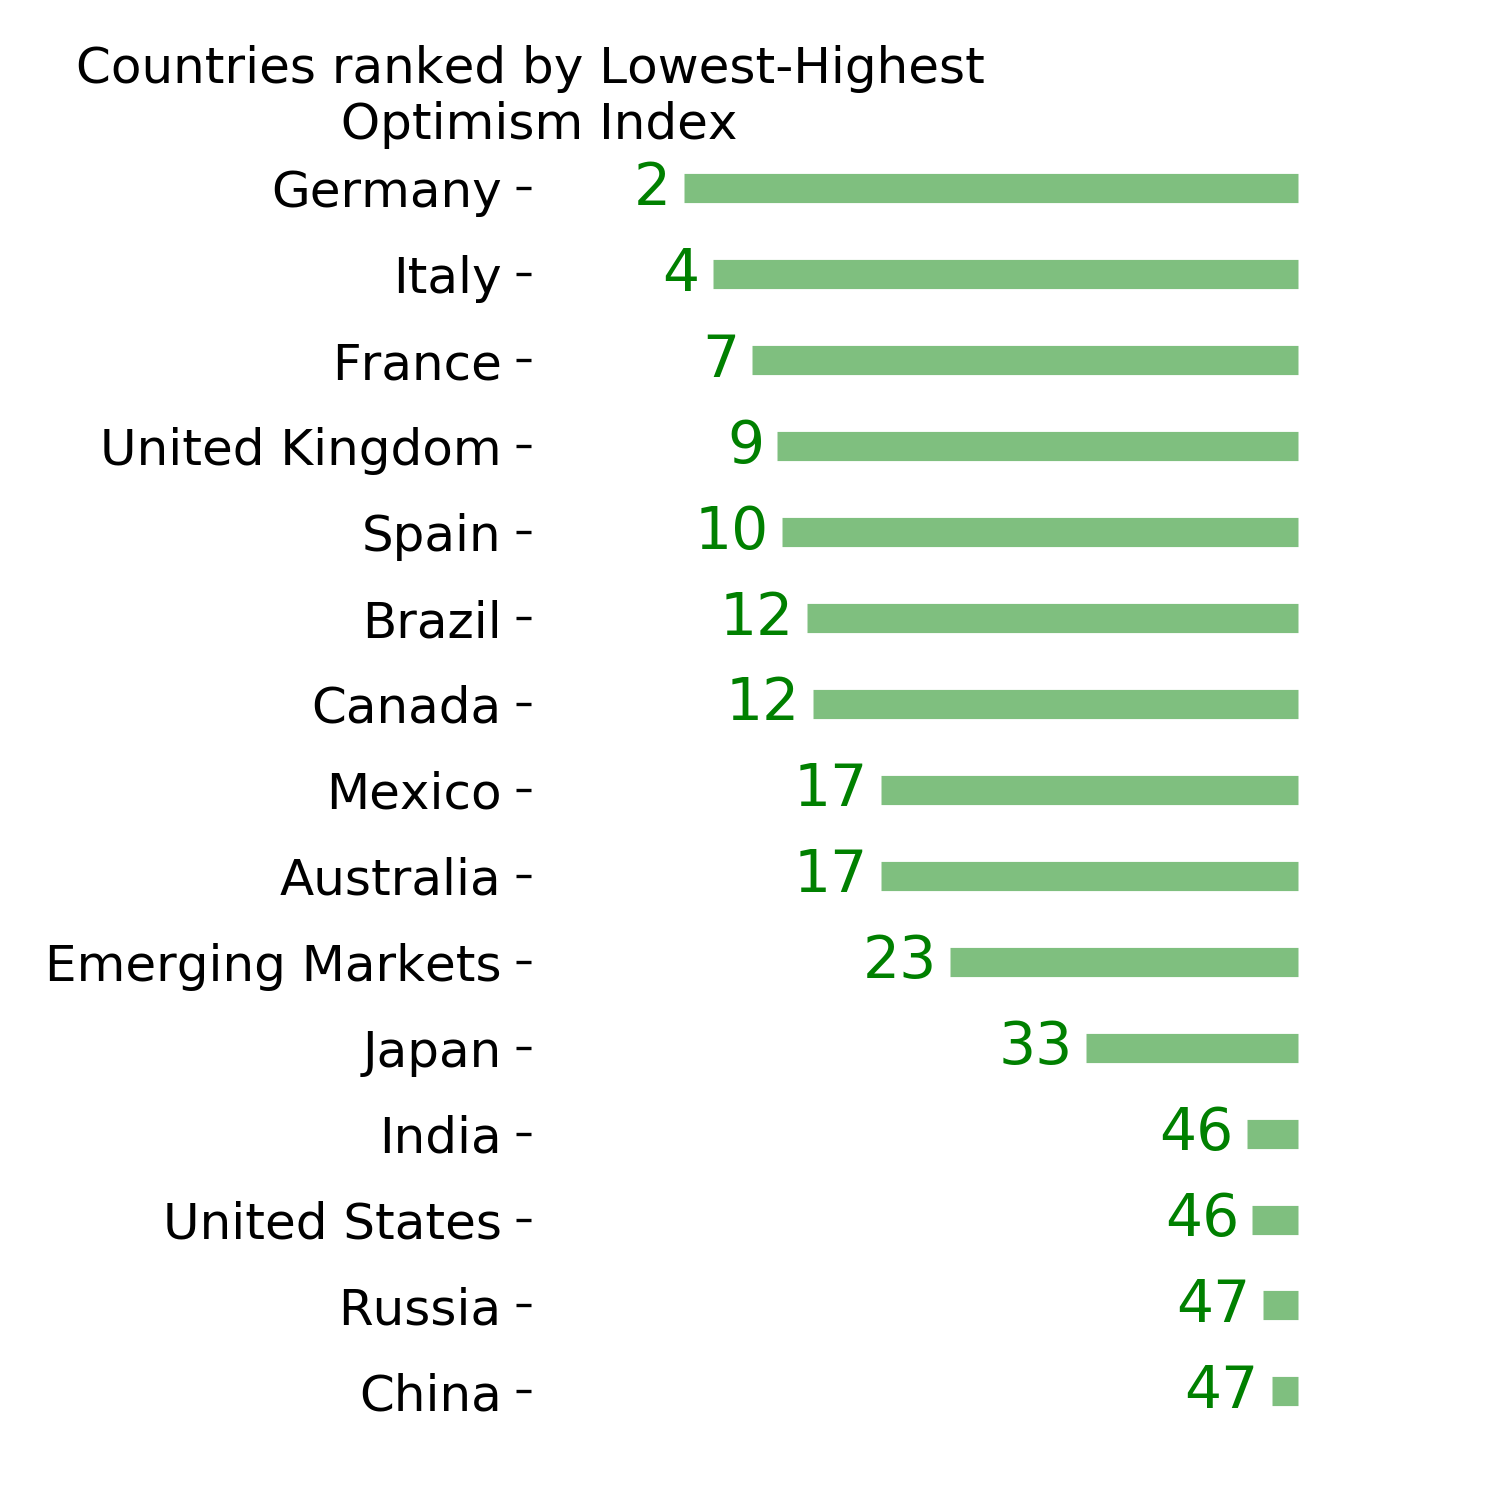
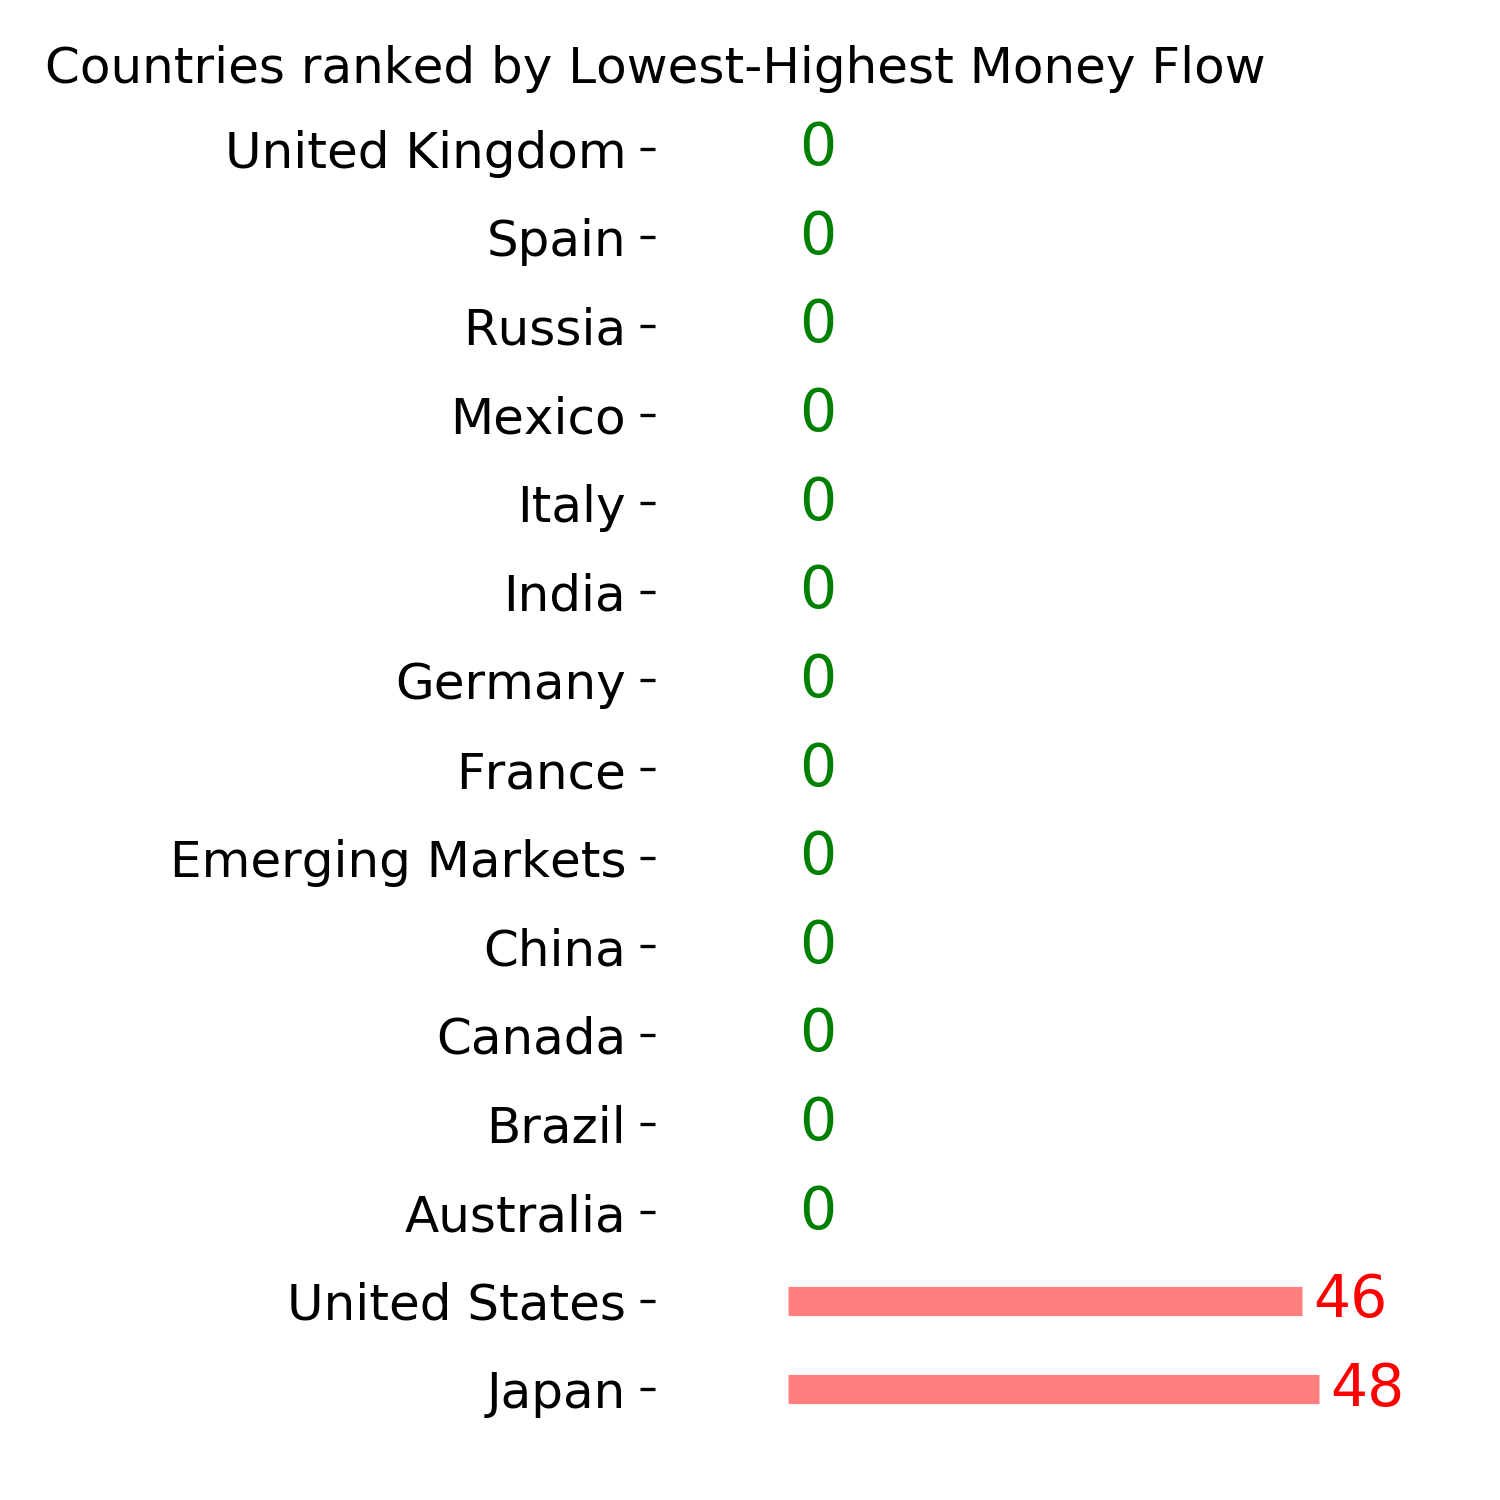
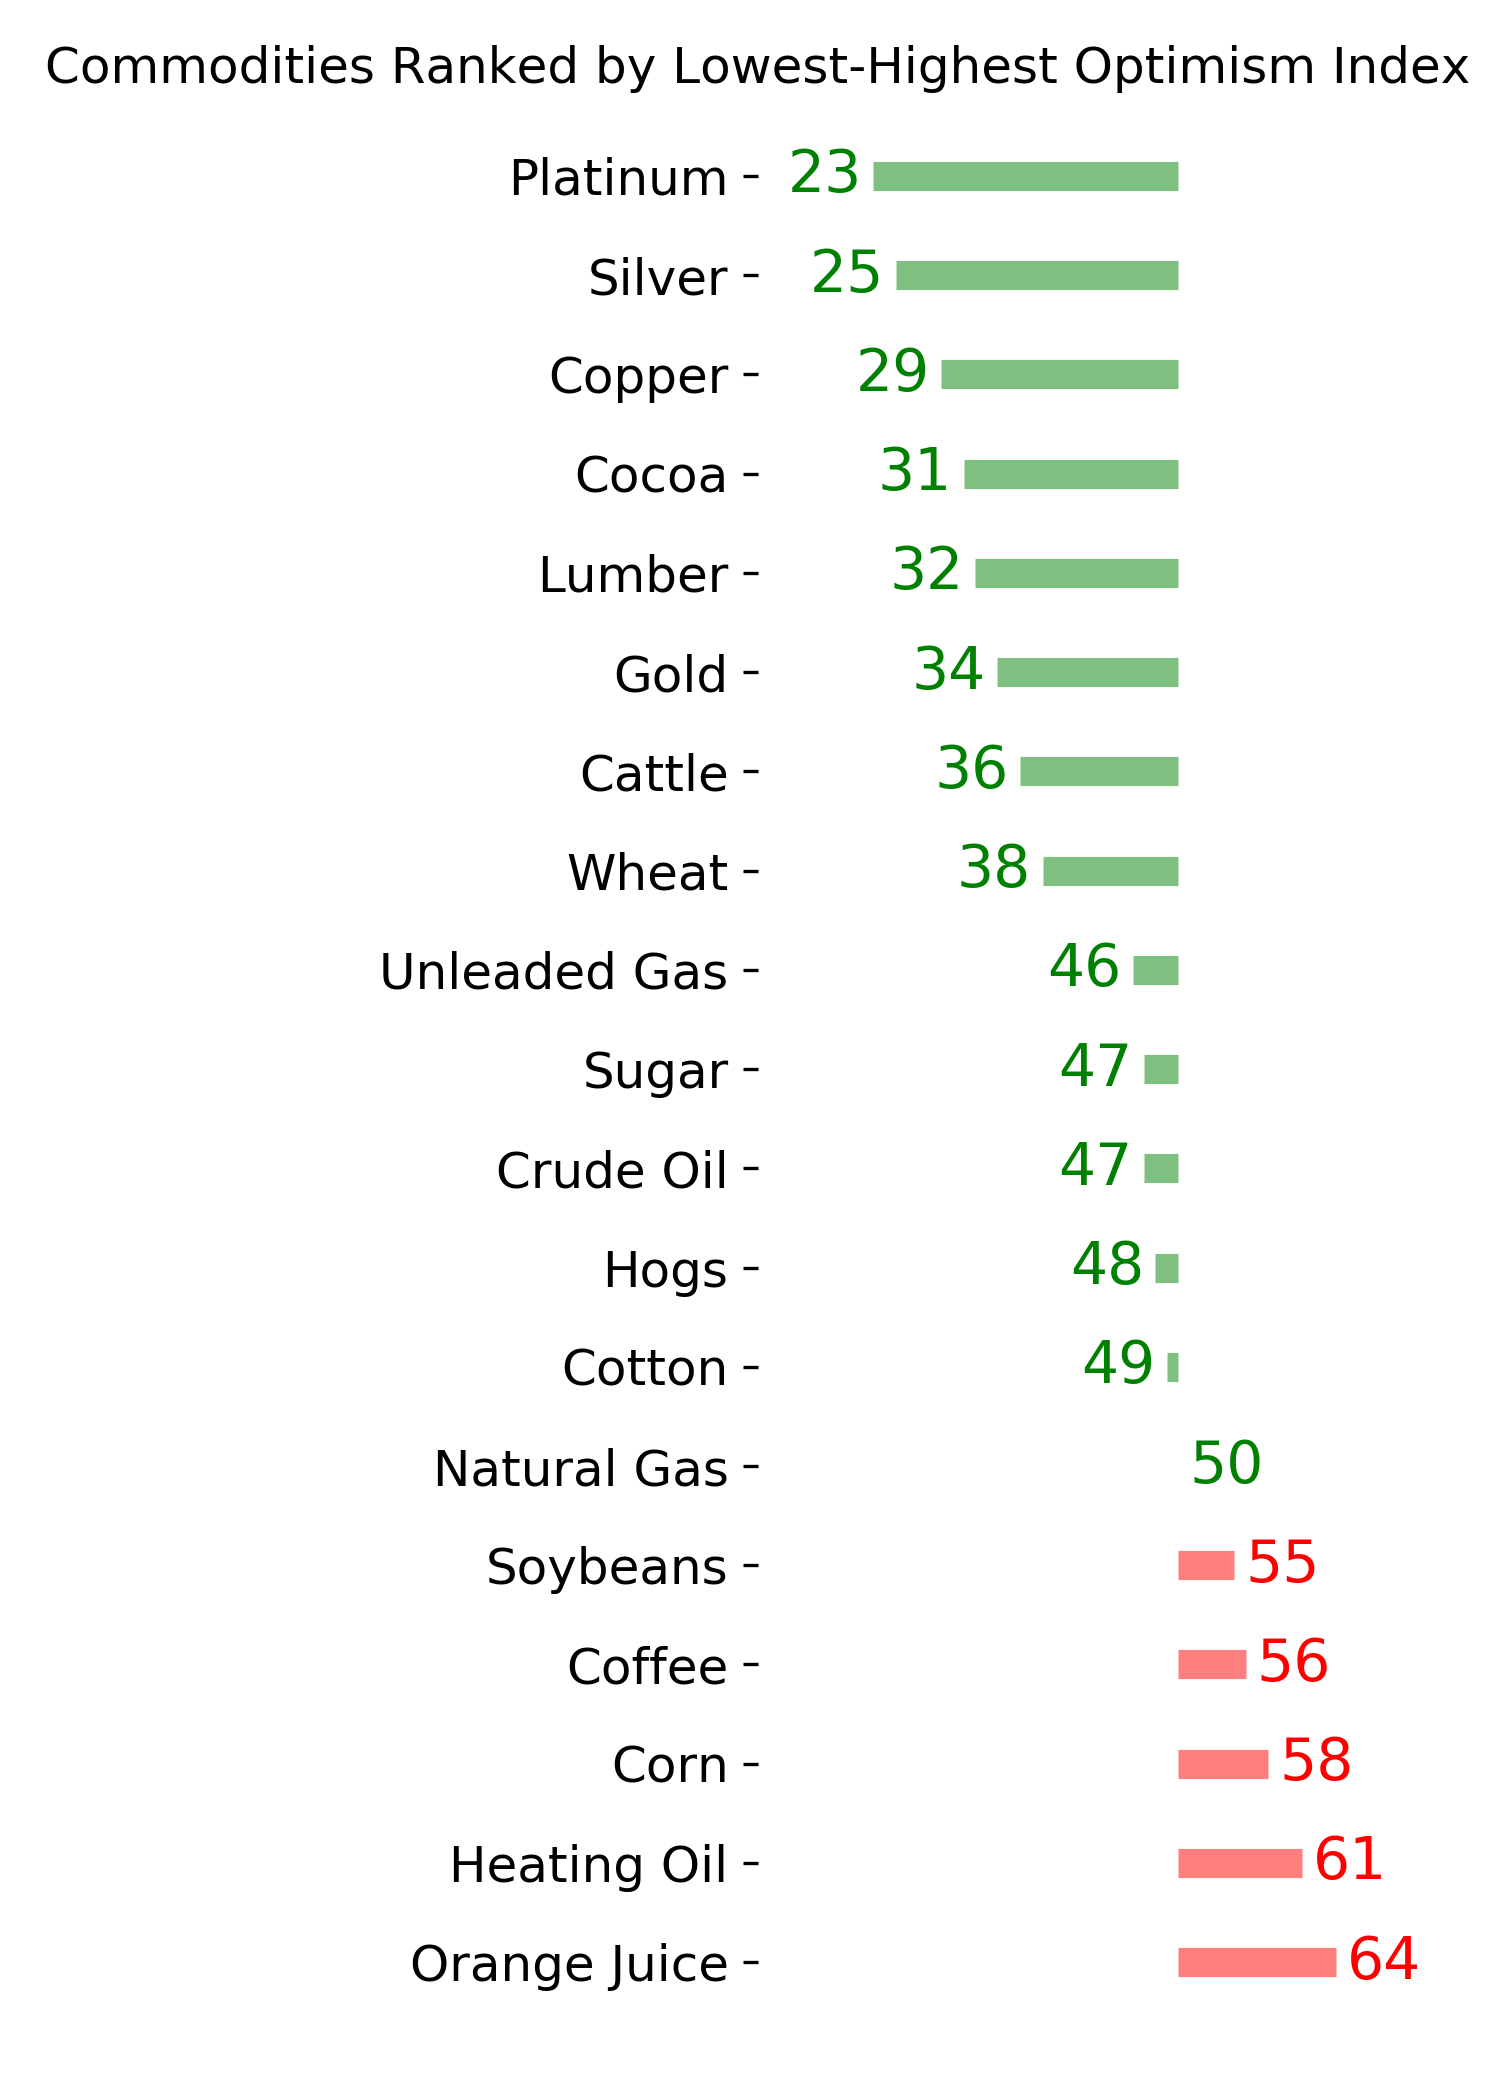
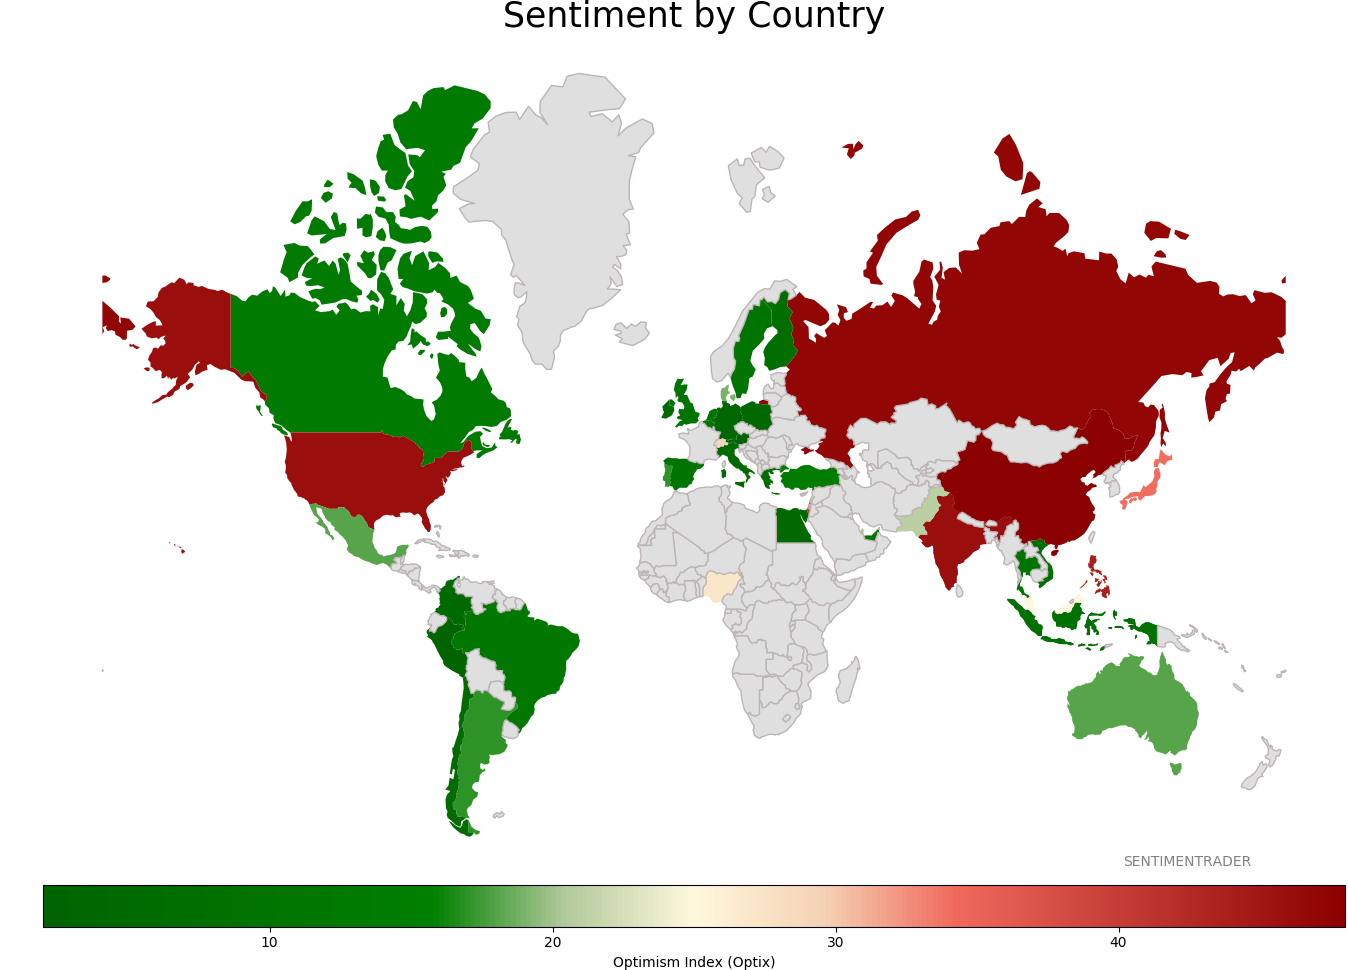
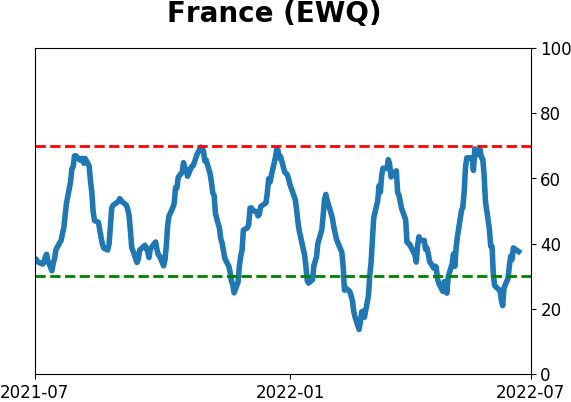
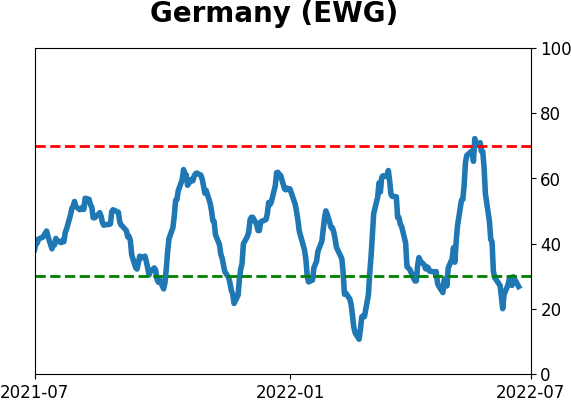
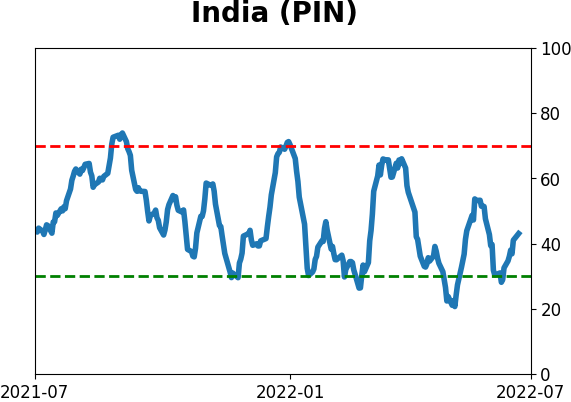
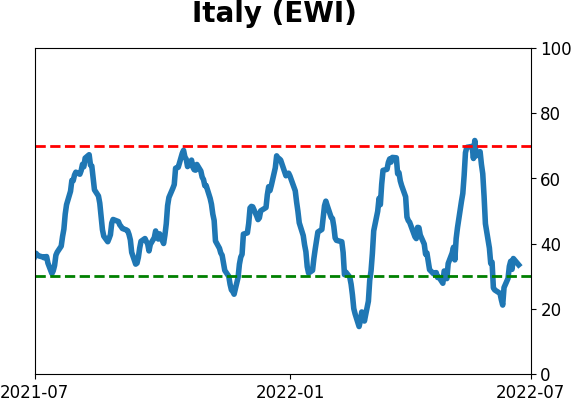
Sentiment Around The World
Optimism Index Thumbnails
|
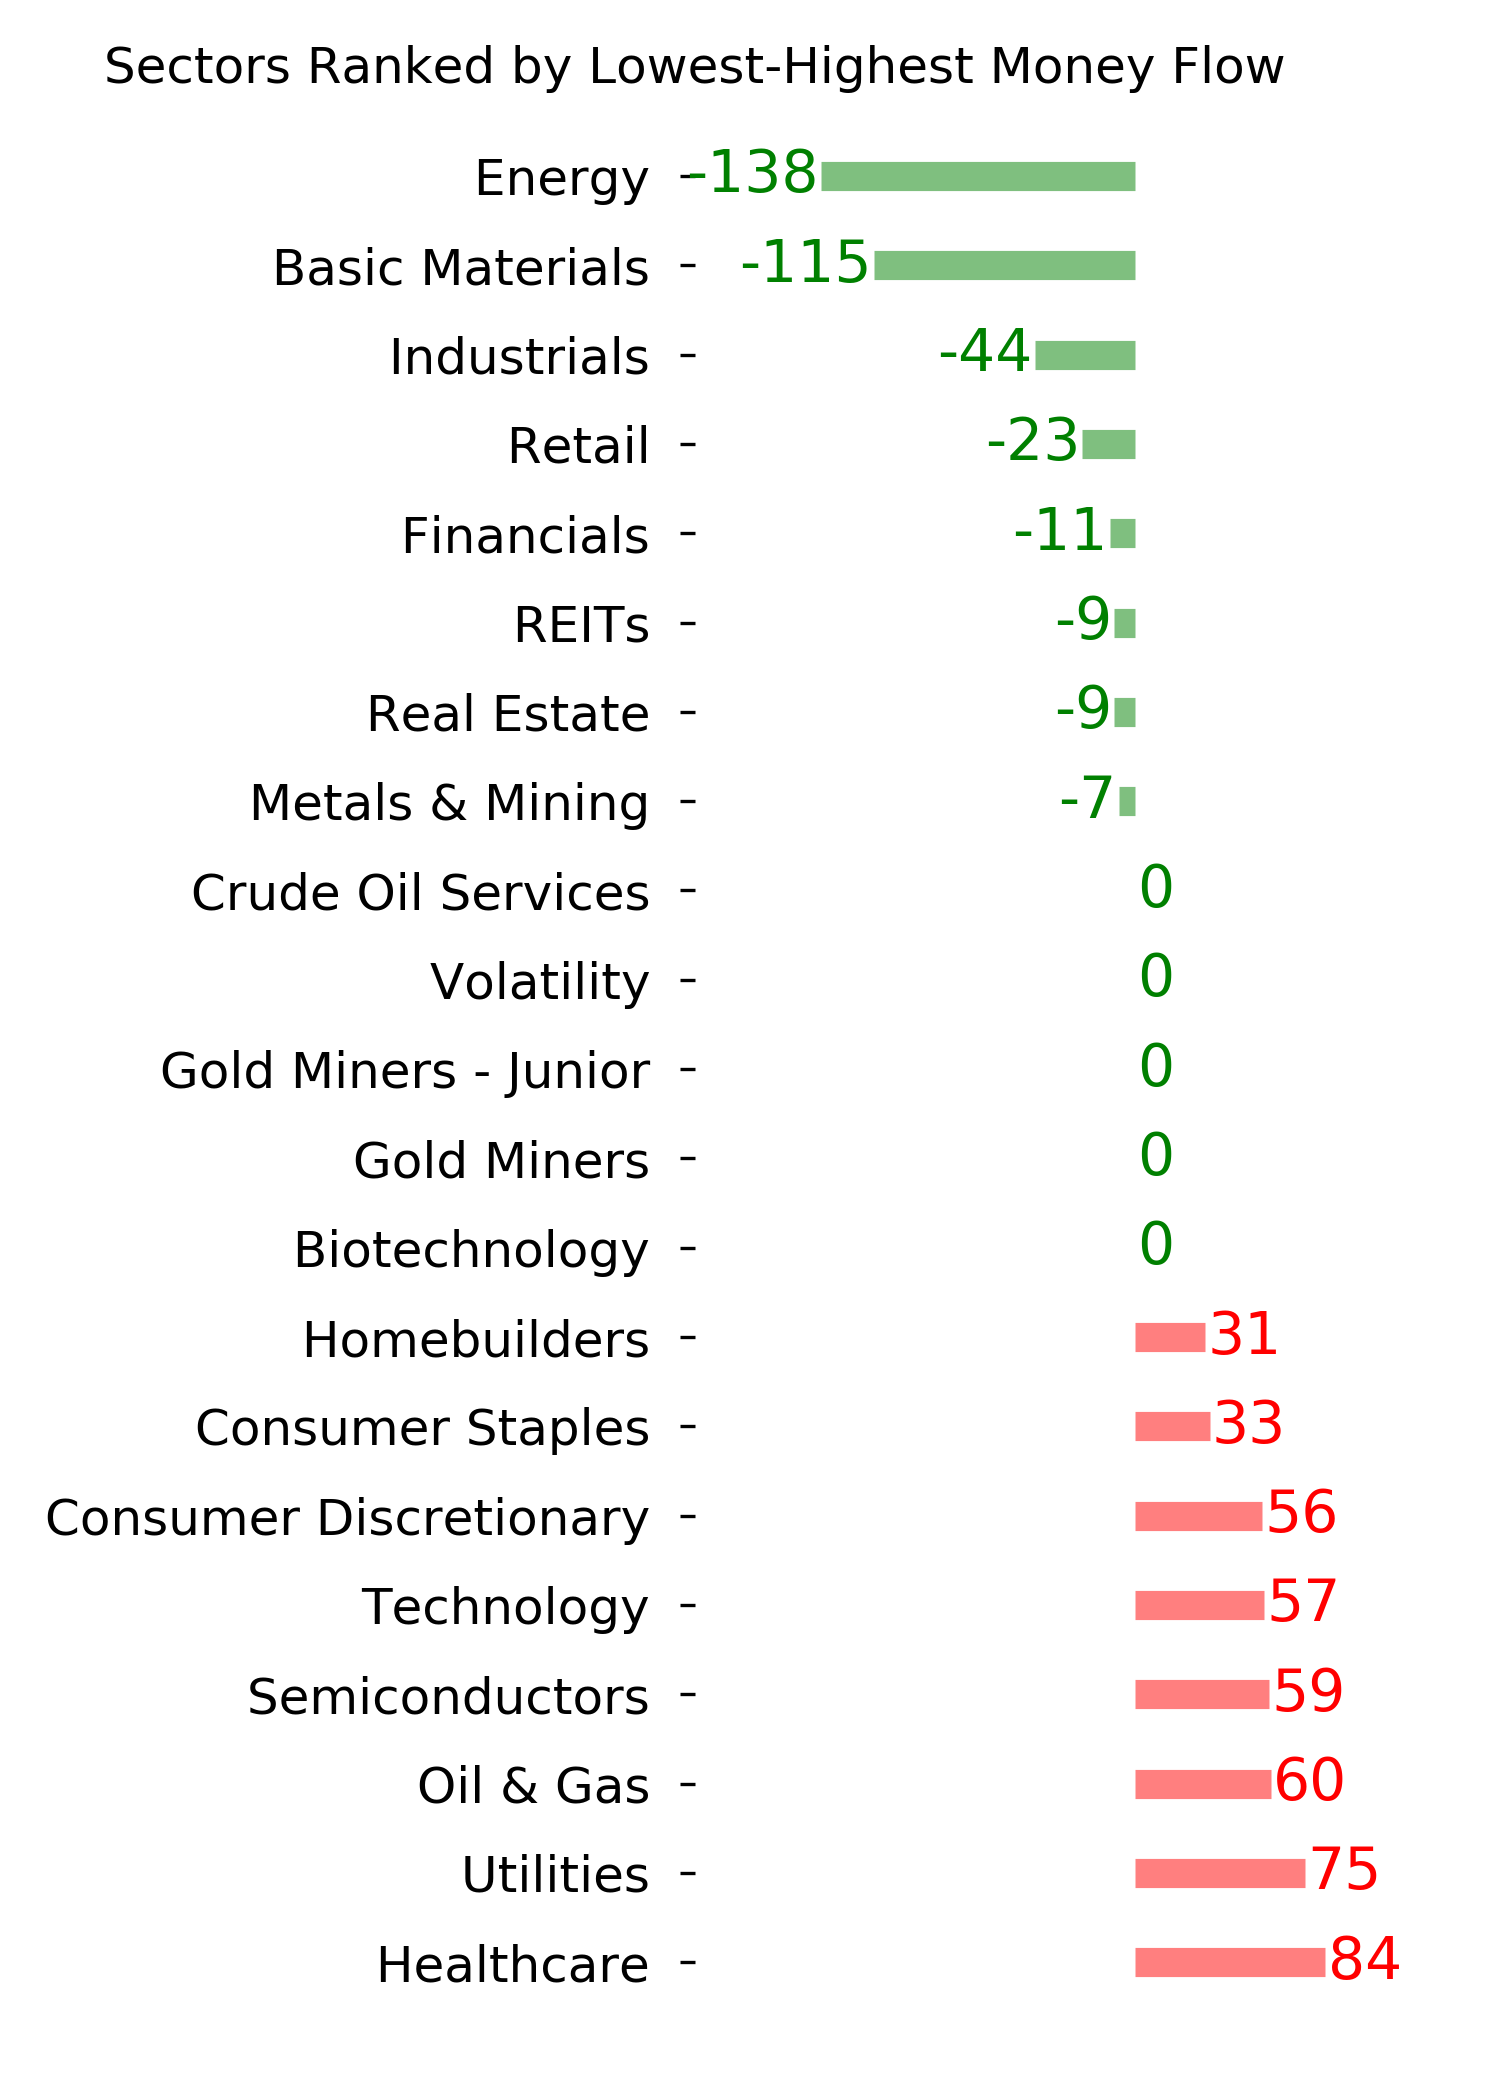
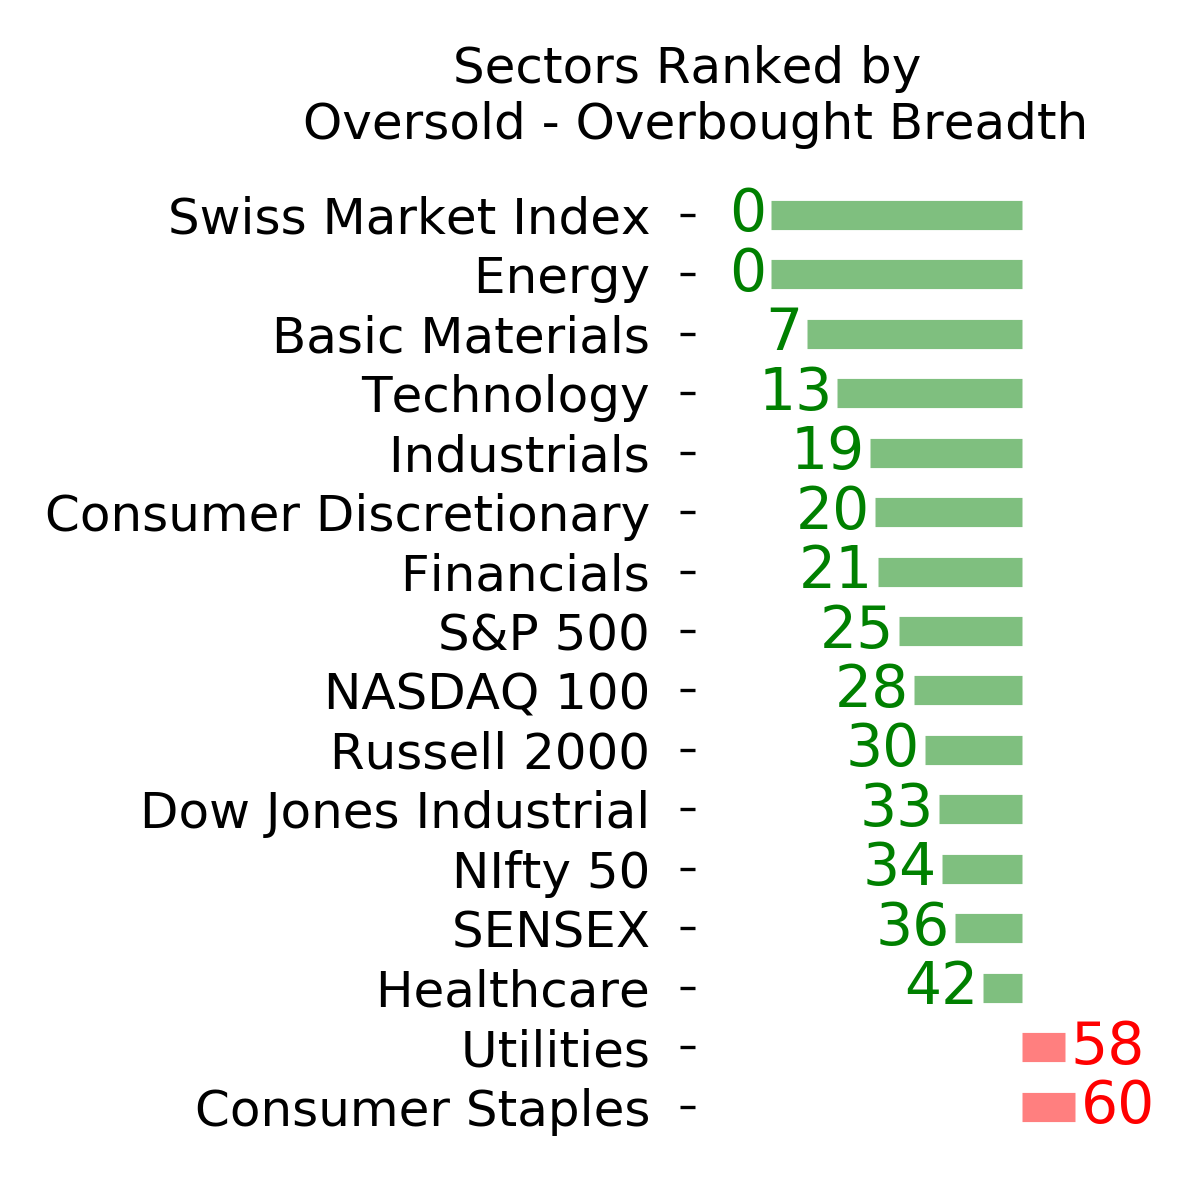
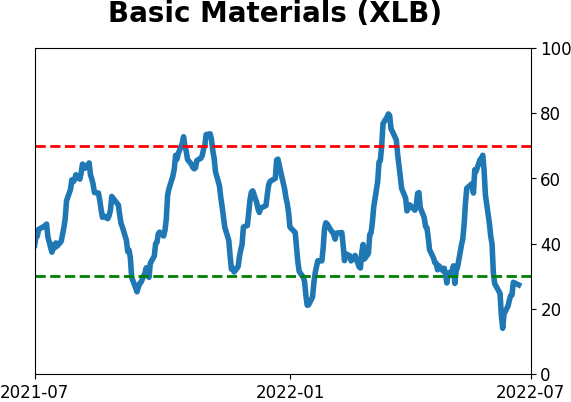
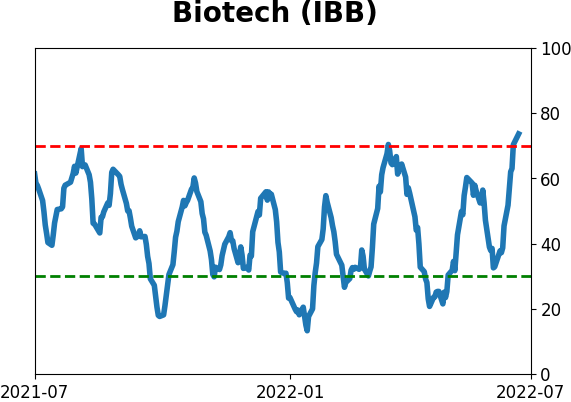
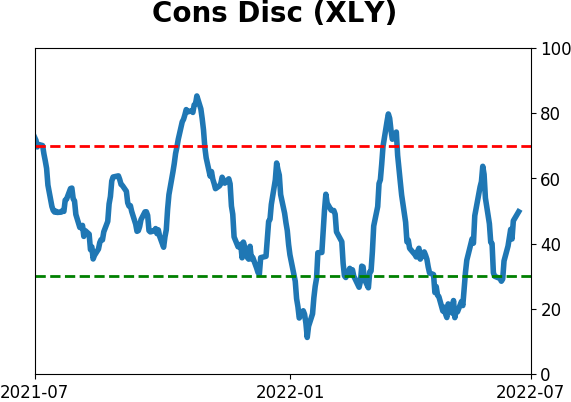
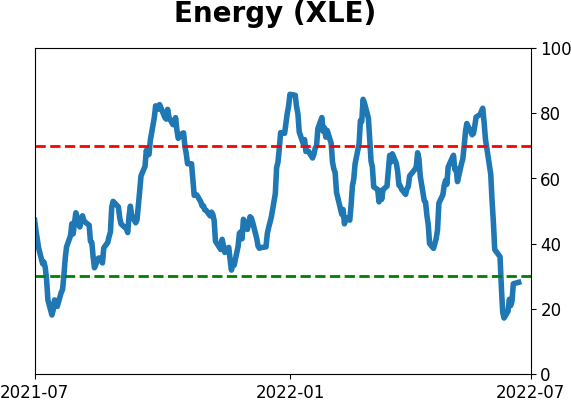
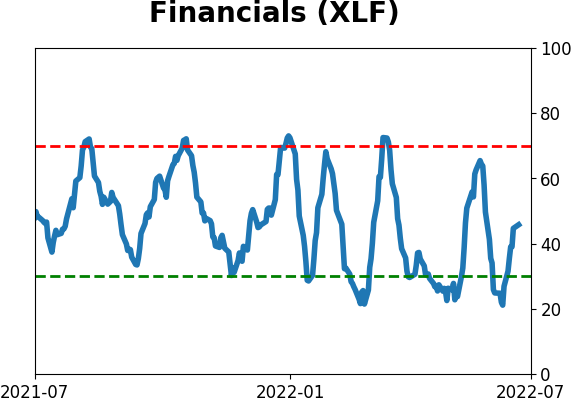
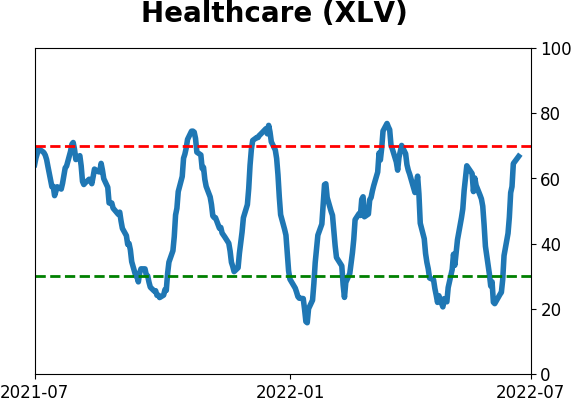
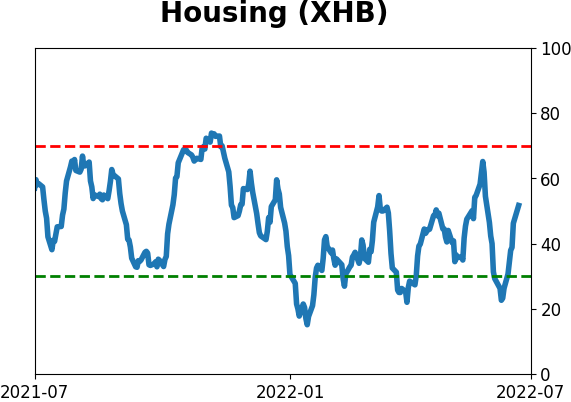
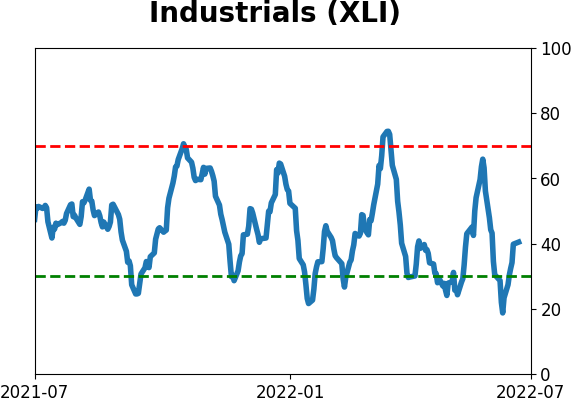
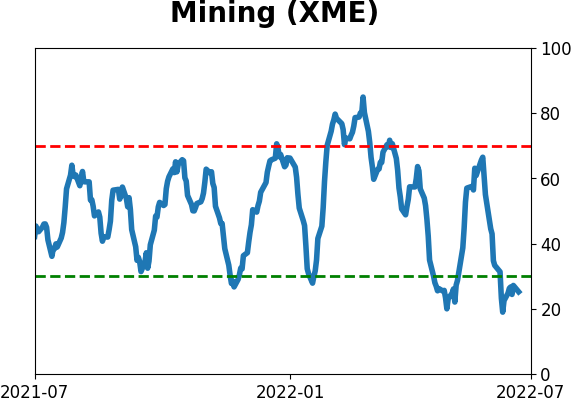
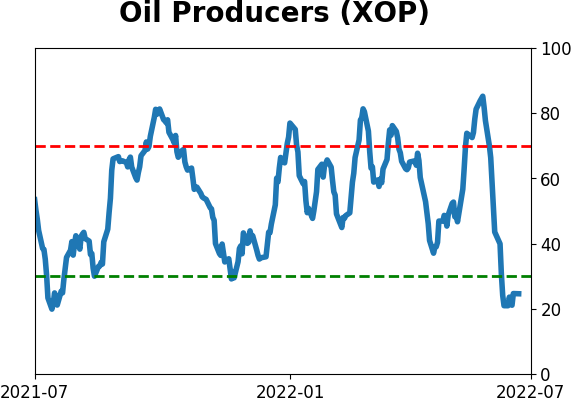
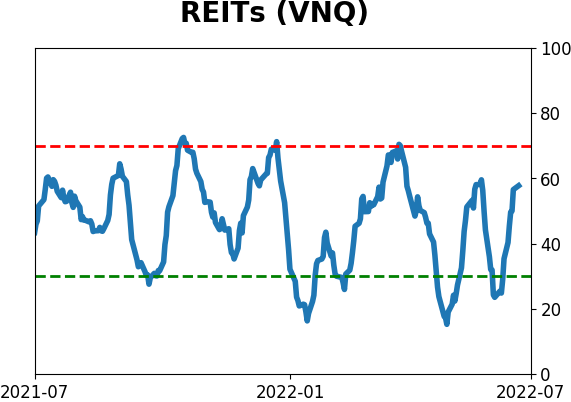
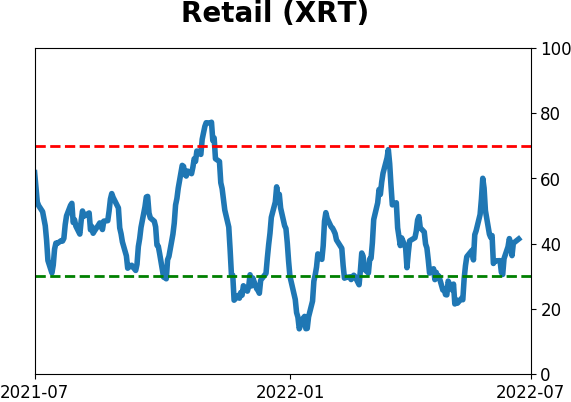
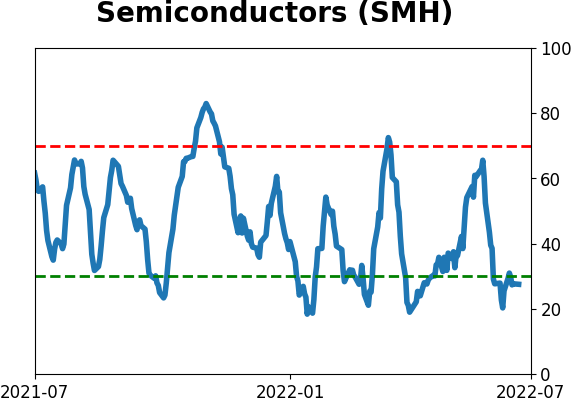
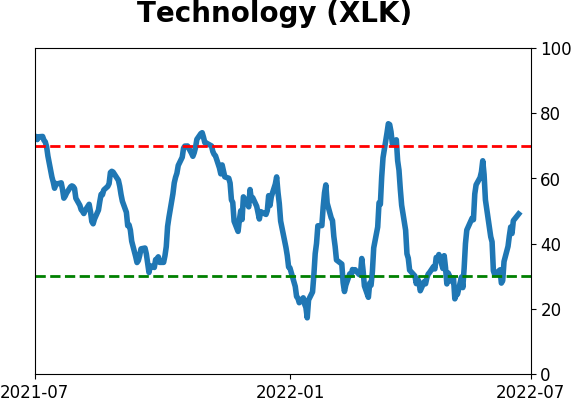
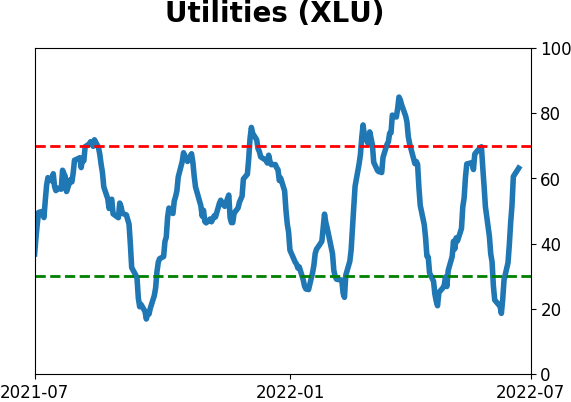
Sector ETF's - 10-Day Moving Average
|
|
|
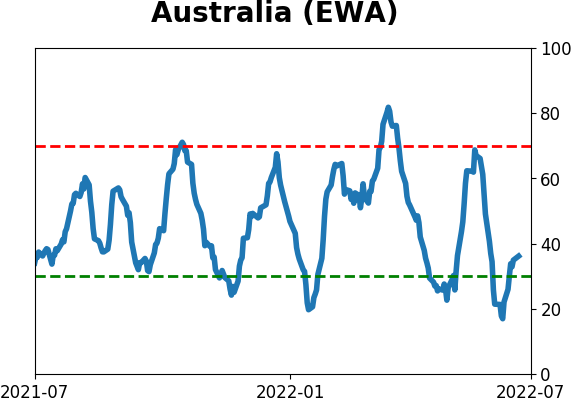
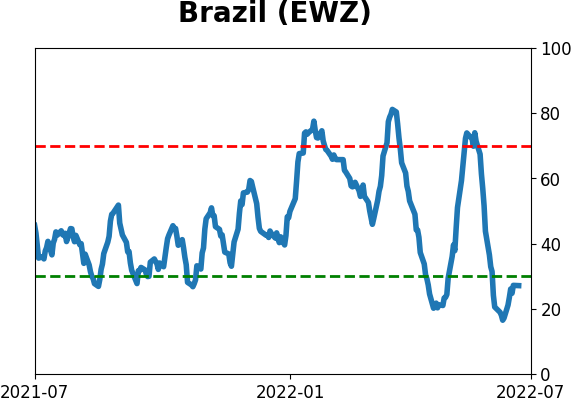
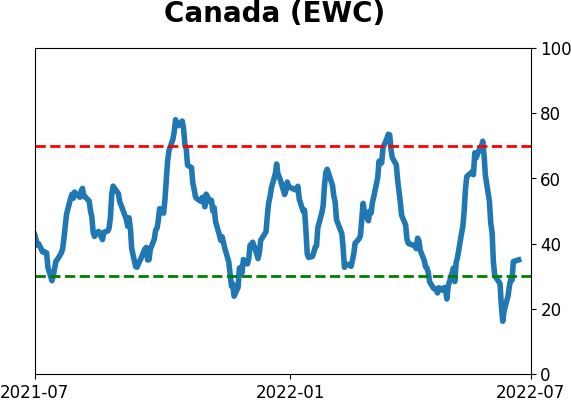
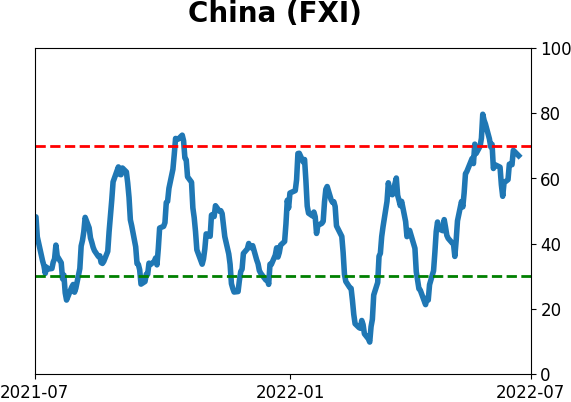
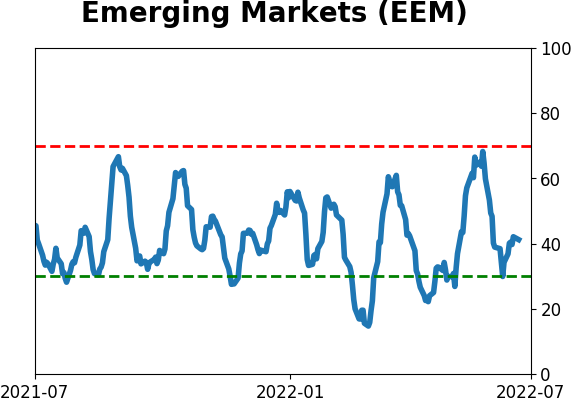
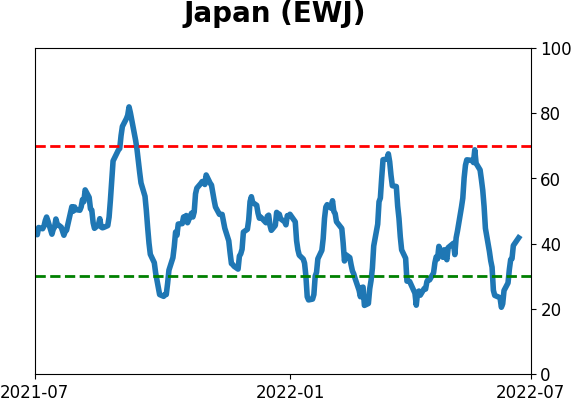
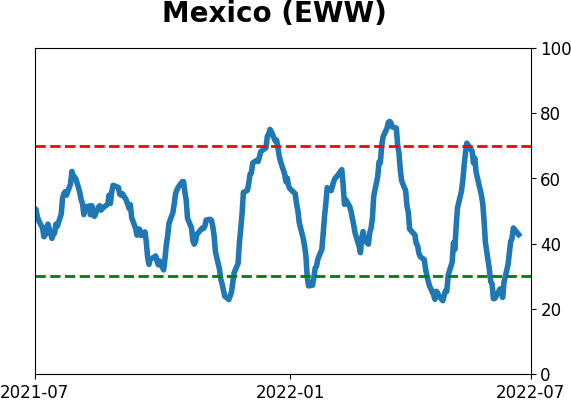
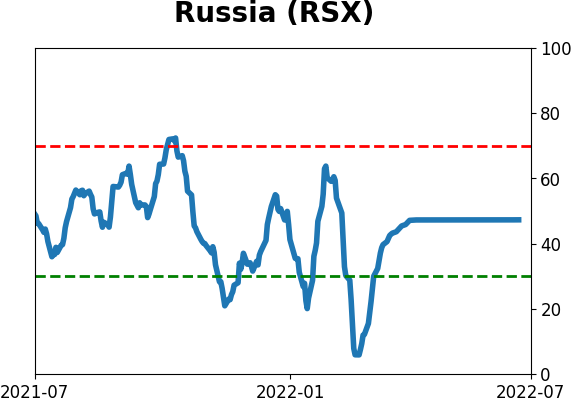
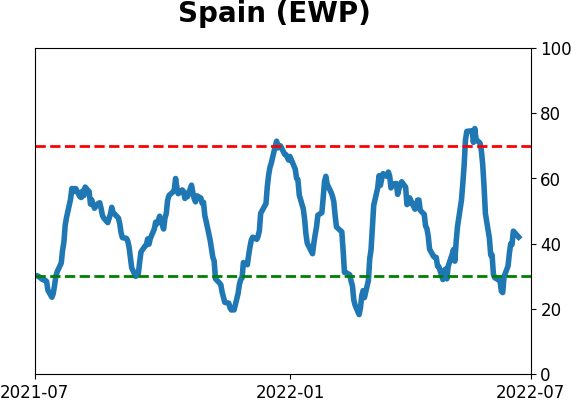
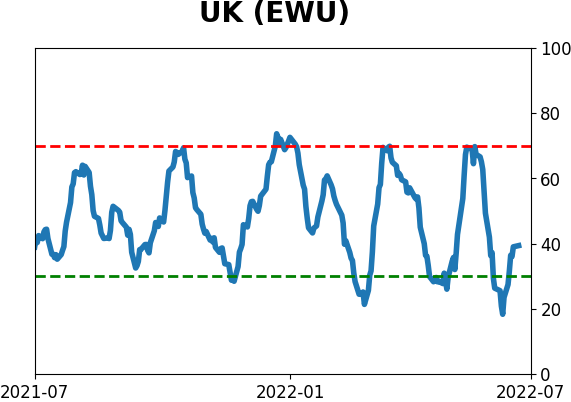
Country ETF's - 10-Day Moving Average
|
|
|
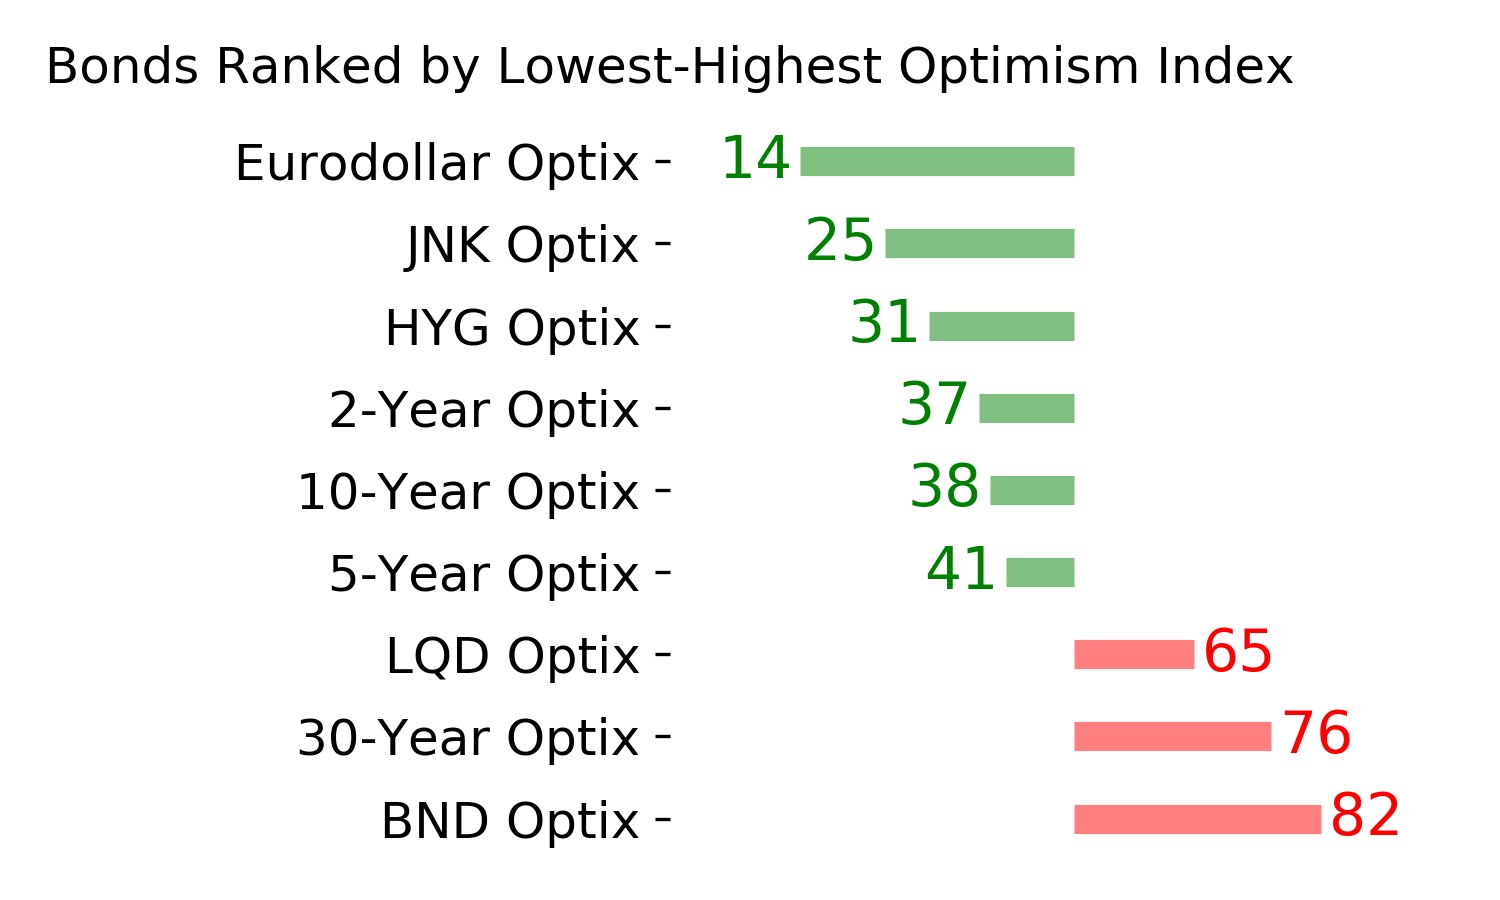
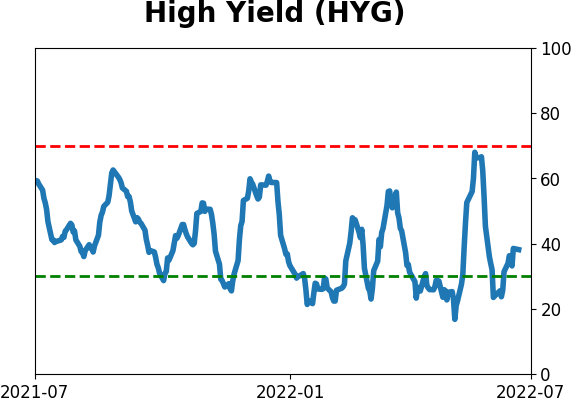
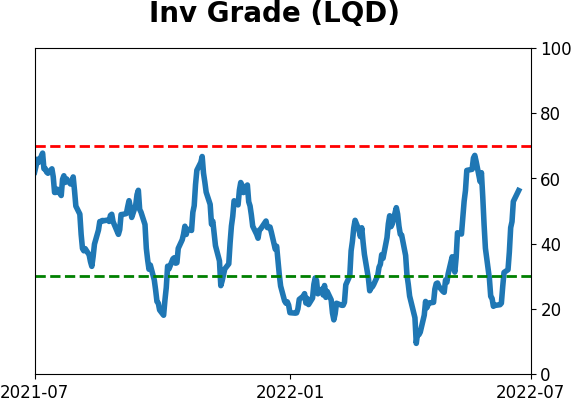
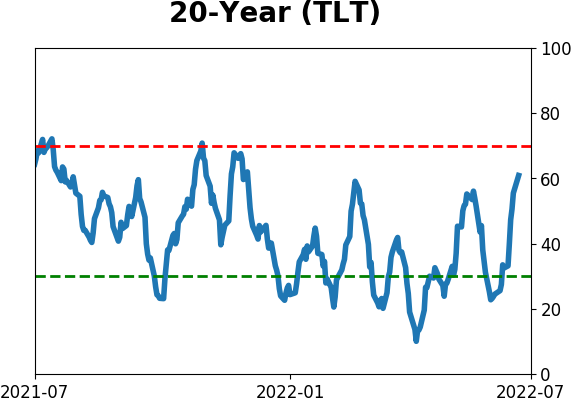
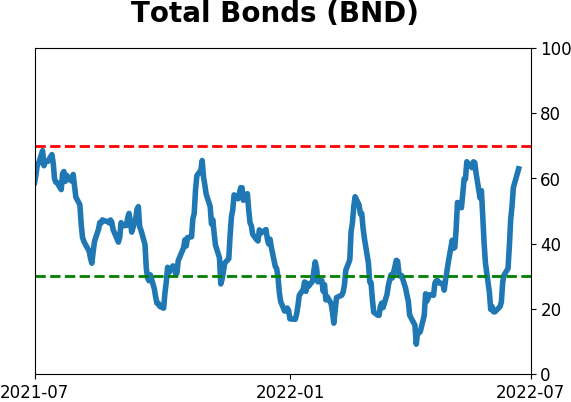
Bond ETF's - 10-Day Moving Average
|
|
|
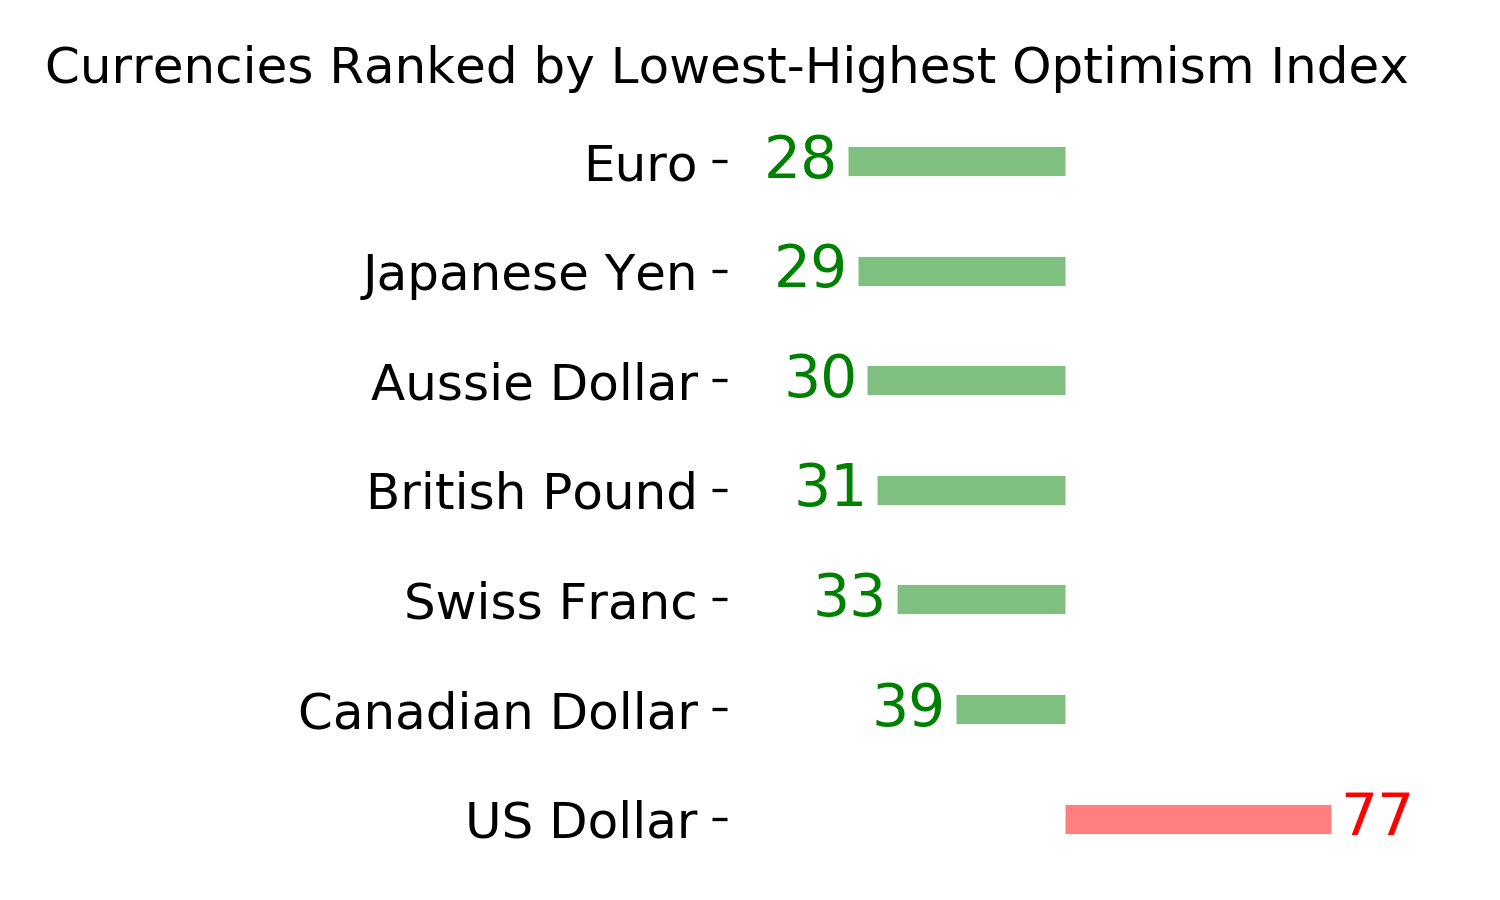
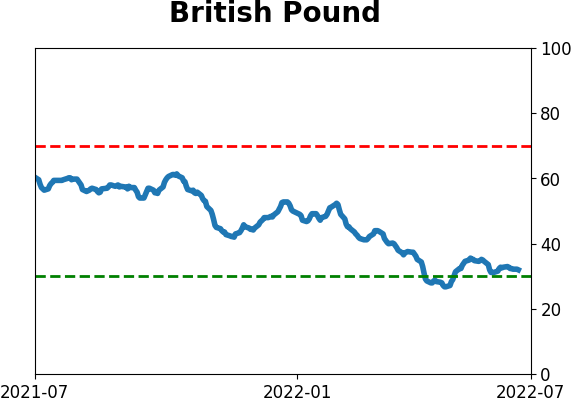
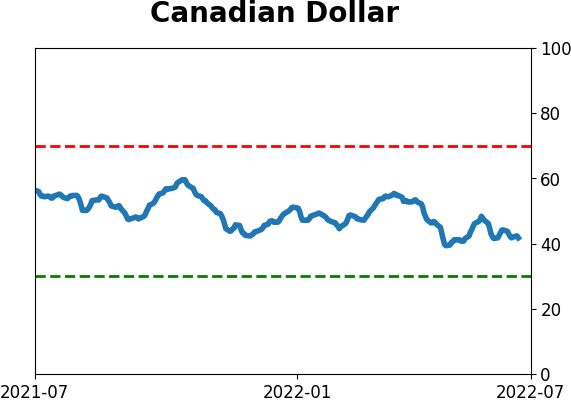
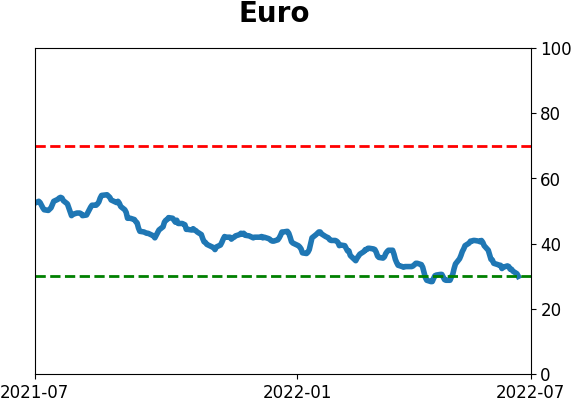
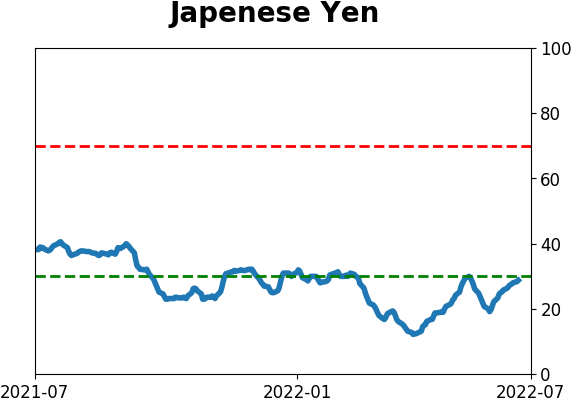
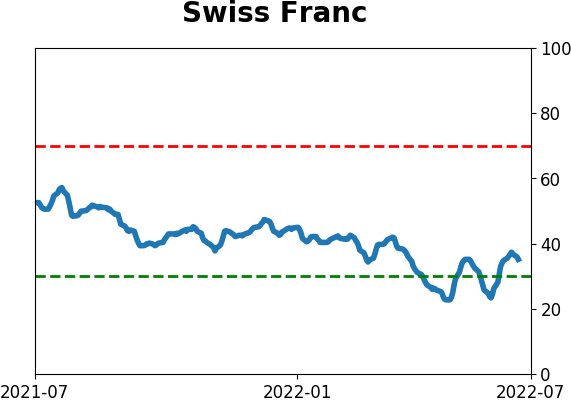
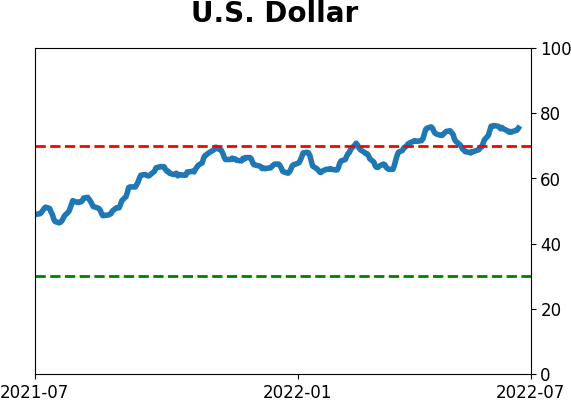
Currency ETF's - 5-Day Moving Average
|
|
|
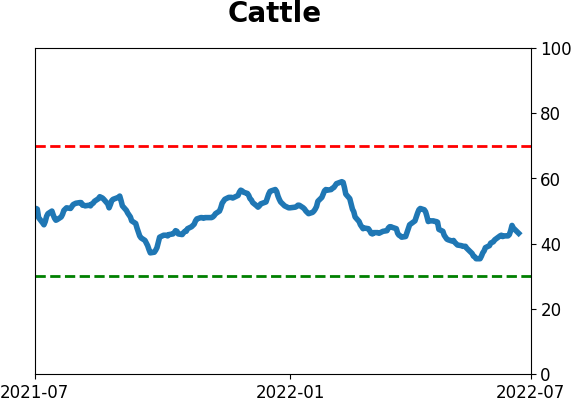
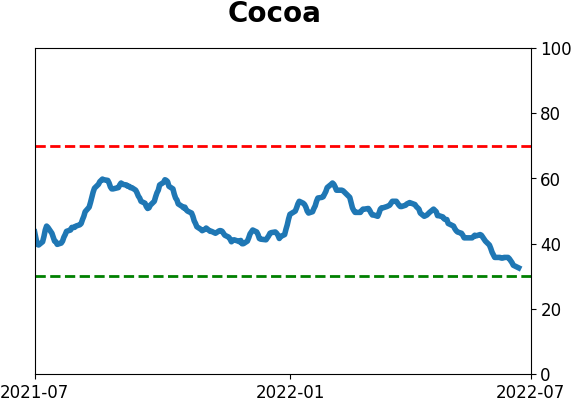
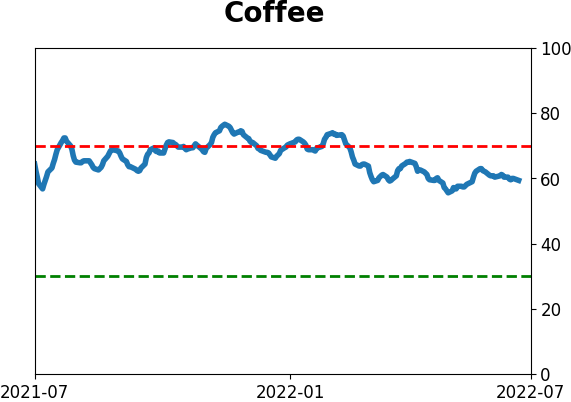
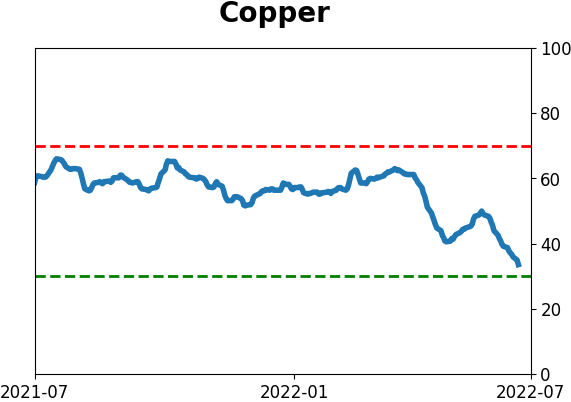
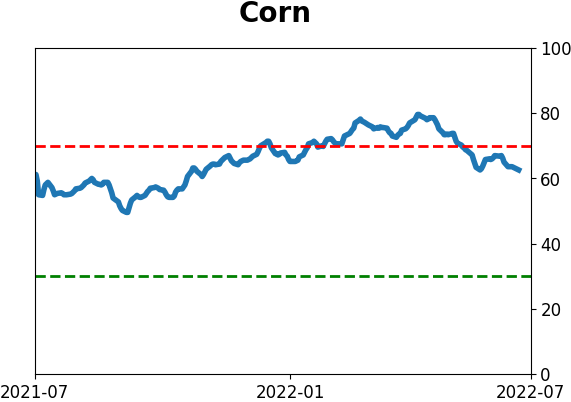
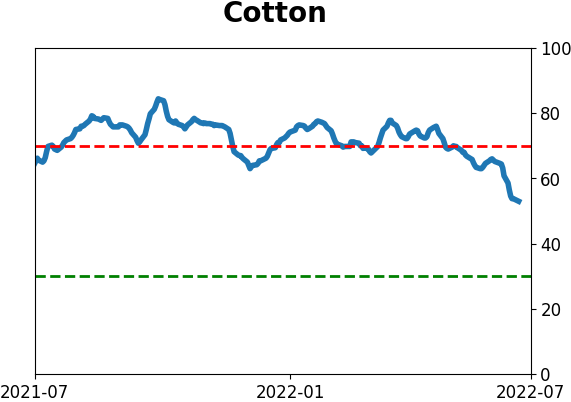
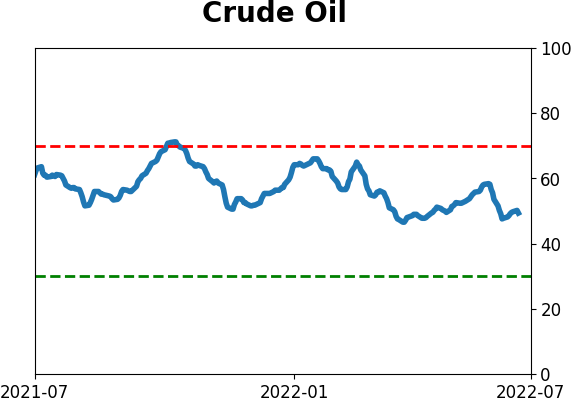
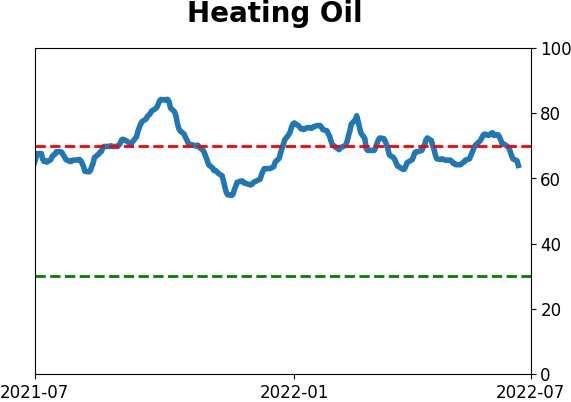
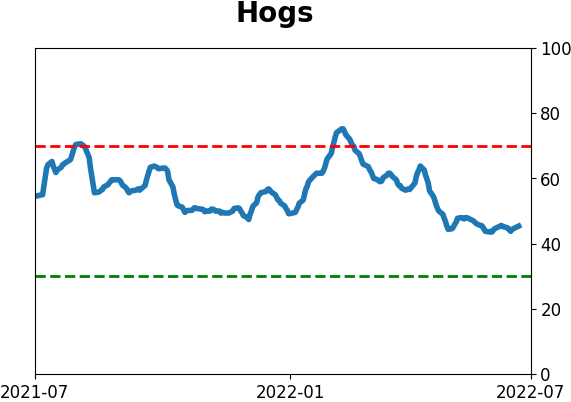
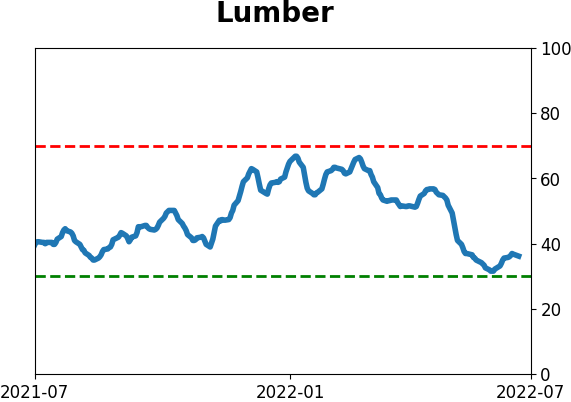
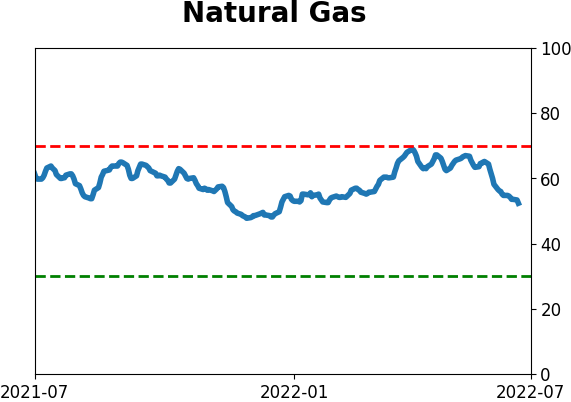
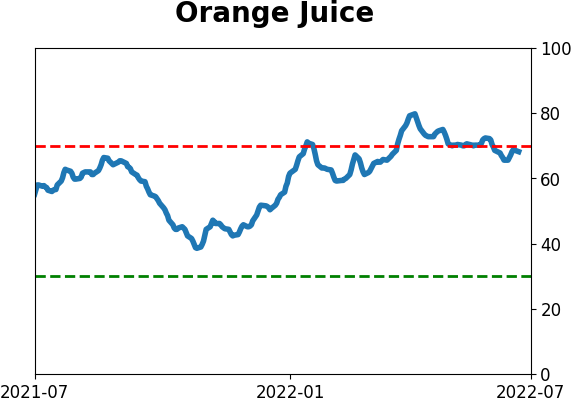
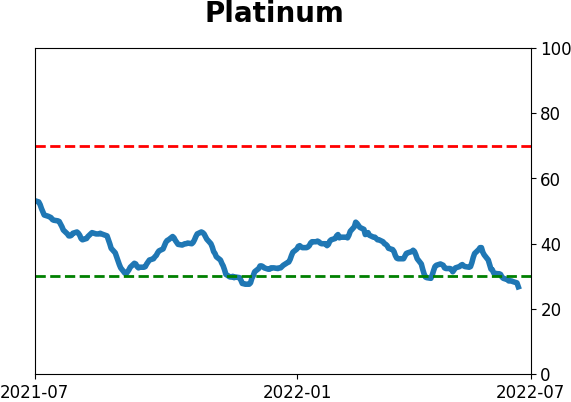
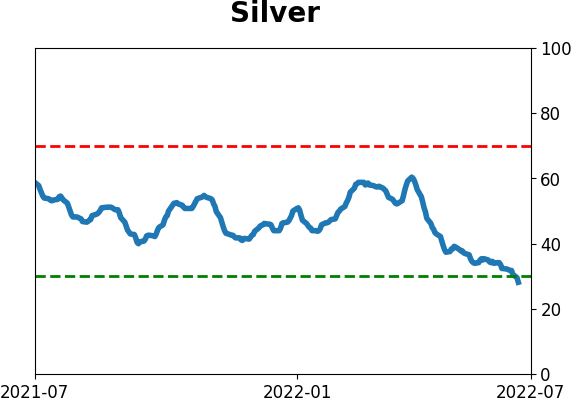
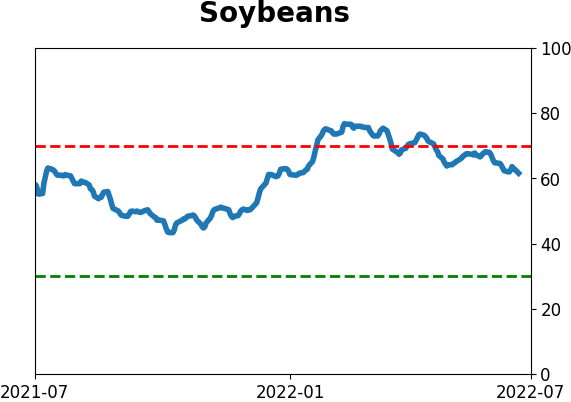
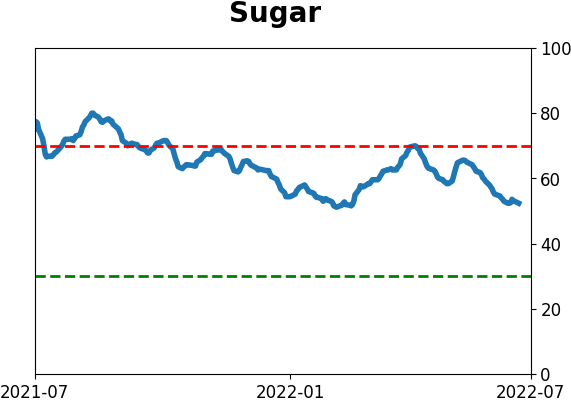
Commodity ETF's - 5-Day Moving Average
|
|