Headlines
|
|
With Yet Another Positive Month, A Historic Set of Precedents:
With another gain in June, the S&P 500 has recorded a historic streak of wins. It has notched impressive gains through June, bucking any kind of 'sell in May' reaction. Its year-to-date performance ranks among the best in history, which has preceded good long-term returns.
Bottom Line:
See the Outlook & Allocations page for more details on these summaries STOCKS: Hold
The speculative frenzy in February is wrung out. Internal dynamics have mostly held up, with some exceptions. Many of our studies still show a mixed to poor short-term view, with medium- and long-term ones turning more positive. BONDS: Hold
Various parts of the market got hit in March, with the lowest Bond Optimism Index we usually see during healthy environments. After a shaky couple of weeks, the broad bond market has modestly recovered. Not a big edge here either way. GOLD: Hold
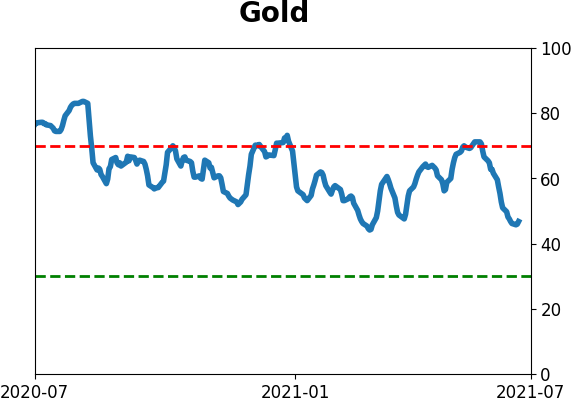
Gold and miners have done very well, recovering above long-term trend lines. The issue is that both have tended to perform poorly after similar situations - will have to wait and see how it plays out.
|
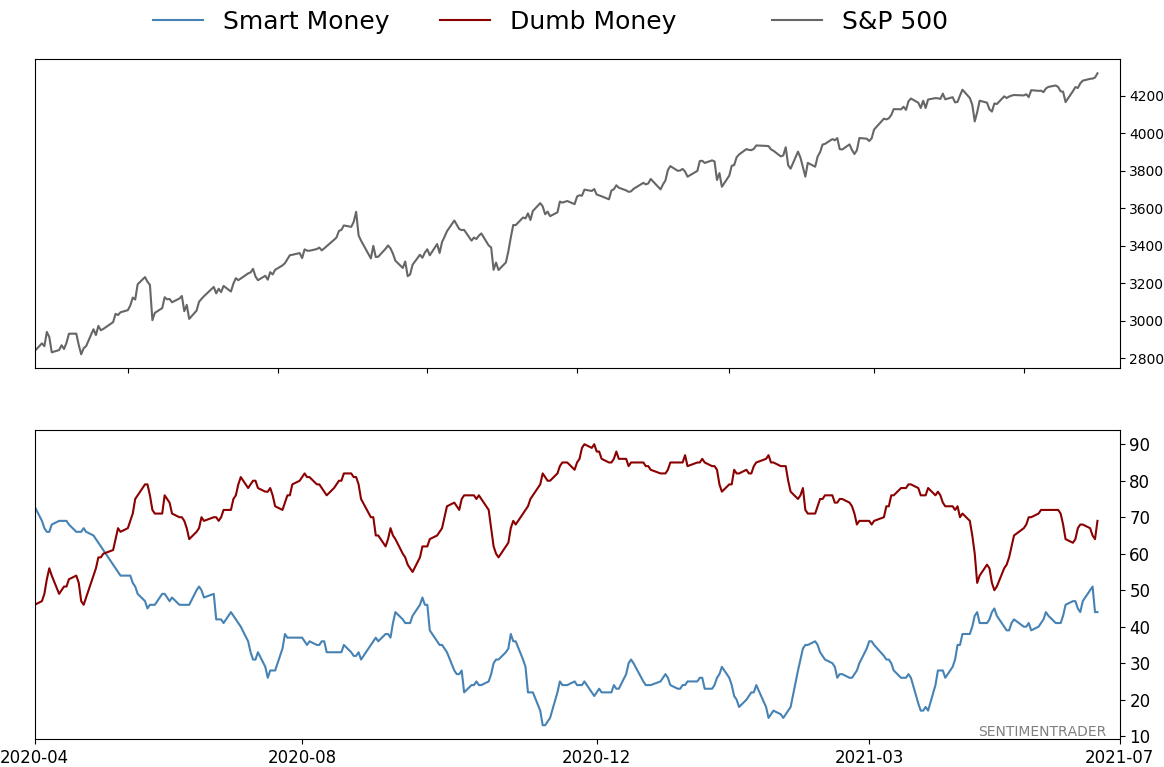
Smart / Dumb Money Confidence
|
Smart Money Confidence: 44%
Dumb Money Confidence: 69%
|
|
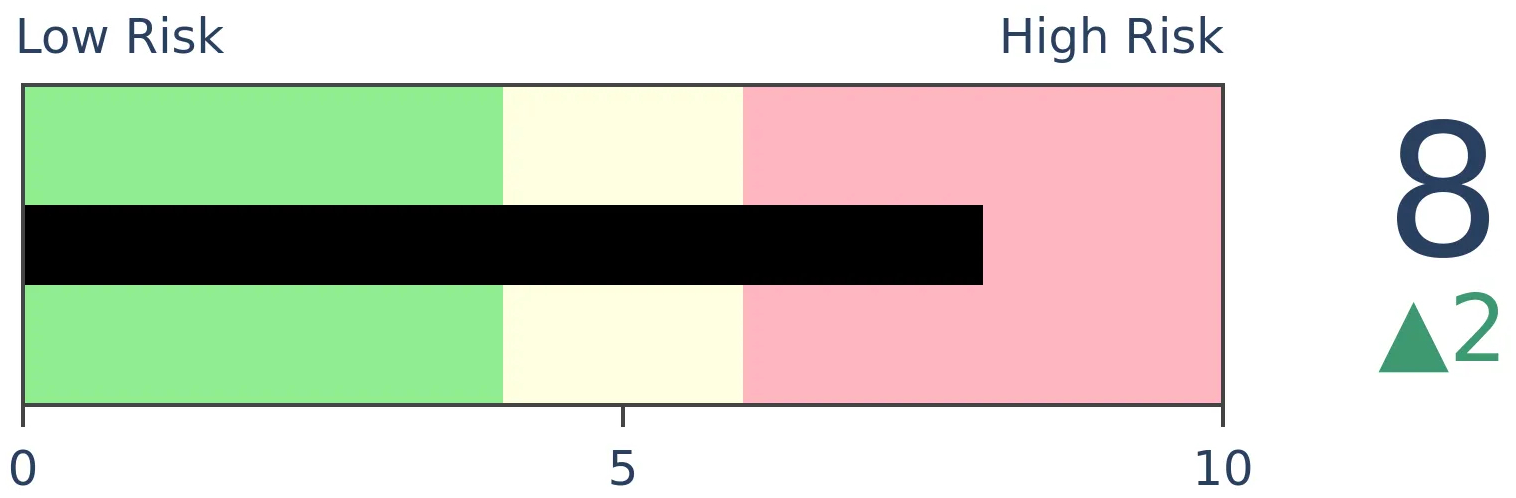
Risk Levels
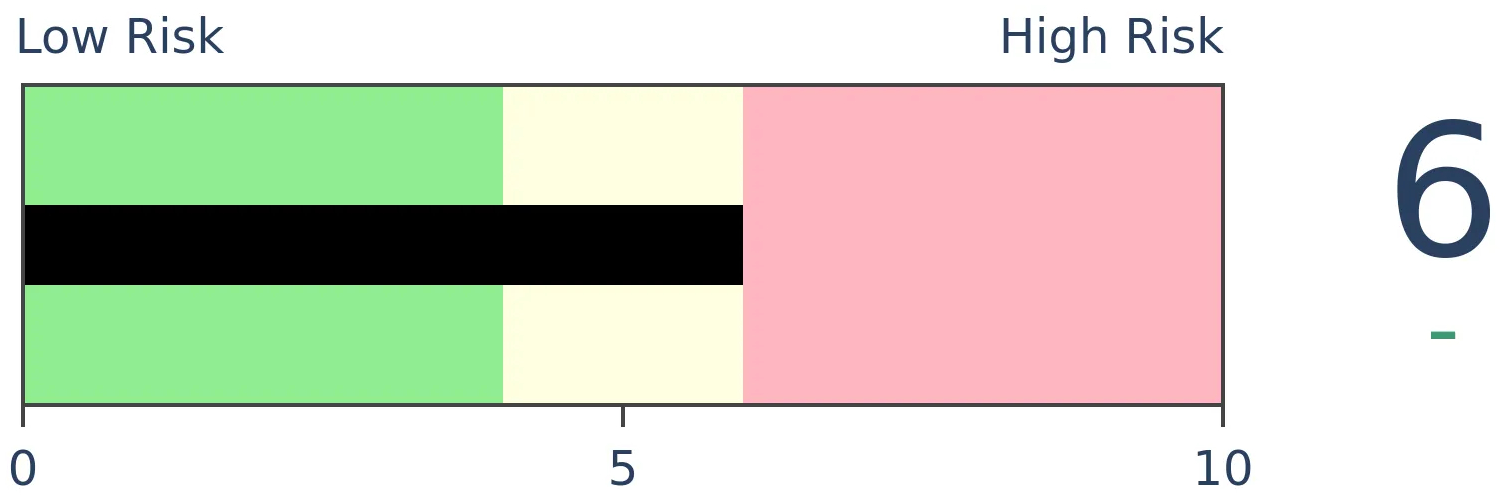
Stocks Short-Term
|
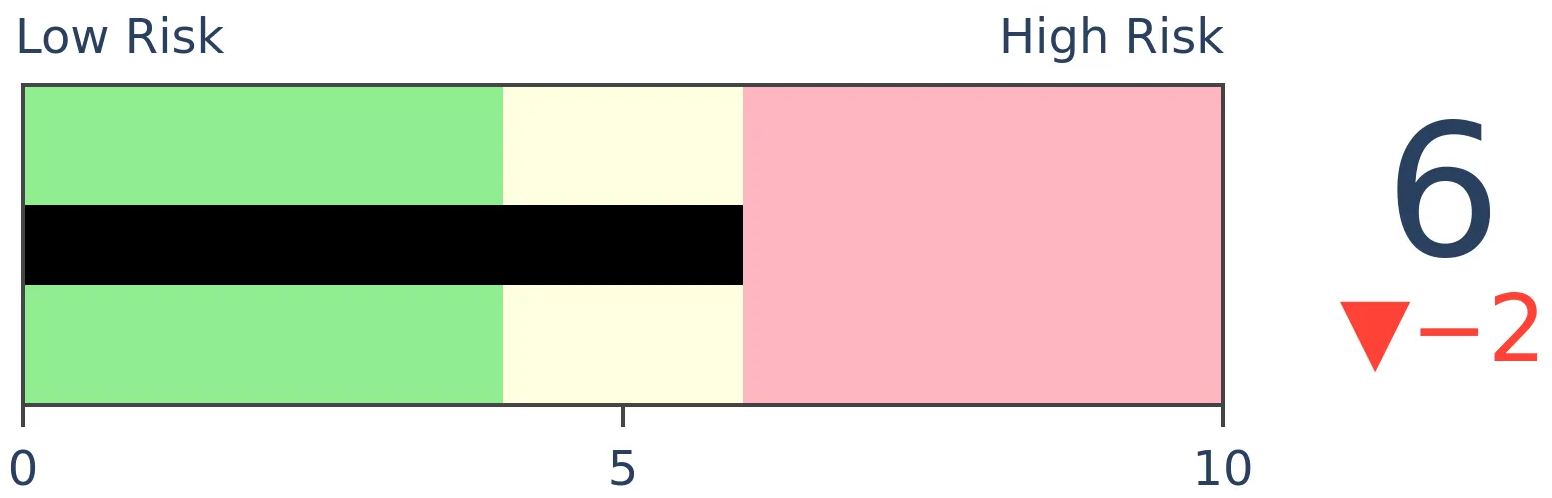
Stocks Medium-Term
|
|
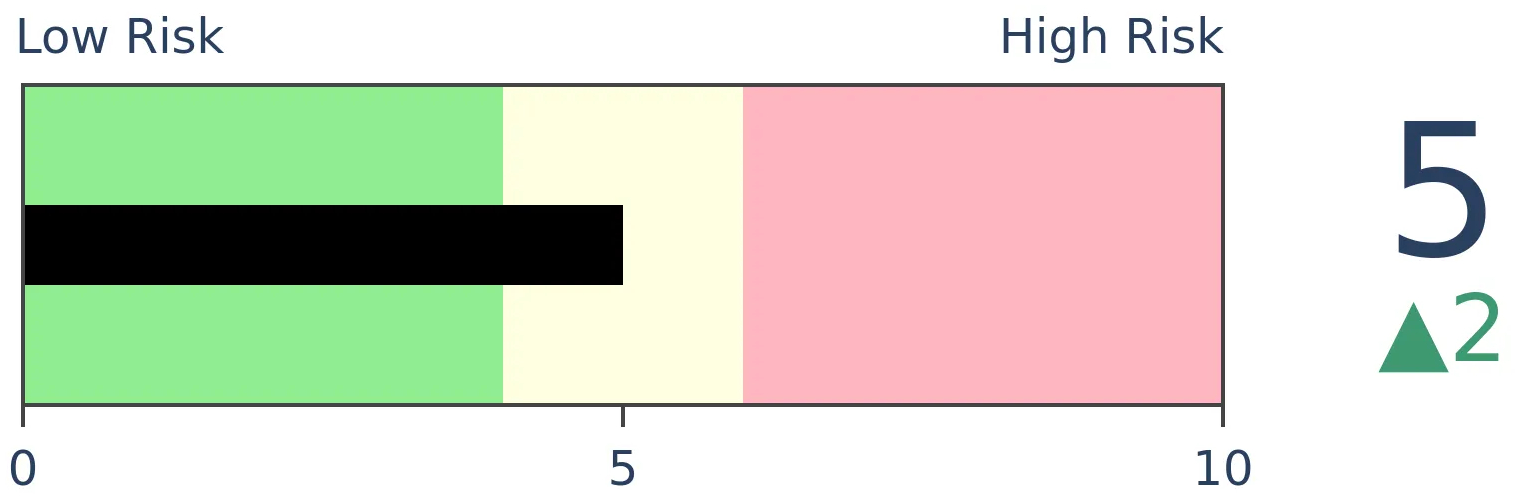
Bonds
|
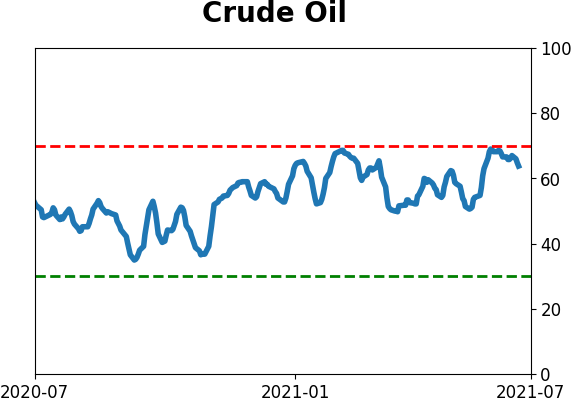
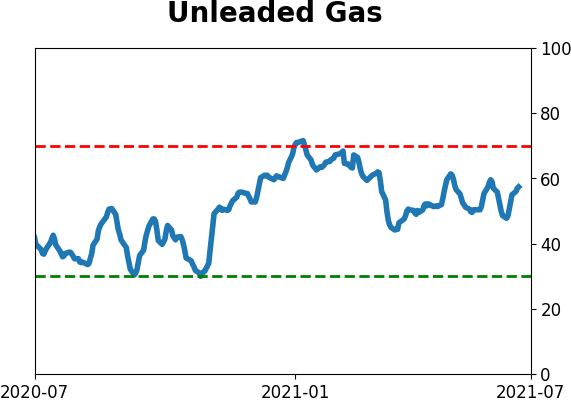
Crude Oil

|
|
Gold

|
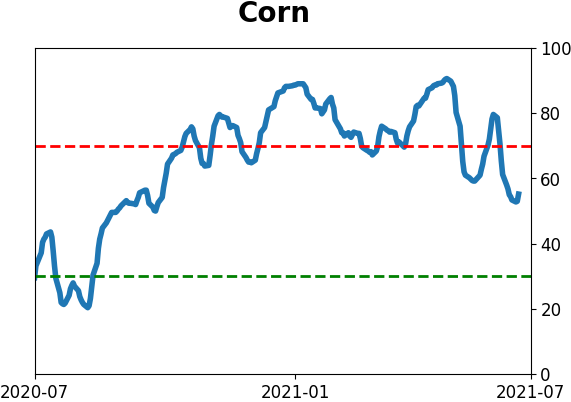
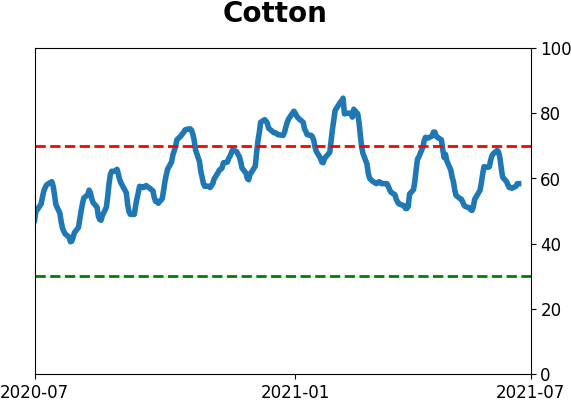
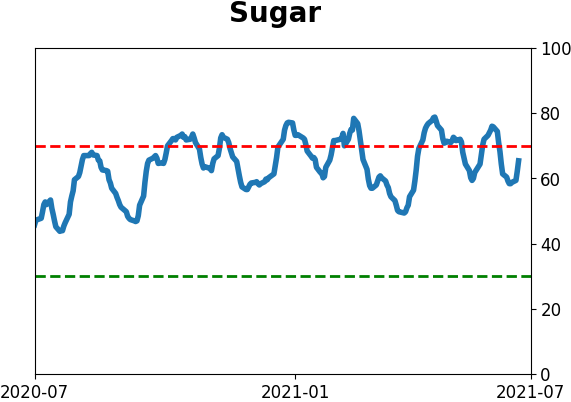
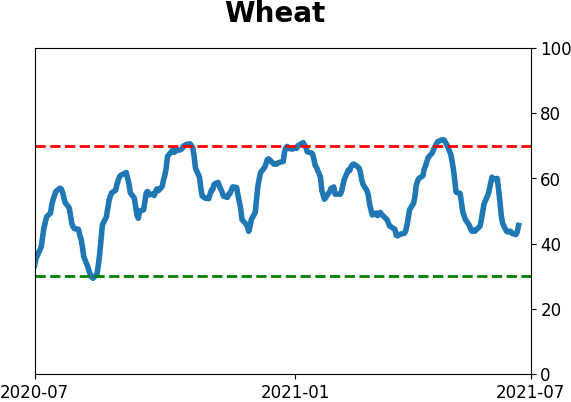
Agriculture
|
|
Research
BOTTOM LINE
With another gain in June, the S&P 500 has recorded a historic streak of wins. It has notched impressive gains through June, bucking any kind of 'sell in May' reaction. Its year-to-date performance ranks among the best in history, which has preceded good long-term returns.
FORECAST / TIMEFRAME
SPY -- Up, Long-Term
|
We saw on Tuesday that this has been one of the few times in history that both stocks and commodities have rallied so hard through this far into a year.
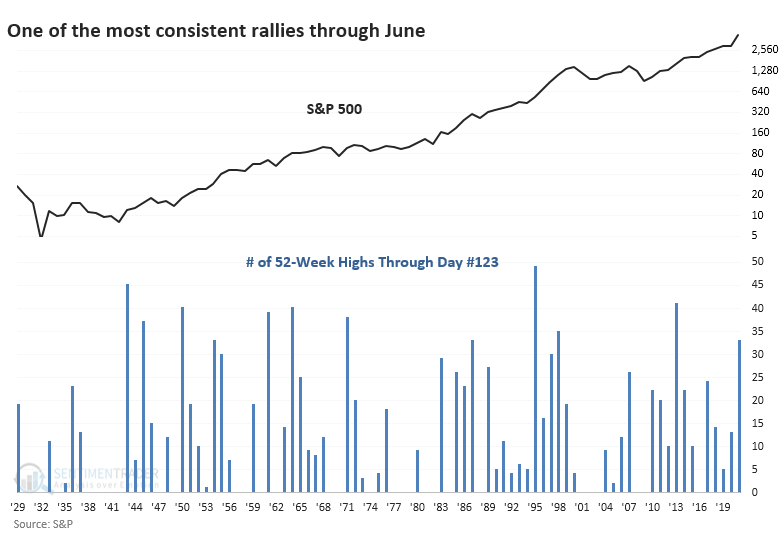
For stocks, in particular, it's been one of the best, most consistent, and most persistent rallies year-to-date in its history. Through the end of June, the S&P 500 has rallied more than 14%, ranking in the top 85% of all years since 1928.
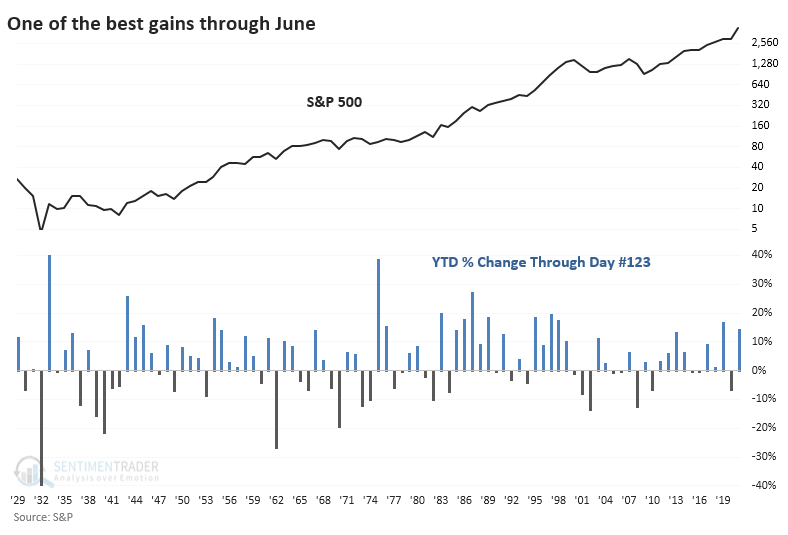
It's also been one of the most consistent years. The S&P has scored 34 record highs for the year already, ranking in the top 88% of all years.
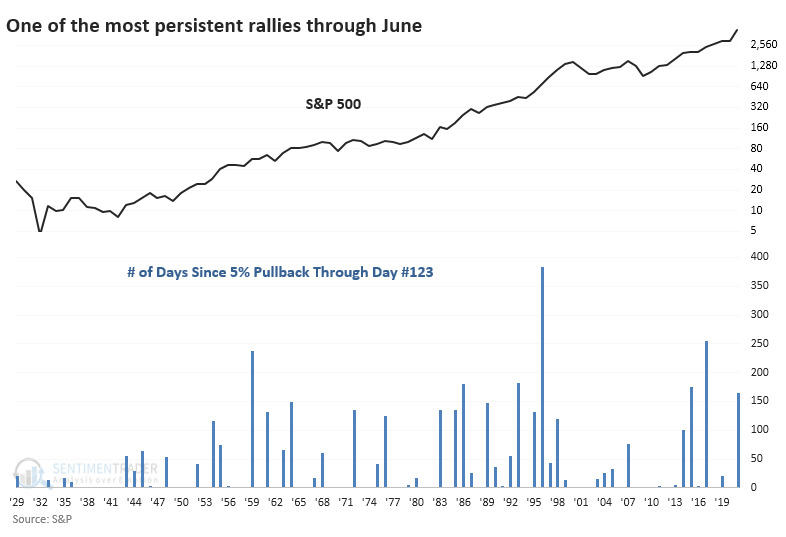
And it has been a very persistent rally. The S&P has now gone more than 150 sessions since the index was more than 5% off of its peak. That streak ranks in the top 93% of all years since 1928.
A DECENT LONG TERM SIGN
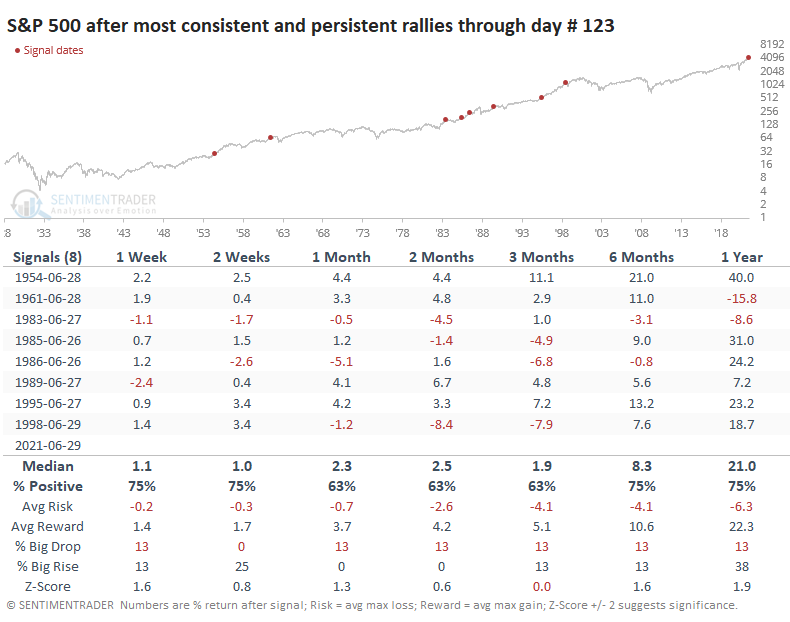
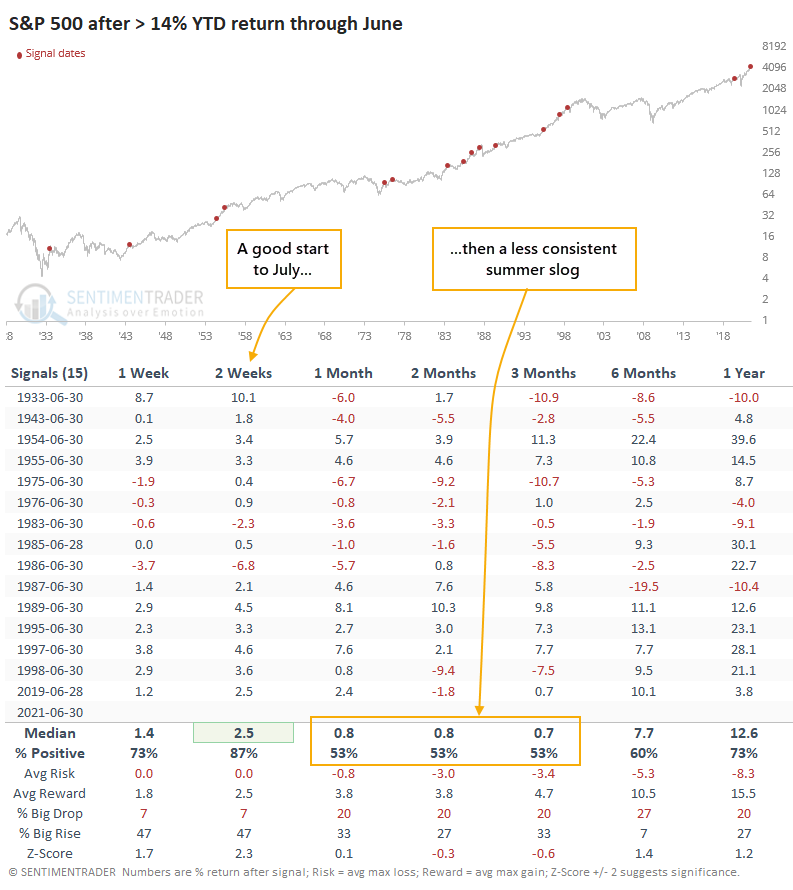
Momentum is a strong force and doesn't usually roll over easily. If we look at the strongest, most consistent, and most persistent years through June, this year ranks among the best.
The risk/reward was decent after the others. There were almost no large declines in the months ahead, but gains also tended to be limited. That's a combination of a lot of buying power potentially already used up, along with what has frequently been a summer soft spot.
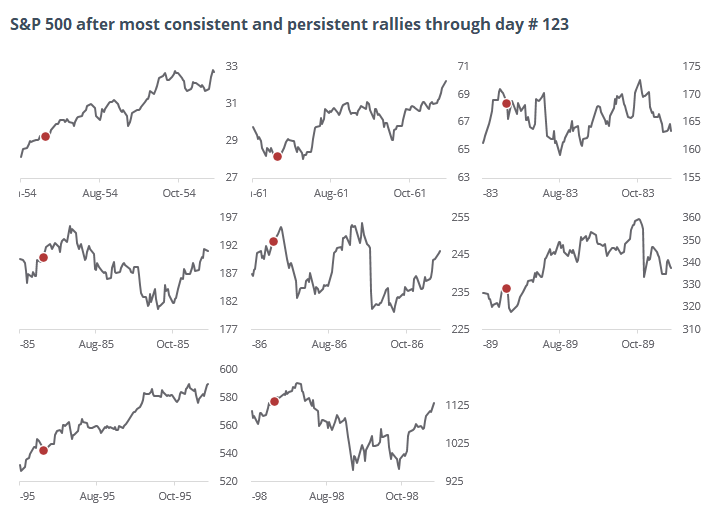
Looking more closely at those signals, we can see a lot of mixed trading activity. A couple of them (1954 and 1995) saw good gains in the months ahead without even much of a dip on any time frame. A couple of the others (1961 and 1989) saw a quick dip then decent gains. The other four had a tougher slog ahead.
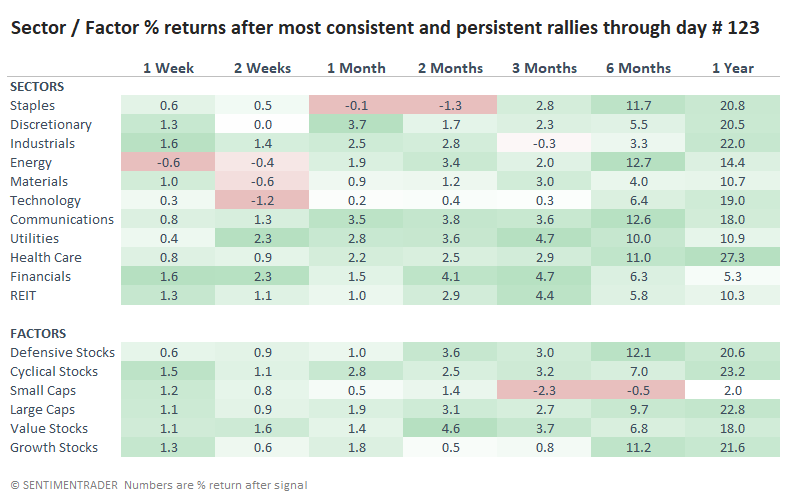
DEFENSIVE STOCKS HELD UP BEST
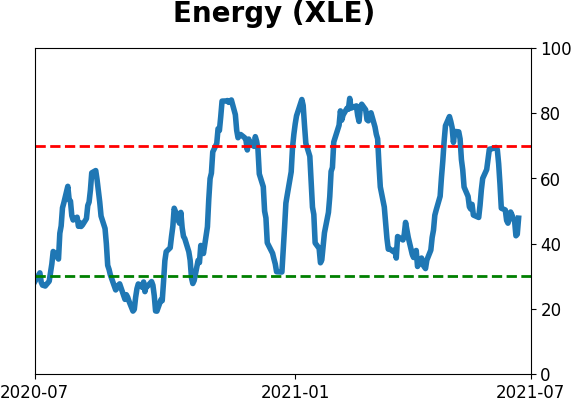
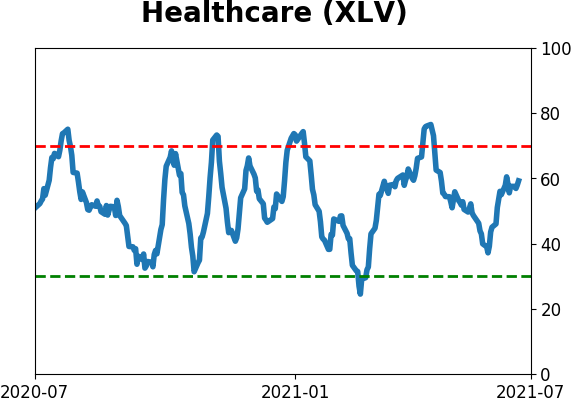
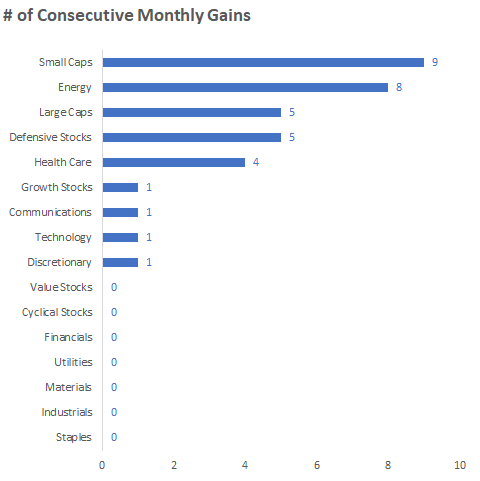
Among sectors, Energy showed the best gains through the end of the year, with other defensive sectors like Staples, Utilities, and Health Care also among the top. It's no surprise, then, that among factors, Defensive stocks showed the best gains, while it was tough sledding for Small-Caps.
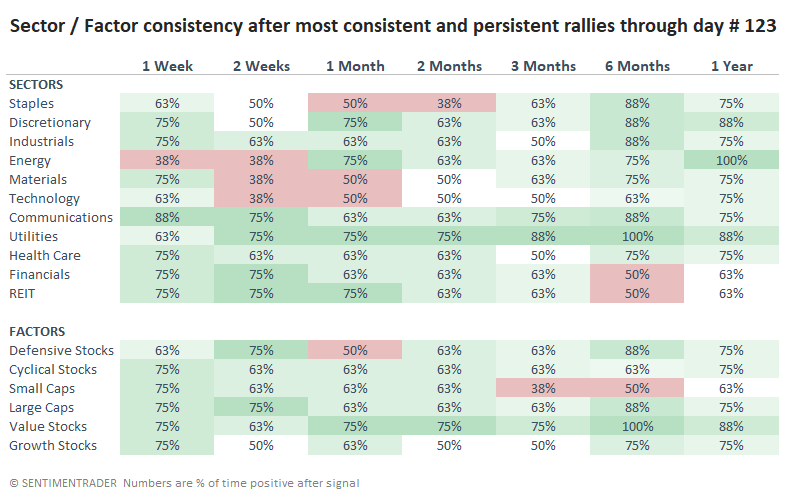
Looking at consistency among sectors and factors, Utilities and Value stocks both showed gains every time over the next six months, while Small-Caps were up only half the time.
MOMENTUM THROUGH THE SPRING
A couple of weeks ago, Jay outlined what was at stake in June. Namely, if the S&P 500 managed to close above 4204, it would trigger all kinds of positive seasonal momentum. And indeed it did.
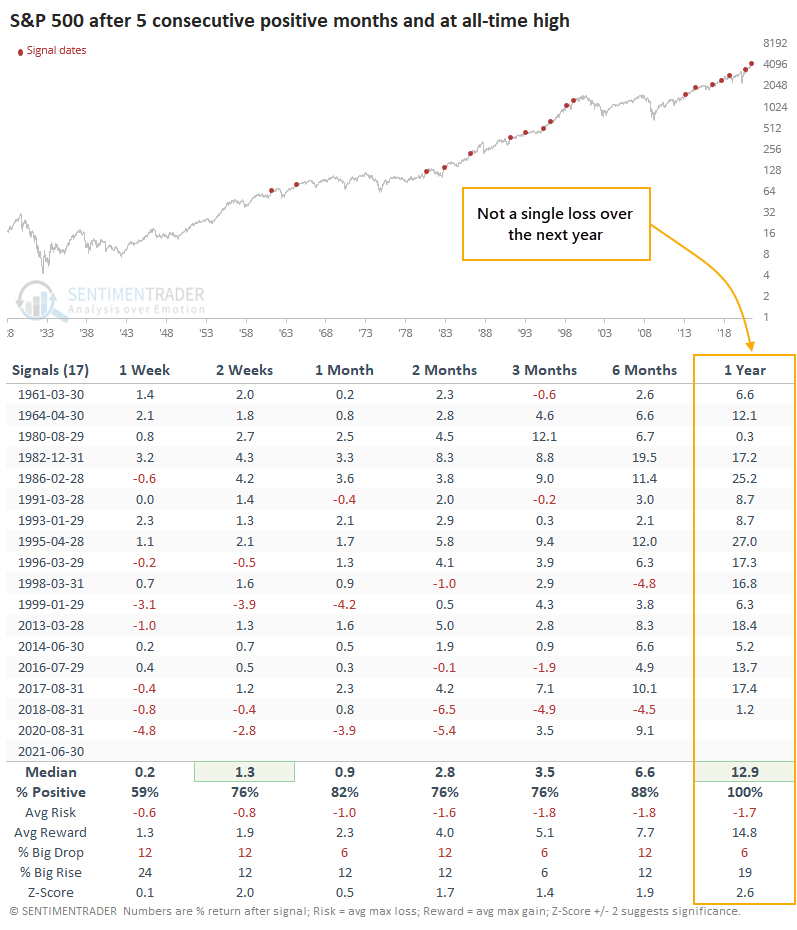
Building on what he pointed out, the S&P closed higher for its 5th consecutive month. It also notched an all-time high. Out of the 17 other times the index did this, it never suffered a loss a year later.
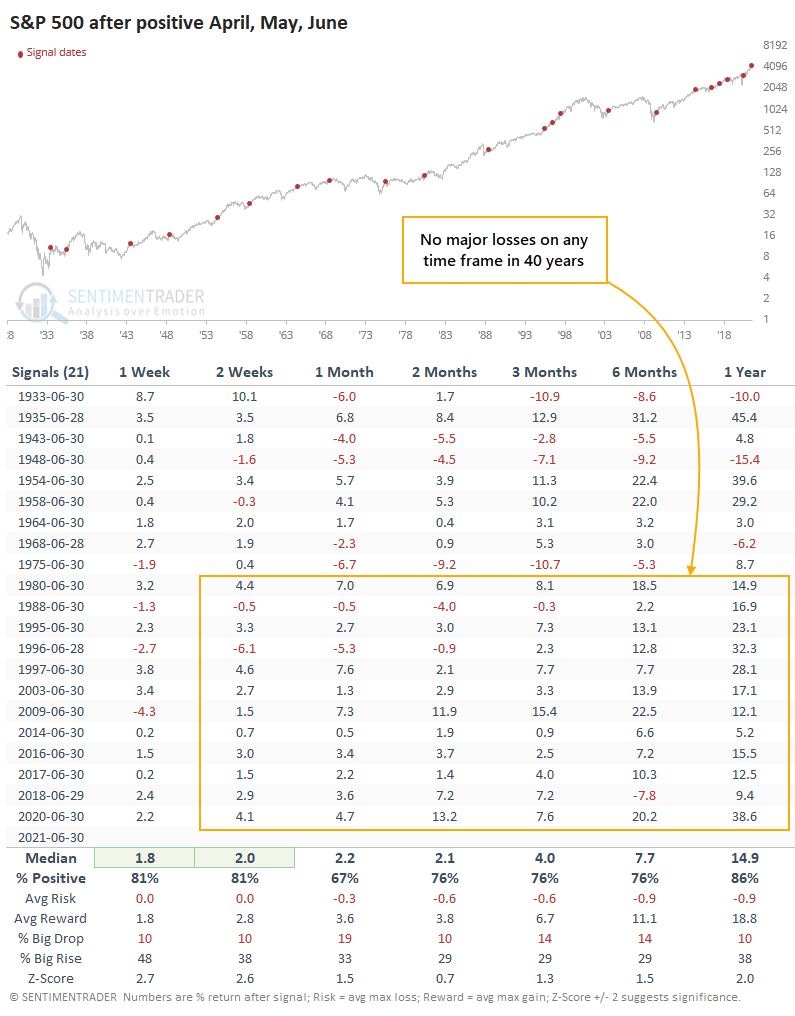
It avoided any "sell in May" reaction from a seasonal perspective and showed a monthly gain for each month in Q2. Over the past 40 years, that preceded gains, or sporadic, small losses, across all time frames.
The good quarter added to a good first quarter, allowing the S&P to gain more than 14% through June. The first couple weeks of July showed a gain after 13 out of 15 years, then there were less consistent gains during the peak of the summer, and average returns were mediocre.
Much of what we've seen pop up lately has suggested another bout of higher risk, with headwinds because of breadth divergences and seasonality starting after the first part of July.
Momentum in the indexes has been remarkable, rolling over every potential negative for months now. It's gone far beyond most (any?) historical precedent, with the most common excuse being an unprecedented fiscal and monetary stimulus. Whatever the reason, momentum is winning and shows no signs of stopping, at least for a passive index investor. Under the surface, there's a lot more tumult.
Given the above, it does seem more likely that momentum could carry even further through the first part of July. If that does come to pass, and we continue to see many stocks struggle under the surface, it should only add to the rising pile of divergence signals, raising the risk for July - September.
BEST STREAKS AMONG SECTORS AND FACTORS
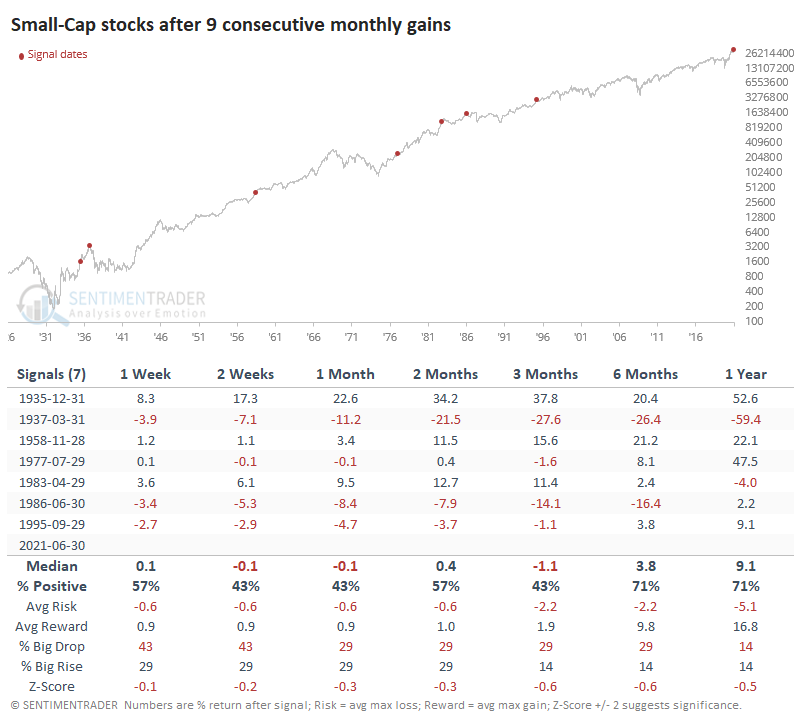
Driving the streaks of monthly gains, Small-Caps and Energy rank as the best. Both are enjoying winning streaks rarely matched since at least 1926.
For both, it was a mixed blessing. In 1935 and 1958, Small-Caps managed to keep tacking on more gains in the months ahead. Other than those, returns moderated as the stocks took a breather.
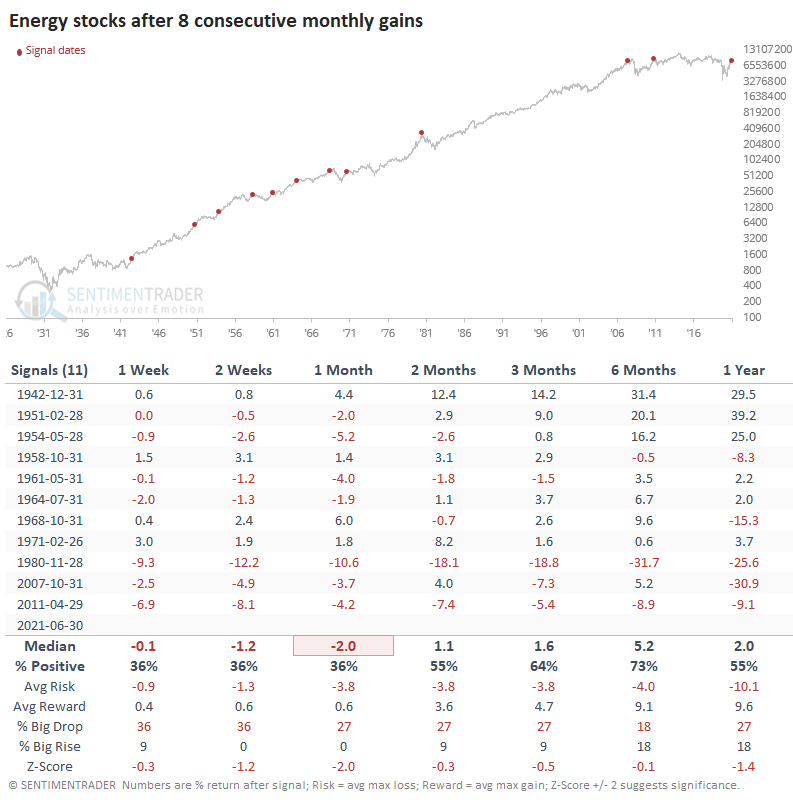
For Energy stocks, there was an even more consistent tendency to see the gains moderate, especially over the following month. On the positive side, the sector enjoyed gains over the next six months after 8 of the 11 precedents, with one of those losses being very small.
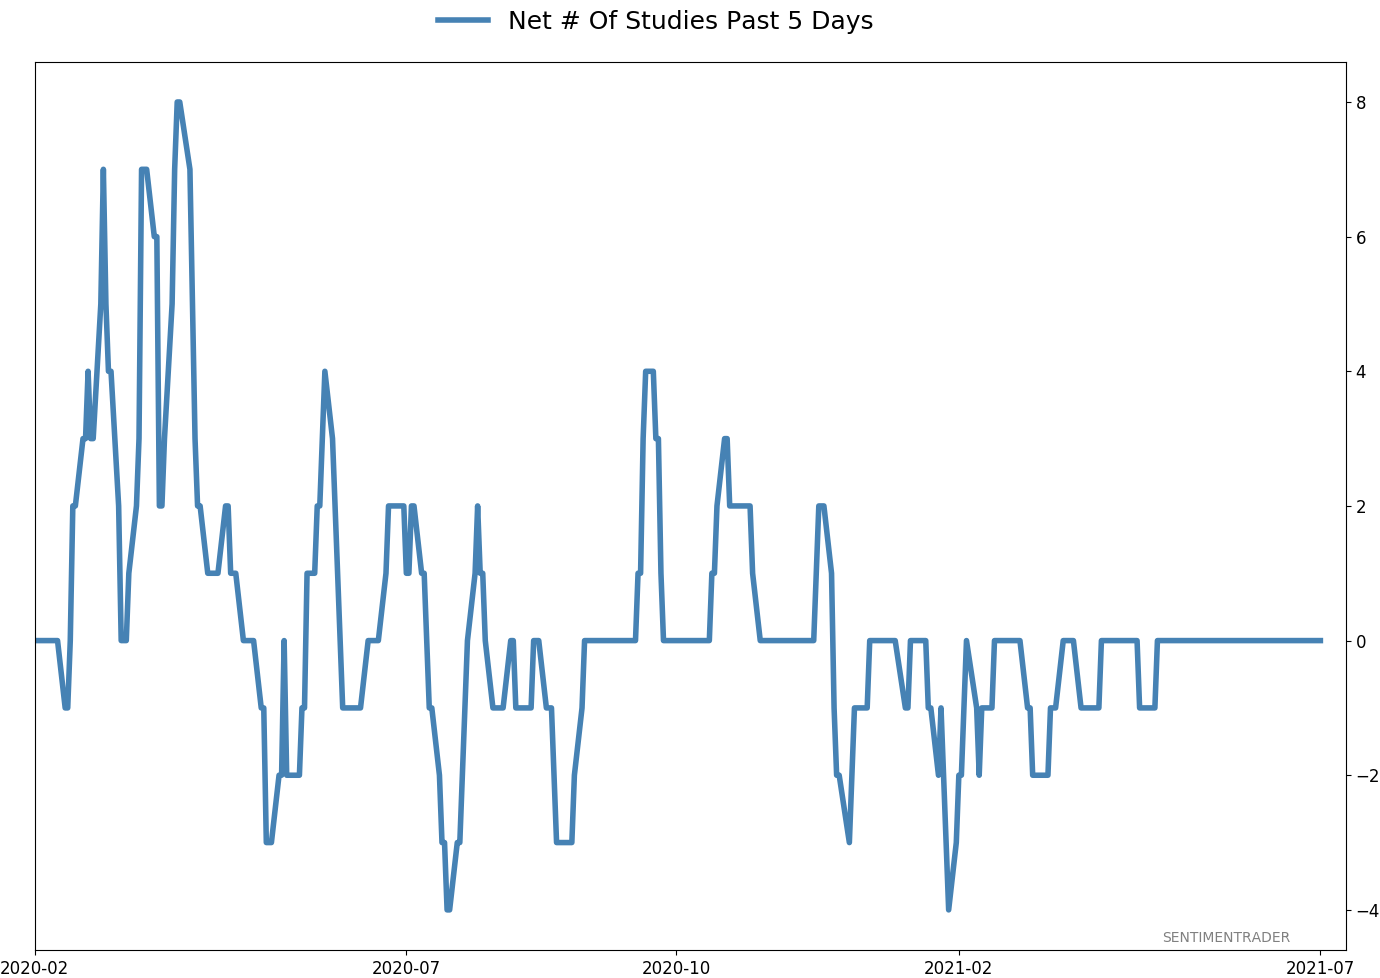
Active Studies
| Time Frame | Bullish | Bearish | | Short-Term | 0 | 1 | | Medium-Term | 2 | 2 | | Long-Term | 9 | 5 |
|
Indicators at Extremes
Portfolio
| Position | Description | Weight % | Added / Reduced | Date | | Stocks | RSP | 4.1 | Added 4.1% | 2021-05-19 | | Bonds | 23.9% BND, 6.9% SCHP | 30.7 | Reduced 7.1% | 2021-05-19 | | Commodities | GCC | 2.6 | Reduced 2.1%
| 2020-09-04 | | Precious Metals | GDX | 5.6 | Reduced 4.2% | 2021-05-19 | | Special Situations | 4.3% XLE, 2.2% PSCE | 7.6 | Reduced 5.6% | 2021-04-22 | | Cash | | 49.4 | | |
|
Updates (Changes made today are underlined)
Much of our momentum and trend work has remained positive for several months, with some scattered exceptions. Almost all sentiment-related work has shown a poor risk/reward ratio for stocks, especially as speculation drove to record highs in exuberance in February. Much of that has worn off, and most of our models are back toward neutral levels. There isn't much to be excited about here. The same goes for bonds and even gold. Gold has been performing well lately and is back above long-term trend lines. The issue is that it has a poor record of holding onto gains when attempting a long-term trend change like this, so we'll take a wait-and-see approach. RETURN YTD: 9.5% 2020: 8.1%, 2019: 12.6%, 2018: 0.6%, 2017: 3.8%, 2016: 17.1%, 2015: 9.2%, 2014: 14.5%, 2013: 2.2%, 2012: 10.8%, 2011: 16.5%, 2010: 15.3%, 2009: 23.9%, 2008: 16.2%, 2007: 7.8%
|
|
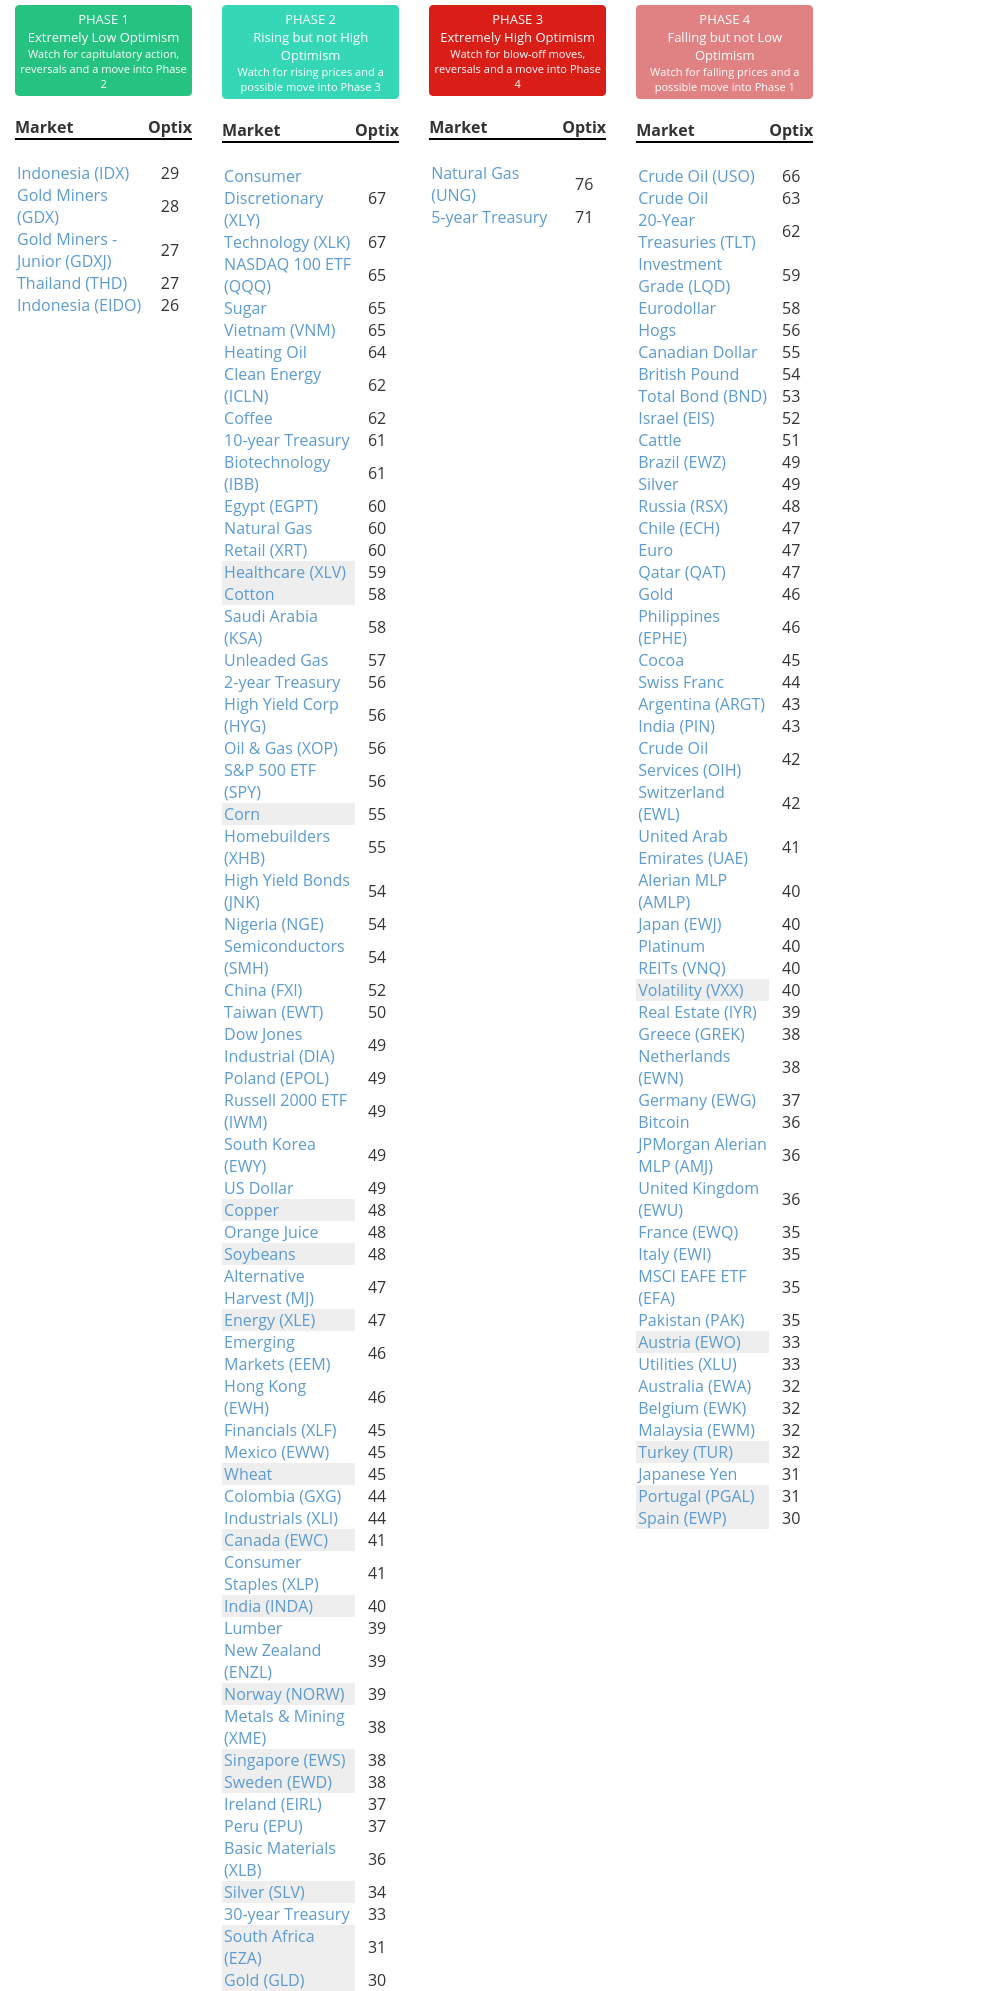
Phase Table
Ranks
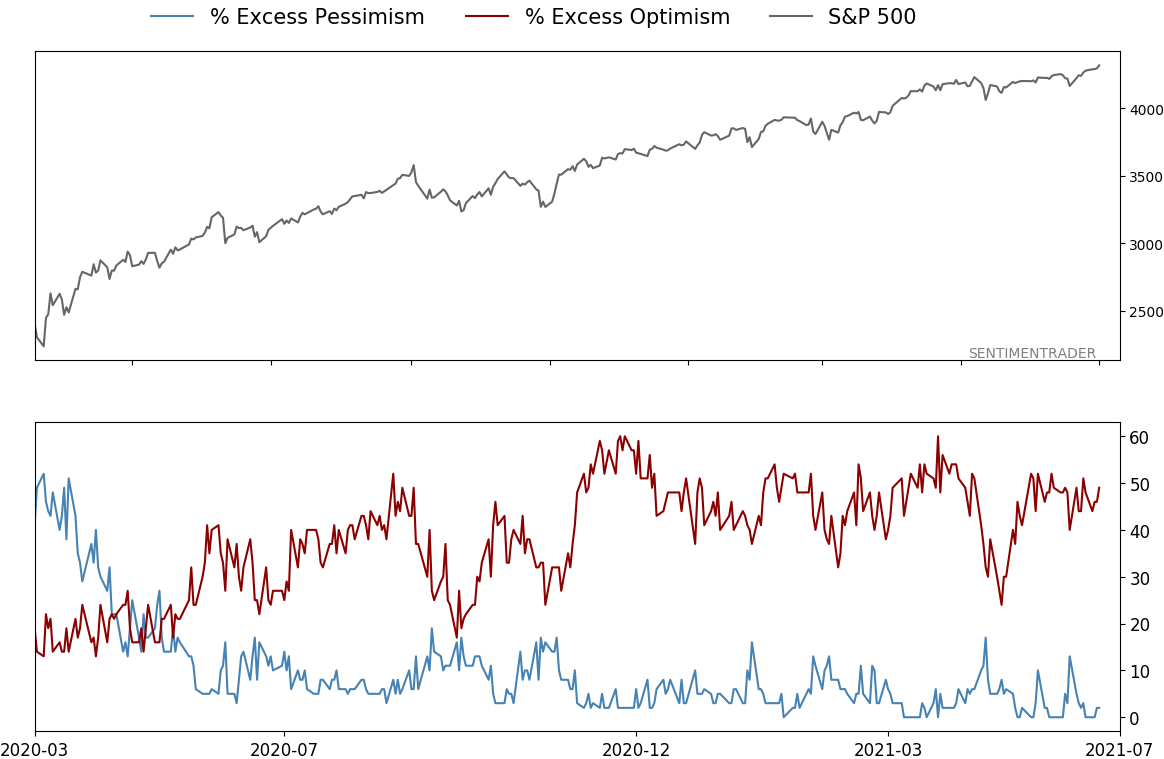
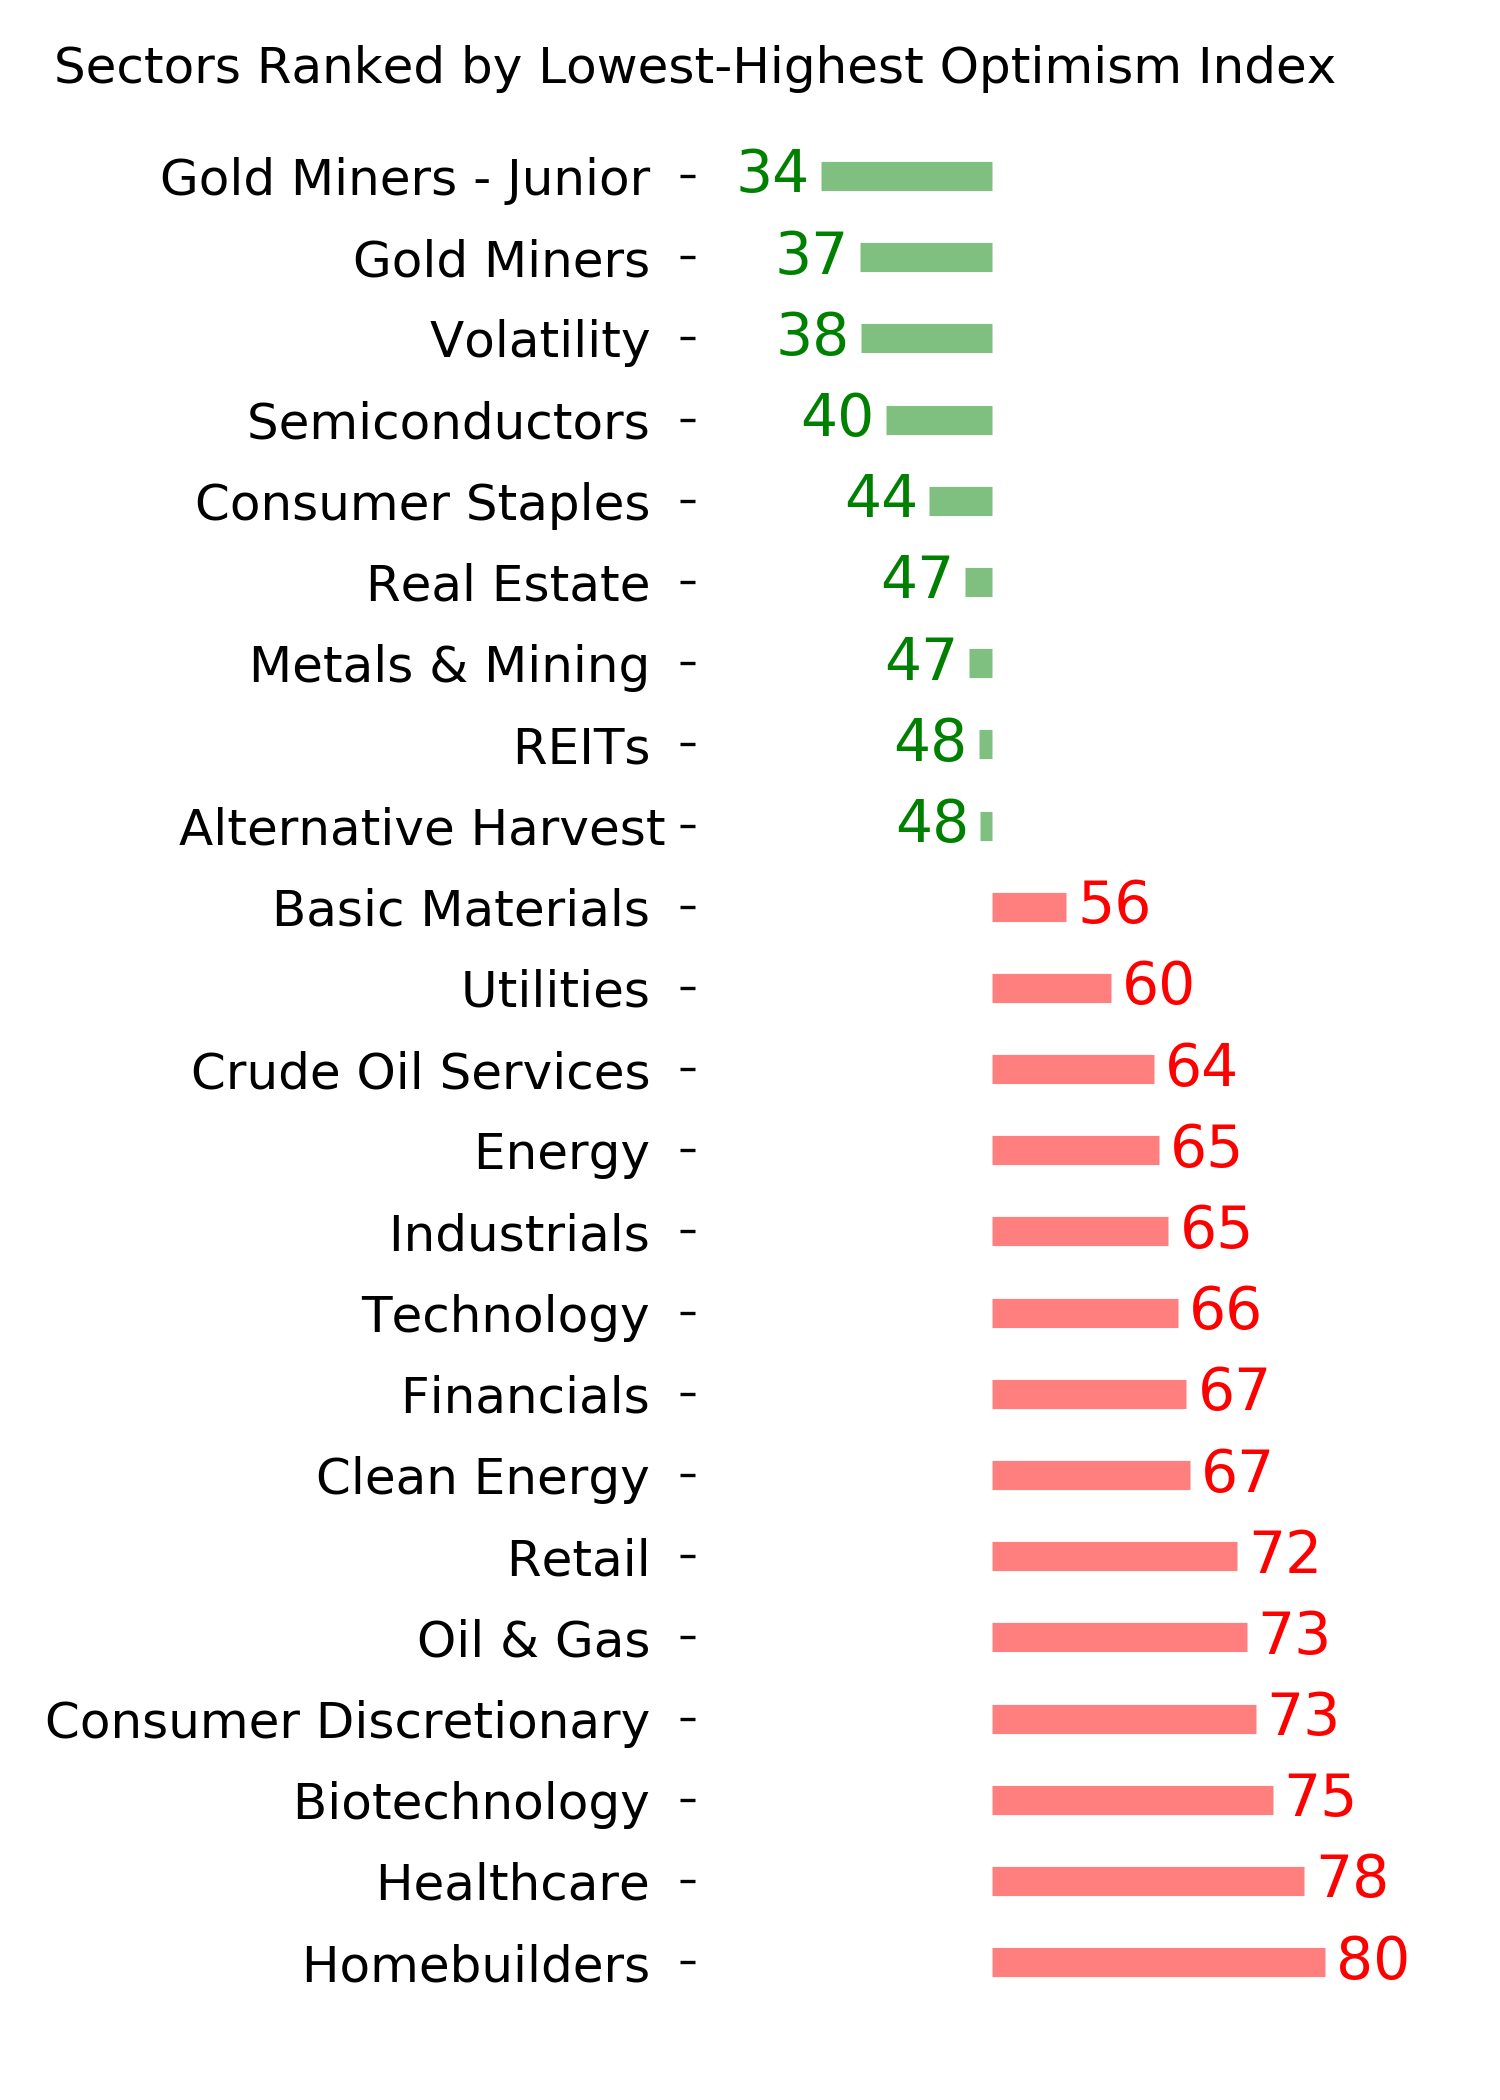
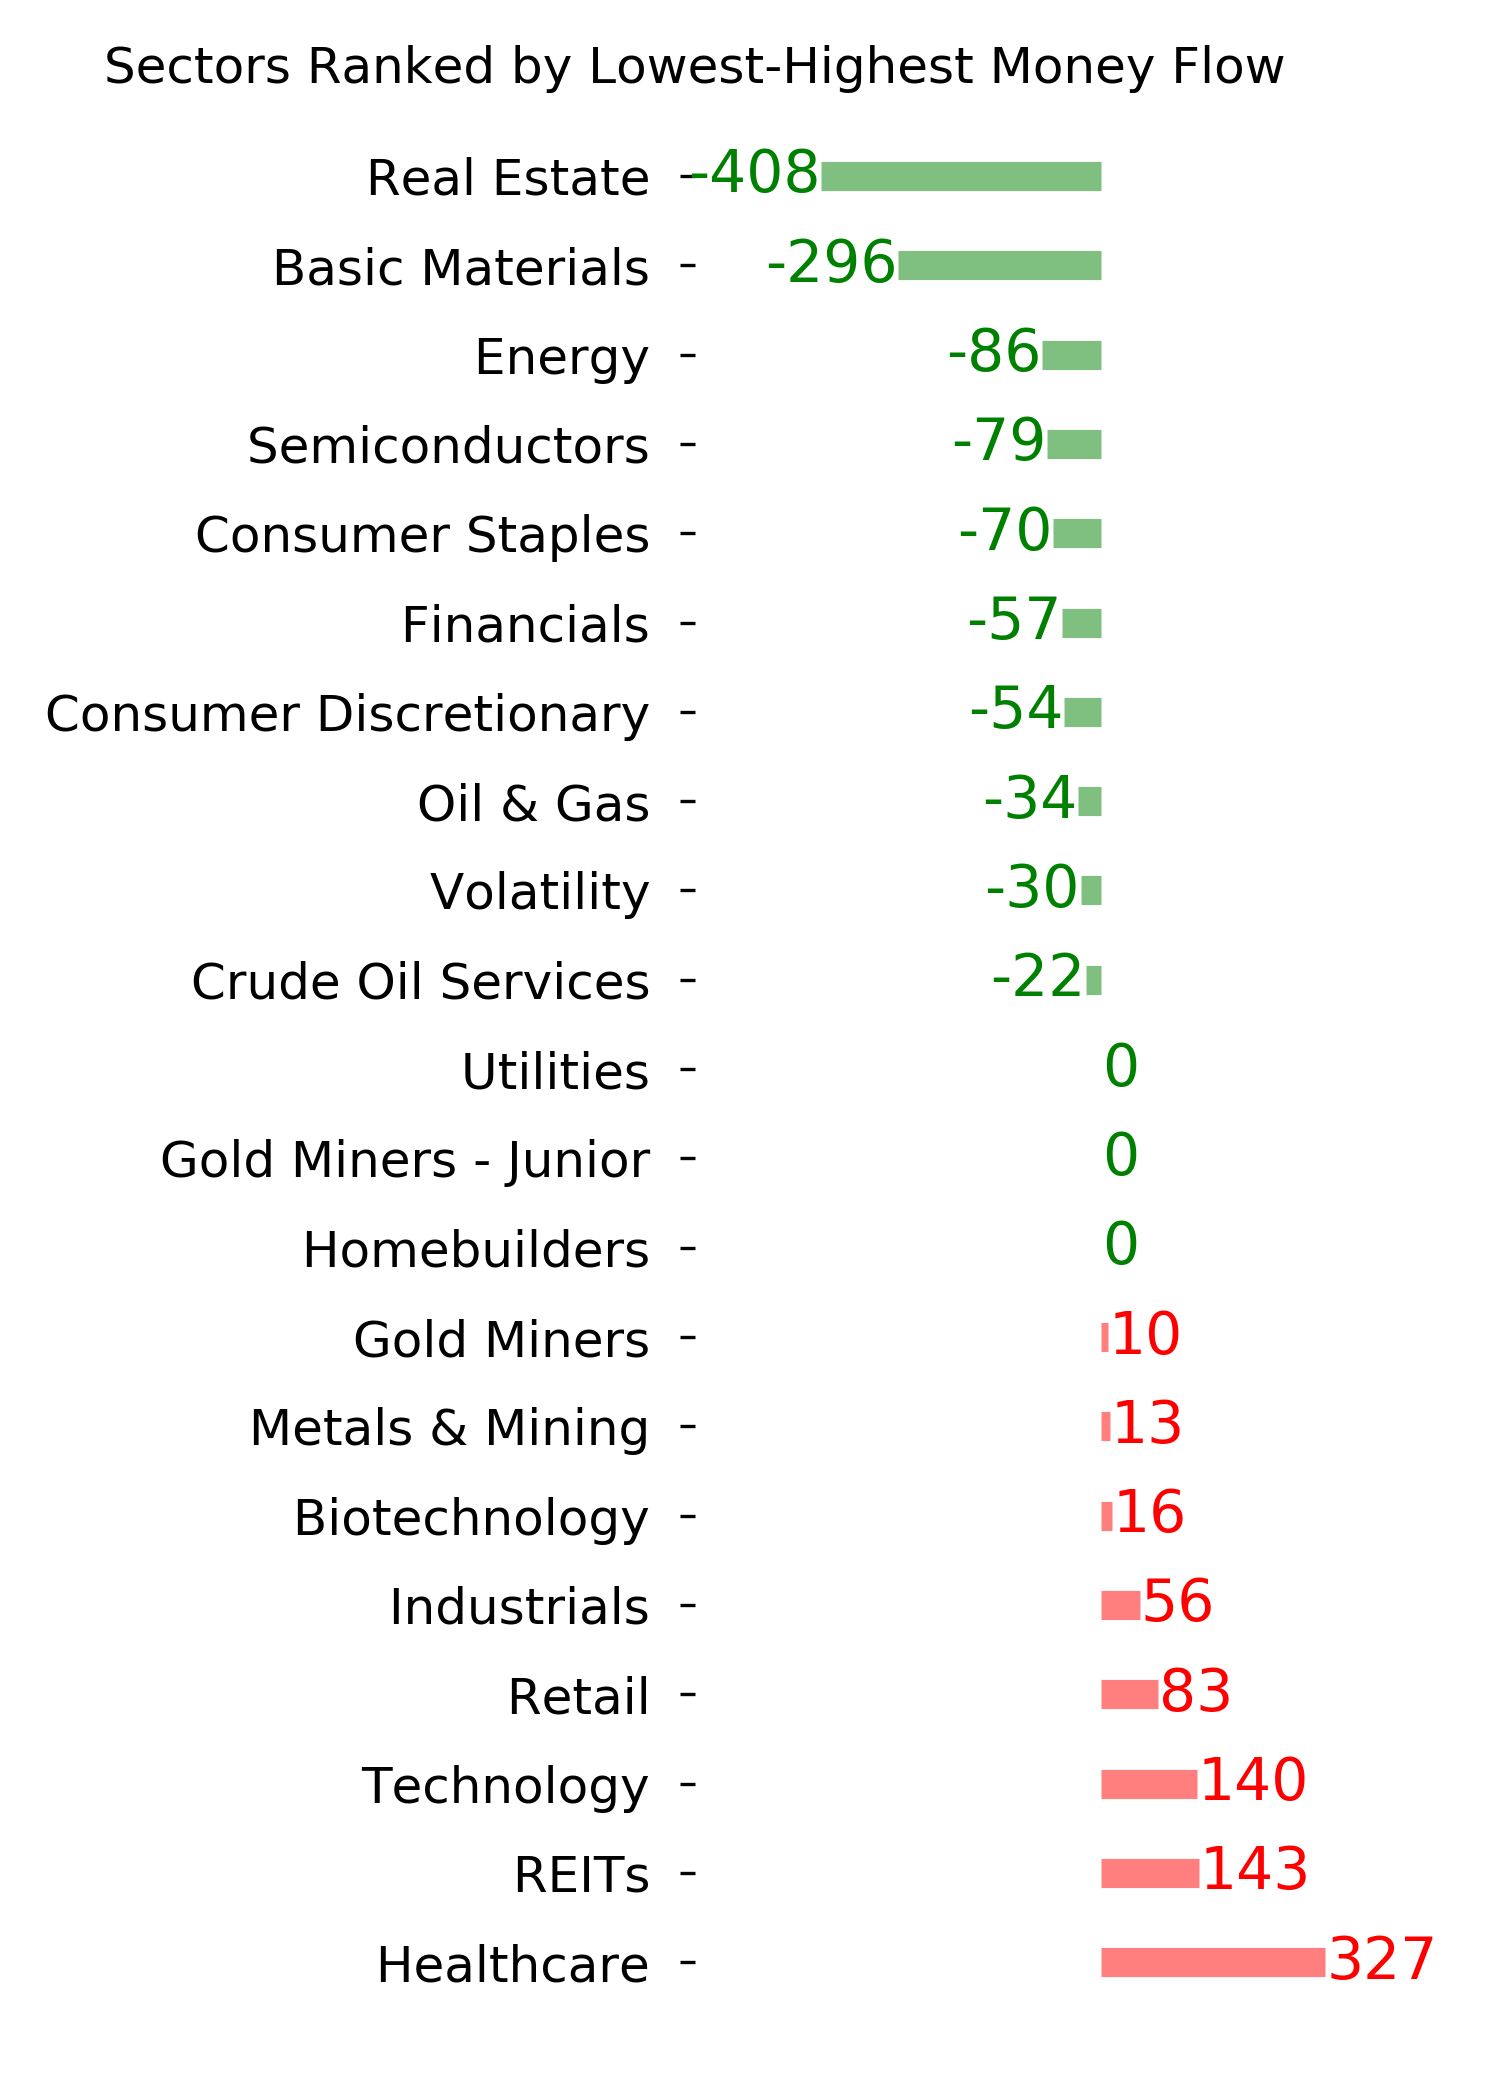
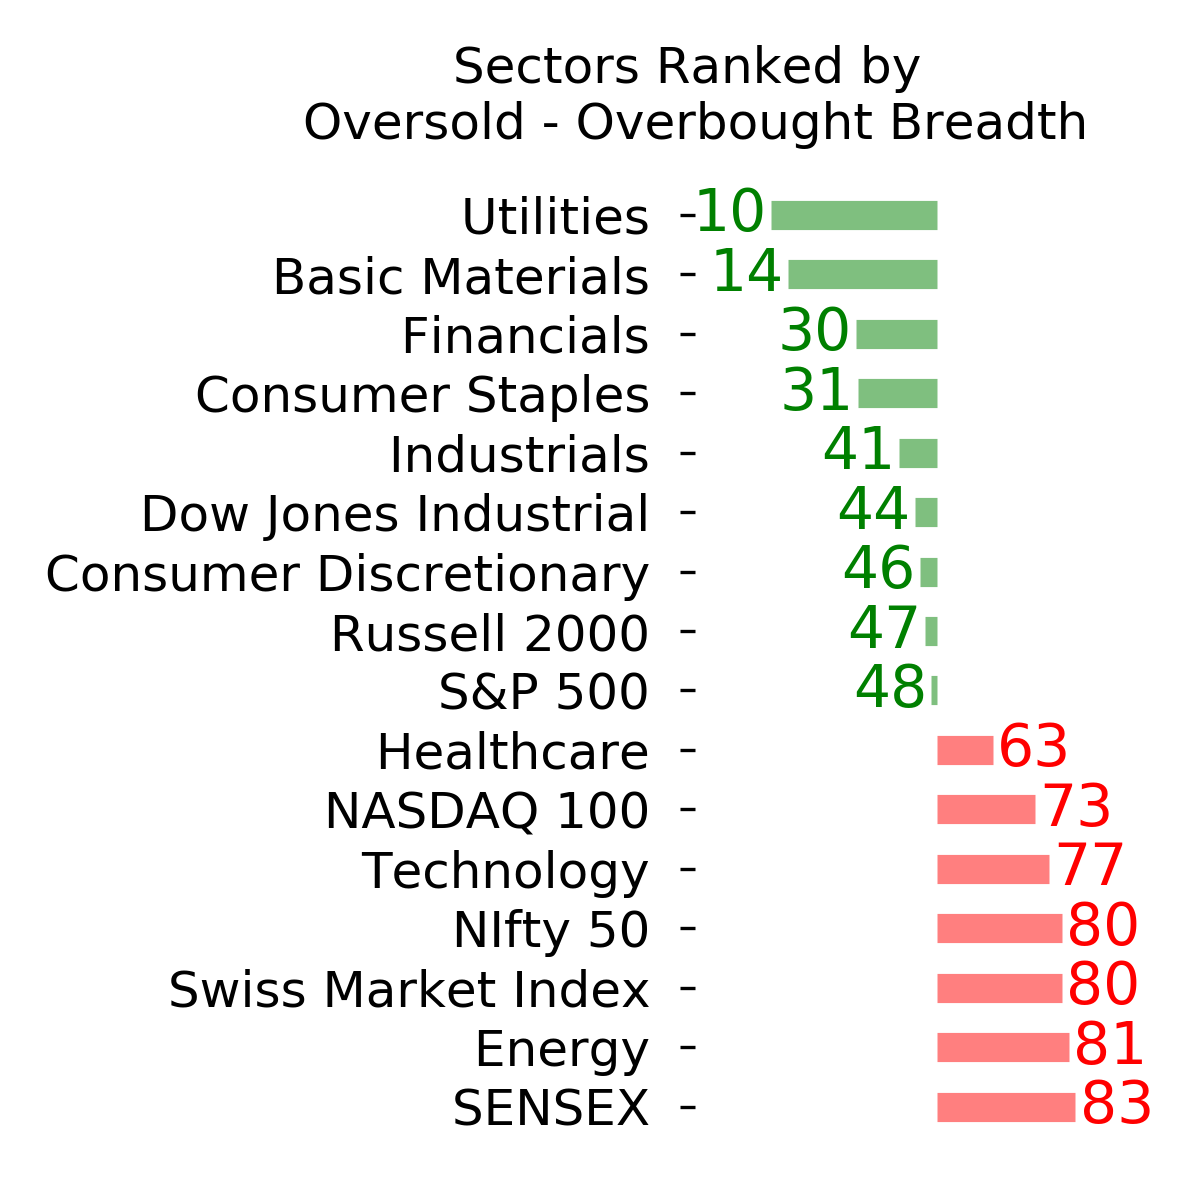
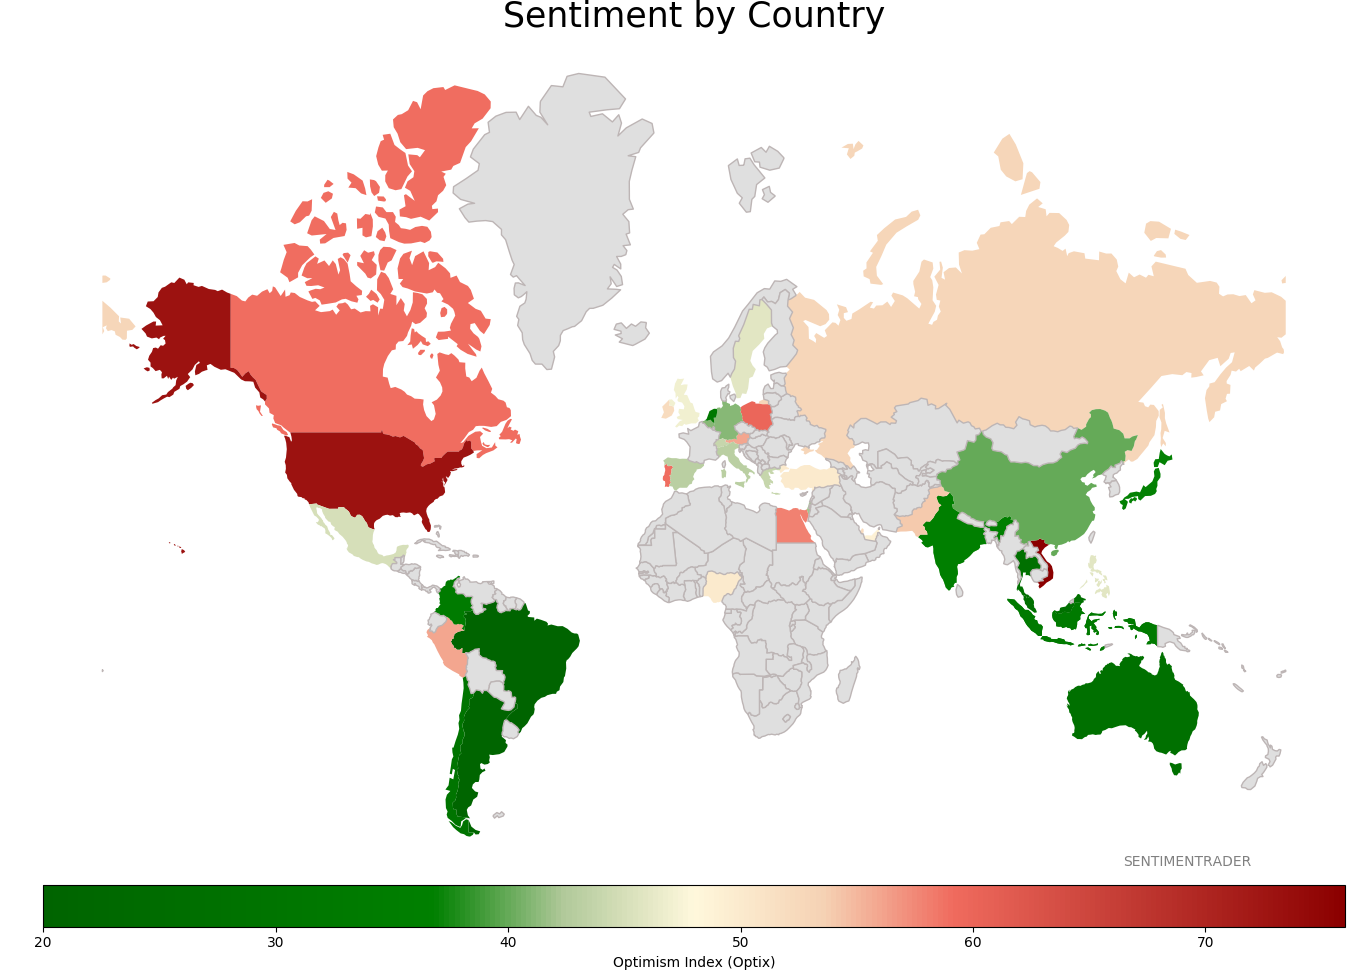
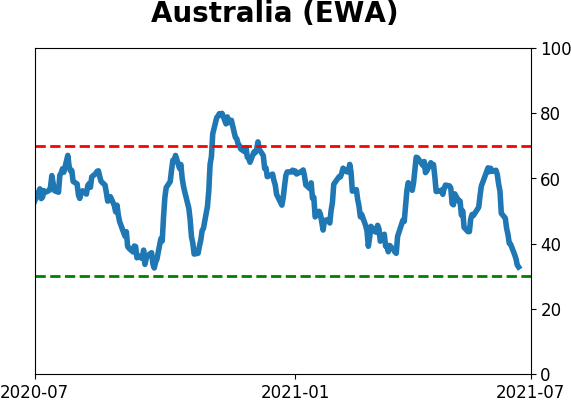
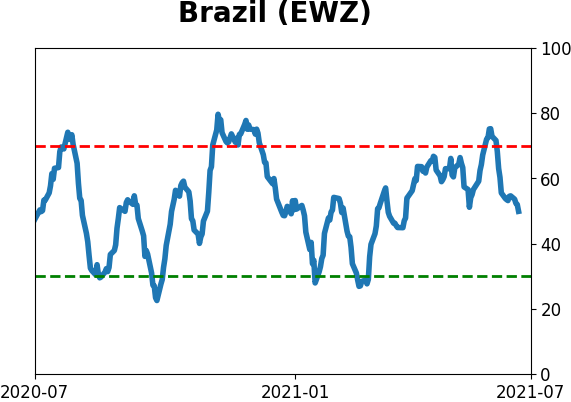
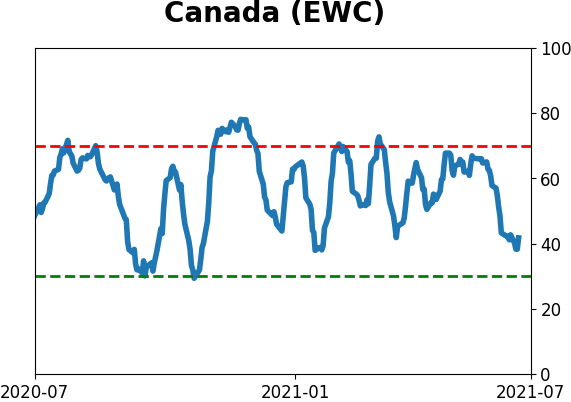
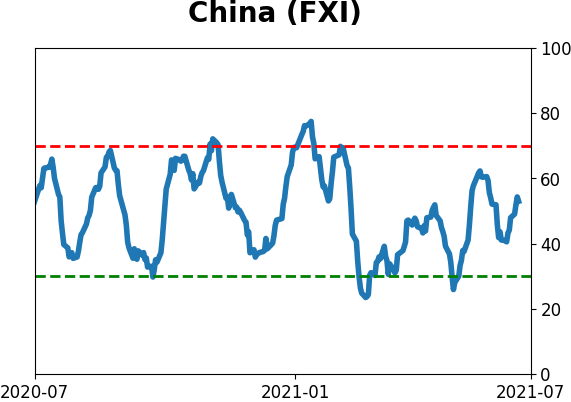
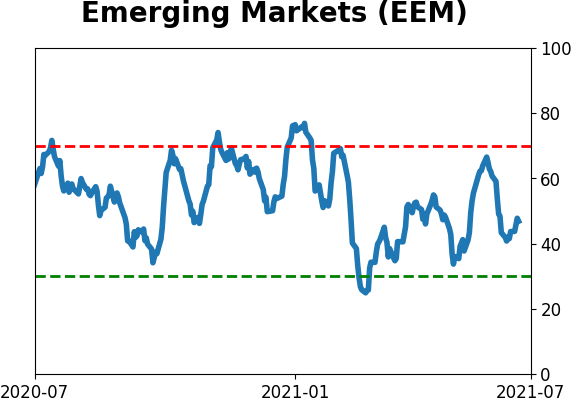
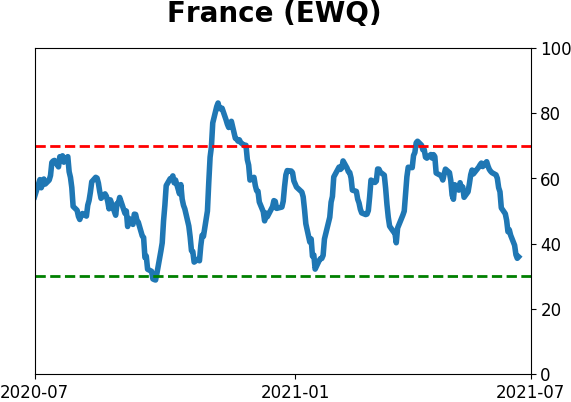
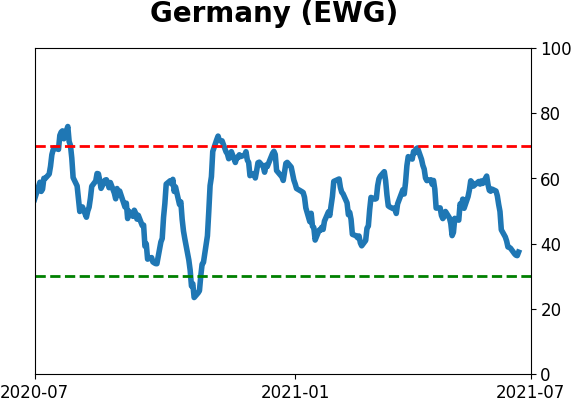
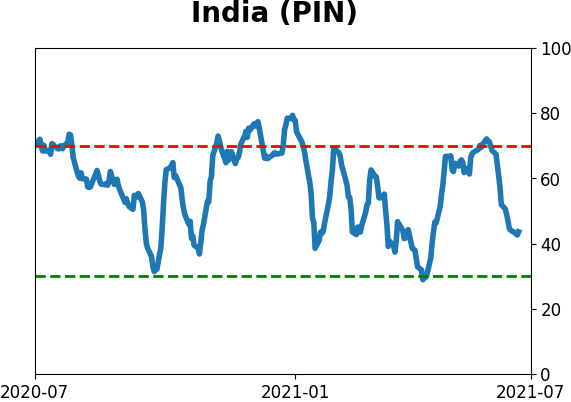
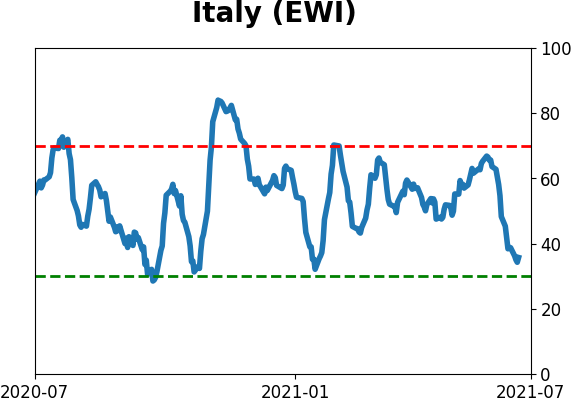
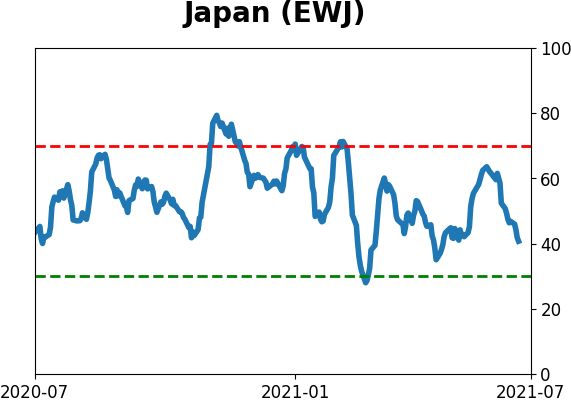
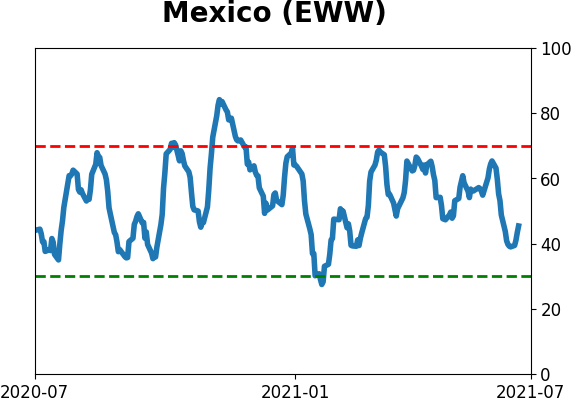
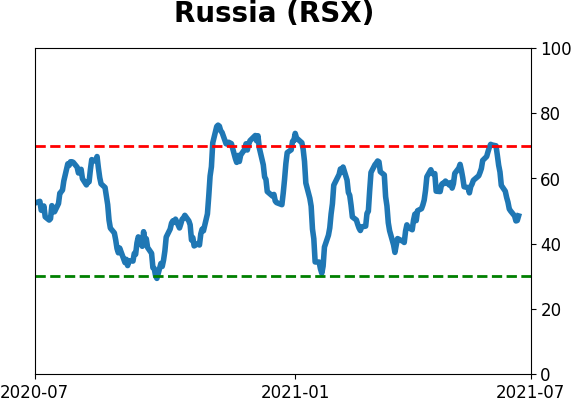
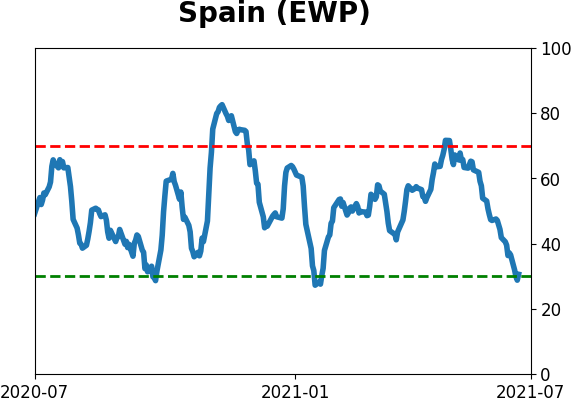
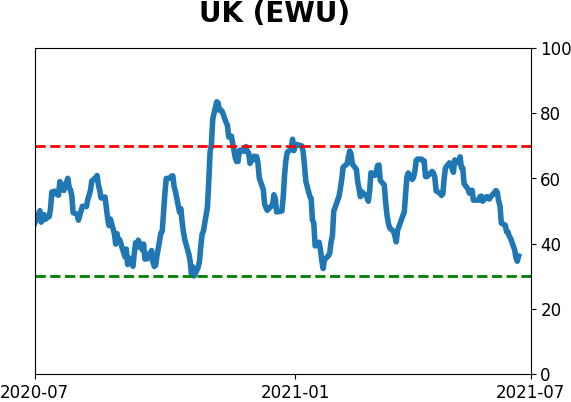
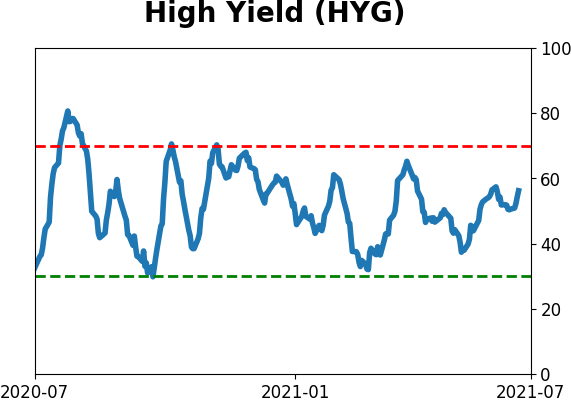
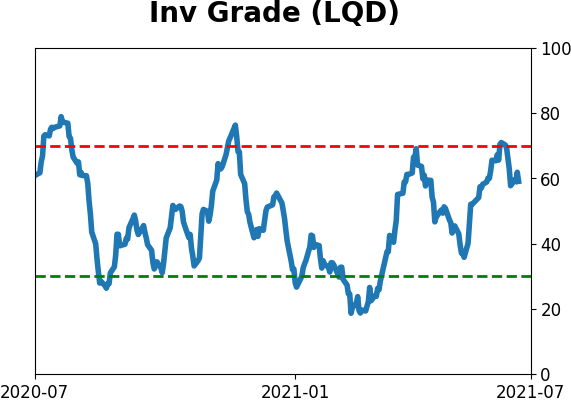
Sentiment Around The World
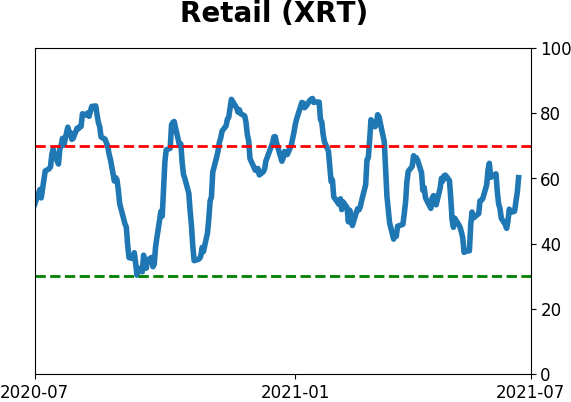
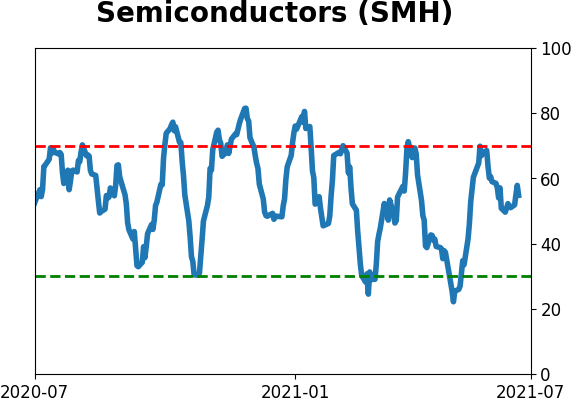
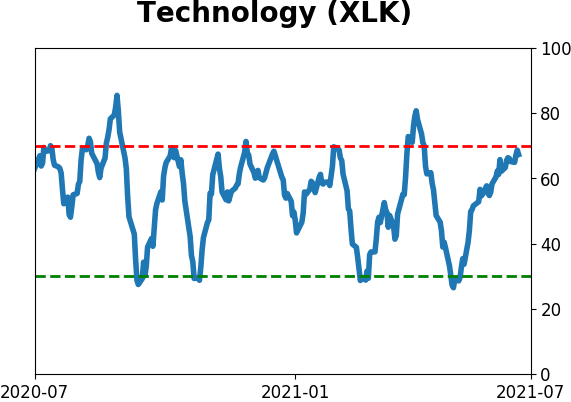
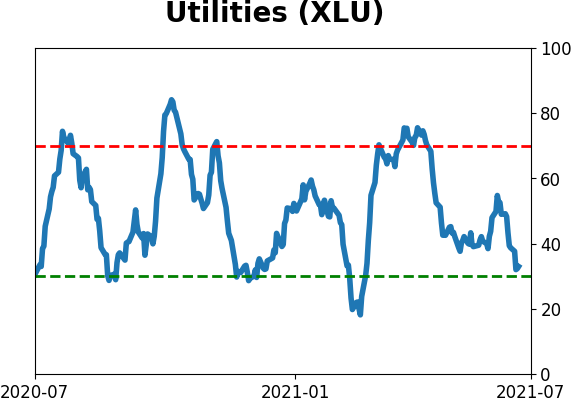
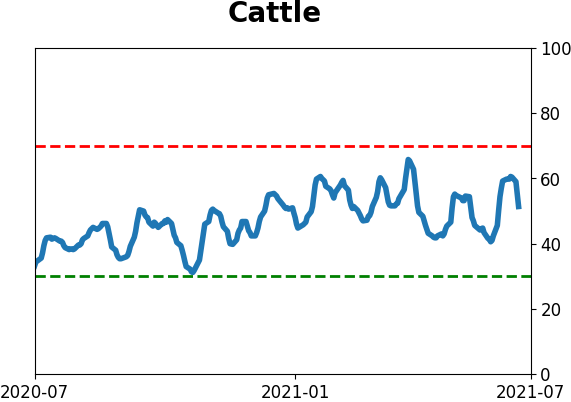
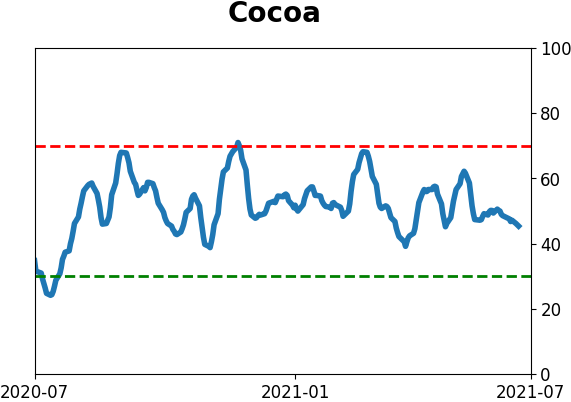
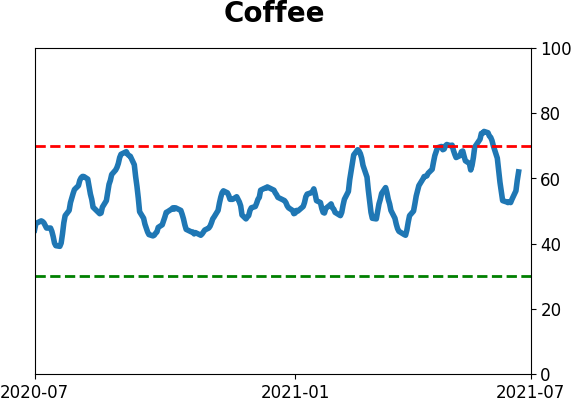
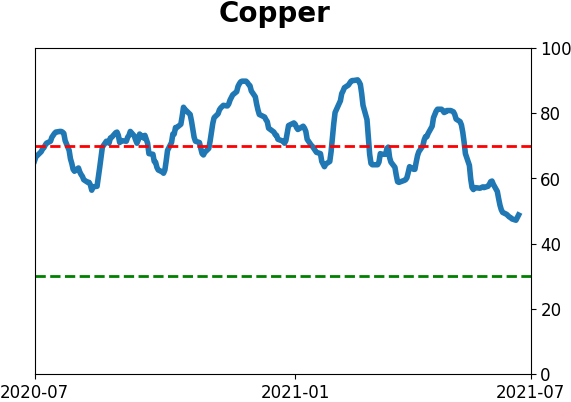
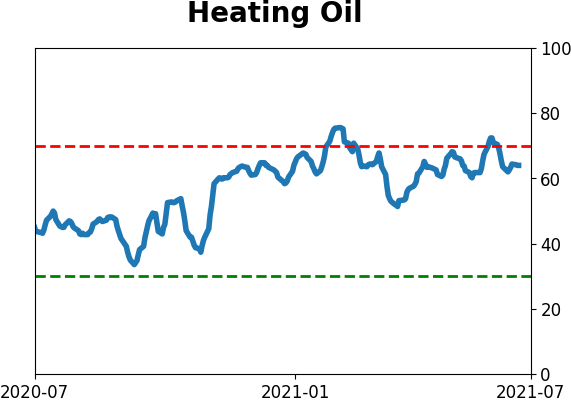
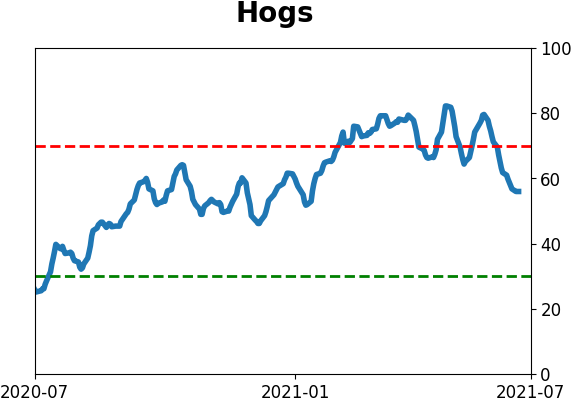
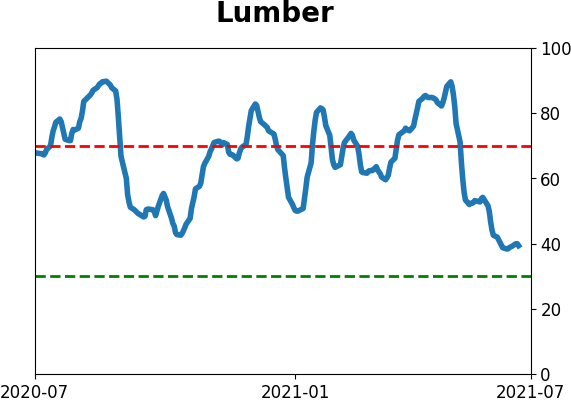
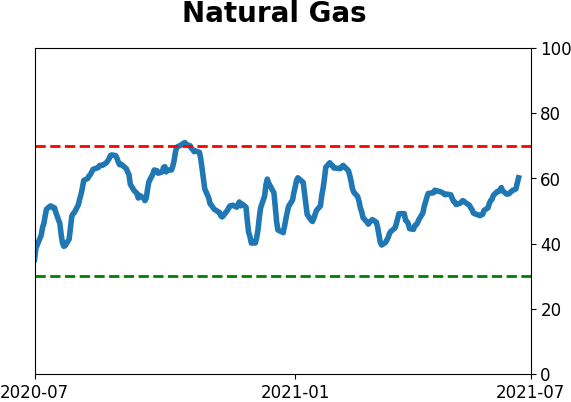
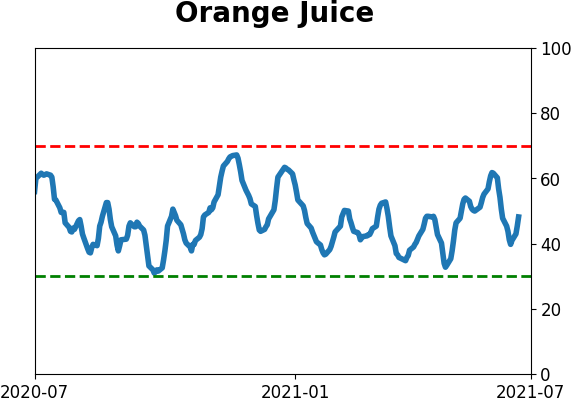
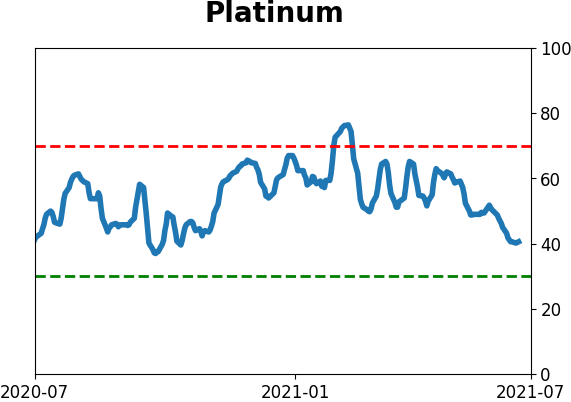
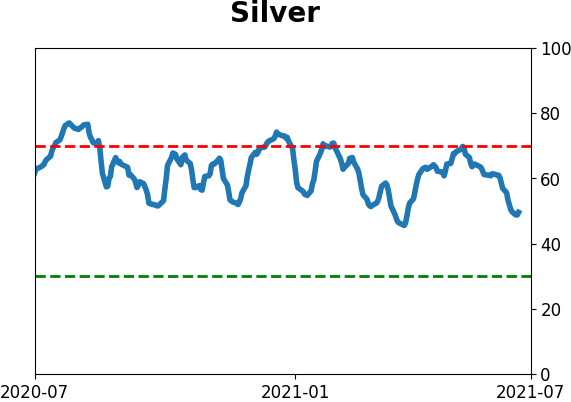
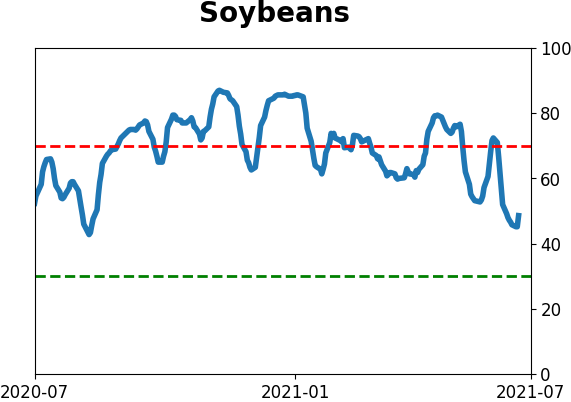
Optimism Index Thumbnails
|
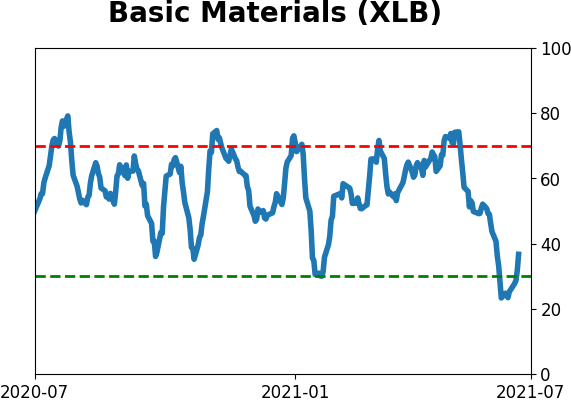
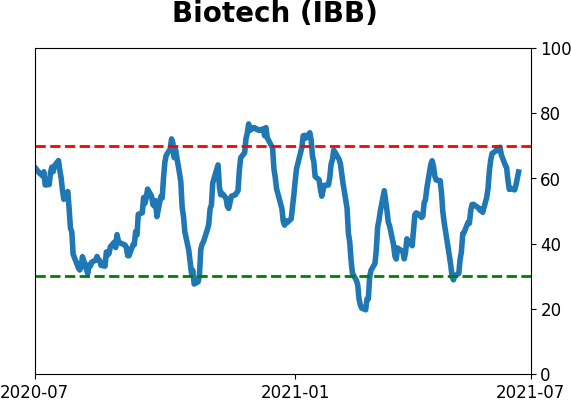
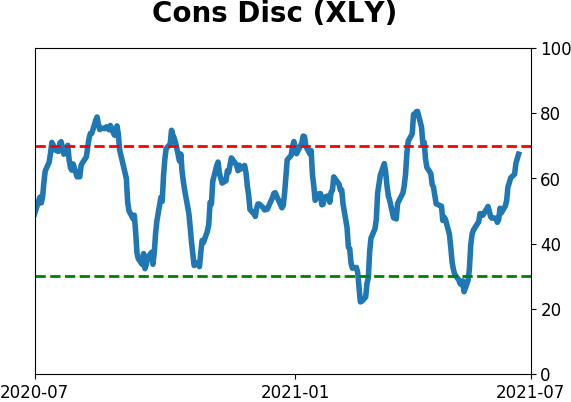
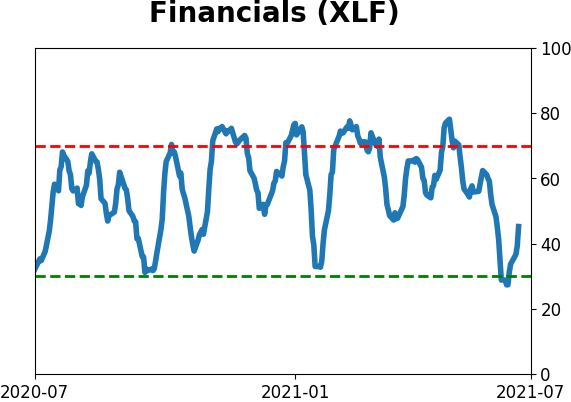
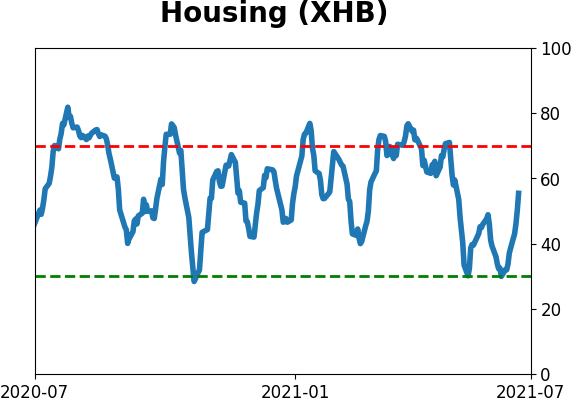
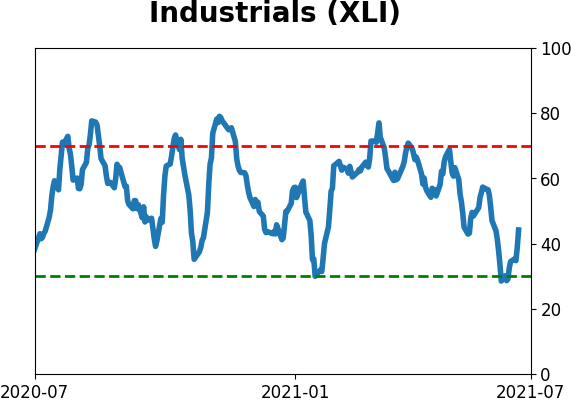
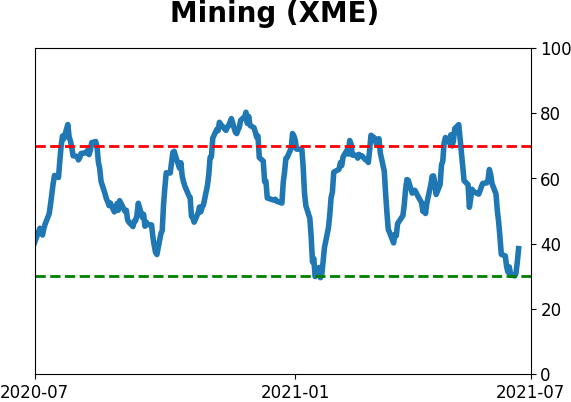
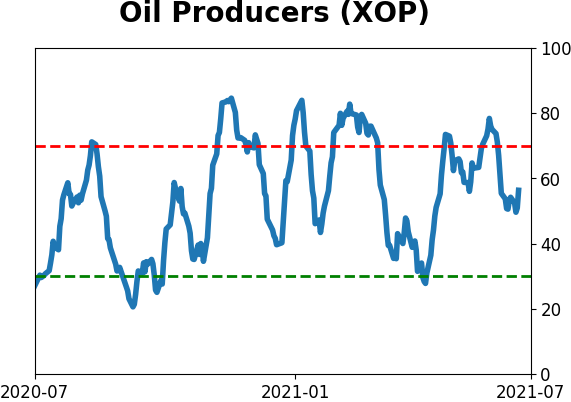
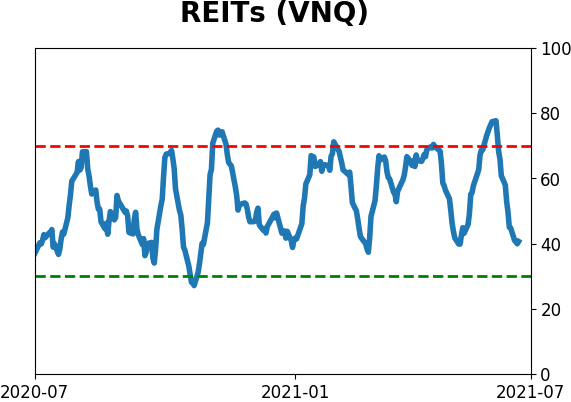
Sector ETF's - 10-Day Moving Average
|
|
|
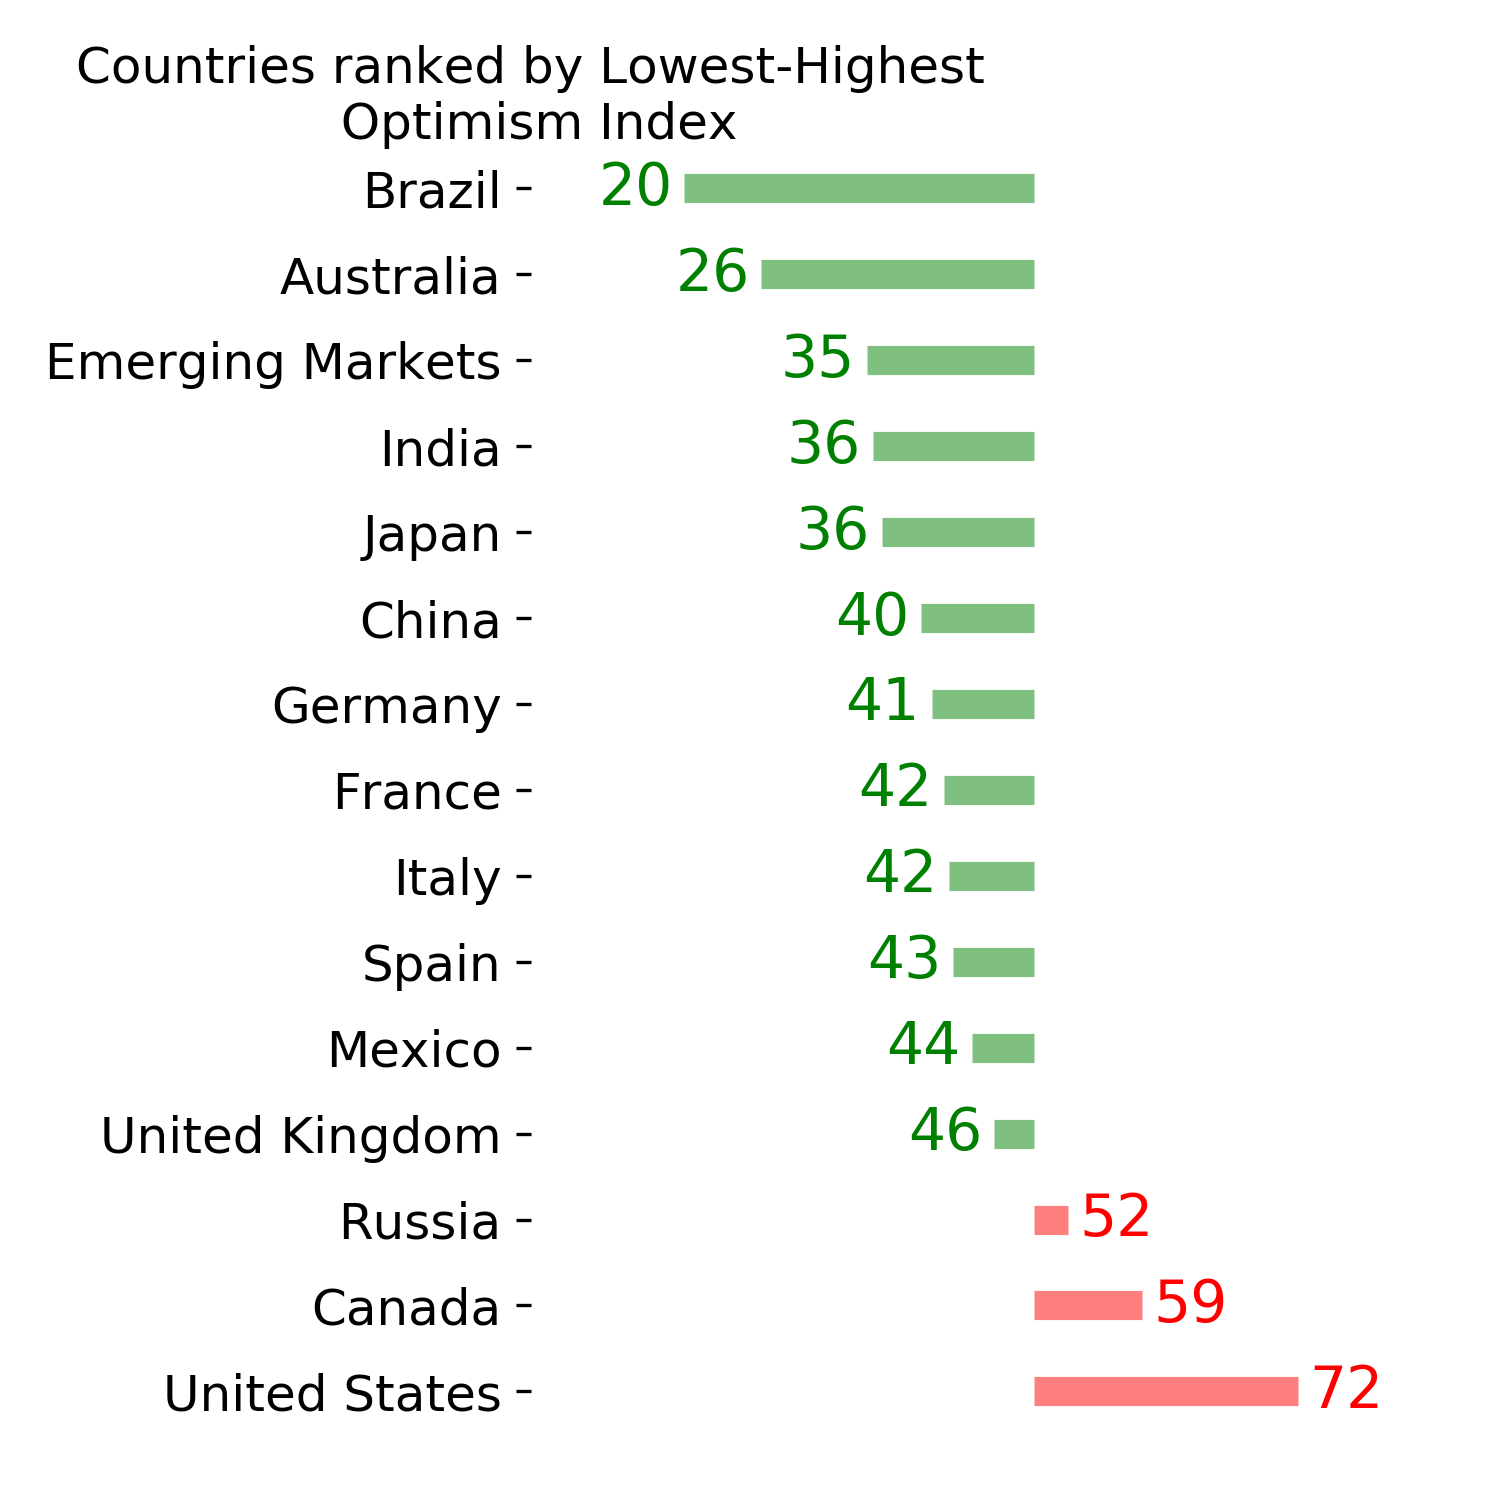
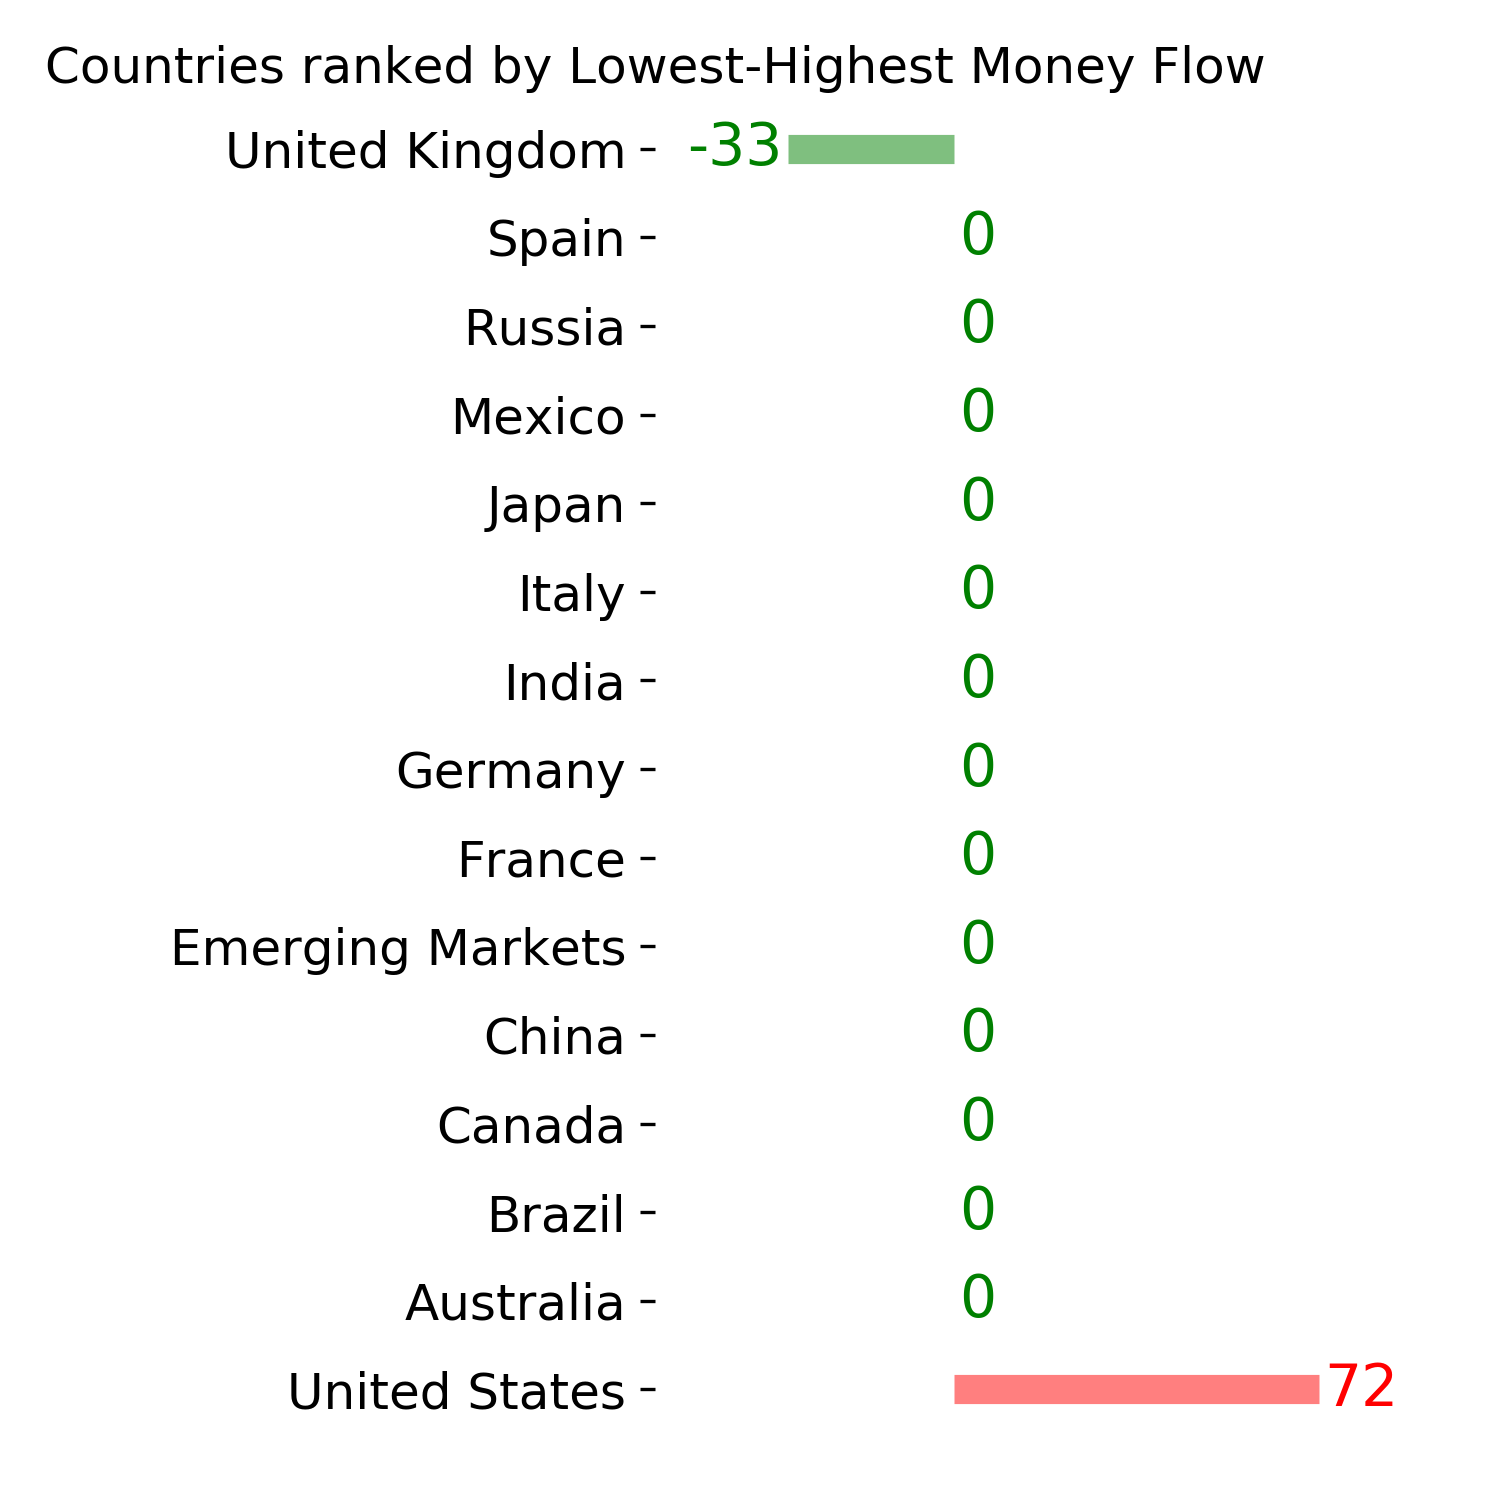
Country ETF's - 10-Day Moving Average
|
|
|
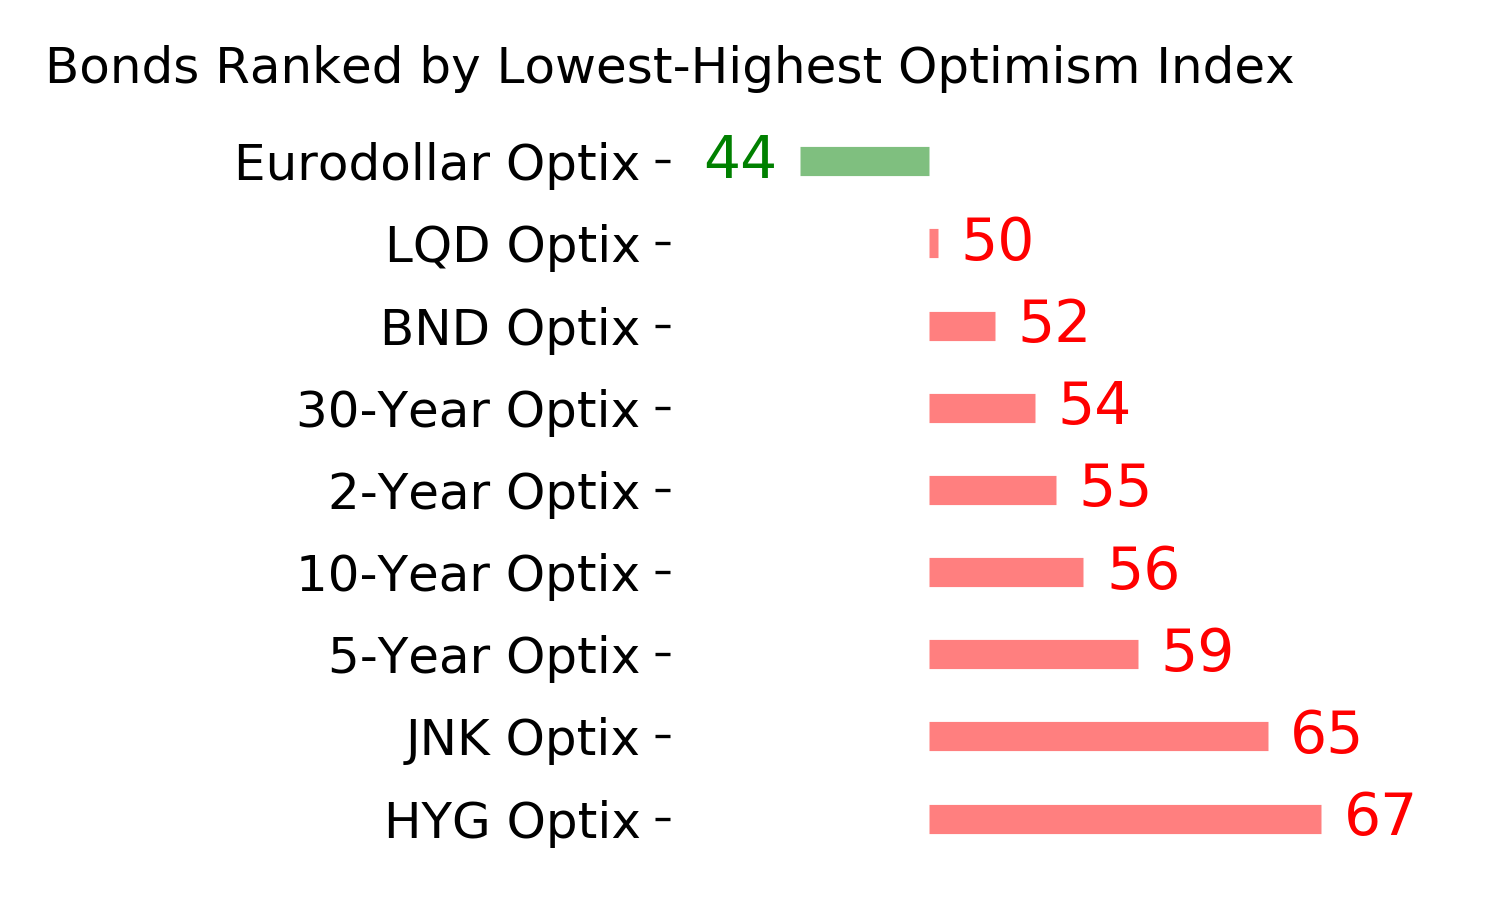
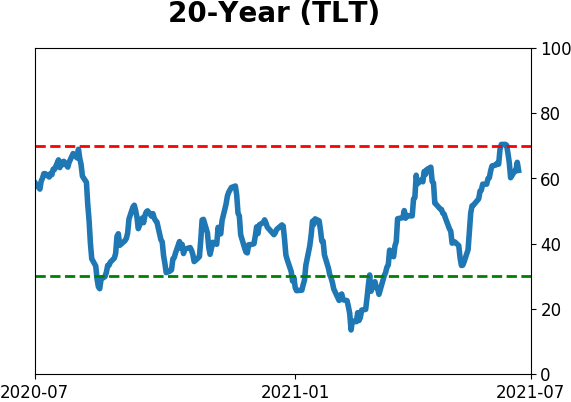
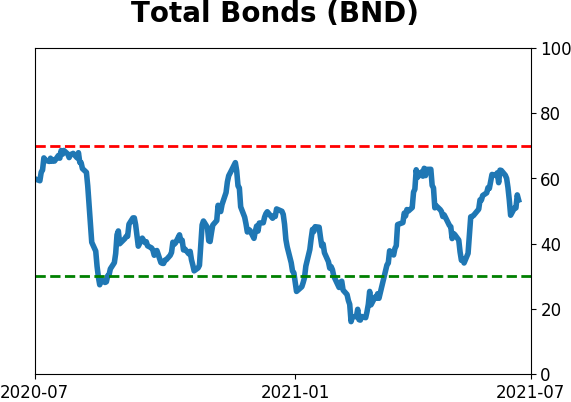
Bond ETF's - 10-Day Moving Average
|
|
|
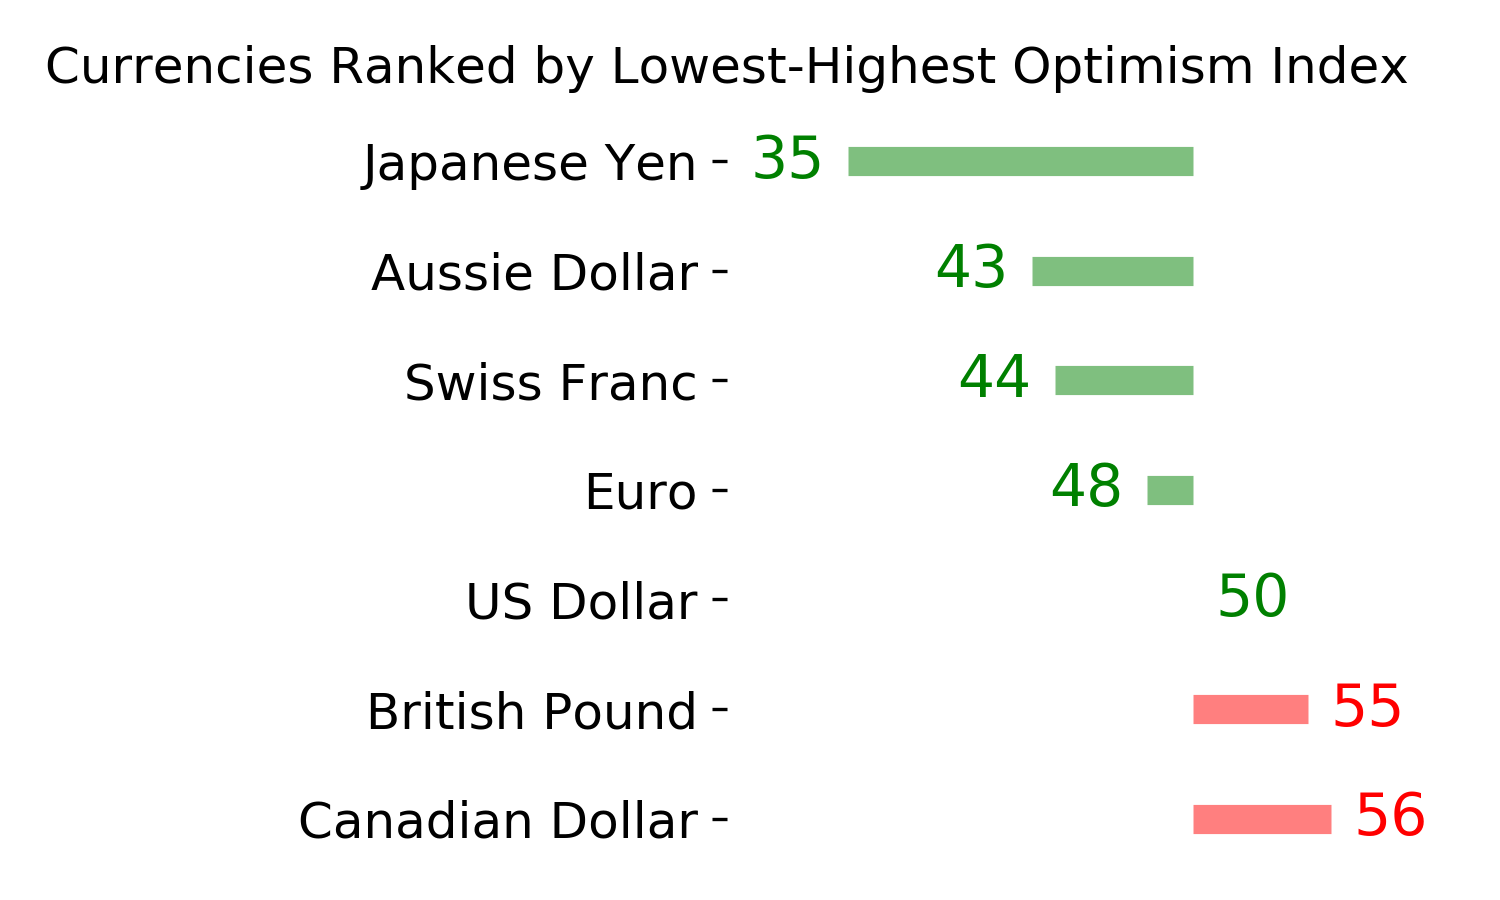
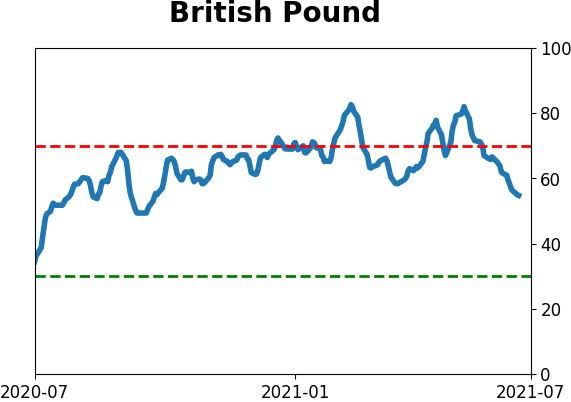
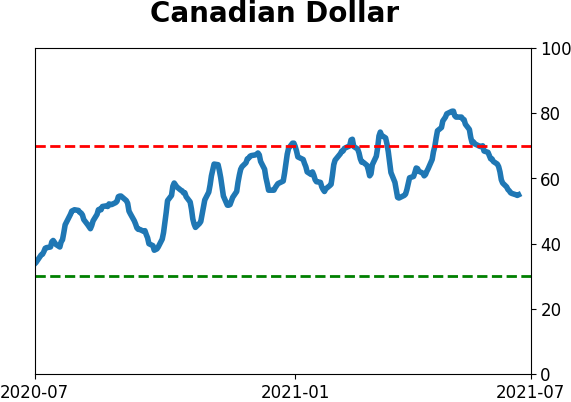
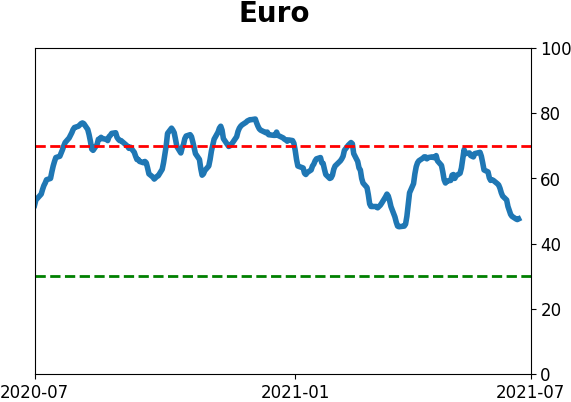
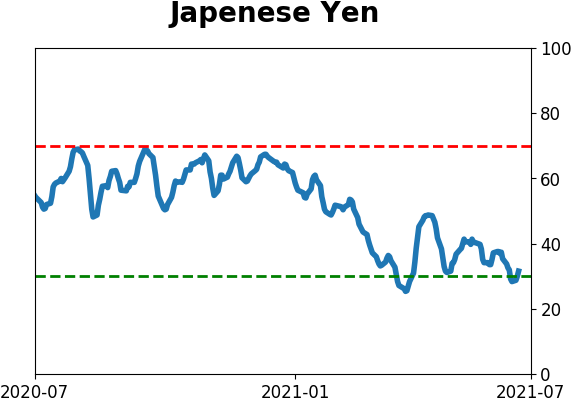
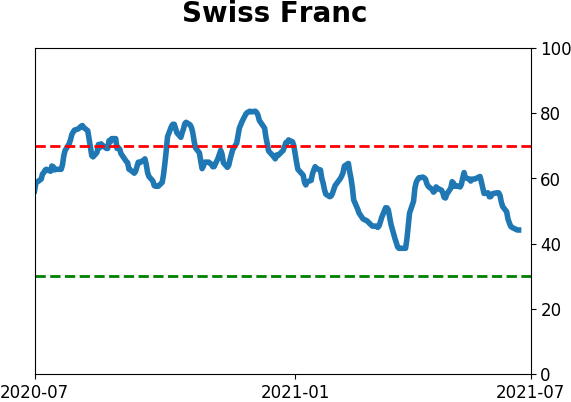
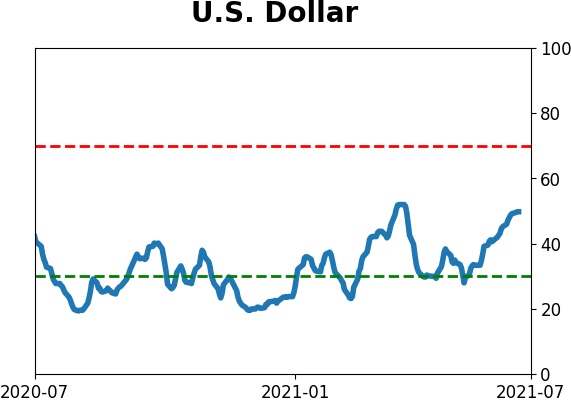
Currency ETF's - 5-Day Moving Average
|
|
|
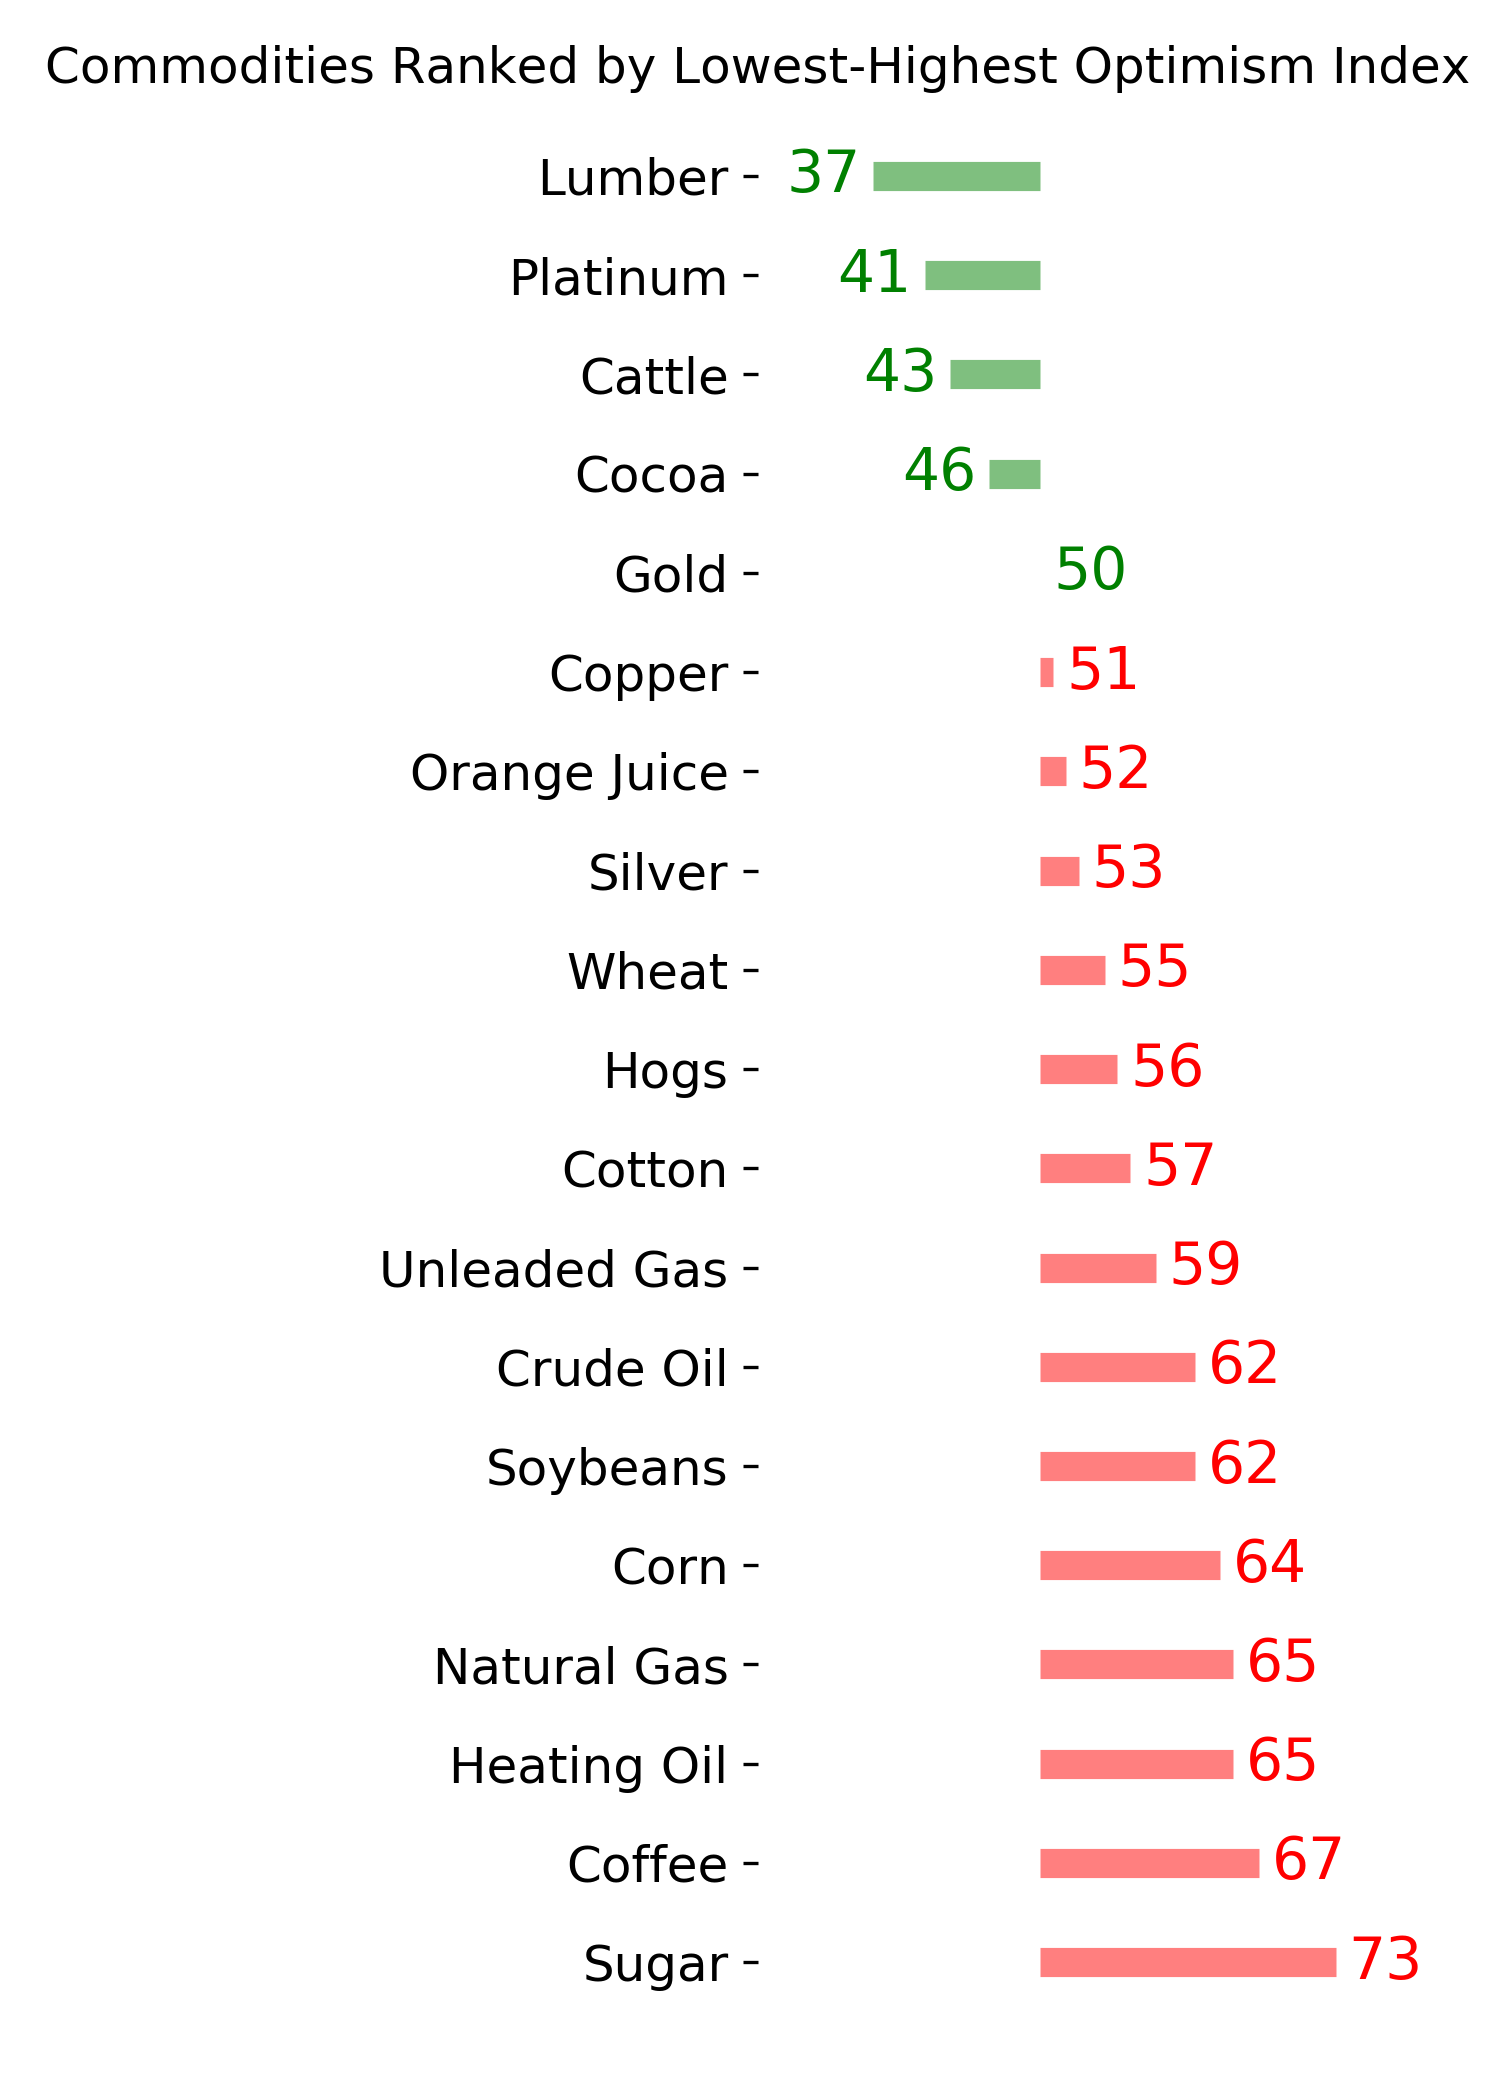
Commodity ETF's - 5-Day Moving Average
|
|