Headlines
|
|
As Small Traders Gamble, Hedge Funds Buy Protection:
The smallest of options traders continue to spend most of their volume on buying speculative call options to open. At the same time, the SKEW index is potentially showing an increase in the probability that stocks may suffer a fall.
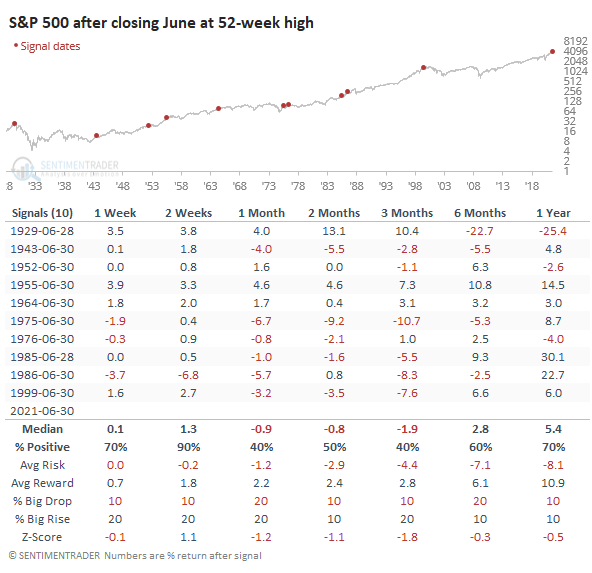
Ending the month strong: The S&P 500 managed to creep to yet another record high on Wednesday (once again with fewer than 50% of its members above their 50-day moving averages). This is the first time the index closed at a 52-week high on the last day of June since 1999.
Bottom Line:
See the Outlook & Allocations page for more details on these summaries STOCKS: Hold
The speculative frenzy in February is wrung out. Internal dynamics have mostly held up, with some exceptions. Many of our studies still show a mixed to poor short-term view, with medium- and long-term ones turning more positive. BONDS: Hold
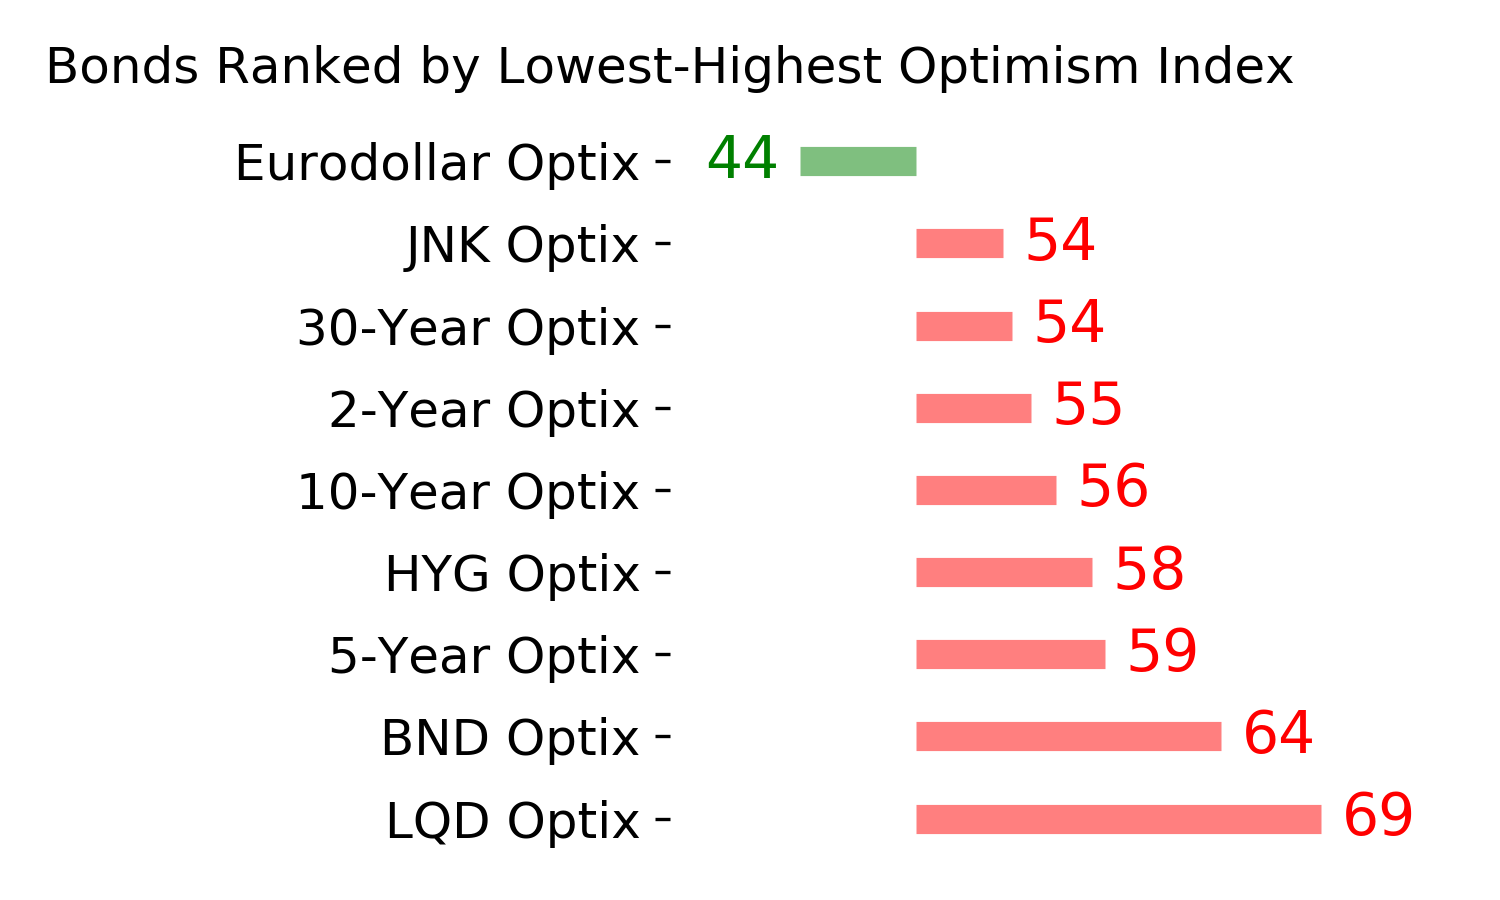
Various parts of the market got hit in March, with the lowest Bond Optimism Index we usually see during healthy environments. After a shaky couple of weeks, the broad bond market has modestly recovered. Not a big edge here either way. GOLD: Hold
Gold and miners have done very well, recovering above long-term trend lines. The issue is that both have tended to perform poorly after similar situations - will have to wait and see how it plays out.
|
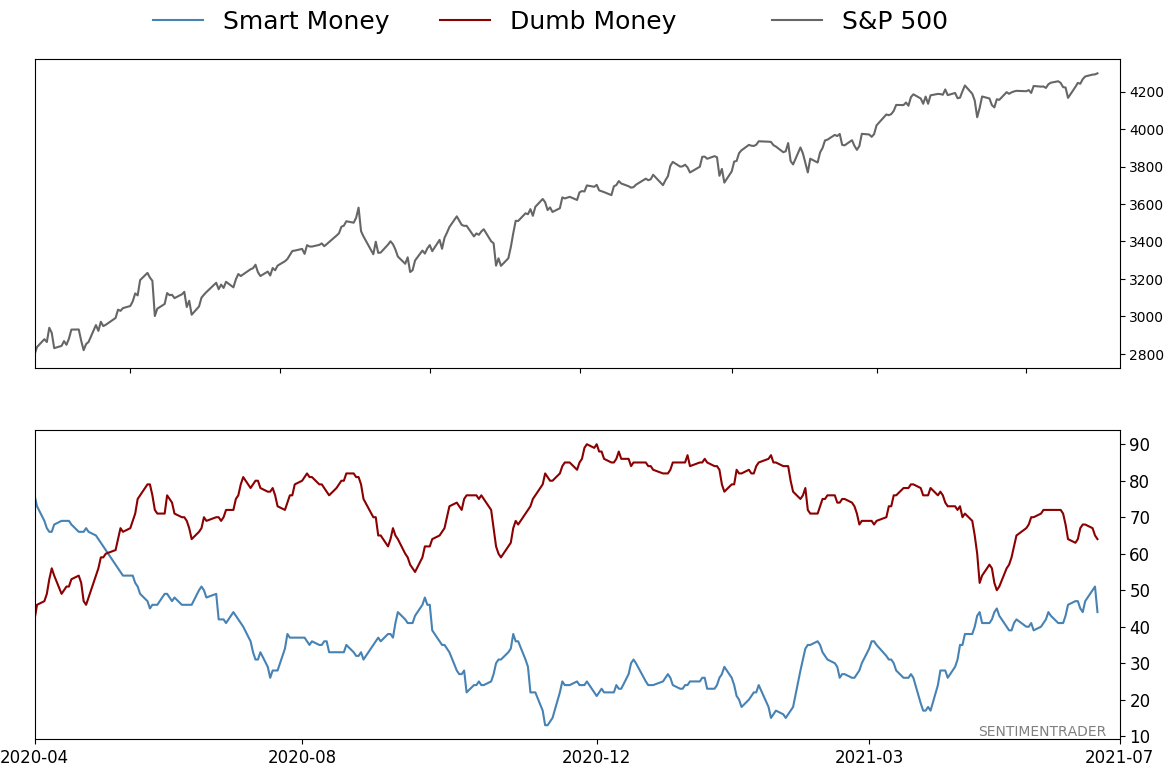
Smart / Dumb Money Confidence
|
Smart Money Confidence: 44%
Dumb Money Confidence: 64%
|
|
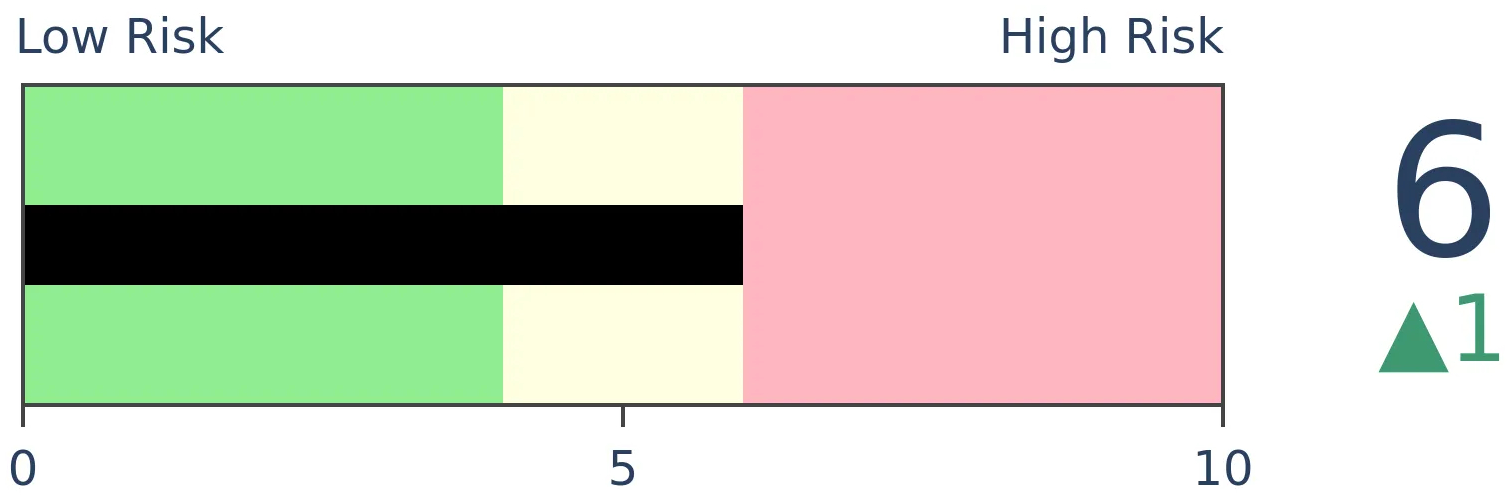
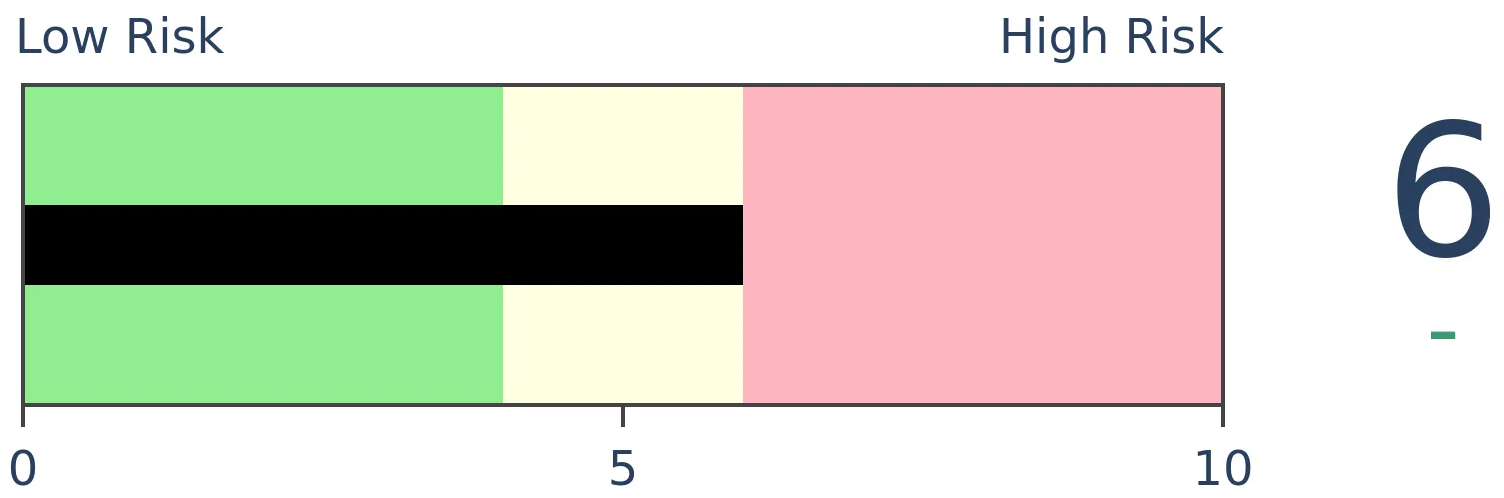
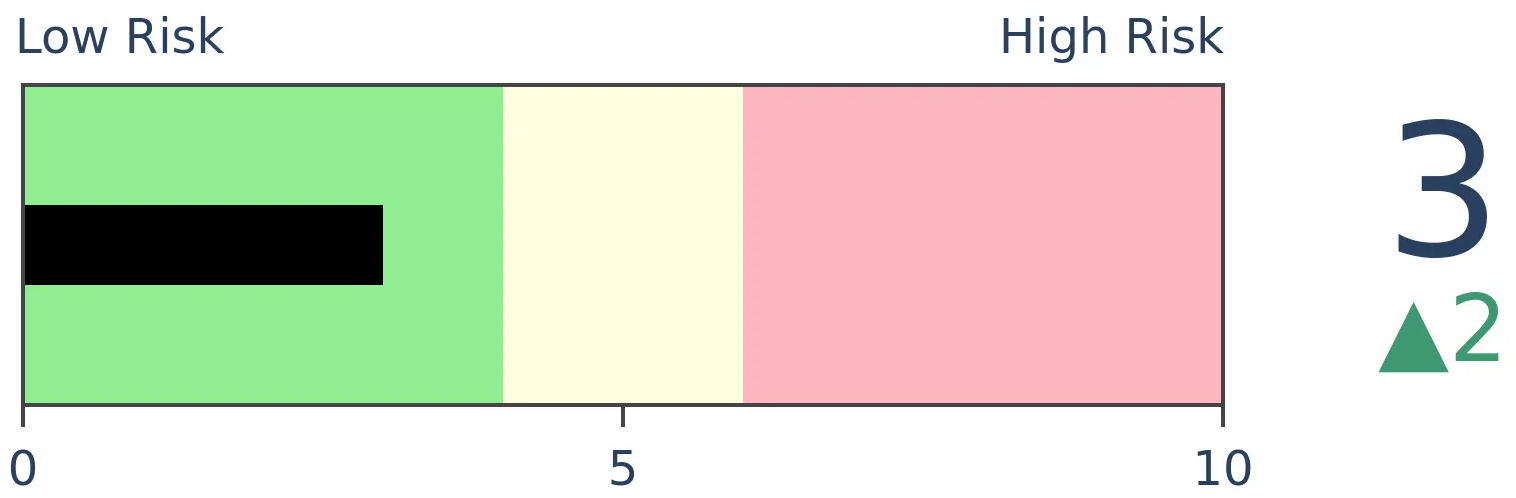
Risk Levels
Stocks Short-Term
|
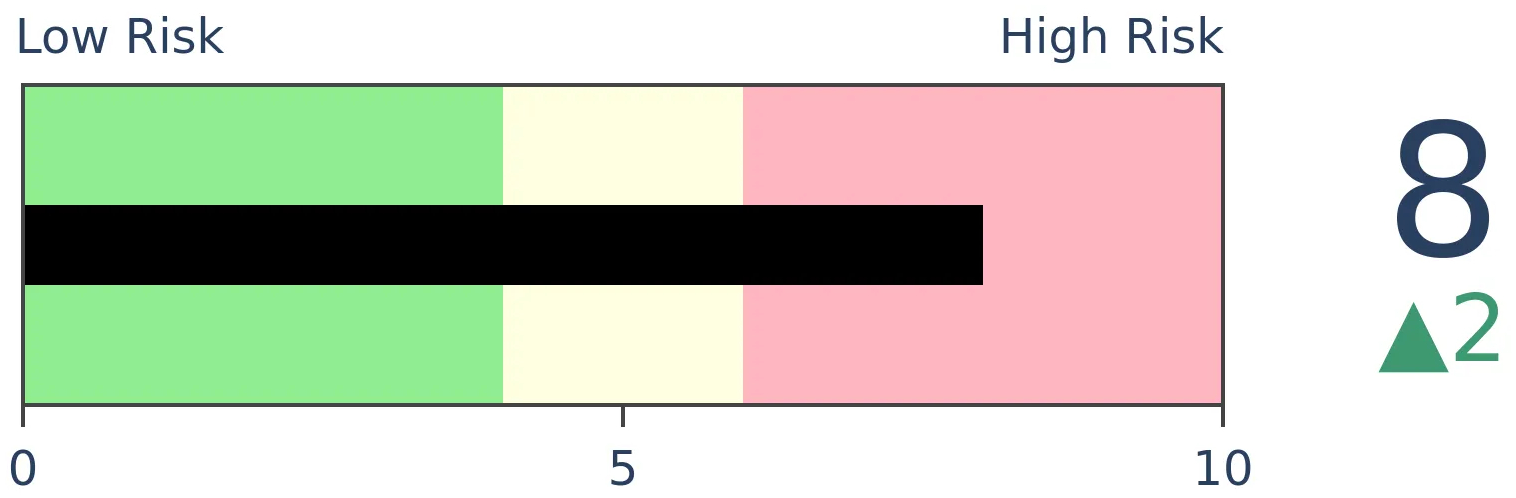
Stocks Medium-Term
|
|
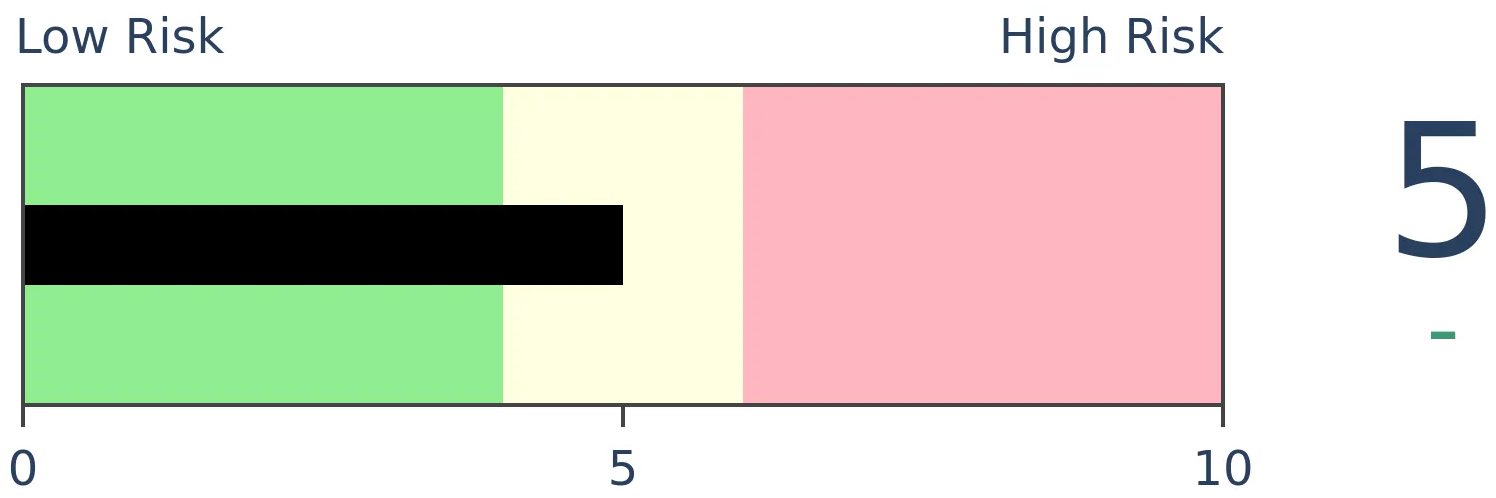
Bonds
|
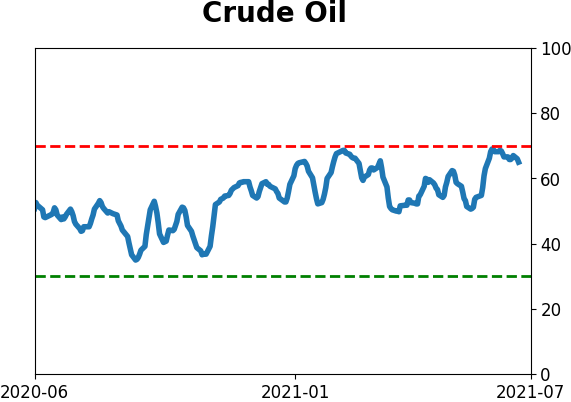
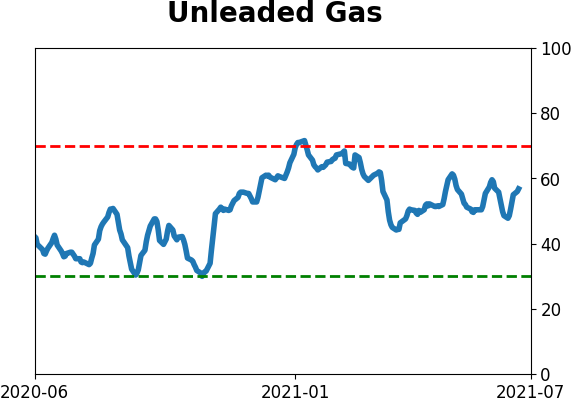
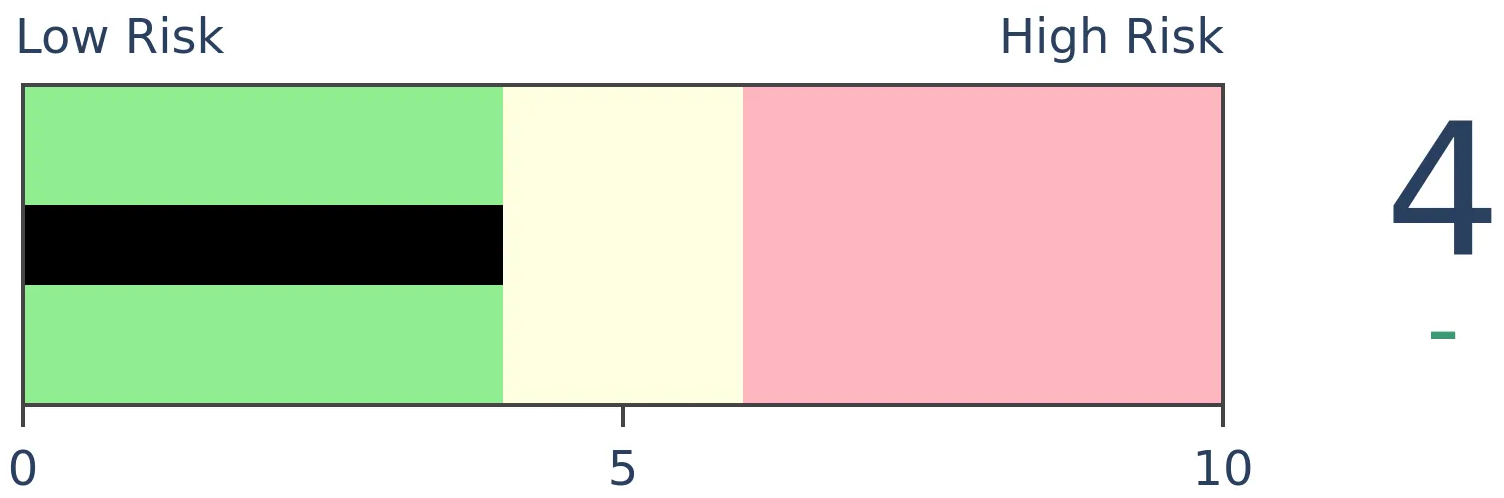
Crude Oil
|
|
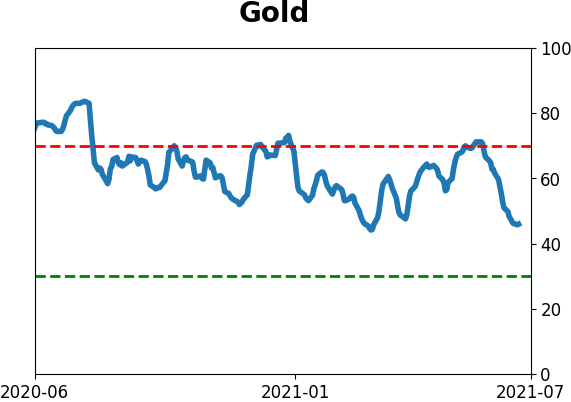
Gold
|
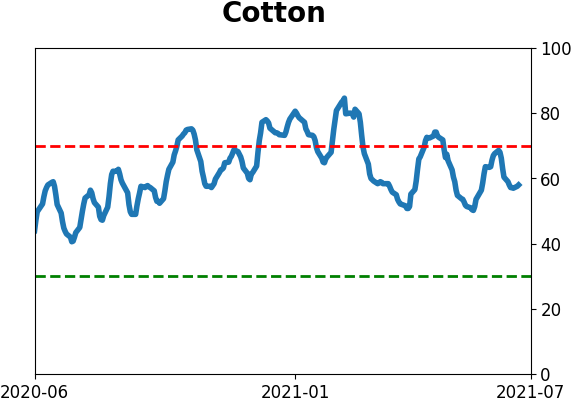
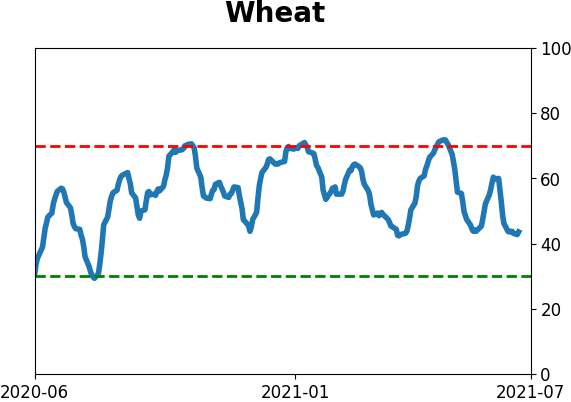
Agriculture
|
|
Research
BOTTOM LINE
The smallest of options traders continue to spend most of their volume on buying speculative call options to open. At the same time, the SKEW index is potentially showing an increase in the probability that stocks may suffer a fall.
FORECAST / TIMEFRAME
None
|
Speculative options activity is near records, but somebody, somewhere, is hedging against a big fall.
A couple of weeks ago, we saw that options volume was exploding to the speculative side again, with few indications of hedging activity anywhere. That hasn't changed much, with small traders still focusing nearly 50% of their total volume on buying call options to open.
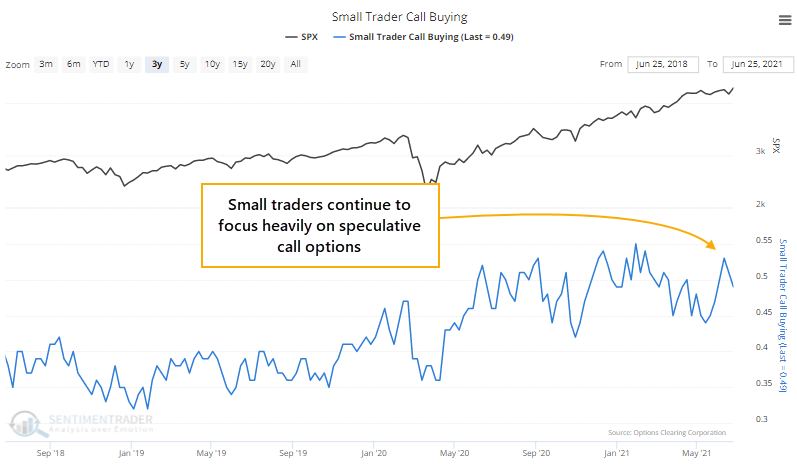
That's down a bit from the recent peak but still among the highest readings in over 20 years.
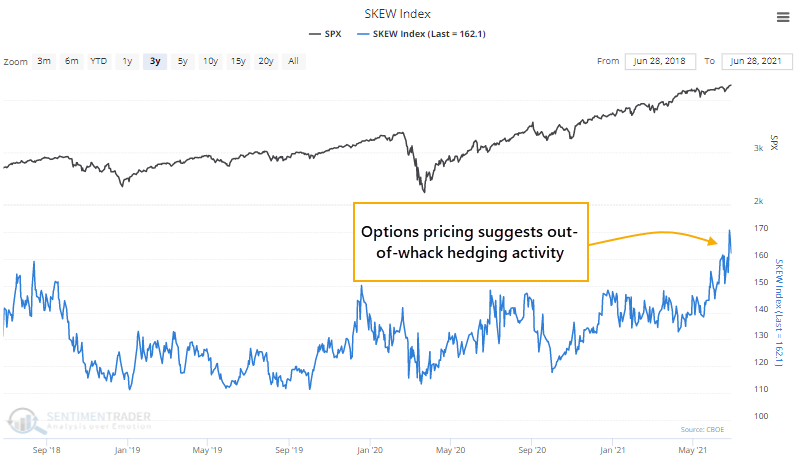
SOMEBODY IS HEDGING...MAYBE
At the same time, there is a big spike in the SKEW Index. According to Cboe, "SKEW is a global, strike independent measure of the slope of the implied volatility curve that increases as this curve tends to steepen."
Yeesh. Their whitepaper goes even further into the weeds on its construction, but it has been dumbed down since its introduction in an attempt to rival the VIX as the "fear index." At its core, it tries to measure the price of far out-of-the-money puts versus calls, with high readings suggesting a higher probability of a crash-type event within the next 30 days.
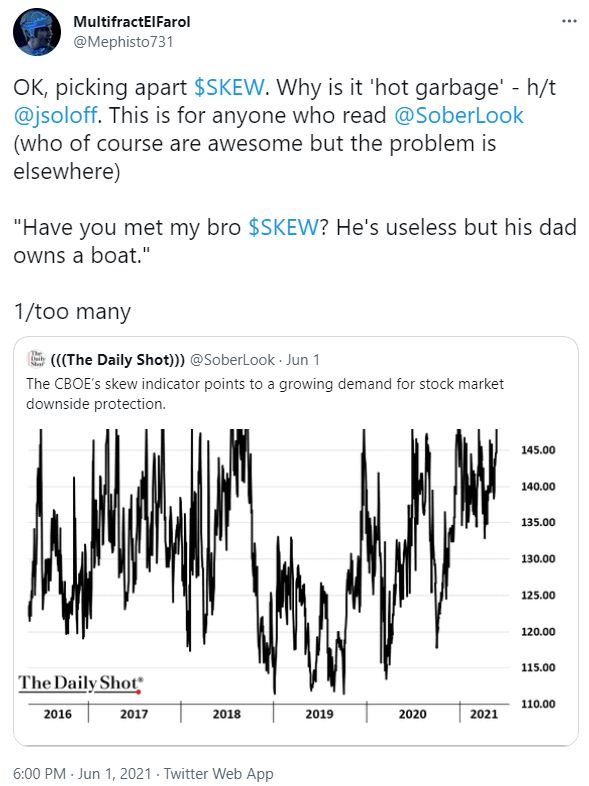
Now, there's a lot wrong with this index and this approach. Some awfully smart folks have torn it apart, and this Twitter thread is as good of a schooling as any, so if you care about why you might NOT want to put a lot of weight on SKEW, check it out.
Let's ignore the issues and take it for what it's supposed to be. We'll assume that a high SKEW reading suggests that somebody, somewhere, is willing to pay a pretty penny for some protection against a larger-than-average and imminent decline.
So, what we have right now is a bunch of the smallest options traders in the market betting heavily that stocks are going to keep soaring, at the same time that (probably) sophisticated (probably) hedge funds are (probably) betting on a quick, big drop.
RETURNS WHEN SMALL TRADERS BULLISH, HEDGE FUNDS BEARISH
The table below shows every time in the past 22 years when small traders' call buying activity and the SKEW index were both in the upper 90% of their 3-year ranges at the same time.
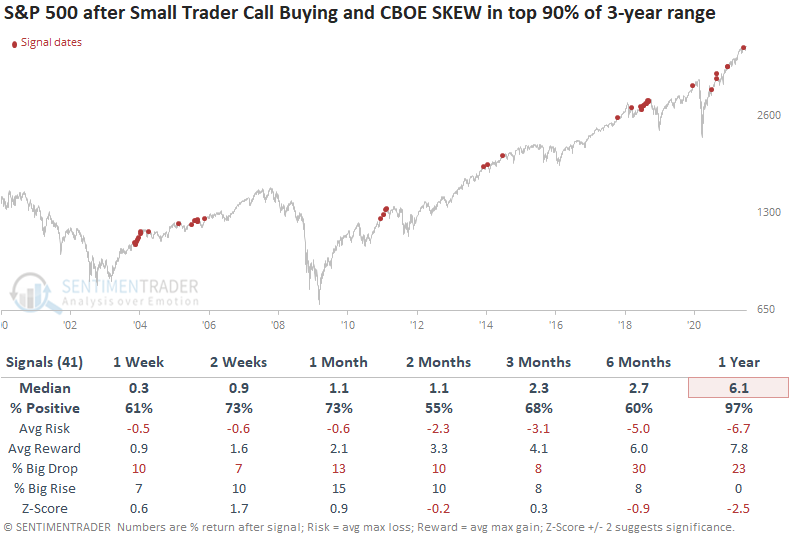
This was not necessarily a sign that we should sell everything and prepare for a crash. Across all time frames, the S&P 500 rallied more often than it declined. What it was a sign for, however, was mediocre returns.
While the timing was inconsistent, if stocks did continue to grind higher, most of the time those gains were given back during a subsequent pullback. Over the next three months, there was about an equal probability of seeing at least a 5% decline as there was a 5% rally. Even up to a year later, risk and reward were about even, which is not a great performance given most of the study period was dominated by bull markets.
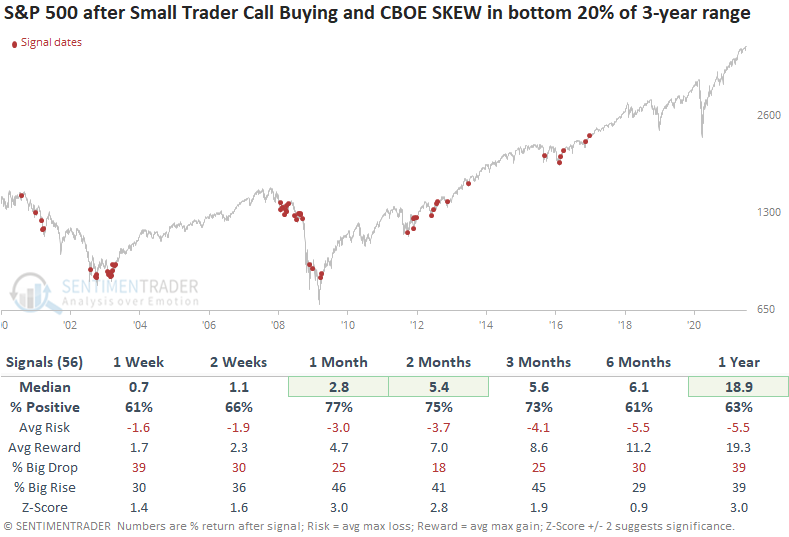
If we look at the opposite scenario, when both small trader call activity and the SKEW were near the bottoms of their ranges simultaneously, it was a better setup for stocks.
So, what's the point with all this - is it a reason to worry about the next month or so?
Uhh...maybe? An uncertain adverb with a question mark is about the highest conviction we could have given the concerns shown above and the inconsistent timing with future declines. It is definitely a concern that small traders of highly leveraged, expiring instruments are so confident in stocks, and it's probably a concern that SKEW is high as opposed to low. Taken together, that hasn't been a great setup for stocks.
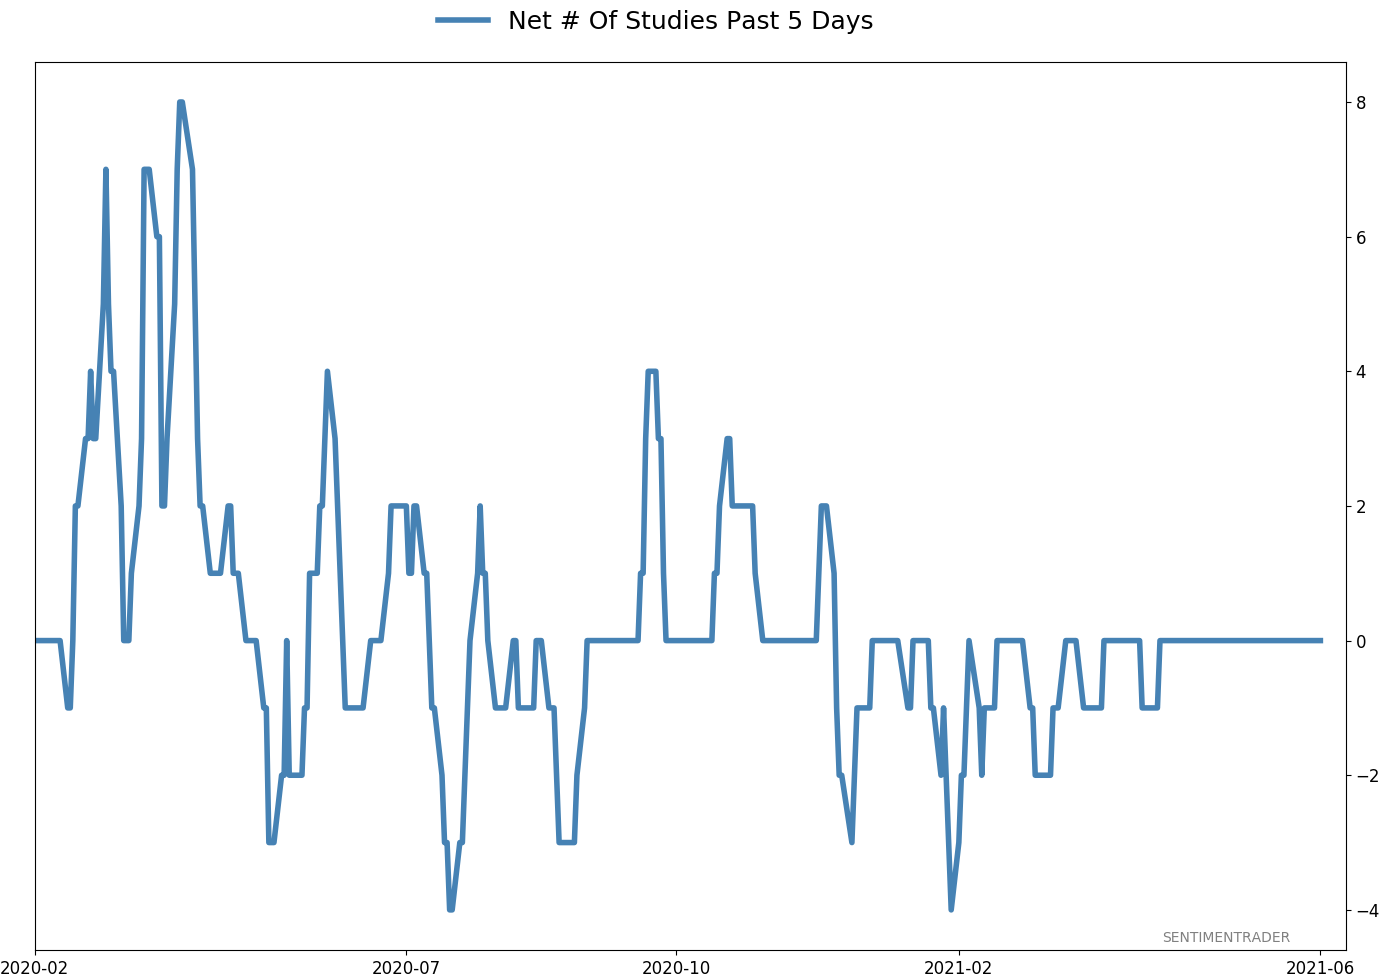
Active Studies
| Time Frame | Bullish | Bearish | | Short-Term | 0 | 1 | | Medium-Term | 2 | 2 | | Long-Term | 8 | 5 |
|
Indicators at Extremes
Portfolio
| Position | Description | Weight % | Added / Reduced | Date | | Stocks | RSP | 4.1 | Added 4.1% | 2021-05-19 | | Bonds | 23.9% BND, 6.9% SCHP | 30.7 | Reduced 7.1% | 2021-05-19 | | Commodities | GCC | 2.6 | Reduced 2.1%
| 2020-09-04 | | Precious Metals | GDX | 5.6 | Reduced 4.2% | 2021-05-19 | | Special Situations | 4.3% XLE, 2.2% PSCE | 7.6 | Reduced 5.6% | 2021-04-22 | | Cash | | 49.4 | | |
|
Updates (Changes made today are underlined)
Much of our momentum and trend work has remained positive for several months, with some scattered exceptions. Almost all sentiment-related work has shown a poor risk/reward ratio for stocks, especially as speculation drove to record highs in exuberance in February. Much of that has worn off, and most of our models are back toward neutral levels. There isn't much to be excited about here. The same goes for bonds and even gold. Gold has been performing well lately and is back above long-term trend lines. The issue is that it has a poor record of holding onto gains when attempting a long-term trend change like this, so we'll take a wait-and-see approach. RETURN YTD: 9.4% 2020: 8.1%, 2019: 12.6%, 2018: 0.6%, 2017: 3.8%, 2016: 17.1%, 2015: 9.2%, 2014: 14.5%, 2013: 2.2%, 2012: 10.8%, 2011: 16.5%, 2010: 15.3%, 2009: 23.9%, 2008: 16.2%, 2007: 7.8%
|
|
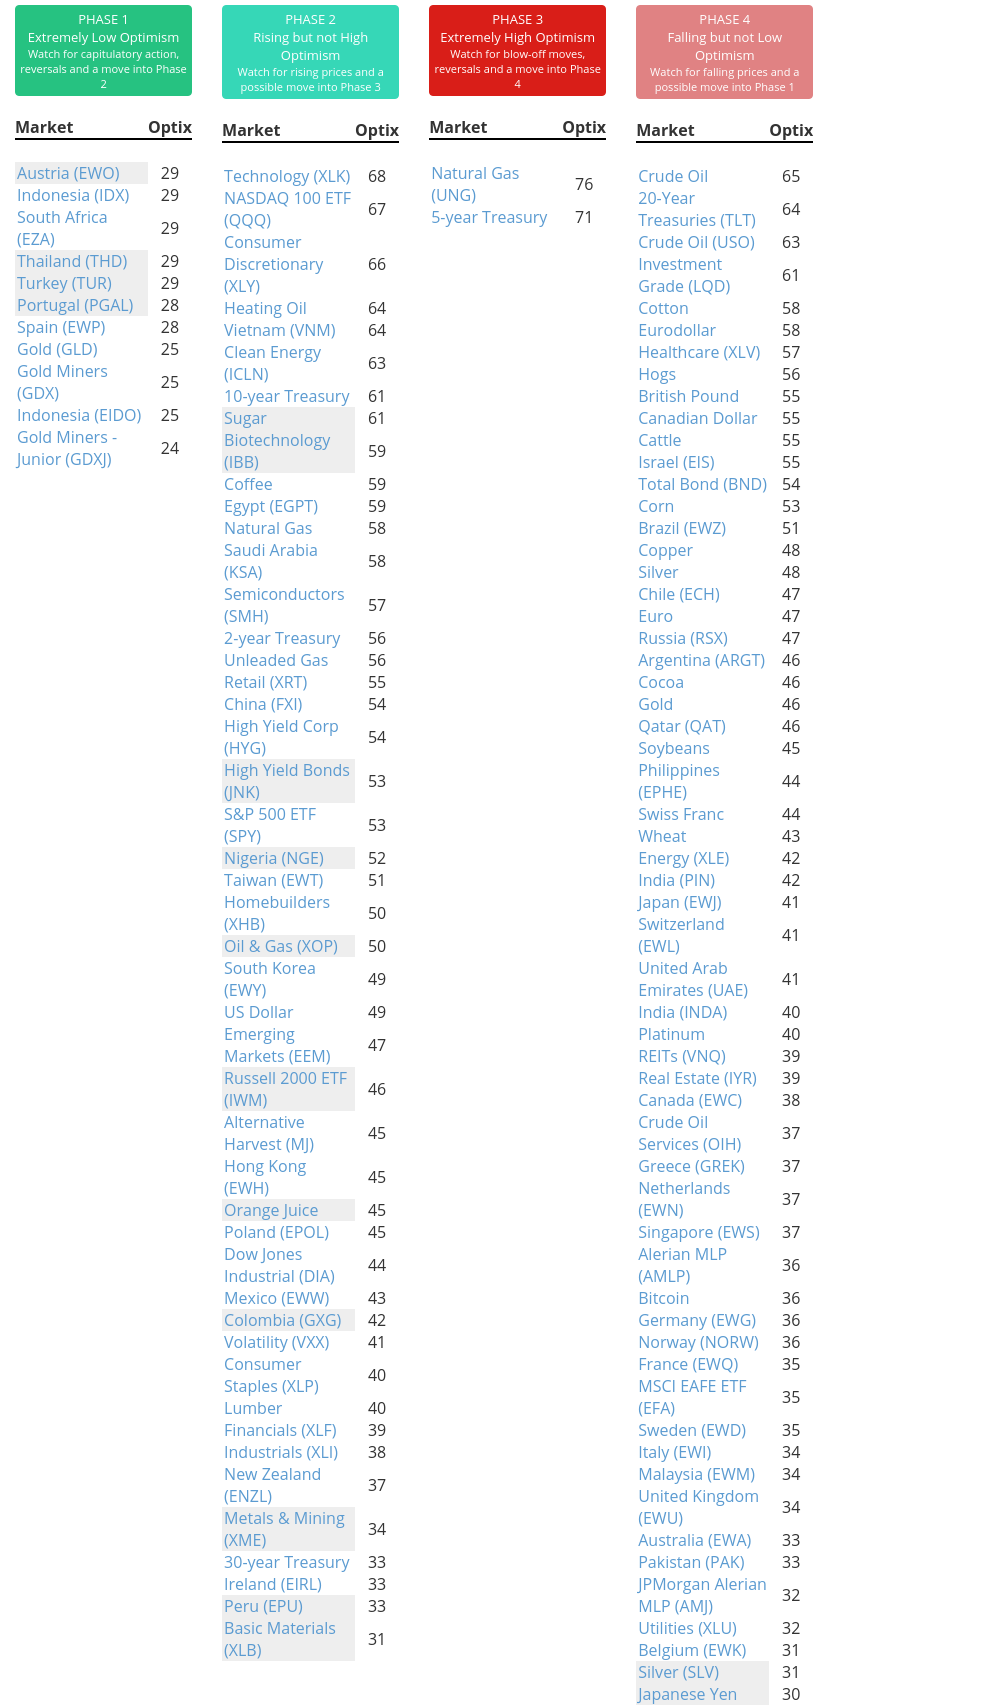
Phase Table
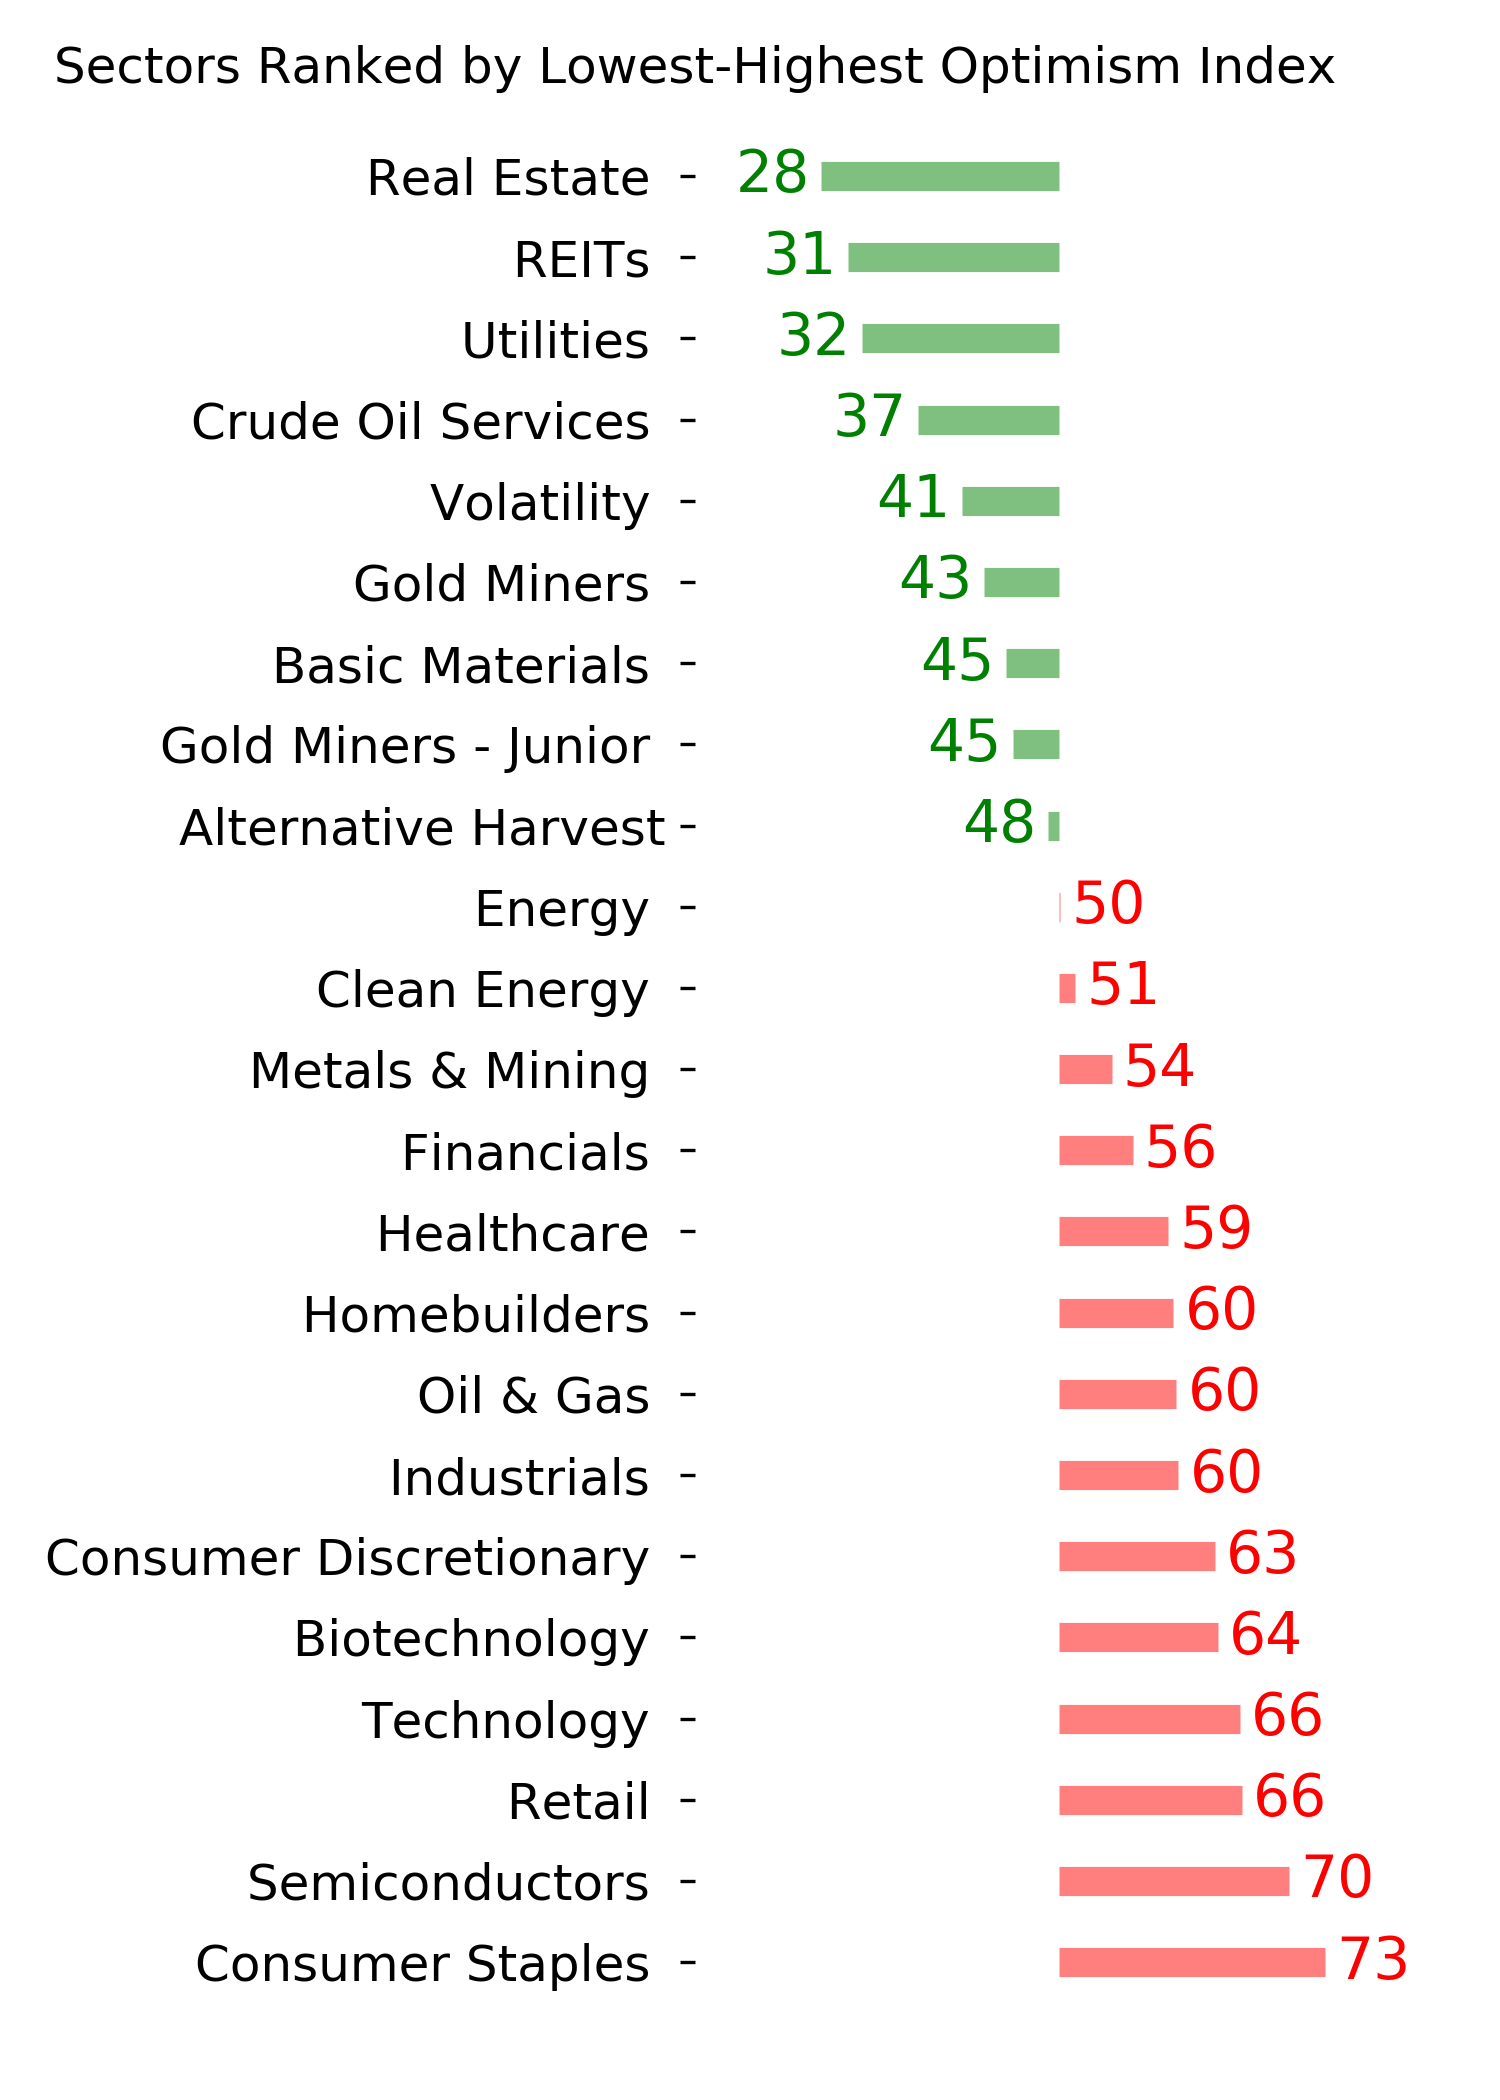
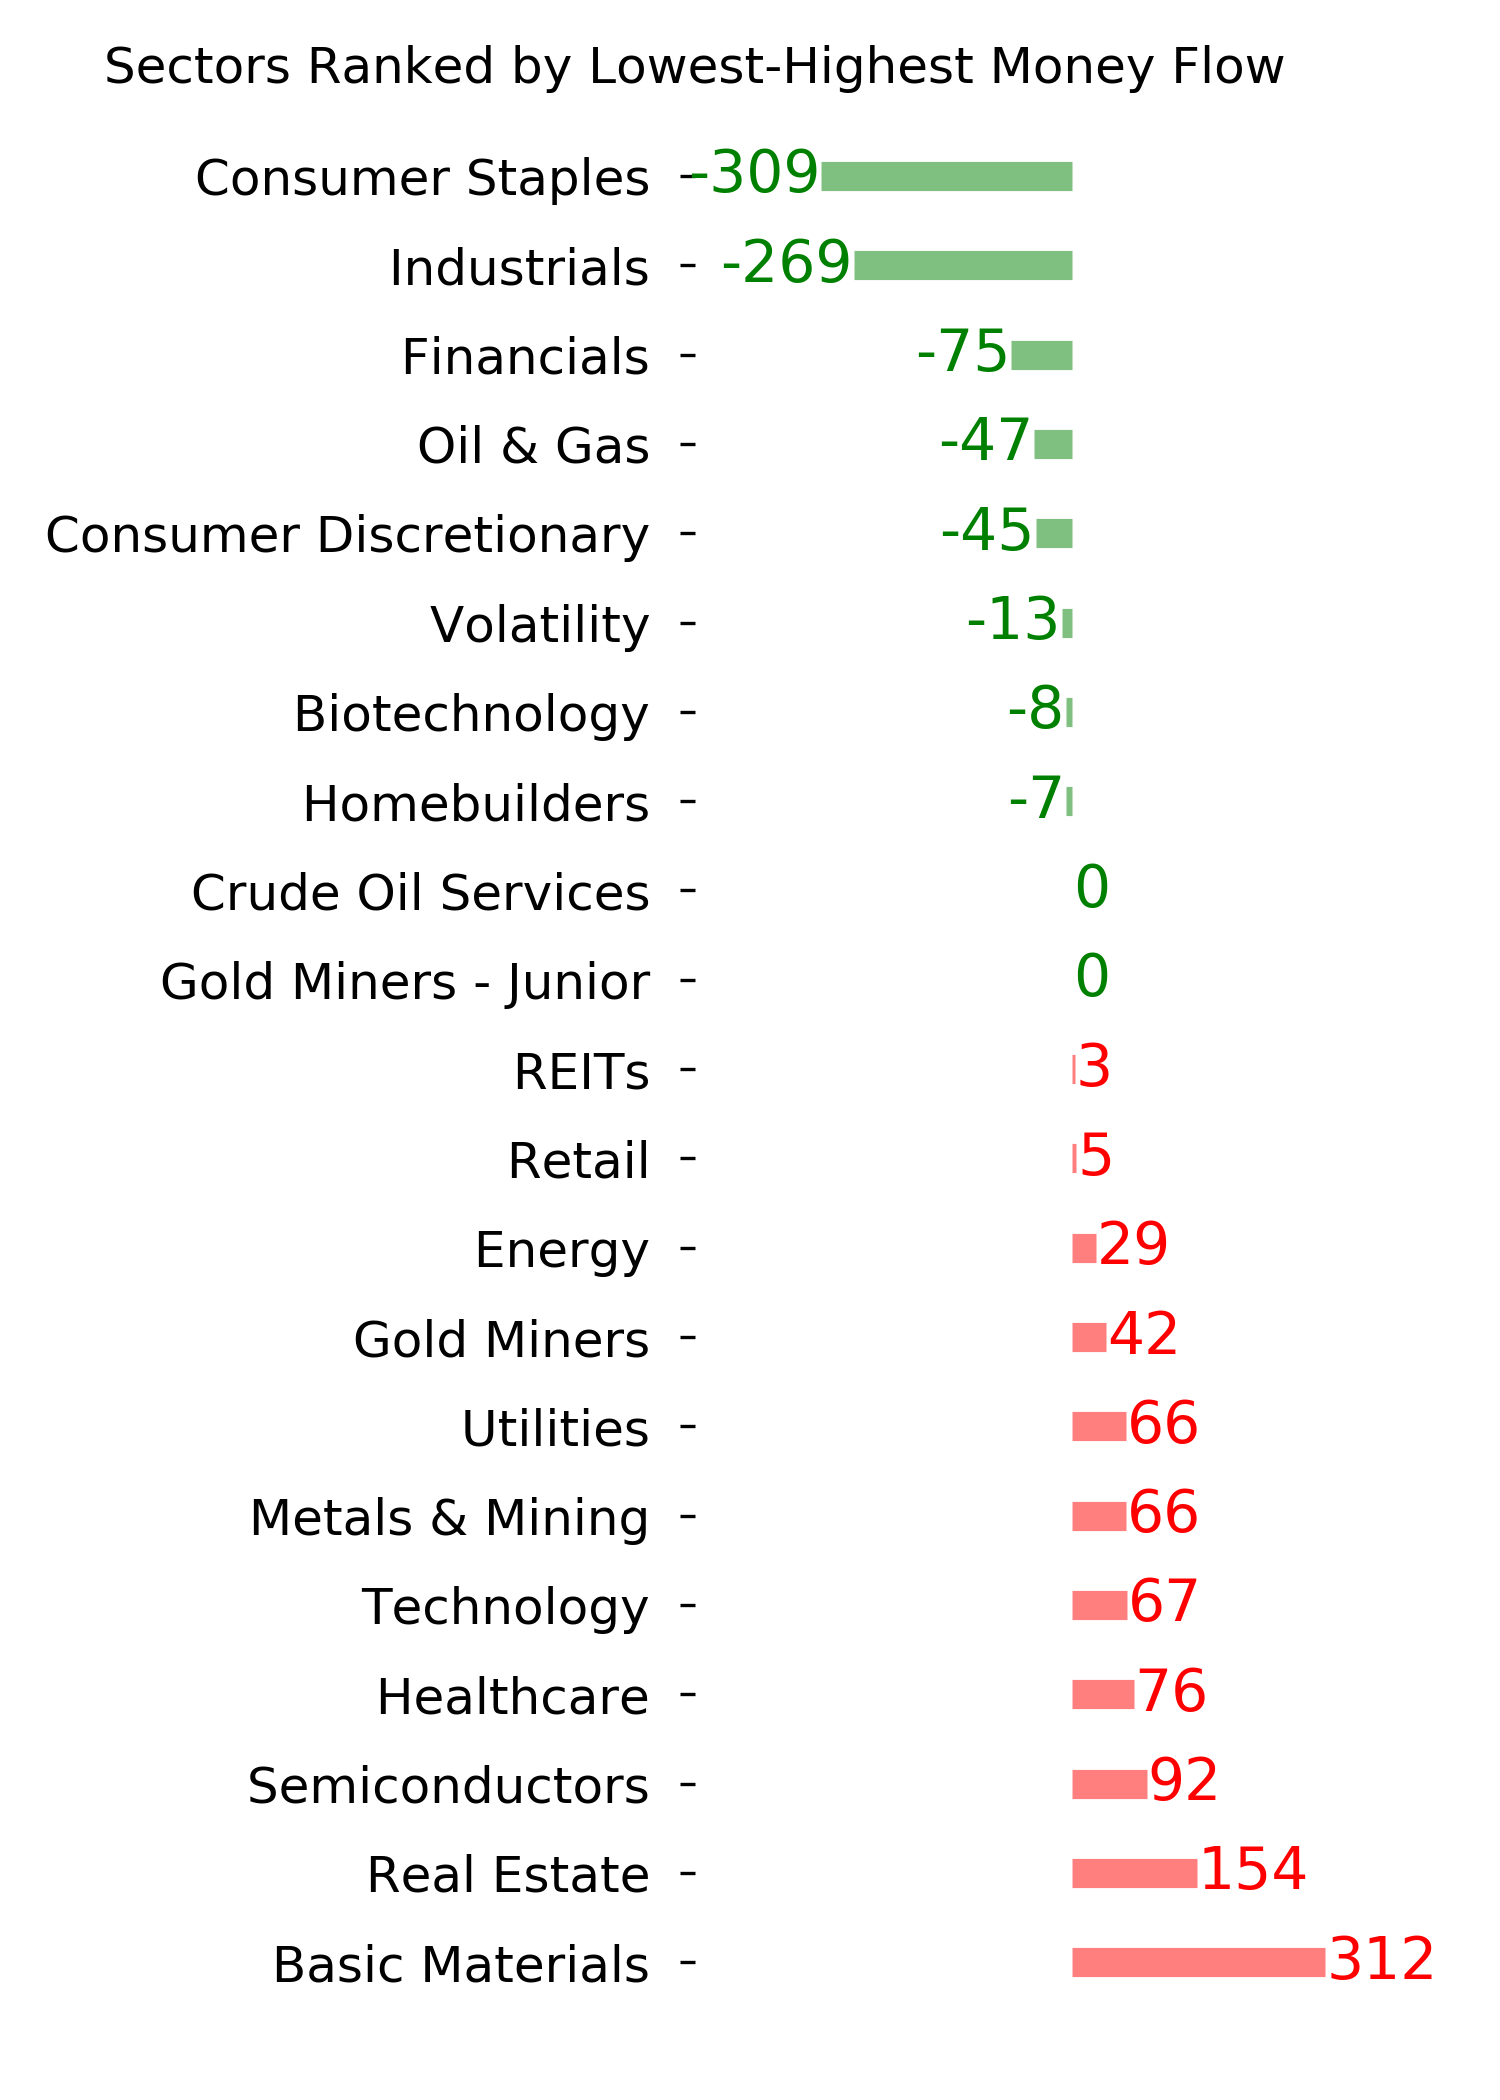
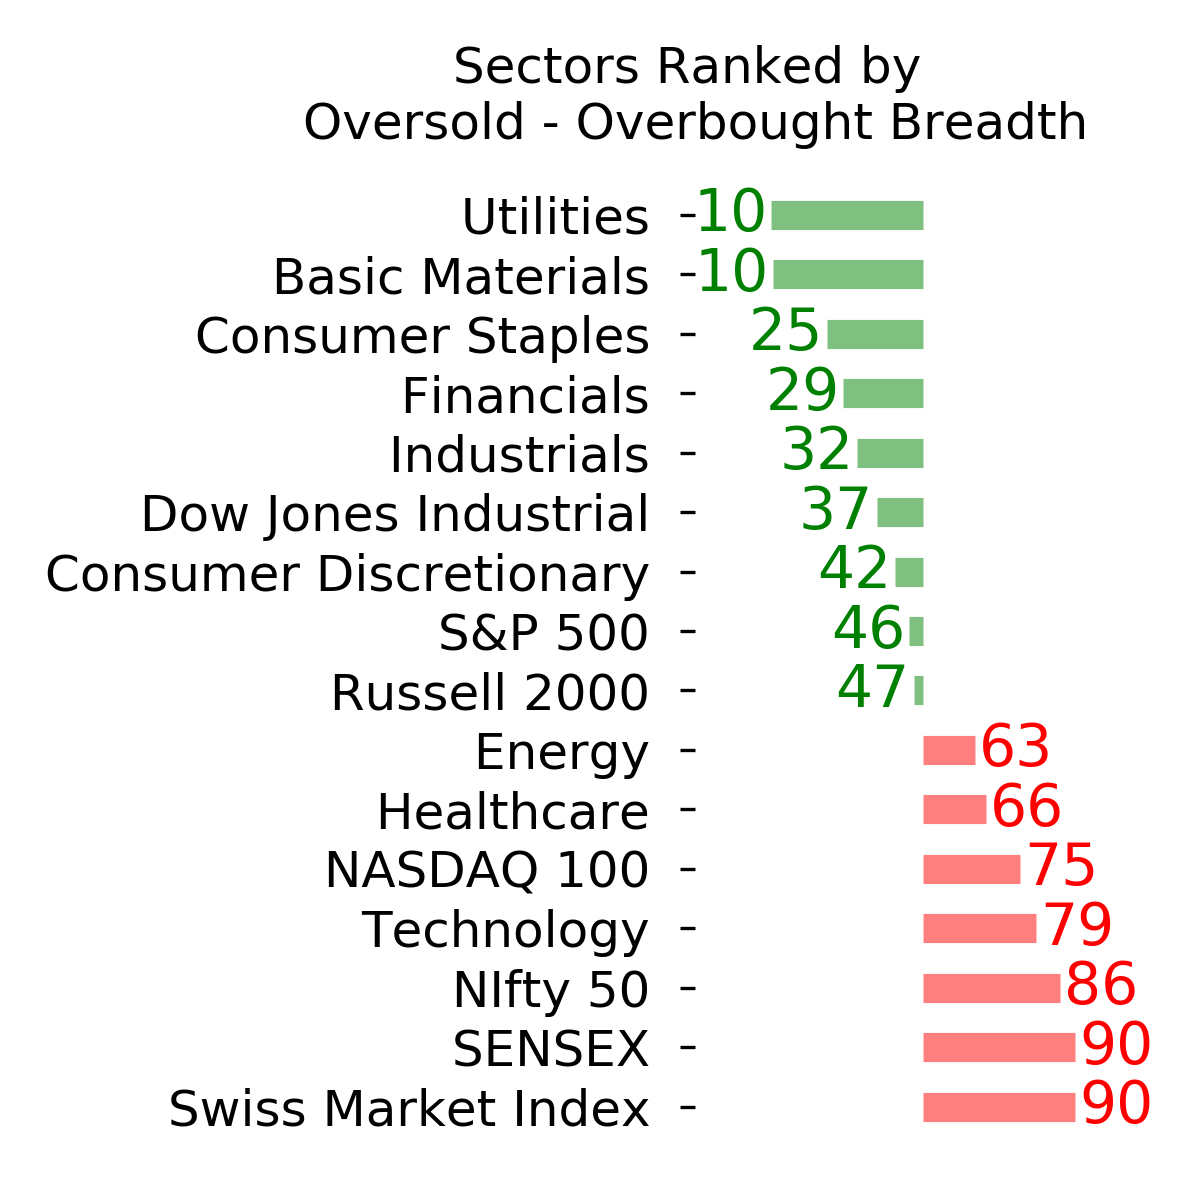
Ranks
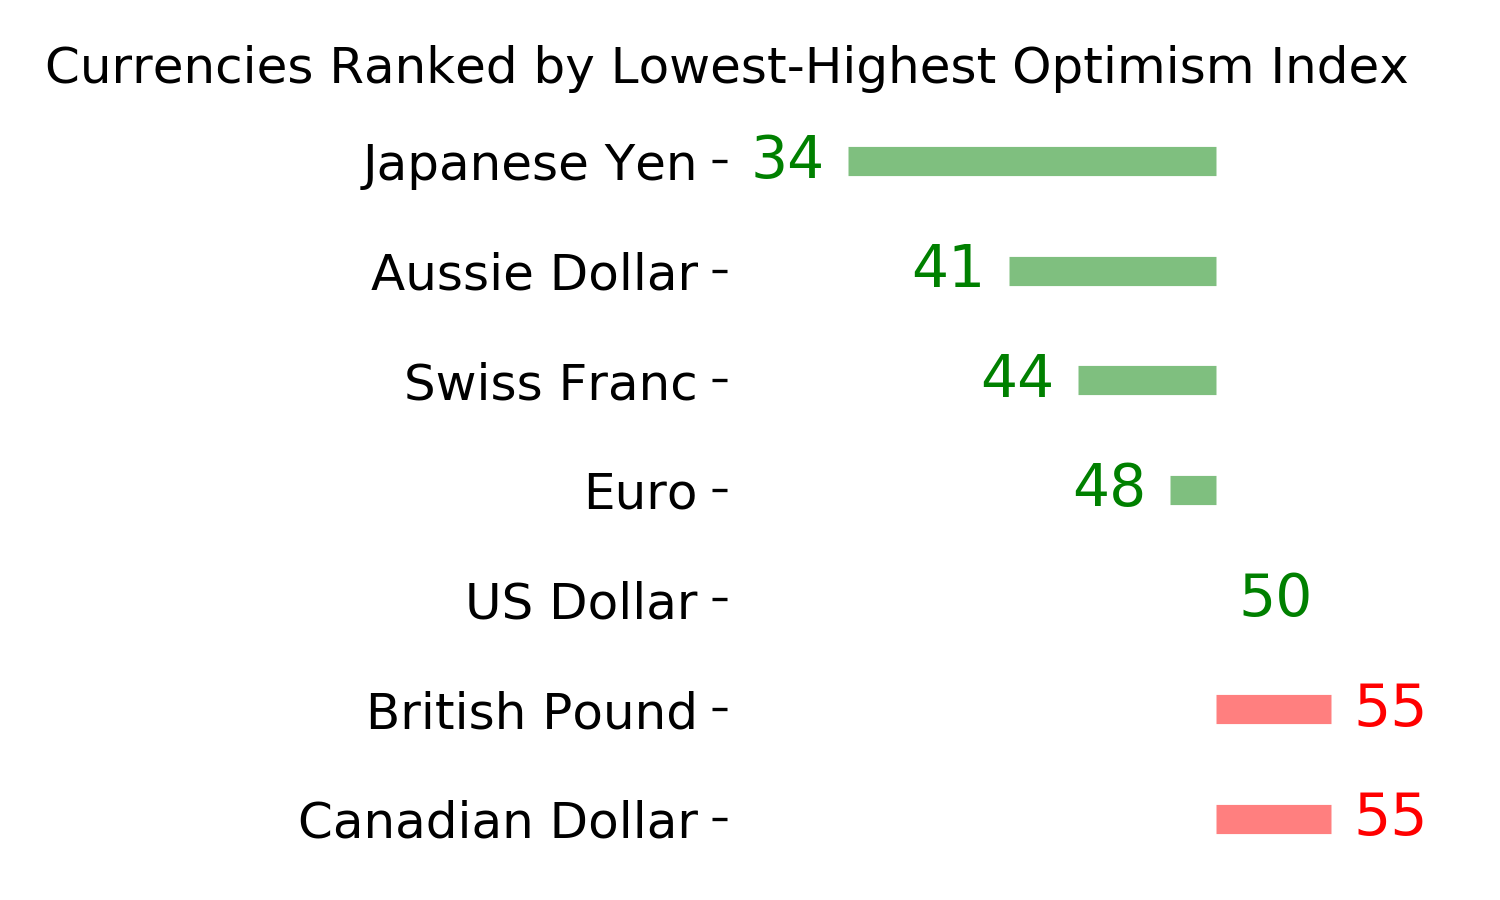
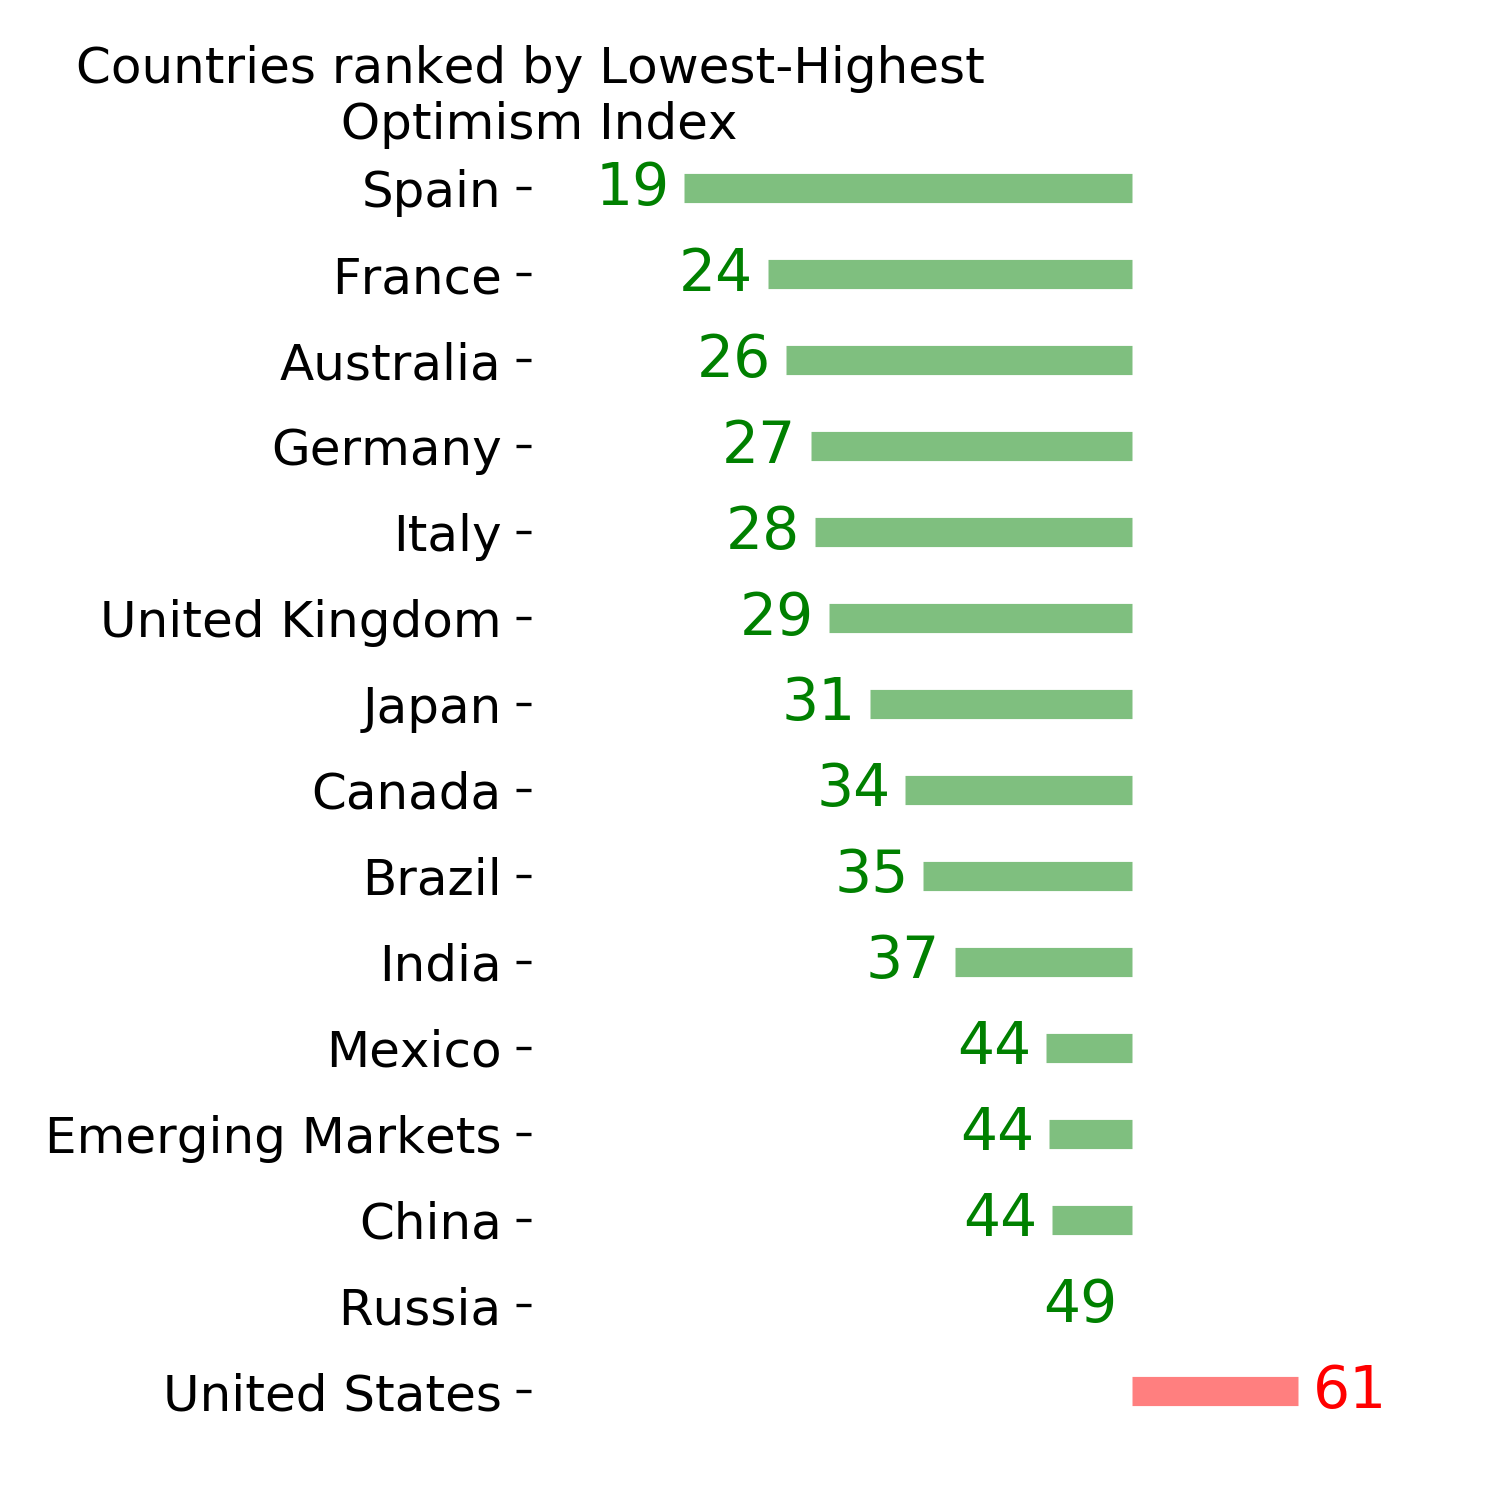
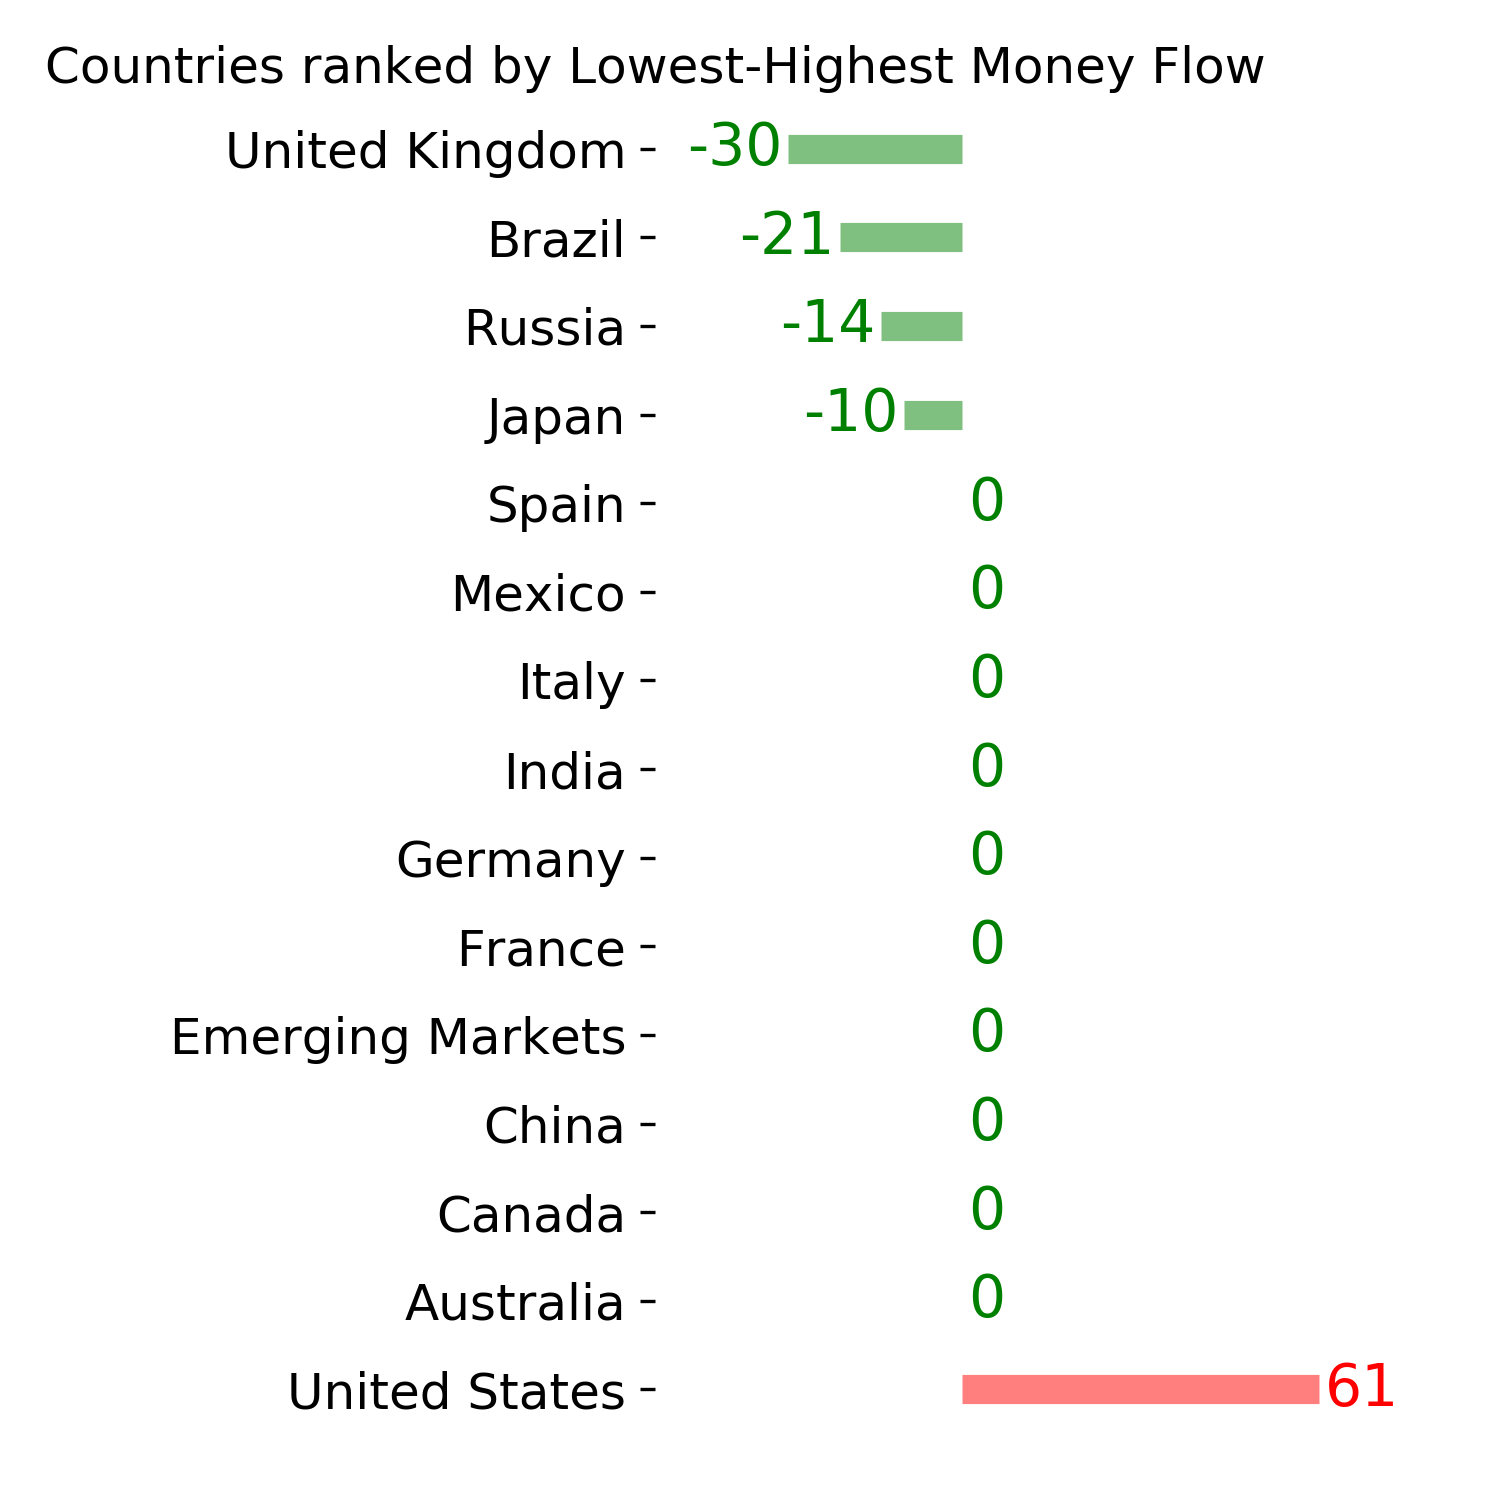
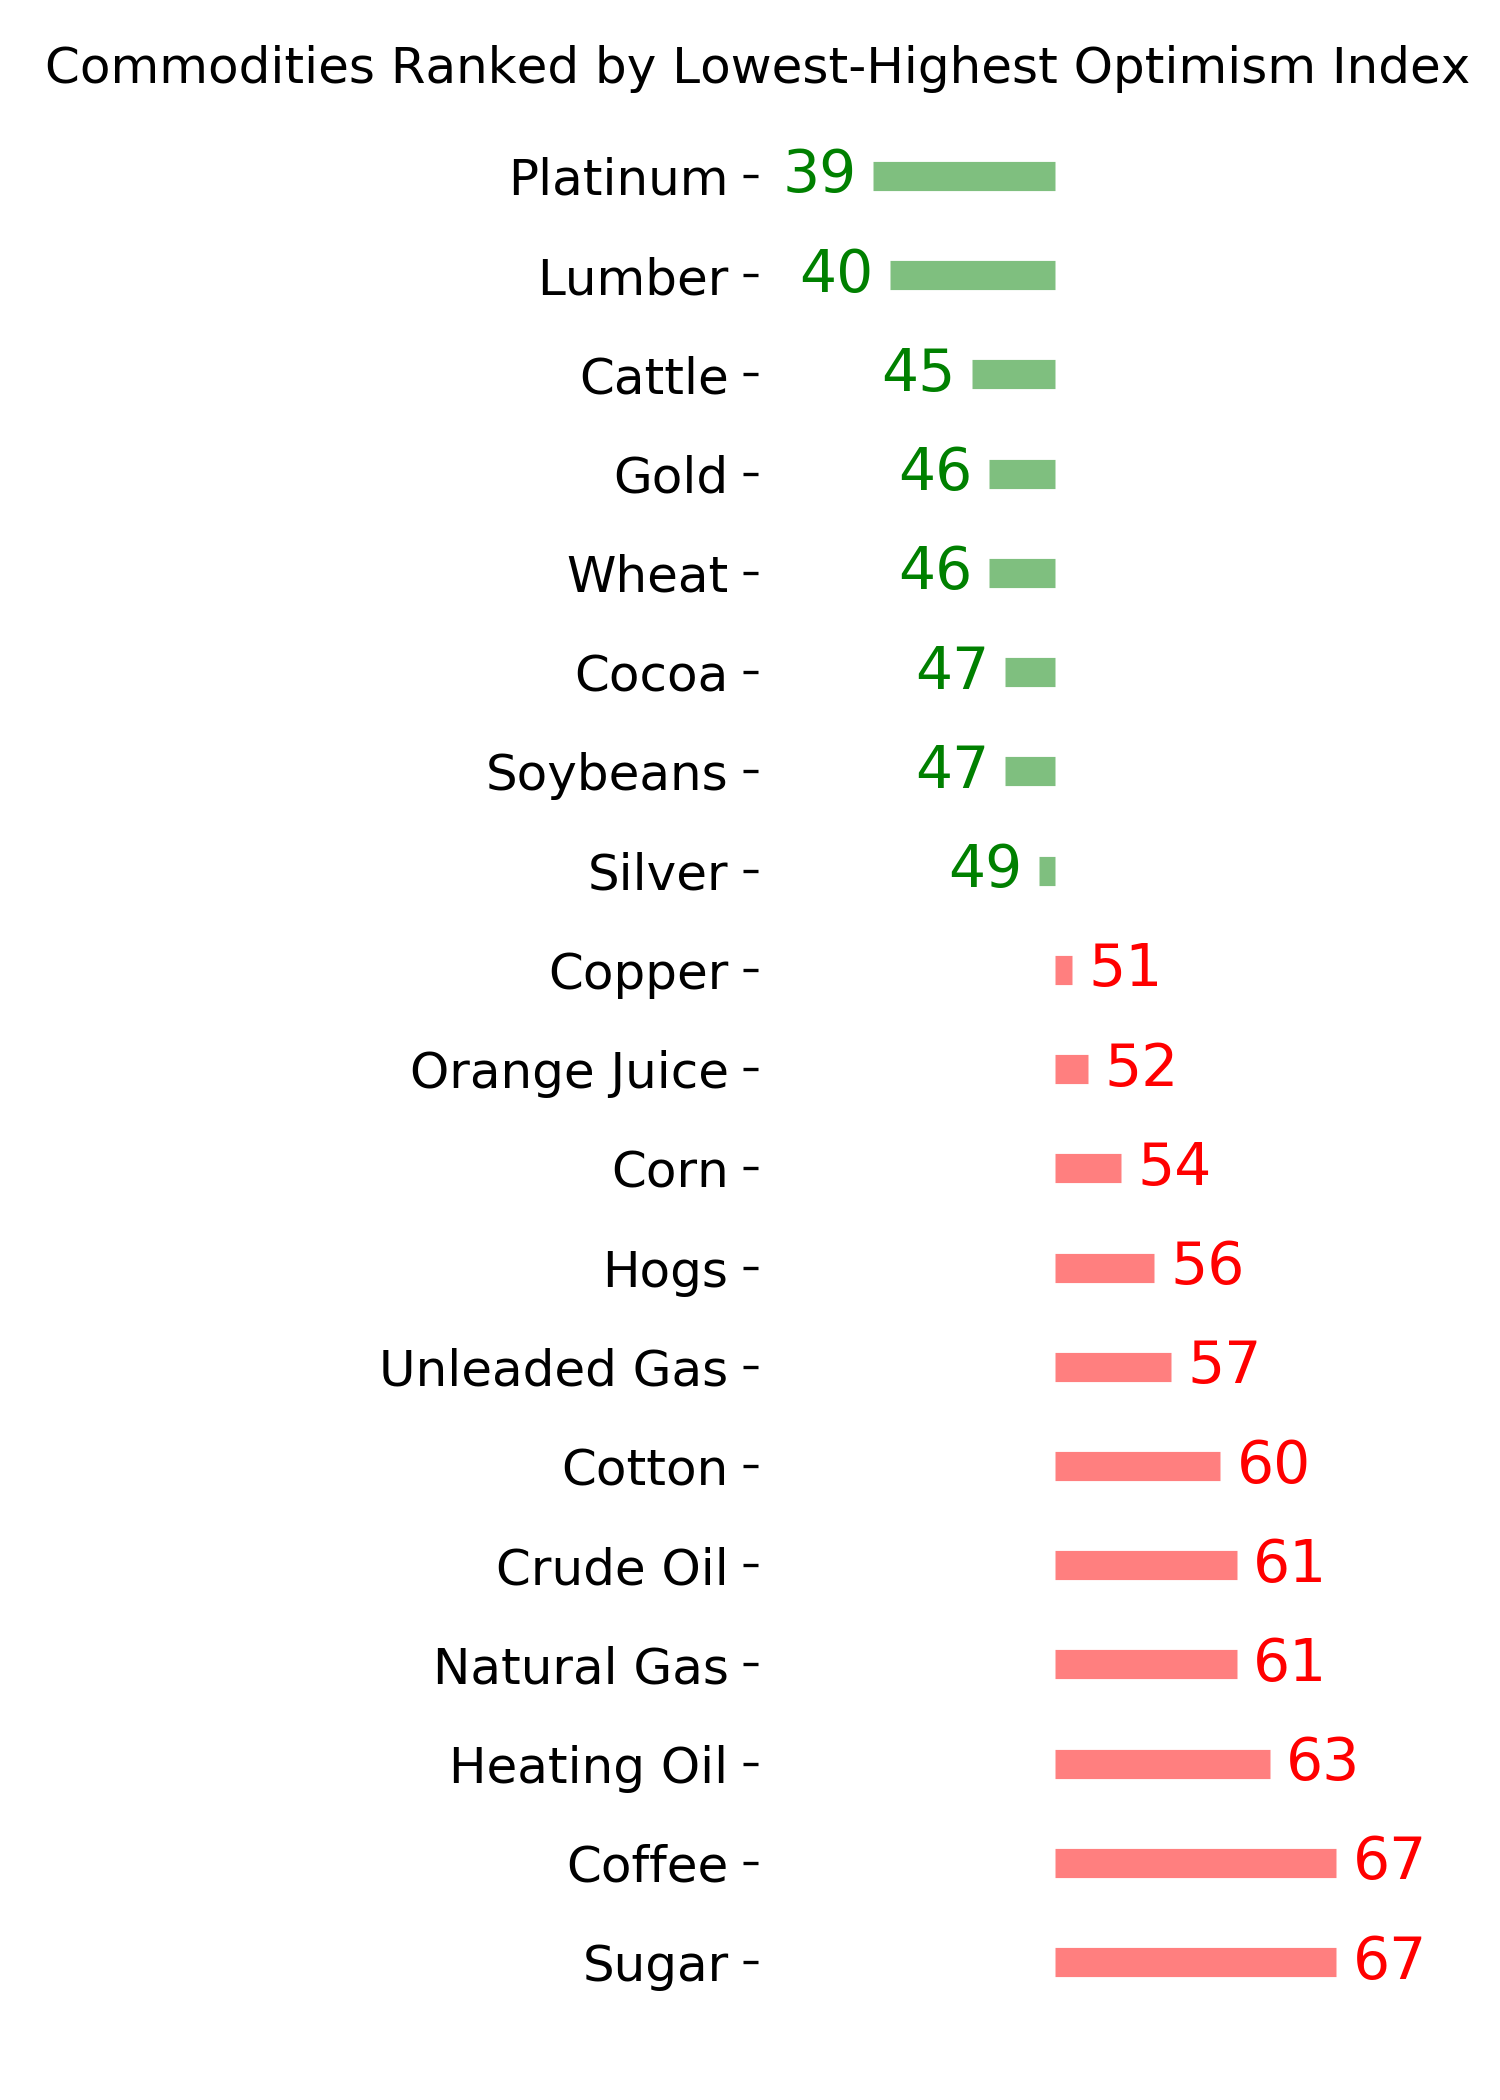
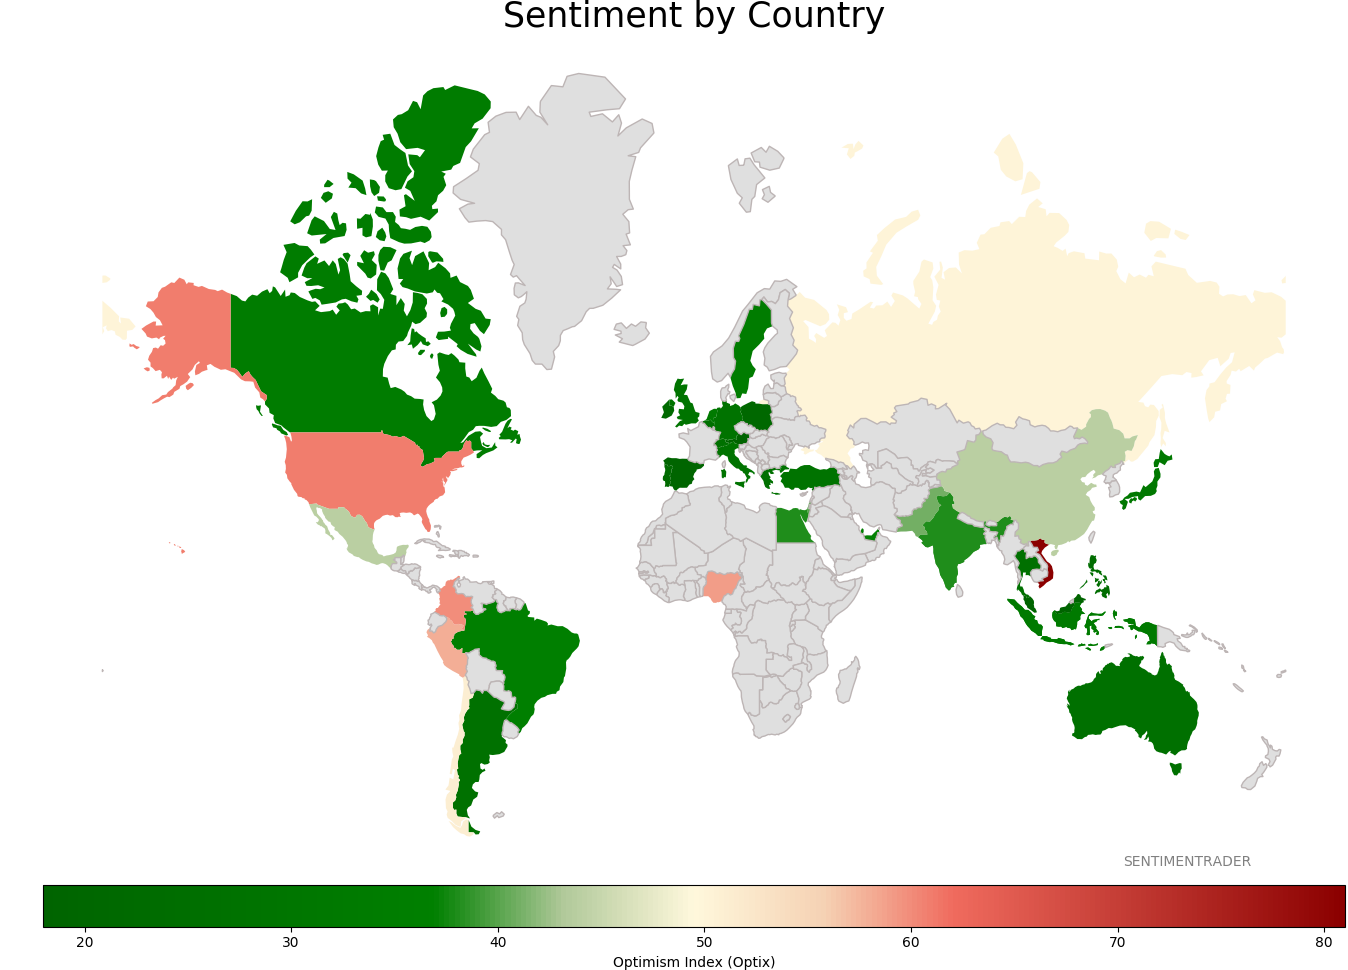
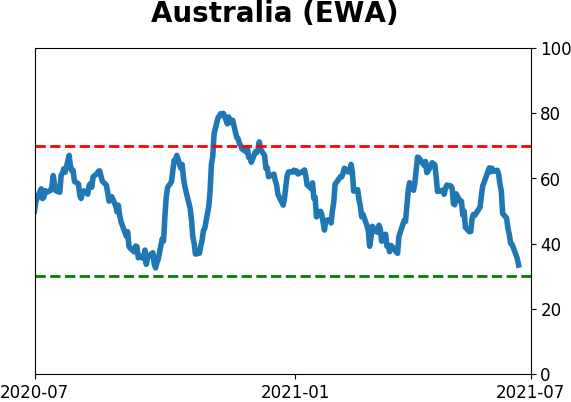
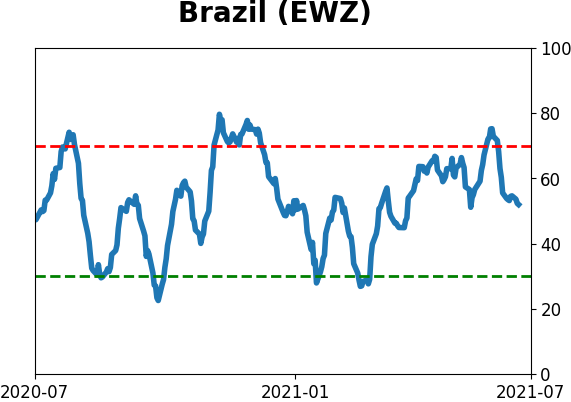
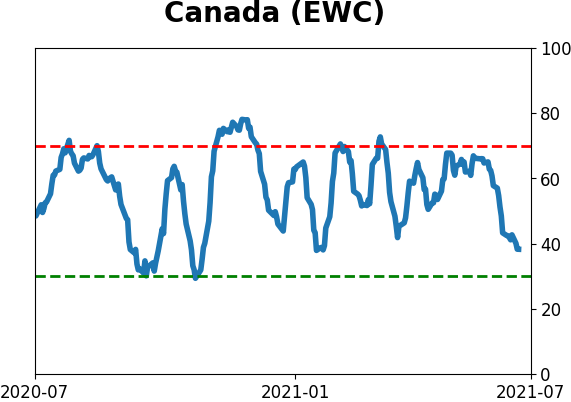
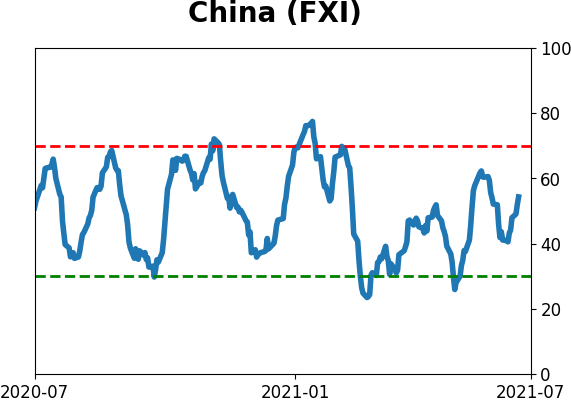
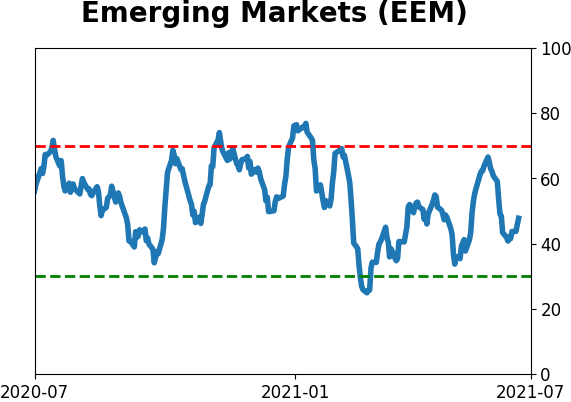
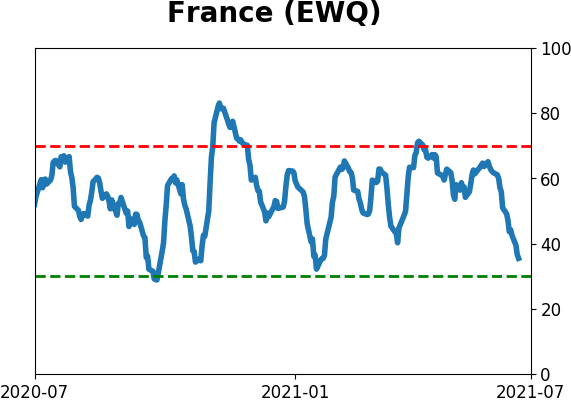
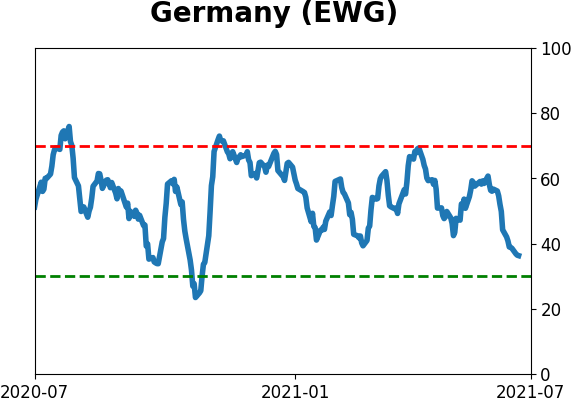
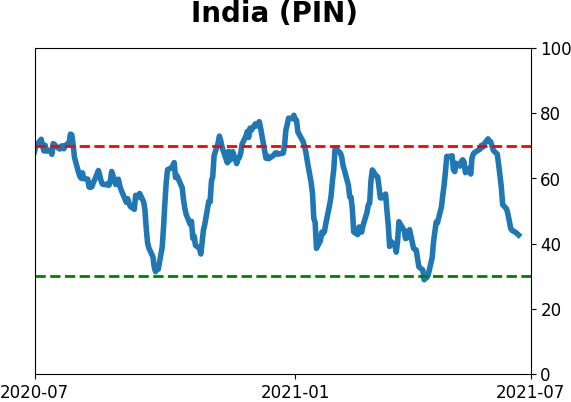
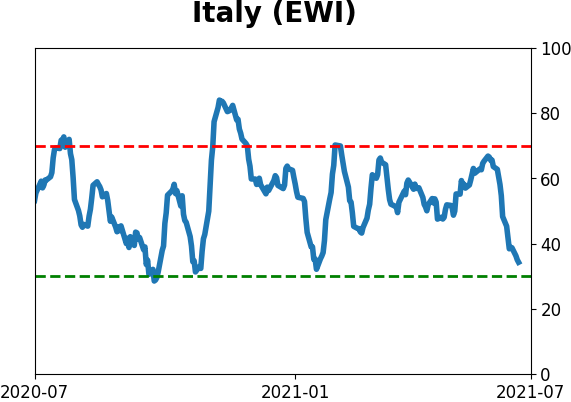
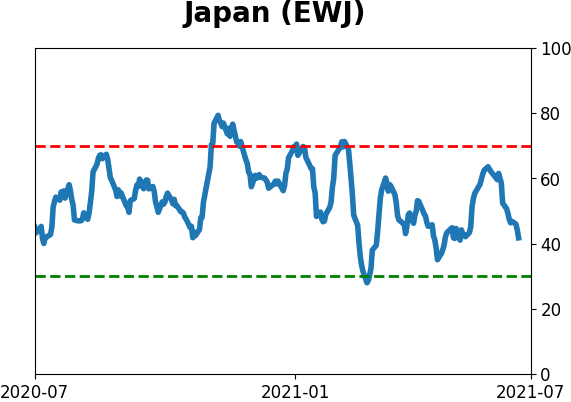
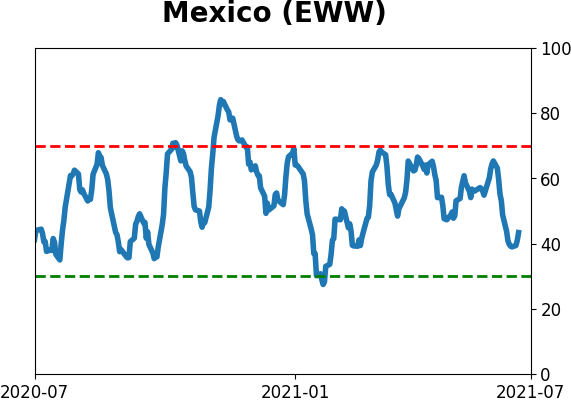
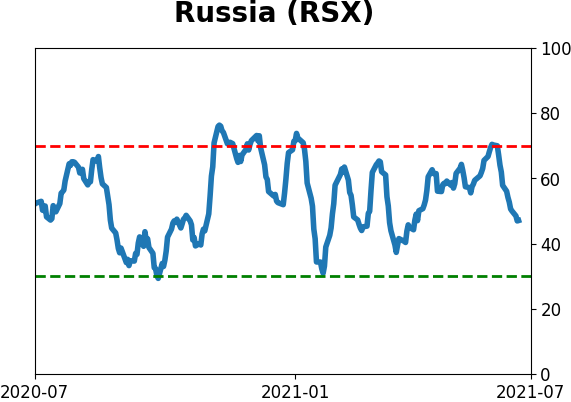
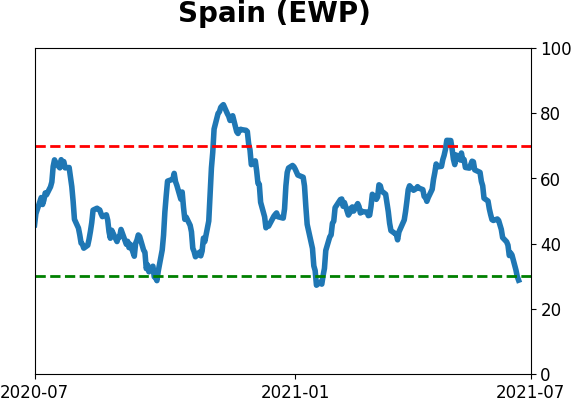
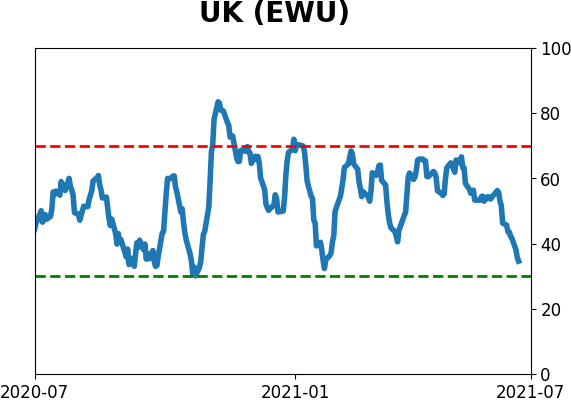
Sentiment Around The World
Optimism Index Thumbnails
|
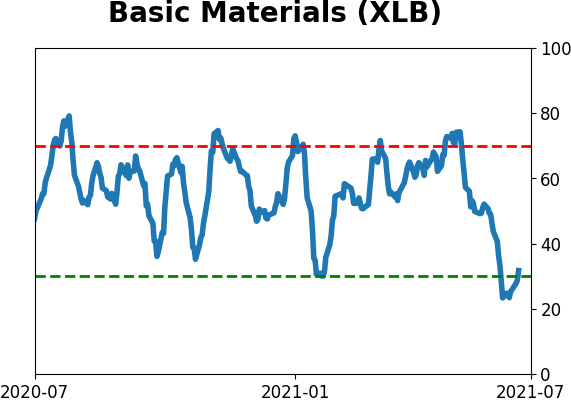
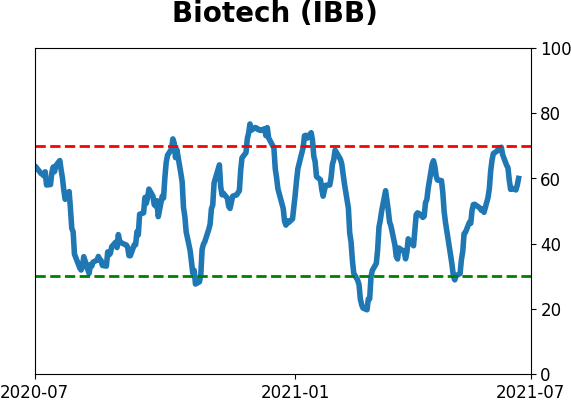
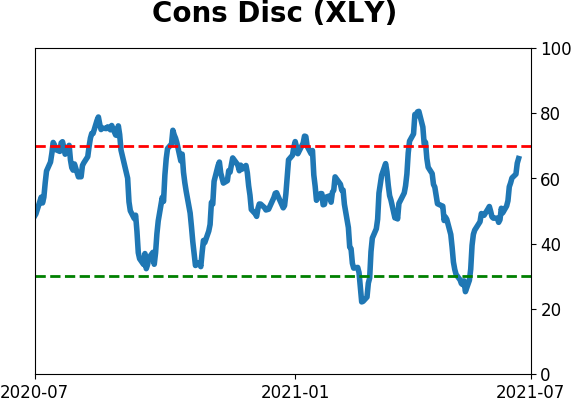
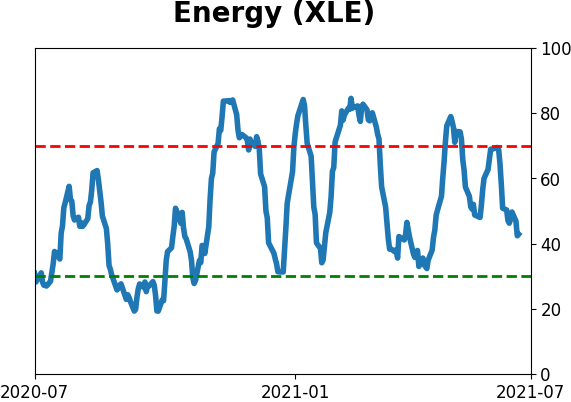
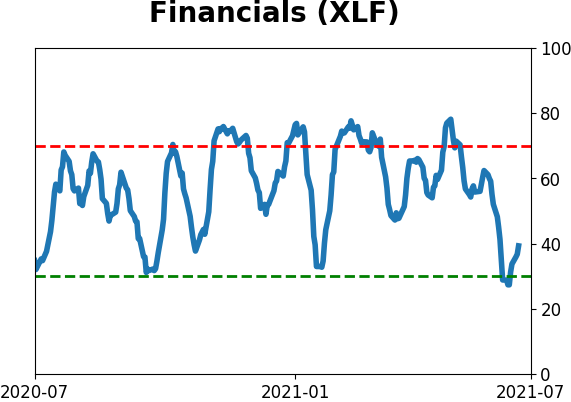
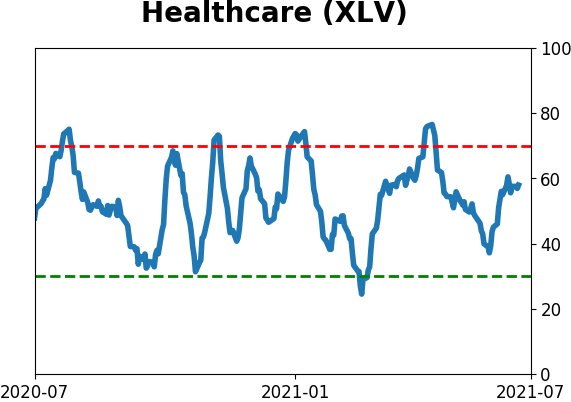
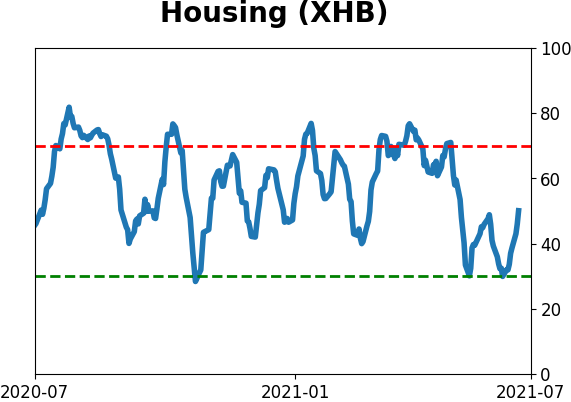
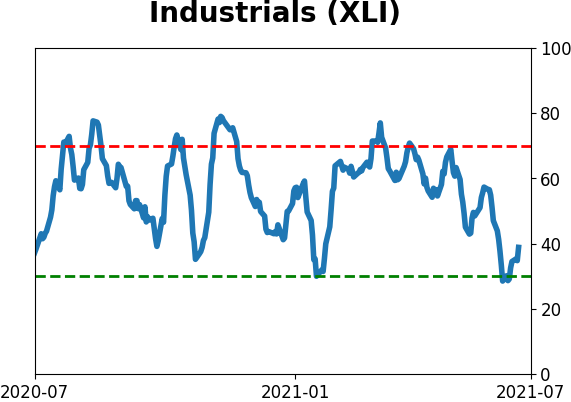
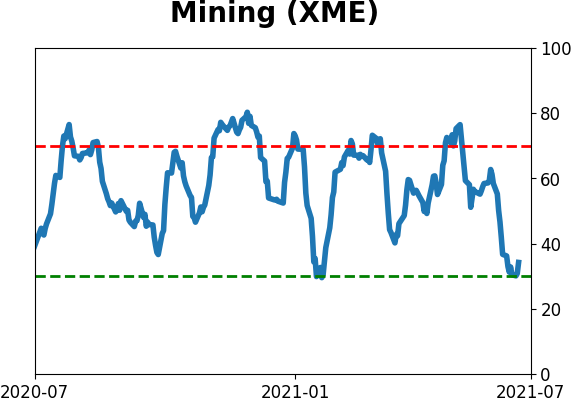
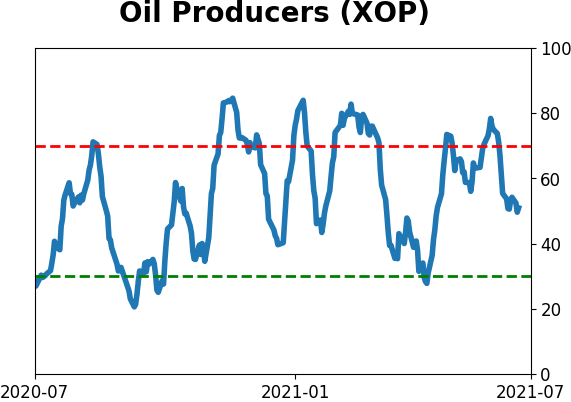
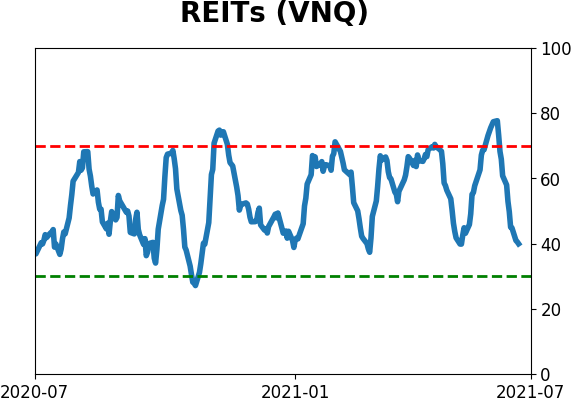
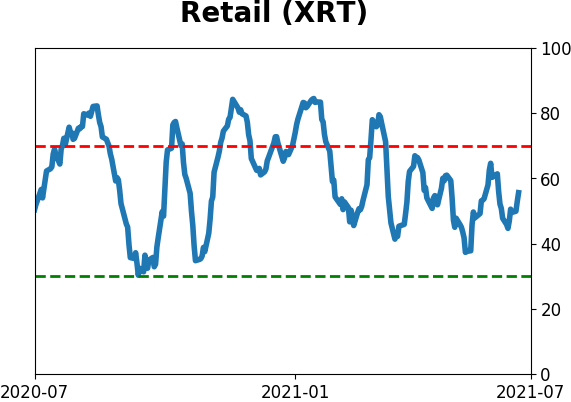
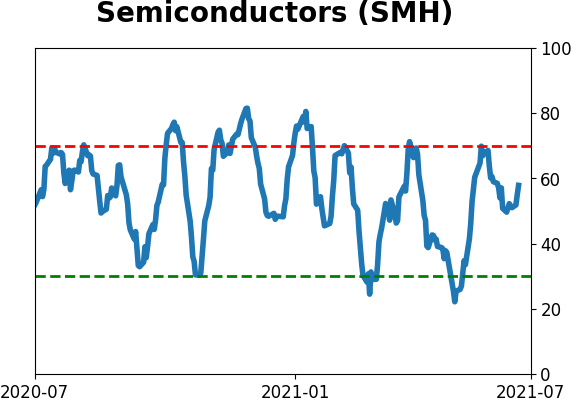
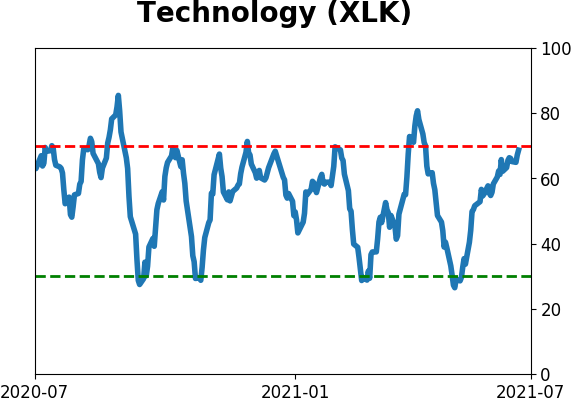
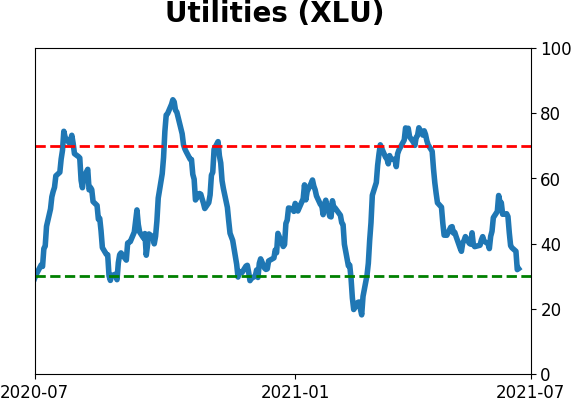
Sector ETF's - 10-Day Moving Average
|
|
|
Country ETF's - 10-Day Moving Average
|
|
|
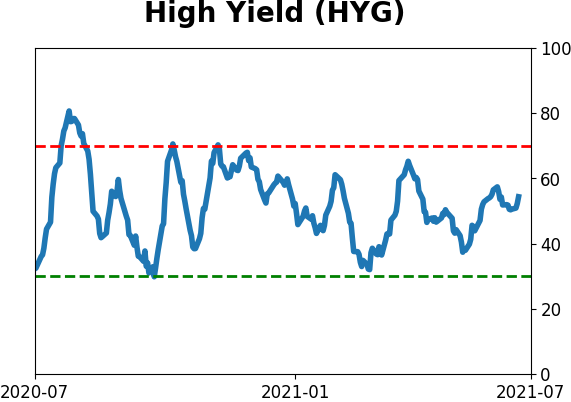
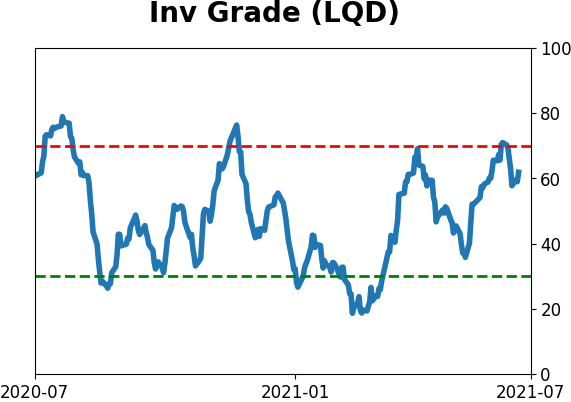
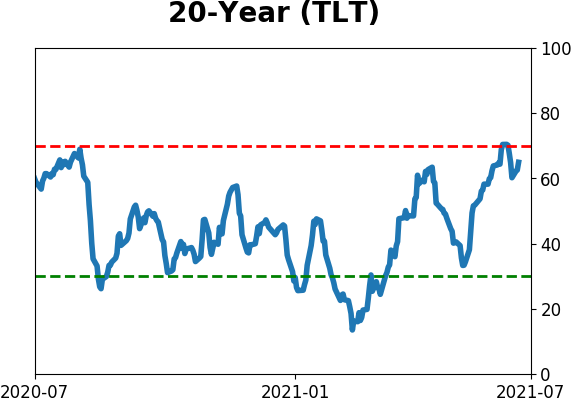
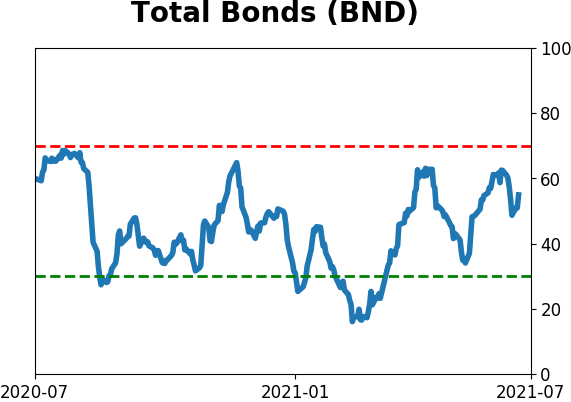
Bond ETF's - 10-Day Moving Average
|
|
|
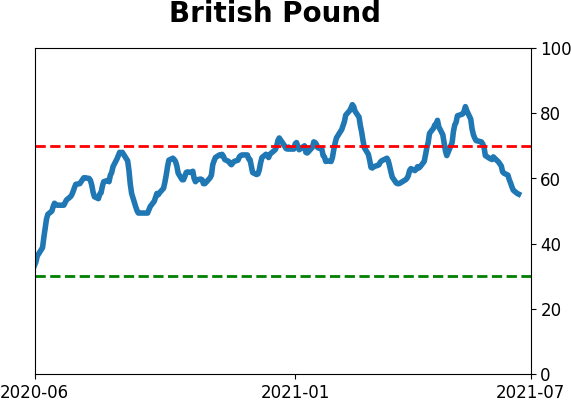
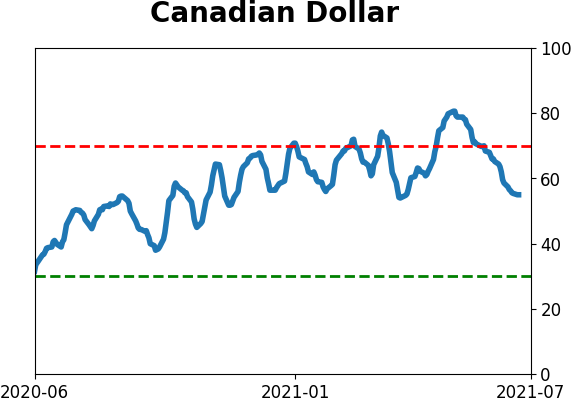
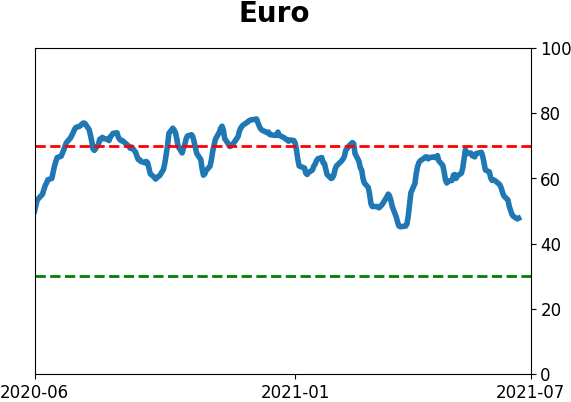
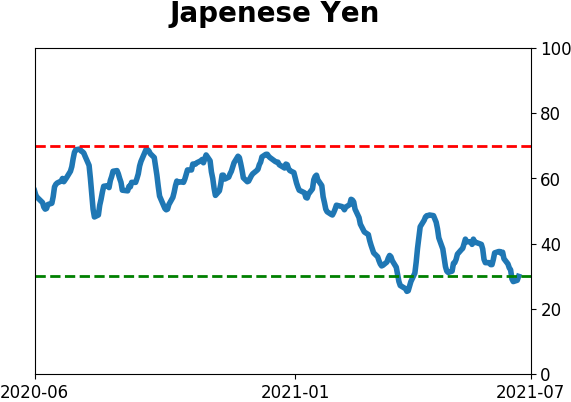
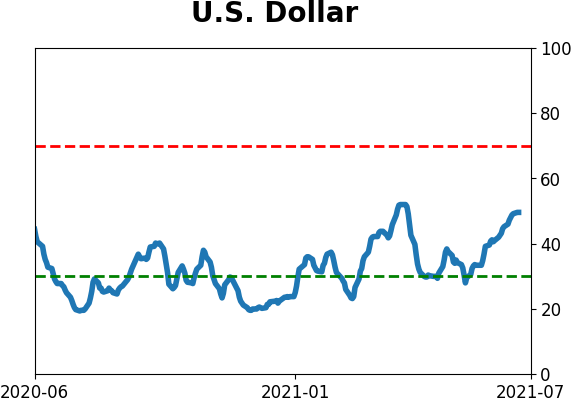
Currency ETF's - 5-Day Moving Average
|
|
|
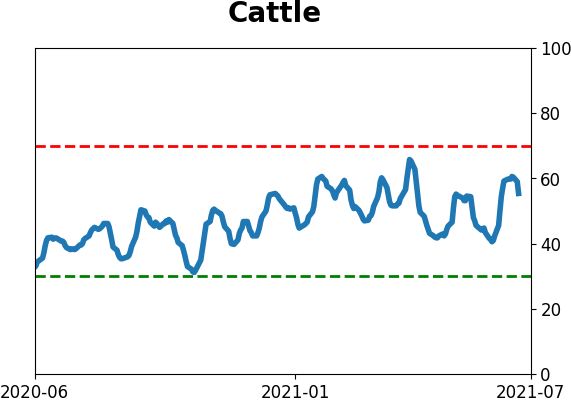
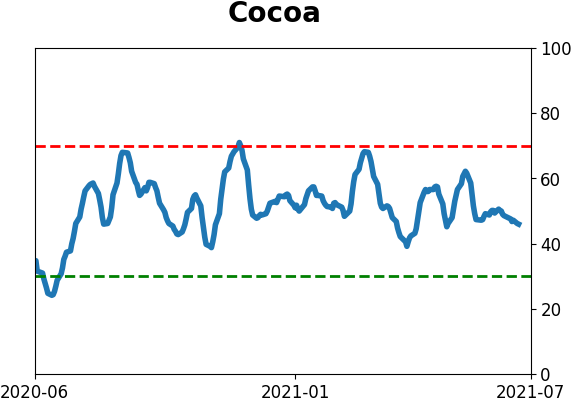
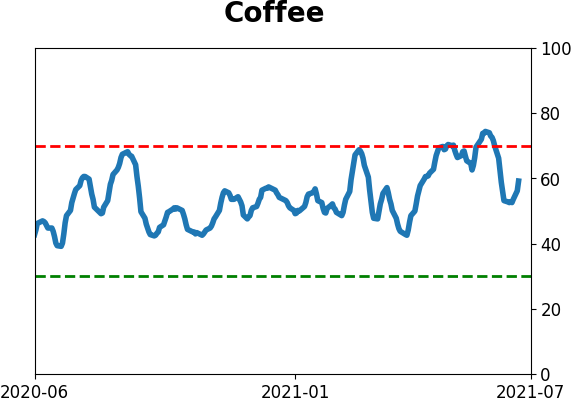
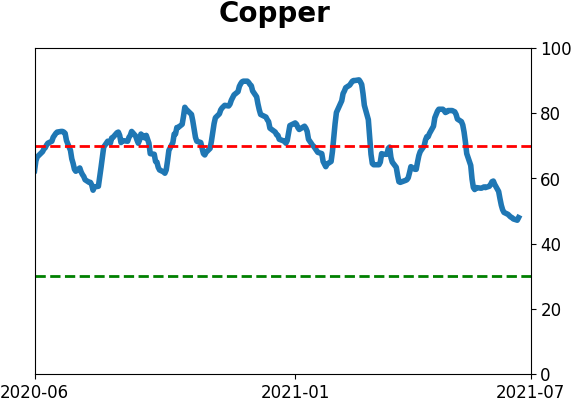
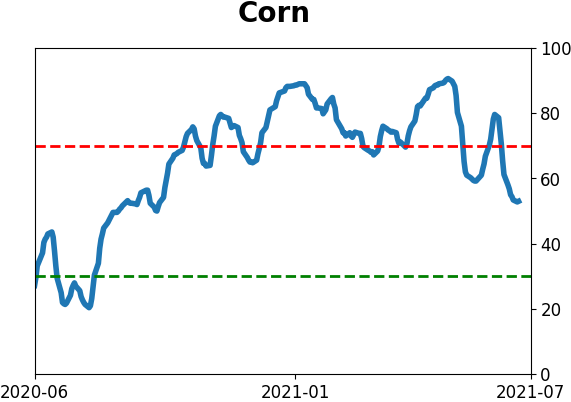
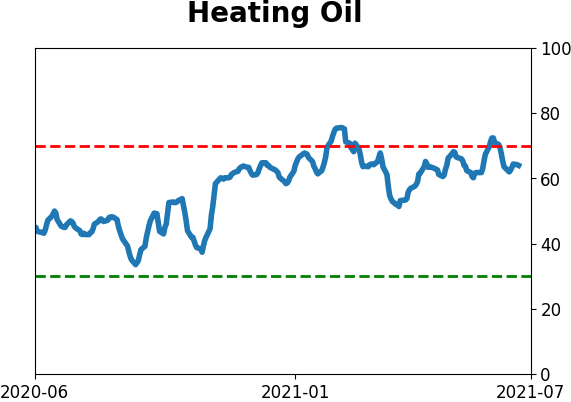
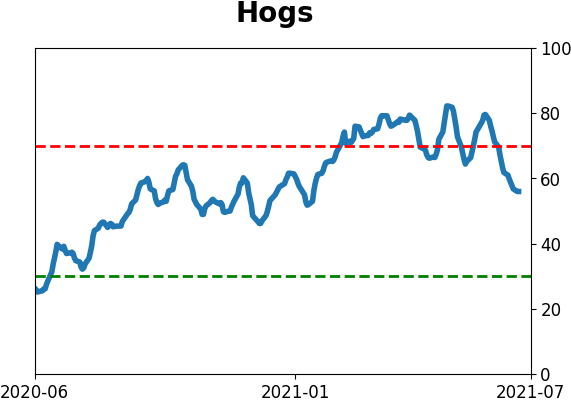
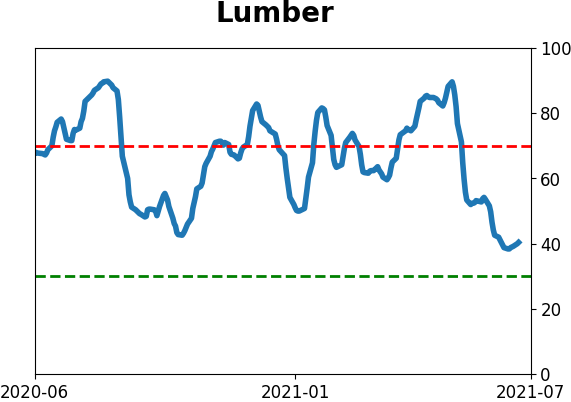
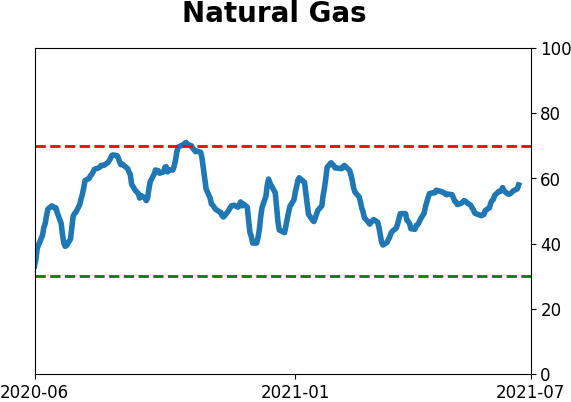
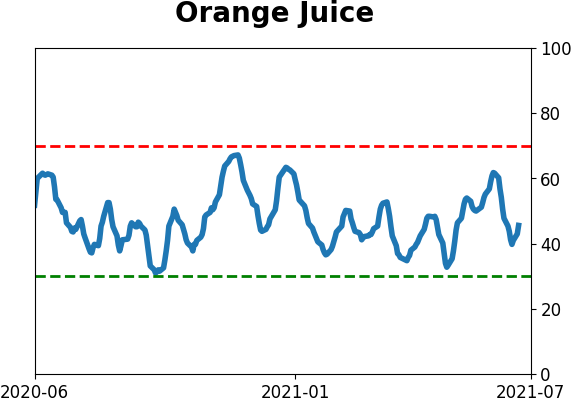
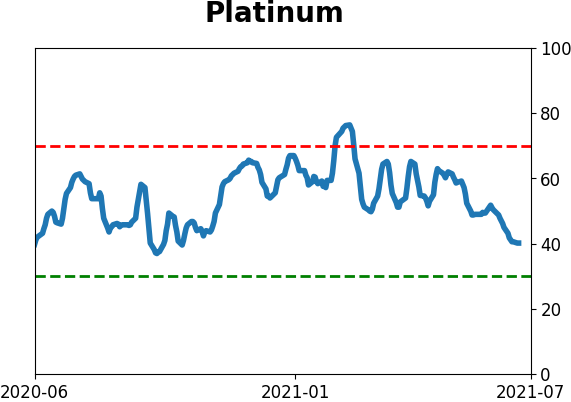
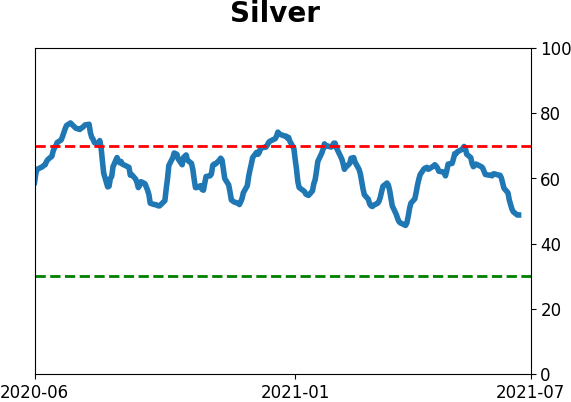
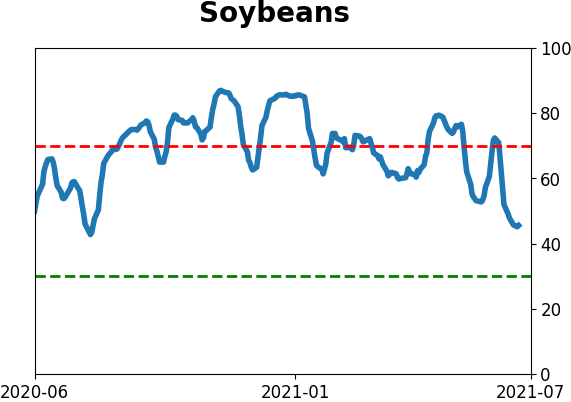
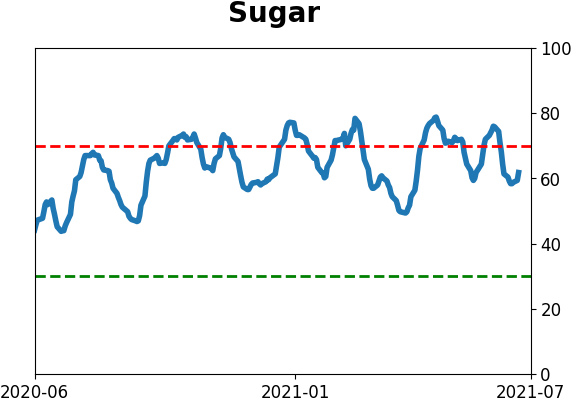
Commodity ETF's - 5-Day Moving Average
|
|