Headlines
|
|
This Is the Best Year Ever for Stocks and Commodities:
As we near the end of June, both stocks and commodities have rallied strongly for the year. Going back nearly 90 years, 2021 stands out as having the best combined gains in the S&P 500 and Bloomberg Commodity Index. That kind of momentum mostly favored stocks going forward, but not commodities.
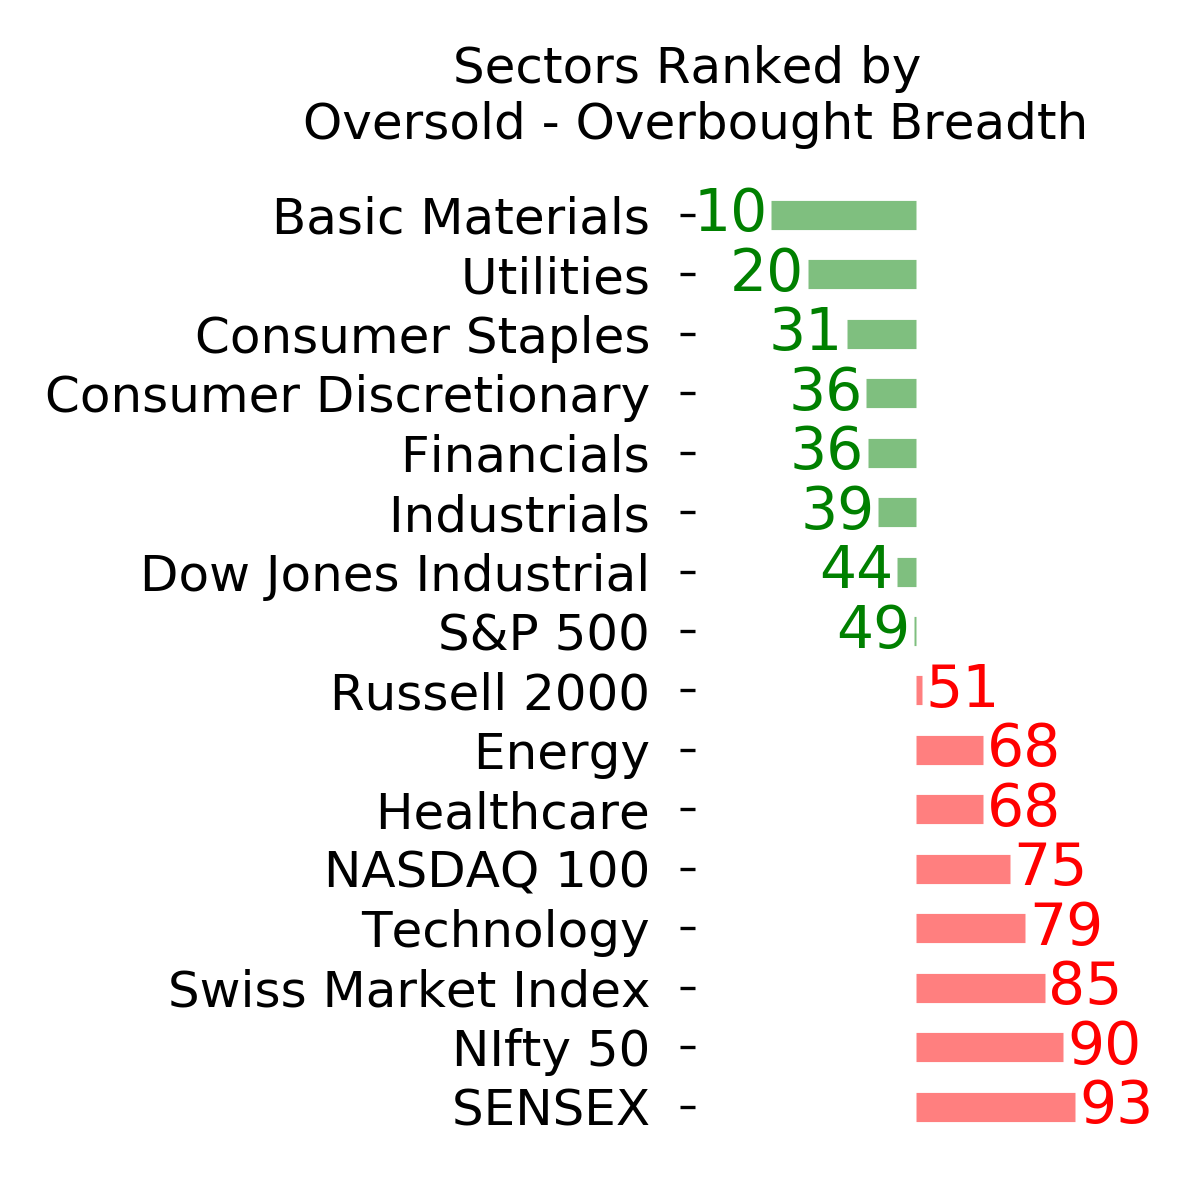
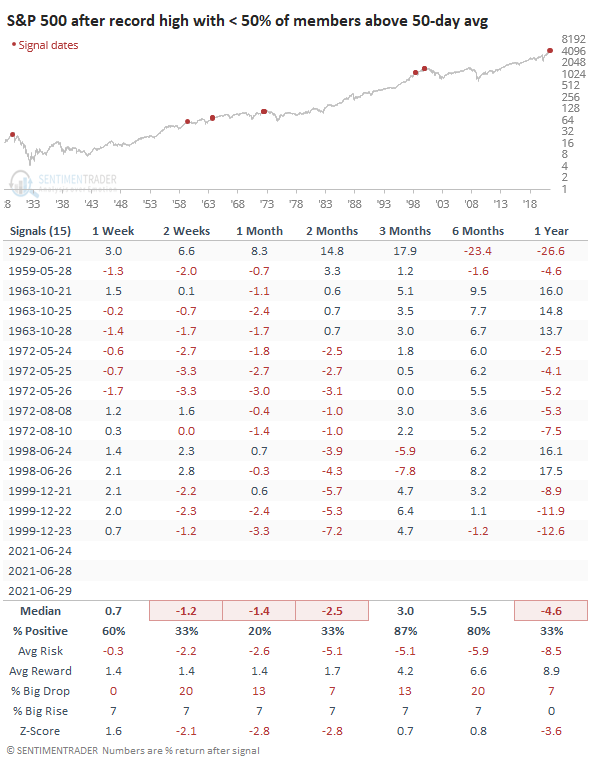
New high with few uptrends: Once again on Tuesday, the S&P 500 managed to close at a record high, and once again less than half of its stocks were above their 50-day moving averages. This is a remarkable divergence in fortunes between those pushing to new highs and those struggling to hold in medium-term uptrends. Out of 18 signals since 1927, 3 of them have triggered in the past 4 sessions. The rest of them have not been bullish.
Bottom Line:
See the Outlook & Allocations page for more details on these summaries STOCKS: Hold
The speculative frenzy in February is wrung out. Internal dynamics have mostly held up, with some exceptions. Many of our studies still show a mixed to poor short-term view, with medium- and long-term ones turning more positive. BONDS: Hold
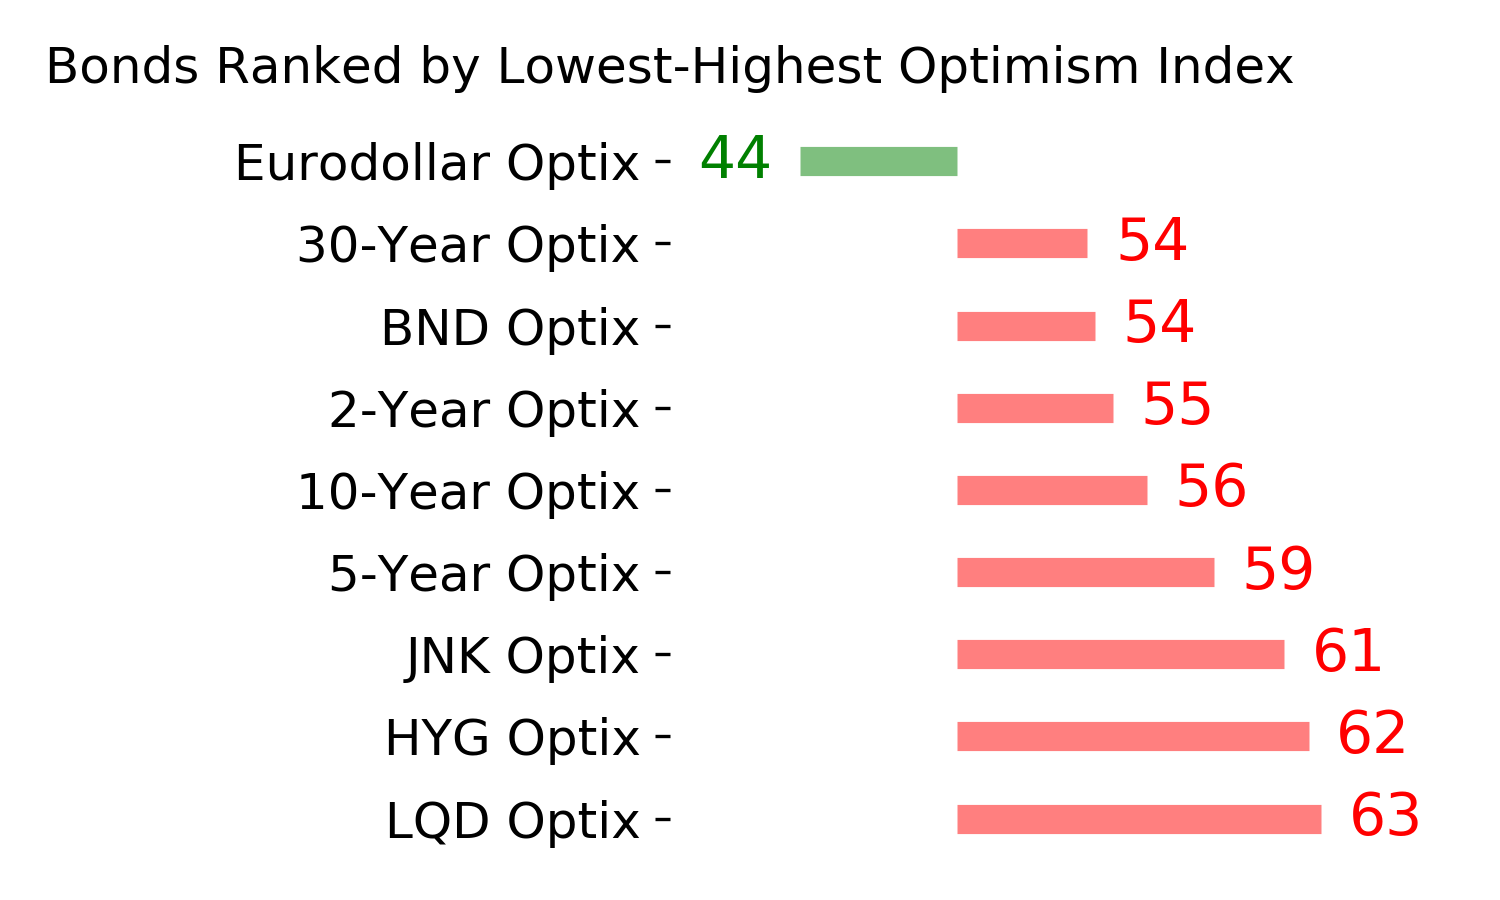
Various parts of the market got hit in March, with the lowest Bond Optimism Index we usually see during healthy environments. After a shaky couple of weeks, the broad bond market has modestly recovered. Not a big edge here either way. GOLD: Hold
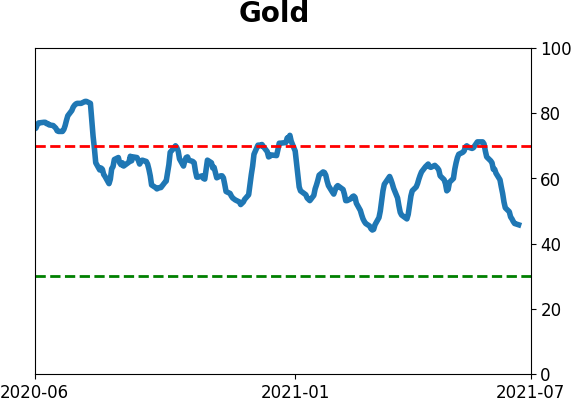
Gold and miners have done very well, recovering above long-term trend lines. The issue is that both have tended to perform poorly after similar situations - will have to wait and see how it plays out.
|
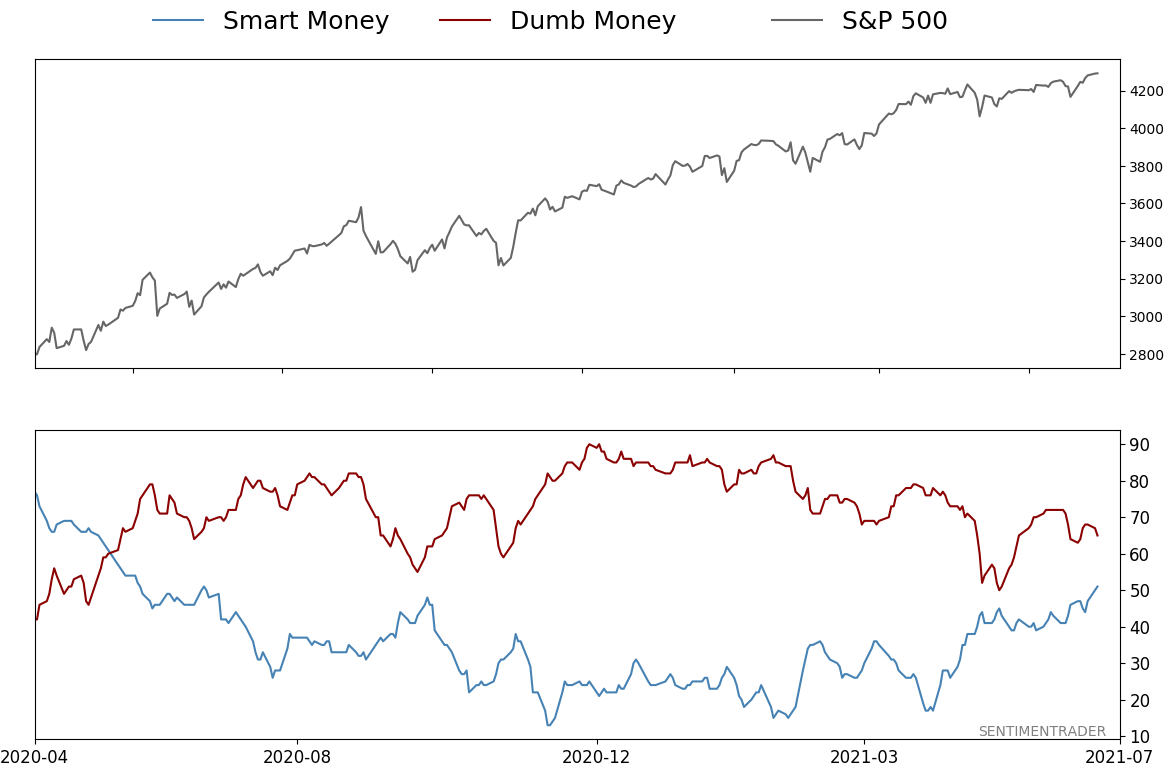
Smart / Dumb Money Confidence
|
Smart Money Confidence: 51%
Dumb Money Confidence: 65%
|
|
Risk Levels
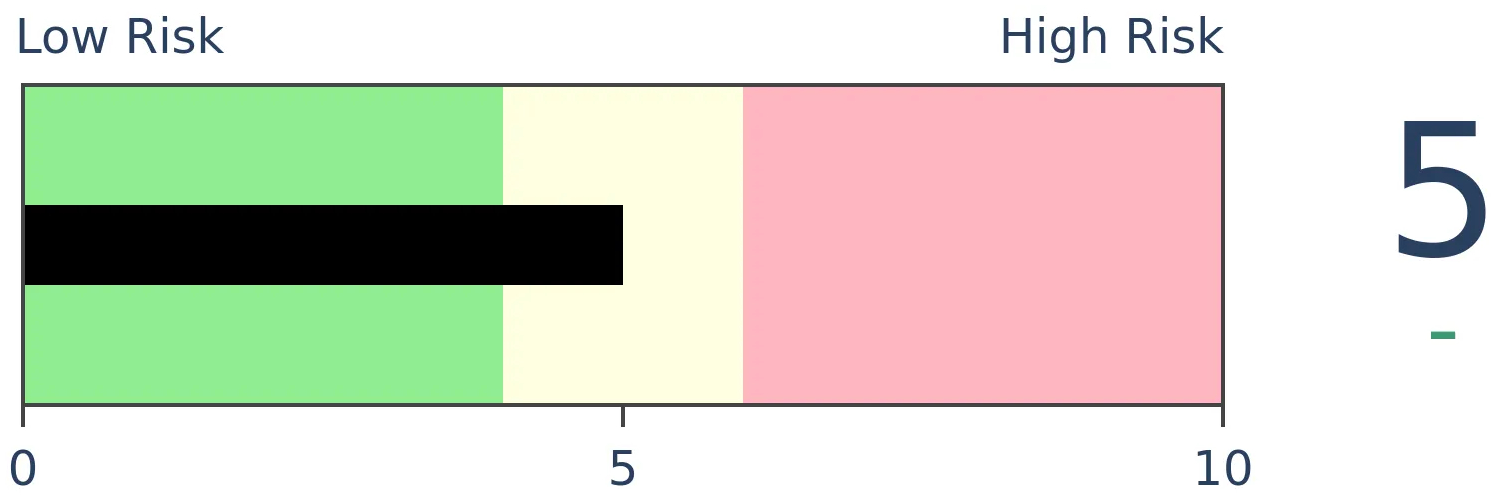
Stocks Short-Term
|
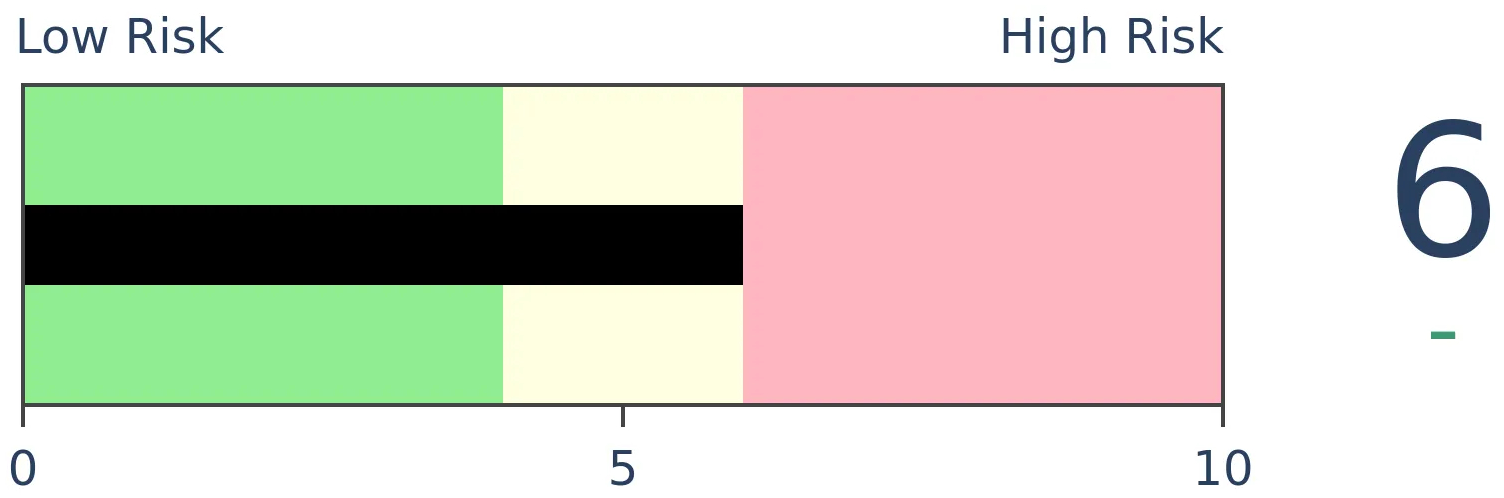
Stocks Medium-Term

|
|
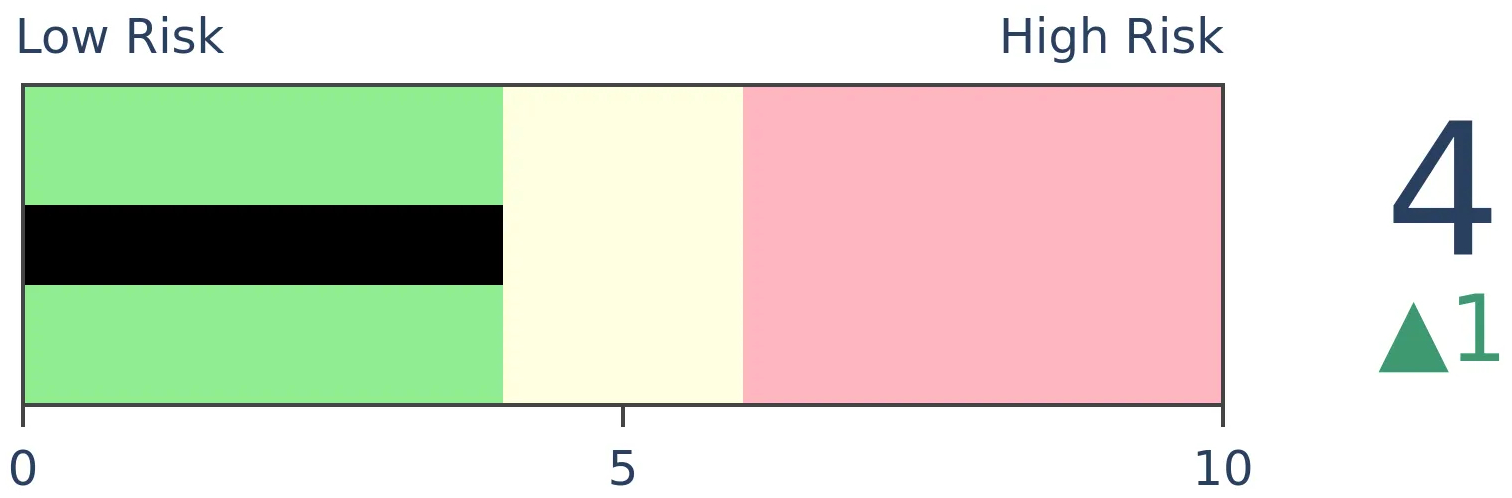
Bonds
|
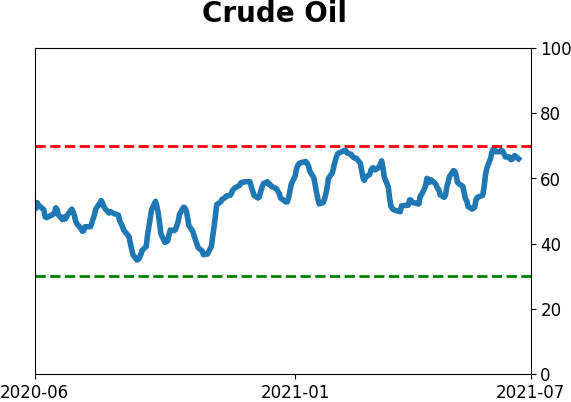
Crude Oil

|
|
Gold
|
Agriculture
|
|
Research
BOTTOM LINE
As we near the end of June, both stocks and commodities have rallied strongly for the year. Going back nearly 90 years, 2021 stands out as having the best combined gains in the S&P 500 and Bloomberg Commodity Index. That kind of momentum mostly favored stocks going forward, but not commodities.
FORECAST / TIMEFRAME
None
|
It's been a heckuva year, and it isn't even July. Not only have stocks enjoyed an almost uninterrupted advance, but even lowly commodities have rallied hard.
As the Wall Street Journal notes:
"Stocks and commodities are surging together in a way few on Wall Street have ever seen, a sign that demand for riskier investments remains robust.
The S&P 500 and S&P GSCI gauge of commodities enter the last few days of the second quarter up about 8% and 13% for the period, respectively. This would mark the first time that both indexes climbed at least 5% in five consecutive quarters, according to a Dow Jones Market Data analysis of figures going back 50 years."
When we look at year-to-date (YTD) returns approximately through the end of June, this year stands out above all others. The S&P 500 and the Bloomberg Commodity Index have each rallied at least 14.2% YTD, surpassing 1976 as the best combined year for the two asset classes.
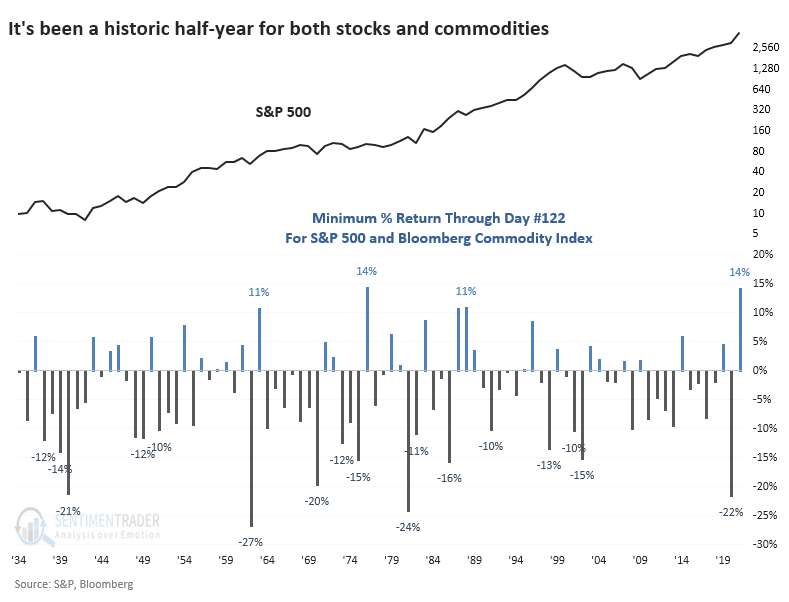
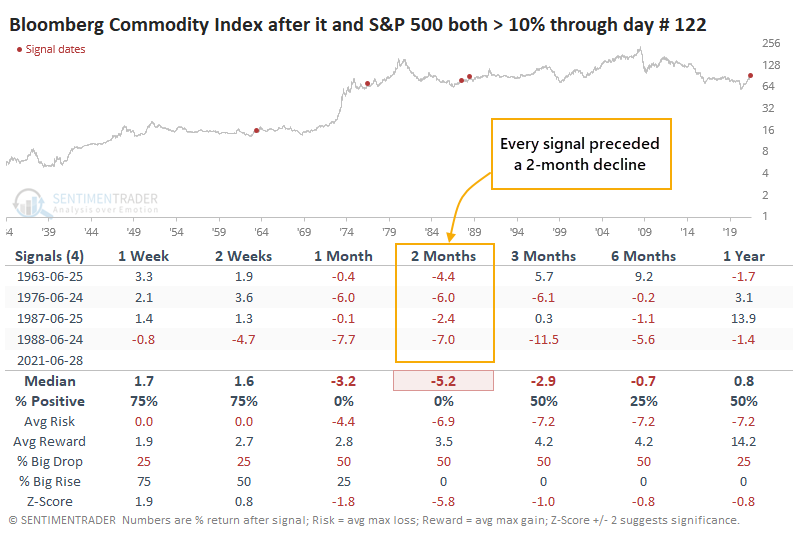
We can see from the chart that there have only been a few times when both stocks and commodities rallied at least 10% through June, the last time being more than 30 years ago. The table below shows how the S&P fared after those dates.

Each showed a negative return somewhere between 2 - 8 weeks later, but only one of them ended up leading to a major drop, which was Black Monday in October 1987.
For commodities, it preceded more consistent weakness, with losses each time over the next two months.
Surely, it's hard to put much weight on a sample size of four, so if we relax the parameters to include any year when both assets were up at least 5% through this part of the year, we can triple the sample.
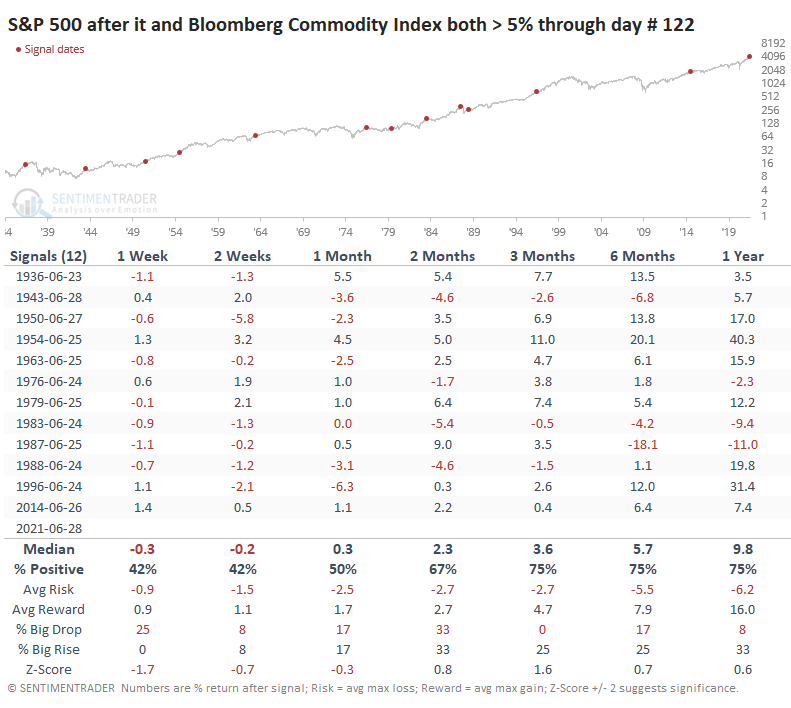
Over the next couple of weeks, the S&P pulled back or showed only a modest advance, except for 1954. Stocks took off that summer and never looked back. The others see-sawed somewhat but still generally rose over the rest of the year. There were only three losses over the next three months, and they were all relatively small.
It was less benign for commodities, especially over the next 1-2 months.
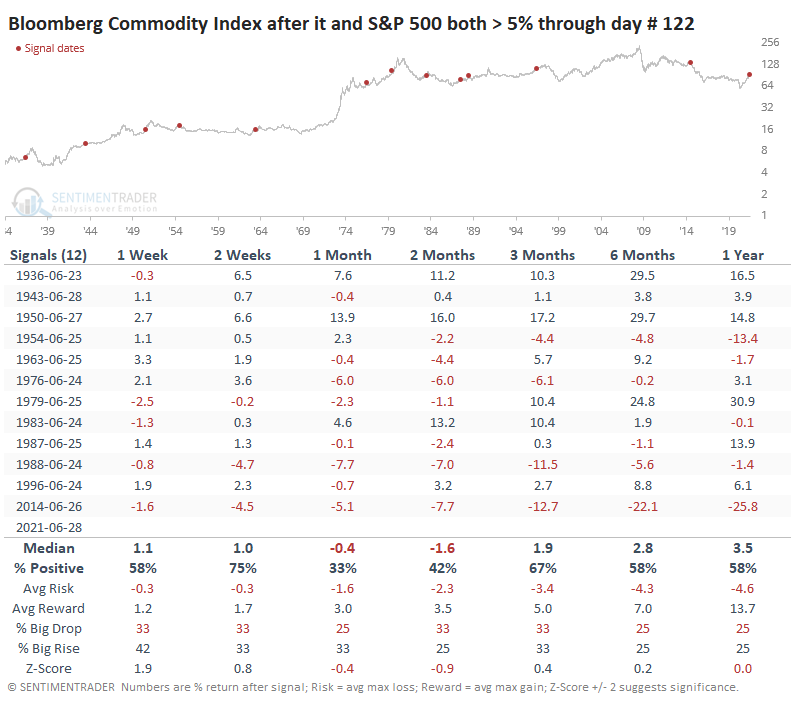
Over the past 60 years, the Bloomberg Commodity Index declined over the next 1 - 2 months every time but once. There are quite a few headwinds for commodities currently, and this appears to be another.
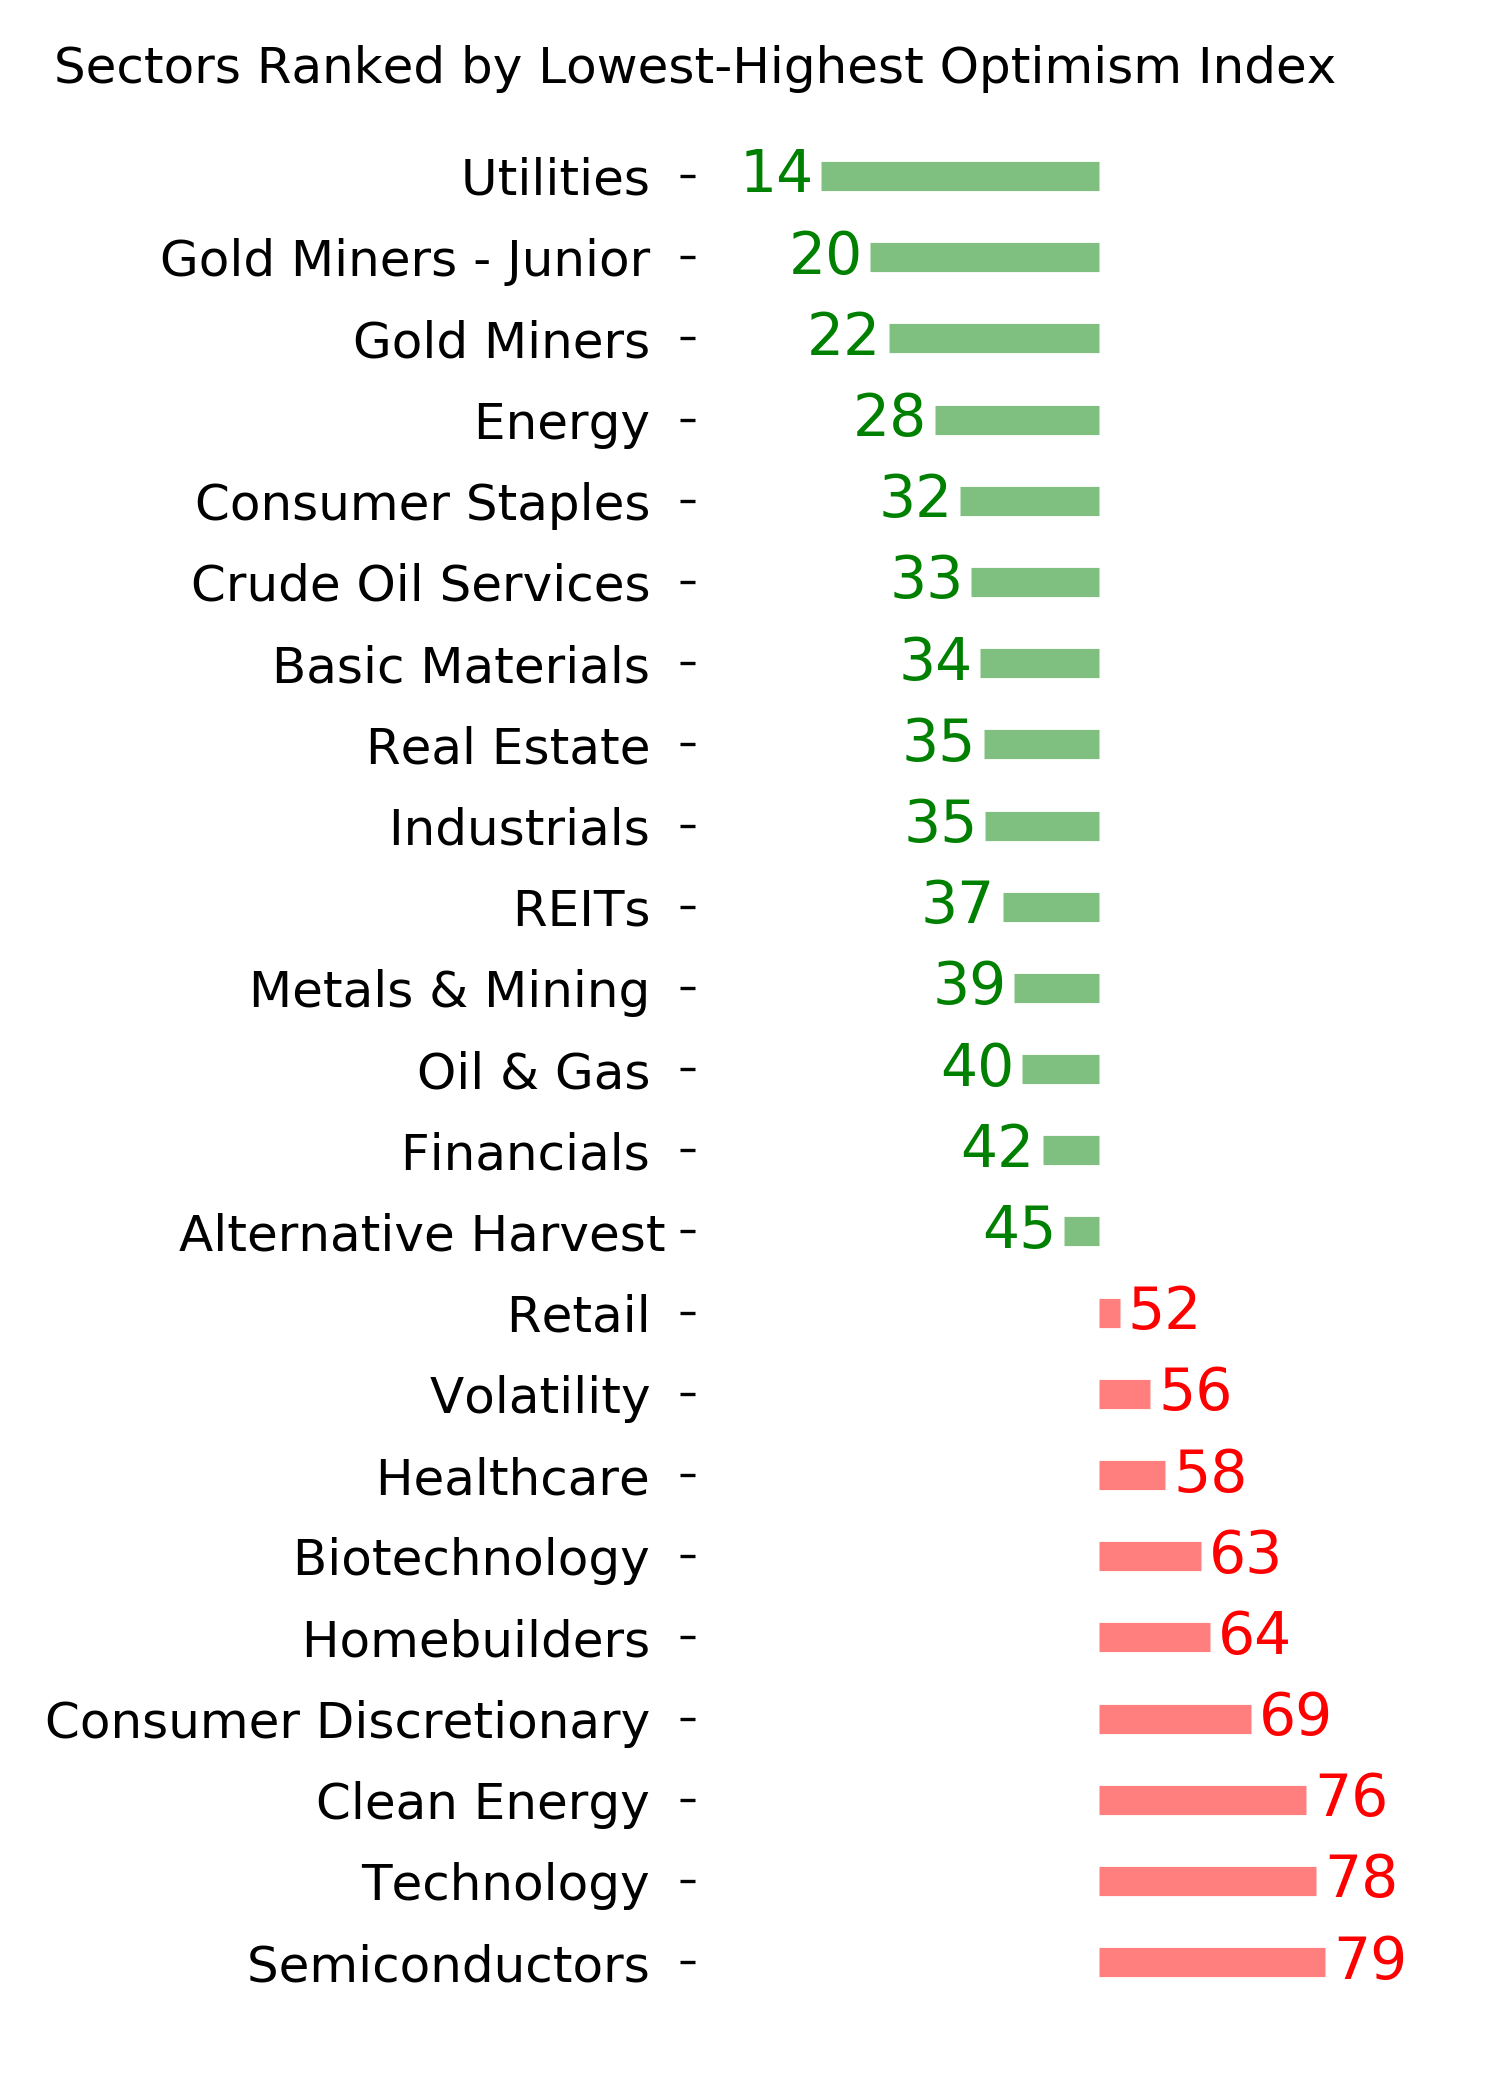
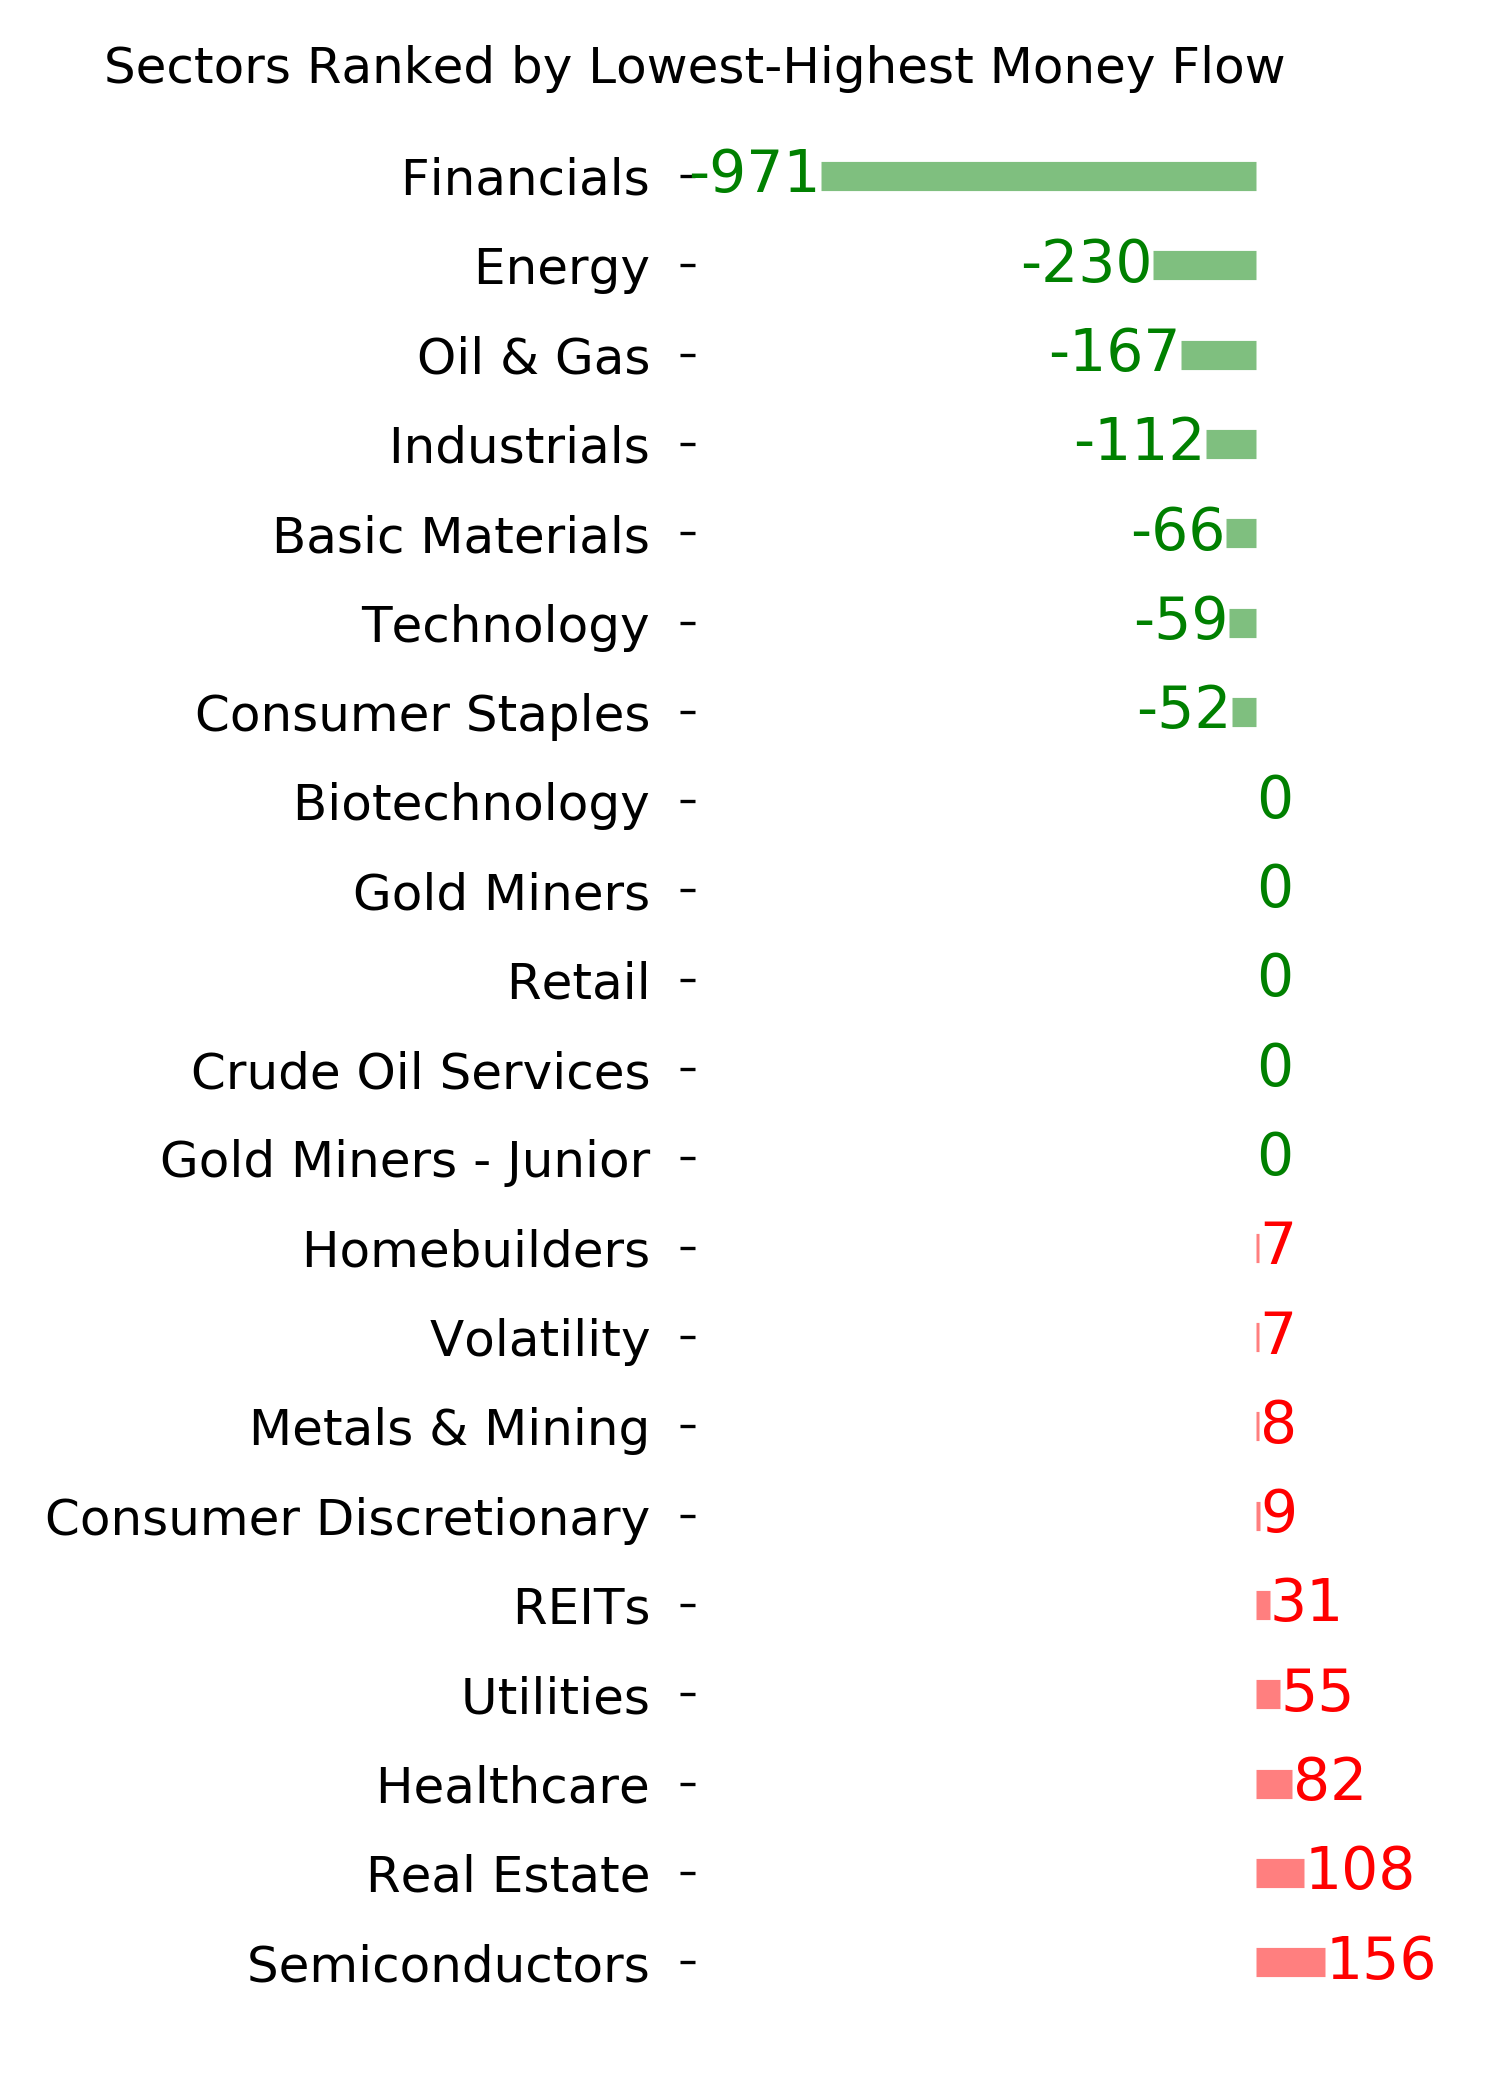
For sectors and factors, this kind of stock + commodity momentum preceded the best gains for the Energy and Utilities sectors, with Technology, Cyclical, and Growth stocks being challenged the most.
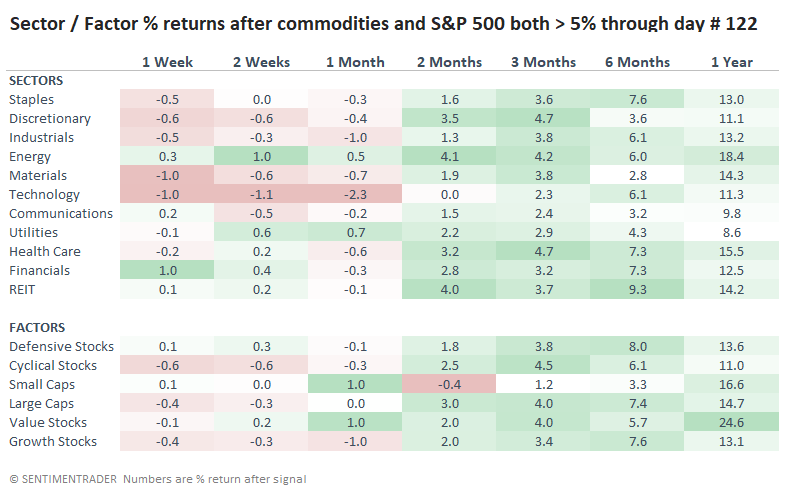
We can see that in their consistency, too. This is the percentage of time each sector or factor rallied over each time frame.
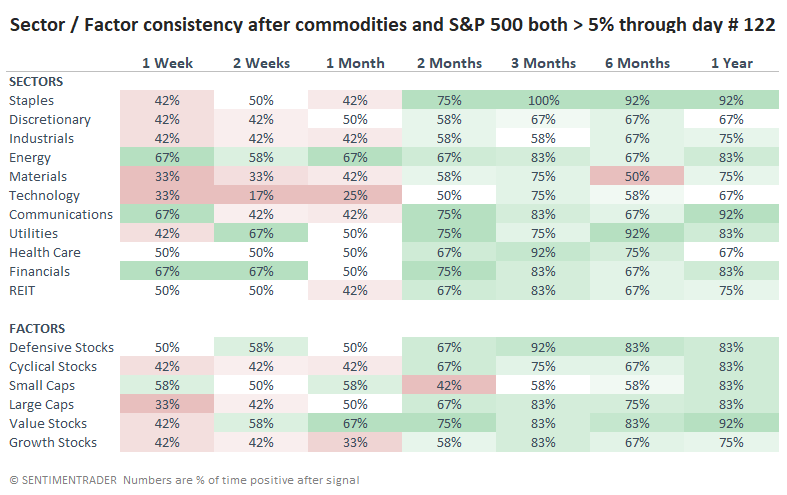
Momentum is a strong force, and even though stocks often struggle a bit starting around mid-July, these kinds of years have typically resulted in a decent continuation of the trend over the longer-term. It was a different story for commodities, though, which tend to be much more influenced by the supply/demand dynamic.
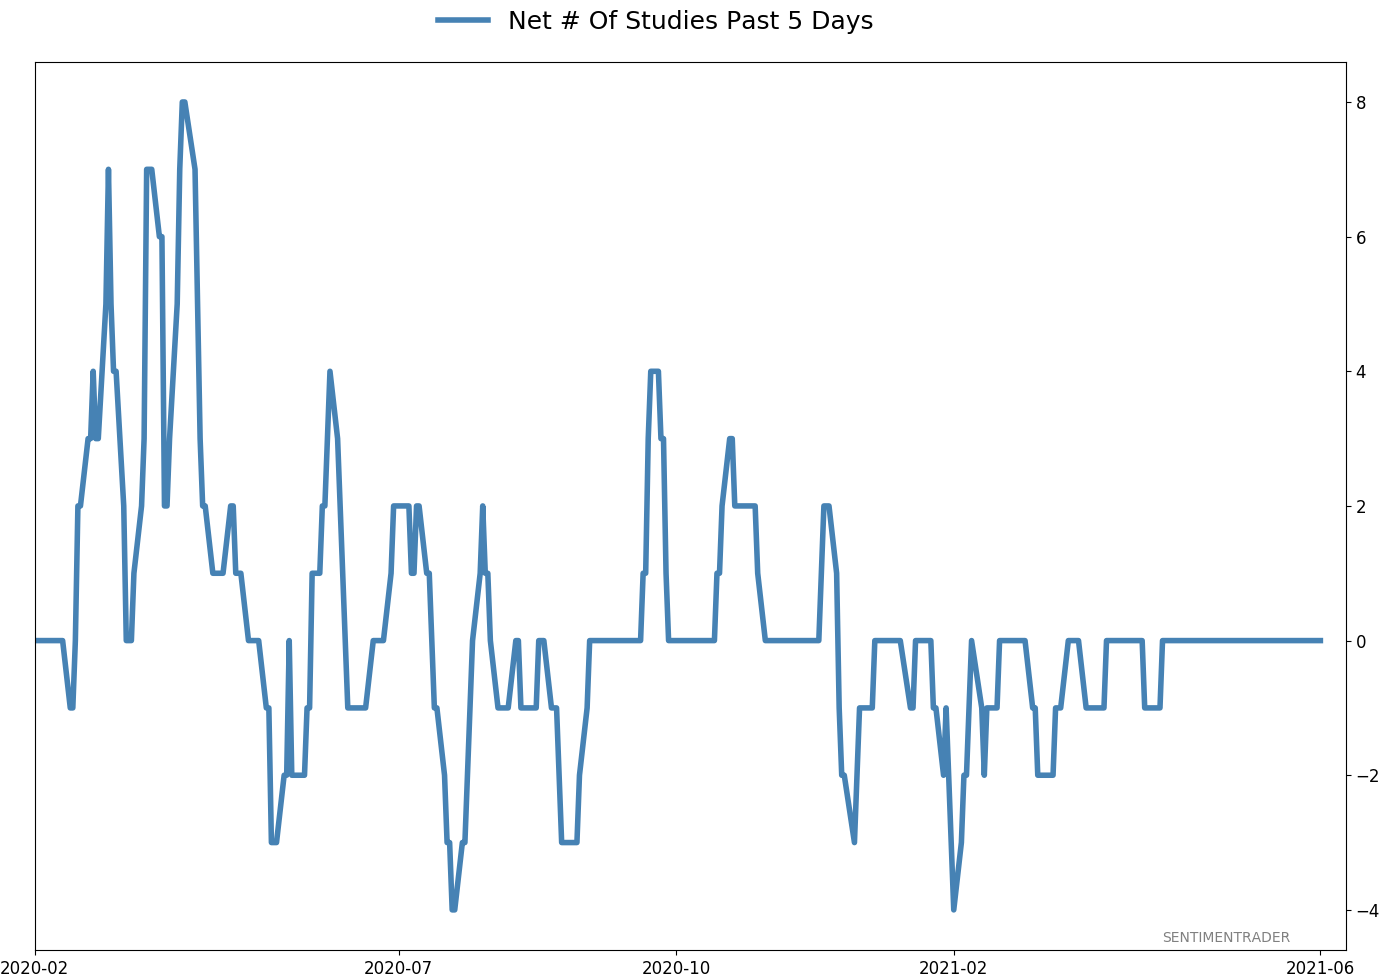
Active Studies
| Time Frame | Bullish | Bearish | | Short-Term | 0 | 1 | | Medium-Term | 2 | 2 | | Long-Term | 8 | 5 |
|
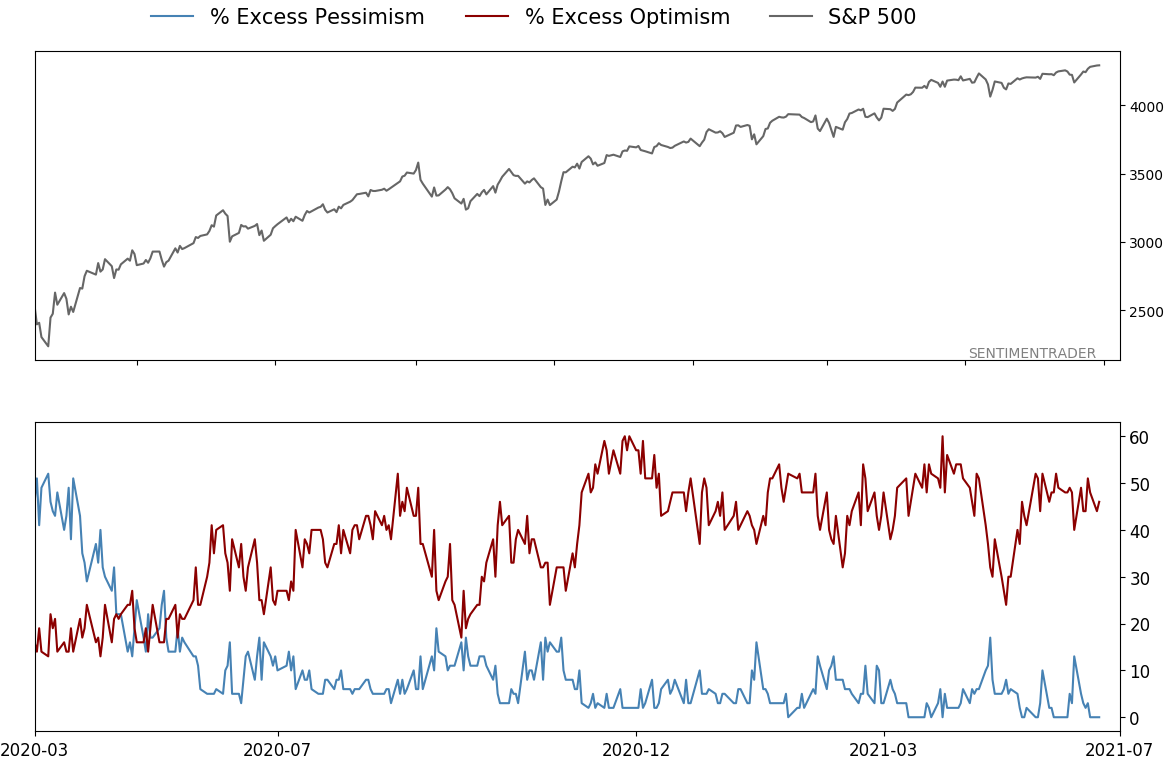
Indicators at Extremes
|
% Showing Pessimism: 0%
Bullish for Stocks
|
|
Portfolio
| Position | Description | Weight % | Added / Reduced | Date | | Stocks | RSP | 4.1 | Added 4.1% | 2021-05-19 | | Bonds | 23.9% BND, 6.9% SCHP | 30.7 | Reduced 7.1% | 2021-05-19 | | Commodities | GCC | 2.6 | Reduced 2.1%
| 2020-09-04 | | Precious Metals | GDX | 5.6 | Reduced 4.2% | 2021-05-19 | | Special Situations | 4.3% XLE, 2.2% PSCE | 7.6 | Reduced 5.6% | 2021-04-22 | | Cash | | 49.4 | | |
|
Updates (Changes made today are underlined)
Much of our momentum and trend work has remained positive for several months, with some scattered exceptions. Almost all sentiment-related work has shown a poor risk/reward ratio for stocks, especially as speculation drove to record highs in exuberance in February. Much of that has worn off, and most of our models are back toward neutral levels. There isn't much to be excited about here. The same goes for bonds and even gold. Gold has been performing well lately and is back above long-term trend lines. The issue is that it has a poor record of holding onto gains when attempting a long-term trend change like this, so we'll take a wait-and-see approach. RETURN YTD: 9.1% 2020: 8.1%, 2019: 12.6%, 2018: 0.6%, 2017: 3.8%, 2016: 17.1%, 2015: 9.2%, 2014: 14.5%, 2013: 2.2%, 2012: 10.8%, 2011: 16.5%, 2010: 15.3%, 2009: 23.9%, 2008: 16.2%, 2007: 7.8%
|
|
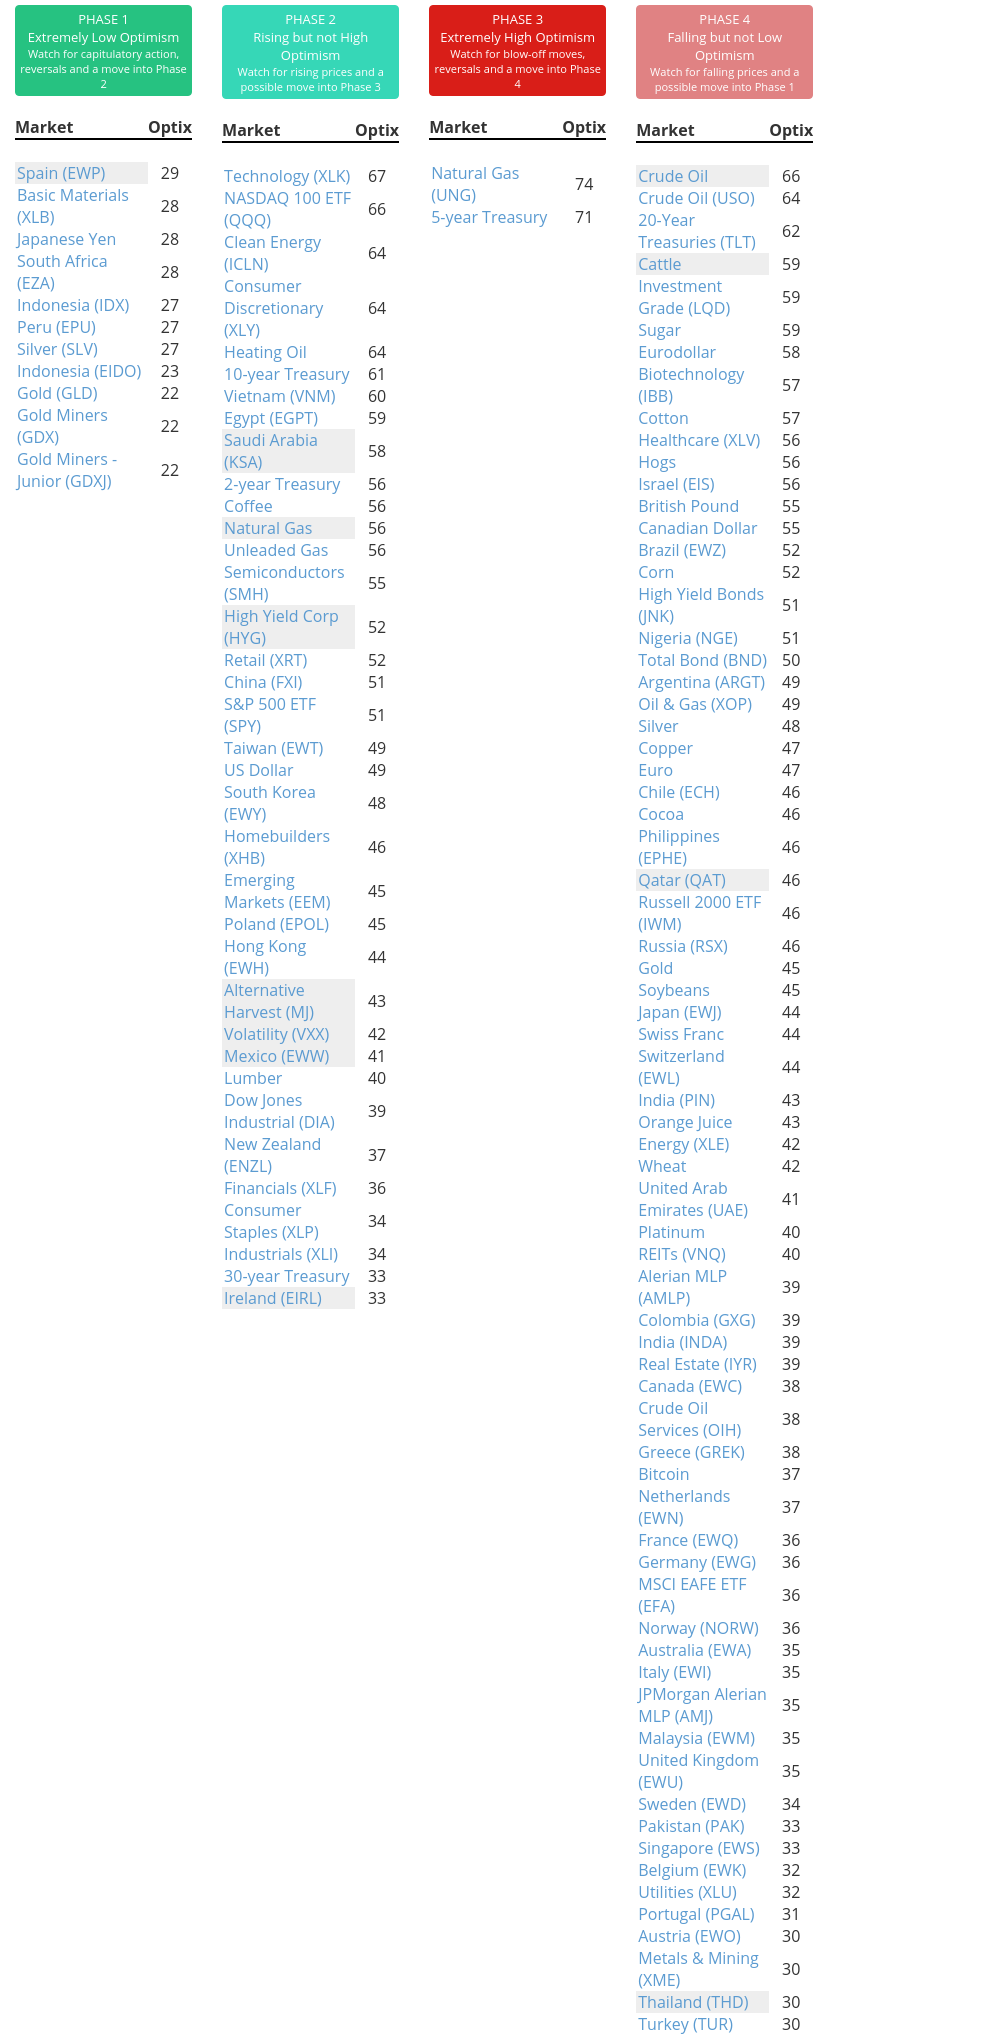
Phase Table
Ranks
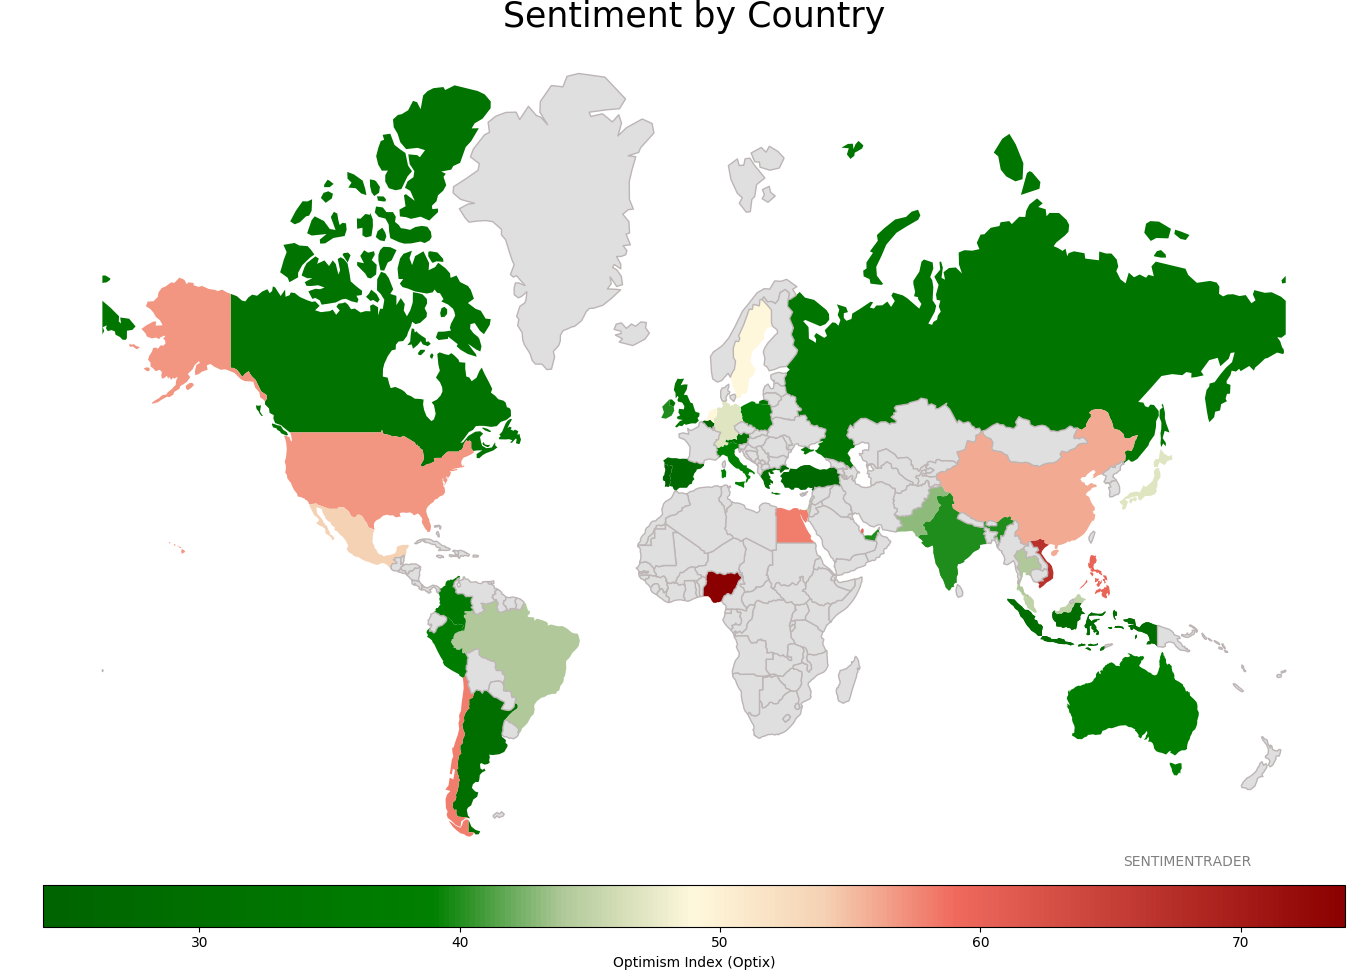
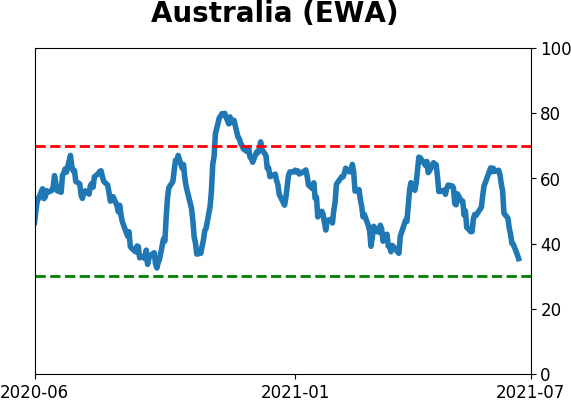
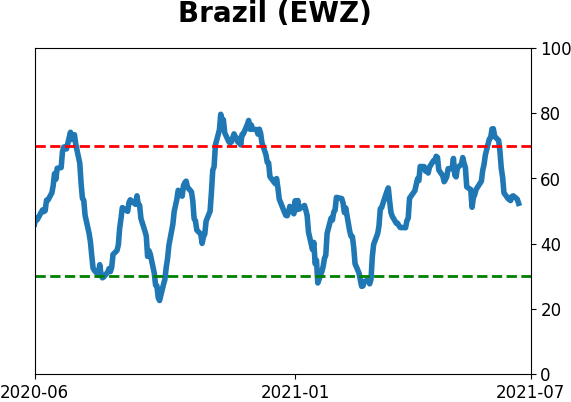
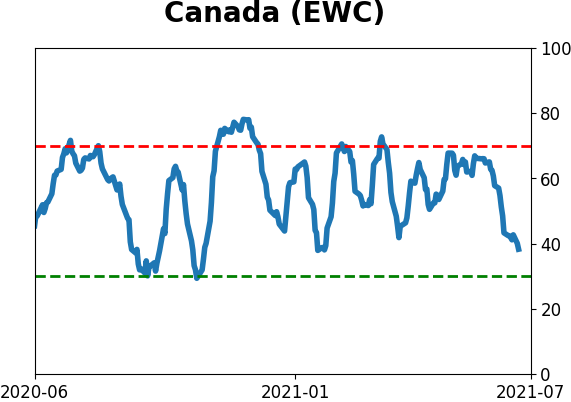
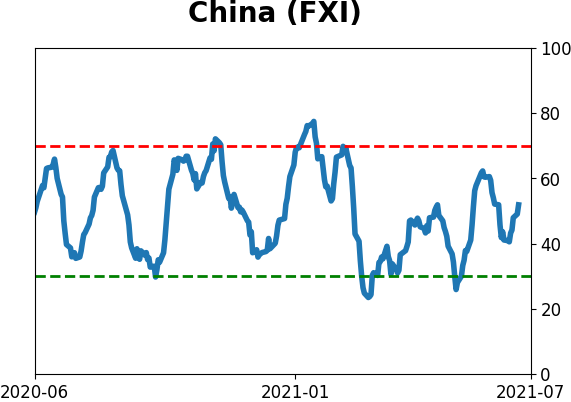
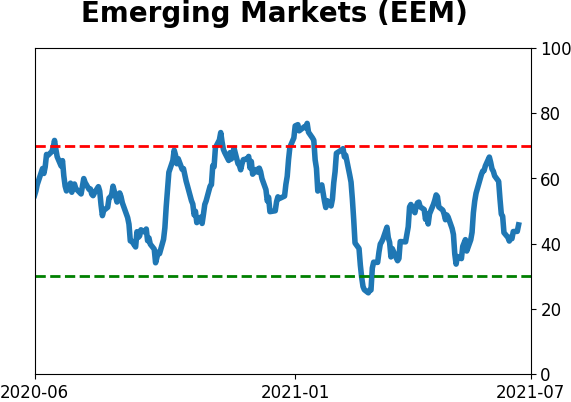
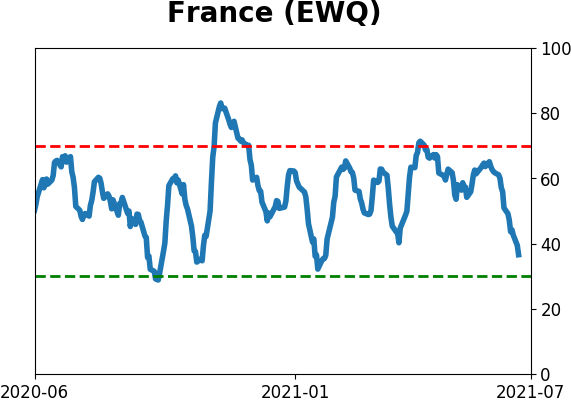
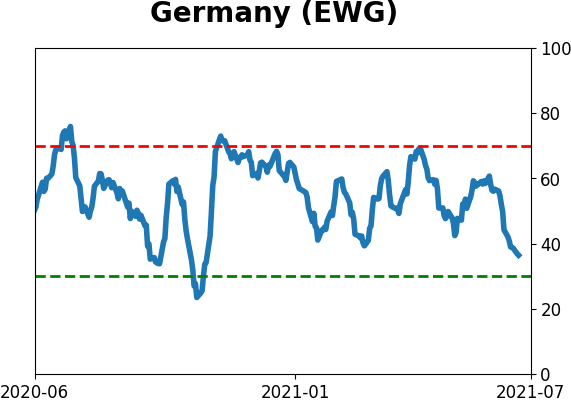
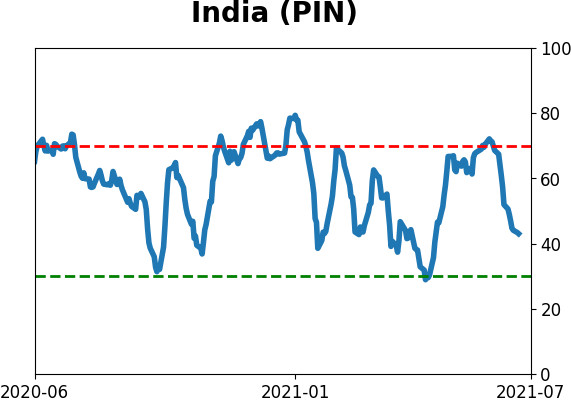
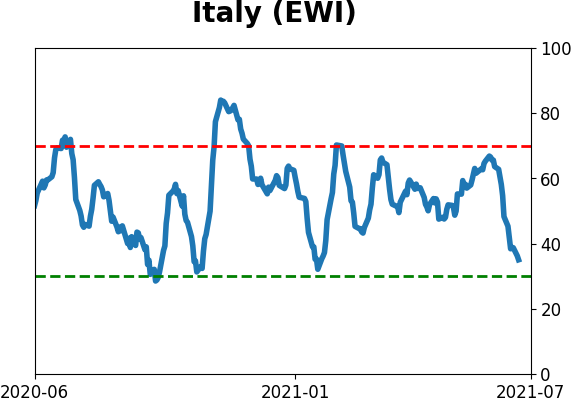
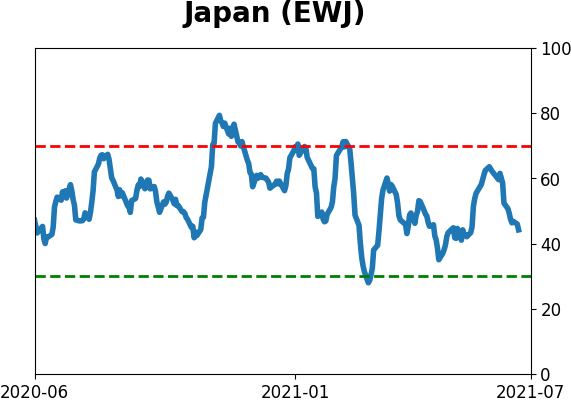
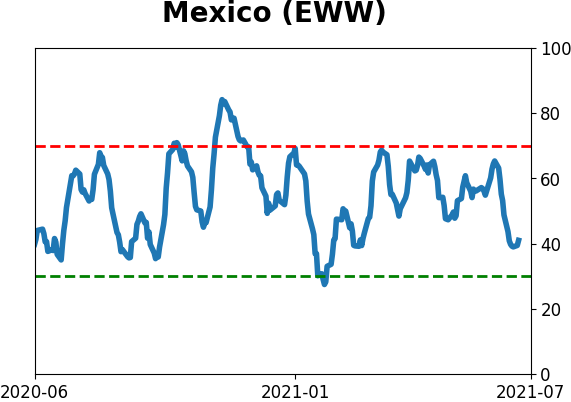
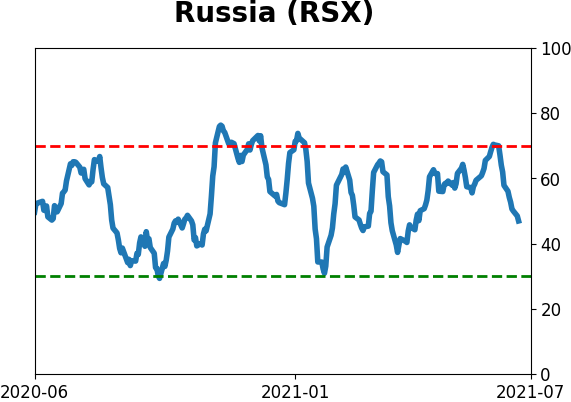
Sentiment Around The World
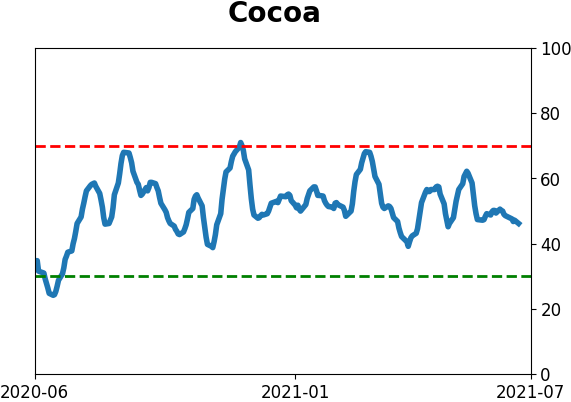
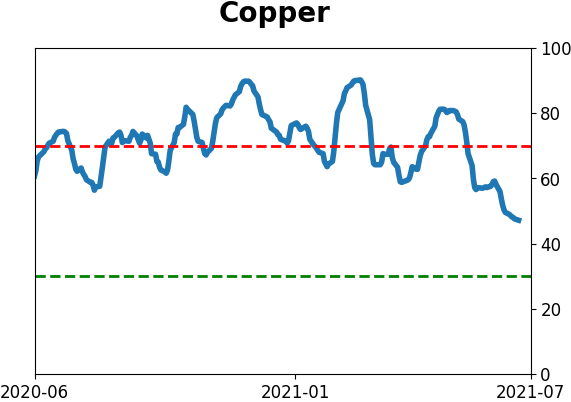
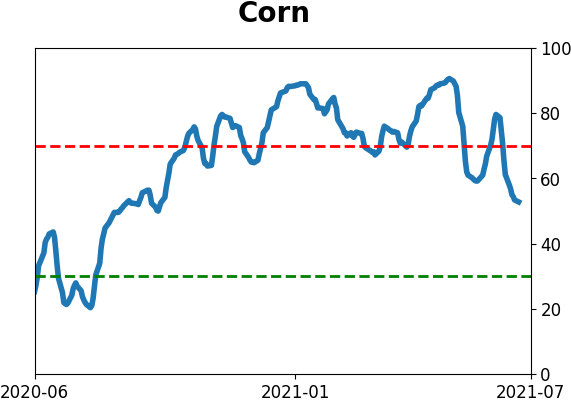
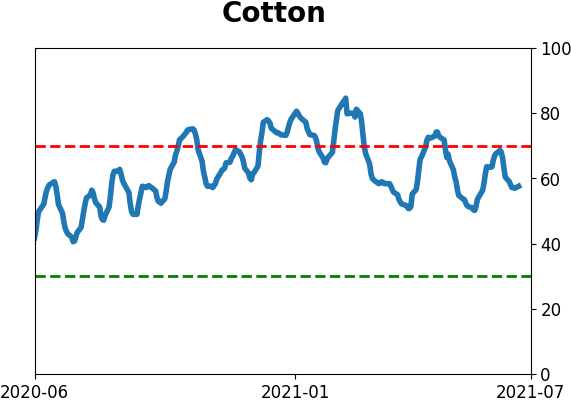
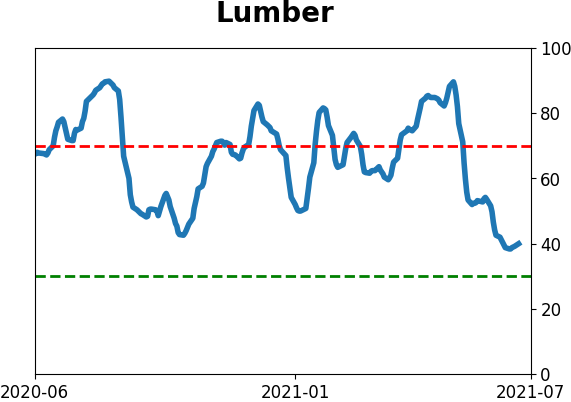
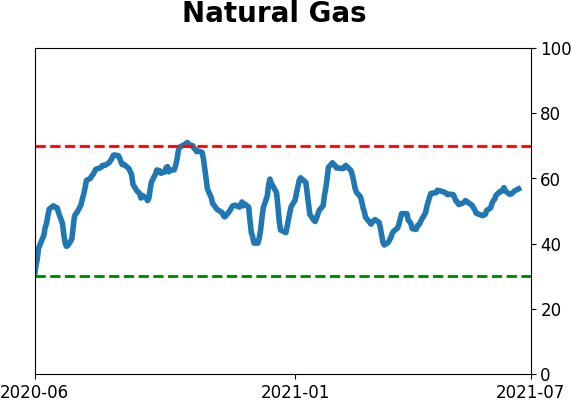
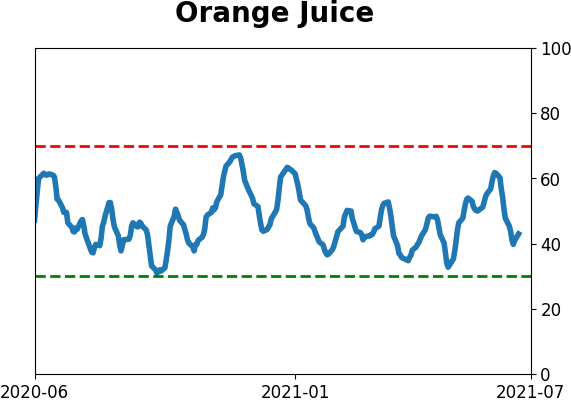
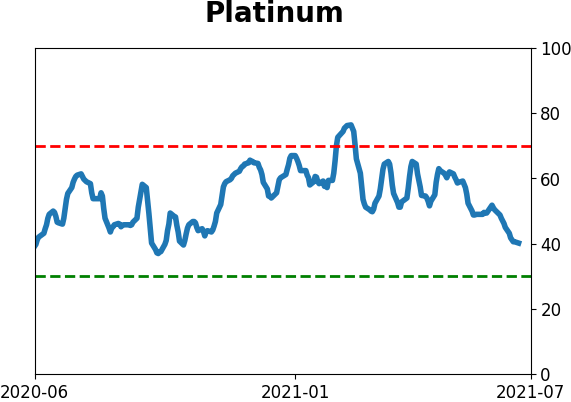
Optimism Index Thumbnails
|
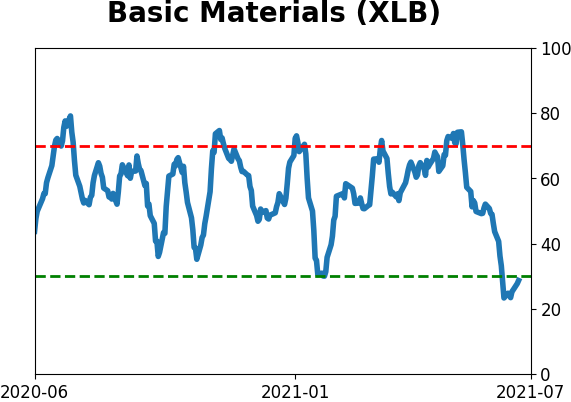
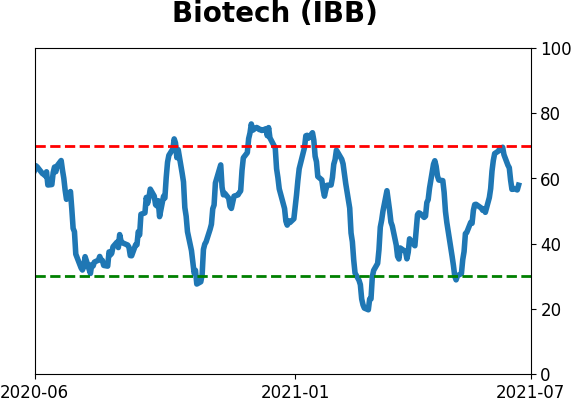
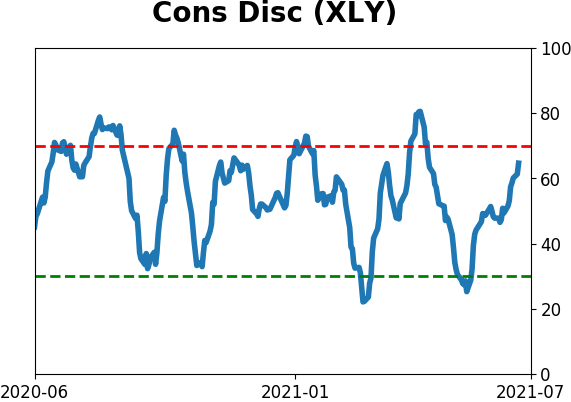
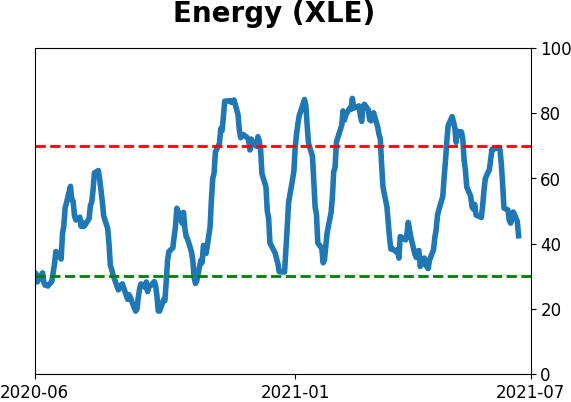
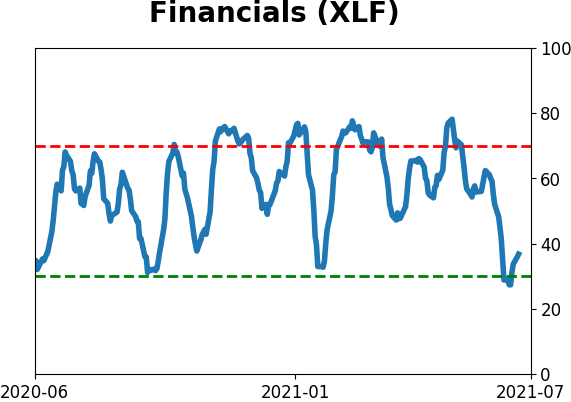
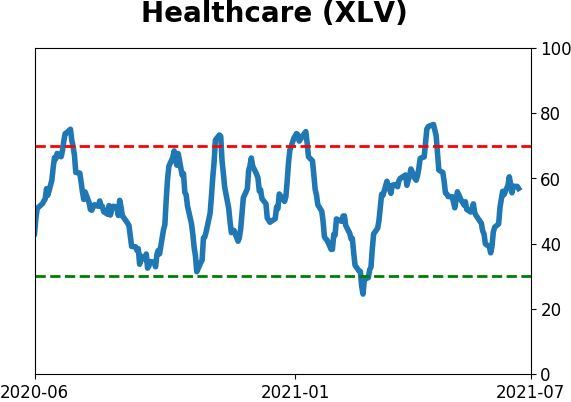
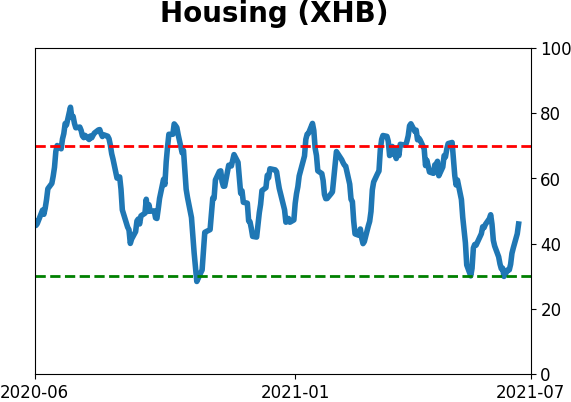
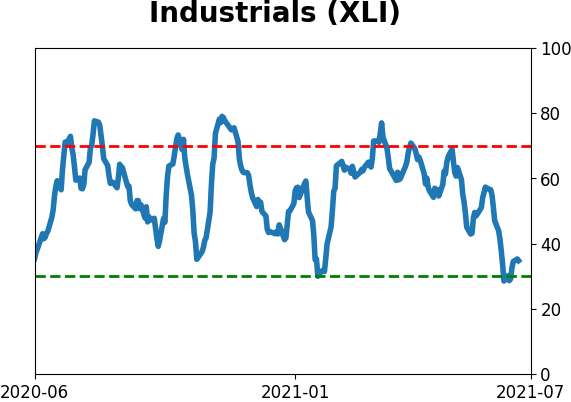
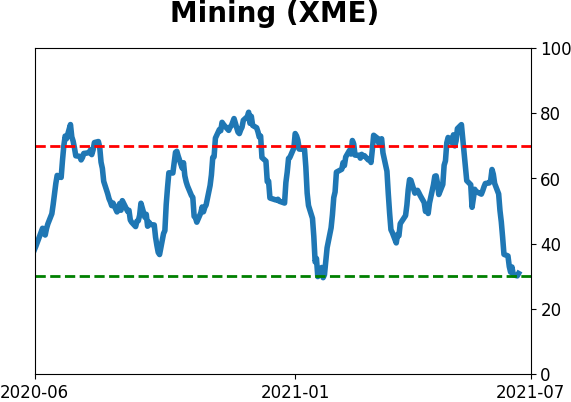
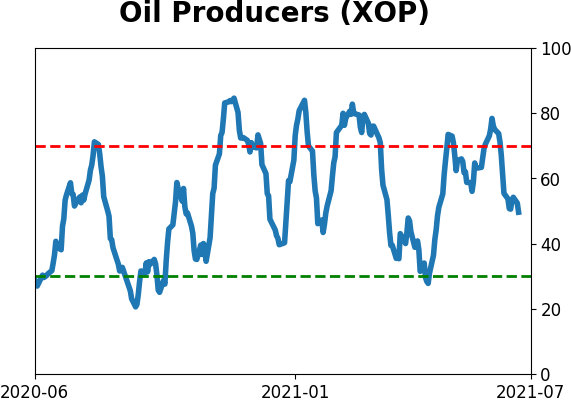
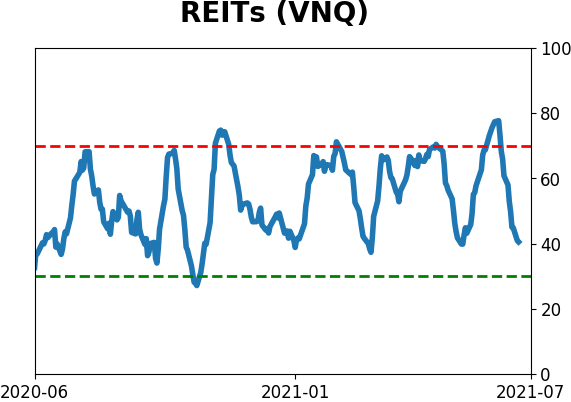
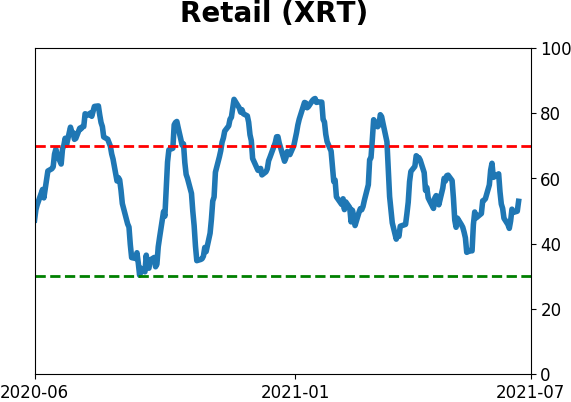
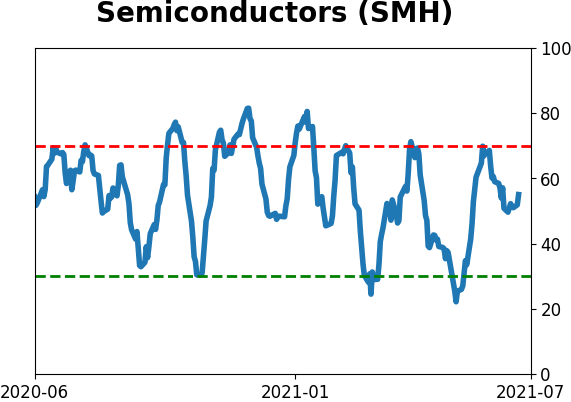
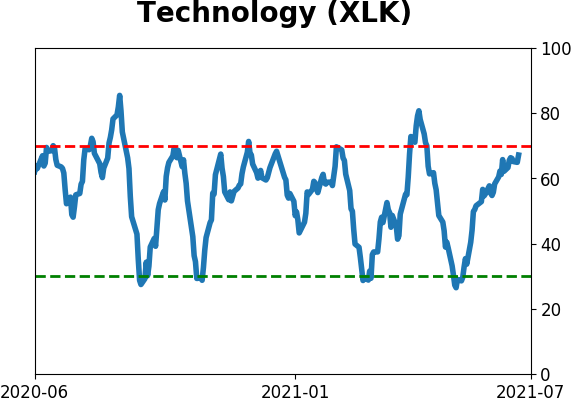
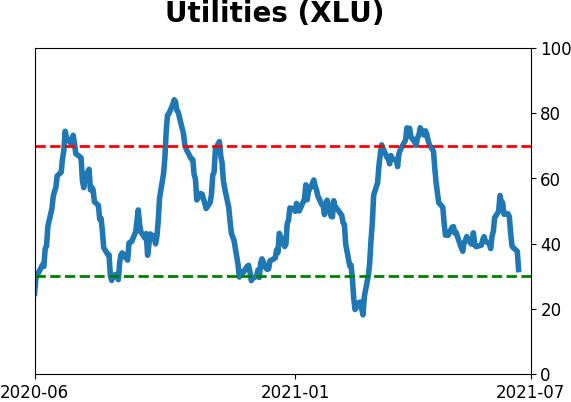
Sector ETF's - 10-Day Moving Average
|
|
|
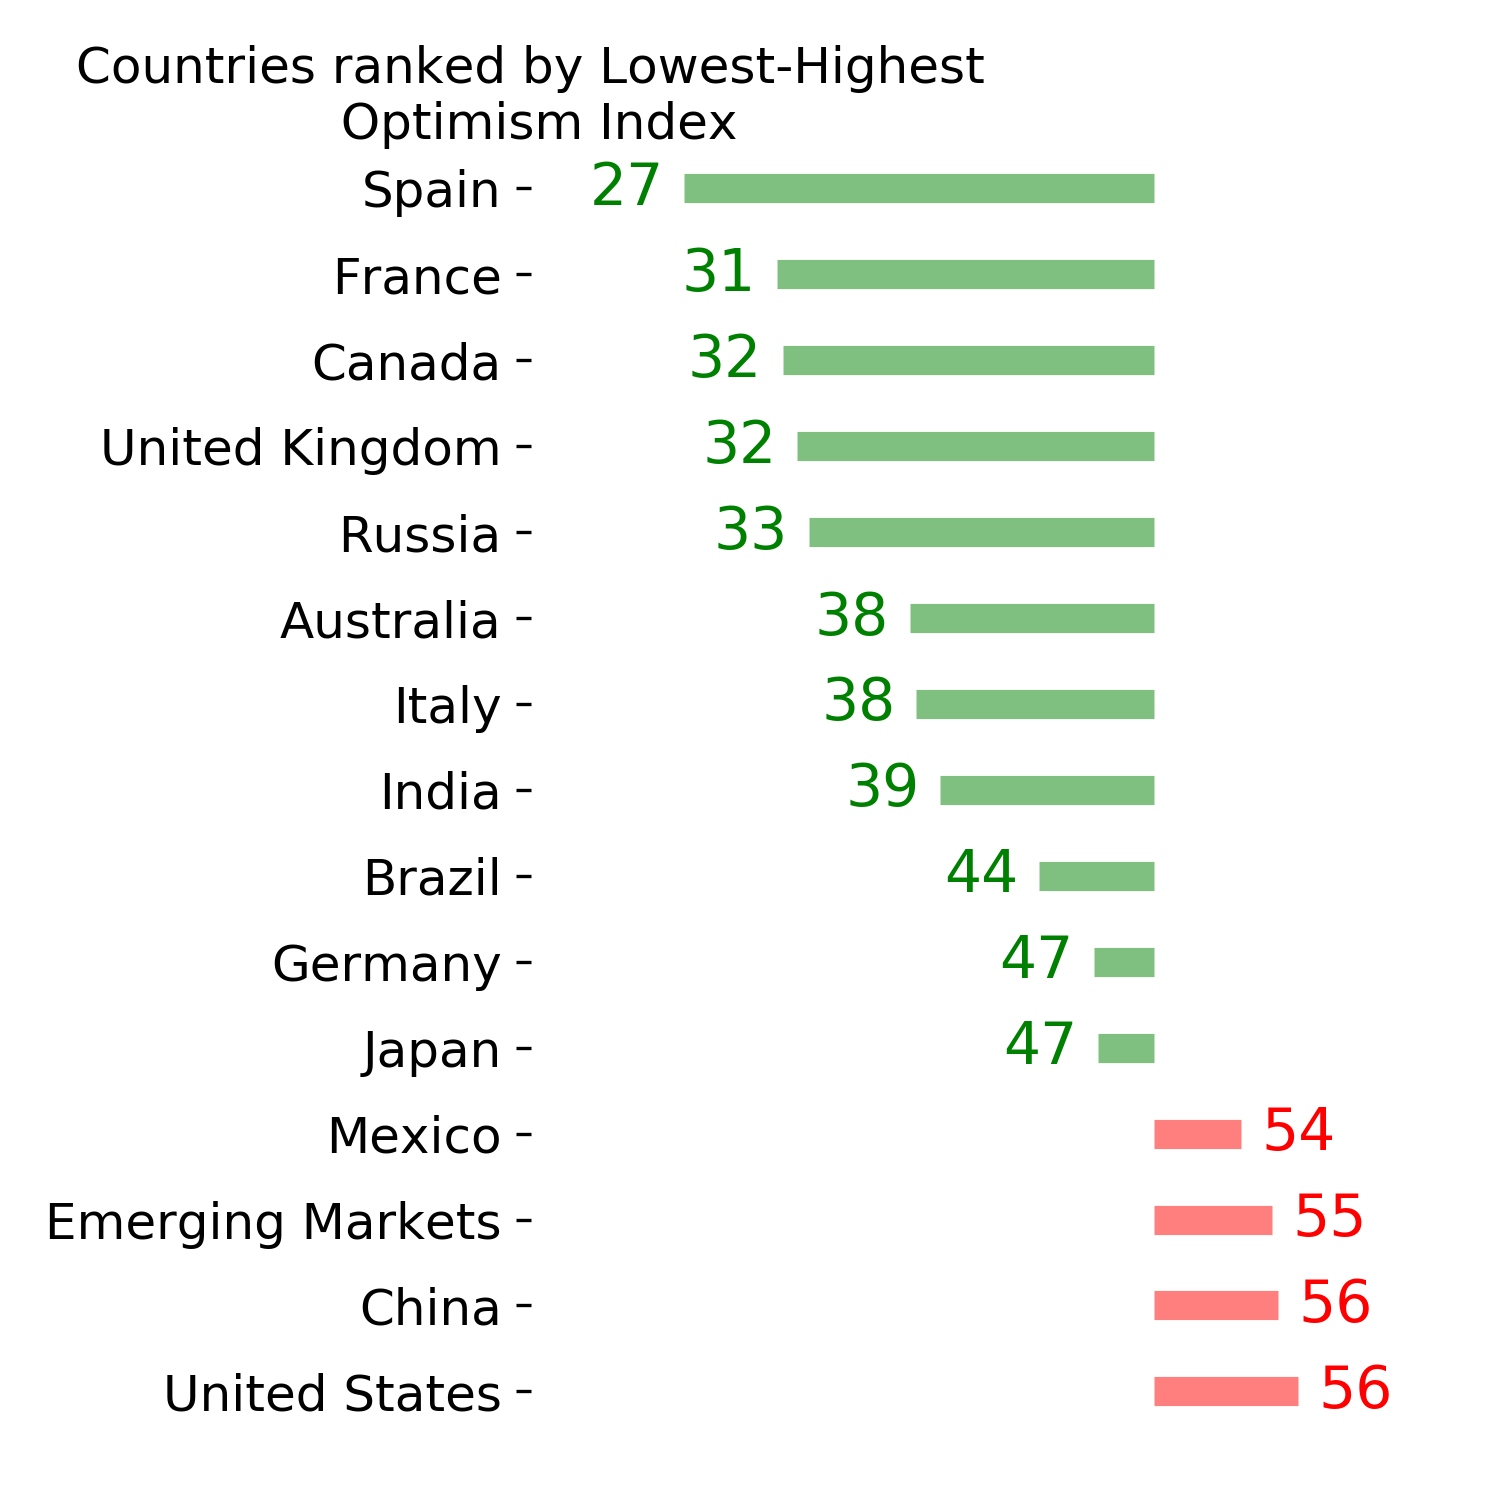
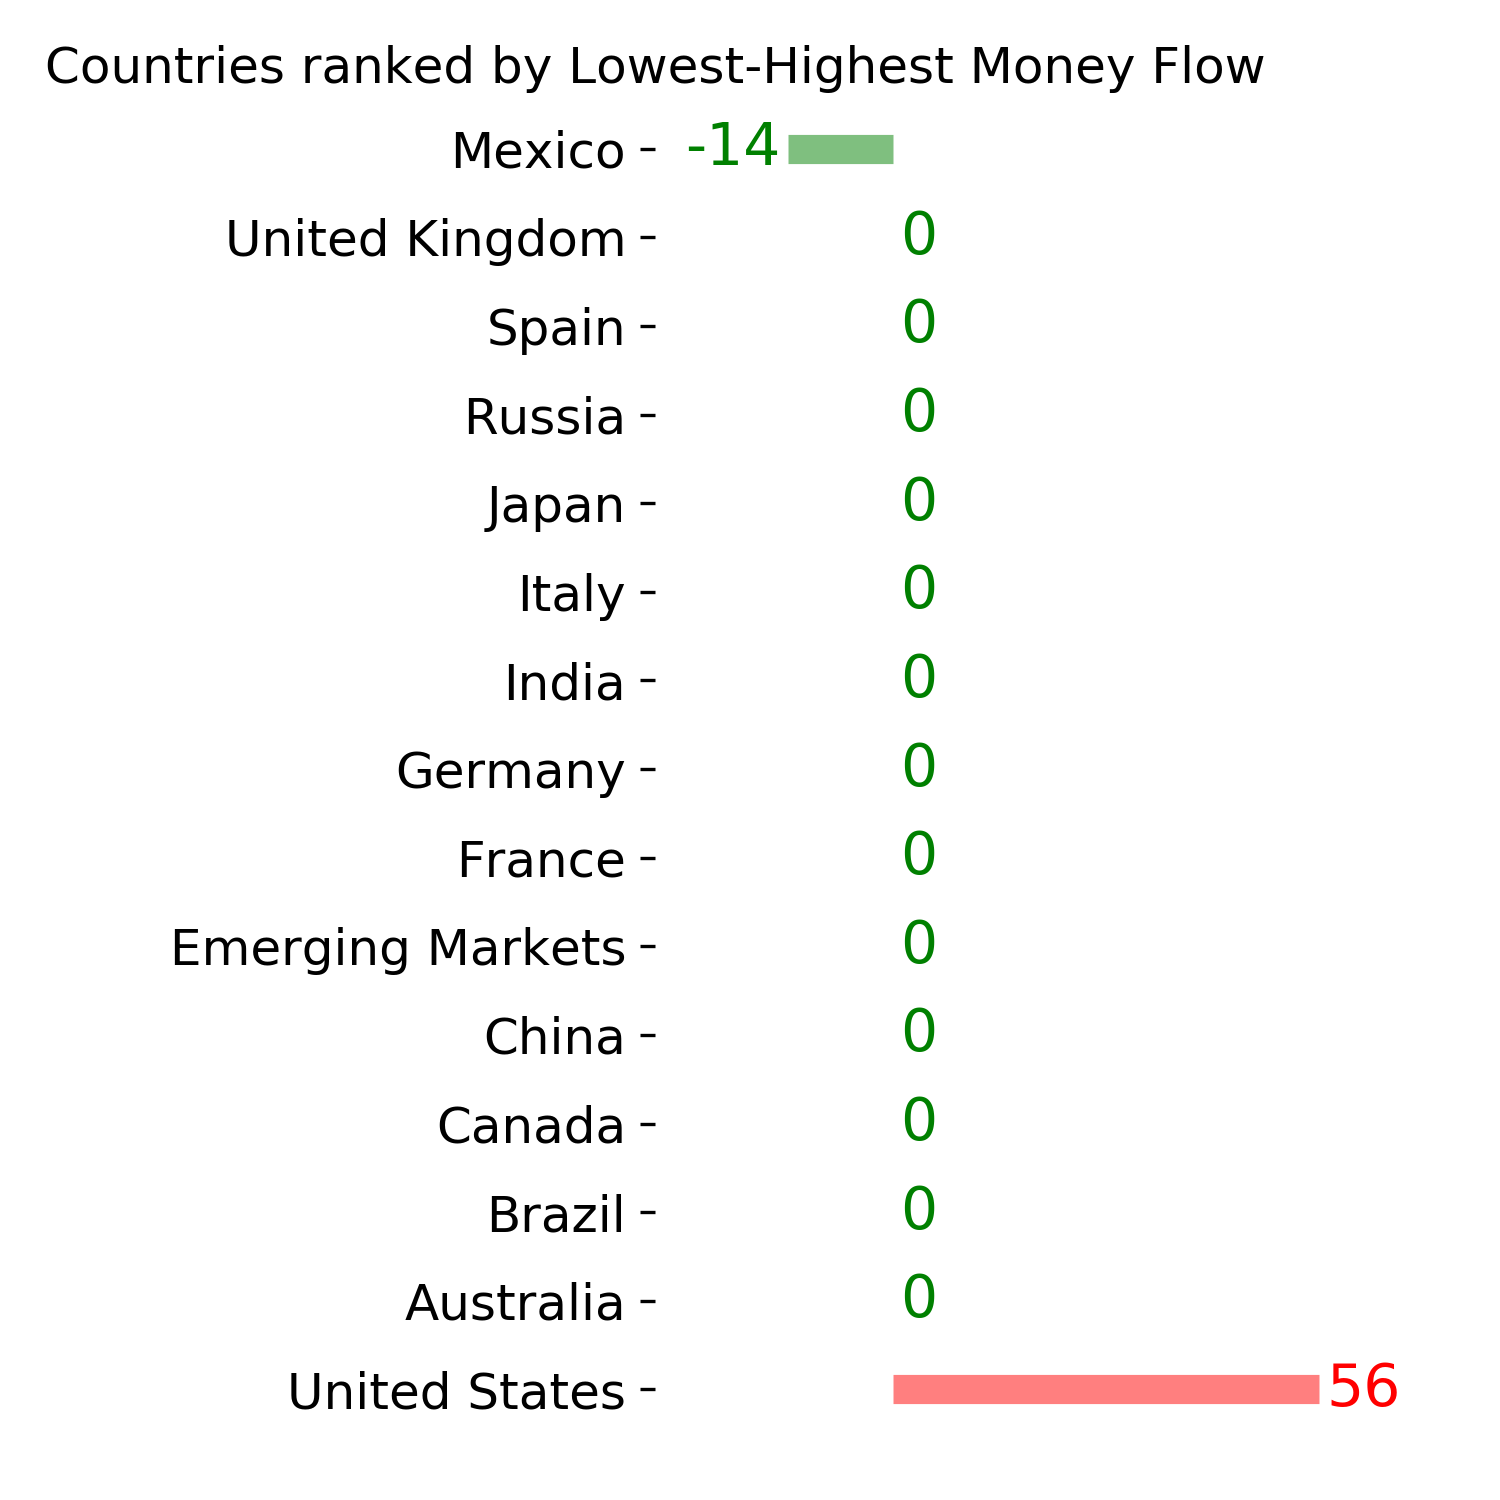
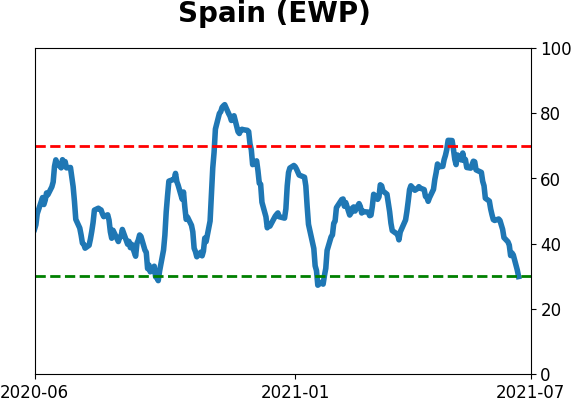
Country ETF's - 10-Day Moving Average
|
|
|
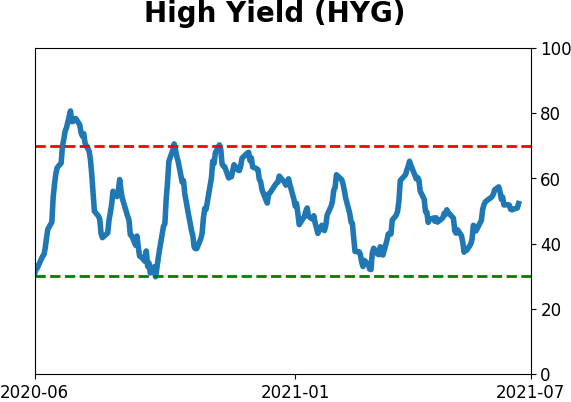
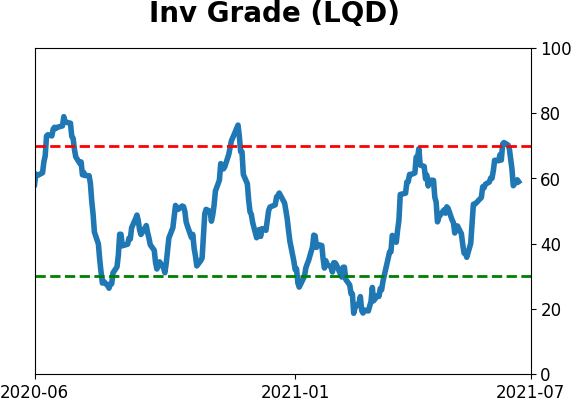
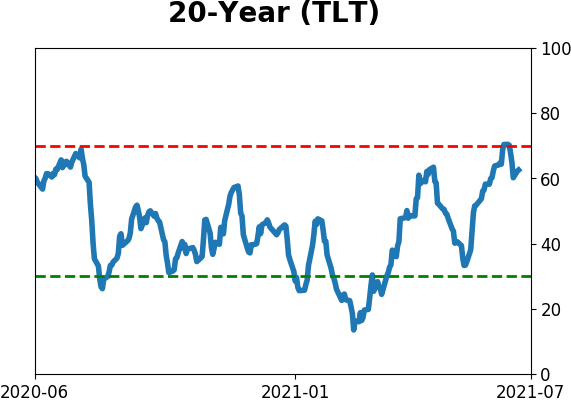
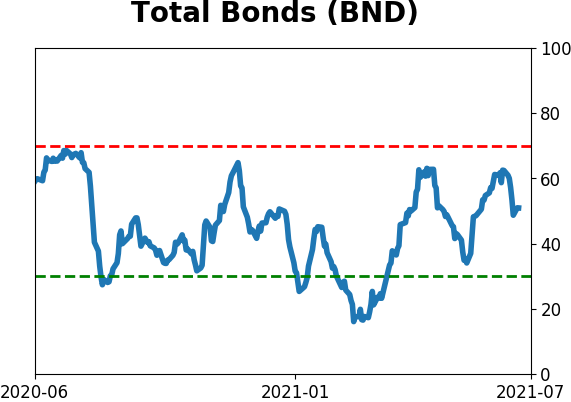
Bond ETF's - 10-Day Moving Average
|
|
|
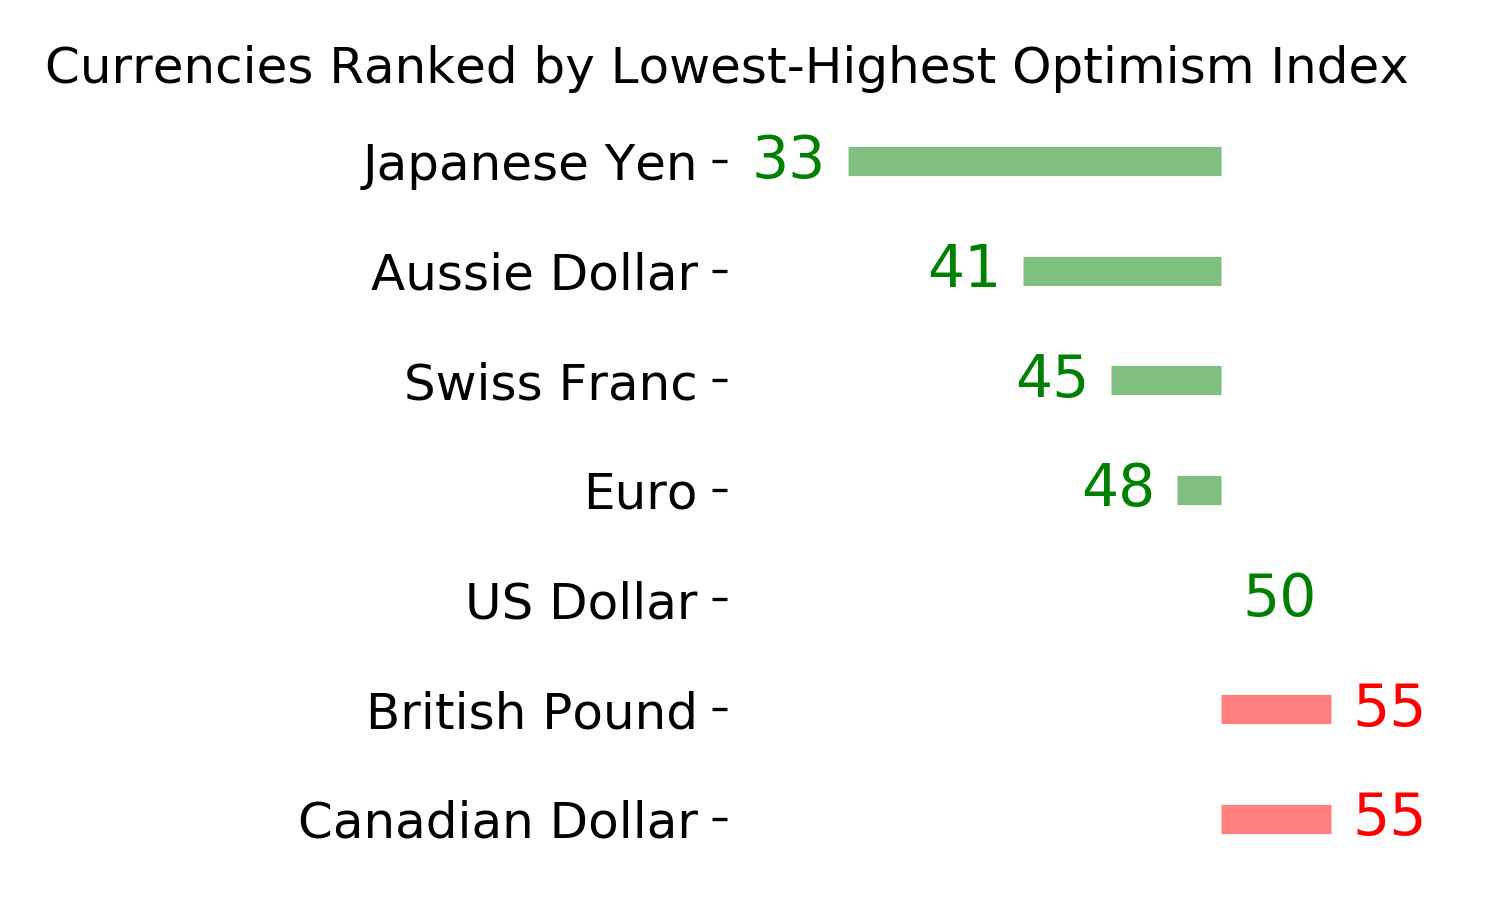
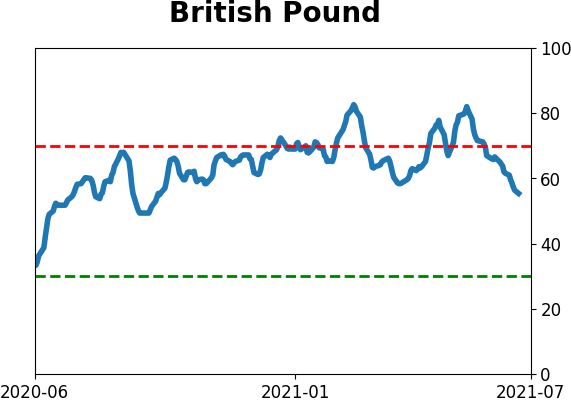
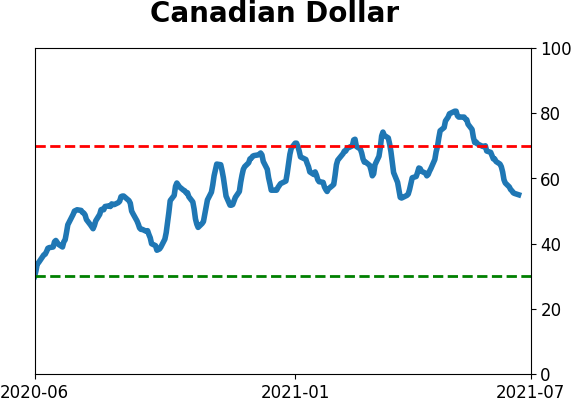
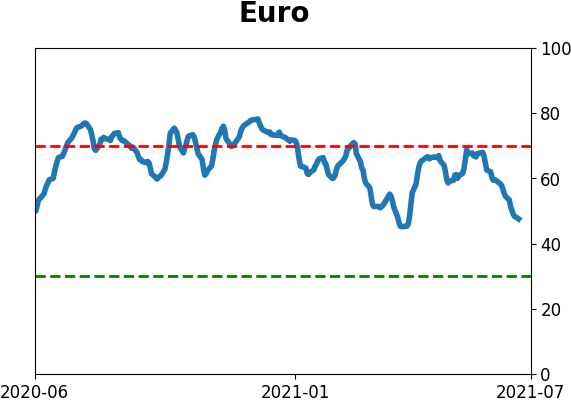
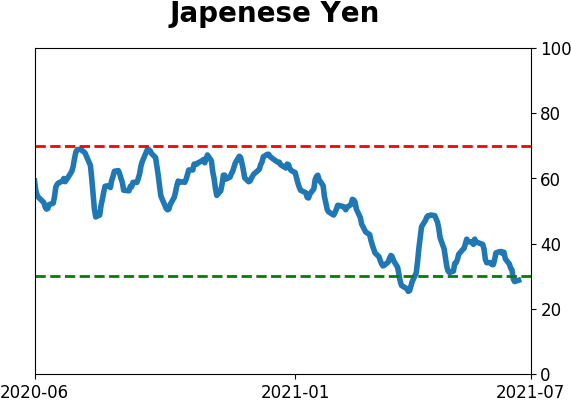
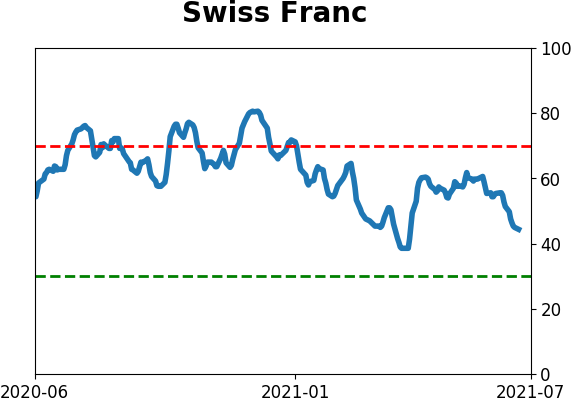
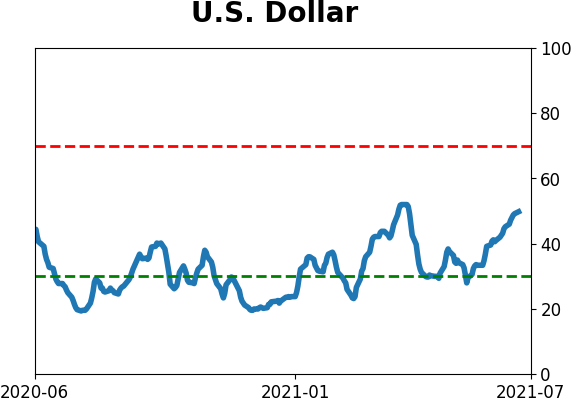
Currency ETF's - 5-Day Moving Average
|
|
|
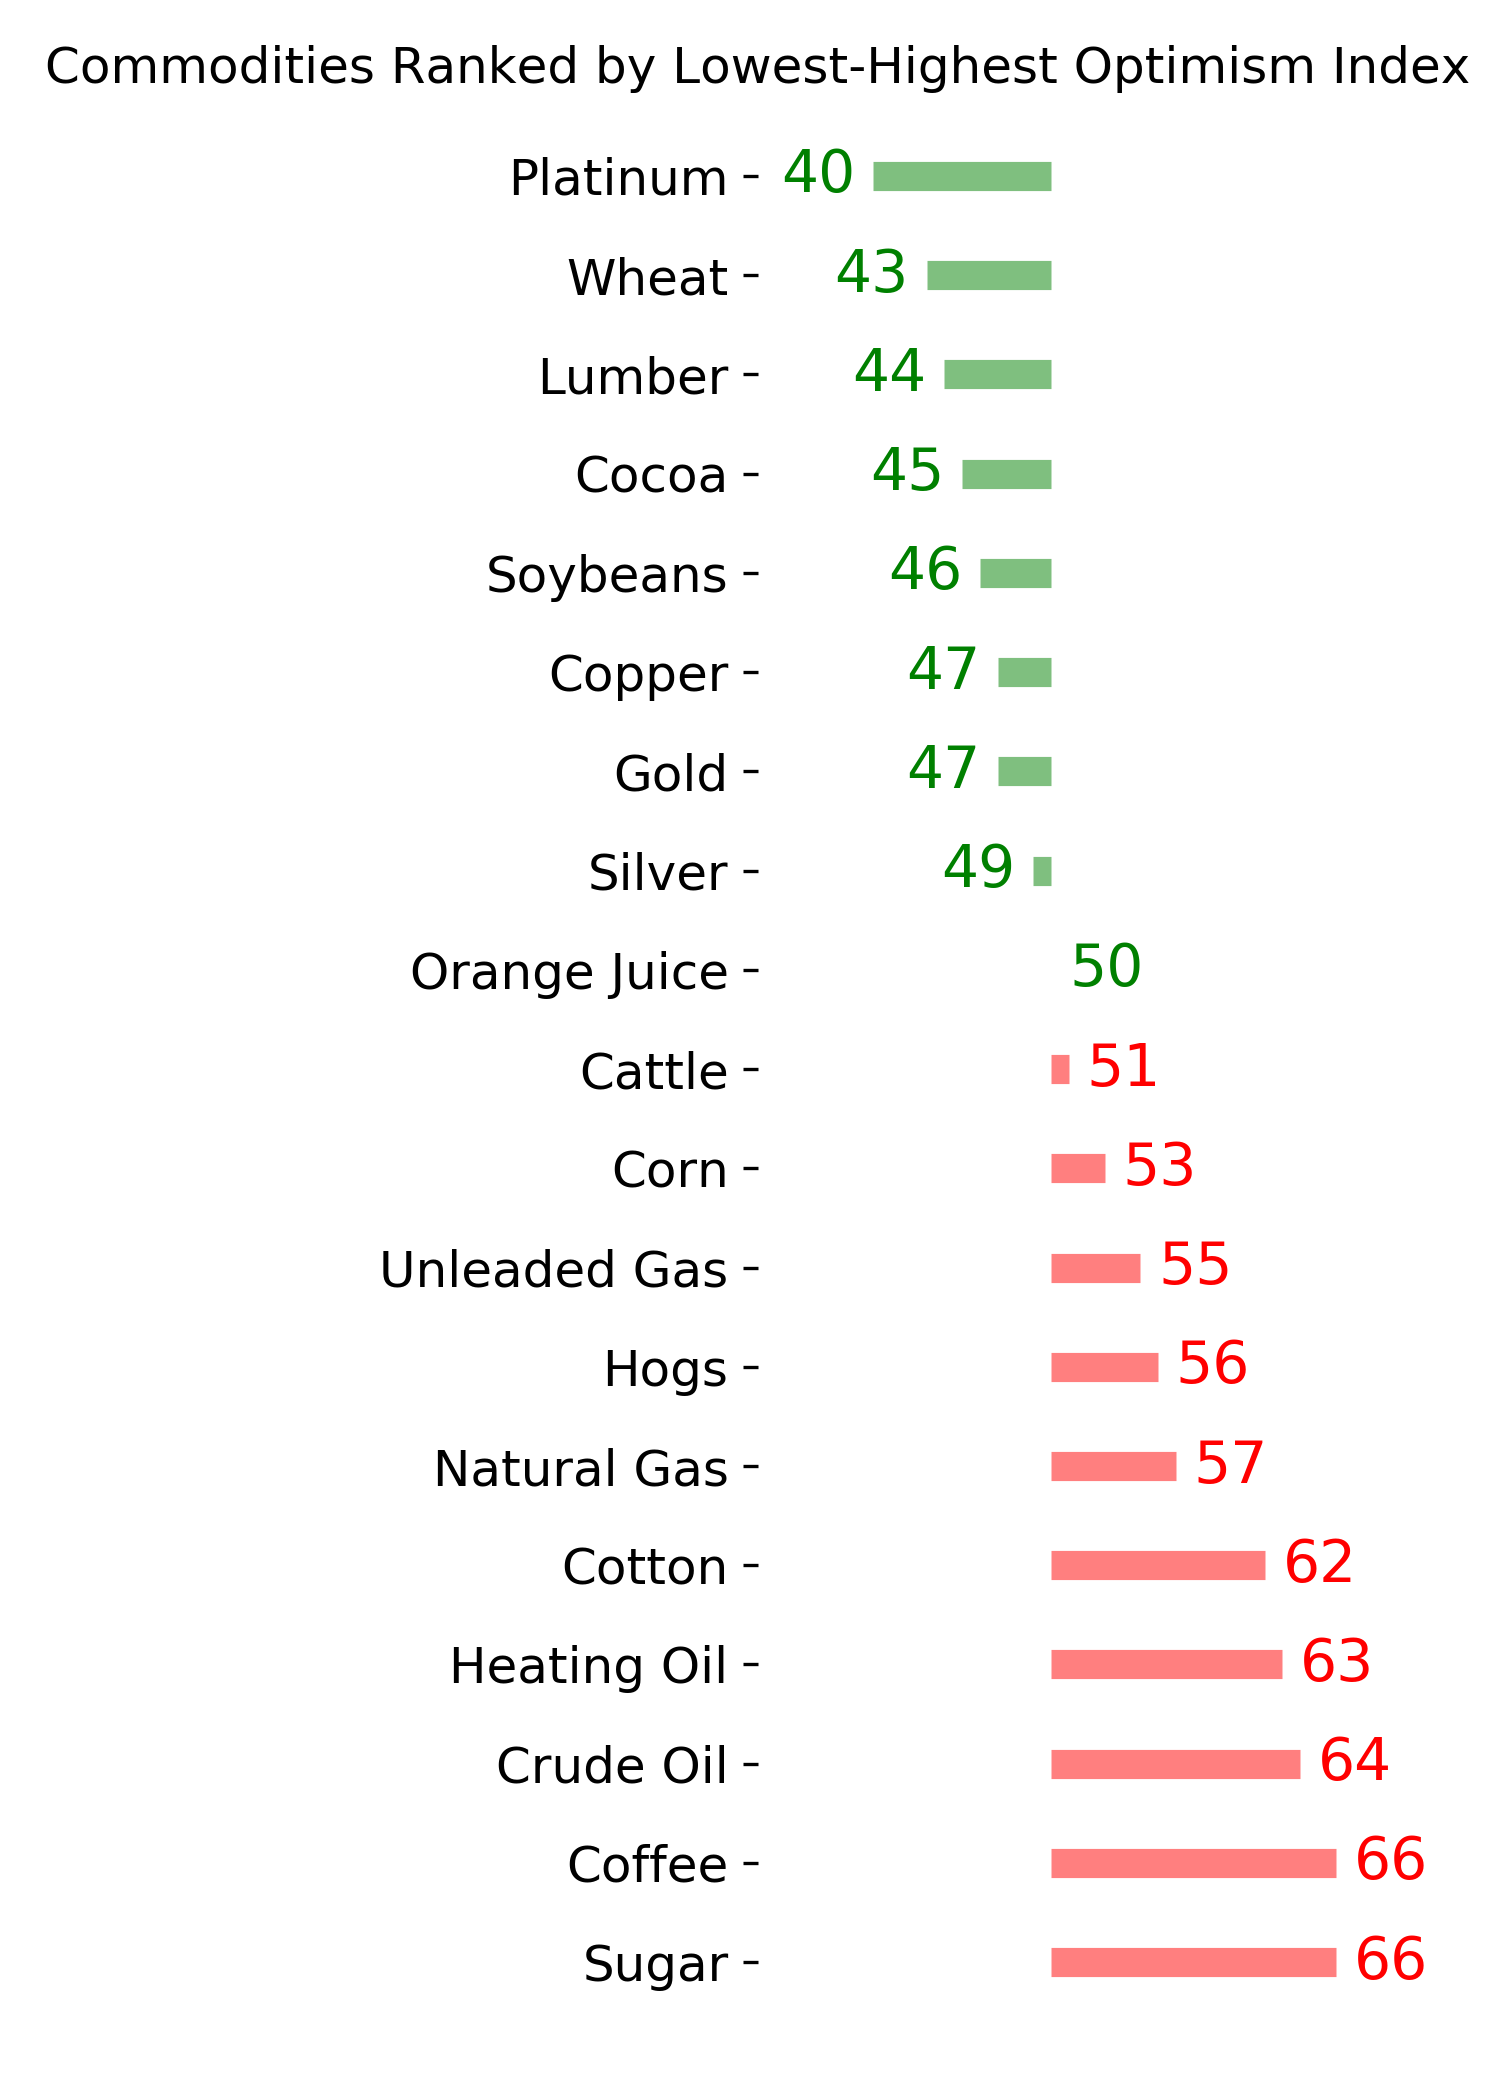
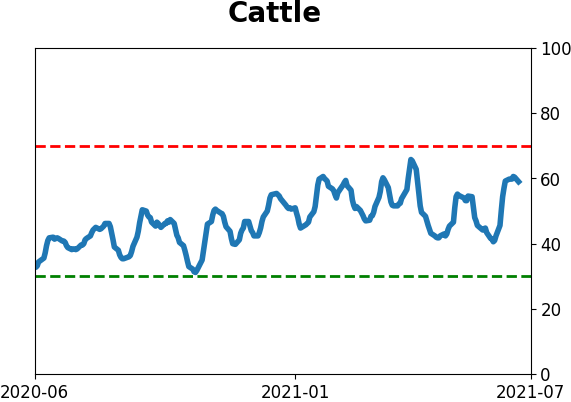
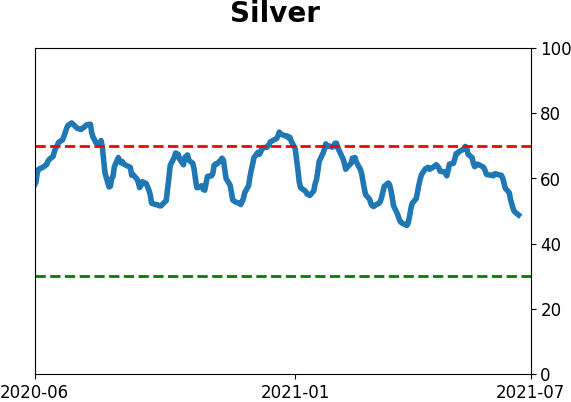
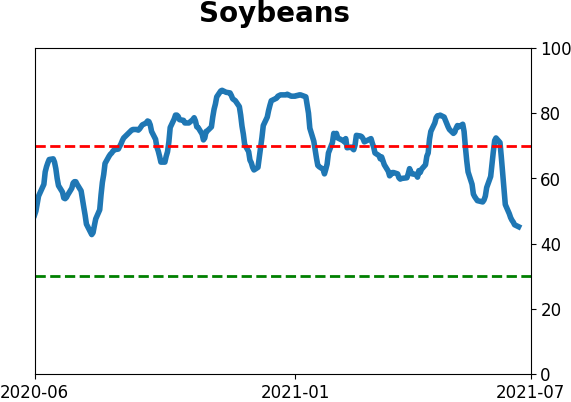
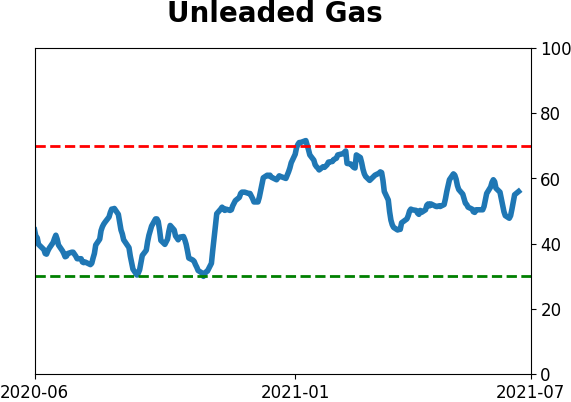
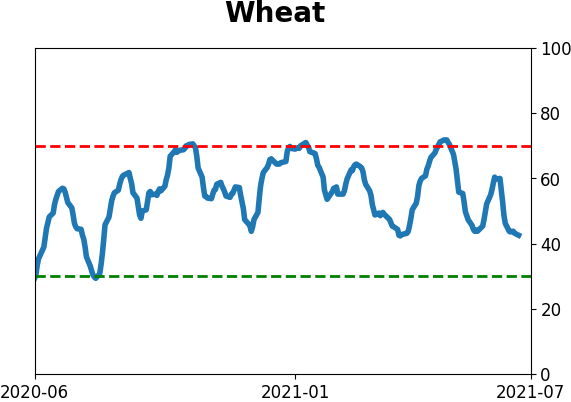
Commodity ETF's - 5-Day Moving Average
|
|