Headlines
|
|
Small options traders get bulled up again...kind of:
After a year like 2022, investors are hyper-focused on any indication that other investors have become too complacent. As such, they've latched onto a recent jump in call option buying as a warning sign. But options traders are still buying a lot of protective puts. Broad and objective measures of options activity do not currently show worrying extremes.
|
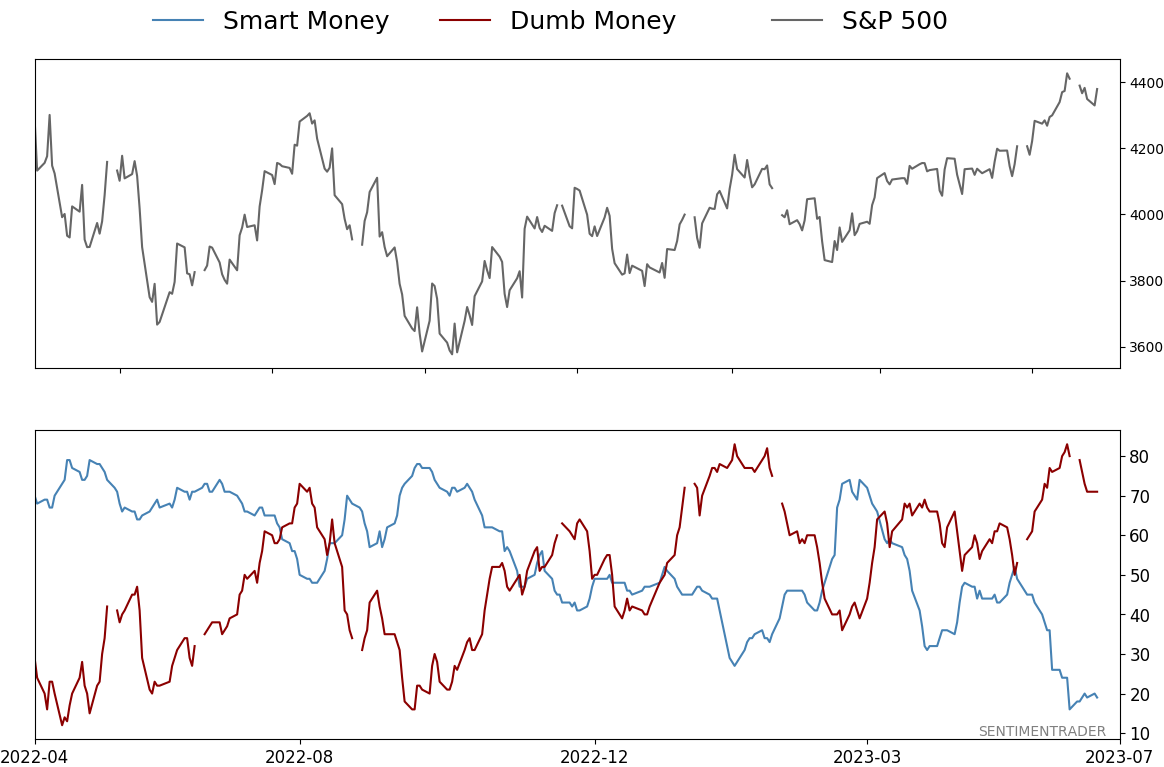
Smart / Dumb Money Confidence
|
Smart Money Confidence: 19%
Dumb Money Confidence: 71%
|
|
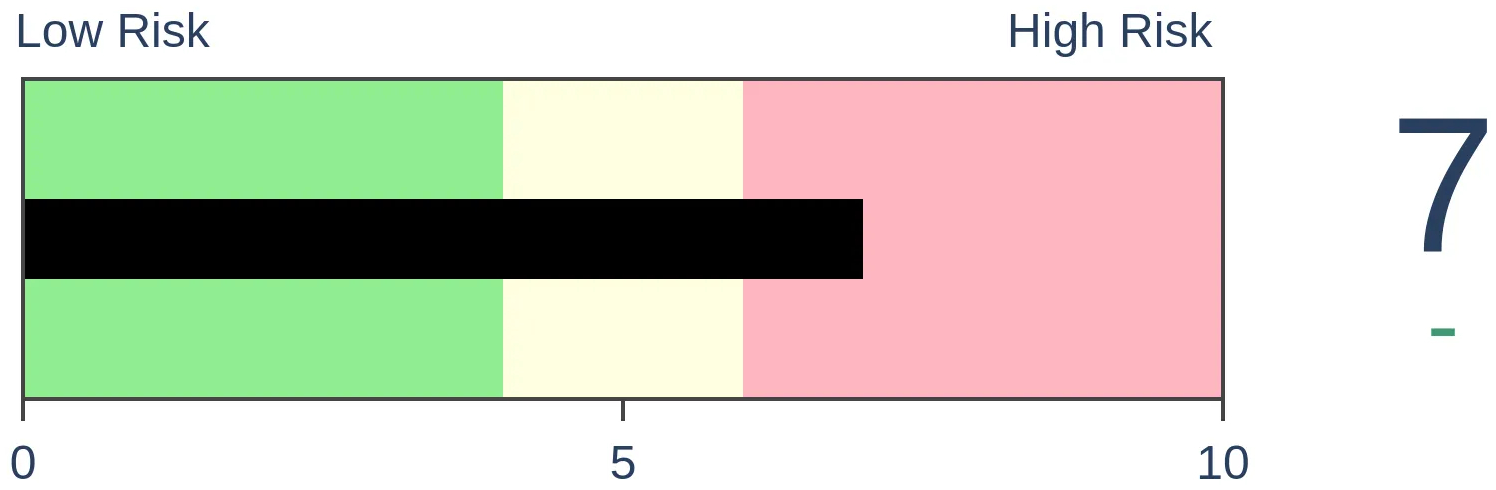
Risk Levels
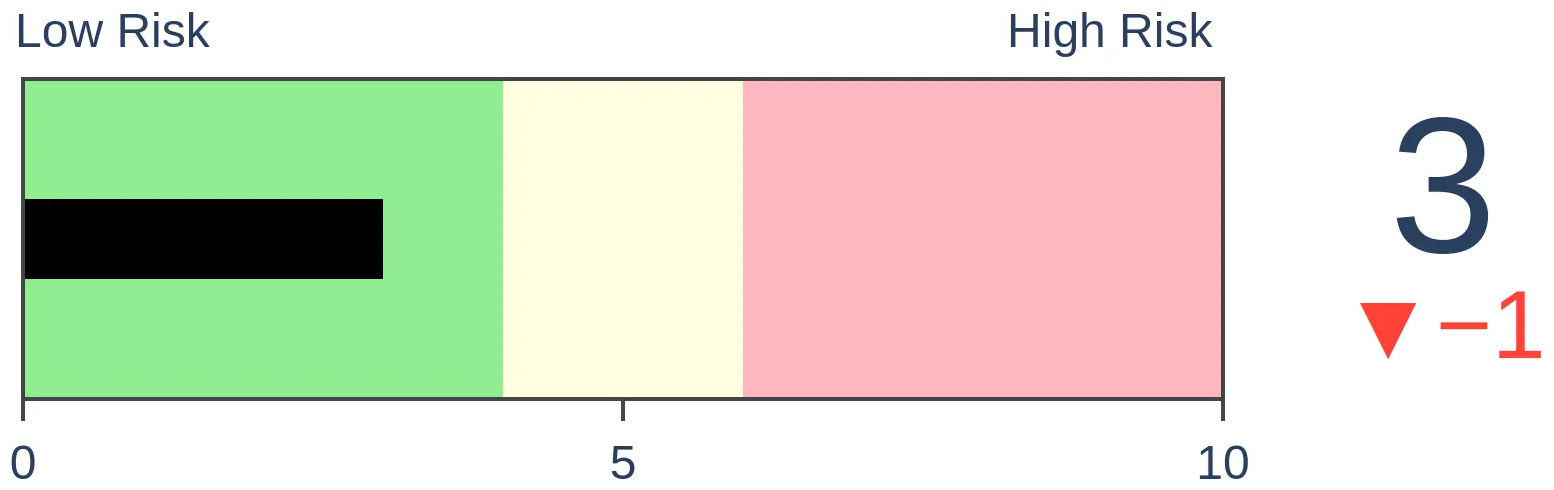
Stocks Short-Term

|
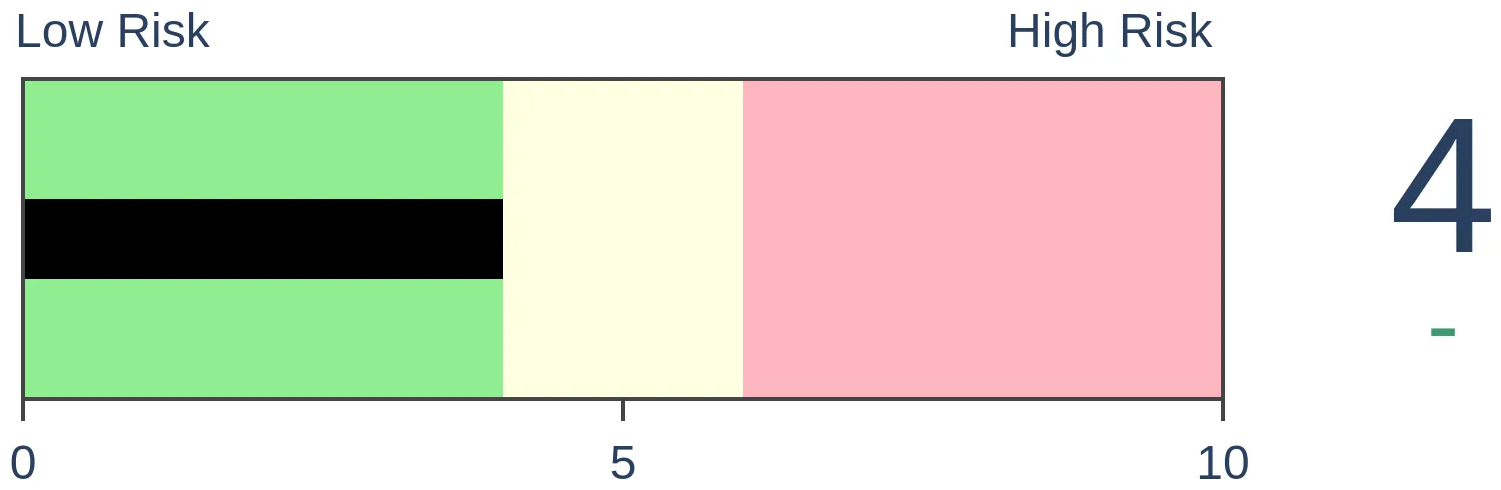
Stocks Medium-Term
|
|
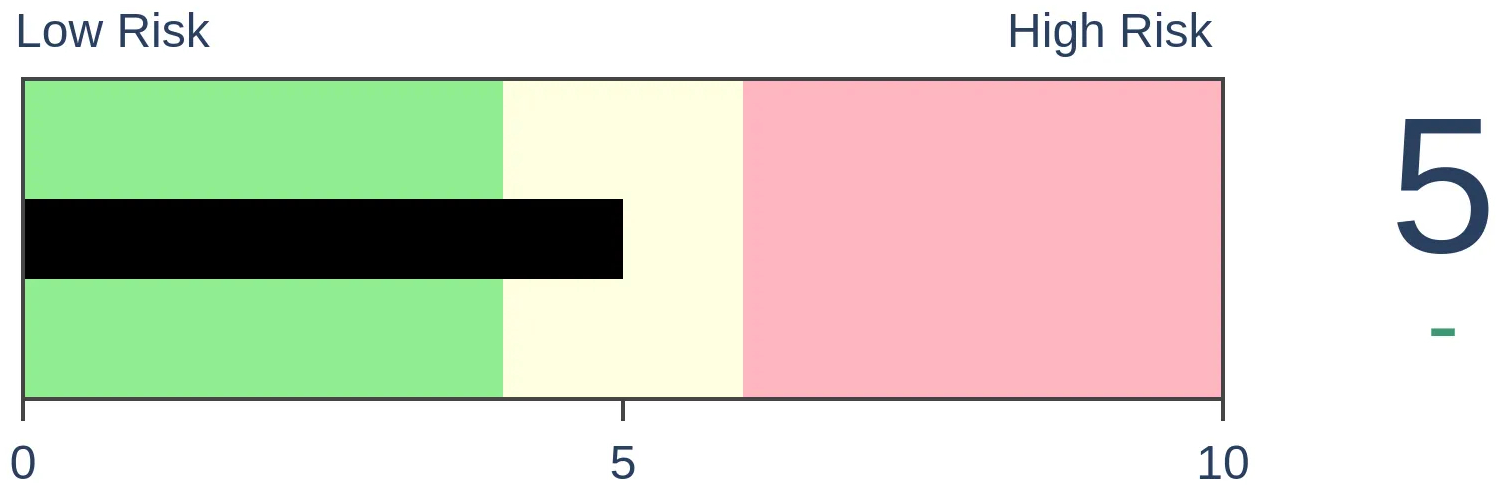
Bonds
|
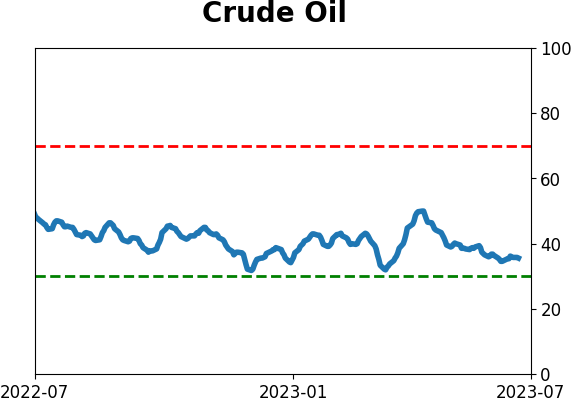
Crude Oil

|
|
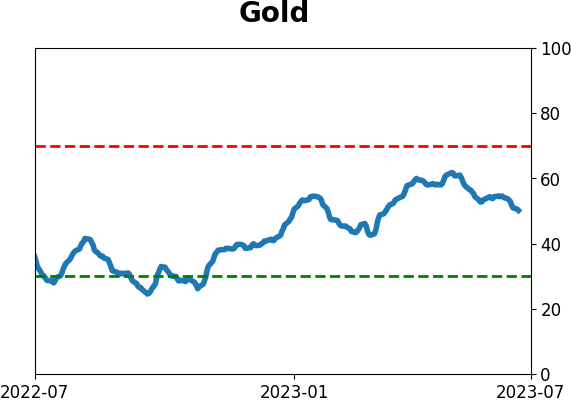
Gold
|
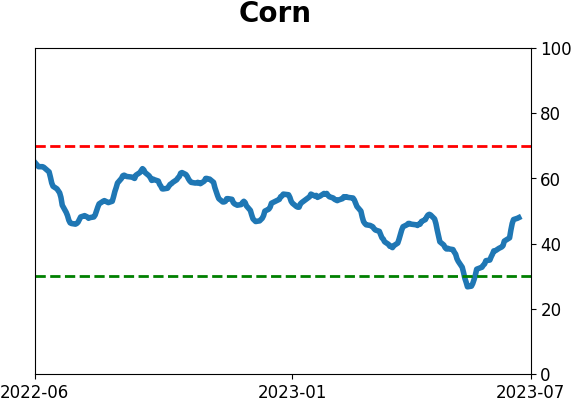
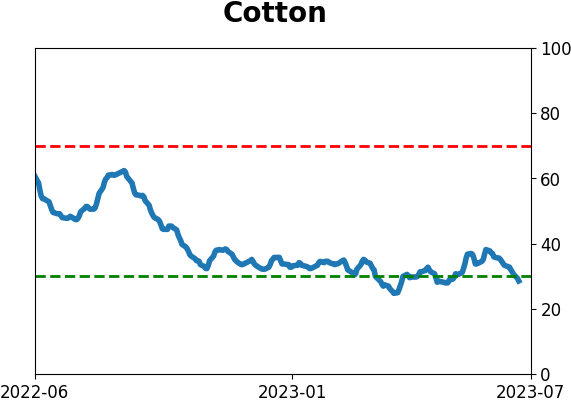
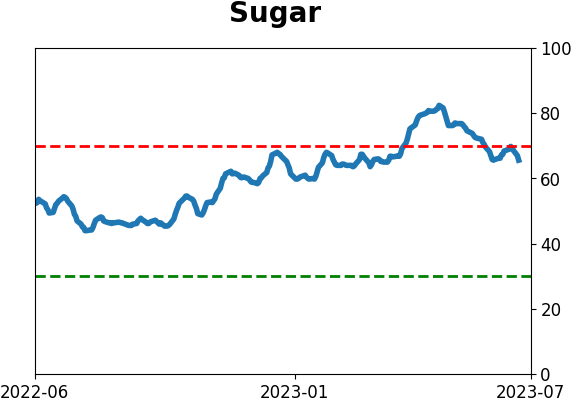
Agriculture
|
|
Research
By Jason Goepfert
BOTTOM LINE
After a year like 2022, investors are hyper-focused on any indication that other investors have become too complacent. As such, they've latched onto a recent jump in call option buying as a warning sign. But options traders are still buying a lot of protective puts. Broad and objective measures of options activity do not currently show worrying extremes.
FORECAST / TIMEFRAME
None
|
Key points:
- The smallest options traders are buying a lot of call options again, reminiscent of 2020-21
- But they're also still buying a lot of puts, suspicious of a repeat of the 2022 bear market
- Broad and objective measures of small trader options activity show only mediocre sentiment, not emotional extremes
Small traders are buying a lot of call options...but a lot of puts, too
Options traders are coming back and betting heavily on the idea of a new bull market. Kind of.
As noted by The Wall Street Journal:
Traders are piling into bullish options bets that would profit if the recent stock rally continues. There has been a flurry of trading tied to continued advances in everything from artificial-intelligence stocks to smaller, economically sensitive companies and regional banks. There has also been record activity tied to S&P 500 index options, with one-day trading in calls surging, according to Cboe Global Markets data. The elevated trading has pushed up prices of such call options to extreme levels, a sign of ebullience.
The article isn't wrong, just incomplete. We've seen repeatedly over the years that it's imperative to look at both sides of indicators like margin debt or options trading or certain breadth metrics. Looking at one without the other is like saying Silicon Valley Bank was a paragon of health because it had $200 billion in assets, or that Berkshire Hathaway is on the verge of insolvency because it has $120 billion in debt.
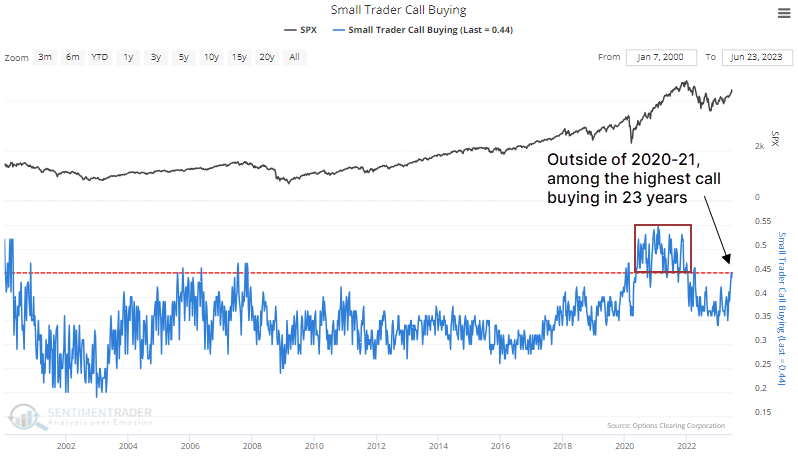
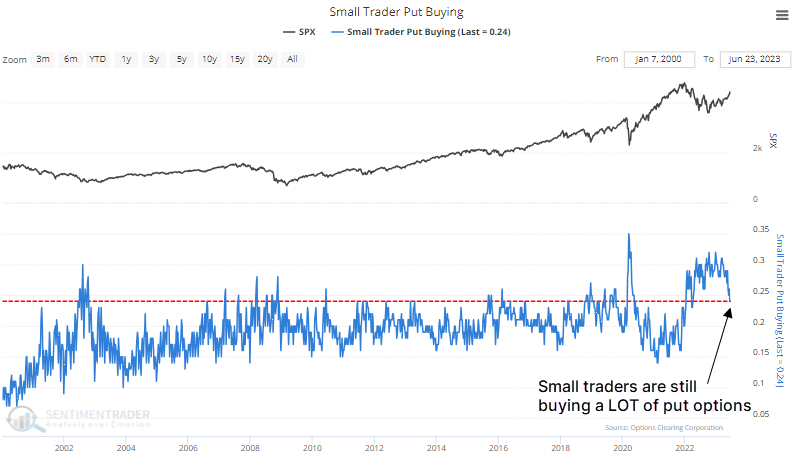
When looking at options trades as an indicator of sentiment, the most effective population we've found is small traders, buying or selling ten or fewer contracts at a time. And there is little doubt they've rediscovered the miracle of leveraged call options during a bull move. They recently spent 45% of their volume buying call options to open on equities and ETFs, among the most in 23 years outside of the stimmy-fueled option-buying spurts in 2020 and 2021. This looks...not good
Now here's where the narrative falls apart. Last week, small traders spent about 24% of their volume buying put options to open. That's more than during most of the panics of the past 23 years. If stocks peaked here, it would be with the most put buying of any major peak since 2000.
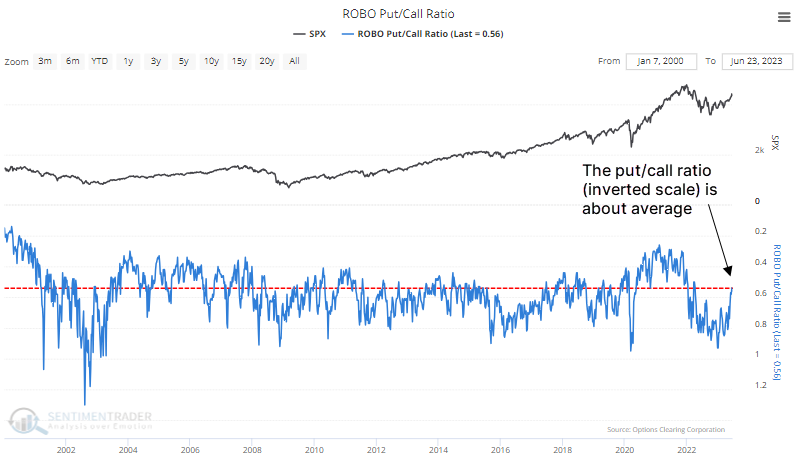
Combining the two indicators gives us the ROBO Put/Call Ratio. The chart below, with an inverted scale to better align with price peaks and troughs, shows that the current reading is only about average historically. It is not showing excessive speculative activity, using what we believe to be one of the most objective and accurate measures of options market activity.
Another way of looking at this is through the net premiums that small traders spend on calls versus puts. Even if they're buying quite a few puts, maybe they're not paying much for the protection, and that could also be a sign of too much complacency. But the Small Trader Put/Call Premium is not showing any extreme. It's even more neutral than the measure using contract volume we saw above (the chart below uses an inverted scale).
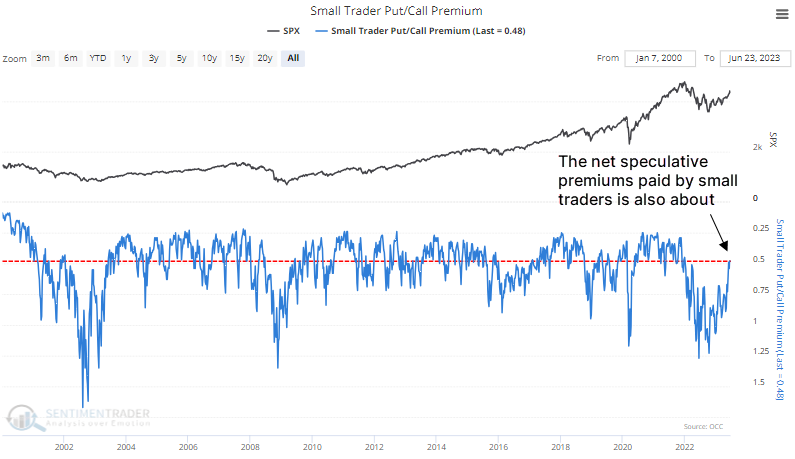
We looked at this in January and saw how extreme it was even months after the October price bottom. While that historic extreme has been largely alleviated, the current level is exactly average relative to the past 1,226 weeks of history.
The counter-argument could be, "Well, we're in a bear market, so it takes less of an extreme to signal complacency." Okay, sure. That's an argument, probably just not a very good one, considering everything we've looked at since October.
What the research tells us...
Countless times over the past decade, it has been beneficial to watch the behavior of small options traders. We get to see how some of the most emotional investors are positioned, using real money in leveraged and expiring instruments. While this data was significantly skewed by stimulus payments in 2020 and to a lesser extent in 2021, their behavior has been a consistent contrary indicator at extremes outside of that abnormal window.
While their recent rediscovery of long call options seems like a major warning sign, they're still buying a boatload of put options. Our broadest and most objective measures for these traders suggest that their overall behavior is not equivalent to what was seen at most of the major peaks over the past 23 years.
Indicators at Extremes
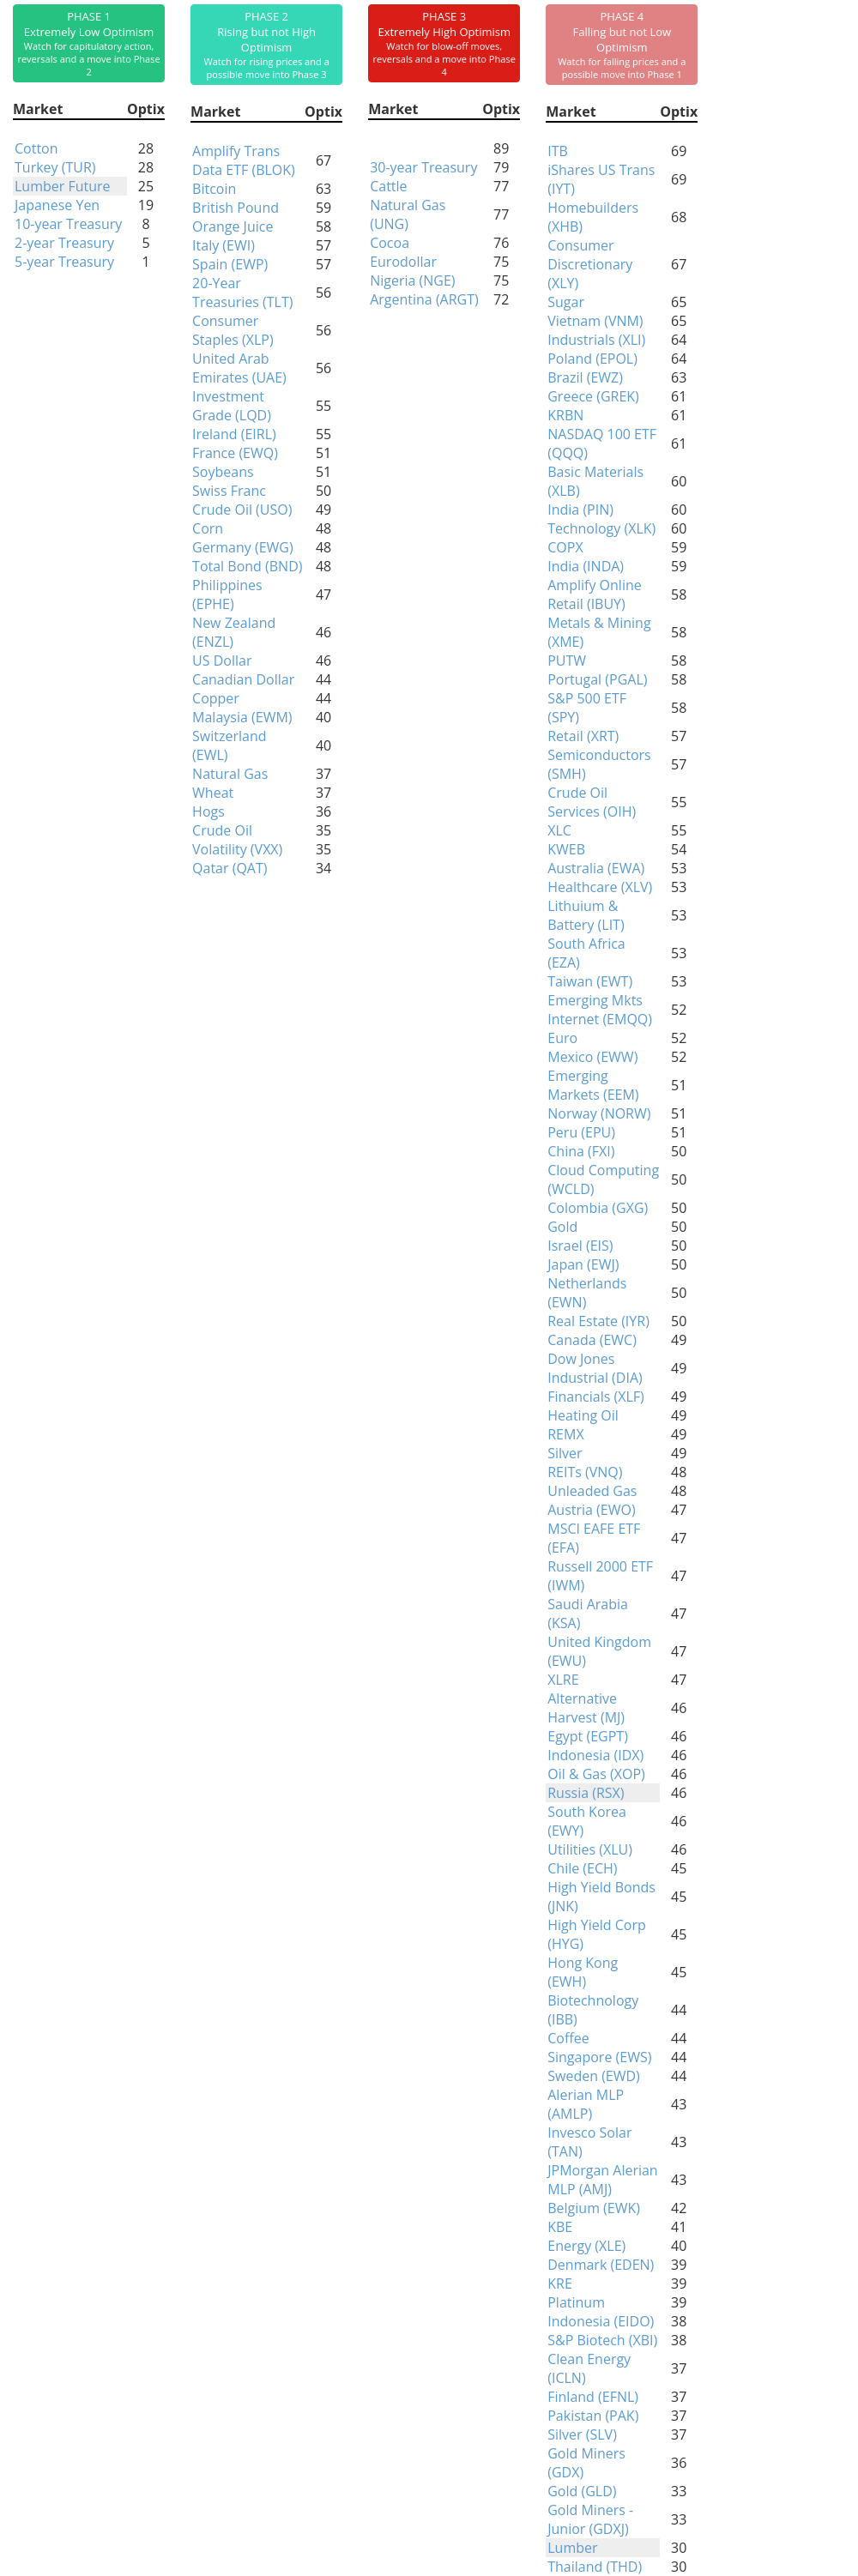
Phase Table
Ranks
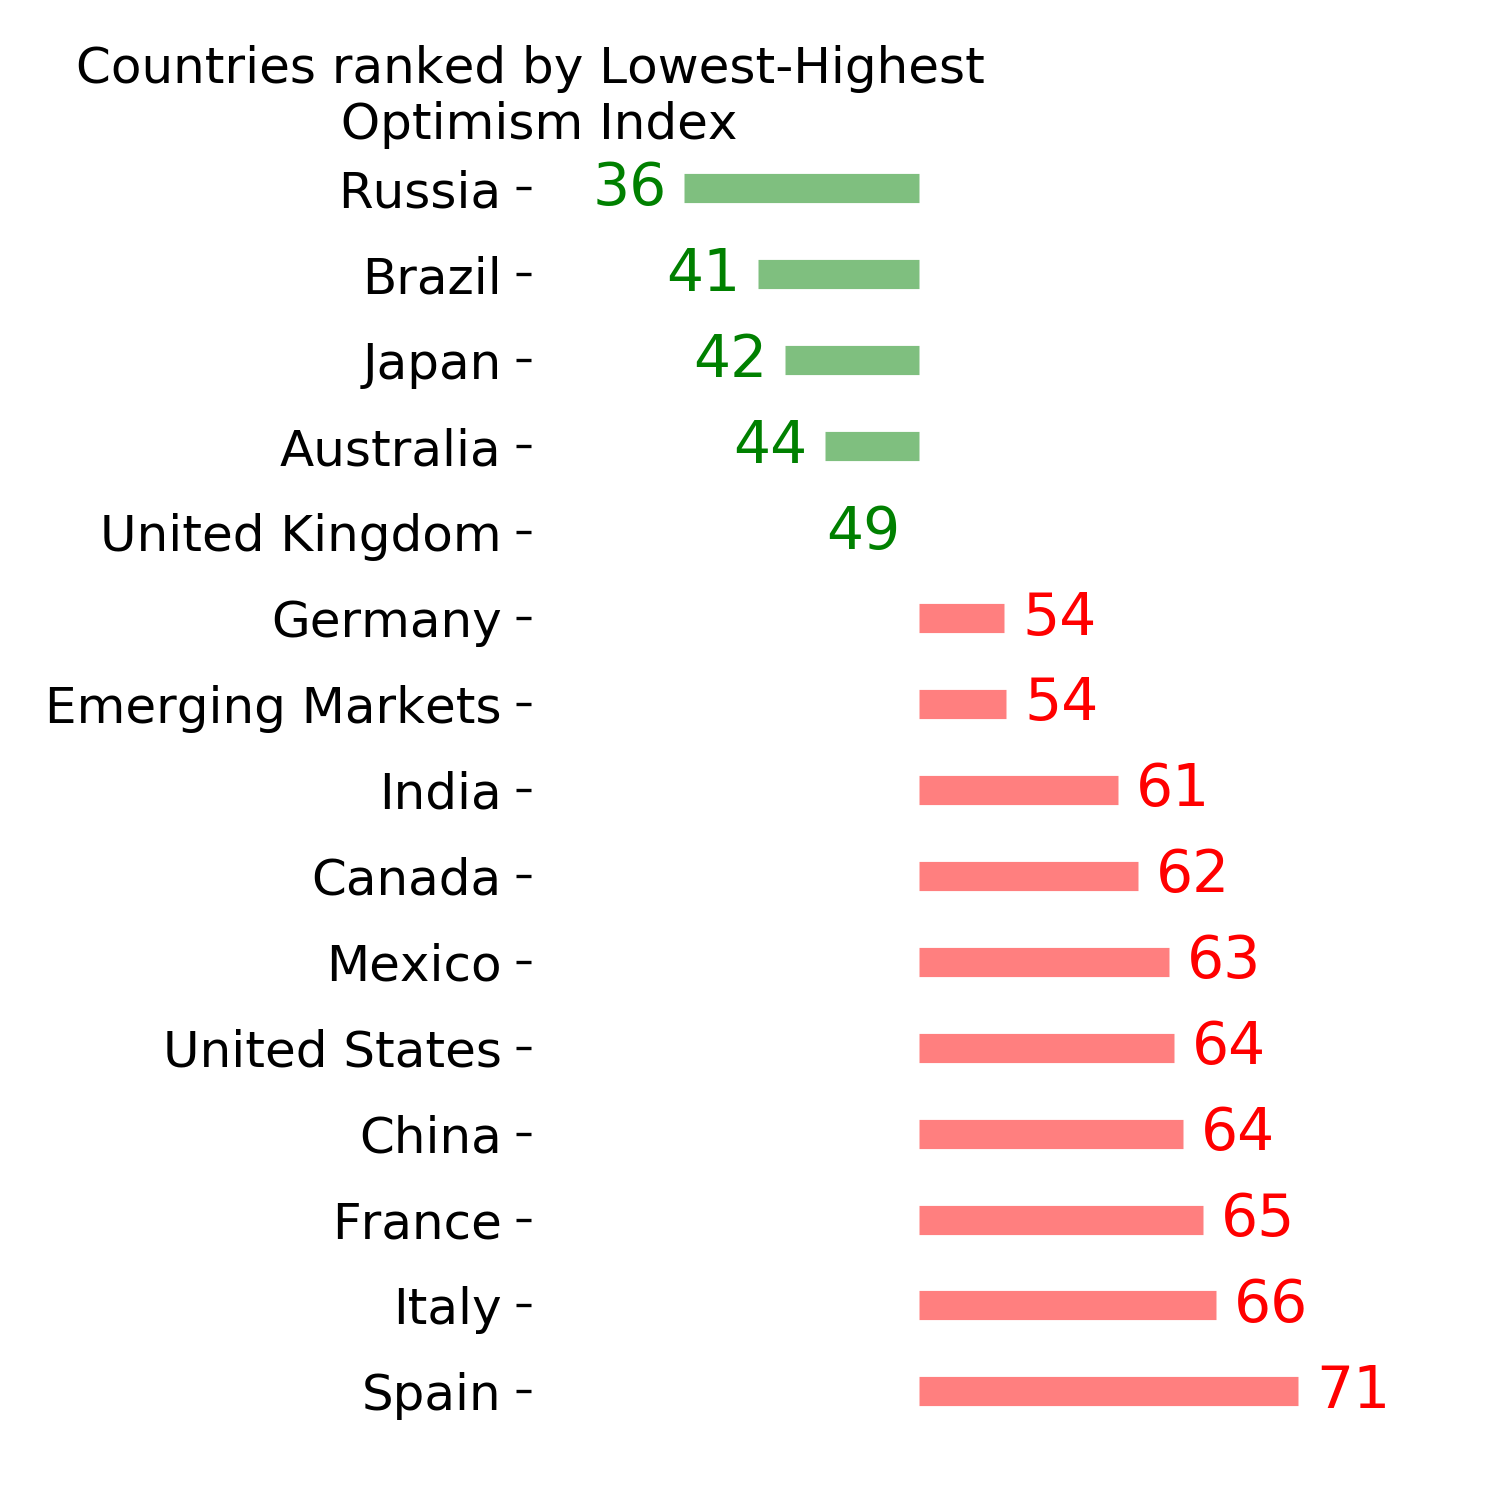
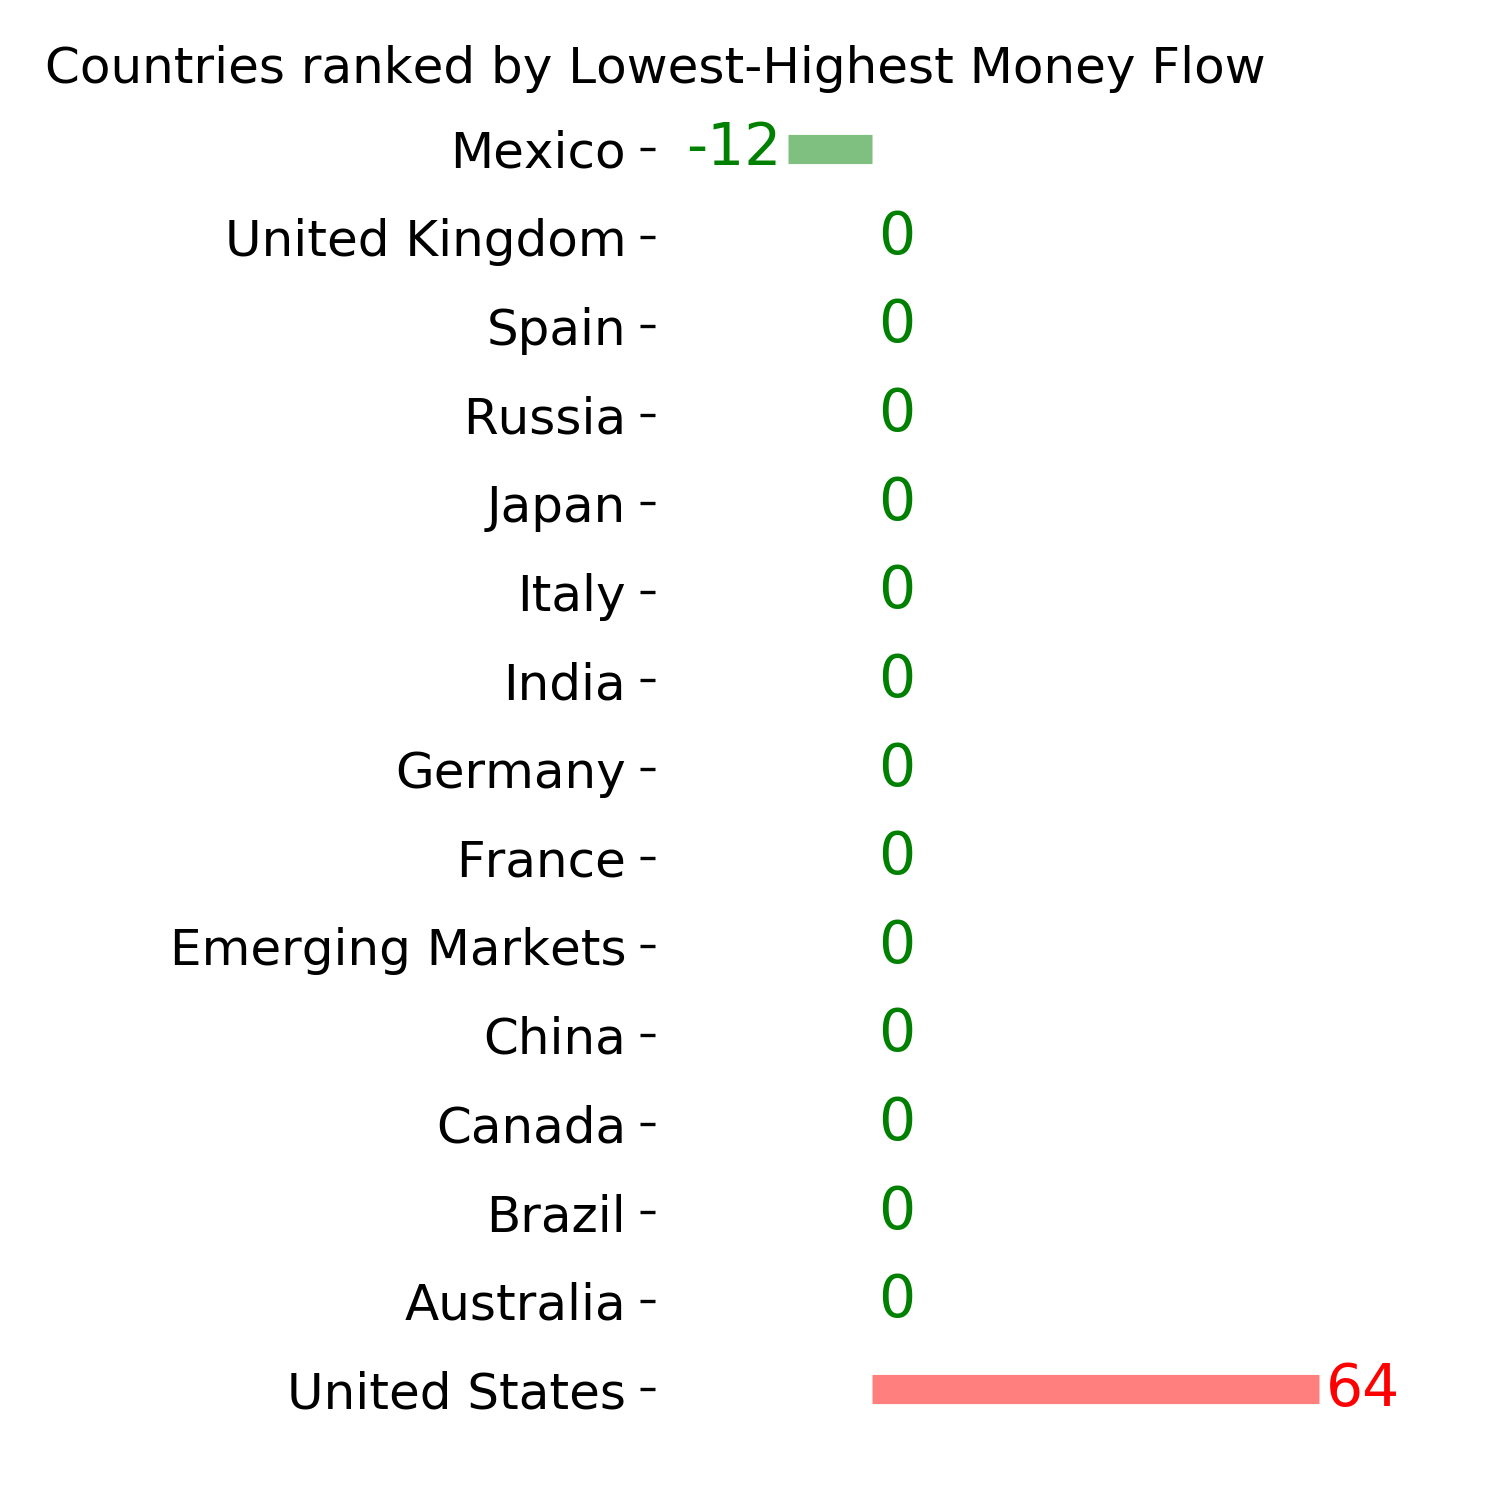
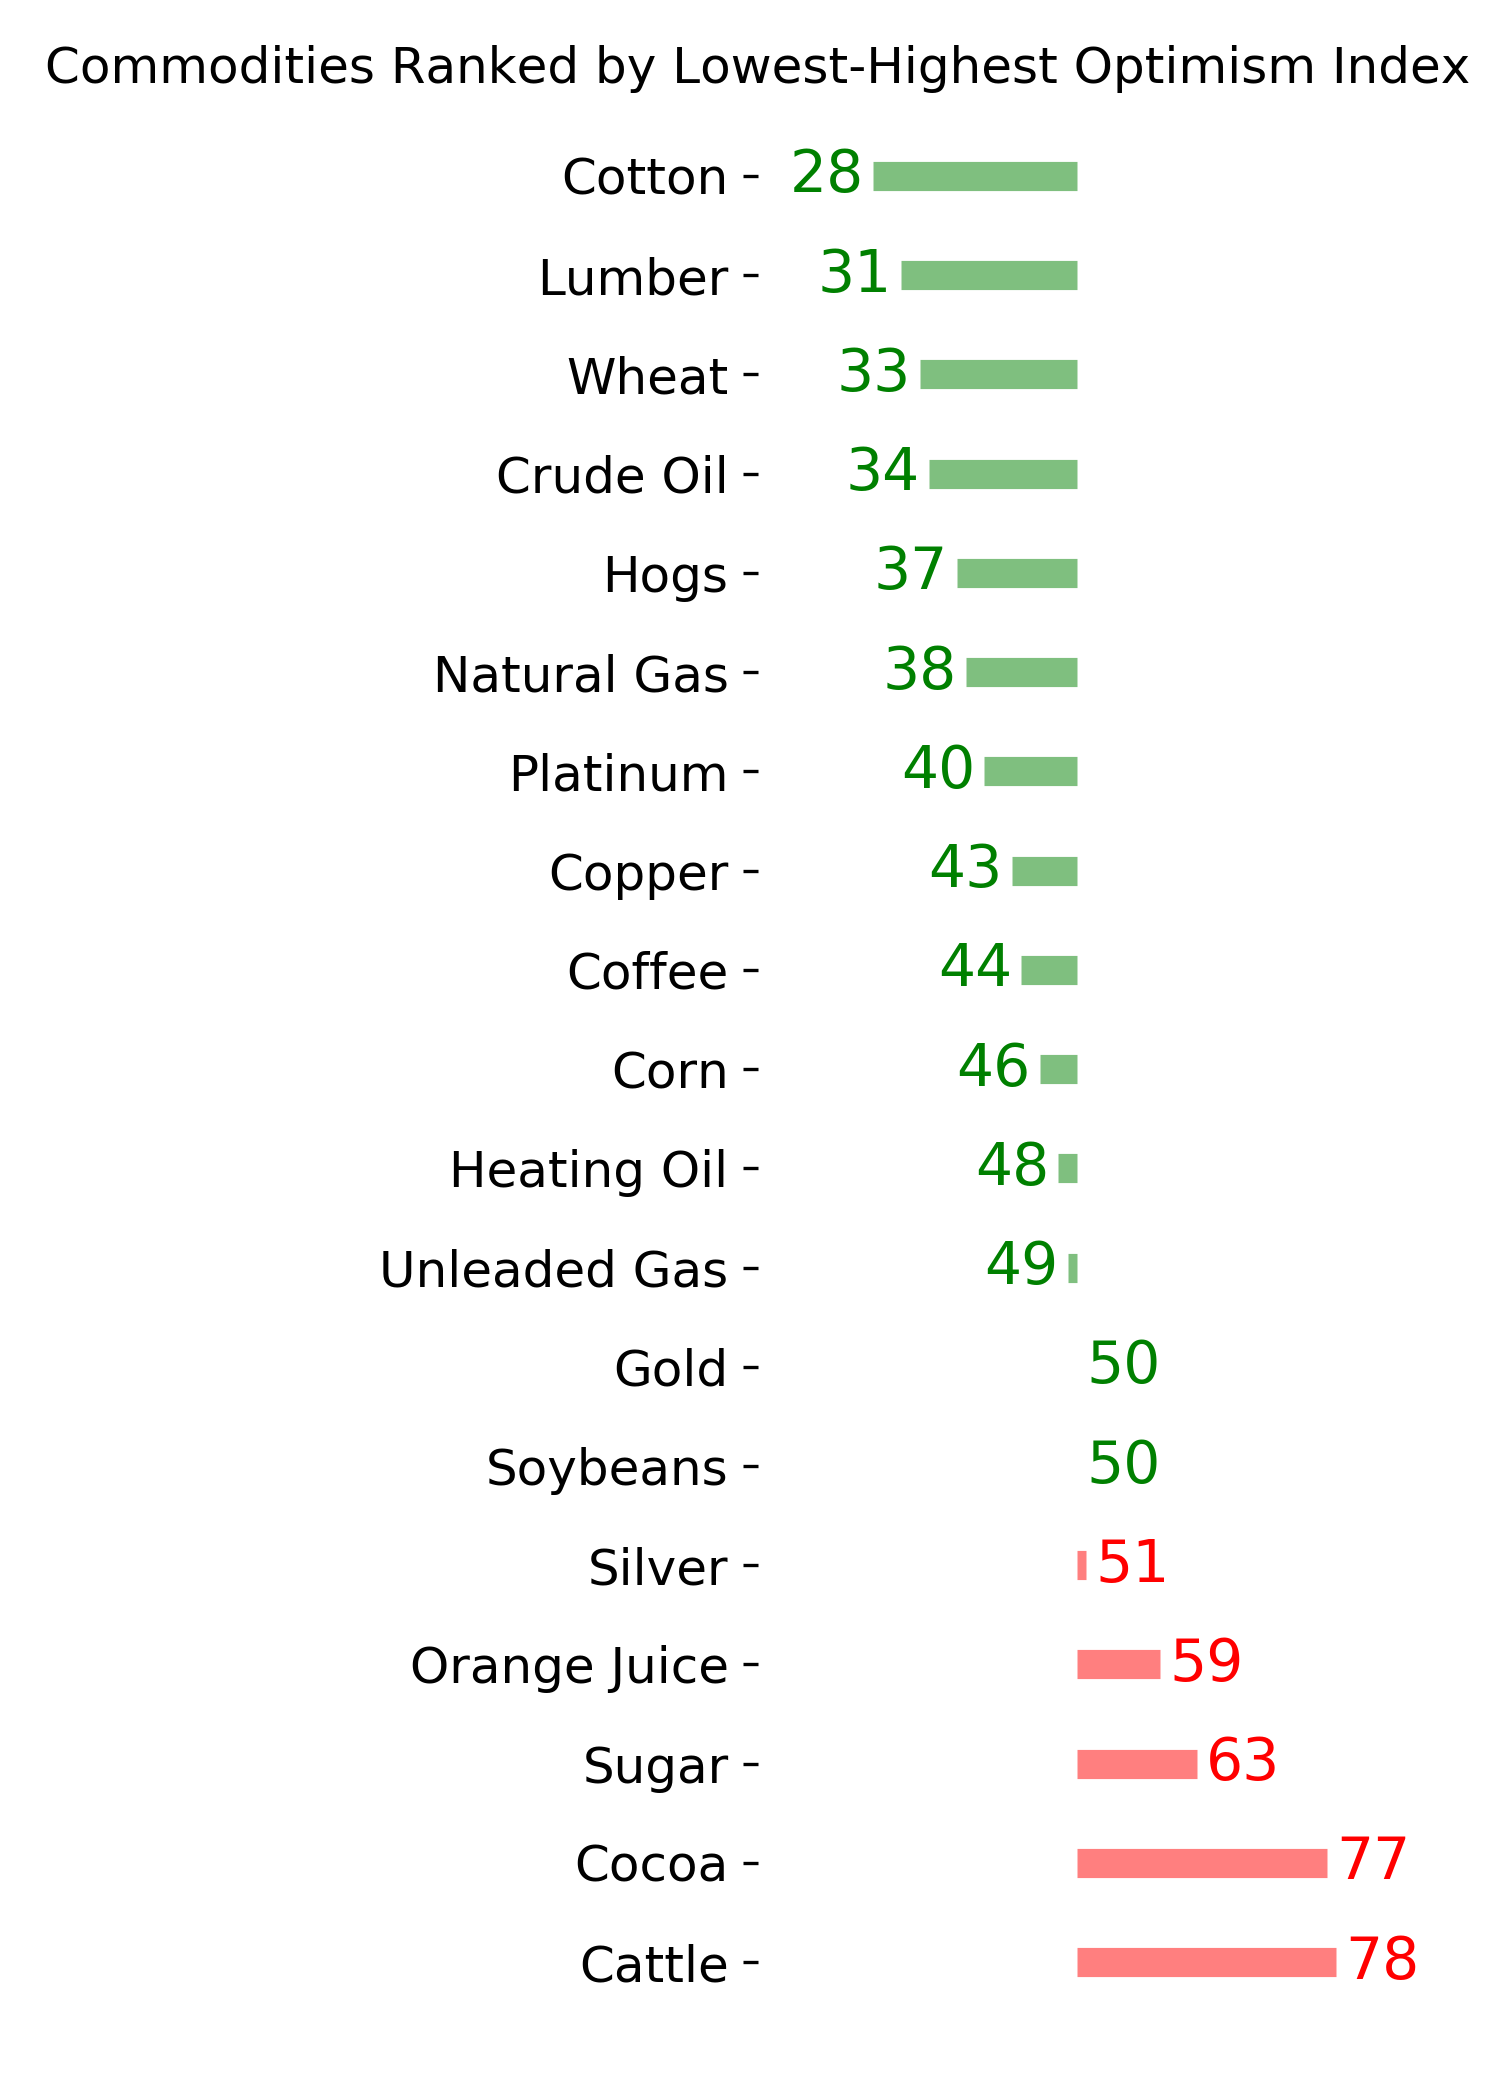
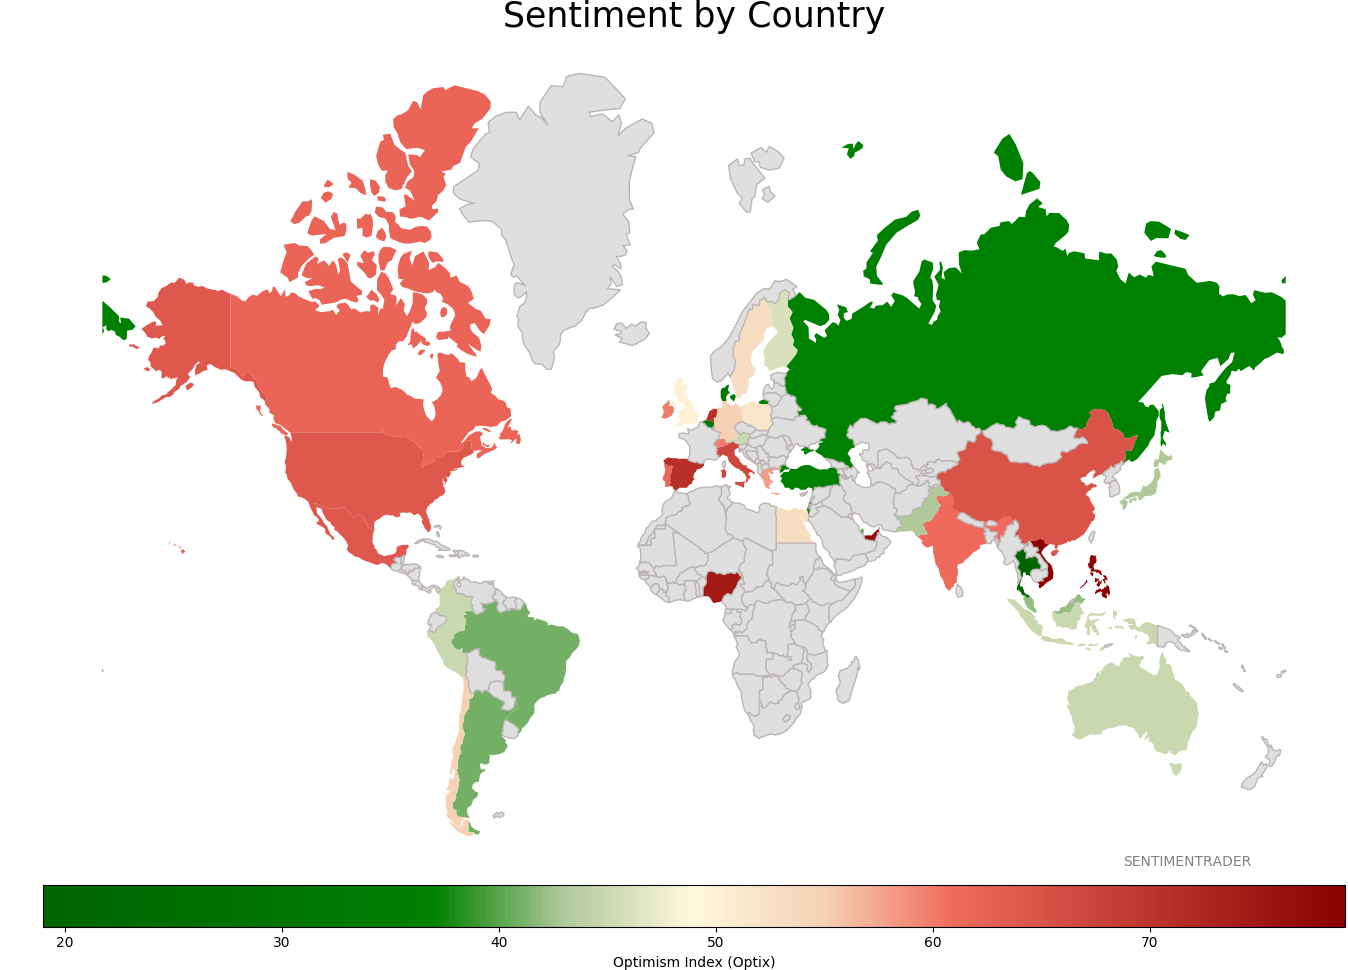
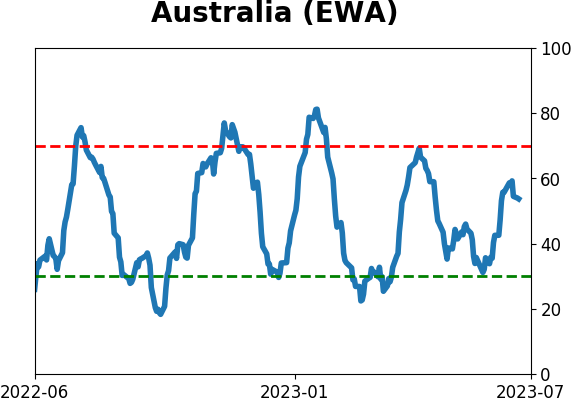
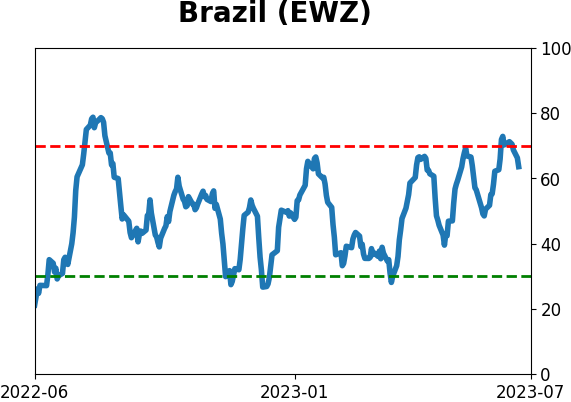
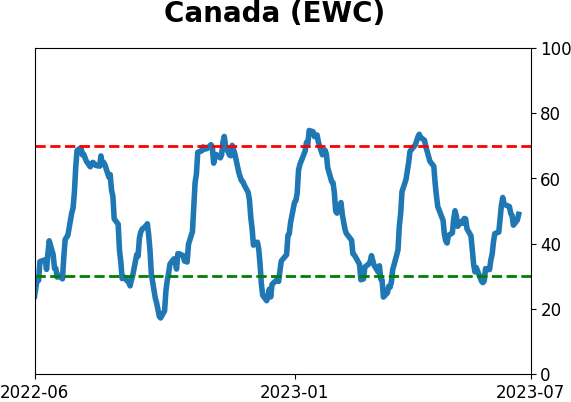
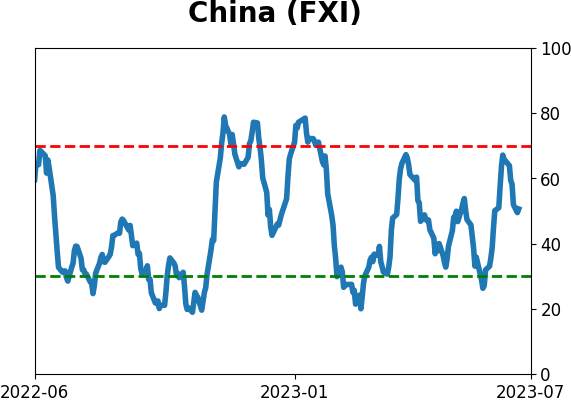
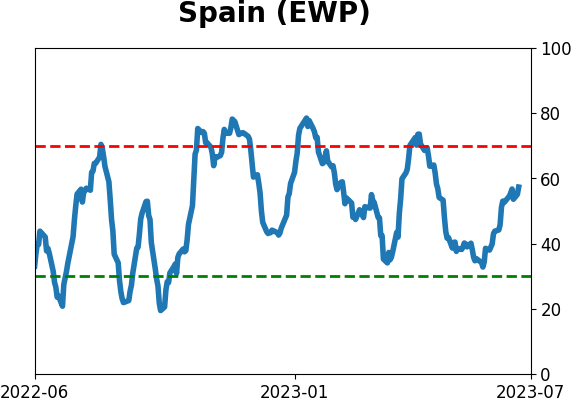
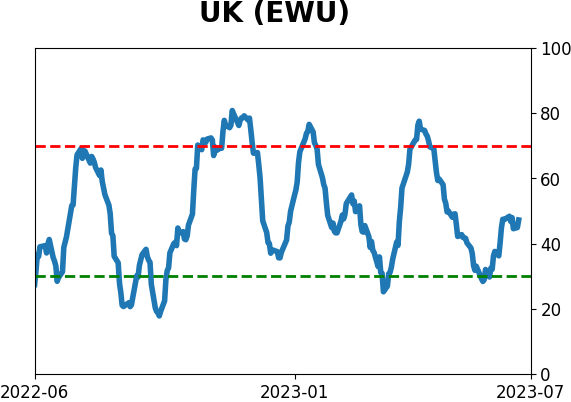
Sentiment Around The World
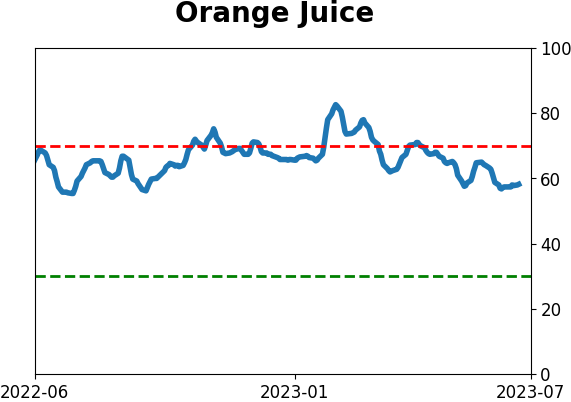
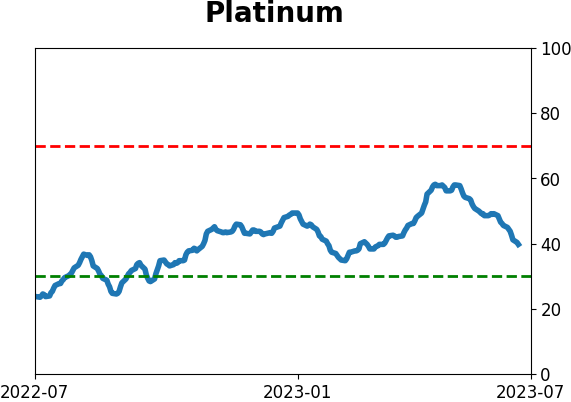
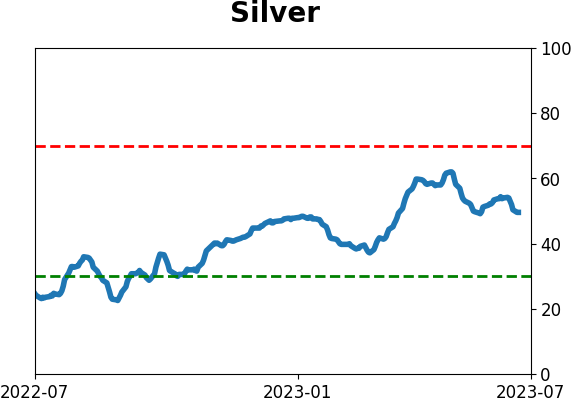
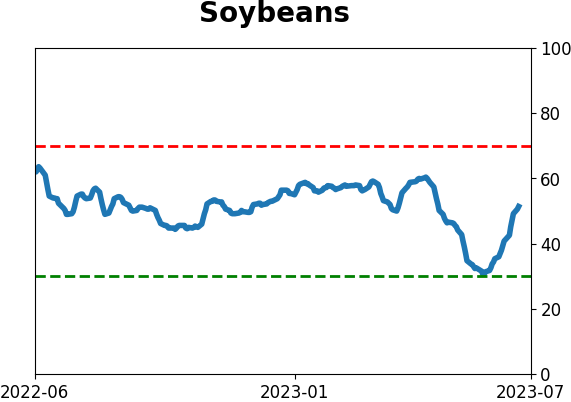
Optimism Index Thumbnails
|
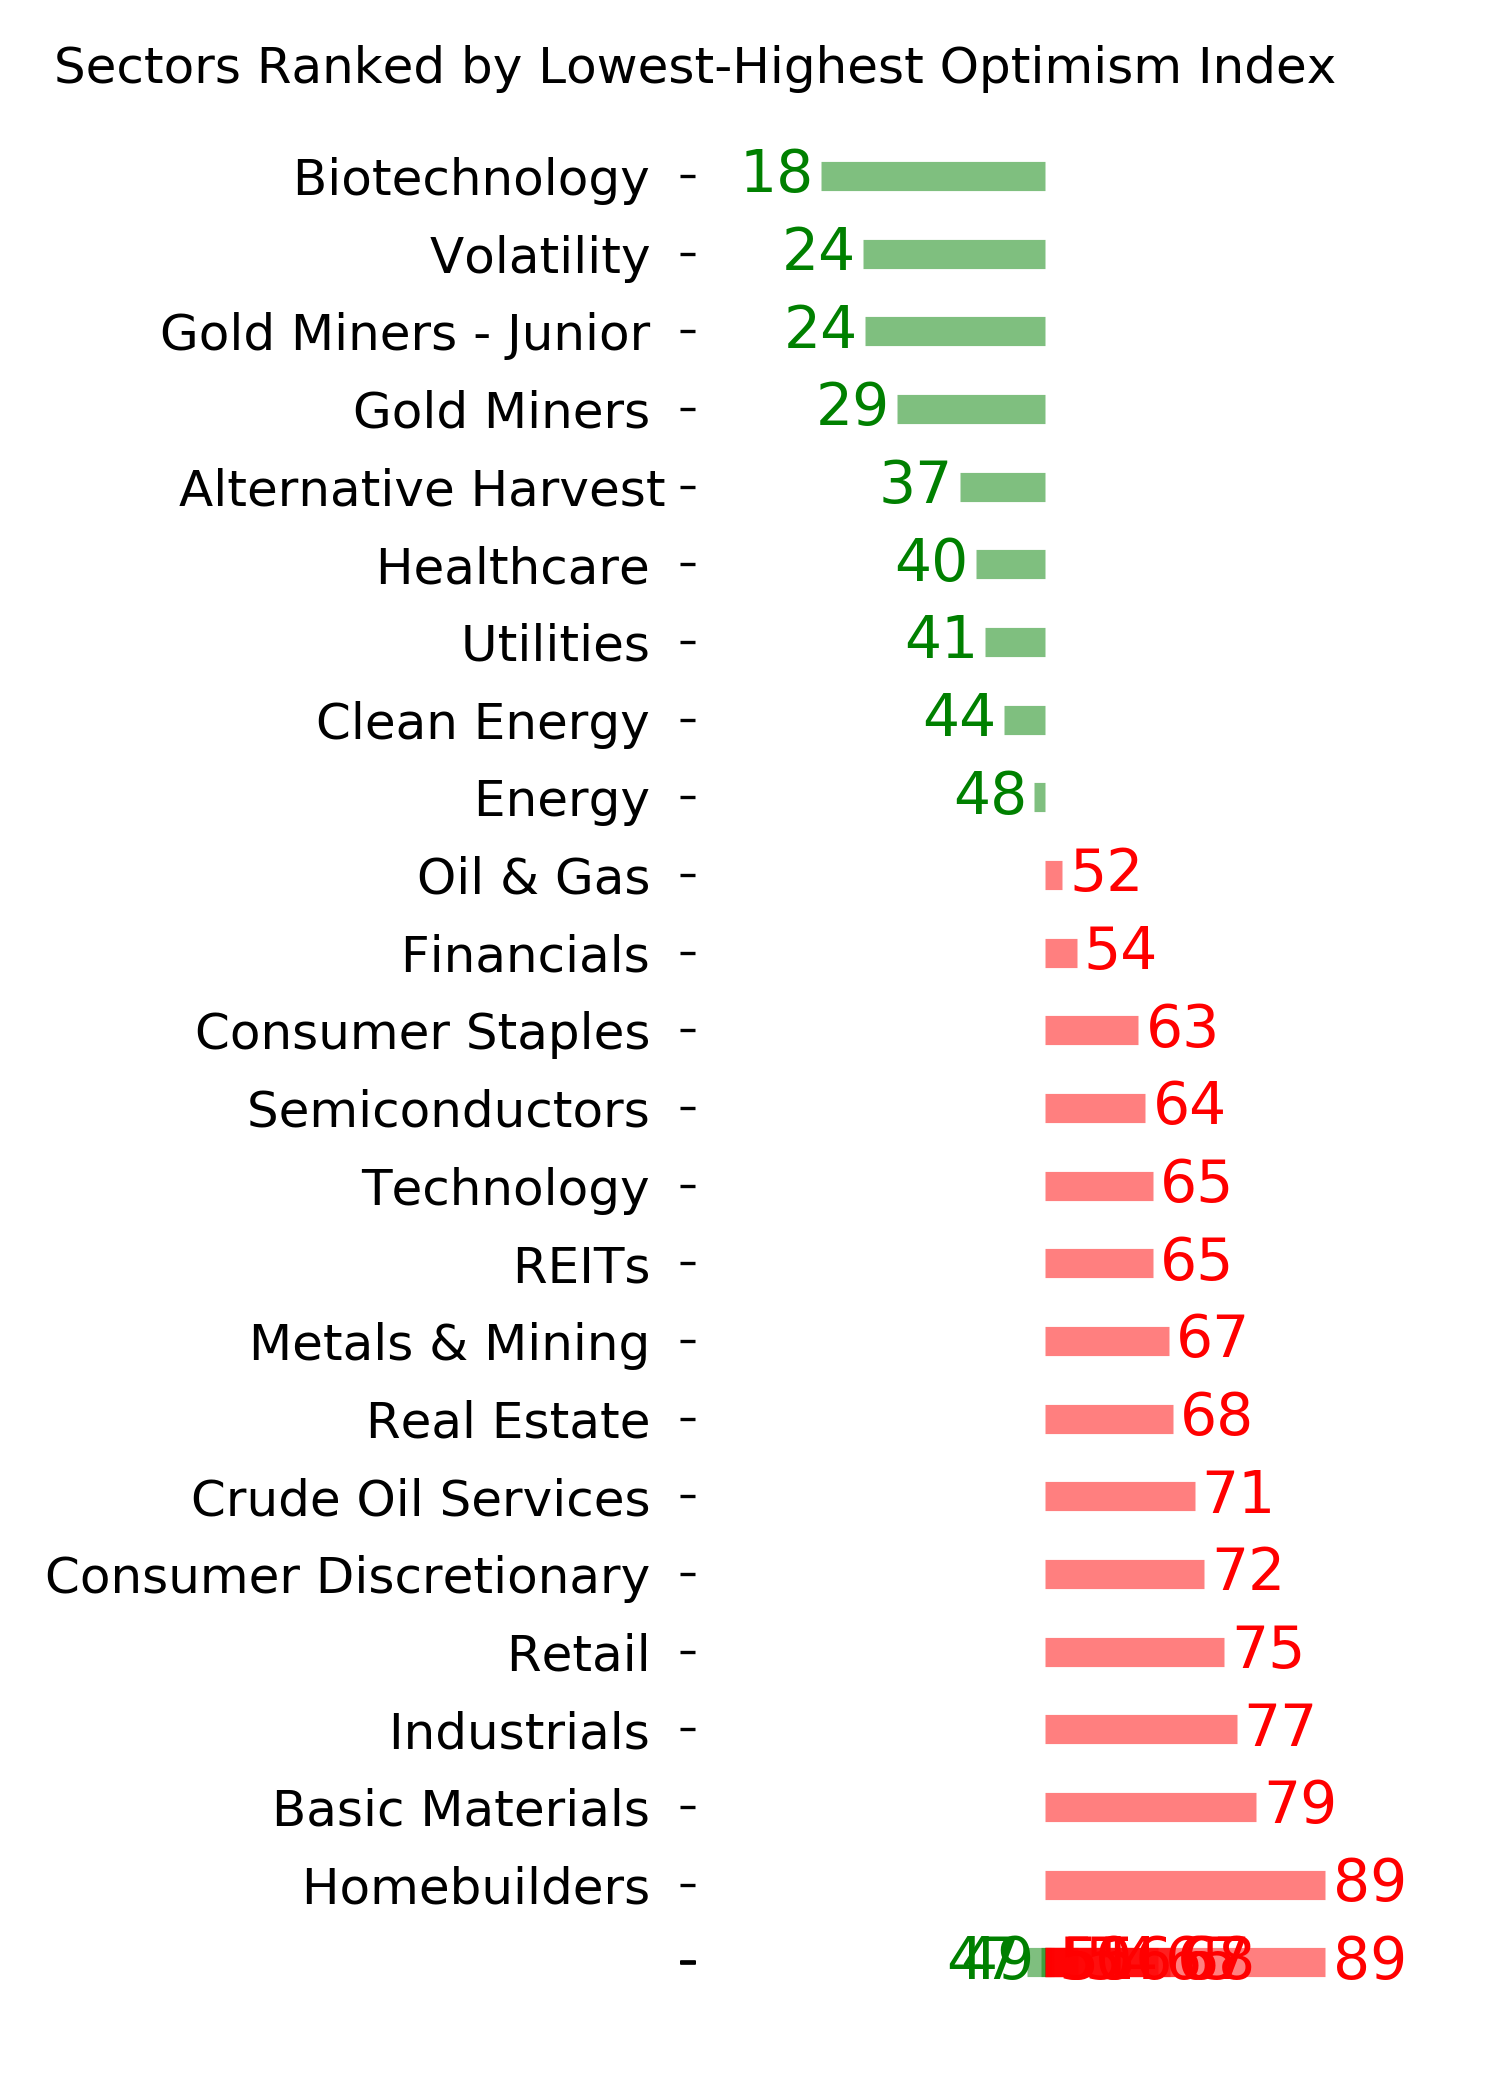
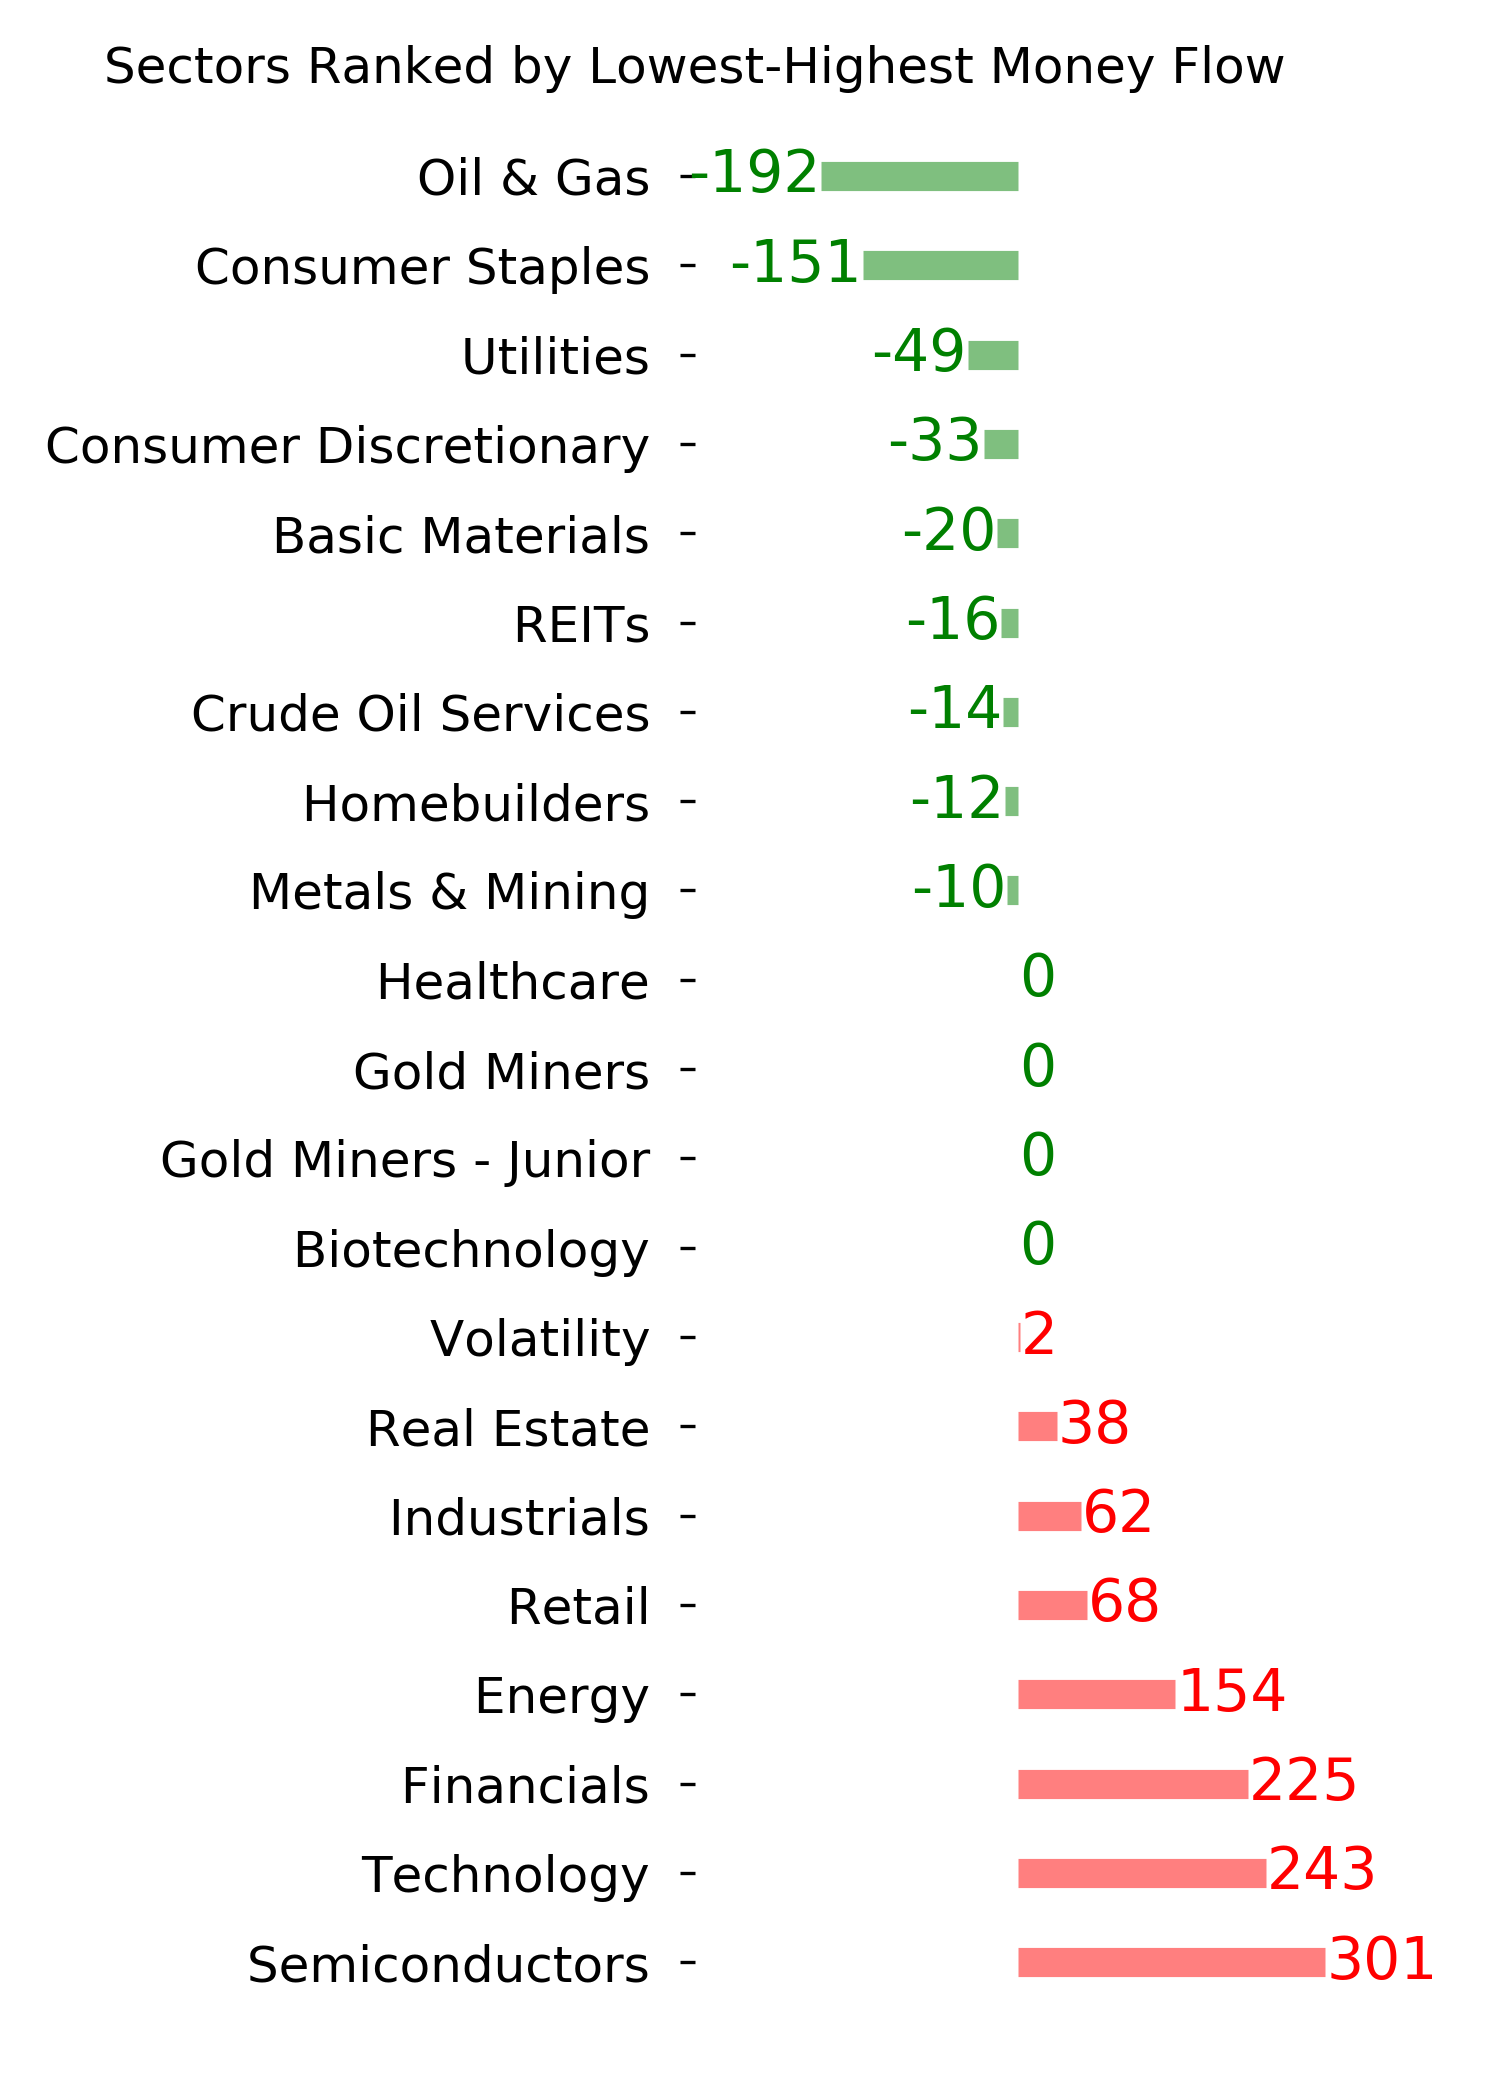
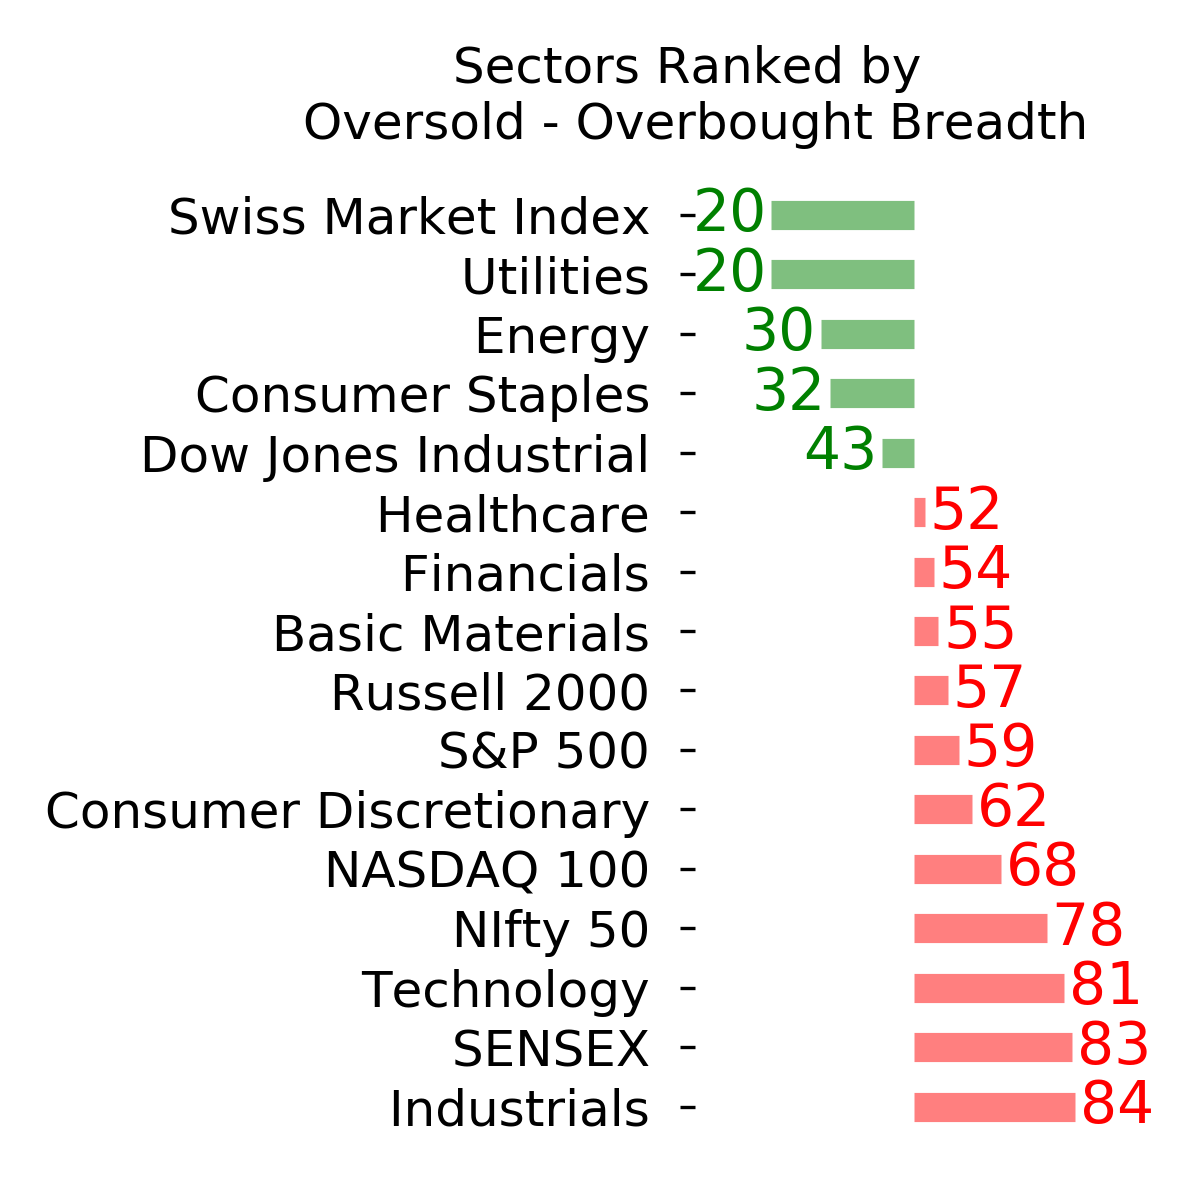
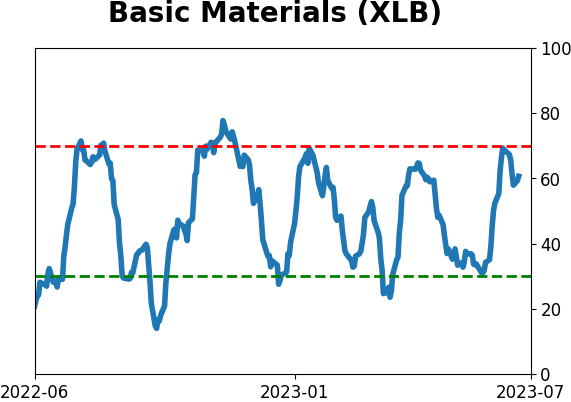
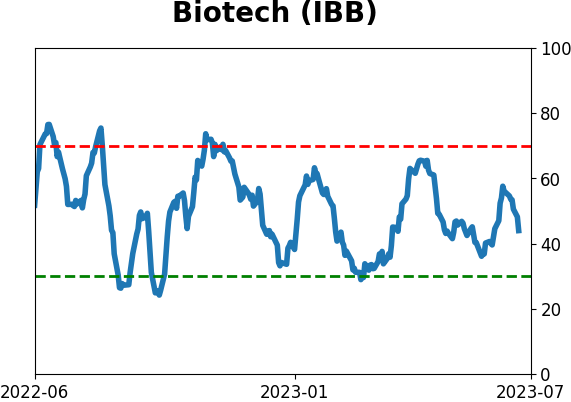
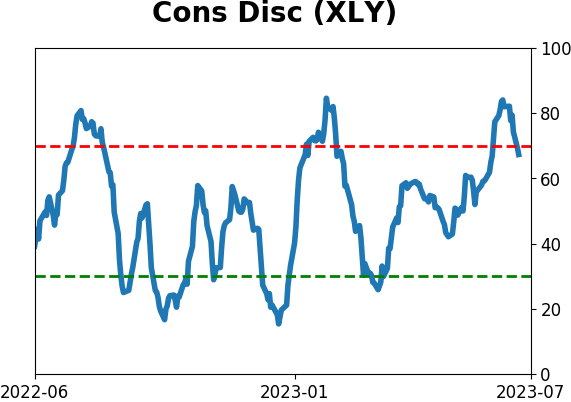
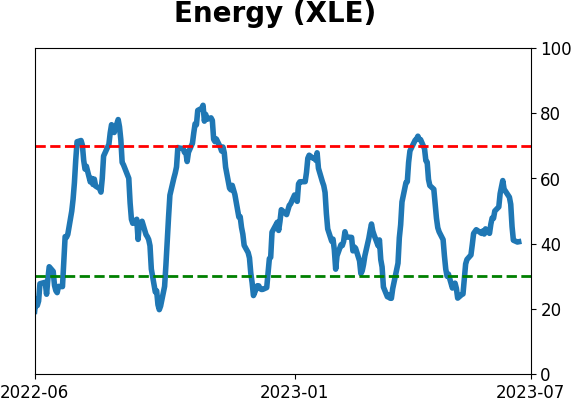
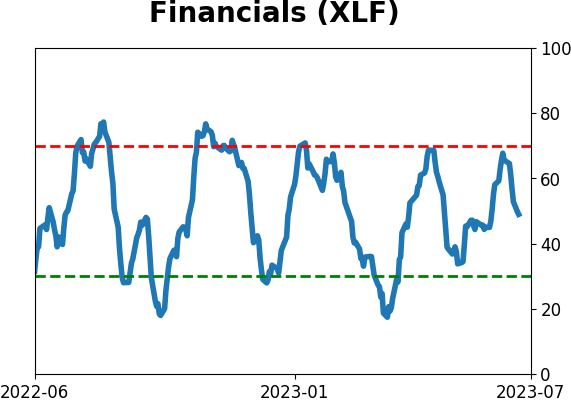
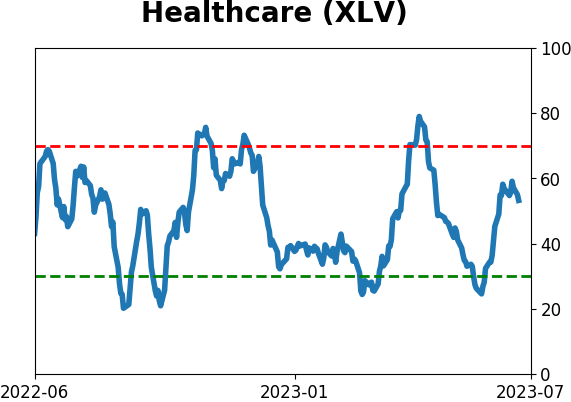
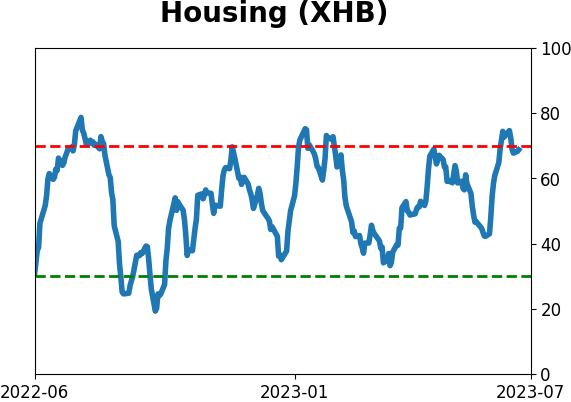
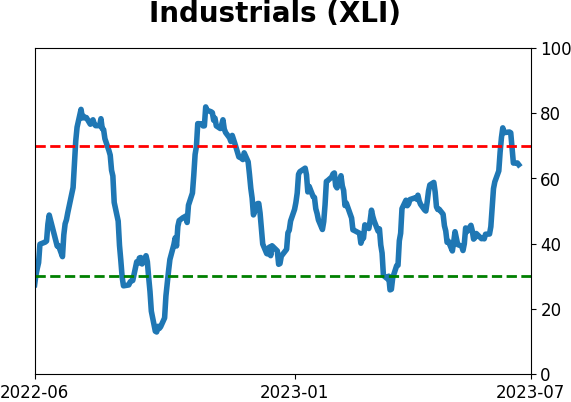
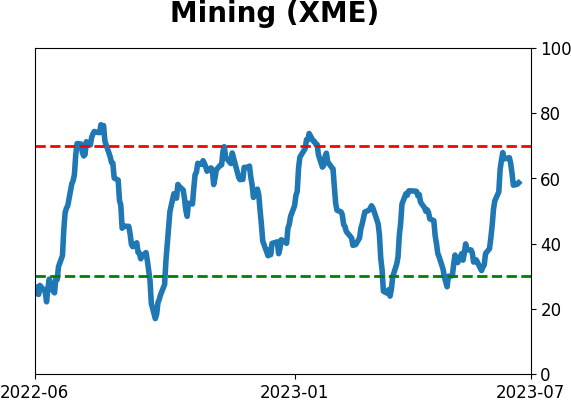
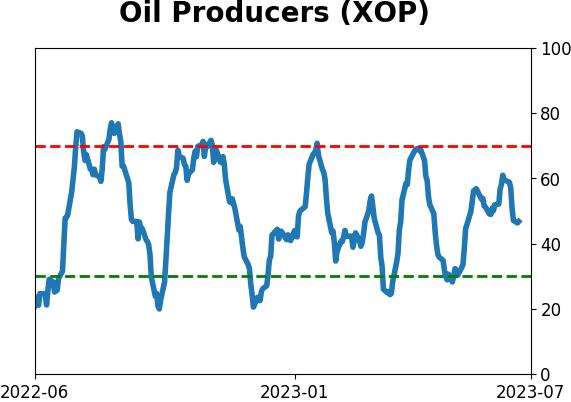
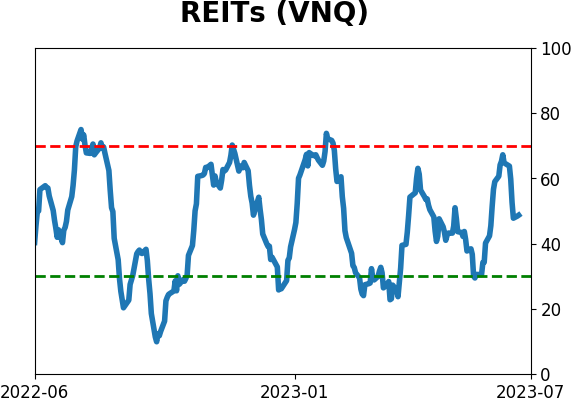
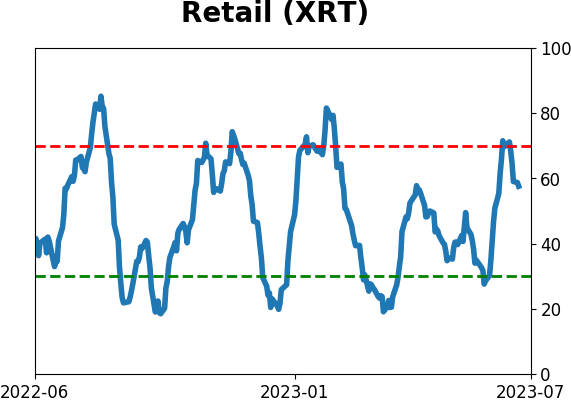
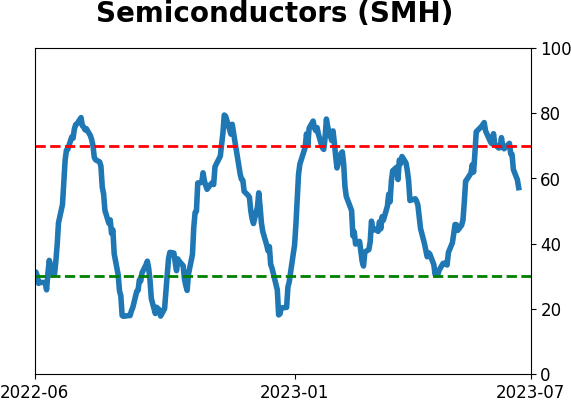
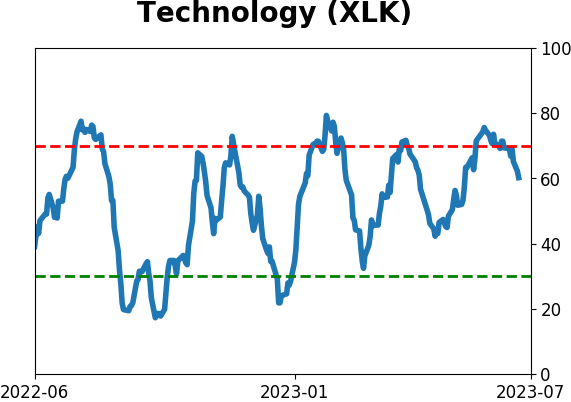
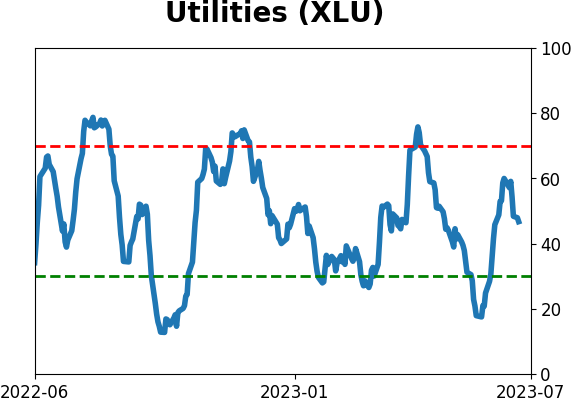
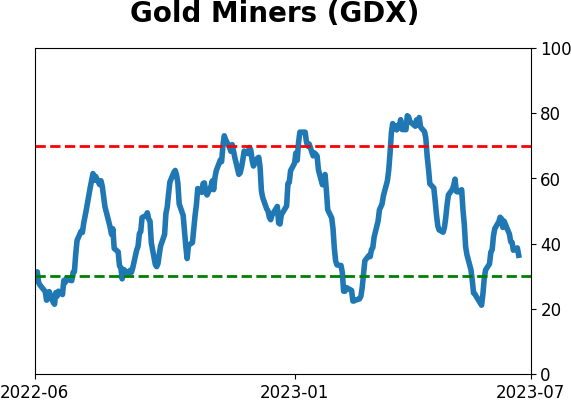
Sector ETF's - 10-Day Moving Average
|
|
|
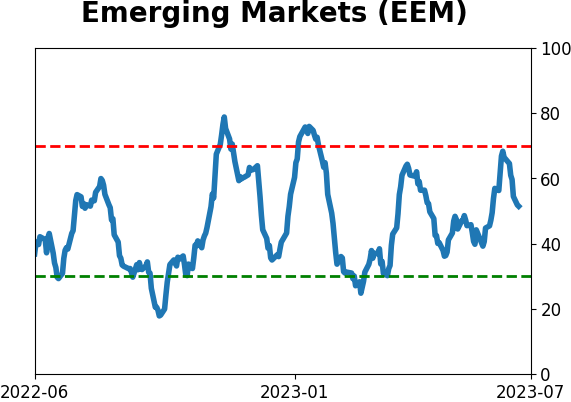
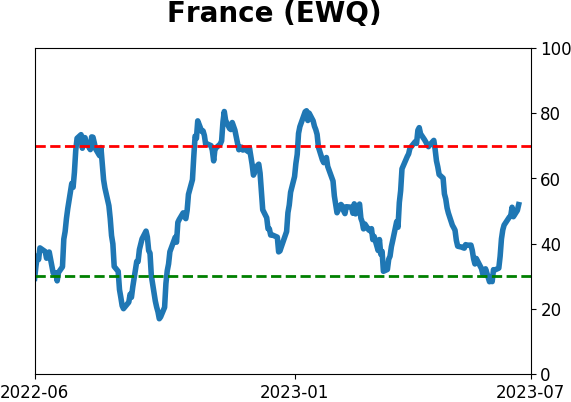
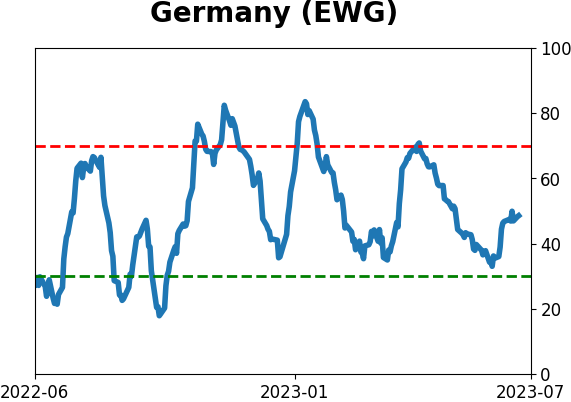
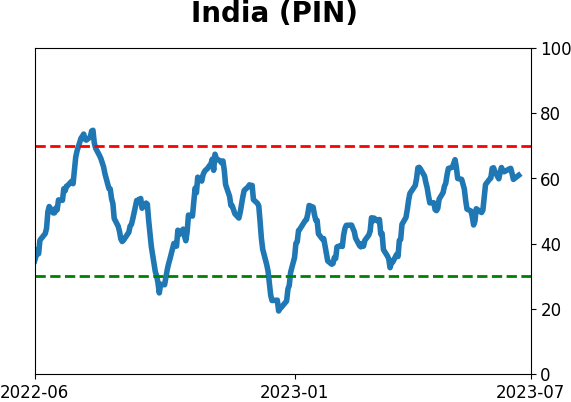
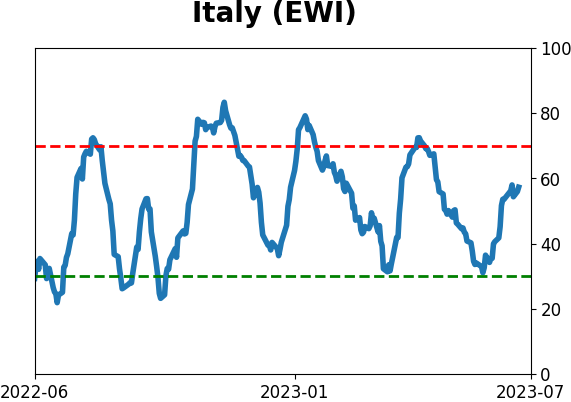
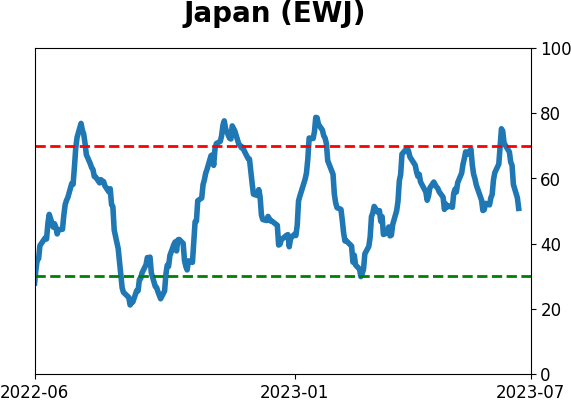
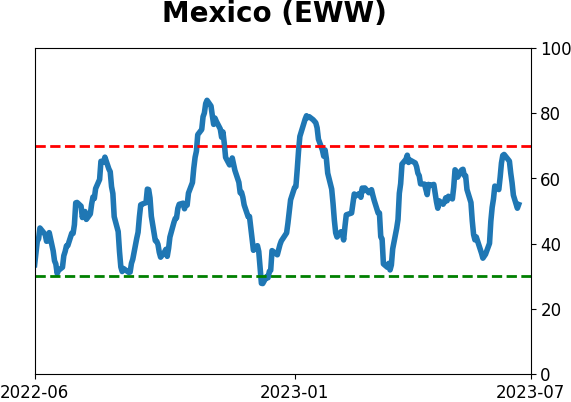
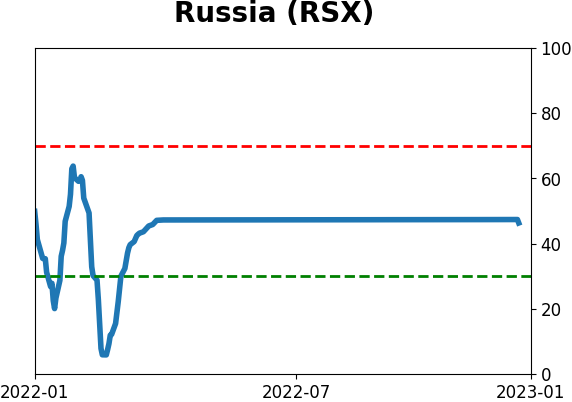
Country ETF's - 10-Day Moving Average
|
|
|
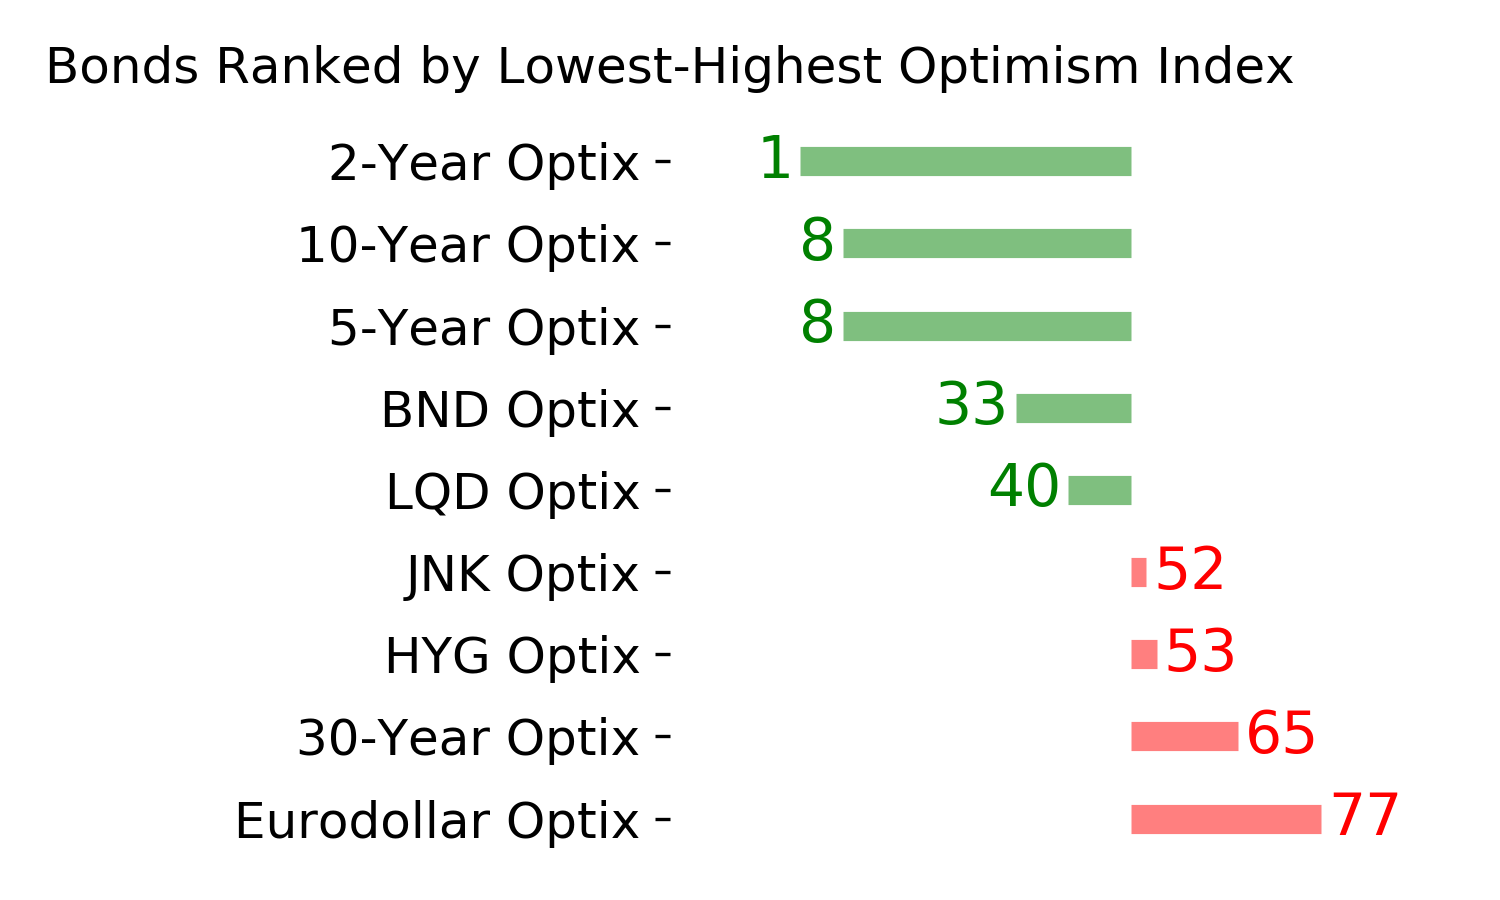
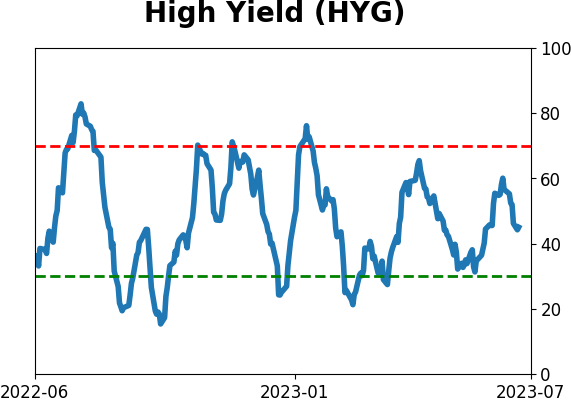
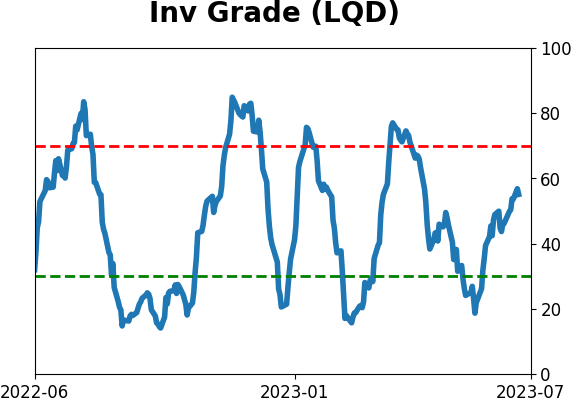
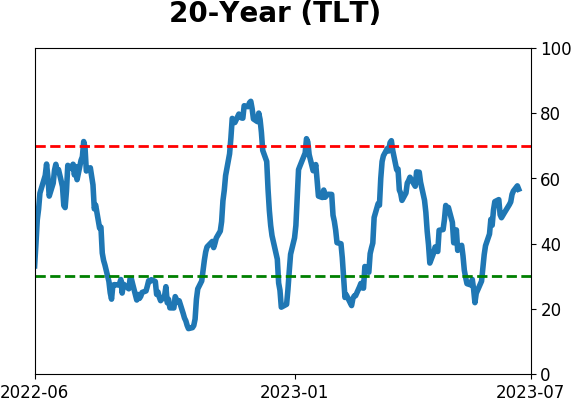
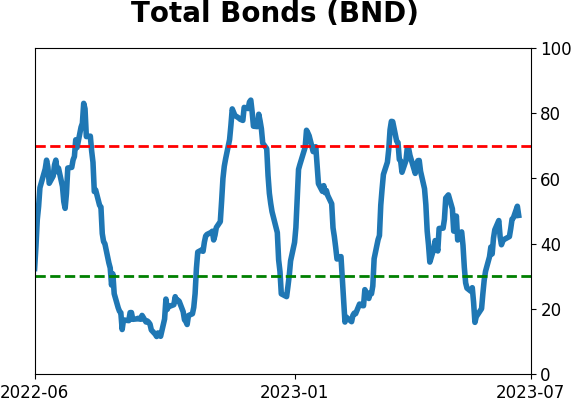
Bond ETF's - 10-Day Moving Average
|
|
|
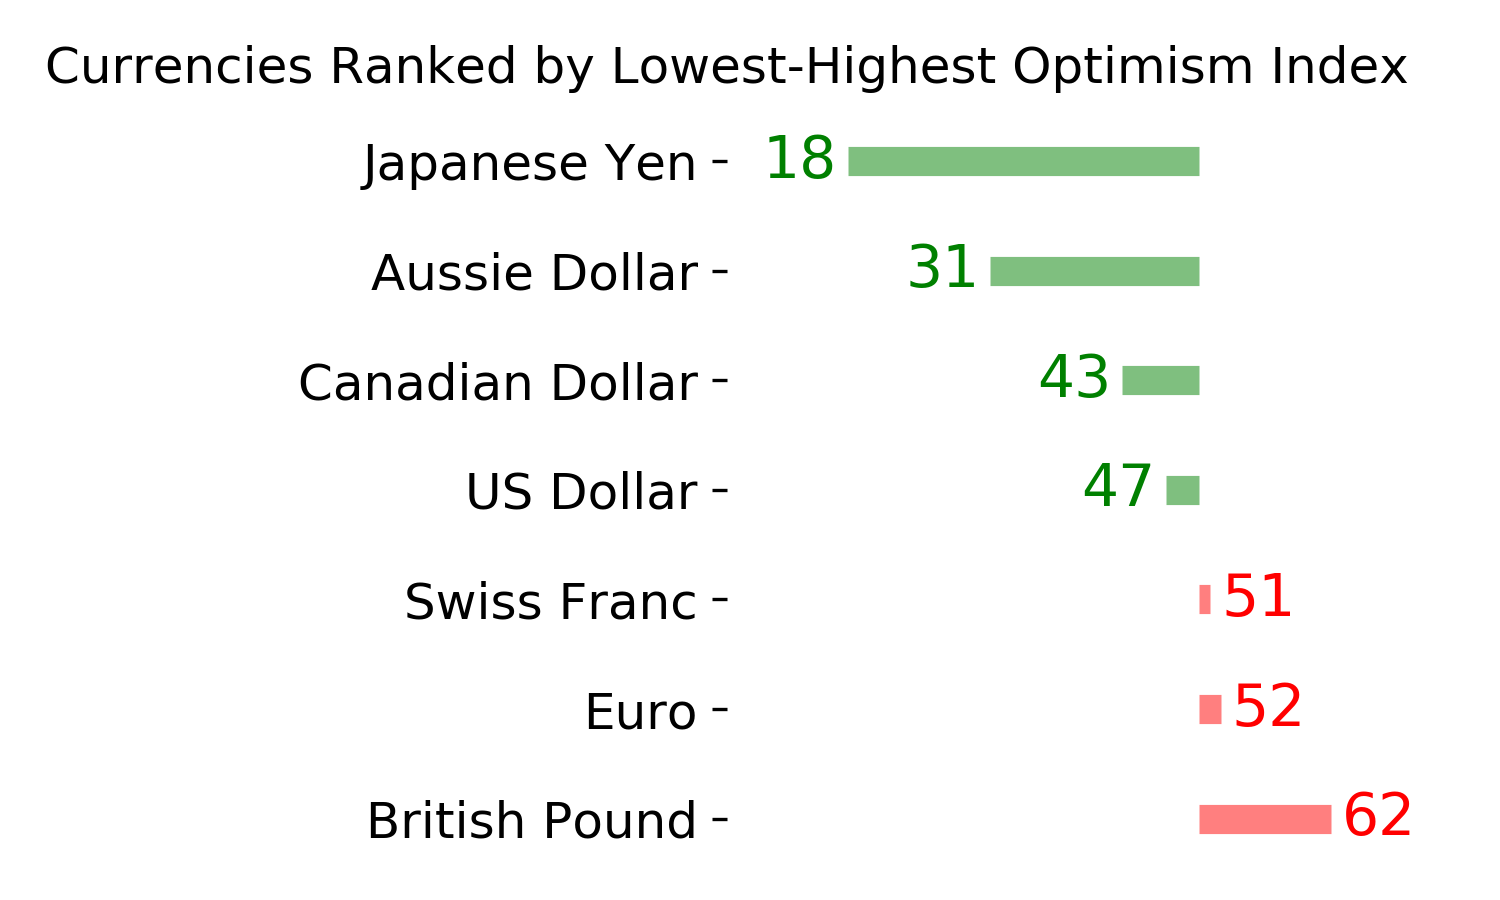
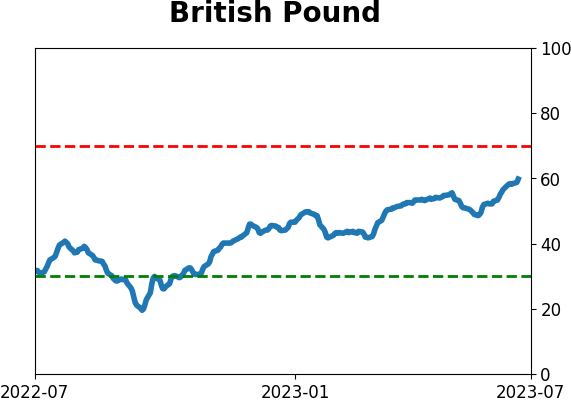
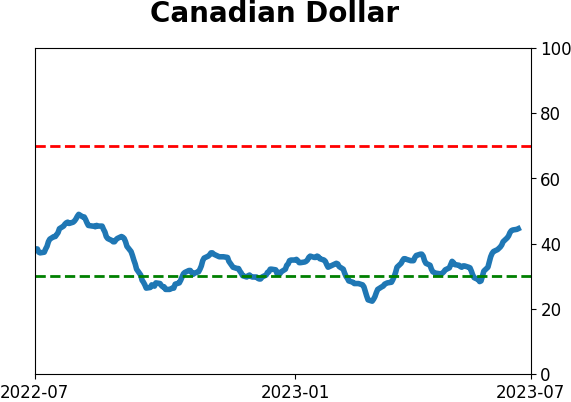
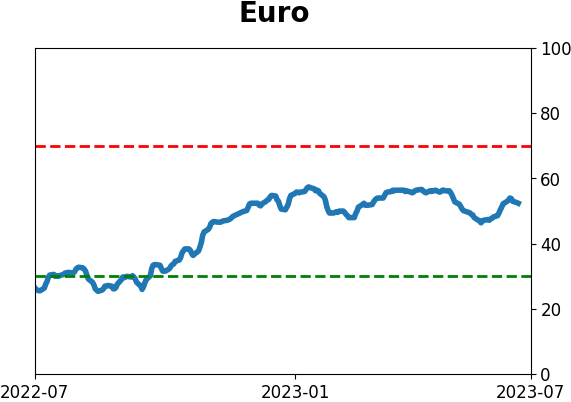
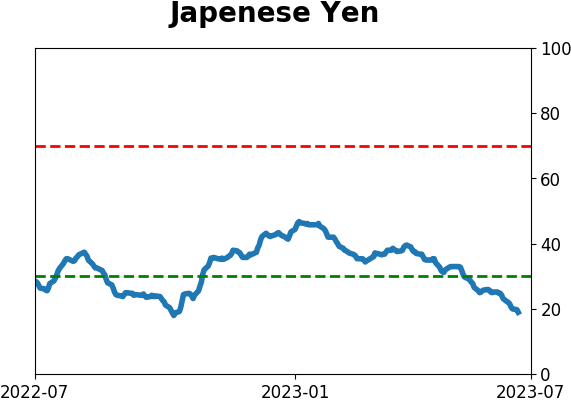
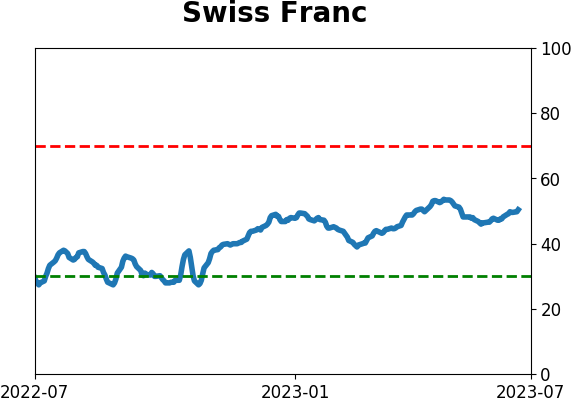
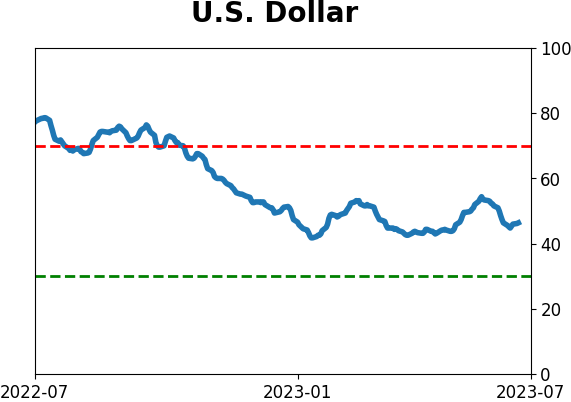
Currency ETF's - 5-Day Moving Average
|
|
|
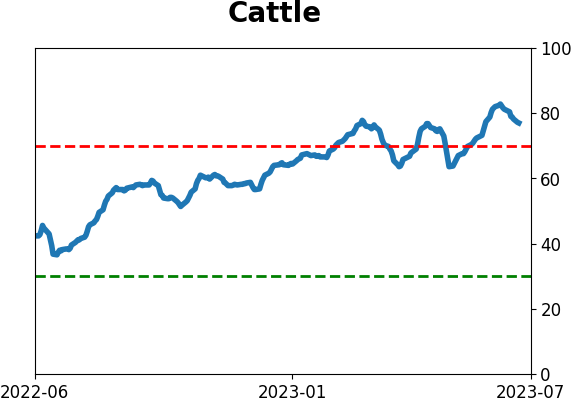
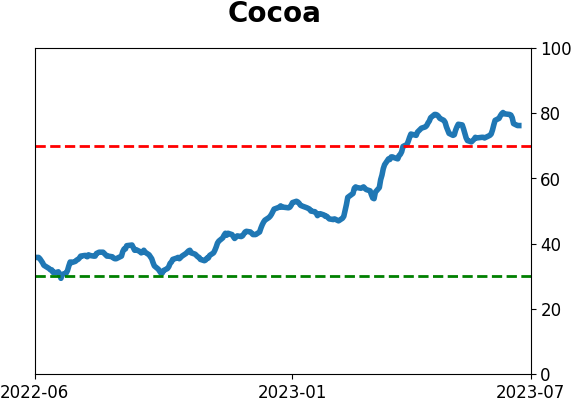
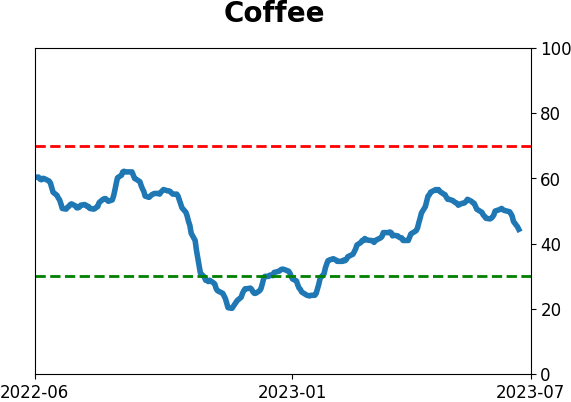
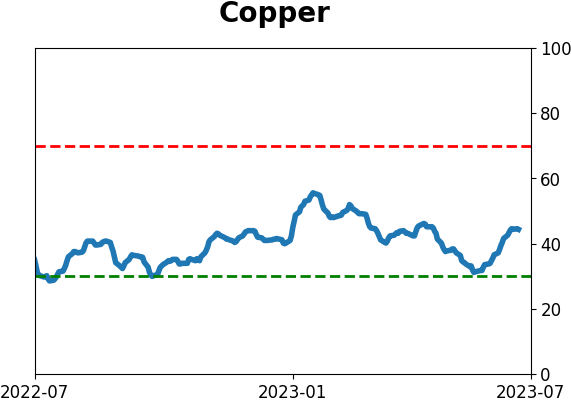
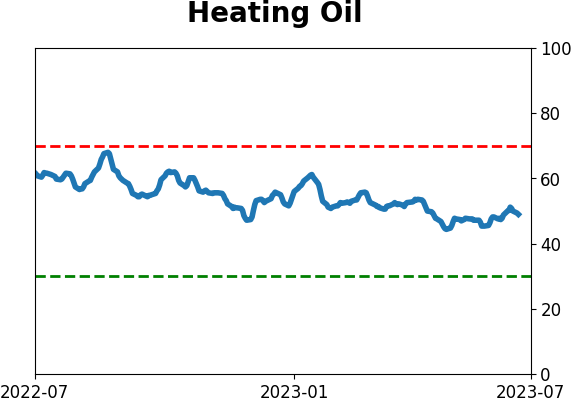
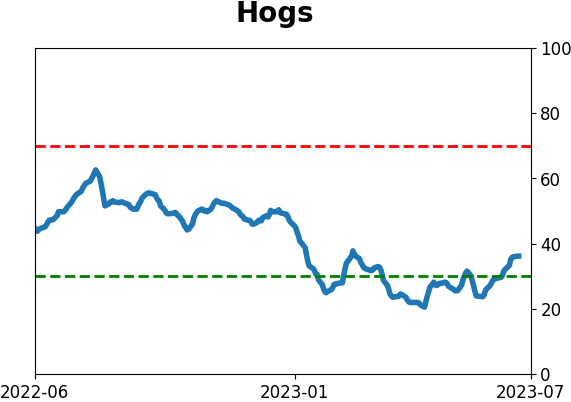
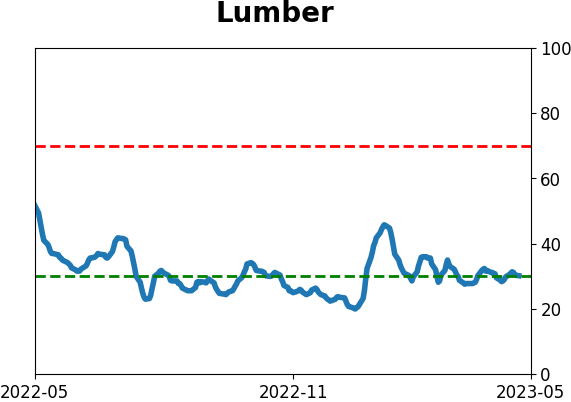
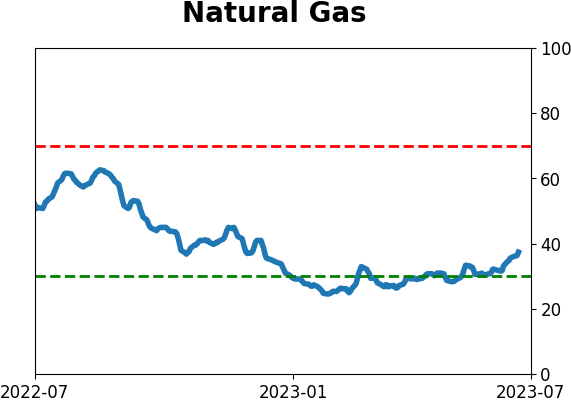
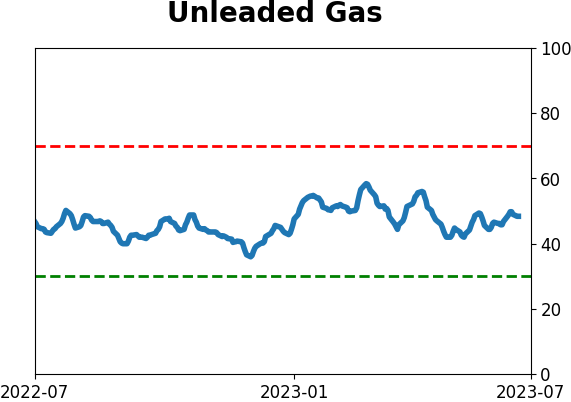
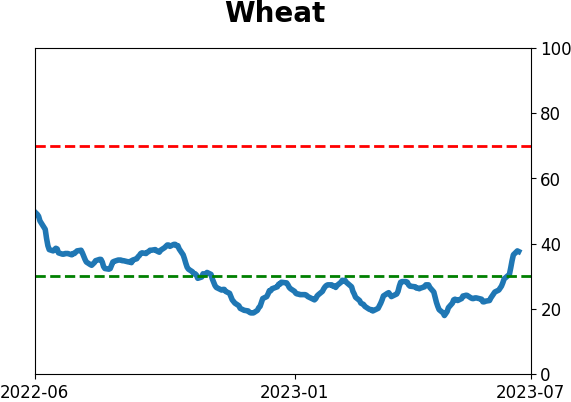
Commodity ETF's - 5-Day Moving Average
|
|