Headlines
|
|
Individual investors won't give up the bearish ghost:
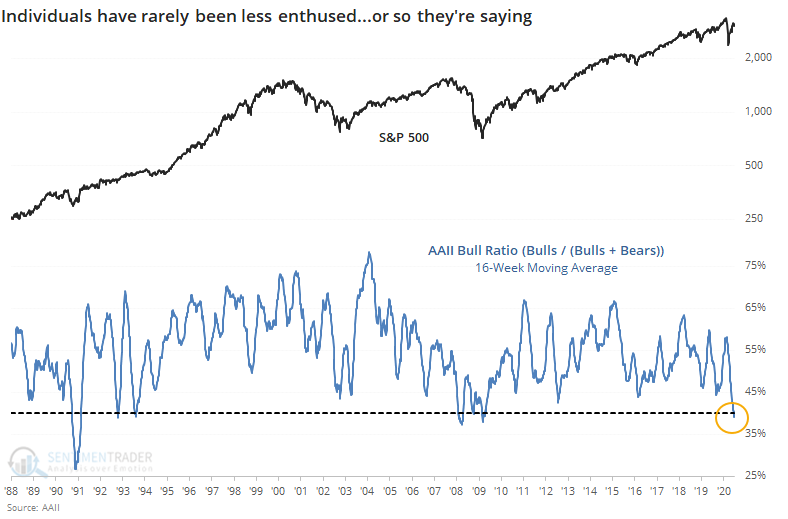
Individuals taking the AAII survey continue to show apathy toward stocks, with the 18th straight week with more bears than bulls. The 16-week average of the Bull Ratio has dropped below 40%, one of the lowest readings since the survey's inception.
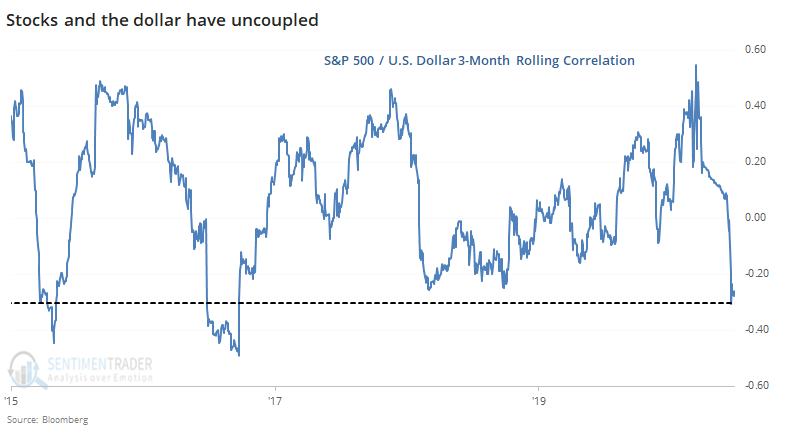
Stocks have uncoupled from the dollar:
During the height of the pandemic panic, stocks and the dollar moved in lockstep. The correlation between them has since broken down and turned to the most negative in years. That has not been a consistent sign of future strength in stocks (or the dollar or gold, for that matter).
The latest Commitments of Traders report was released, covering positions through Tuesday: The 3-Year Min/Max Screen showed continued "smart money" buying in equity index futures, especially the Dow. They're holding about $42 billion in equity futures - as we've been noting for over a month, this has been exceptionally bullish over the past decade but it's odd that they're not behaving as they have in the past. They added a bit to net longs in the dollar, especially versus the euro. They remain near record net long corn, though total positions in agriculture contracts have still not spiked higher.
Bottom line: - Weight of the evidence has been suggesting flat/lower stock prices short- to medium-term, though that's starting to turn more neutral as stocks pull back; still suggesting higher prices long-term
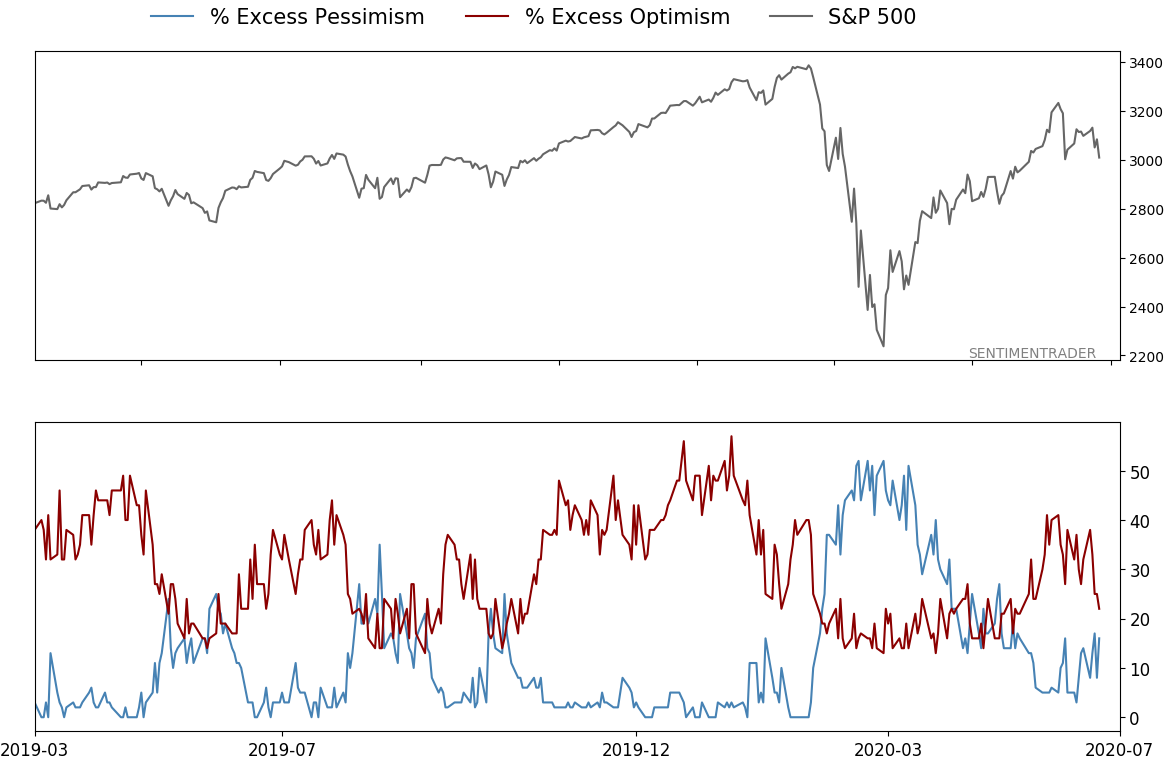
- Indicators are showing high and declining optimism, as Dumb Money Confidence was recently near 80% with isolated signs of reckless speculation, during what appears to be an unhealthy market environment
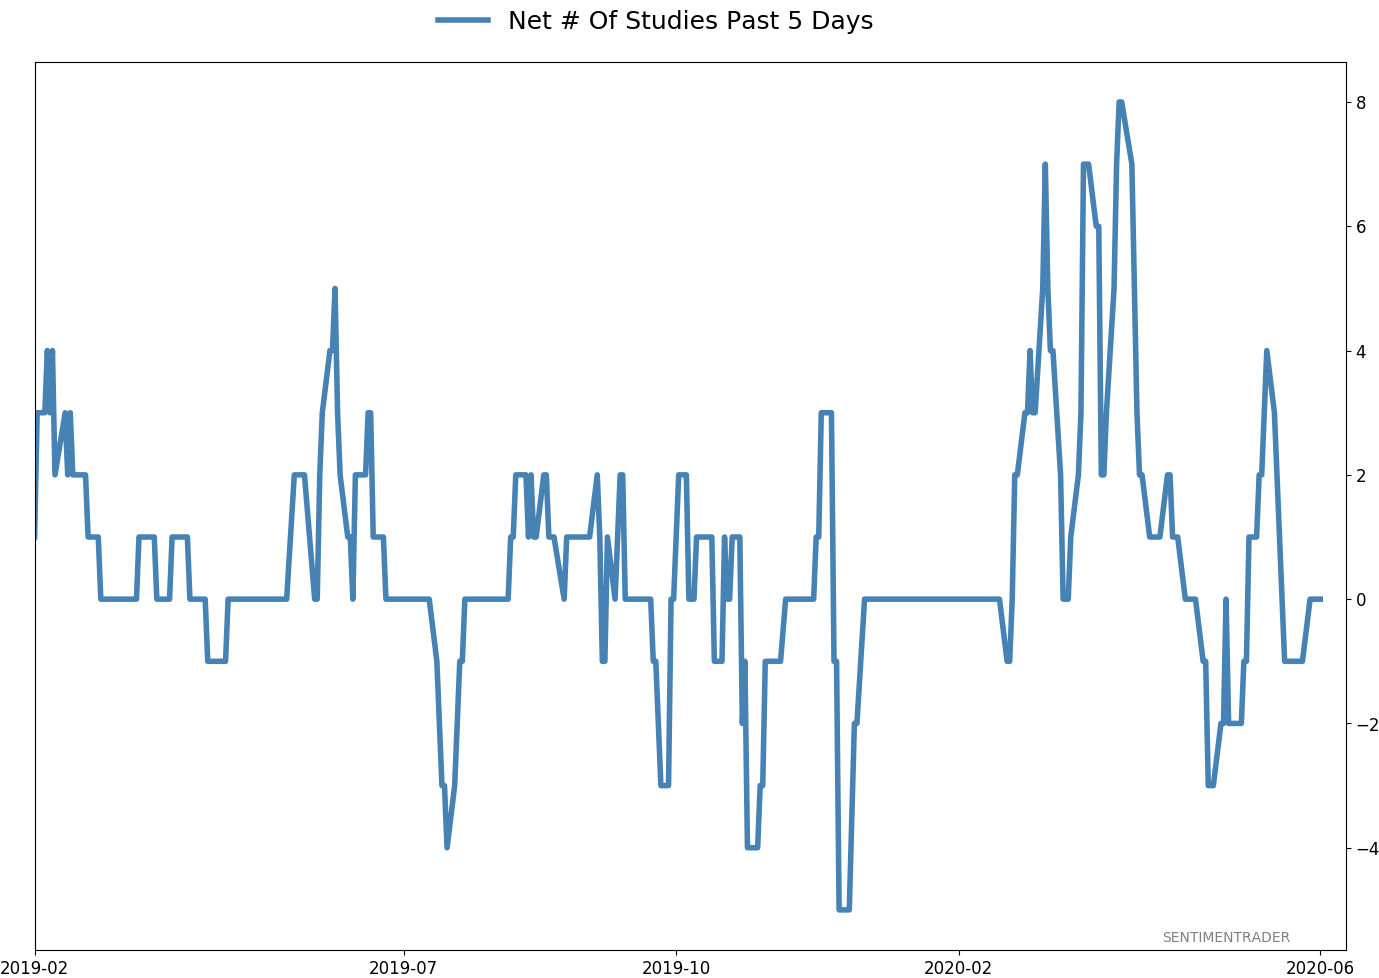
- Active Studies show a heavy positive skew over the medium- to long-term; breadth thrusts and recoveries have an almost unblemished record at preceding higher prices over a 6-12 month time frame
- Signs of extremely skewed preference for tech stocks nearing exhaustion, especially relative to industrials and financials (here and here)
- Indicators and studies for other markets are mixed with no strong conclusion
|
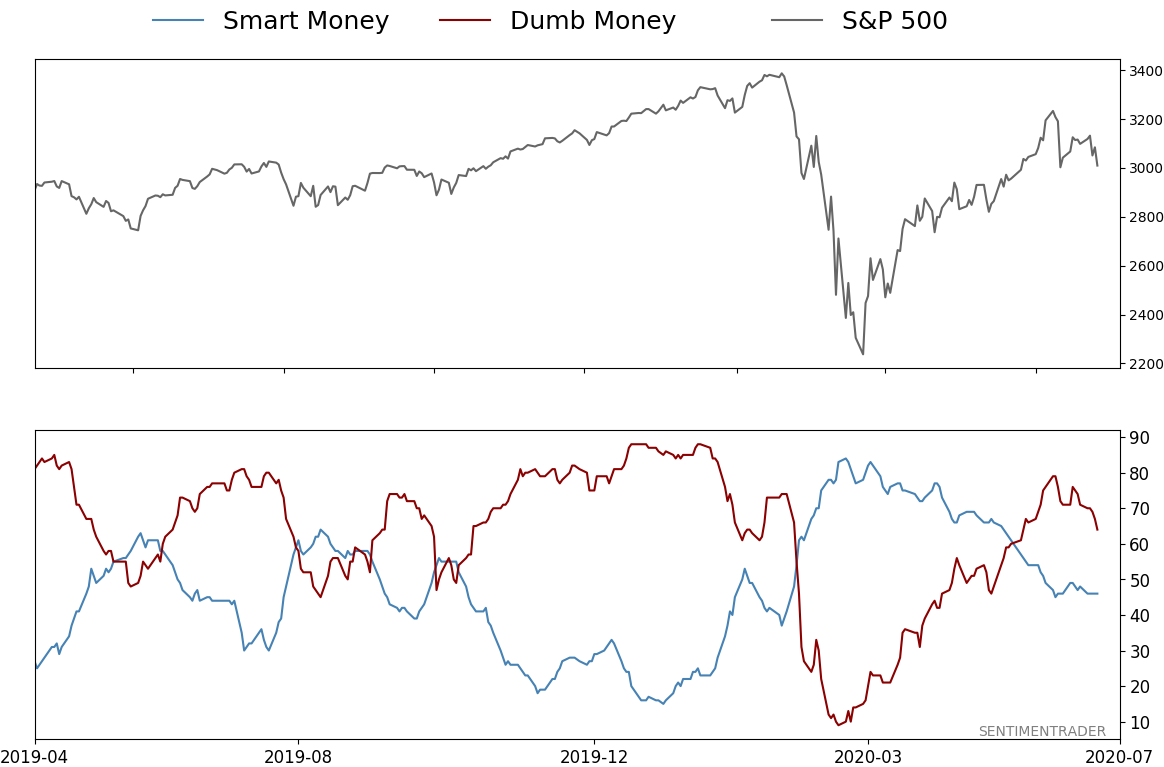
Smart / Dumb Money Confidence
|
Smart Money Confidence: 46%
Dumb Money Confidence: 64%
|
|
Risk Levels
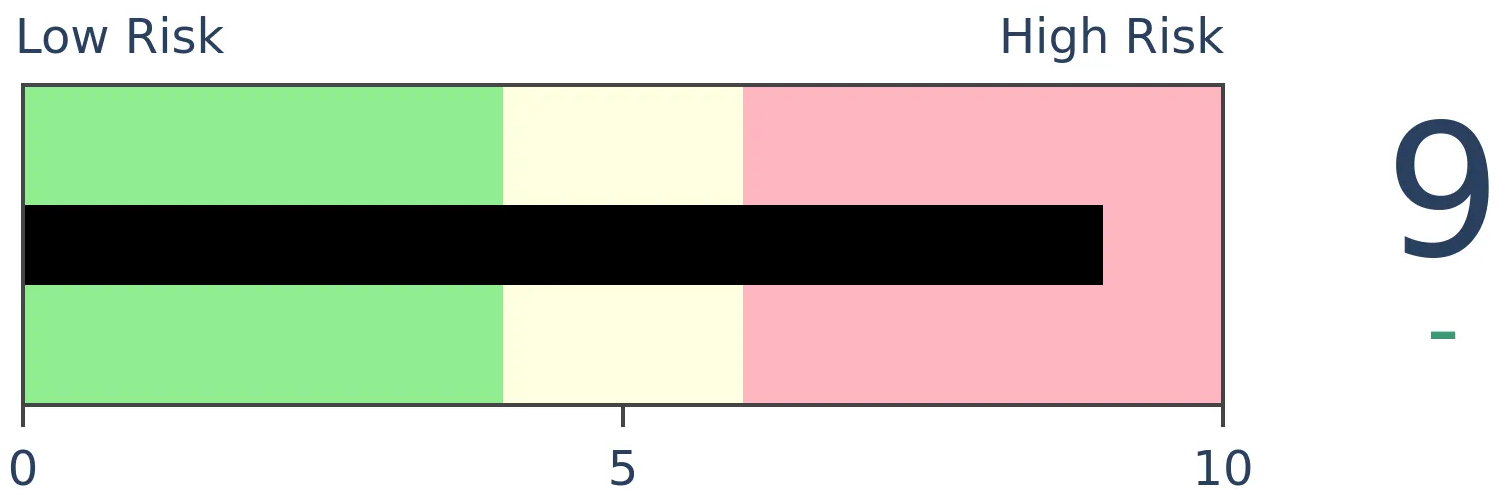
Stocks Short-Term
|
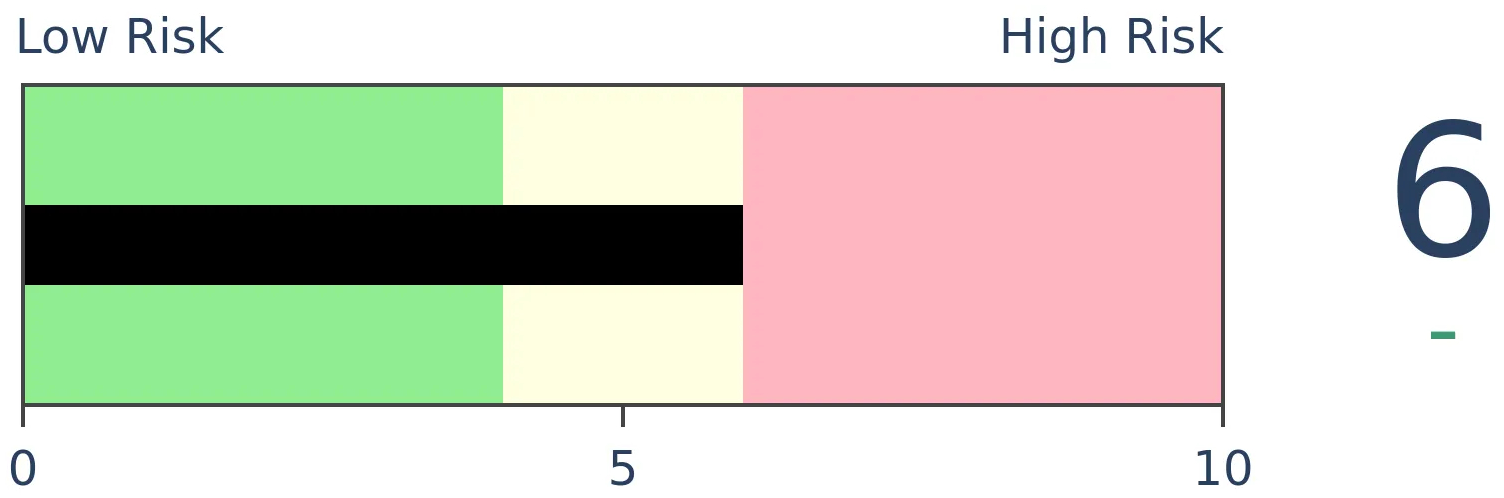
Stocks Medium-Term
|
|
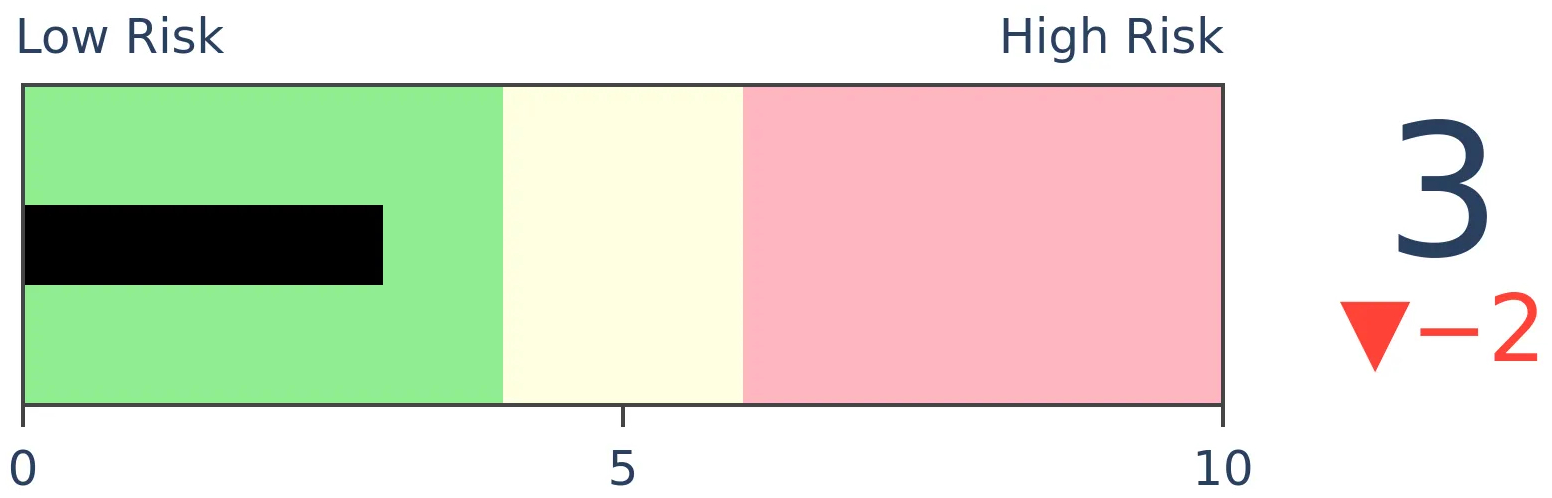
Bonds

|
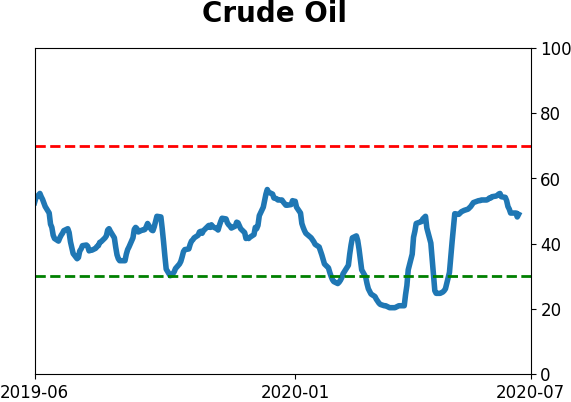
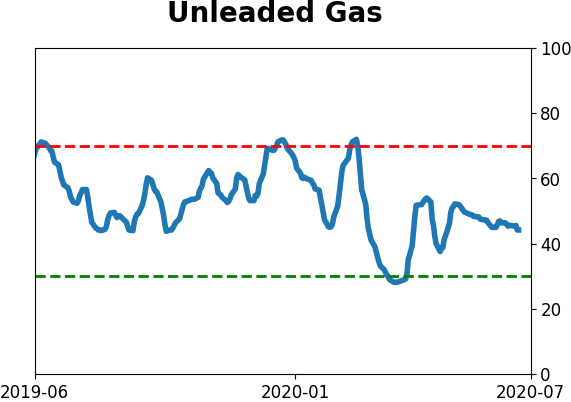
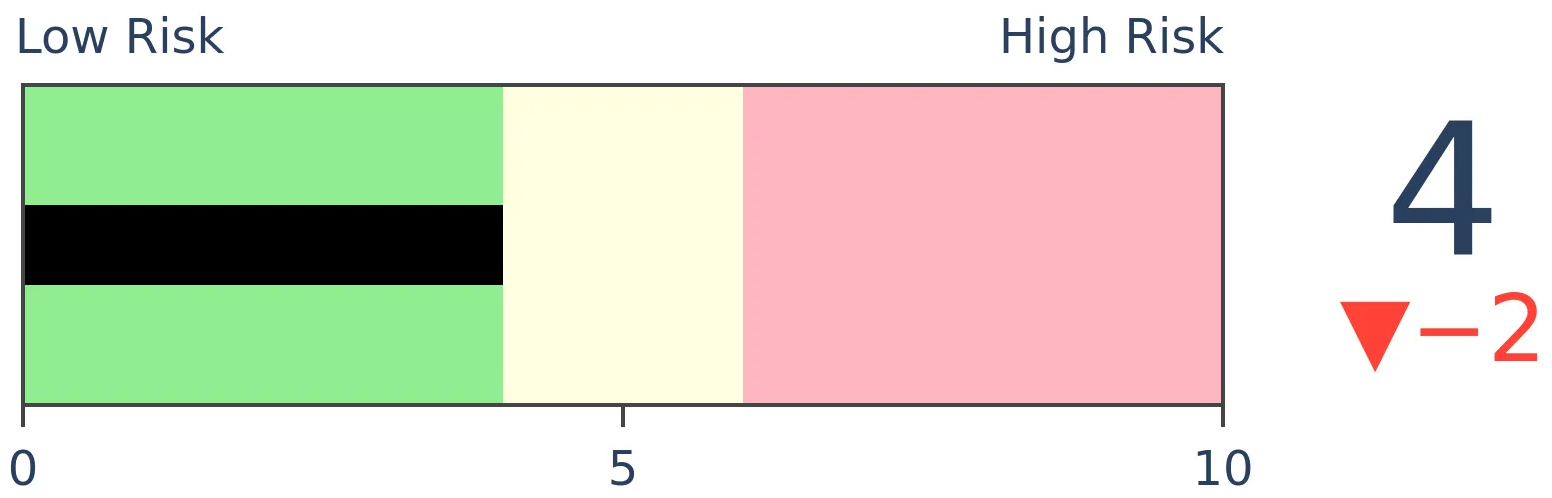
Crude Oil
|
|
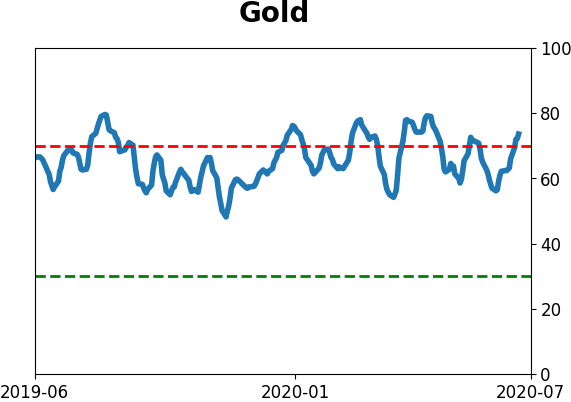
Gold
|
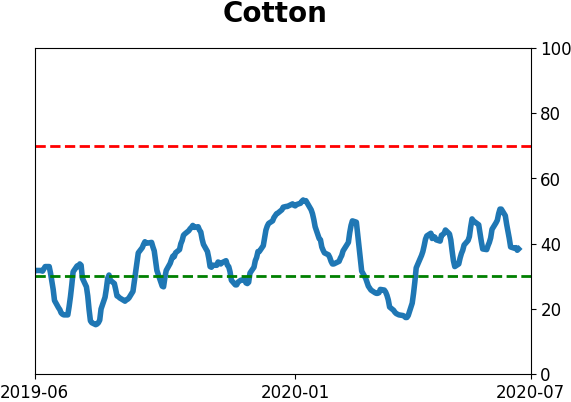
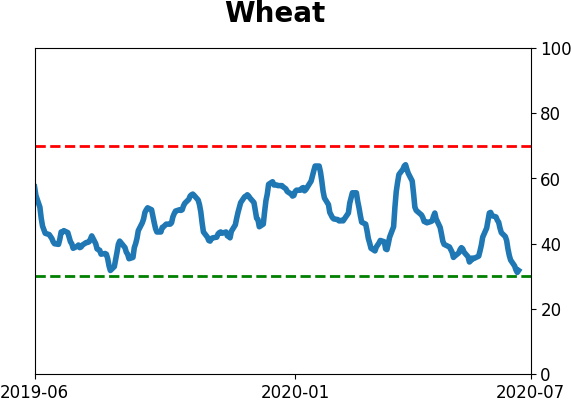
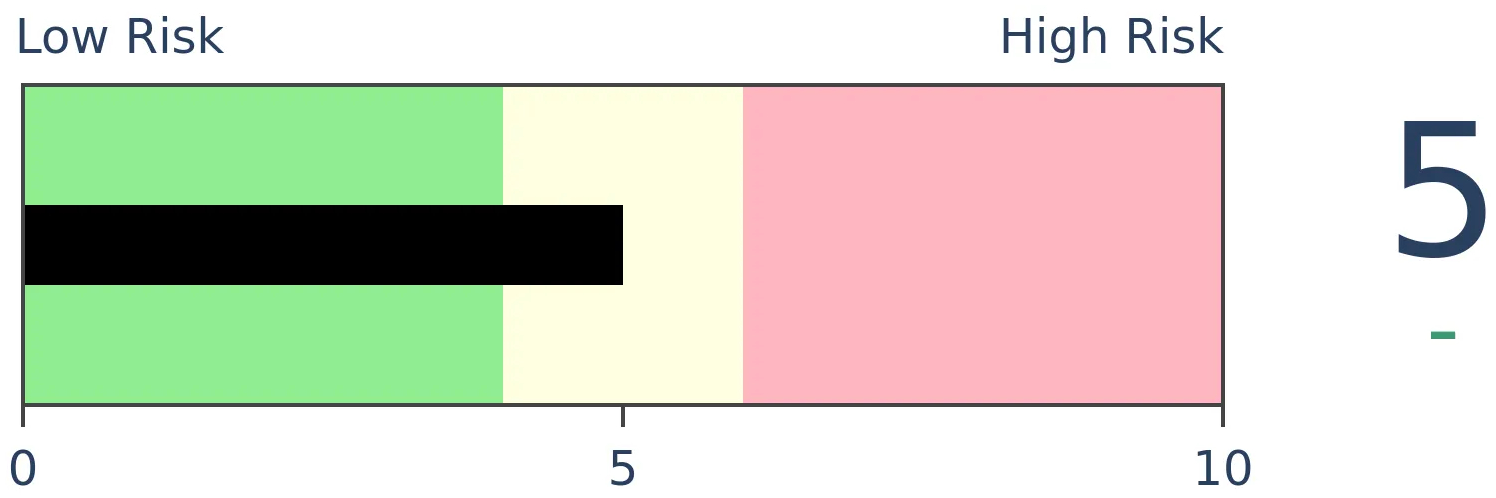
Agriculture
|
|
Research
BOTTOM LINE
Individuals taking the AAII survey continue to show apathy toward stocks, with the 18th straight week with more bears than bulls. The 16-week average of the Bull Ratio has dropped below 40%, one of the lowest readings since the survey's inception.
FORECAST / TIMEFRAME
None
|
The latest survey from the Association of Individual Investors showed yet another week of apathy, even outright pessimism. This is now the 18th straight week with the survey showing more people thinking stocks will go down than up, the 2nd-longest since the survey's inception.
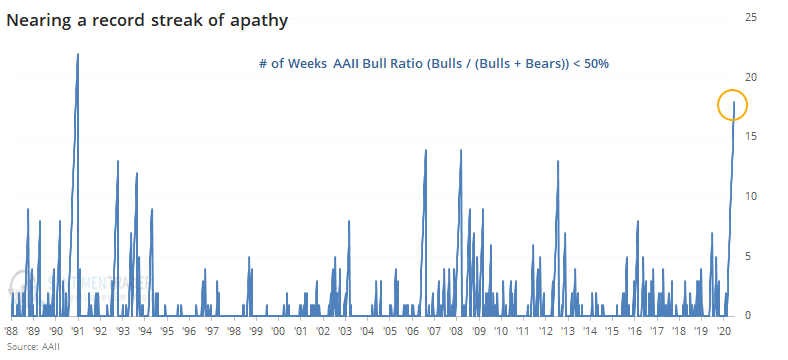
This streak has pushed the 16-week average of the Bull Ratio below 40% for the first time since 2009.
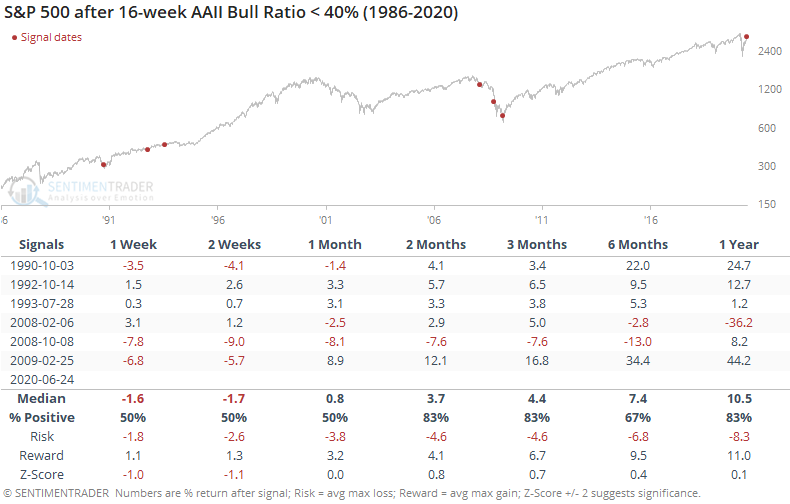
When the ratio first became this depressed, it wasn't an automatic contrary buy signal. The S&P 500 had more work to do on the downside when it first triggered in 1990 and it was woefully early in 2008. That helped contribute to a poor risk/reward ratio over the short- to medium-term.
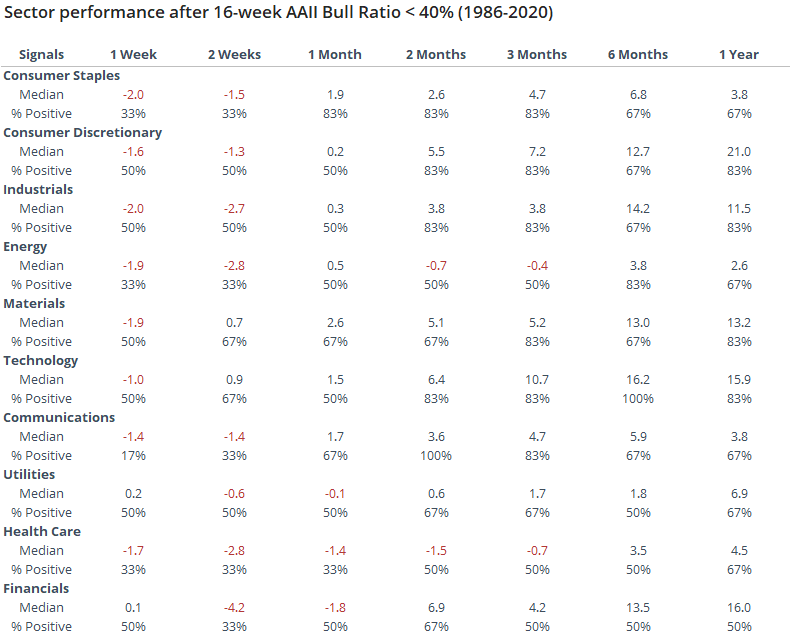
Among sectors, higher-beta ones like discretionary and technology performed best over the medium- to long-term. Health care and financials were among the worst.
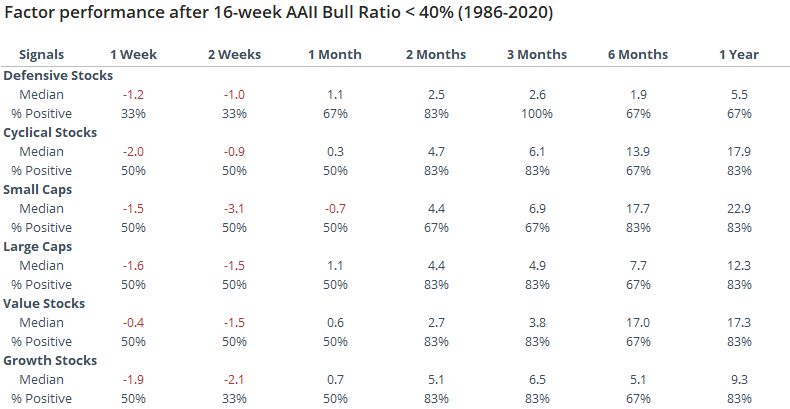
For factors, there wasn't a clear bias, though cyclical, small-cap, and value stocks showed the highest average returns.
This is a really odd time in the survey. In its nearly 35-year history, it has never really behaved this way. It's exceptionally unusual to see retail investors become more pessimistic during a rally, especially a historic one. When indicators don't behave as they have in the past, we become wary. Because of that, we're reading less into it than we normally would.
The safest bet historically was waiting until the 16-week average climbed back above 50%. That would have meant missing the low, of course, but it also prevented one from buying too early, which was a bigger benefit during the last protracted bear market.
BOTTOM LINE
During the height of the pandemic panic, stocks and the dollar moved in lockstep. The correlation between them has since broken down and turned to the most negative in years. That has not been a consistent sign of future strength in stocks (or the dollar or gold, for that matter).
FORECAST / TIMEFRAME
None
|
Correlation and causation are a tricky pair, as we never really know if we can rely on one to suggest the other.
During the peak of pandemic panic in February and March, the correlation between stocks and the dollar was extremely high, as the economic forces on one seemed to be related to the other - mostly investors' perceptions about the influence of Federal Reserve actions.
As noted by the Financial Times:
"Strategists attribute the recent moves to the radical actions of central banks and governments to fend off the worst effects of the pandemic. Since the start of the Covid-19 crisis, interest rates in major economies have been slashed to near zero, wiping out an important metric for assessing currencies."
The rolling 3-month correlation between the two hit a 12-year high in March, then settled down as stocks rallied. Recently, it has dived, as they take their separate paths. Stocks have continued to rally while the dollar tanked.
Going back to 1975, we can see that this large of a negative correlation between the two is unusual.
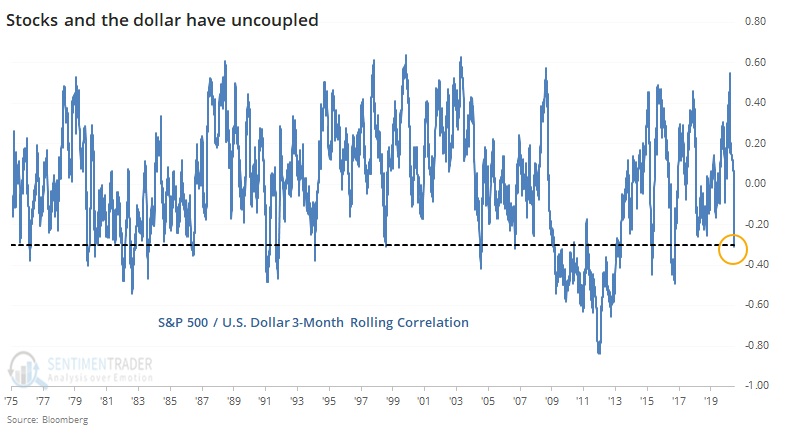
As for what it meant when the correlation first dropped below -0.3, it wasn't a great short- to medium-term sign for the S&P 500.
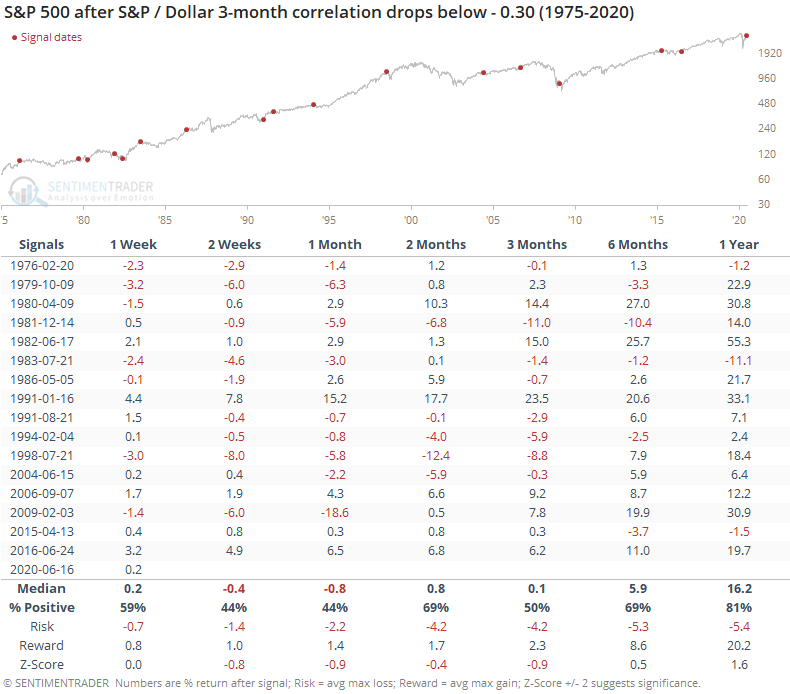
The S&P's median return was below average (a negative z-score) up to three months later, but it wasn't particularly large or consistent. The most worrisome part is the very poor risk/reward ratio, which was especially bad during the next two months.
It wasn't a great sign for the dollar, either.
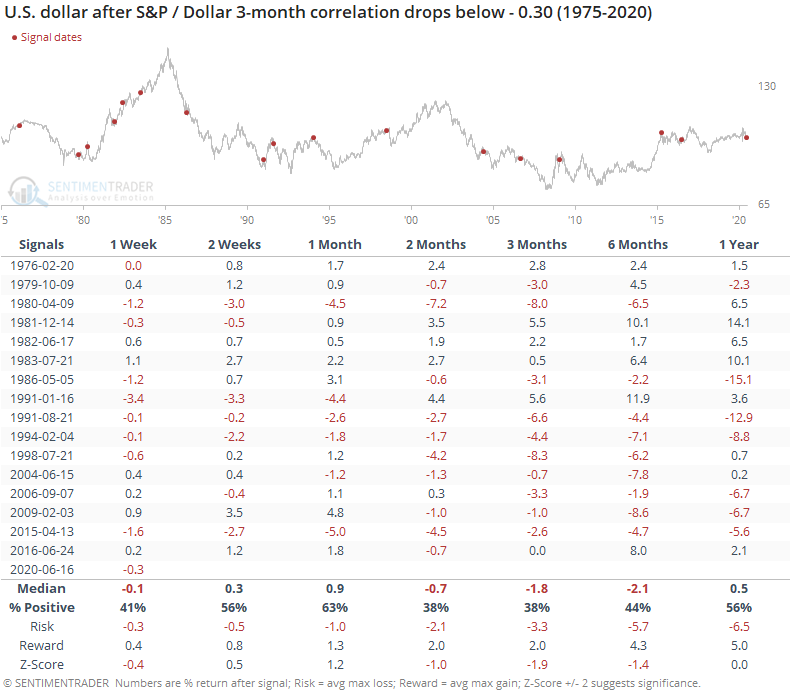
Over the next 2-3 months, the buck had a consistent tendency to decline, especially since late 1991. Every signal since then saw the dollar at a lower level either two or three months later.
Gold often rallies when the dollar falls, but after these signals, the metal struggled shorter-term.
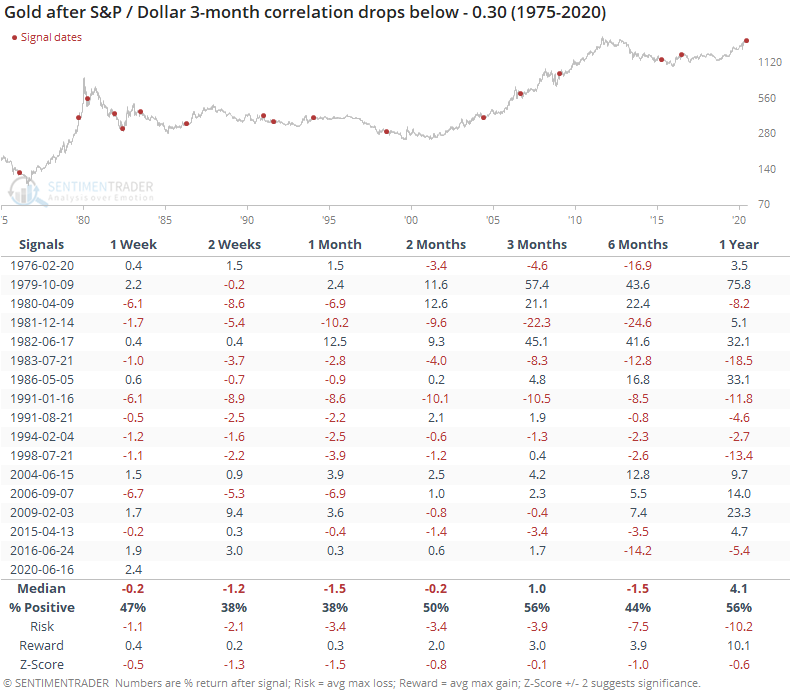
Intermarket correlations get a lot of attention among analysts and the media, but they're extremely hard to use since they change all the time. There aren't many markets that have had a consistent and predictable correlation over the decades. While it seems like it might be positive that stocks have uncoupled from the same forces driving the dollar, there isn't much evidence to support that historically.
Active Studies
| Time Frame | Bullish | Bearish | | Short-Term | 0 | 1 | | Medium-Term | 8 | 6 | | Long-Term | 40 | 1 |
|
Indicators at Extremes
Portfolio
| Position | Weight % | Added / Reduced | Date | | Stocks | 29.8 | Reduced 9.1% | 2020-06-11 | | Bonds | 0.0 | Reduced 6.7% | 2020-02-28 | | Commodities | 5.2 | Added 2.4%
| 2020-02-28 | | Precious Metals | 0.0 | Reduced 3.6% | 2020-02-28 | | Special Situations | 0.0 | Reduced 31.9% | 2020-03-17 | | Cash | 65.0 | | |
|
Updates (Changes made today are underlined)
In the first months of the year, we saw manic trading activity. From big jumps in specific stocks to historic highs in retail trading activity to record highs in household confidence to almost unbelievable confidence among options traders. All of that came amid a market where the average stock couldn't keep up with their indexes. There were signs of waning momentum in stocks underlying the major averages, which started triggering technical warning signs in late January. After stocks bottomed on the 23rd, they enjoyed a historic buying thrust and retraced a larger amount of the decline than "just a bear market rally" tends to. Those thrusts are the most encouraging sign we've seen in years. Through early June, we were still seeing thrusts that have led to recoveries in longer-term breadth metrics. The longer-term prospects for stocks (6-12 months) still look decent given the above. On a short- to medium-term basis, it was getting harder to make that case. Dumb Money Confidence spiked and there were multiple signs of a historic level of speculation. This is likely the lowest I will go given what I still consider to be compelling positives over a longer time frame. There is not a slam-dunk case to be made for either direction, so it will seem like a mistake whether stocks keep dropping (why didn't I sell more?) or if they turn and head higher (why did I let short-term concerns prevail?). After nearly three decades of trading, I've learned to let go of the idea of perfection.
RETURN YTD: -6.6% 2019: 12.6%, 2018: 0.6%, 2017: 3.8%, 2016: 17.1%, 2015: 9.2%, 2014: 14.5%, 2013: 2.2%, 2012: 10.8%, 2011: 16.5%, 2010: 15.3%, 2009: 23.9%, 2008: 16.2%, 2007: 7.8%
|
|
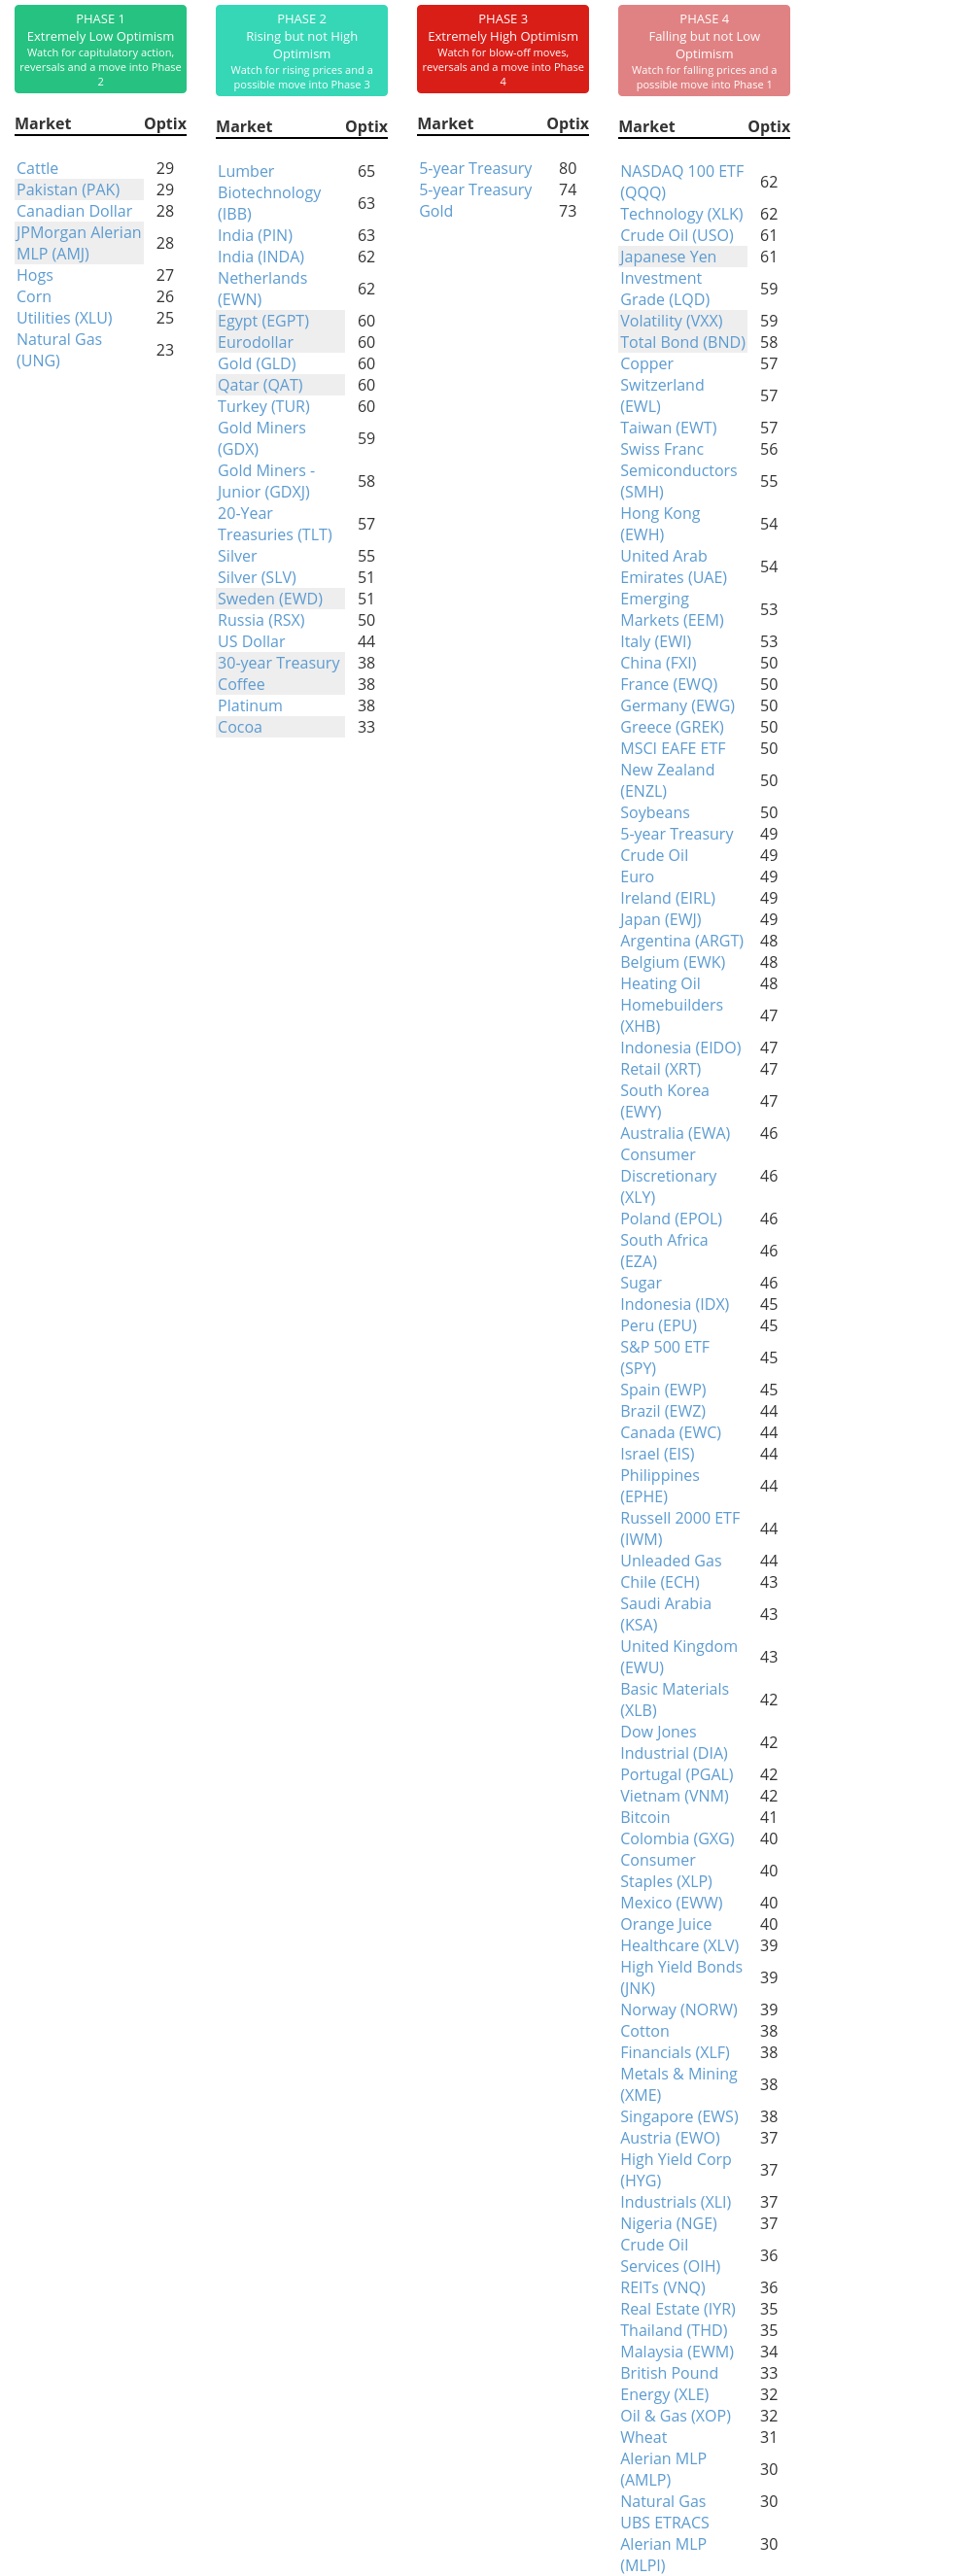
Phase Table
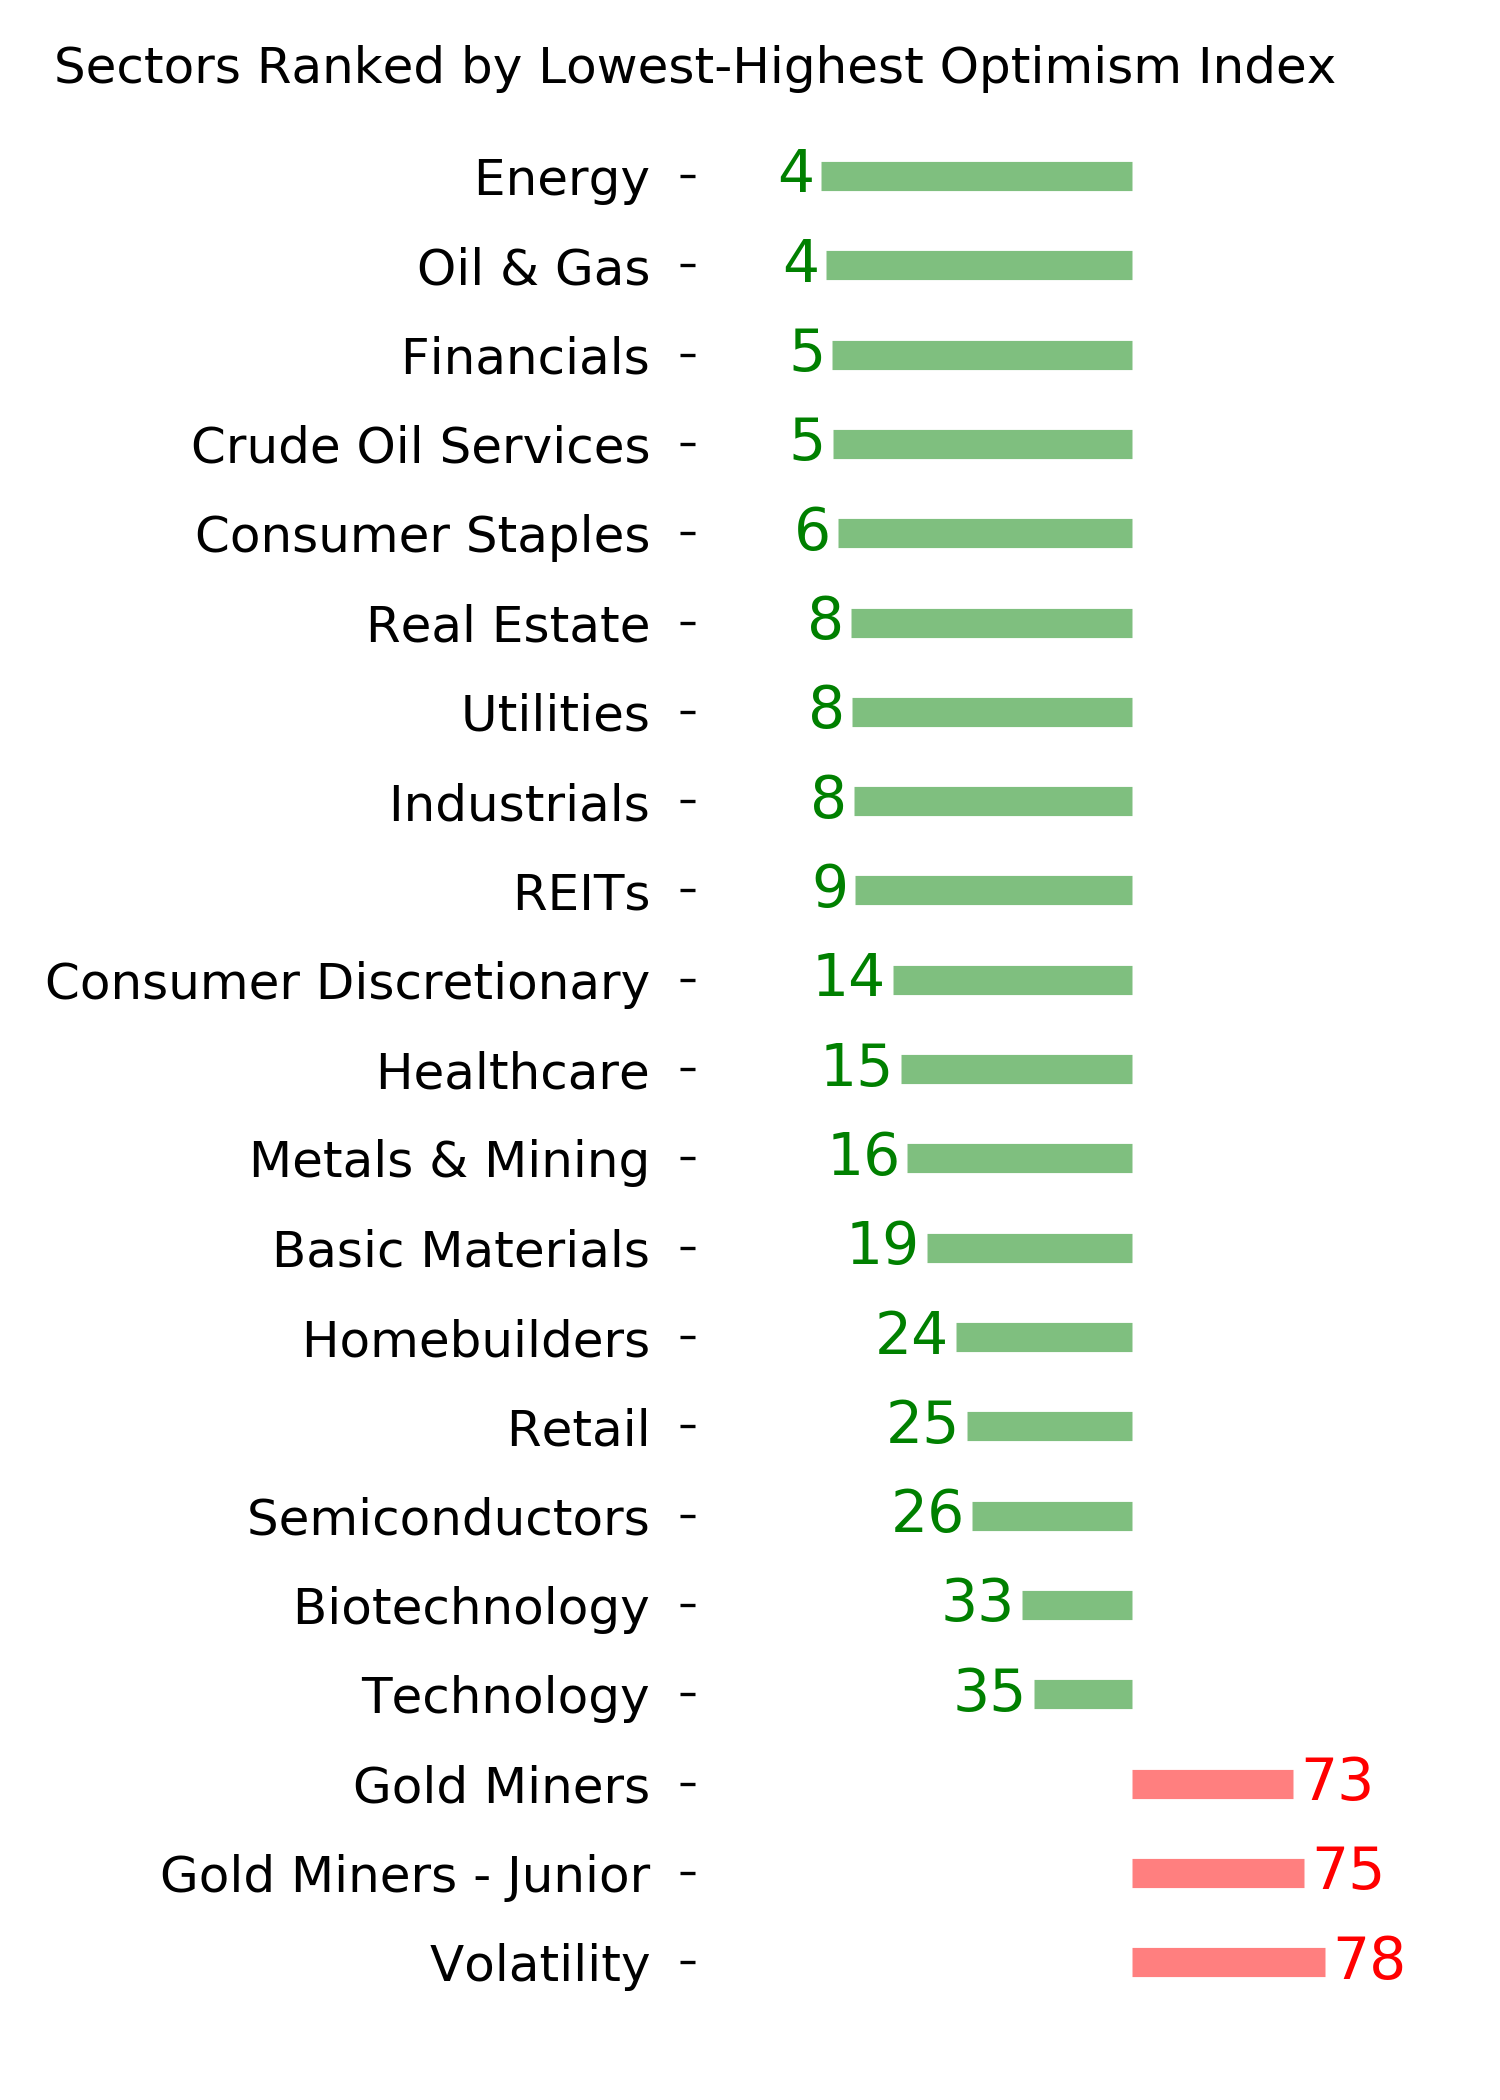
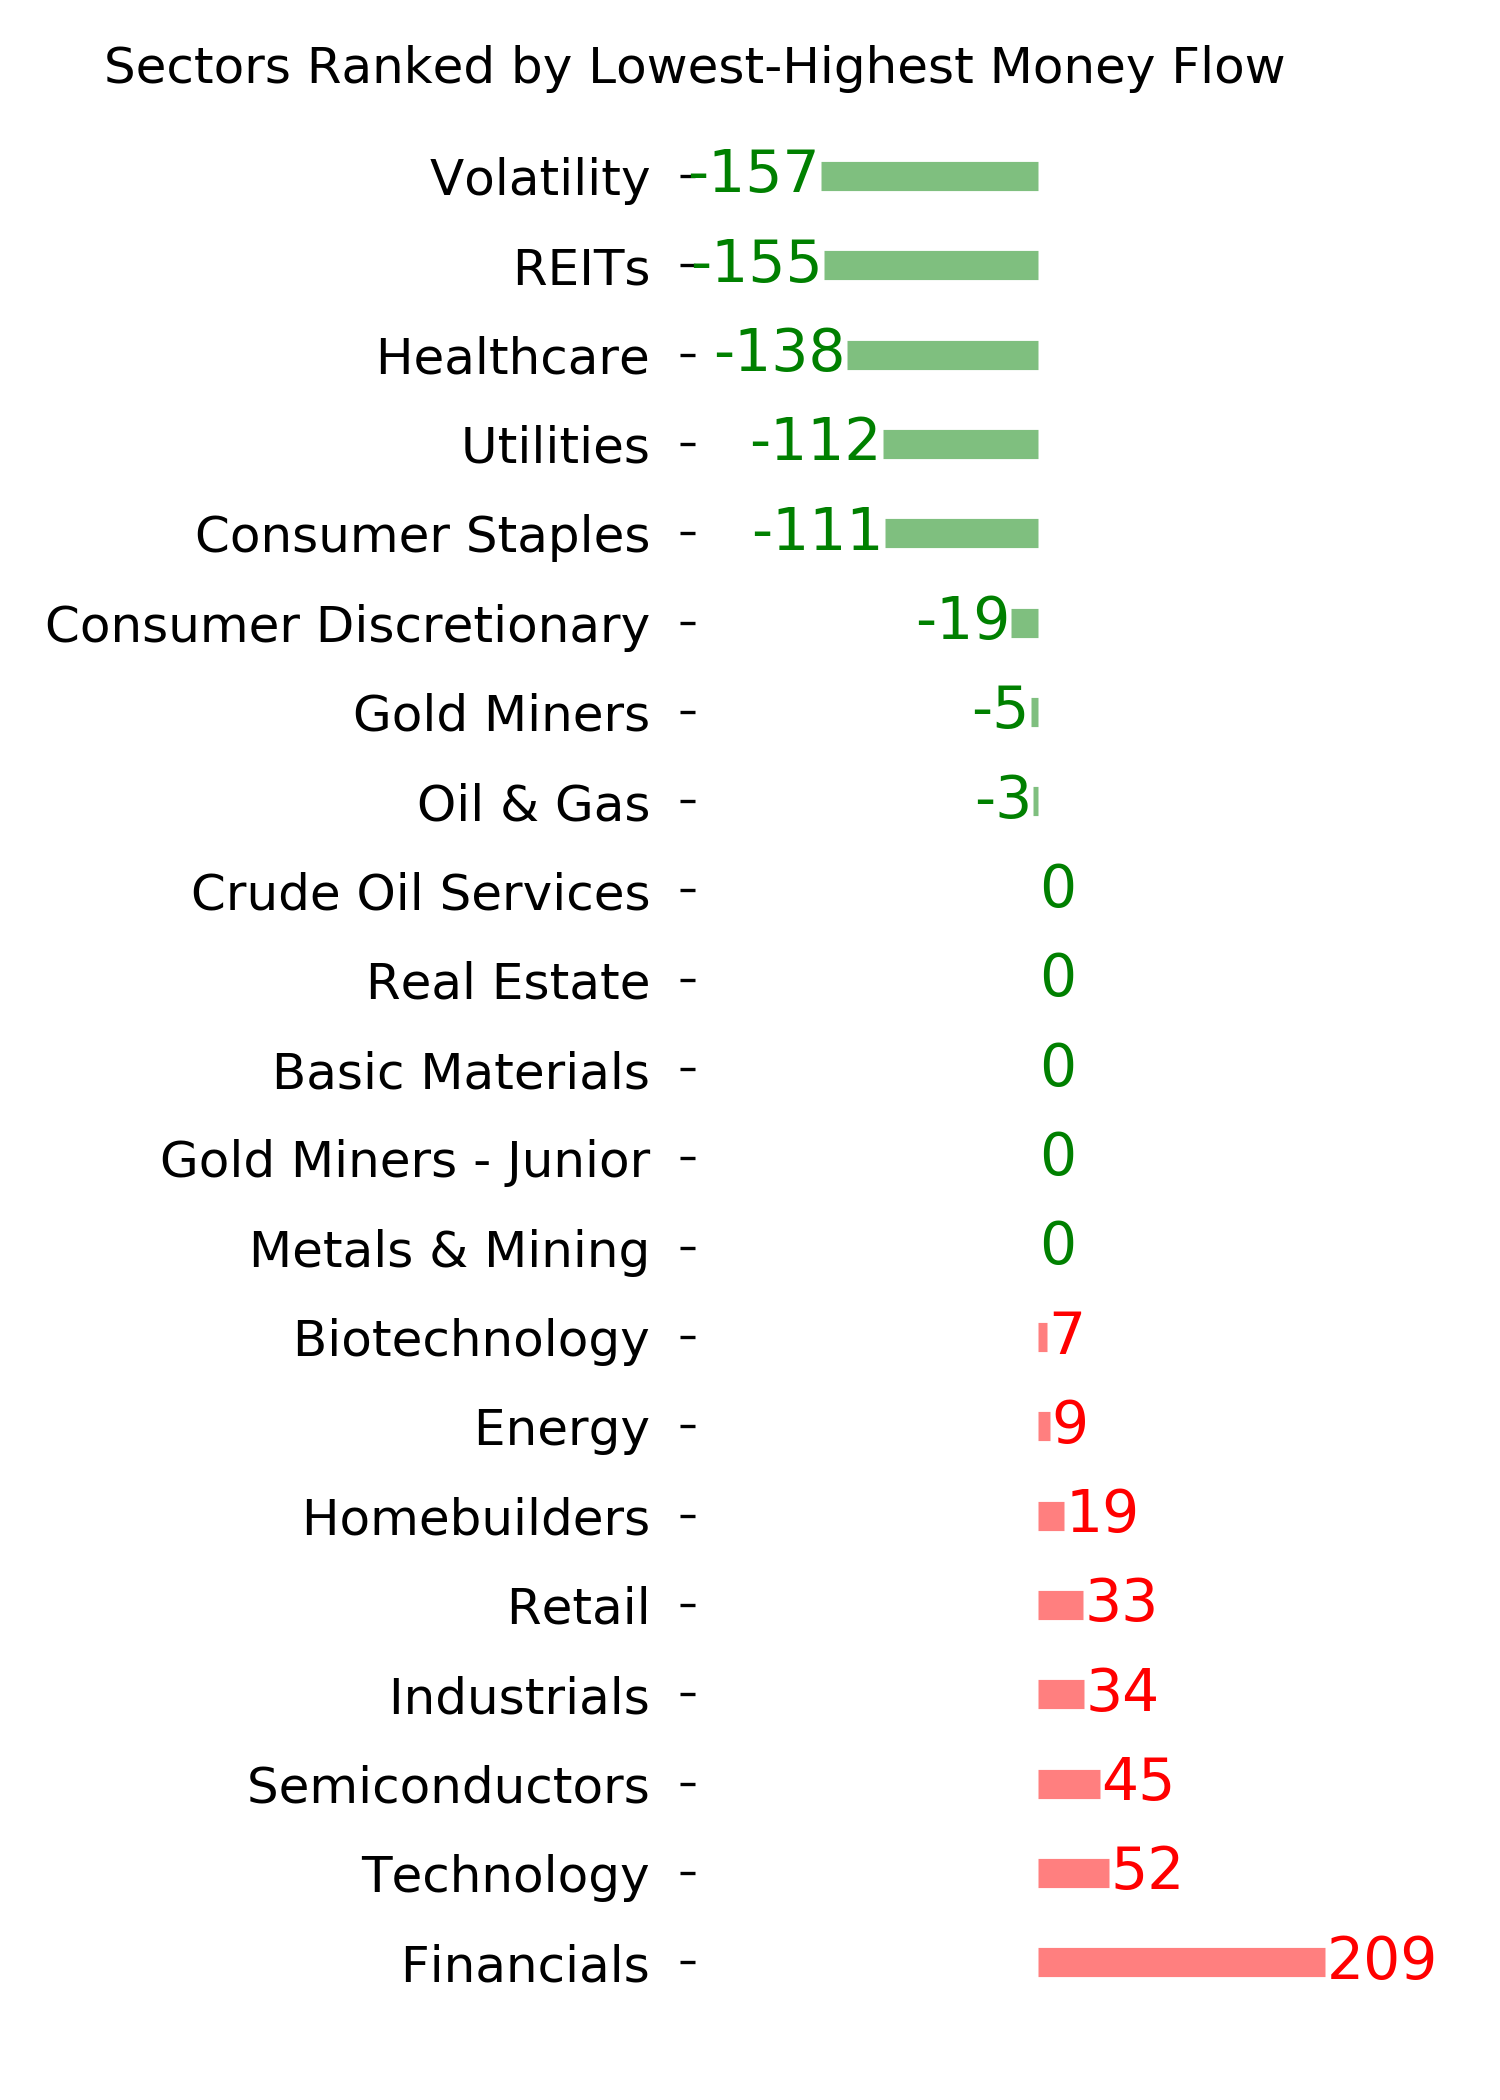
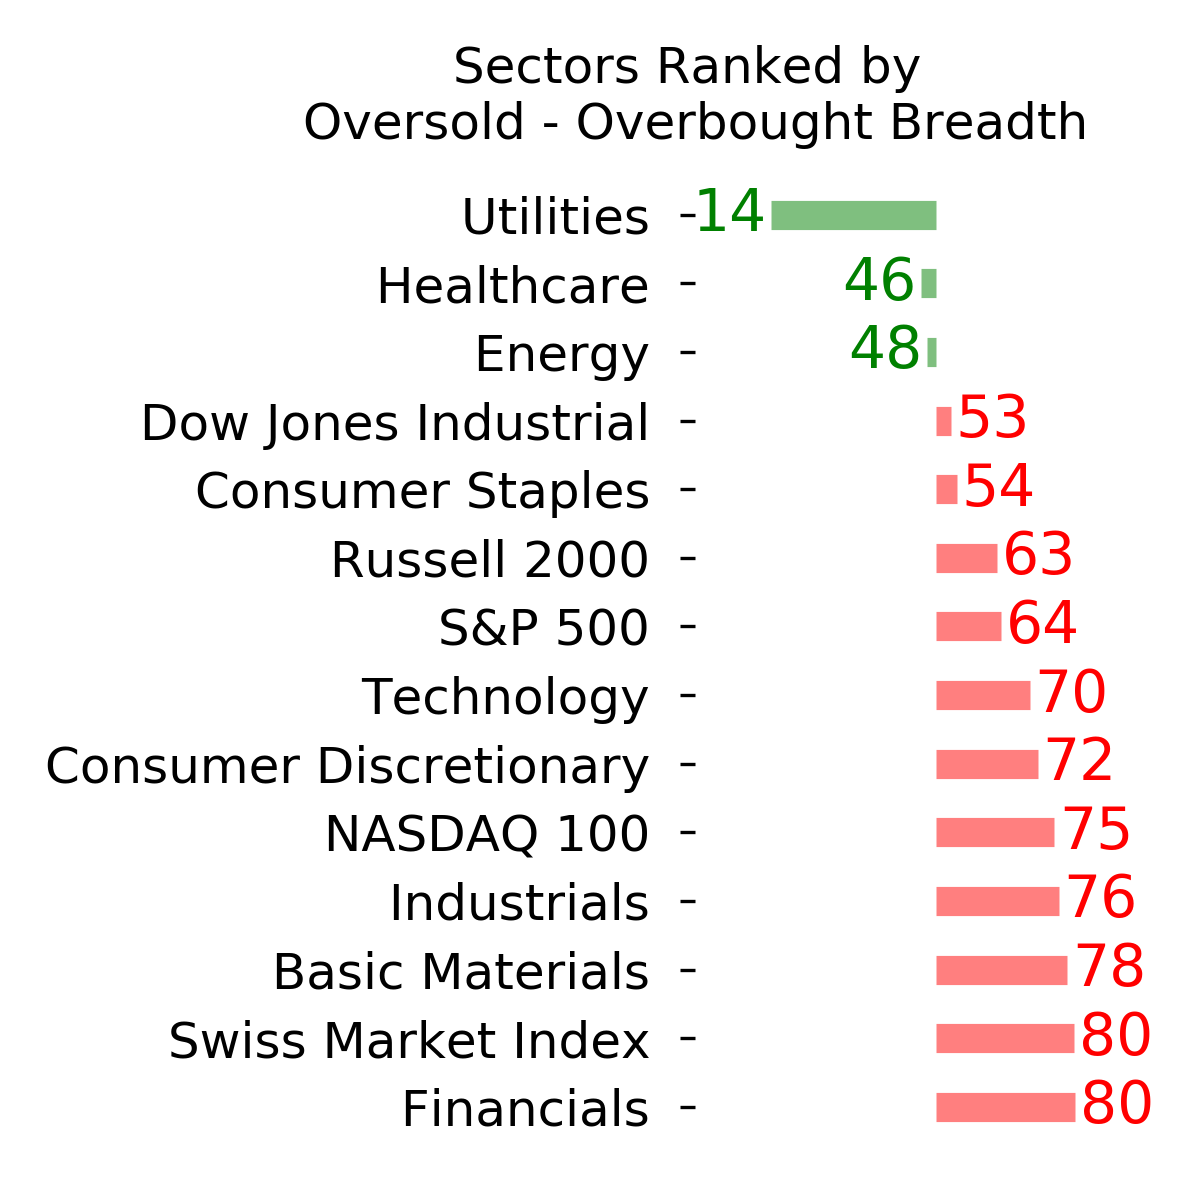
Ranks
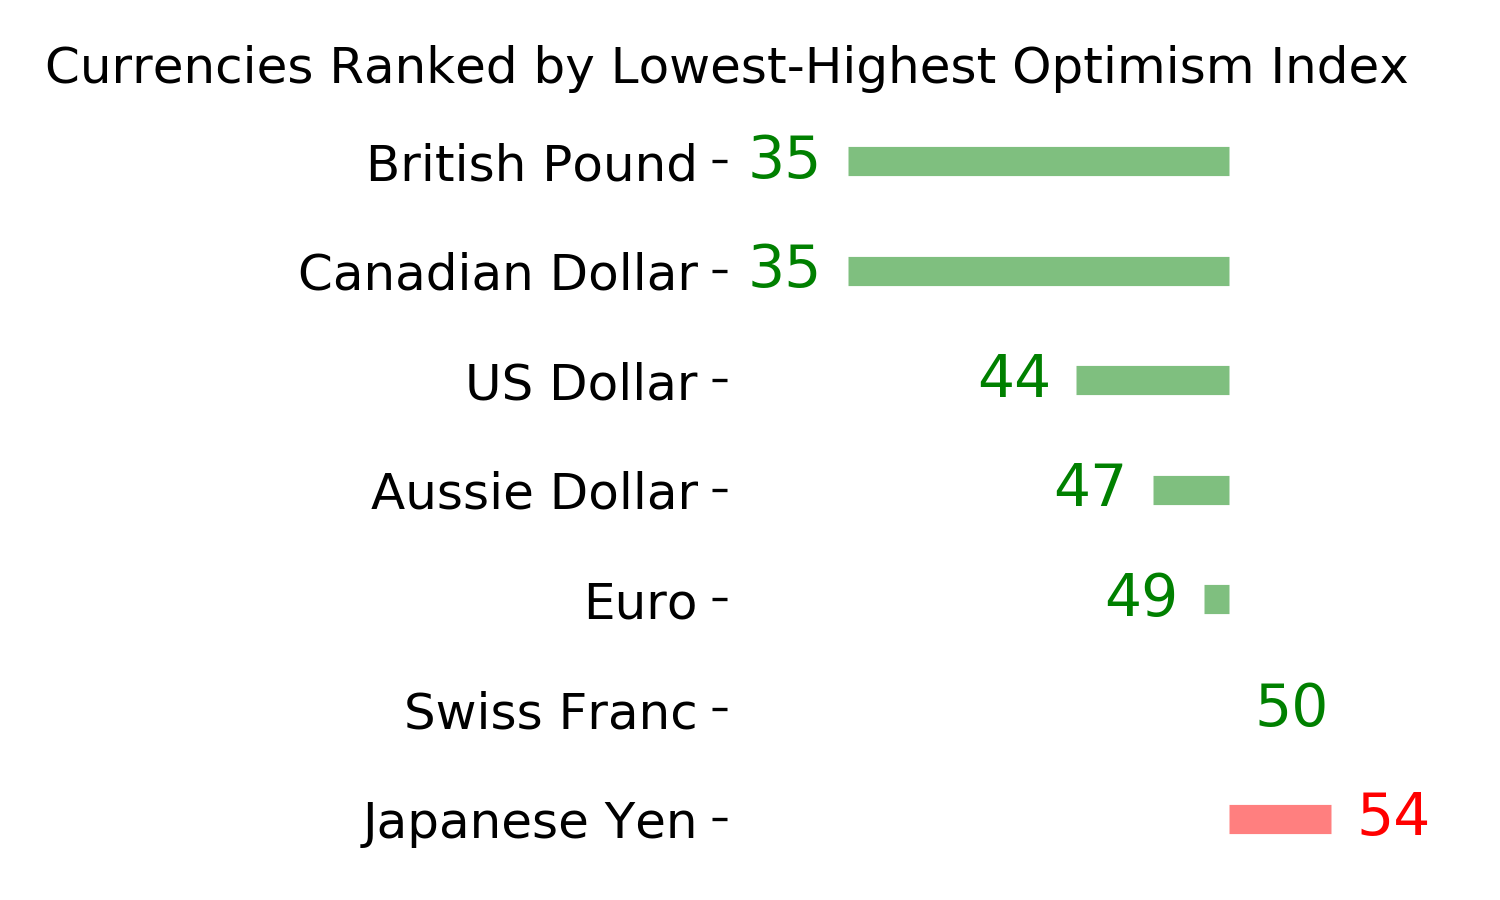
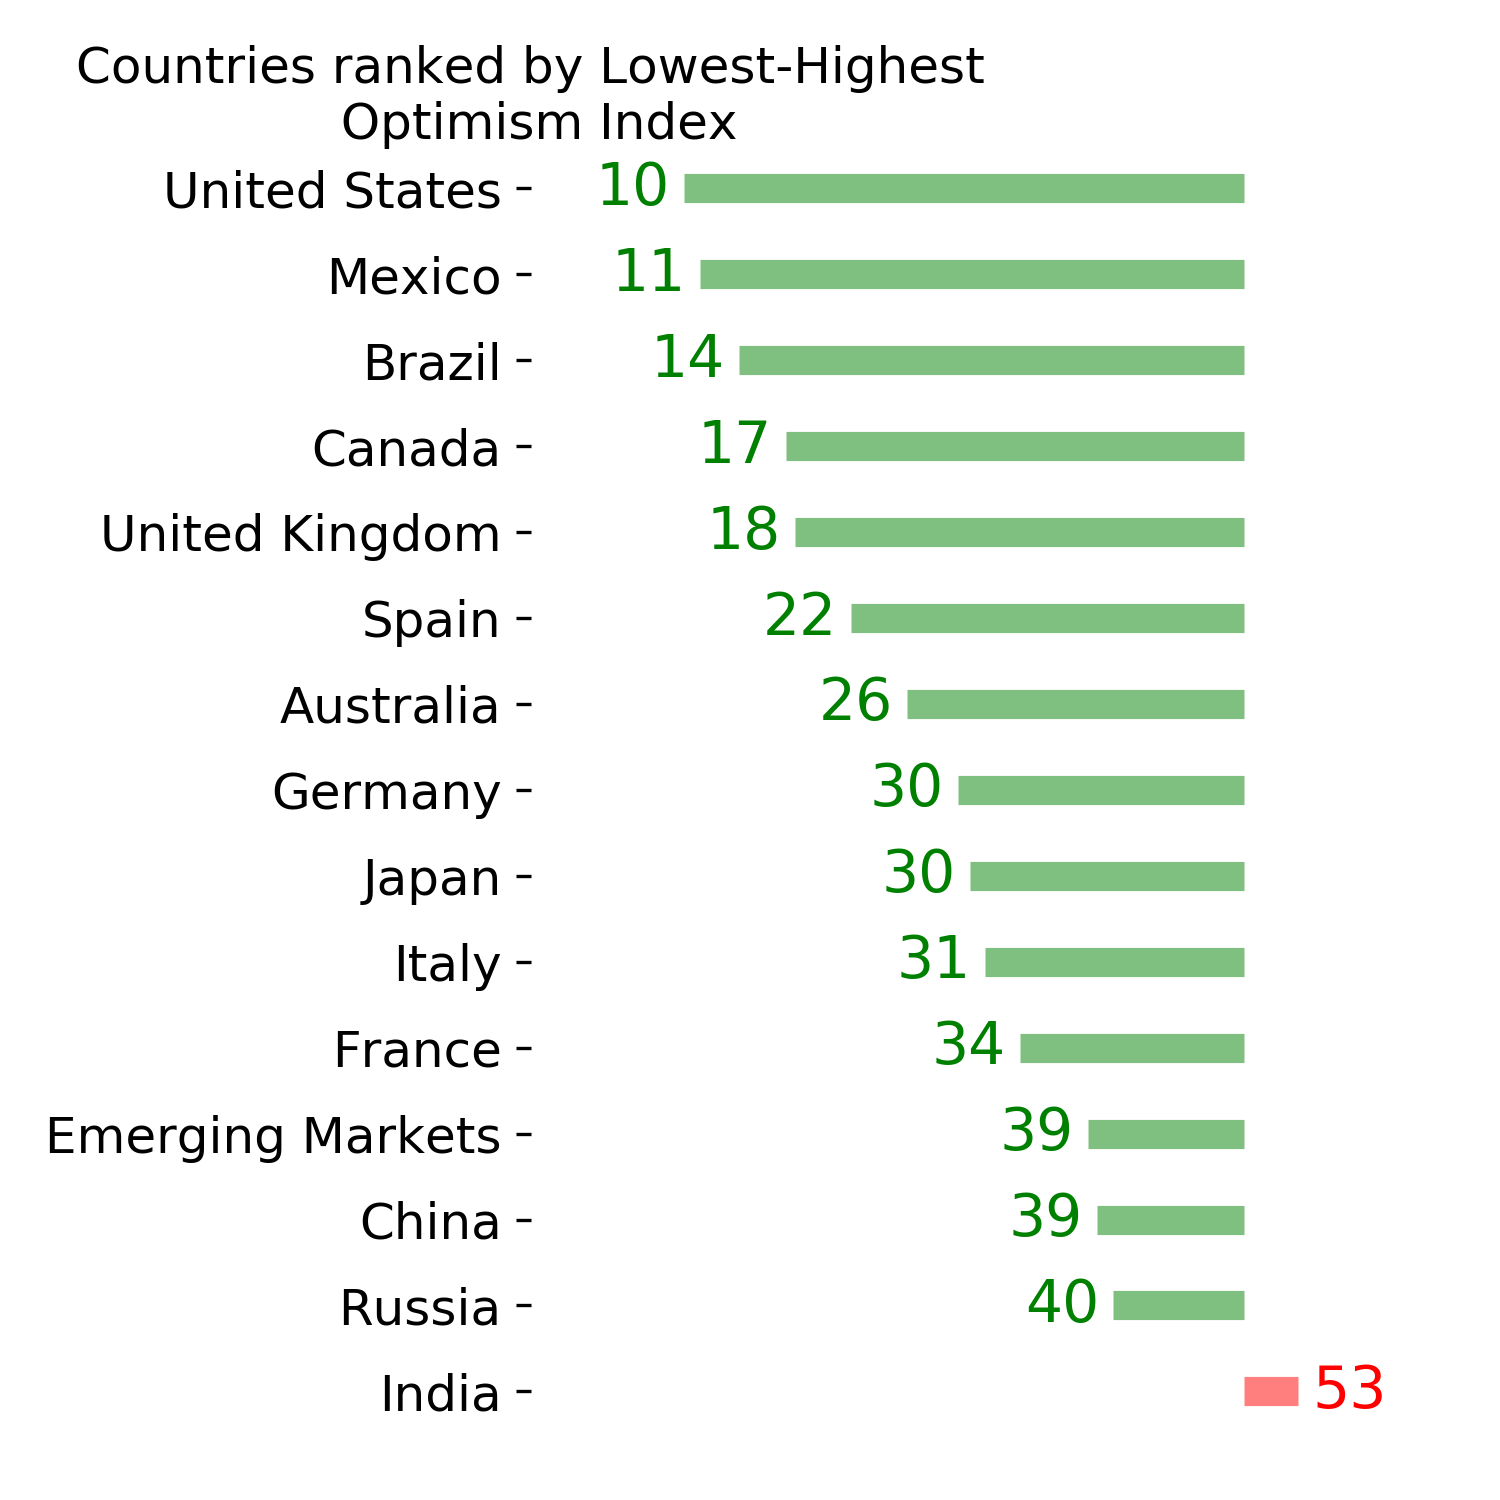
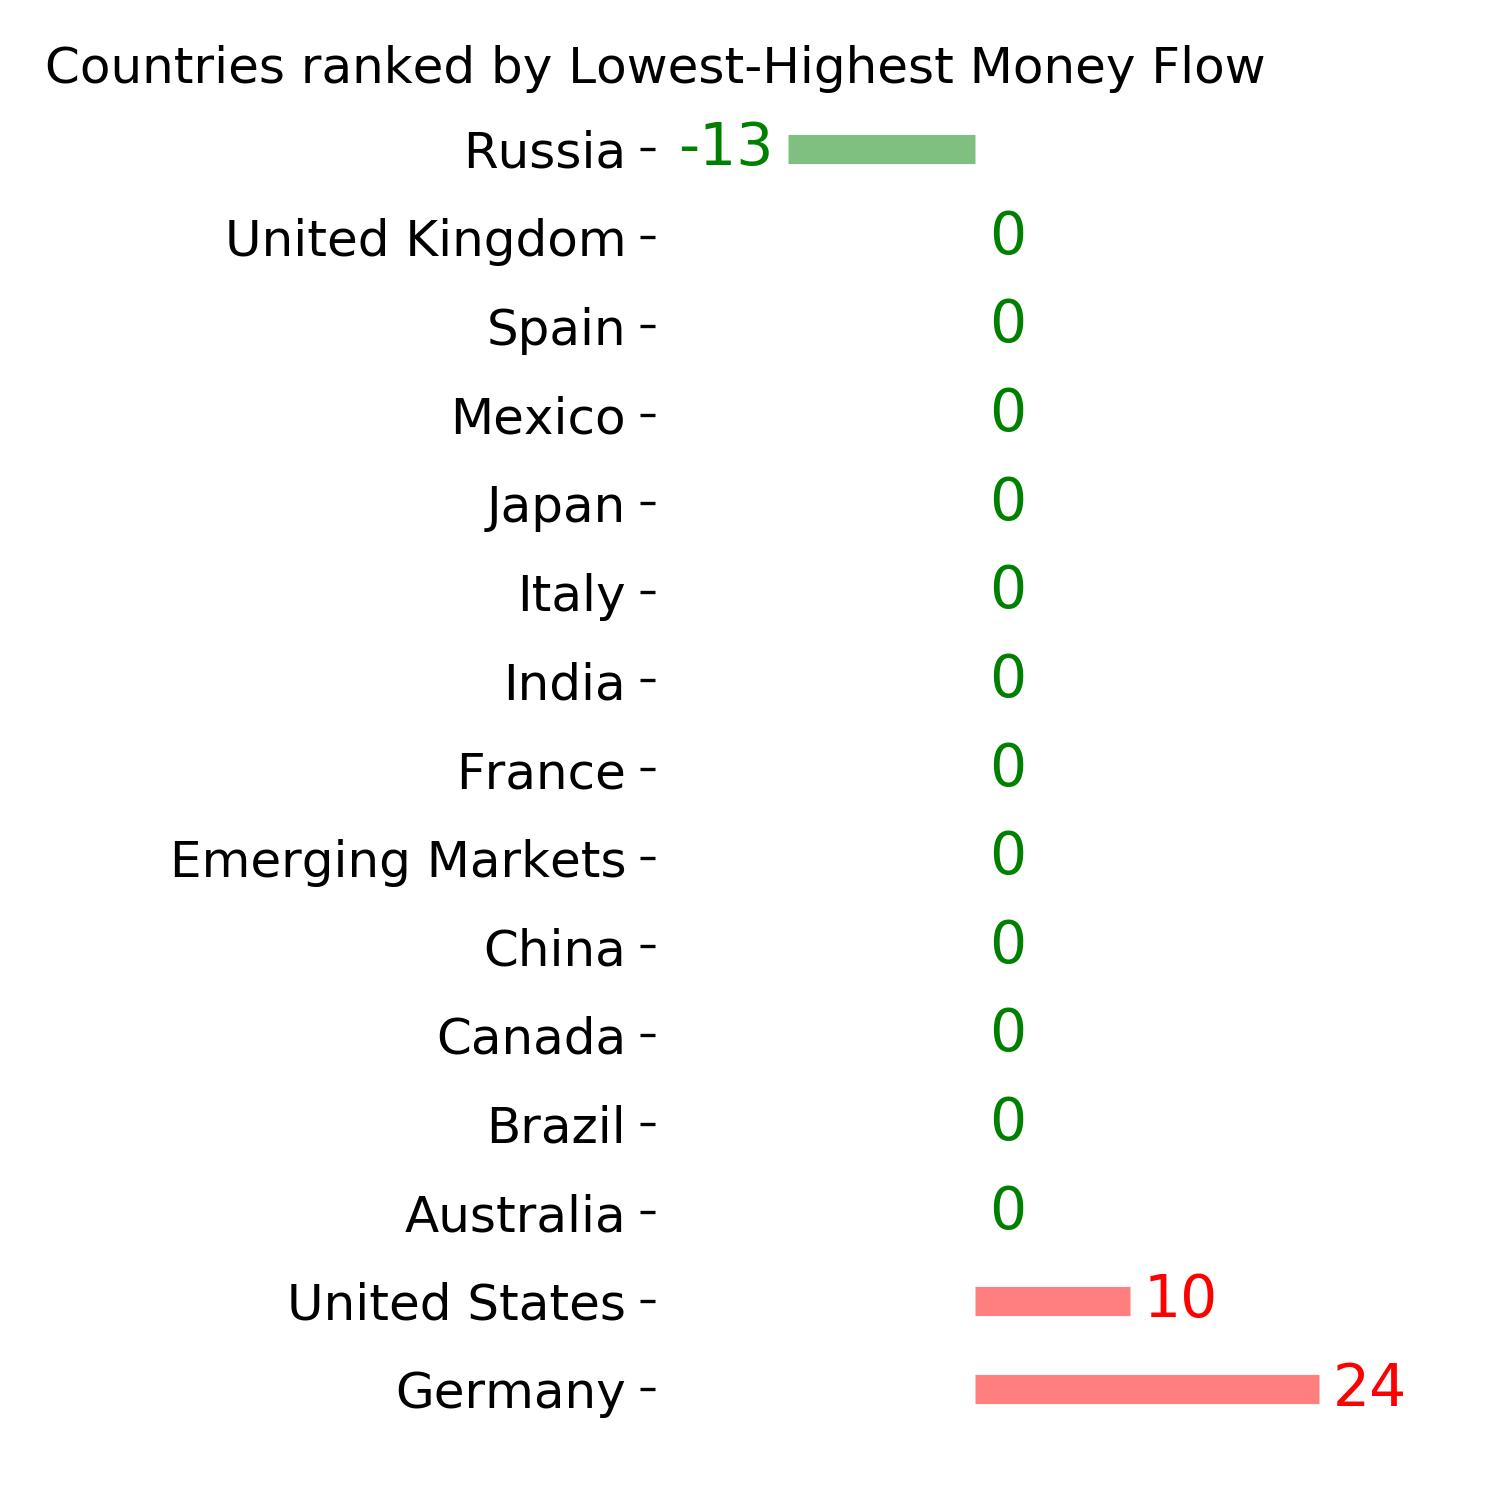
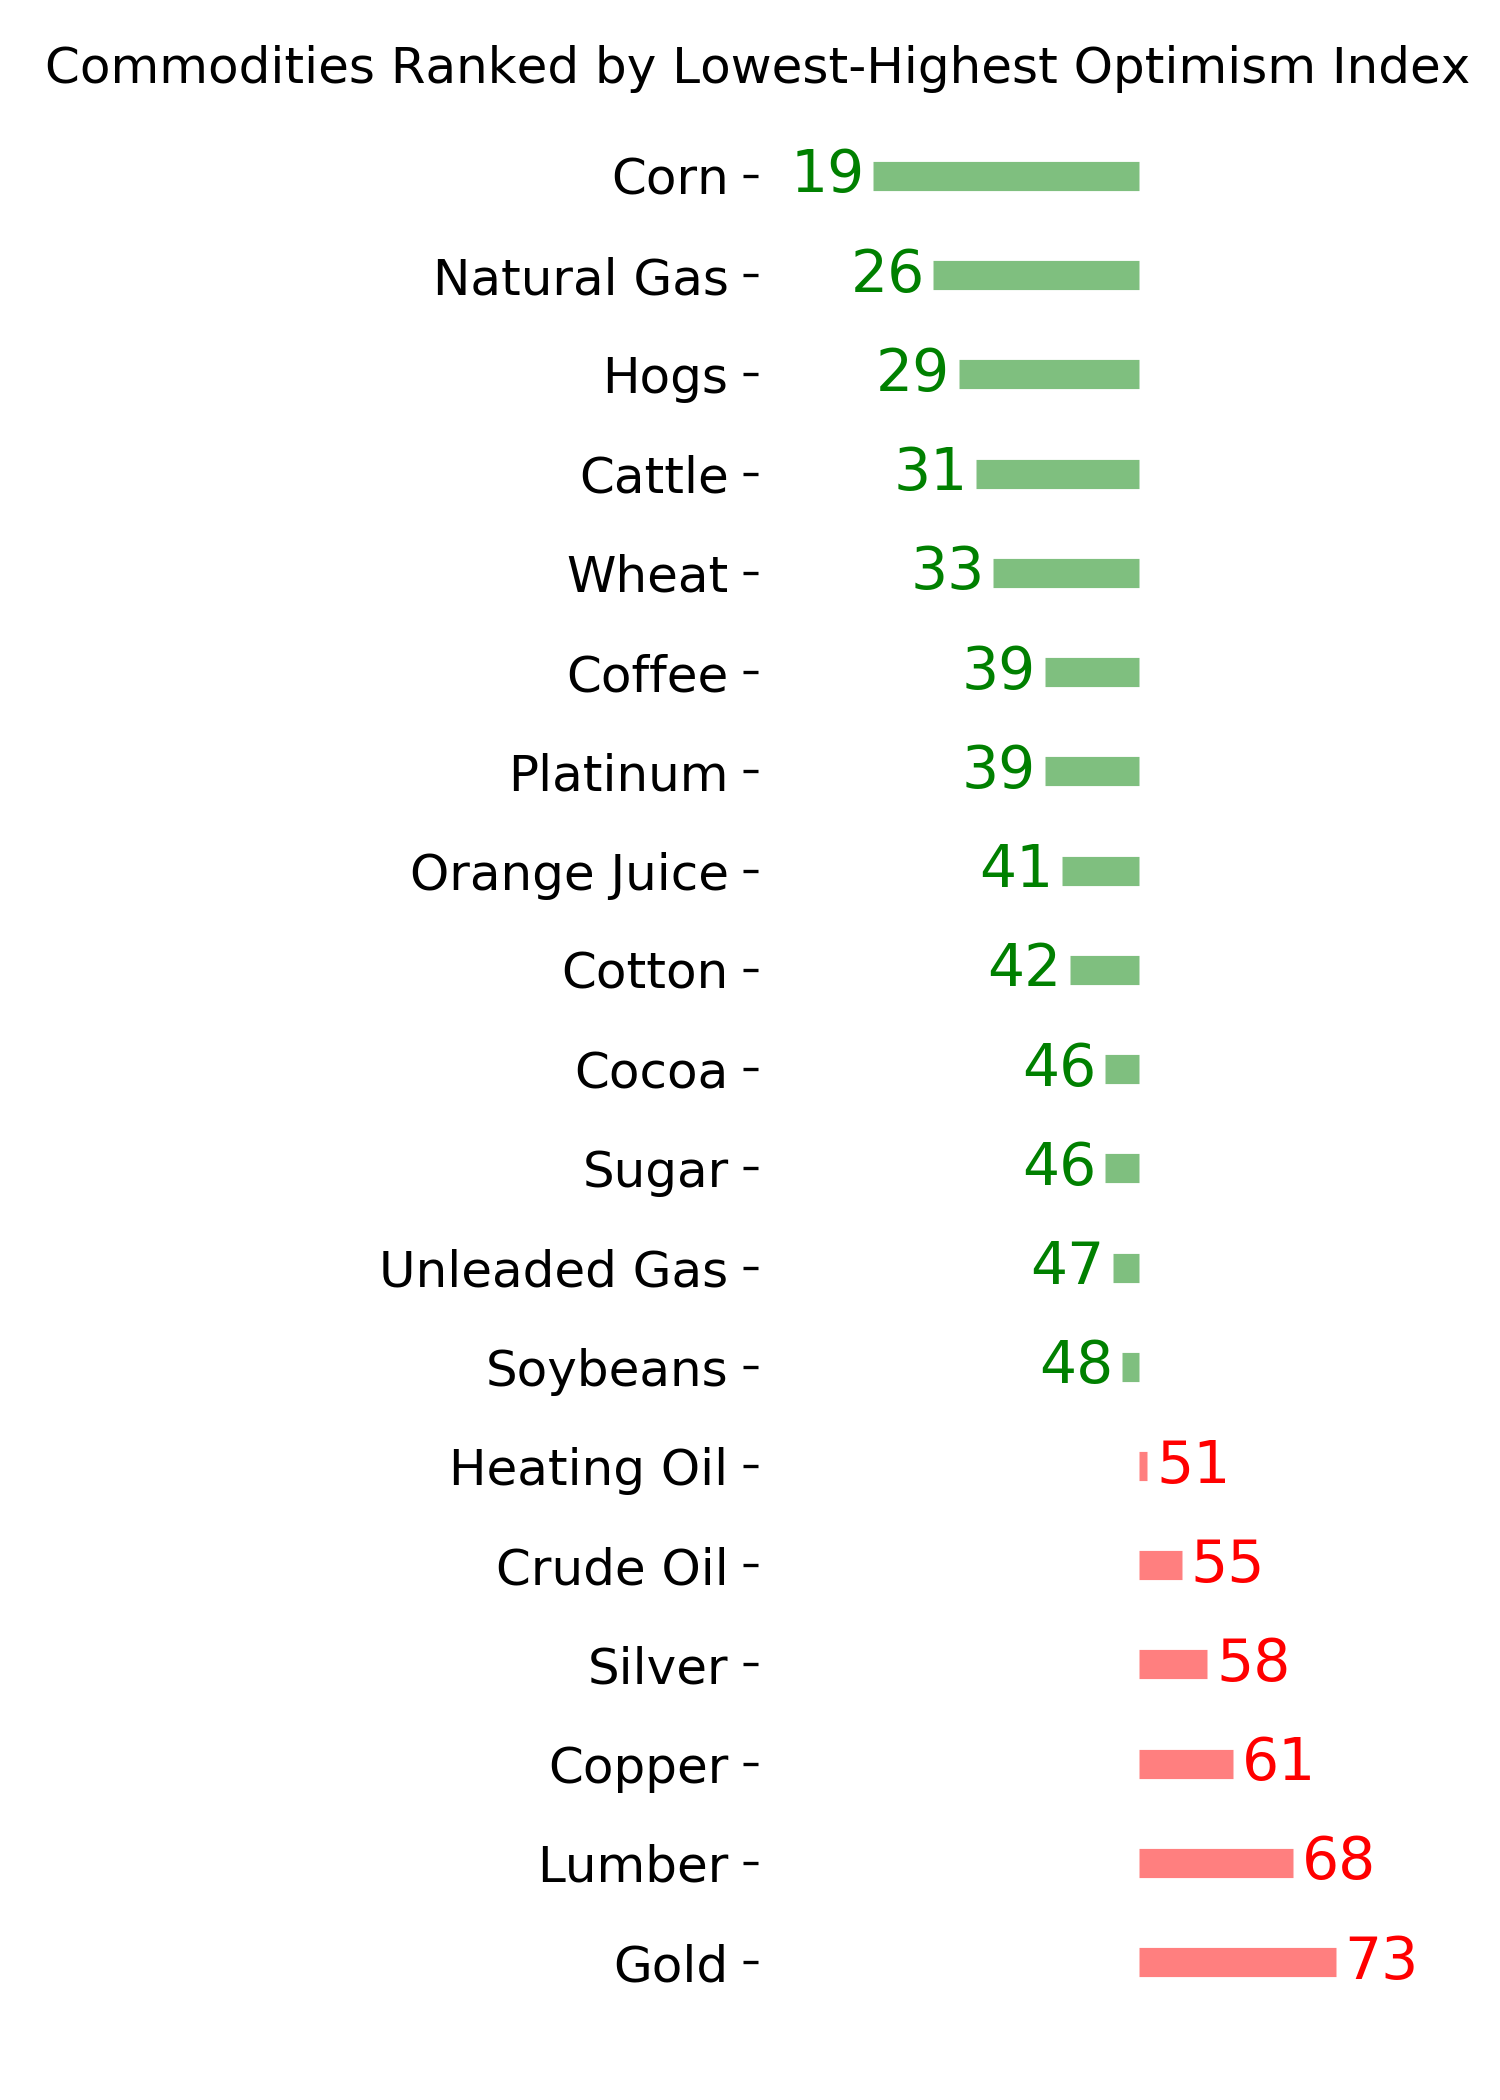
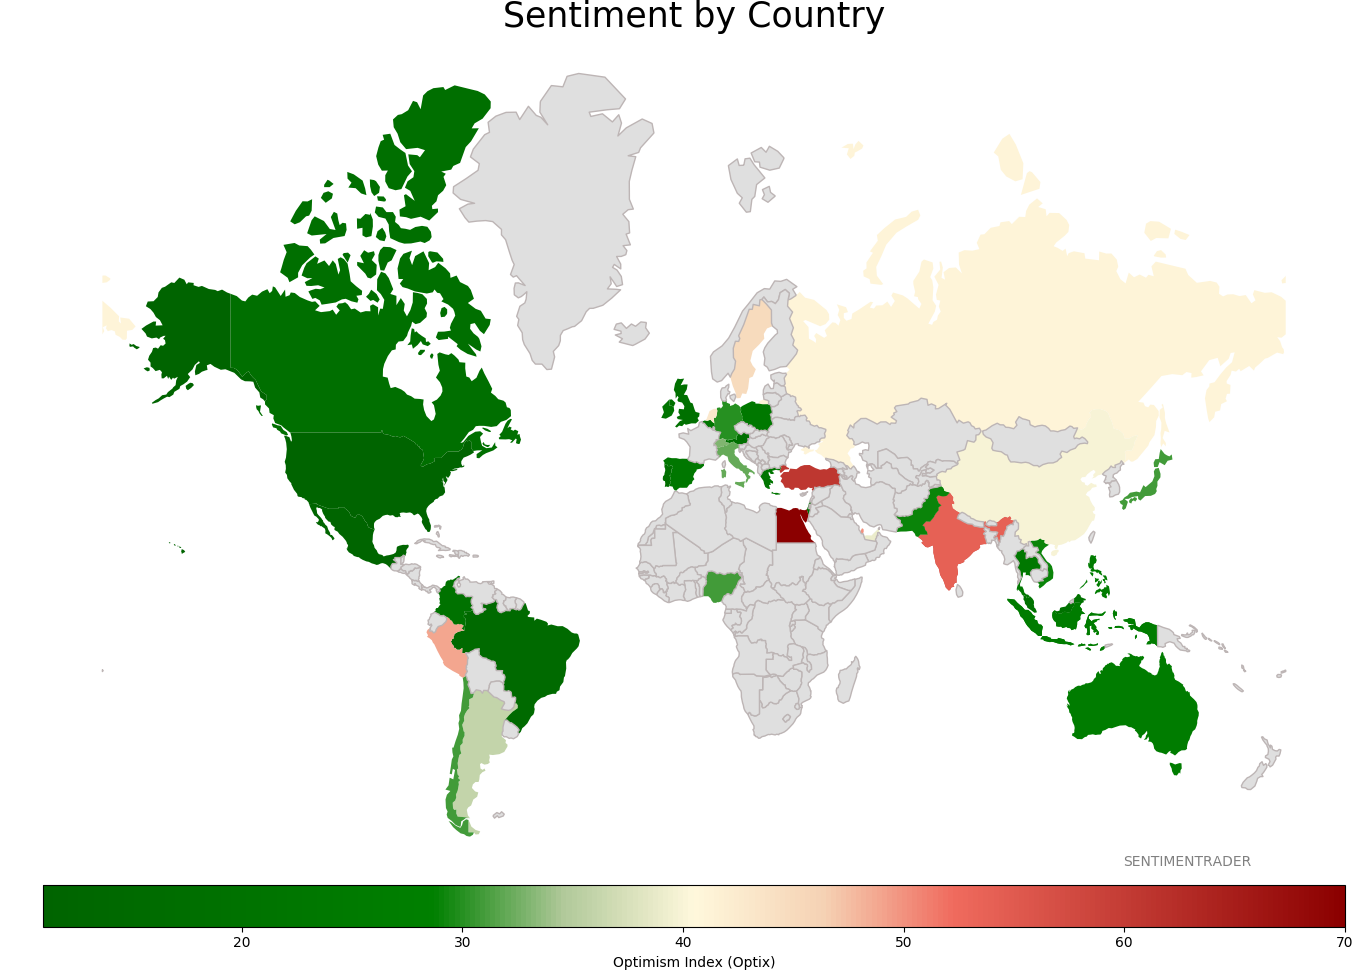
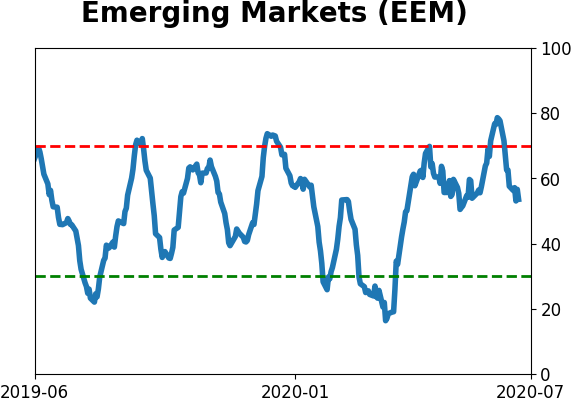
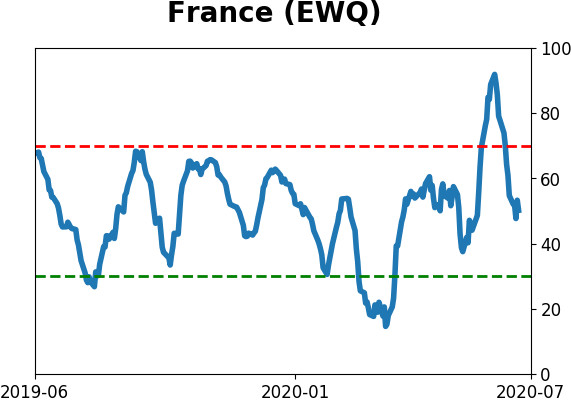
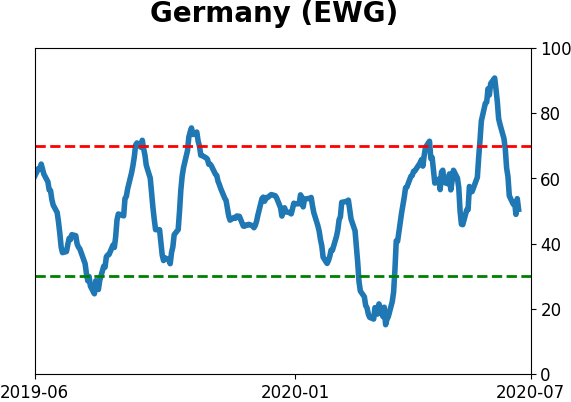
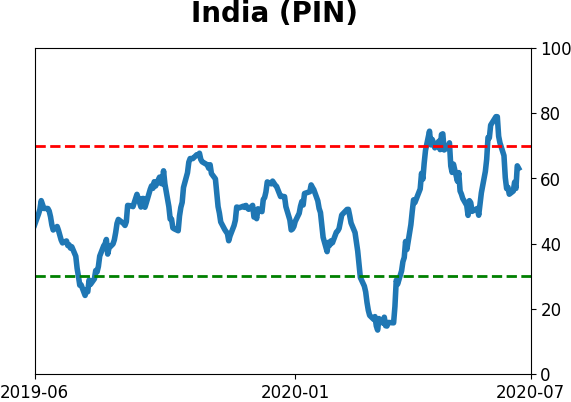
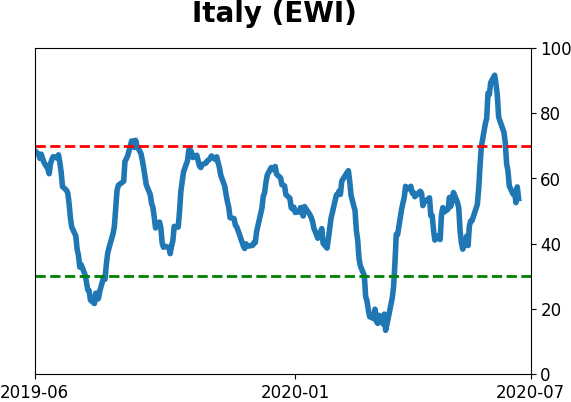
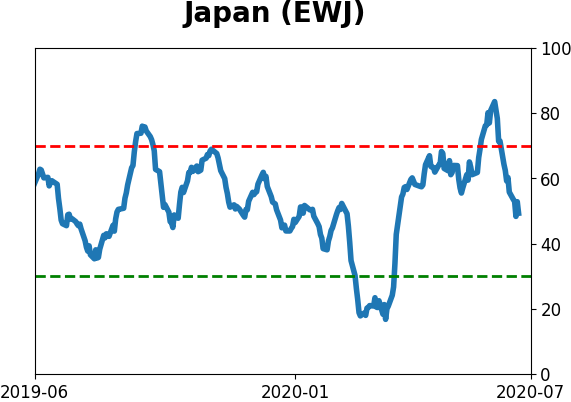
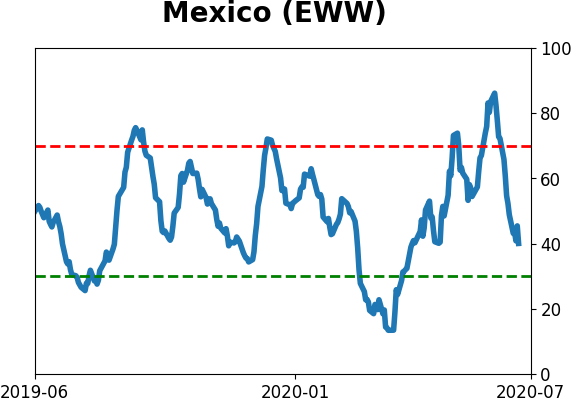
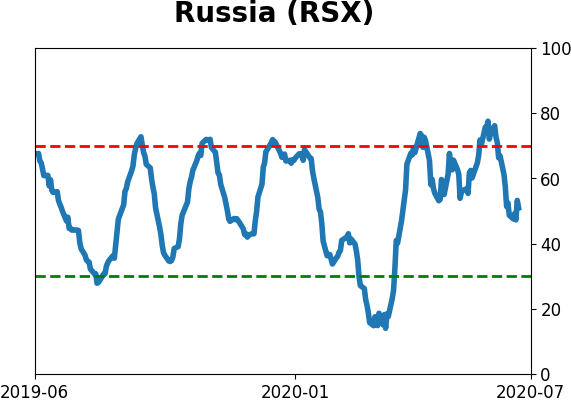
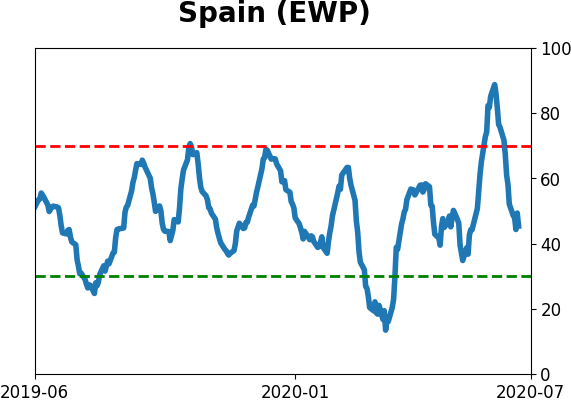
Sentiment Around The World
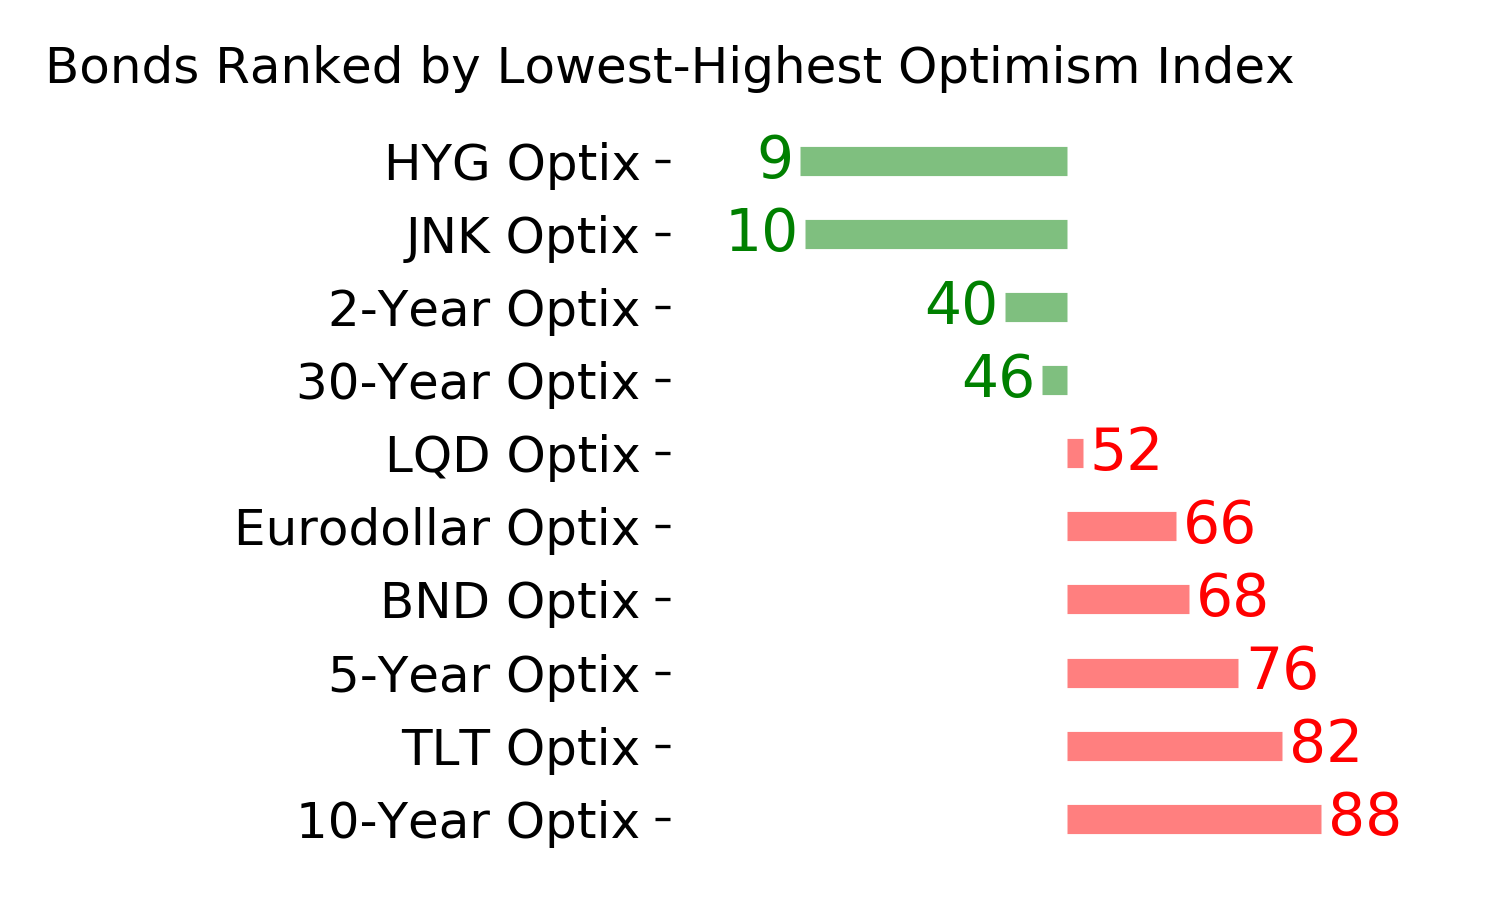
Optimism Index Thumbnails
|
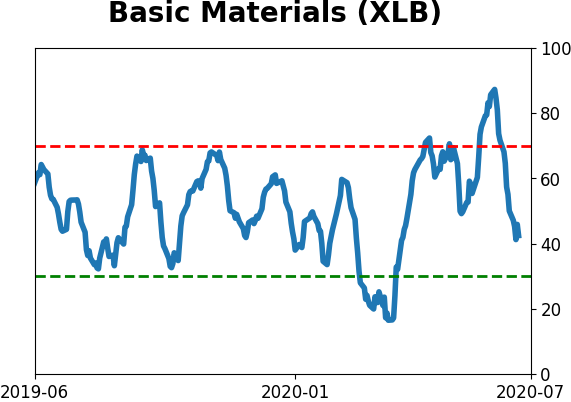
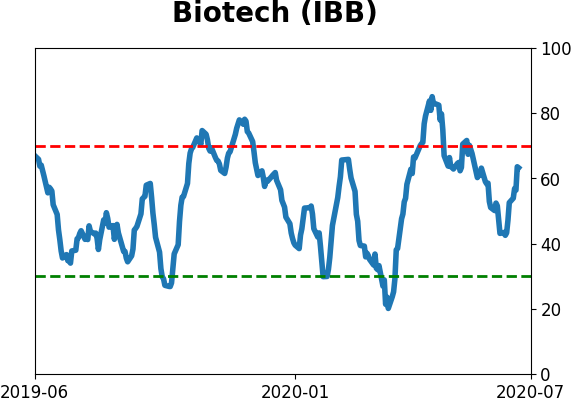
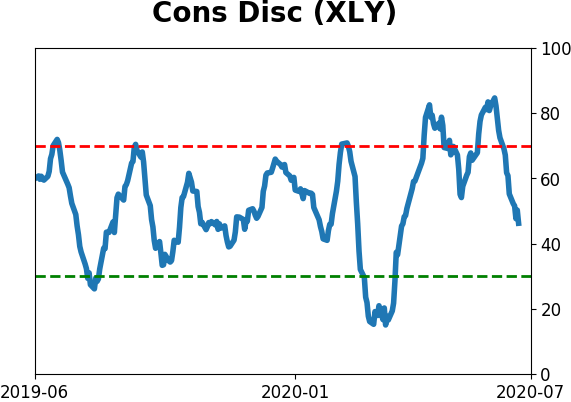
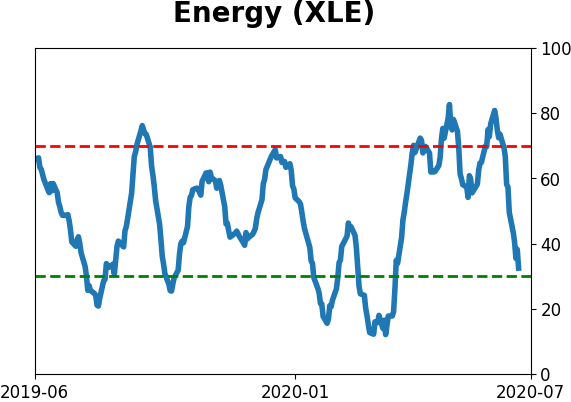
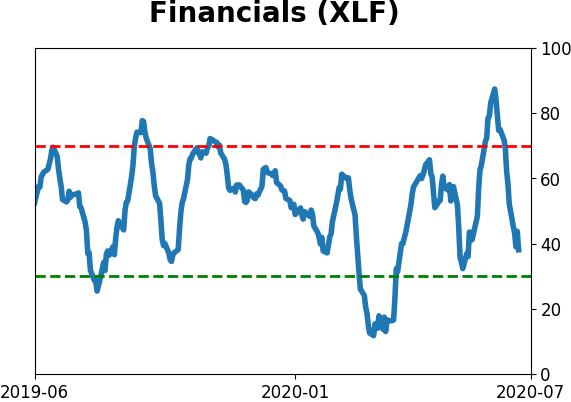
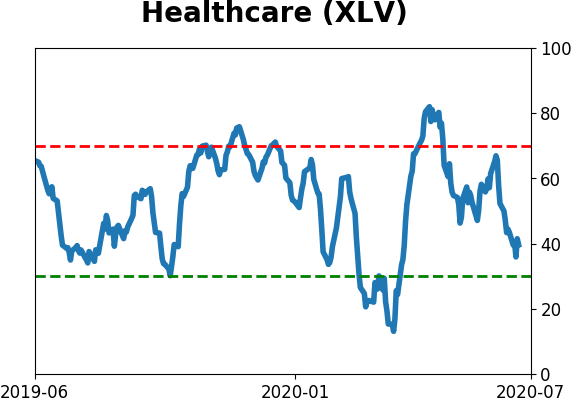
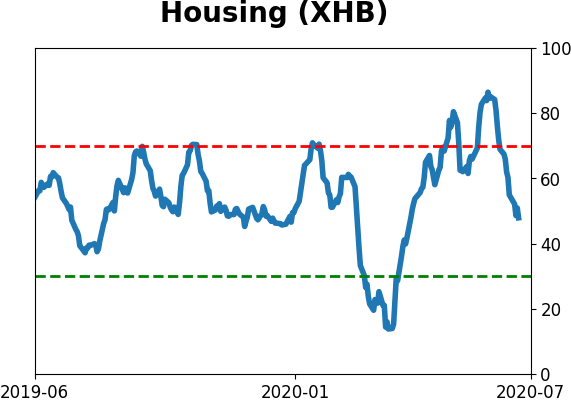
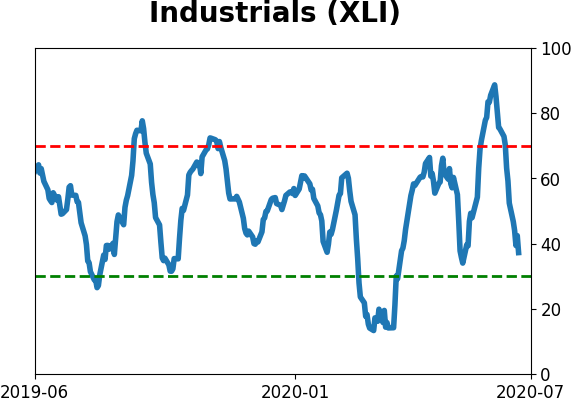
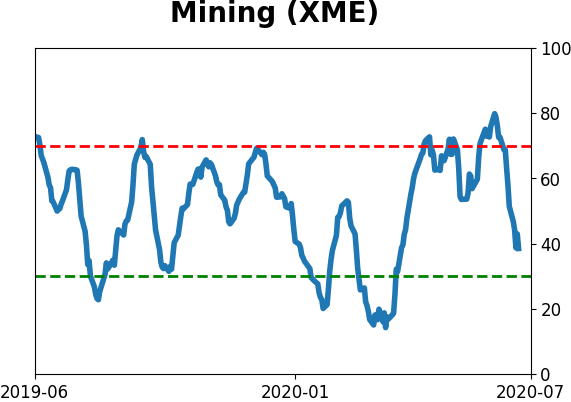
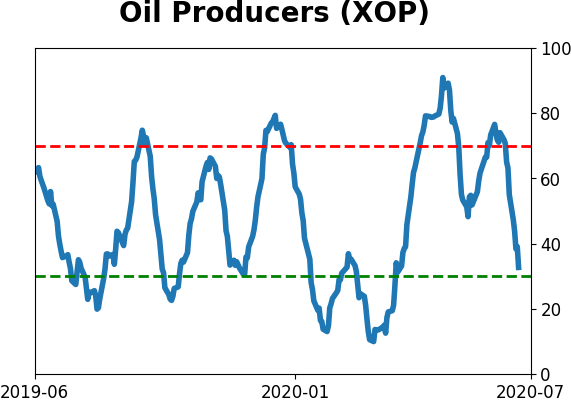
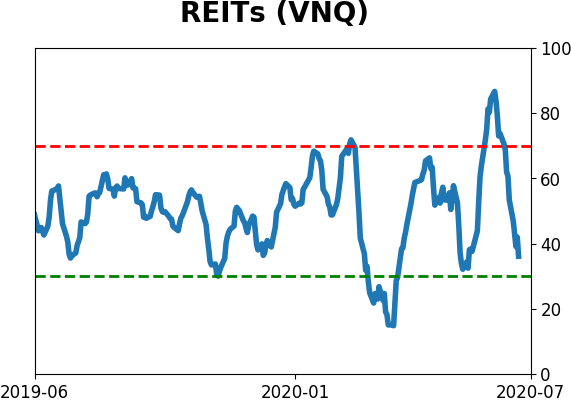
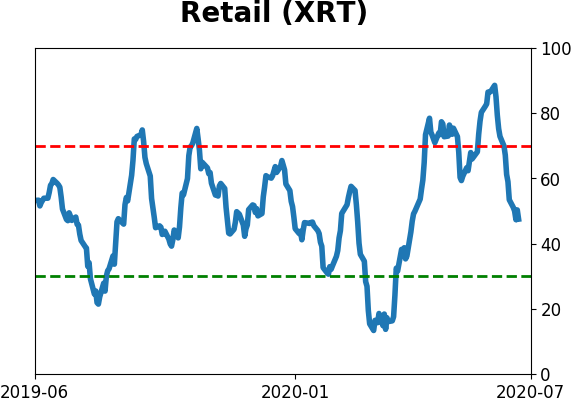
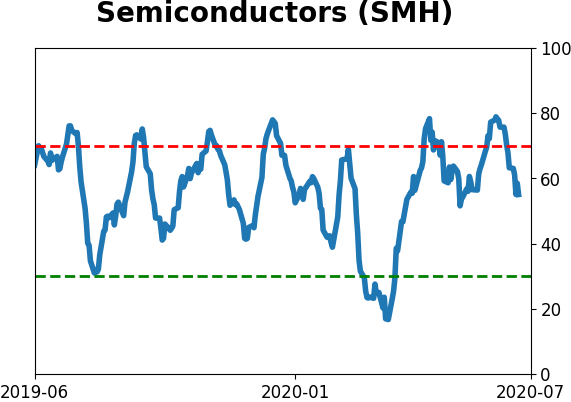
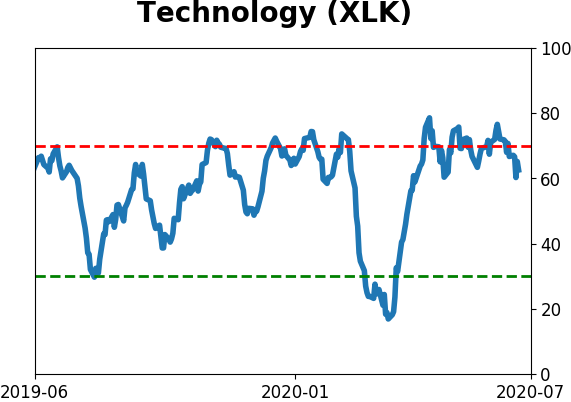
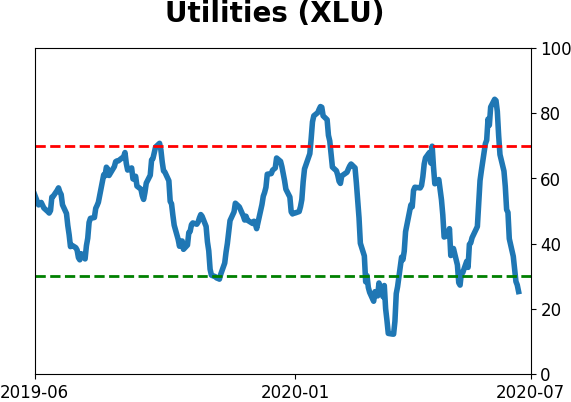
Sector ETF's - 10-Day Moving Average
|
|
|
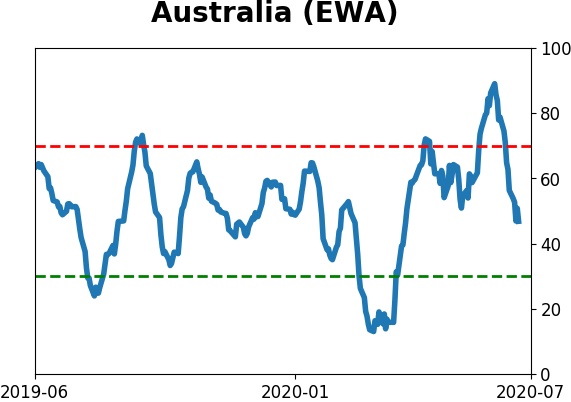
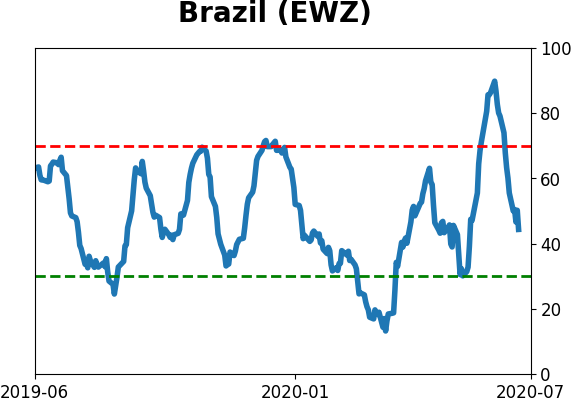
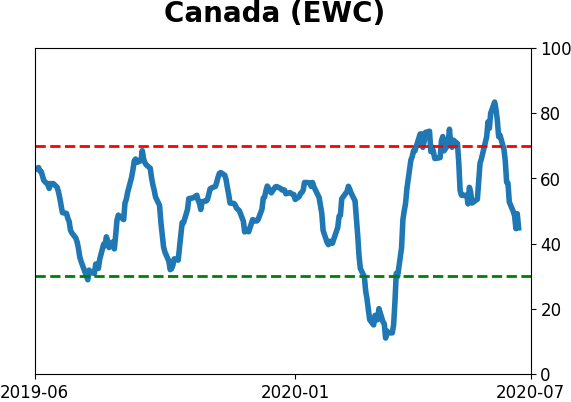
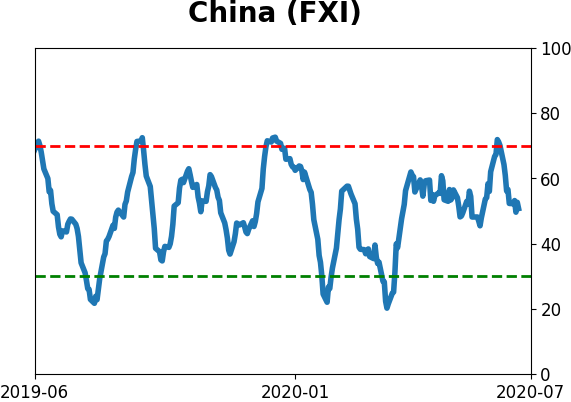
Country ETF's - 10-Day Moving Average
|
|
|
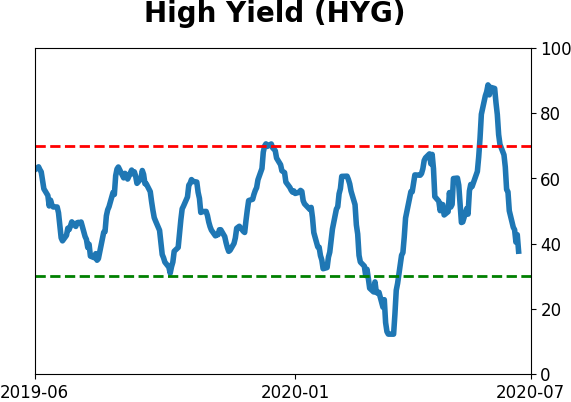
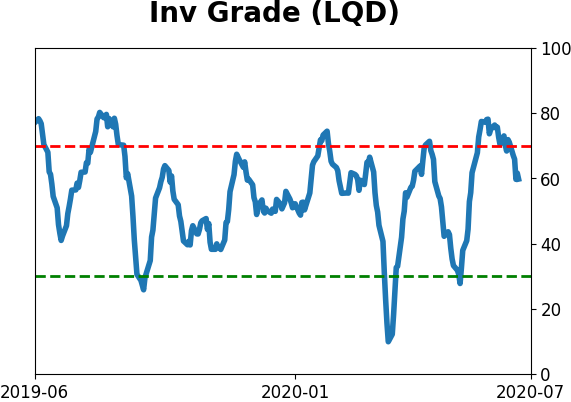
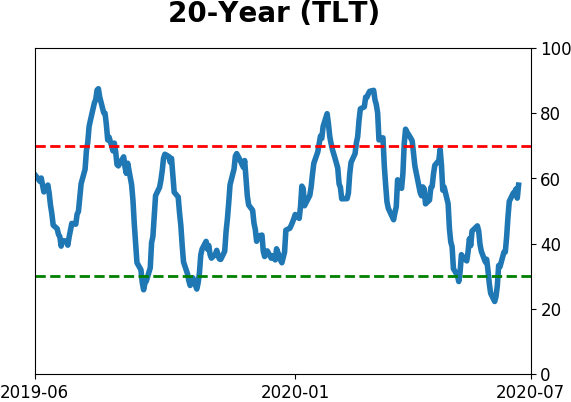
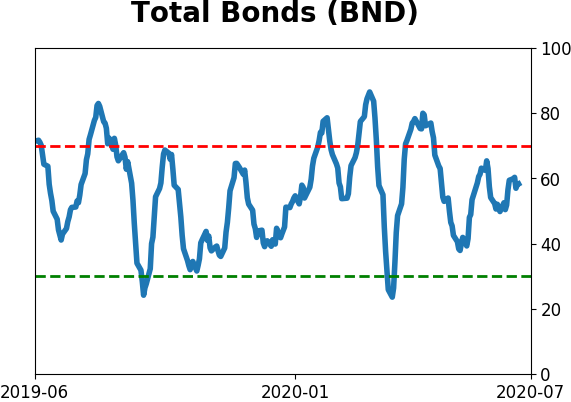
Bond ETF's - 10-Day Moving Average
|
|
|
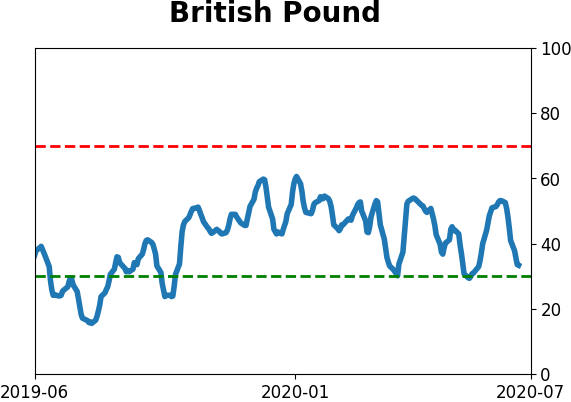
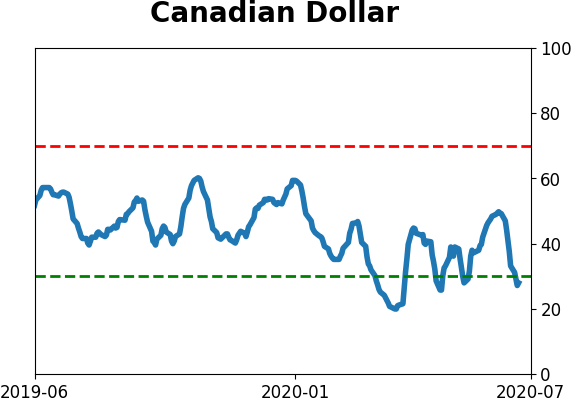
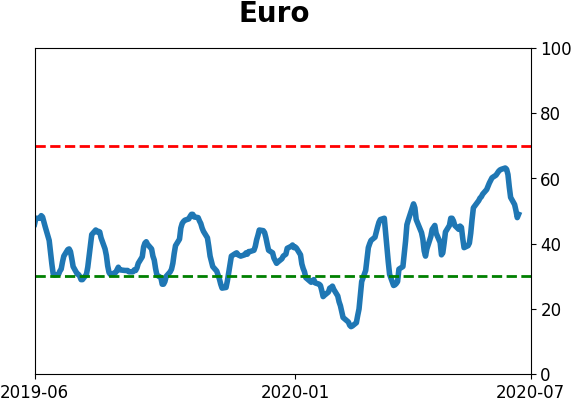
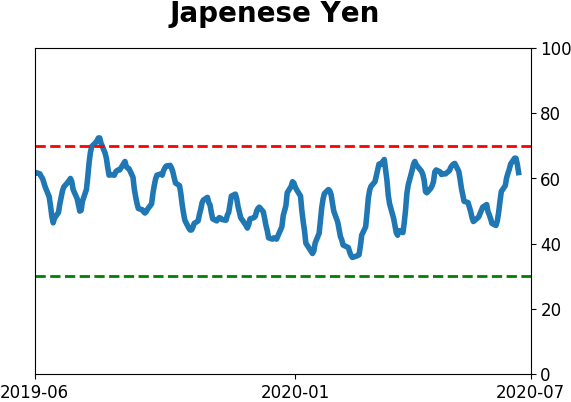
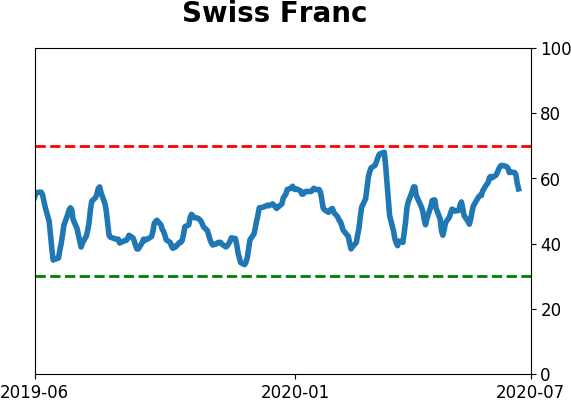
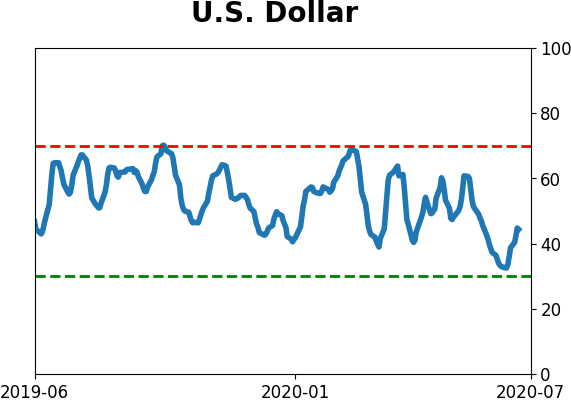
Currency ETF's - 5-Day Moving Average
|
|
|
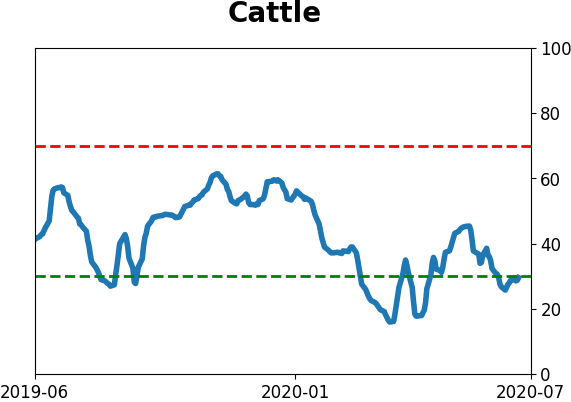
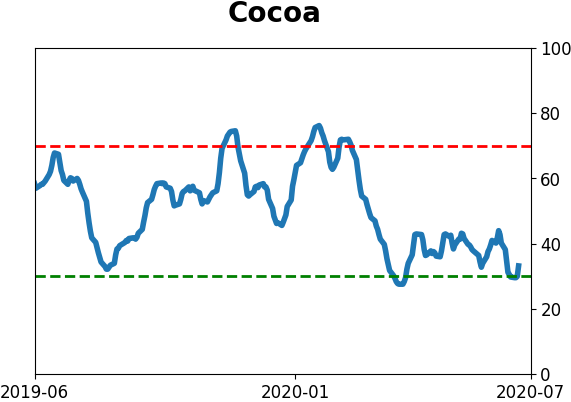
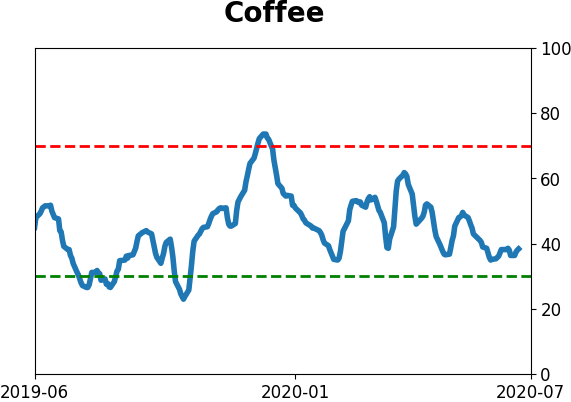
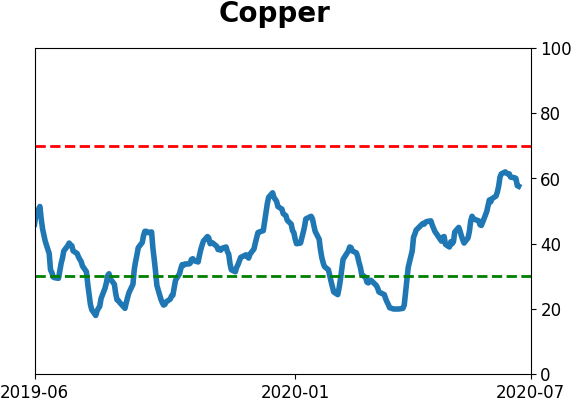
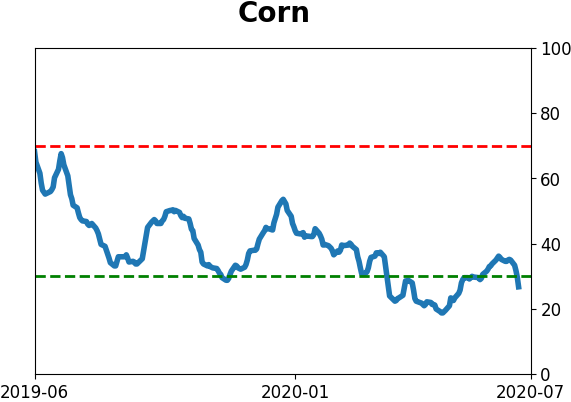
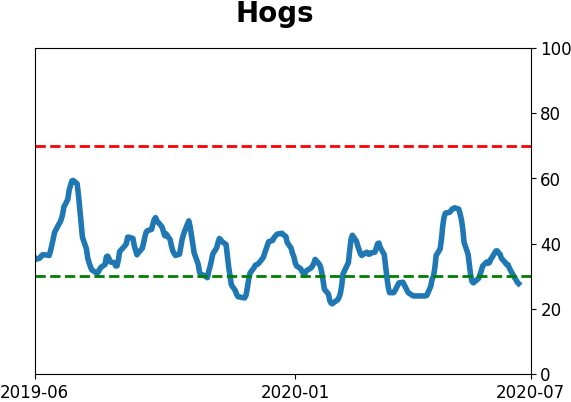
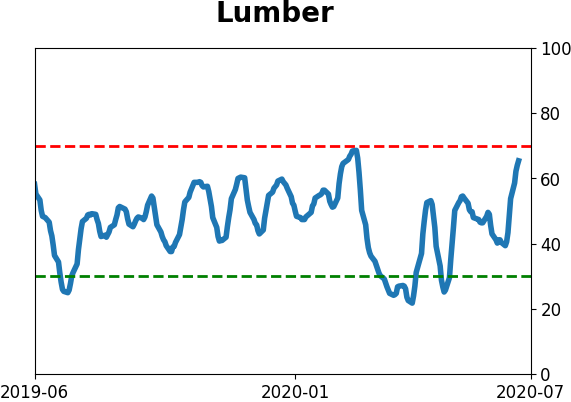
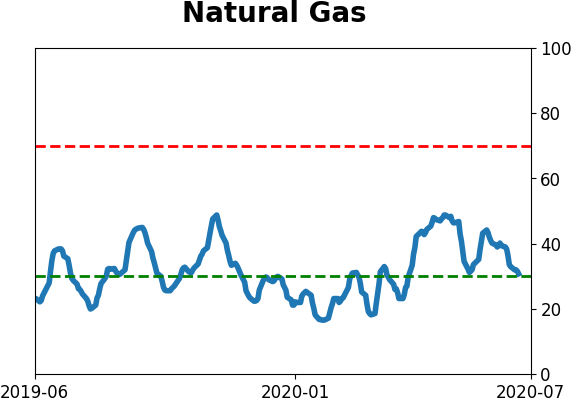
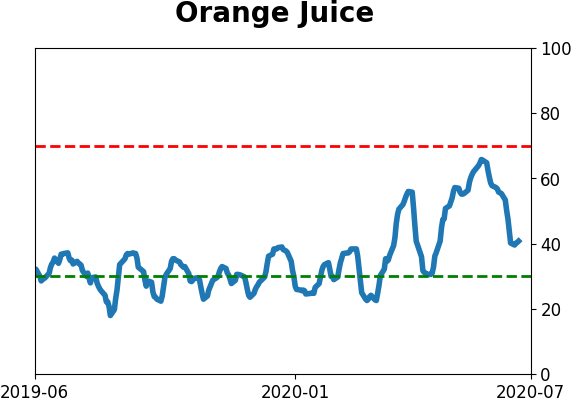
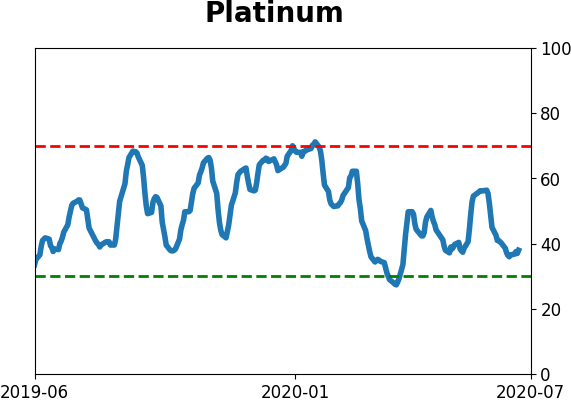
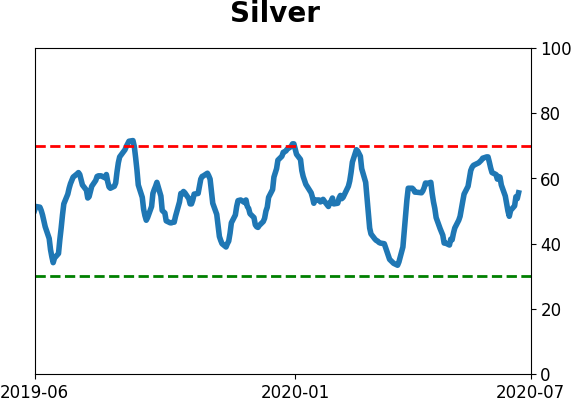
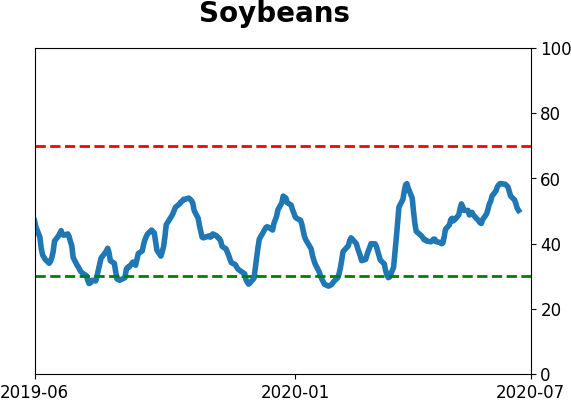
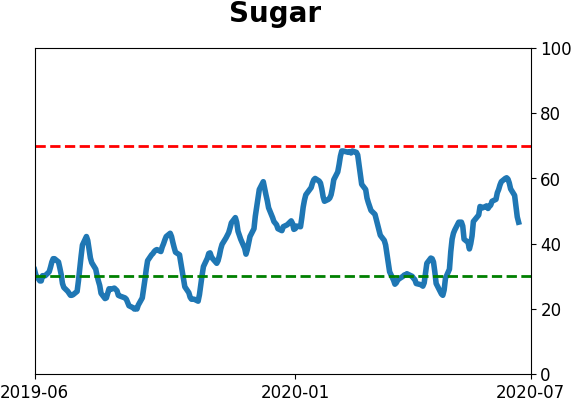
Commodity ETF's - 5-Day Moving Average
|
|