Headlines
|
|
A Record Glut of Shares from Money Losers:
There has been a surge of secondary issuance of shares by U.S. companies in recent months. Even more notable, much of that issuance has come from companies that have negative net income.
Bottom Line:
See the Outlook & Allocations page for more details on these summaries STOCKS: Hold
The speculative frenzy in February is wrung out. Internal dynamics have mostly held up, with some exceptions. Many of our studies still show a mixed to poor short-term view, with medium- and long-term ones turning more positive. BONDS: Hold
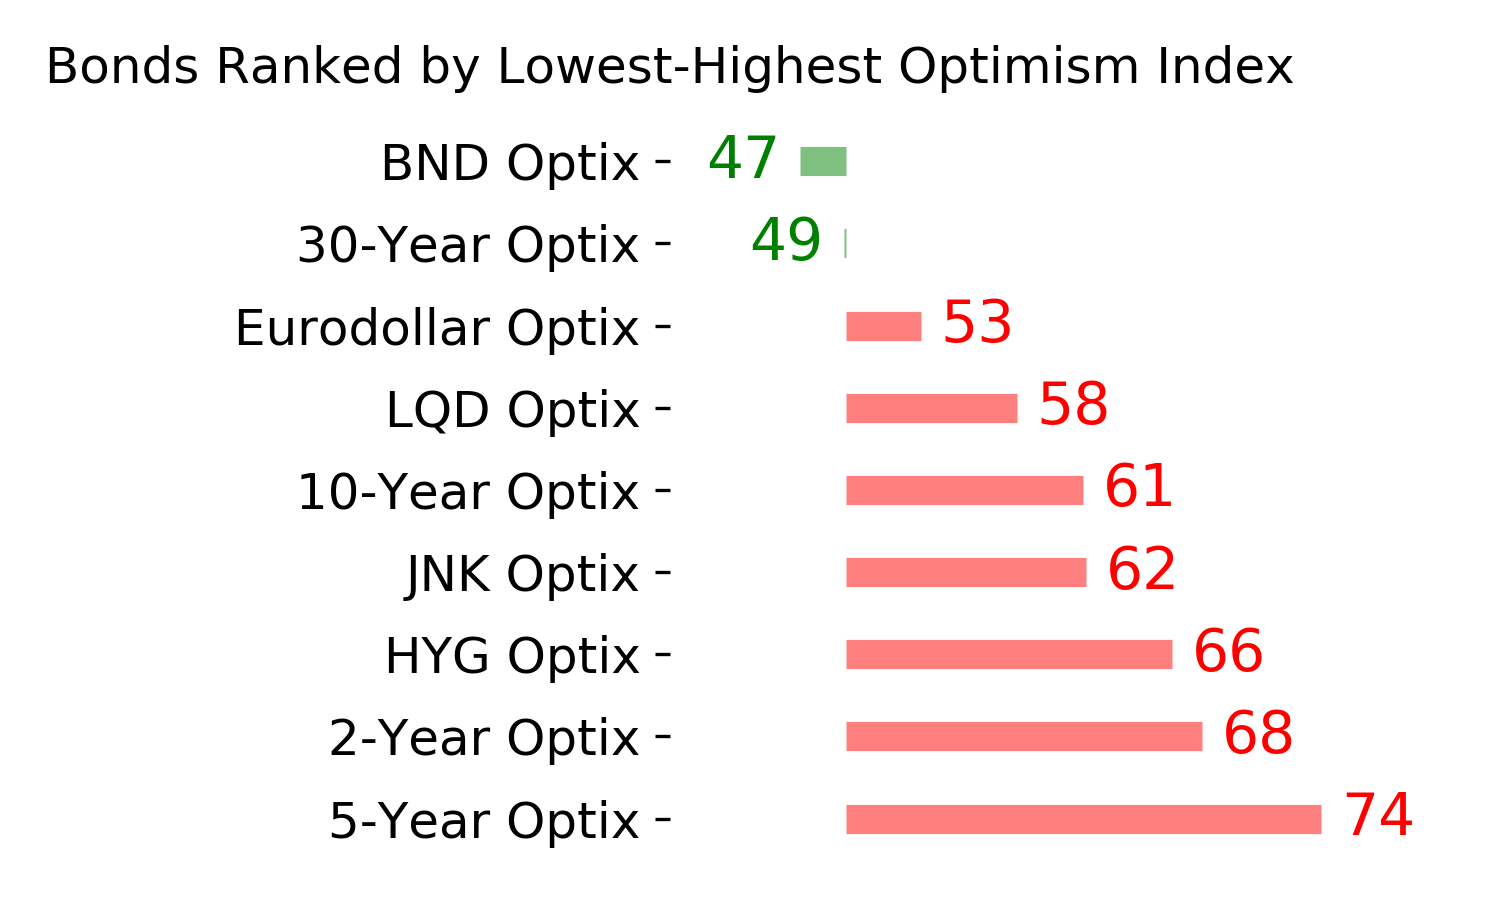
Various parts of the market got hit in March, with the lowest Bond Optimism Index we usually see during healthy environments. After a shaky couple of weeks, the broad bond market has modestly recovered. Not a big edge here either way. GOLD: Hold
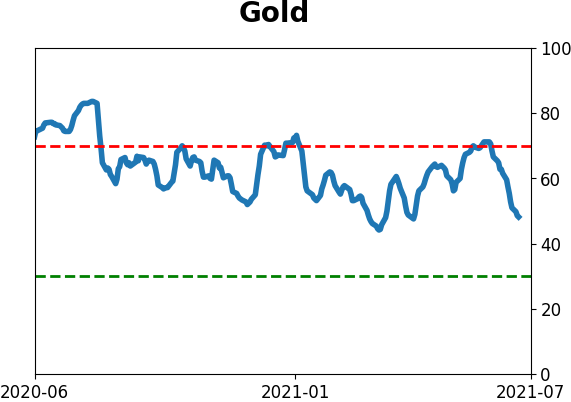
Gold and miners have done very well, recovering above long-term trend lines. The issue is that both have tended to perform poorly after similar situations - will have to wait and see how it plays out.
|
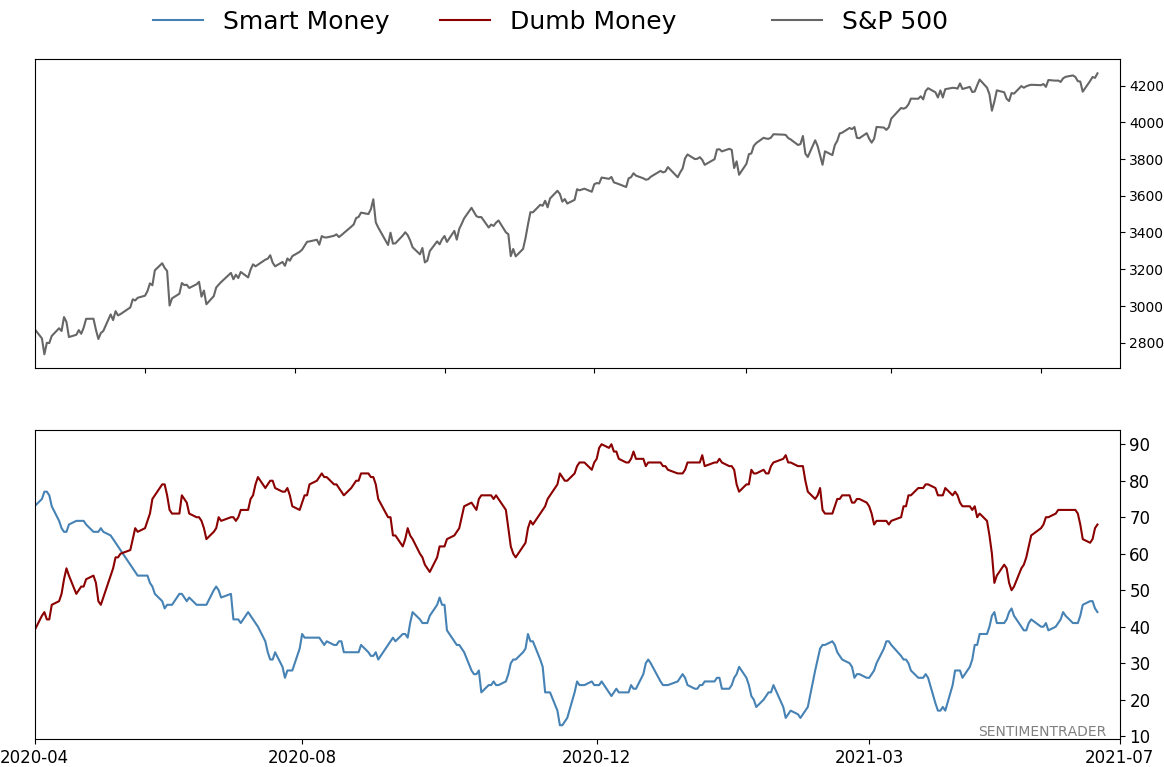
Smart / Dumb Money Confidence
|
Smart Money Confidence: 44%
Dumb Money Confidence: 68%
|
|
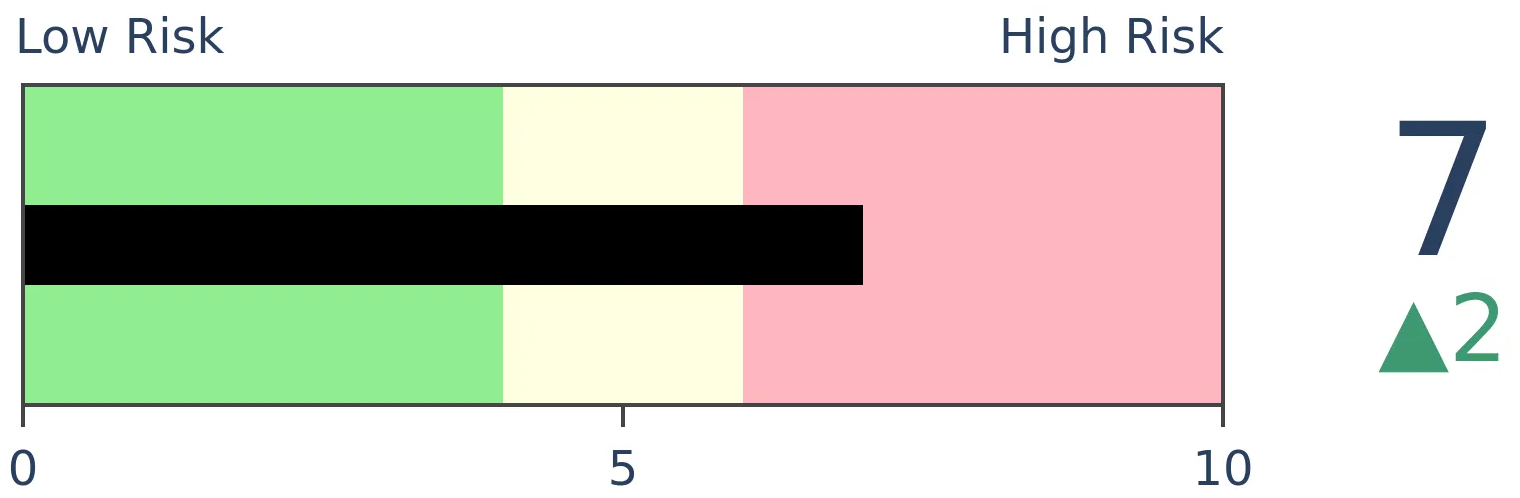
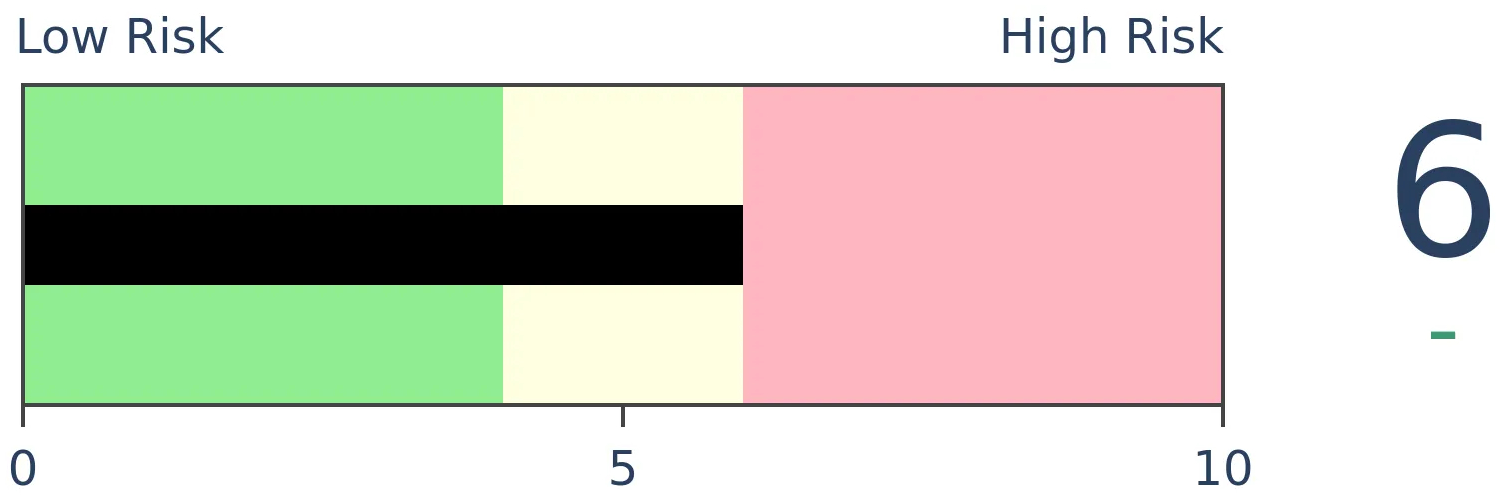
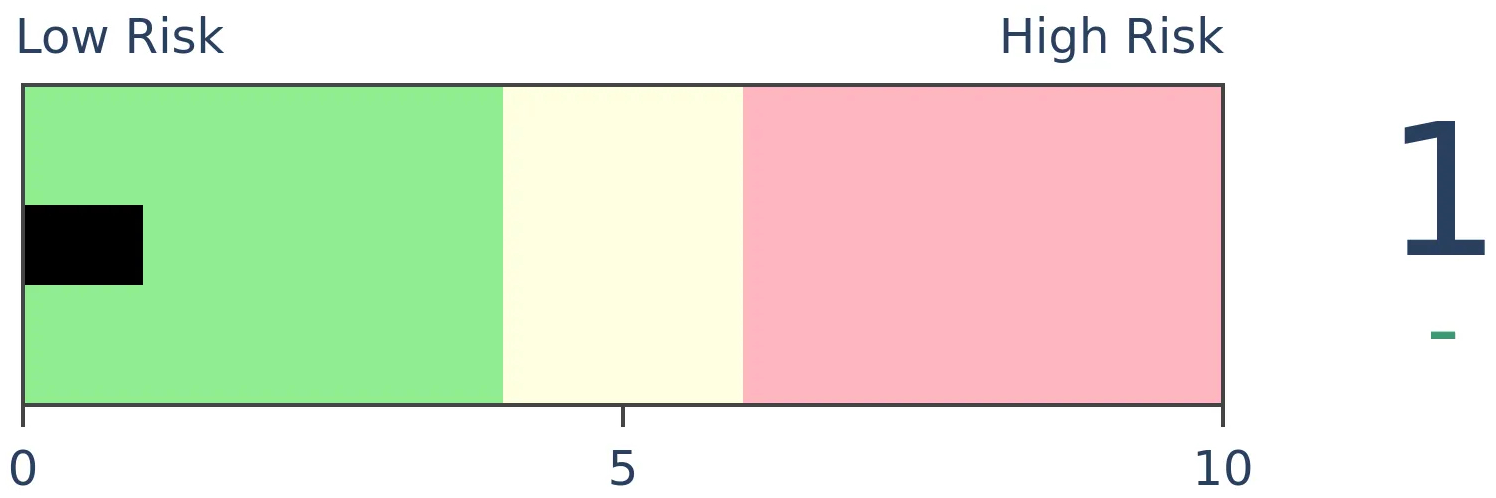
Risk Levels
Stocks Short-Term
|
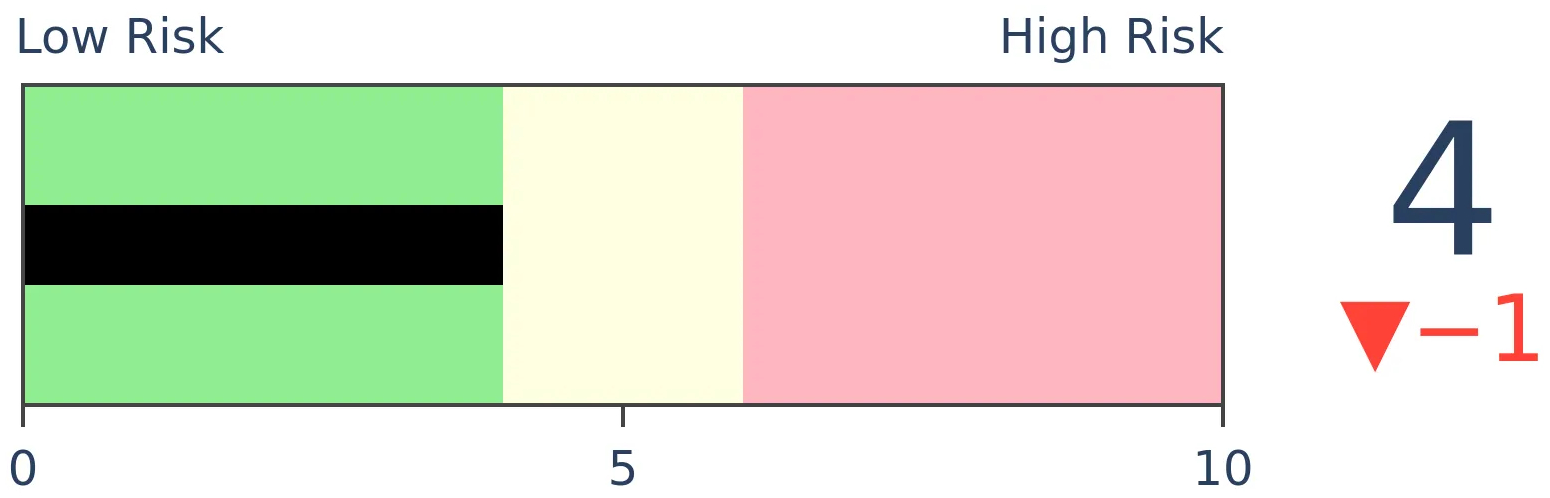
Stocks Medium-Term
|
|
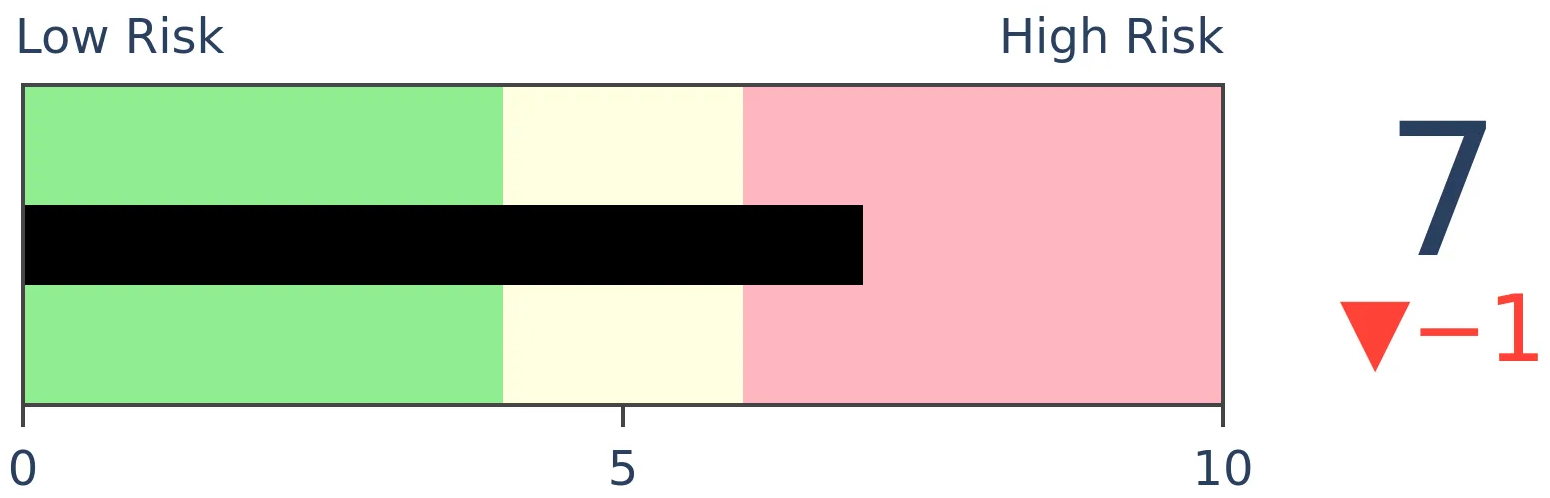
Bonds
|
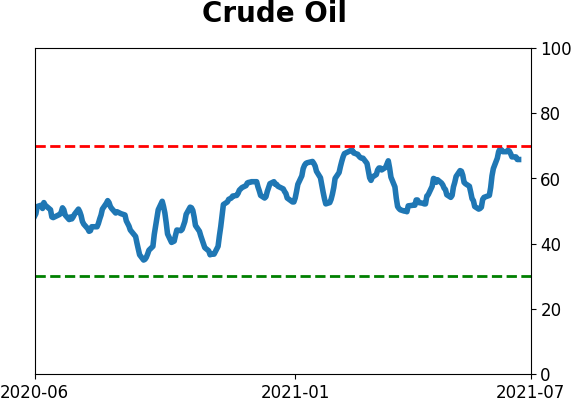
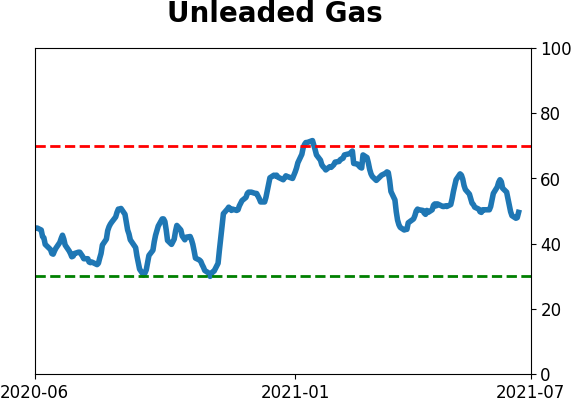
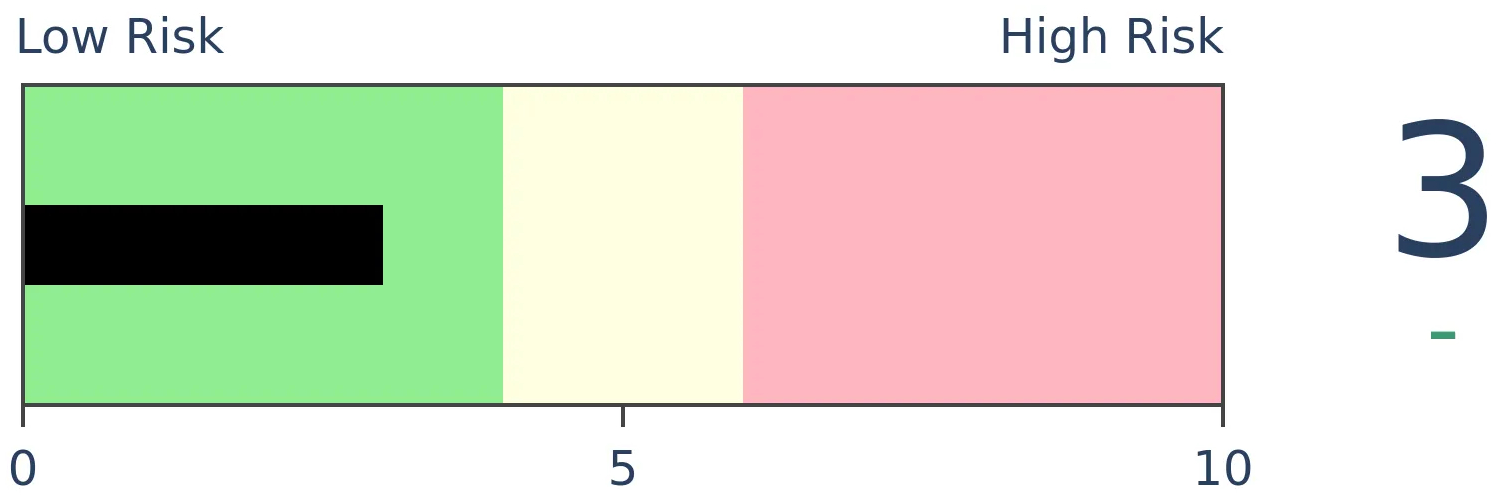
Crude Oil
|
|
Gold
|
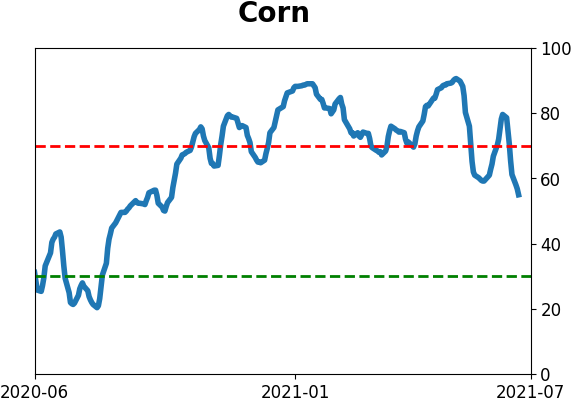
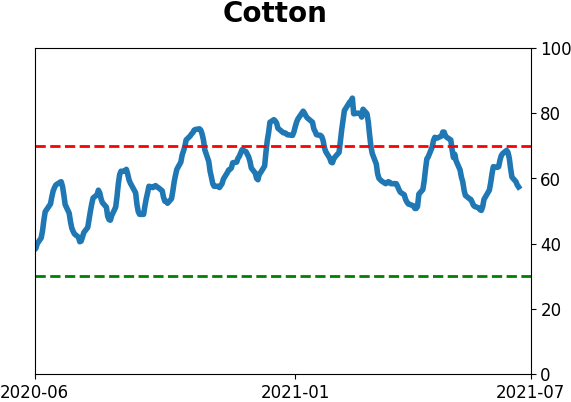
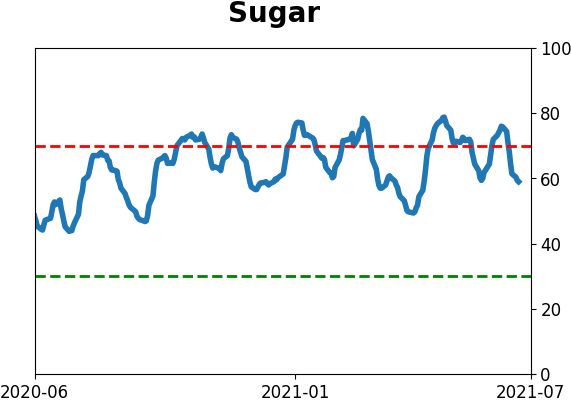
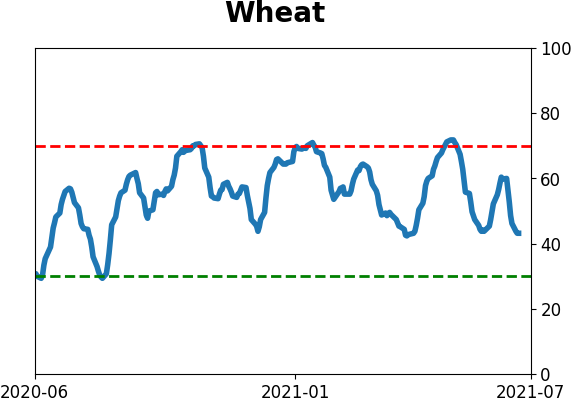
Agriculture
|
|
Research
BOTTOM LINE
There has been a surge of secondary issuance of shares by U.S. companies in recent months. Even more notable, much of that issuance has come from companies that have negative net income.
FORECAST / TIMEFRAME
None
|
A rising tide lifts all boats in life and markets. And the rising tide of money has lifted the fortunes of many companies that otherwise would have sunk long ago.
As the Wall Street Journal notes:
"The frenzied stock-buying activity that may have saved AMC Entertainment Holdings Inc. from bankruptcy is opening up a potential escape hatch for other troubled borrowers as well.
More companies with steep financial challenges are seeking a lifeline from equity markets, eager to capitalize on the surge of interest in stock buying from nonprofessional investors.
But equity markets now are more open to supporting troubled issuers, in large part because of risk-hungry individual investors eager to speculate, according to bankers and investors following the trend."
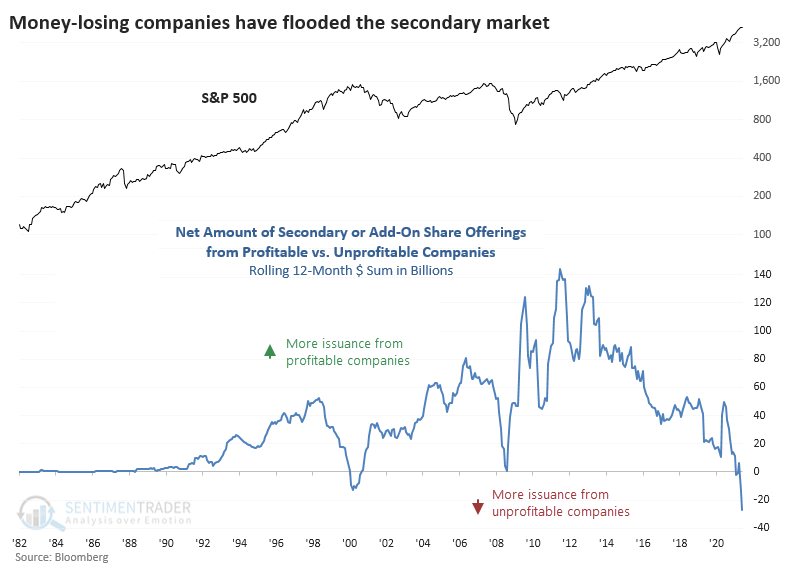
We can see this explicitly in the amount of money raised from secondary and add-on share issuance between money-making and money-losing corporations in the U.S. In March, we looked at the explosion in IPOs, which has been a concern for a while.
A TREND TOWARD MONEY-LOSERS
According to Bloomberg data, there have been 254 profitable companies issuing secondary or add-on shares over the past 12 months. But there have been 748 unprofitable companies doing the same, for a net differential of more than 500 companies.
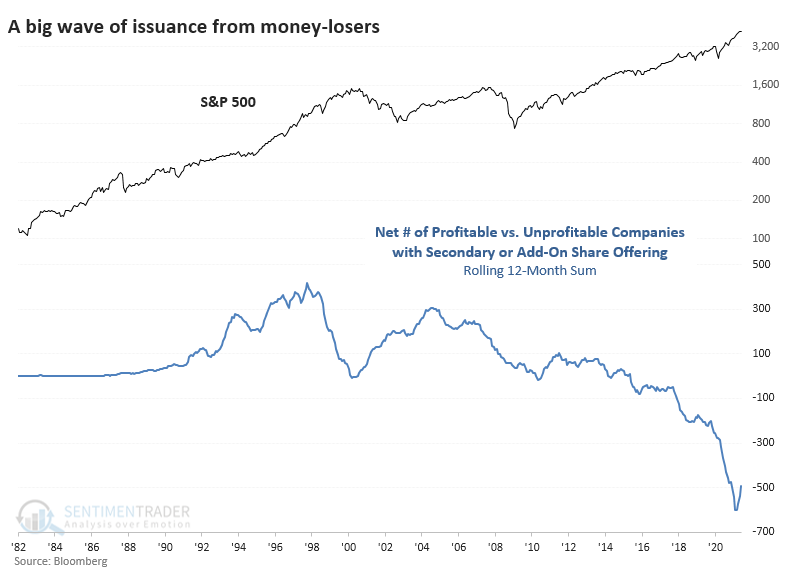
All of this issuance amounted to more than $27 billion worth of offerings that have been priced. That, too, is a record amount dating back 40 years.
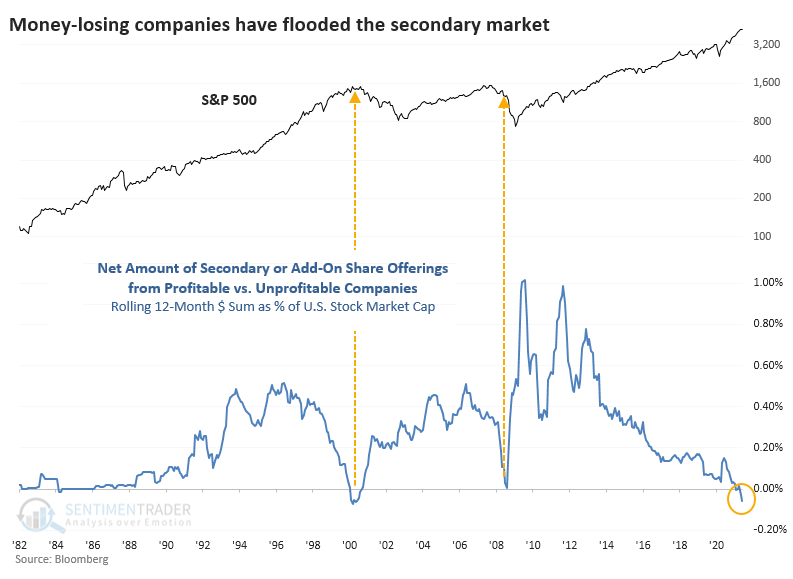
ONLY TWO HISTORICAL PRECEDENTS
As a percentage of the U.S. equity market, this is about 0.1%, which is nothing more than a blip. That's not really the point. It's not about the amount of issuance; it's about a market environment that allows this to happen.
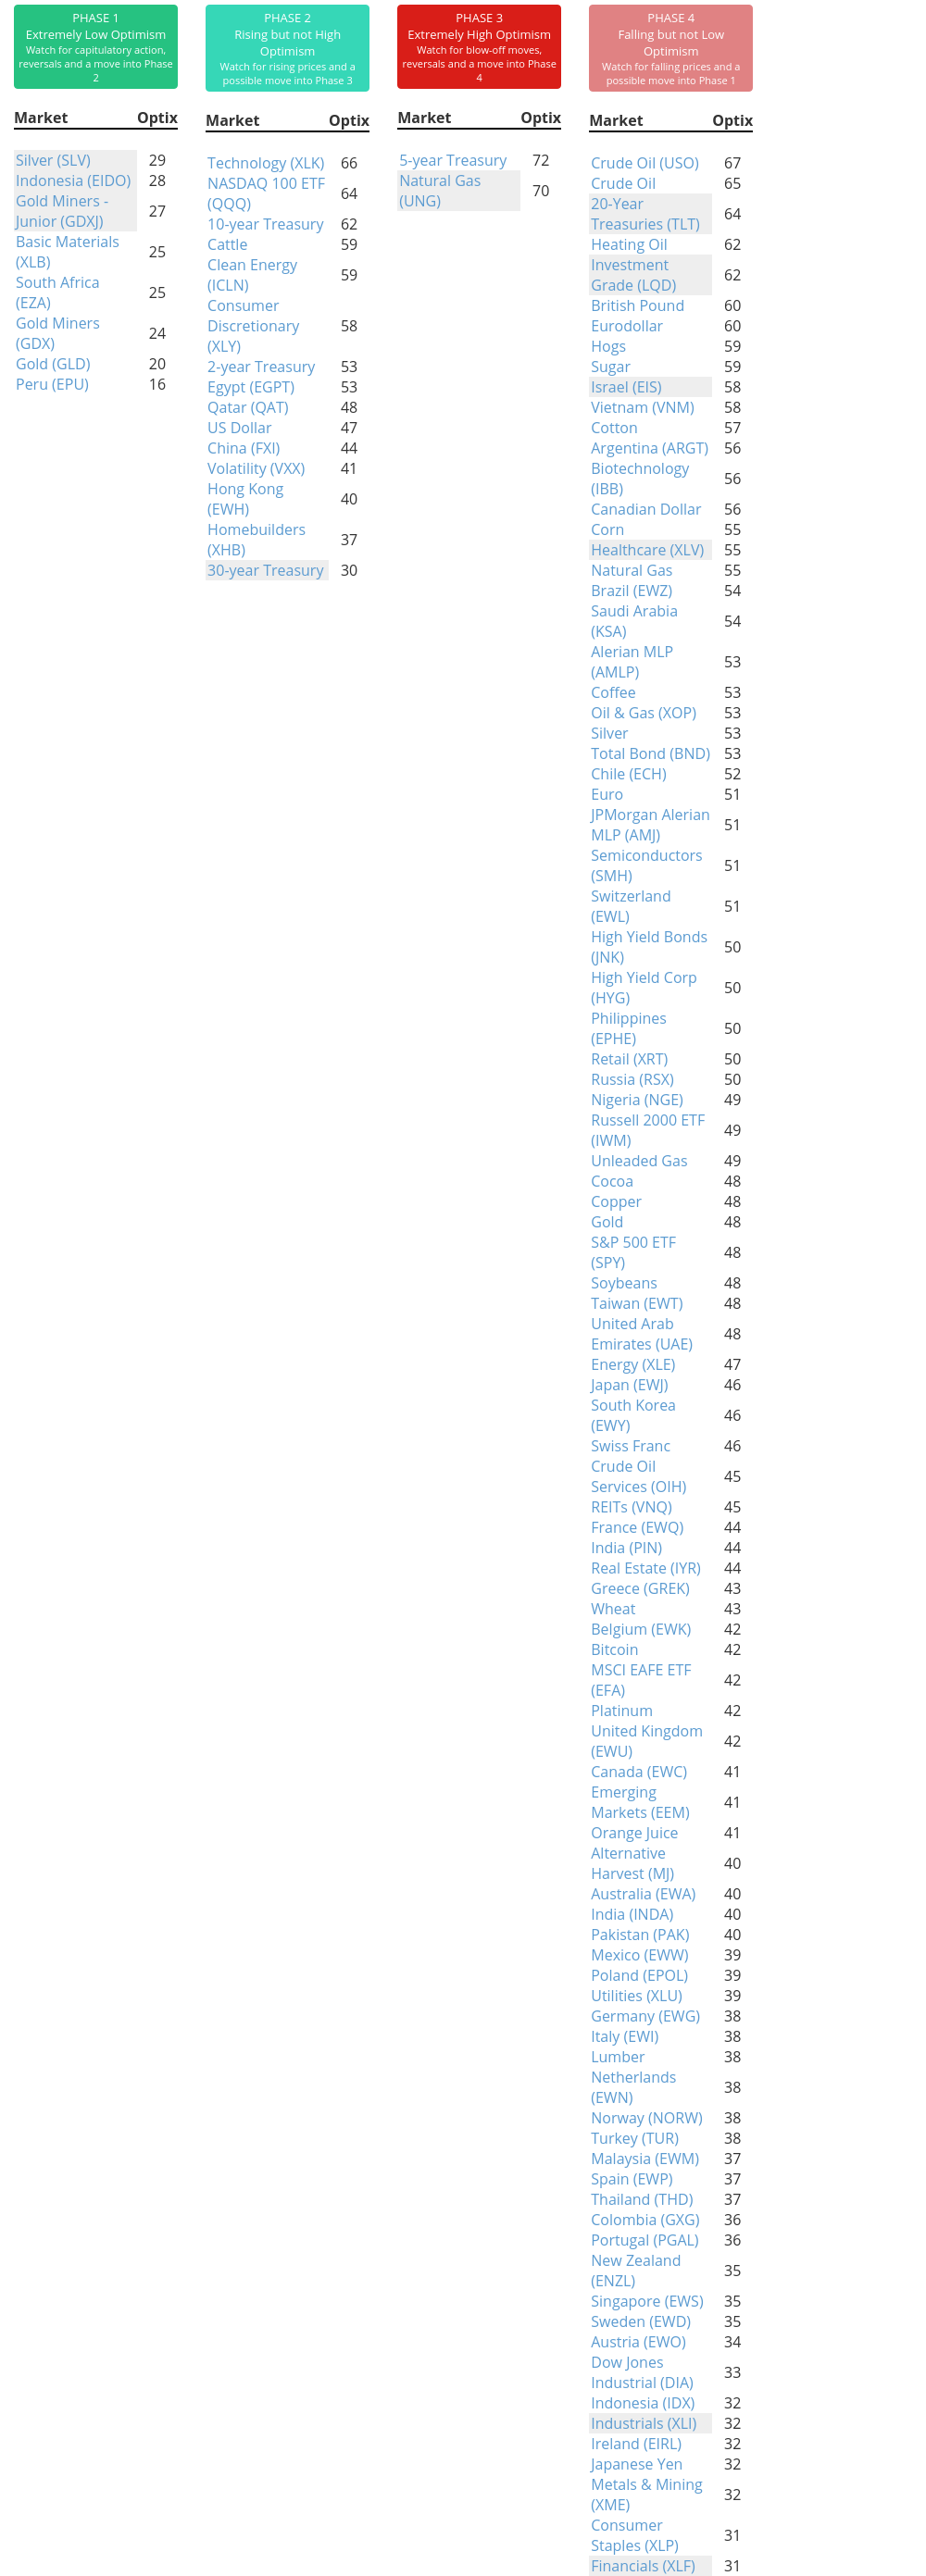
We've been in the Enthusiasm phase of a Typical Sentiment Cycle for more than six months now. The phase usually exhibits all of these factors.
- High optimism
- Easy credit (too easy, with loose terms)
- A rush of initial and secondary offerings
- Risky stocks outperforming
- Stretched valuations
Optimism has ebbed from its peak in February, and some risky stocks have been clobbered. However, the other factors are still in play. We need to be on the lookout for internal divergences and warnings among technical indicators during and after these phases. So far, those have been spotty. We'll have to watch if conditions like we saw earlier this week continue.
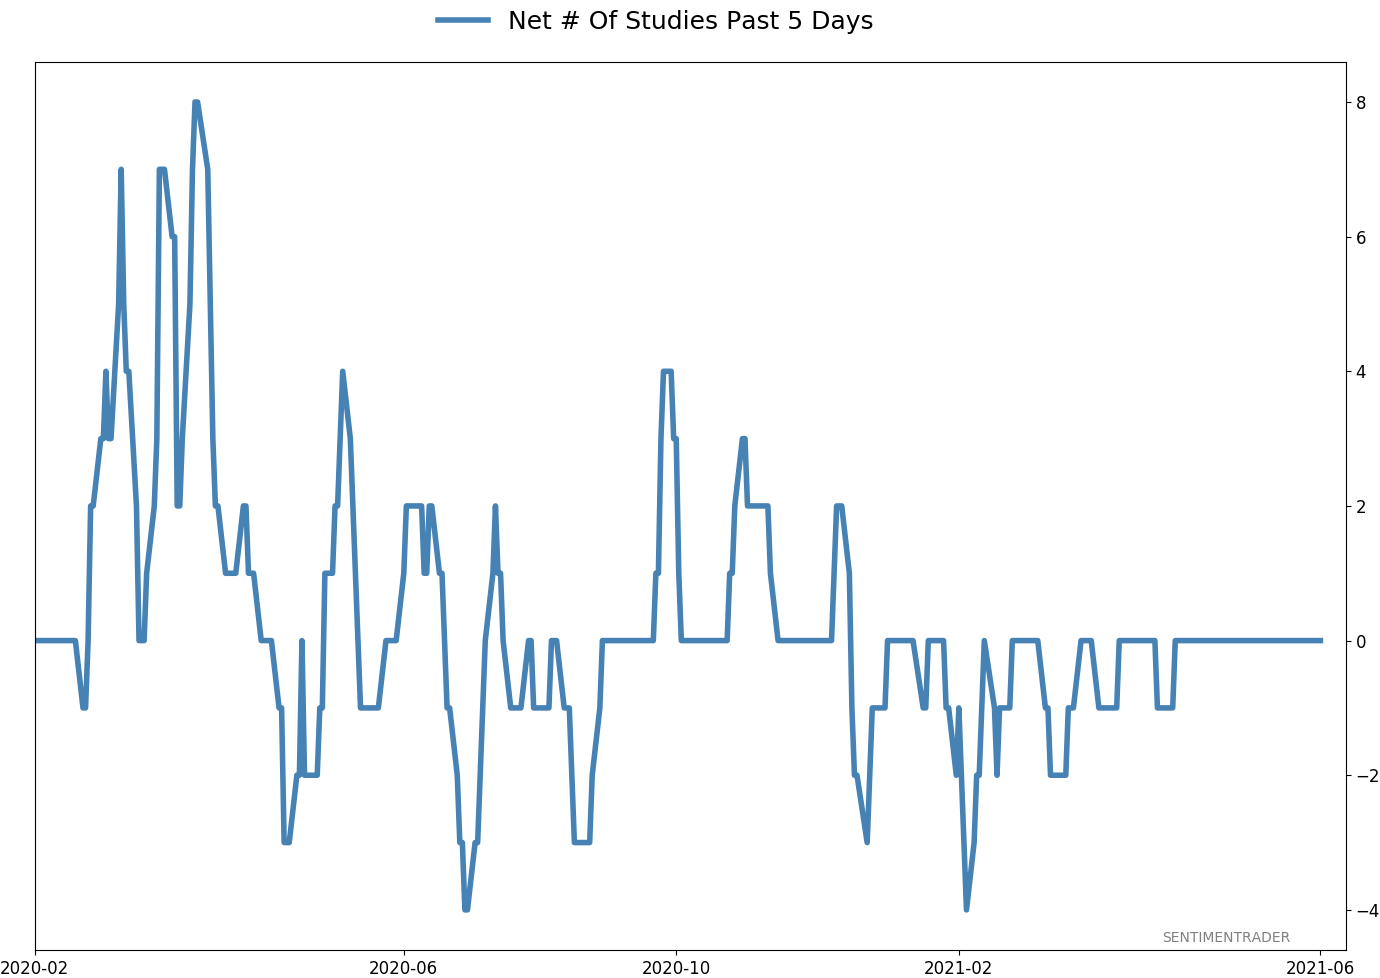
Active Studies
| Time Frame | Bullish | Bearish | | Short-Term | 0 | 1 | | Medium-Term | 2 | 2 | | Long-Term | 8 | 5 |
|
Indicators at Extremes
Portfolio
| Position | Description | Weight % | Added / Reduced | Date | | Stocks | RSP | 4.1 | Added 4.1% | 2021-05-19 | | Bonds | 23.9% BND, 6.9% SCHP | 30.7 | Reduced 7.1% | 2021-05-19 | | Commodities | GCC | 2.6 | Reduced 2.1%
| 2020-09-04 | | Precious Metals | GDX | 5.6 | Reduced 4.2% | 2021-05-19 | | Special Situations | 4.3% XLE, 2.2% PSCE | 7.6 | Reduced 5.6% | 2021-04-22 | | Cash | | 49.4 | | |
|
Updates (Changes made today are underlined)
Much of our momentum and trend work has remained positive for several months, with some scattered exceptions. Almost all sentiment-related work has shown a poor risk/reward ratio for stocks, especially as speculation drove to record highs in exuberance in February. Much of that has worn off, and most of our models are back toward neutral levels. There isn't much to be excited about here. The same goes for bonds and even gold. Gold has been performing well lately and is back above long-term trend lines. The issue is that it has a poor record of holding onto gains when attempting a long-term trend change like this, so we'll take a wait-and-see approach. RETURN YTD: 9.5% 2020: 8.1%, 2019: 12.6%, 2018: 0.6%, 2017: 3.8%, 2016: 17.1%, 2015: 9.2%, 2014: 14.5%, 2013: 2.2%, 2012: 10.8%, 2011: 16.5%, 2010: 15.3%, 2009: 23.9%, 2008: 16.2%, 2007: 7.8%
|
|
Phase Table
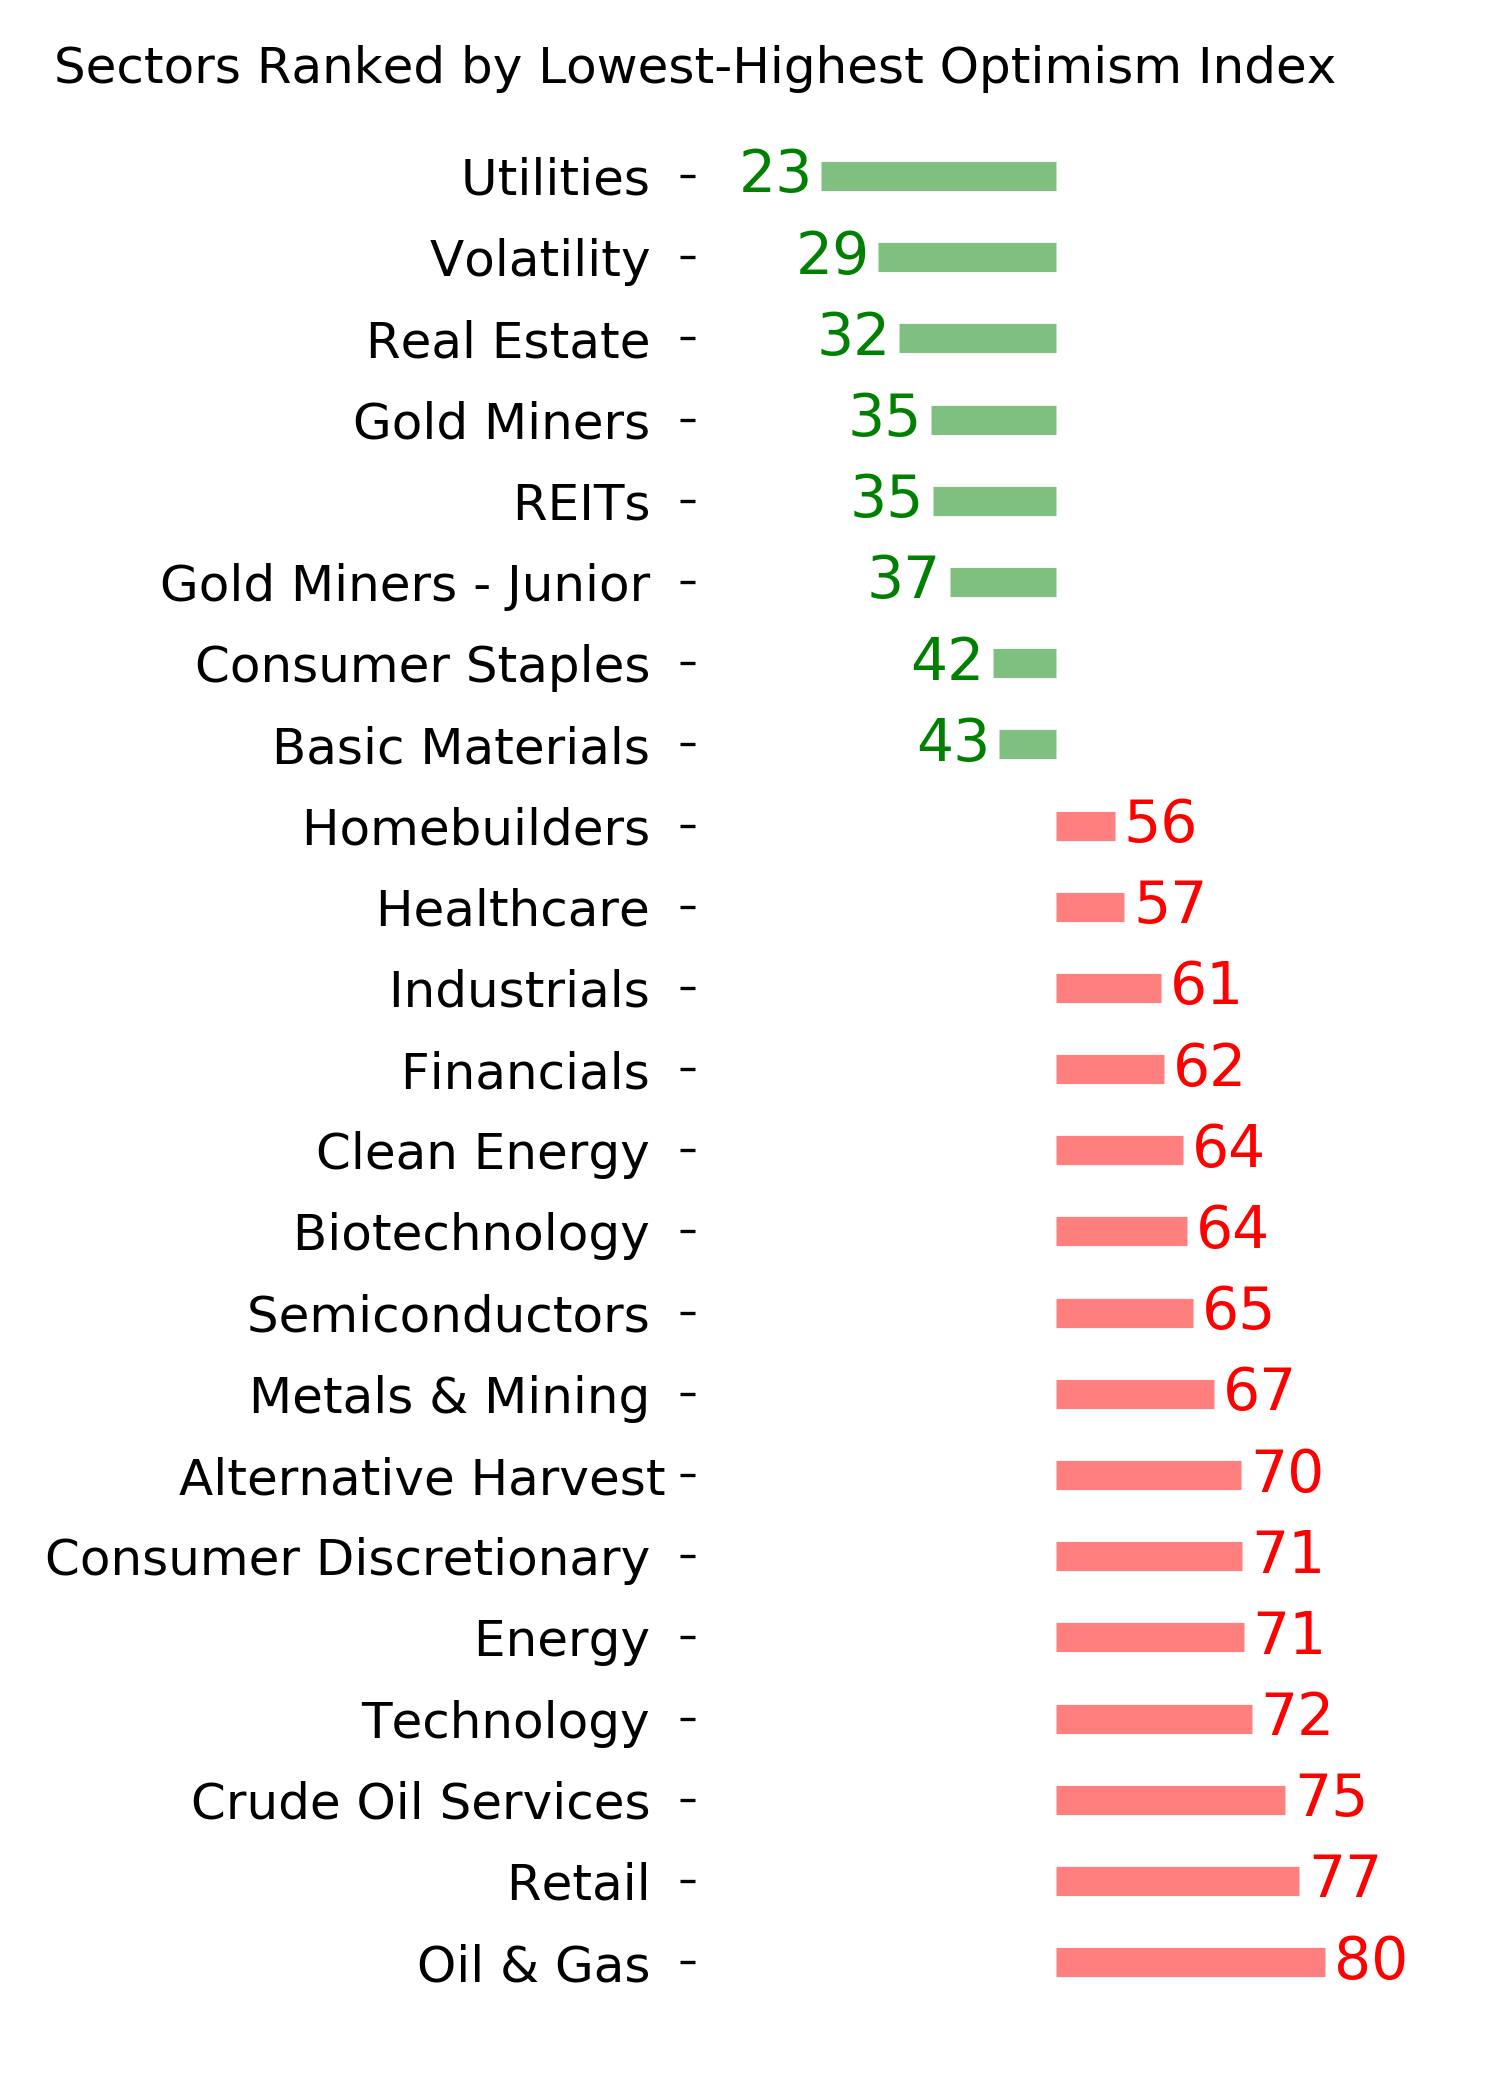
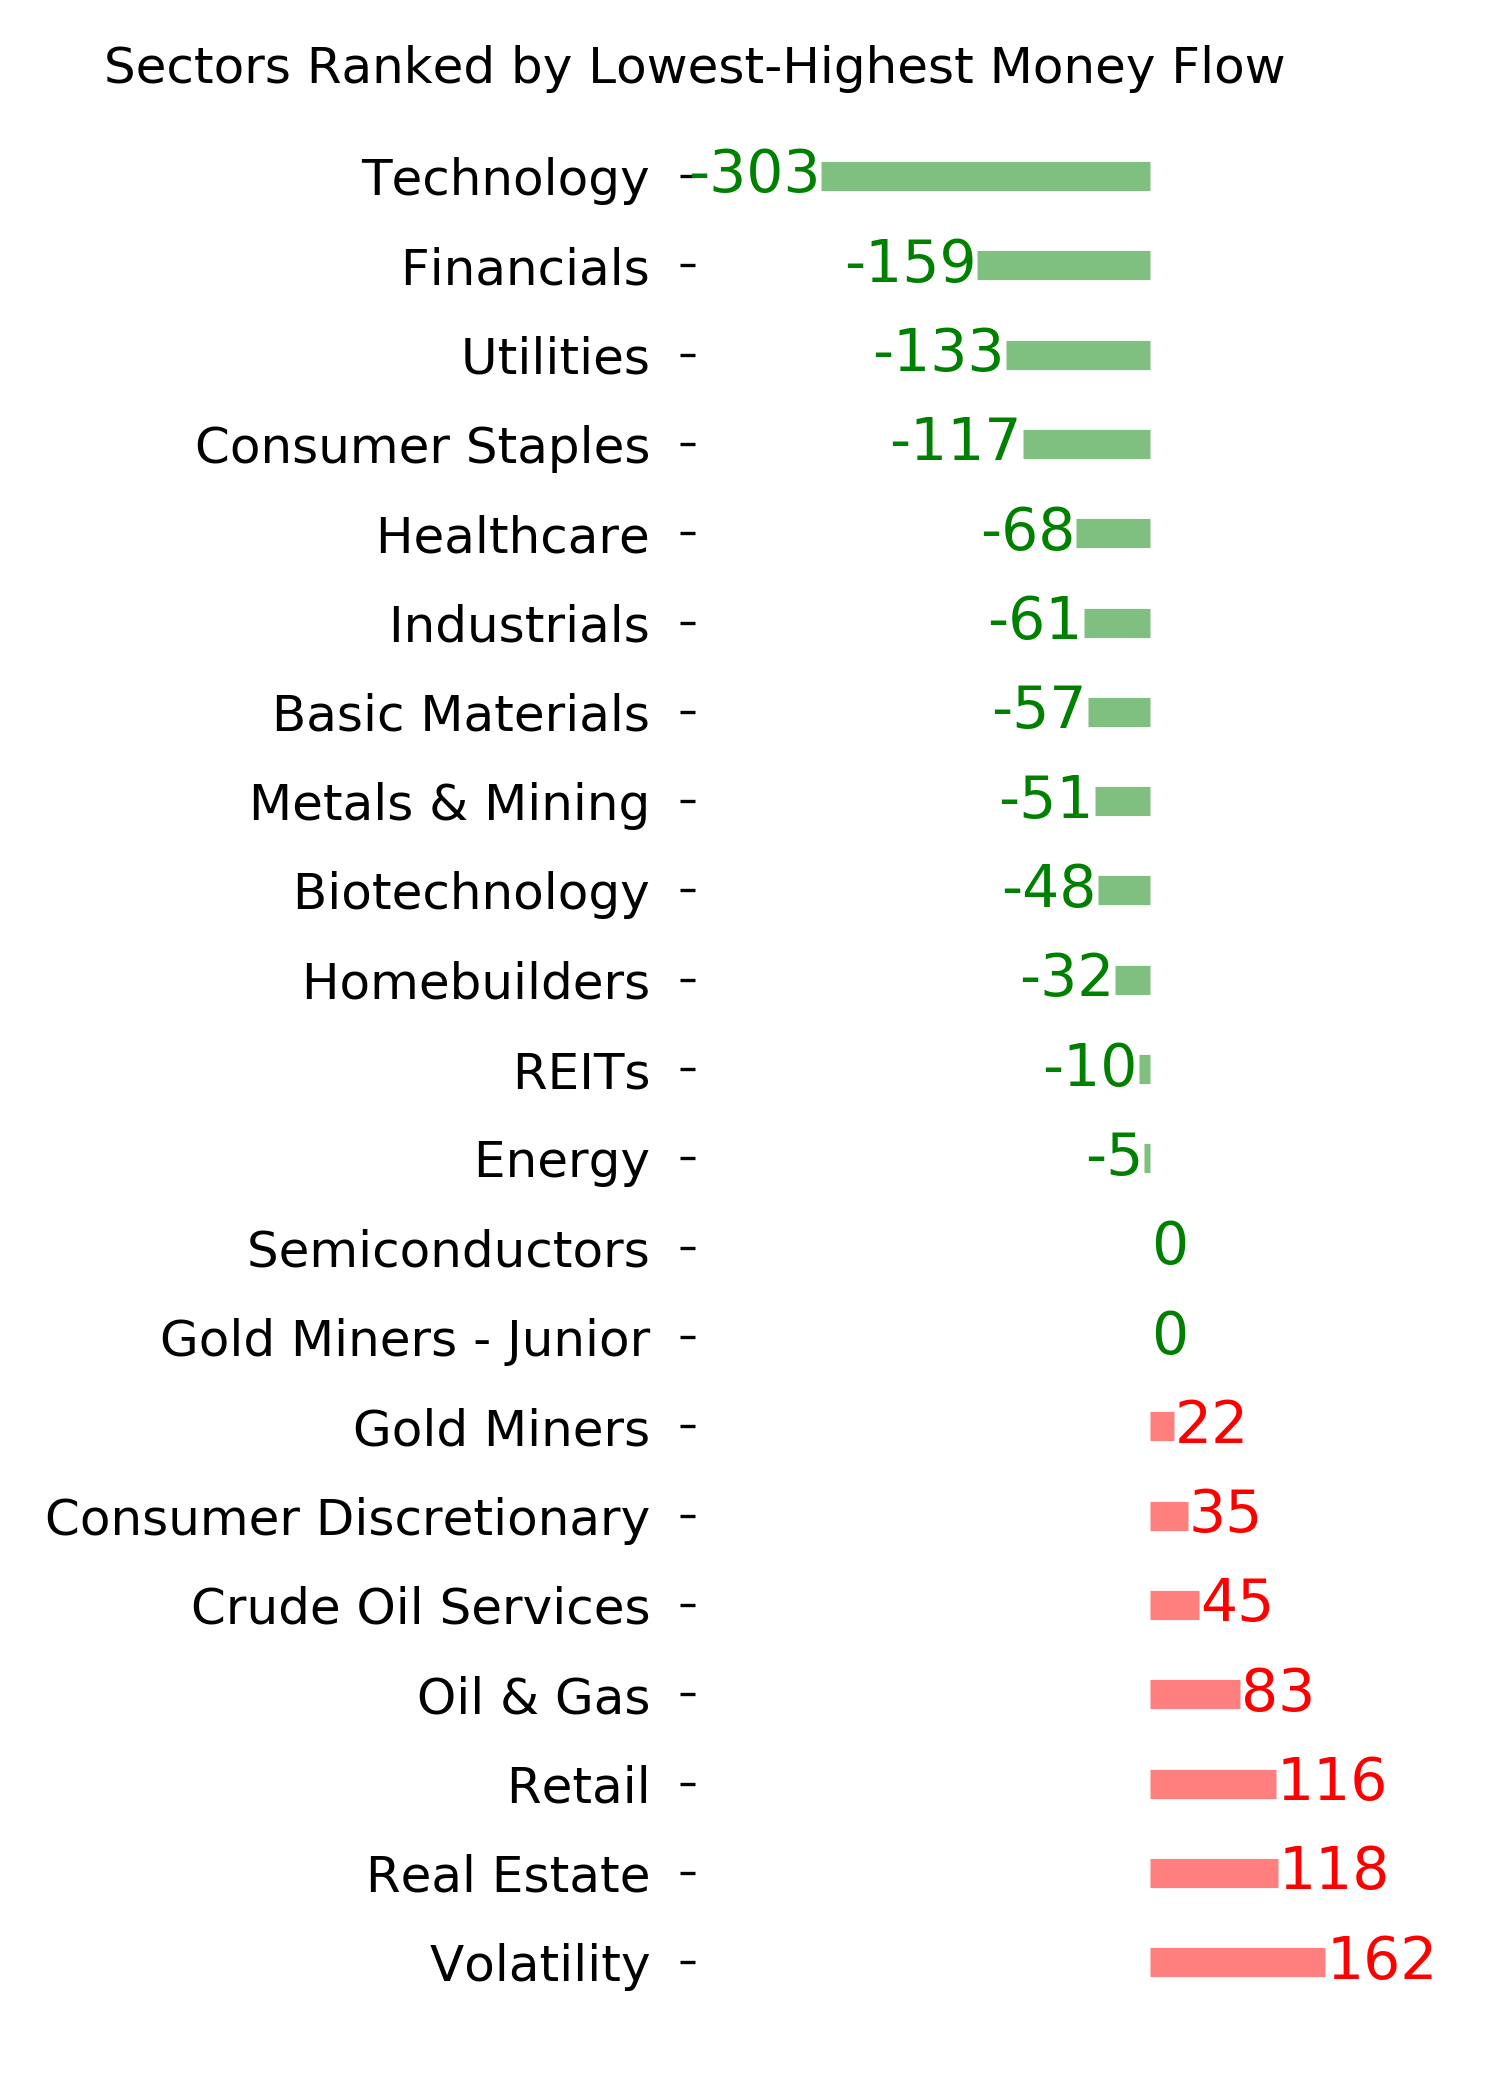
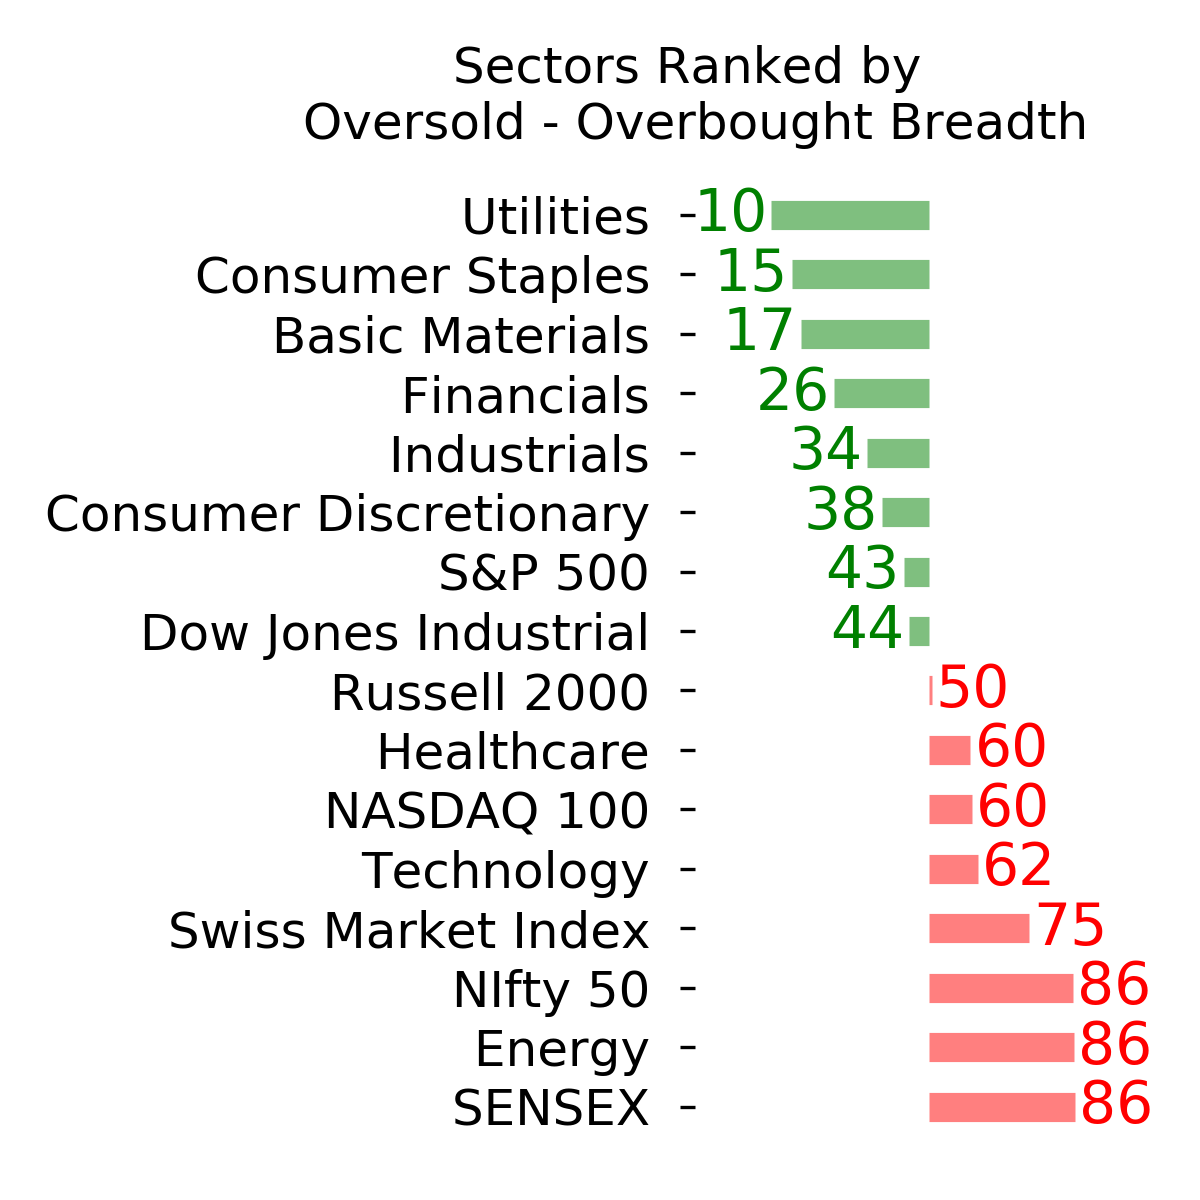
Ranks
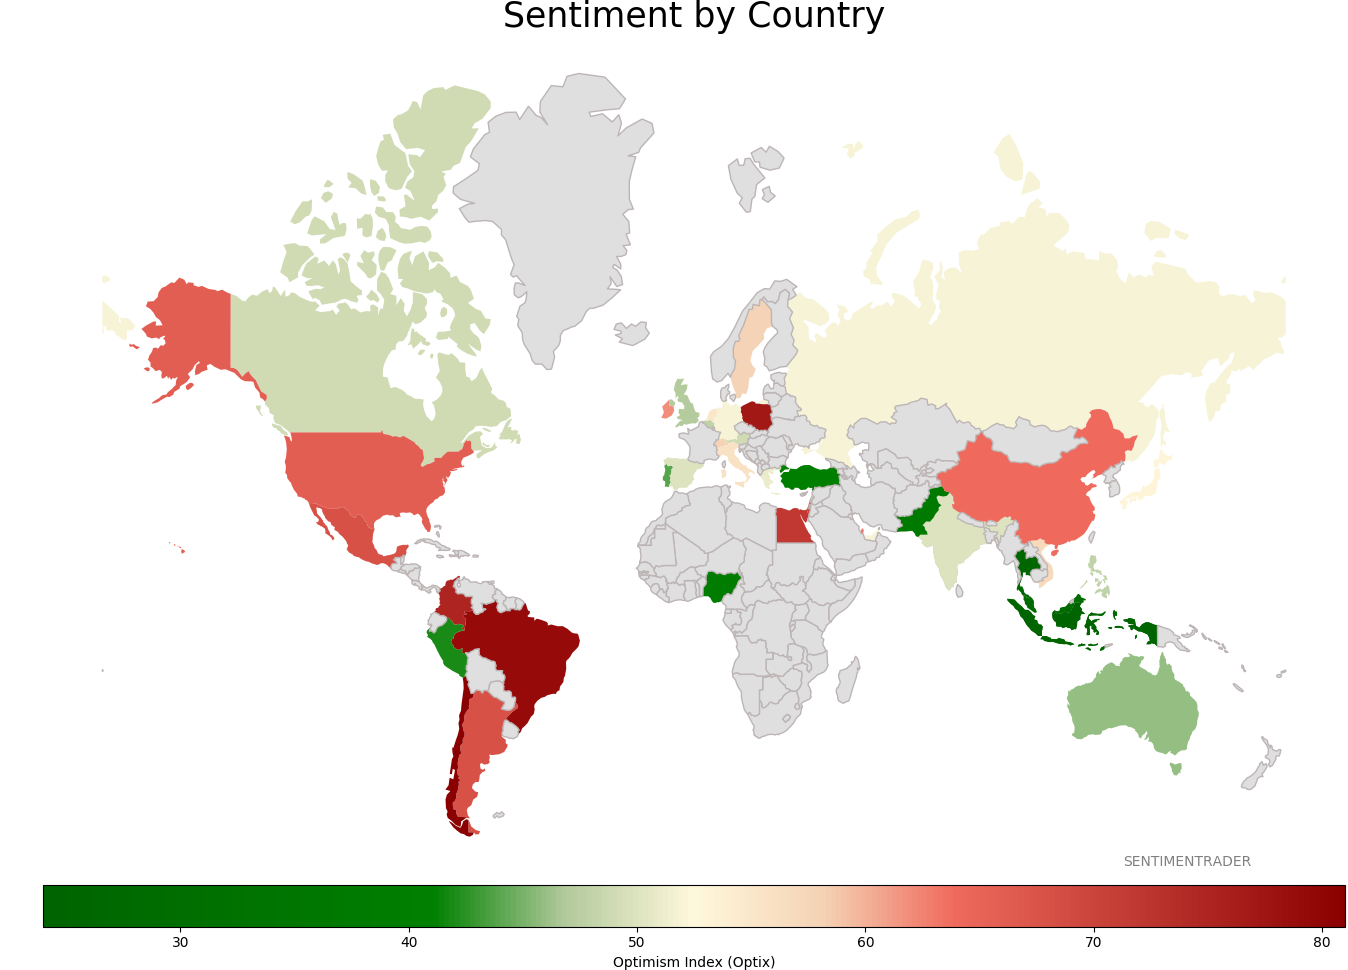
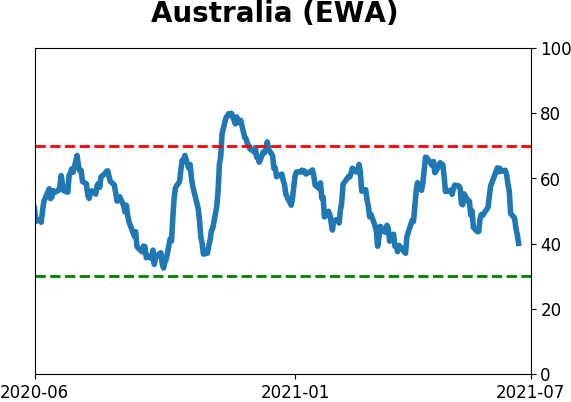
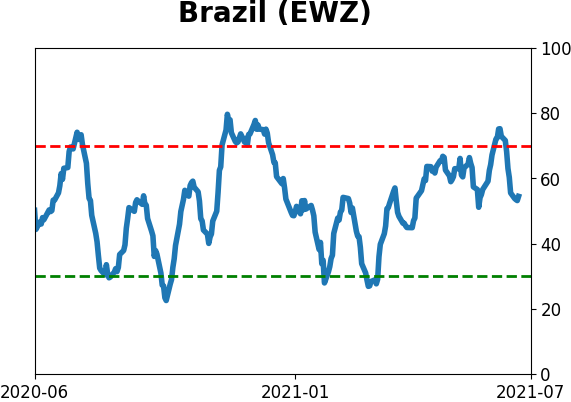
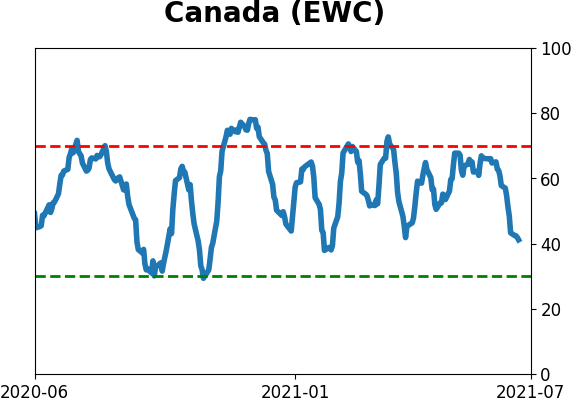
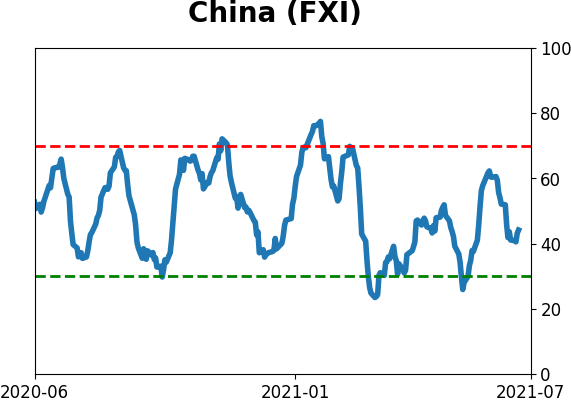
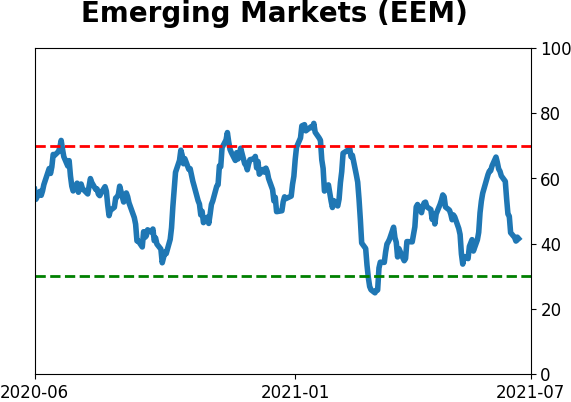
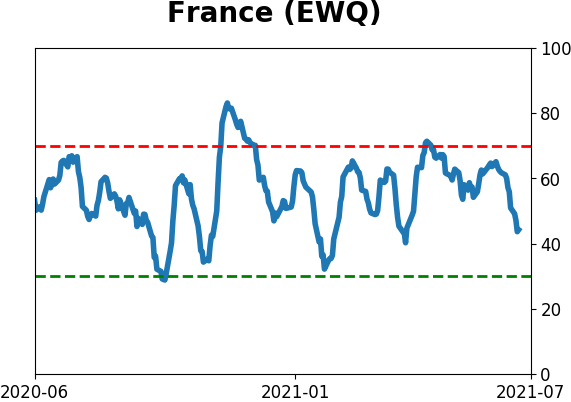
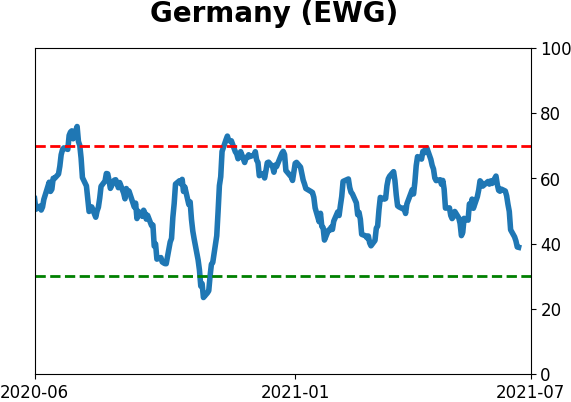
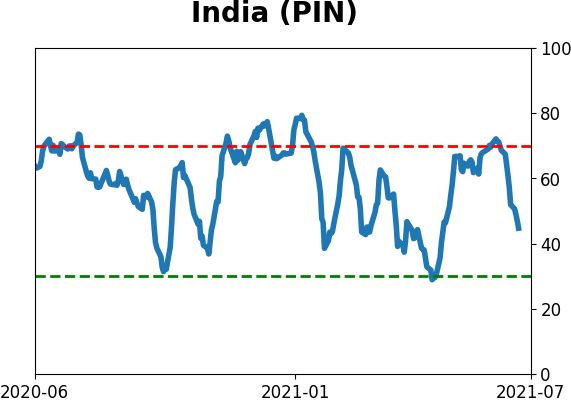
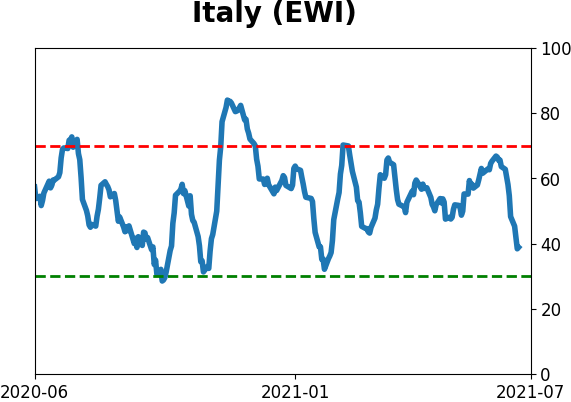
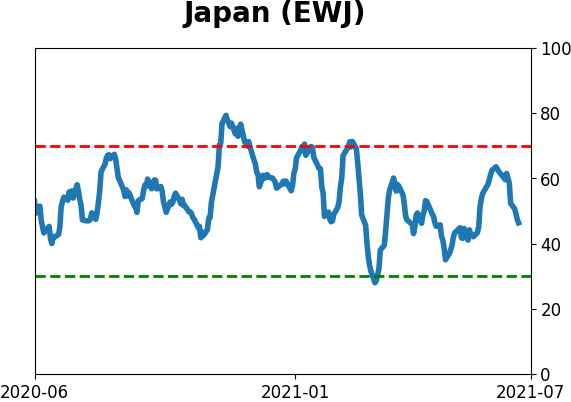
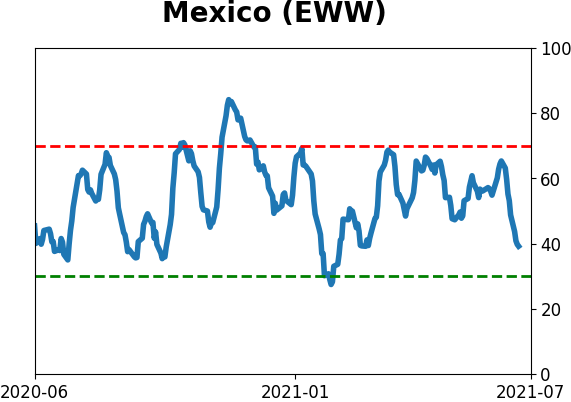
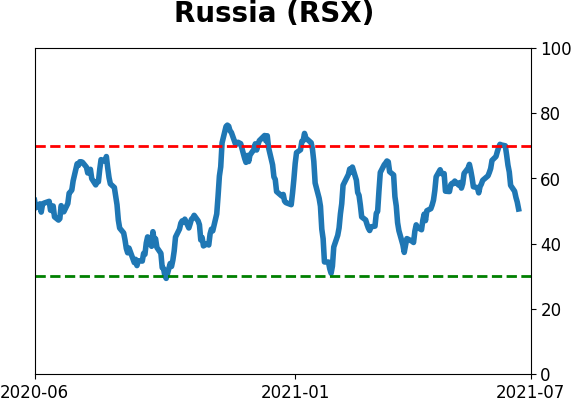
Sentiment Around The World
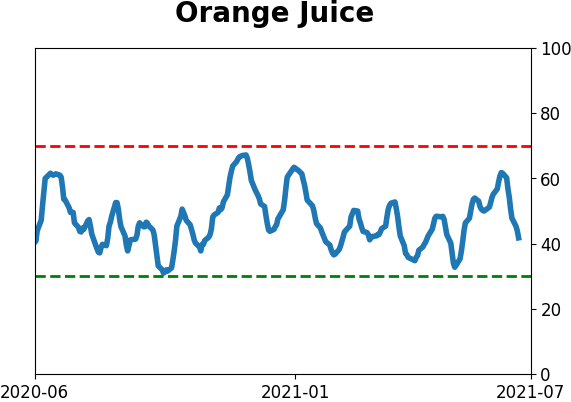
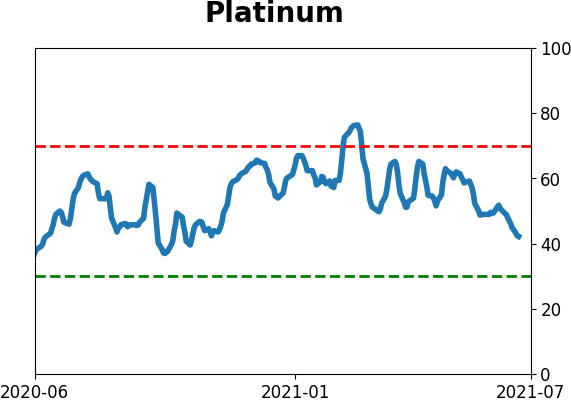
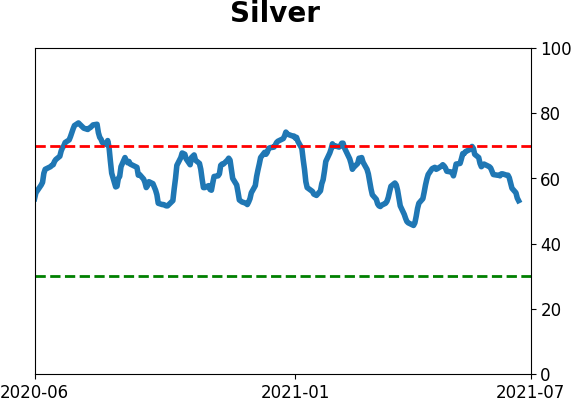
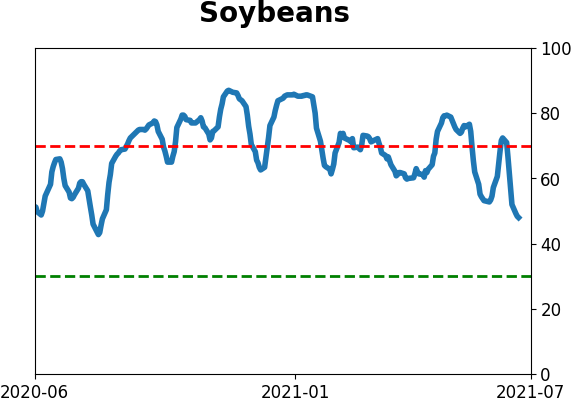
Optimism Index Thumbnails
|
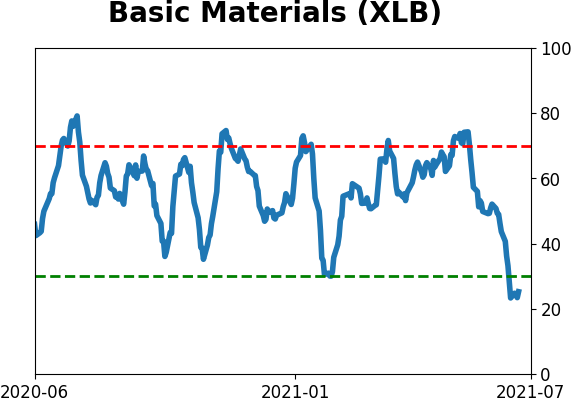
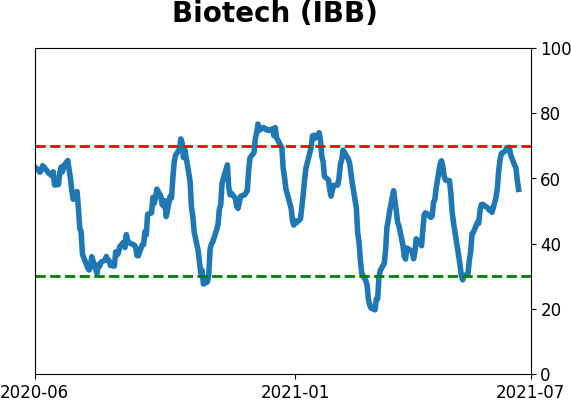
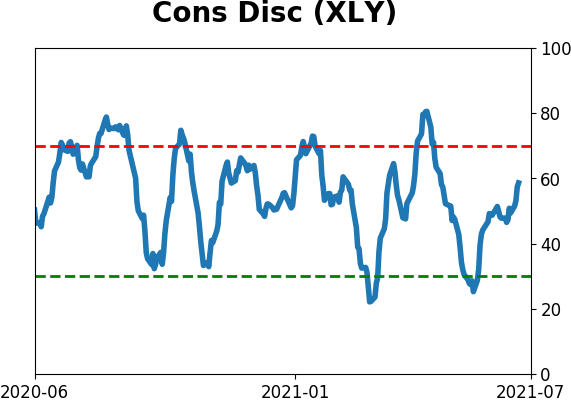
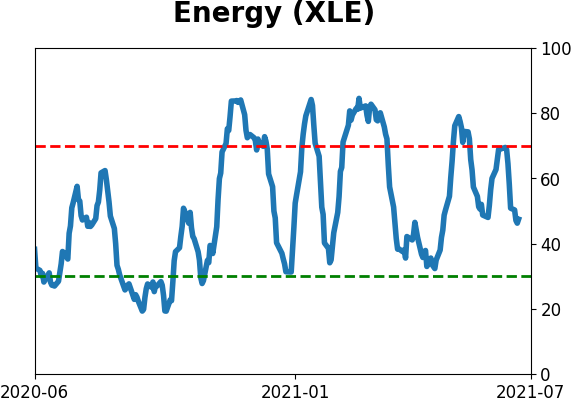
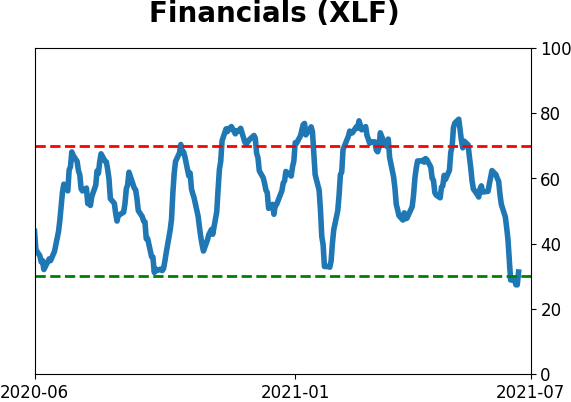
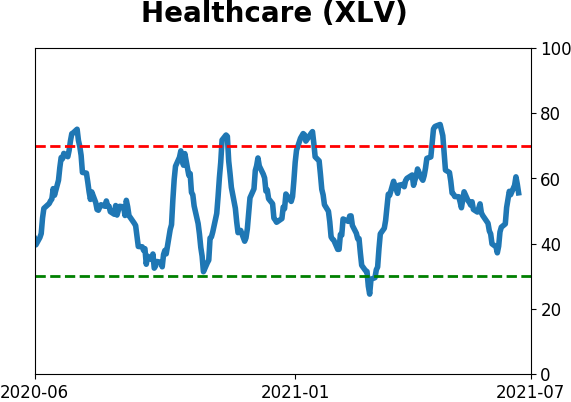
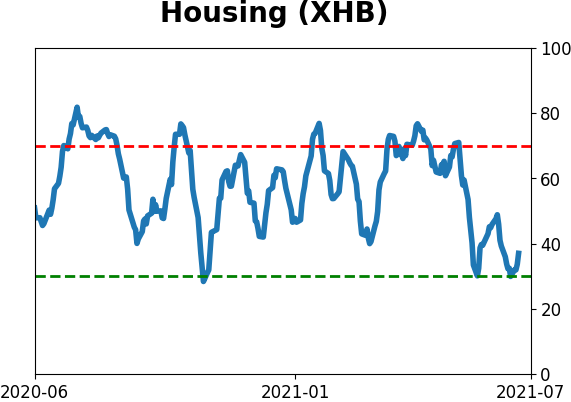
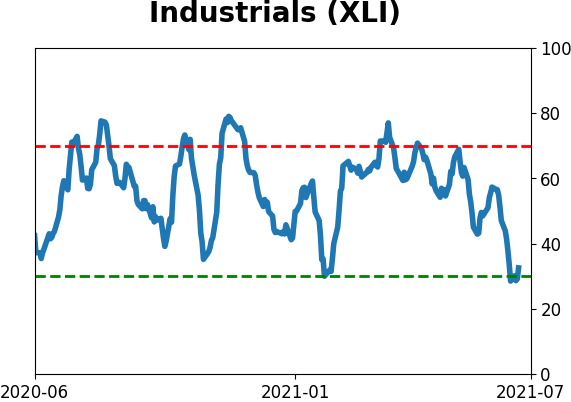
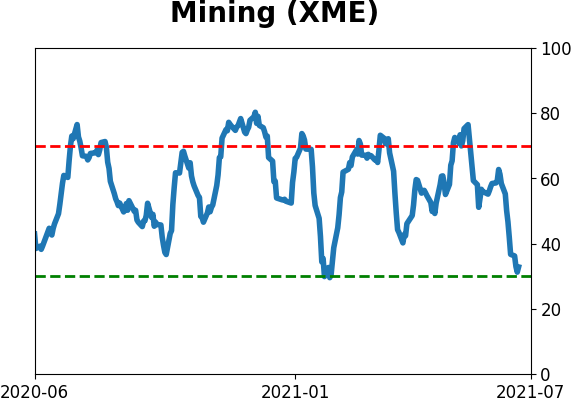
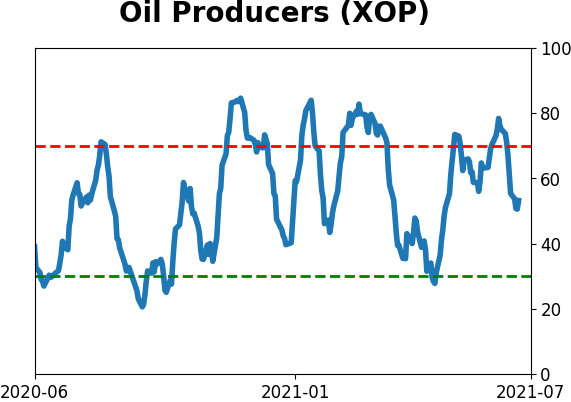
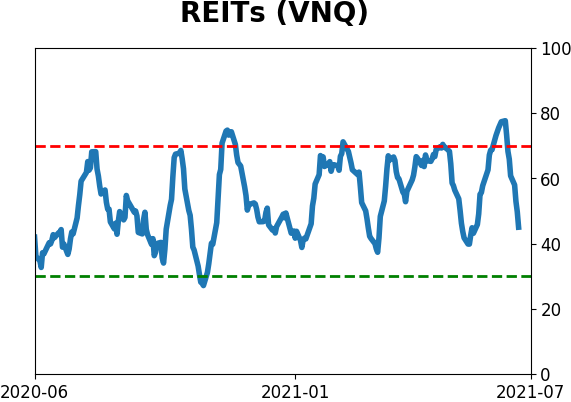
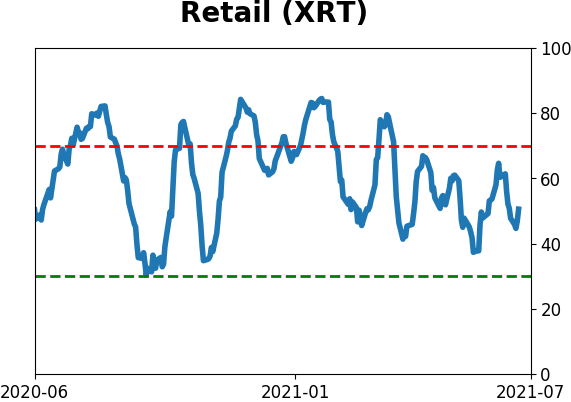
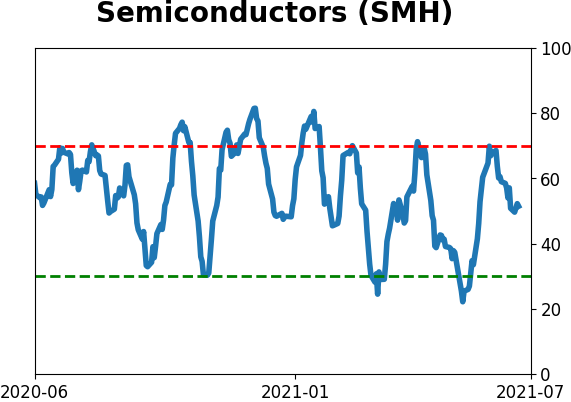
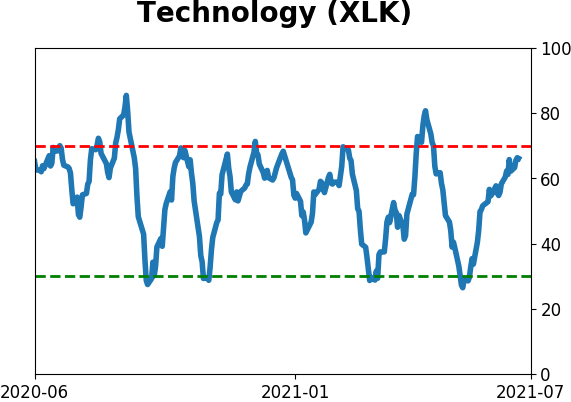
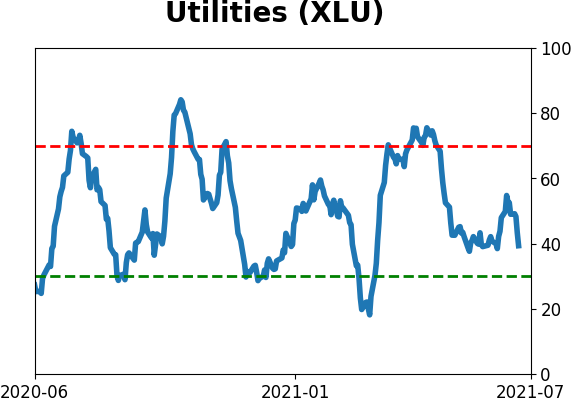
Sector ETF's - 10-Day Moving Average
|
|
|
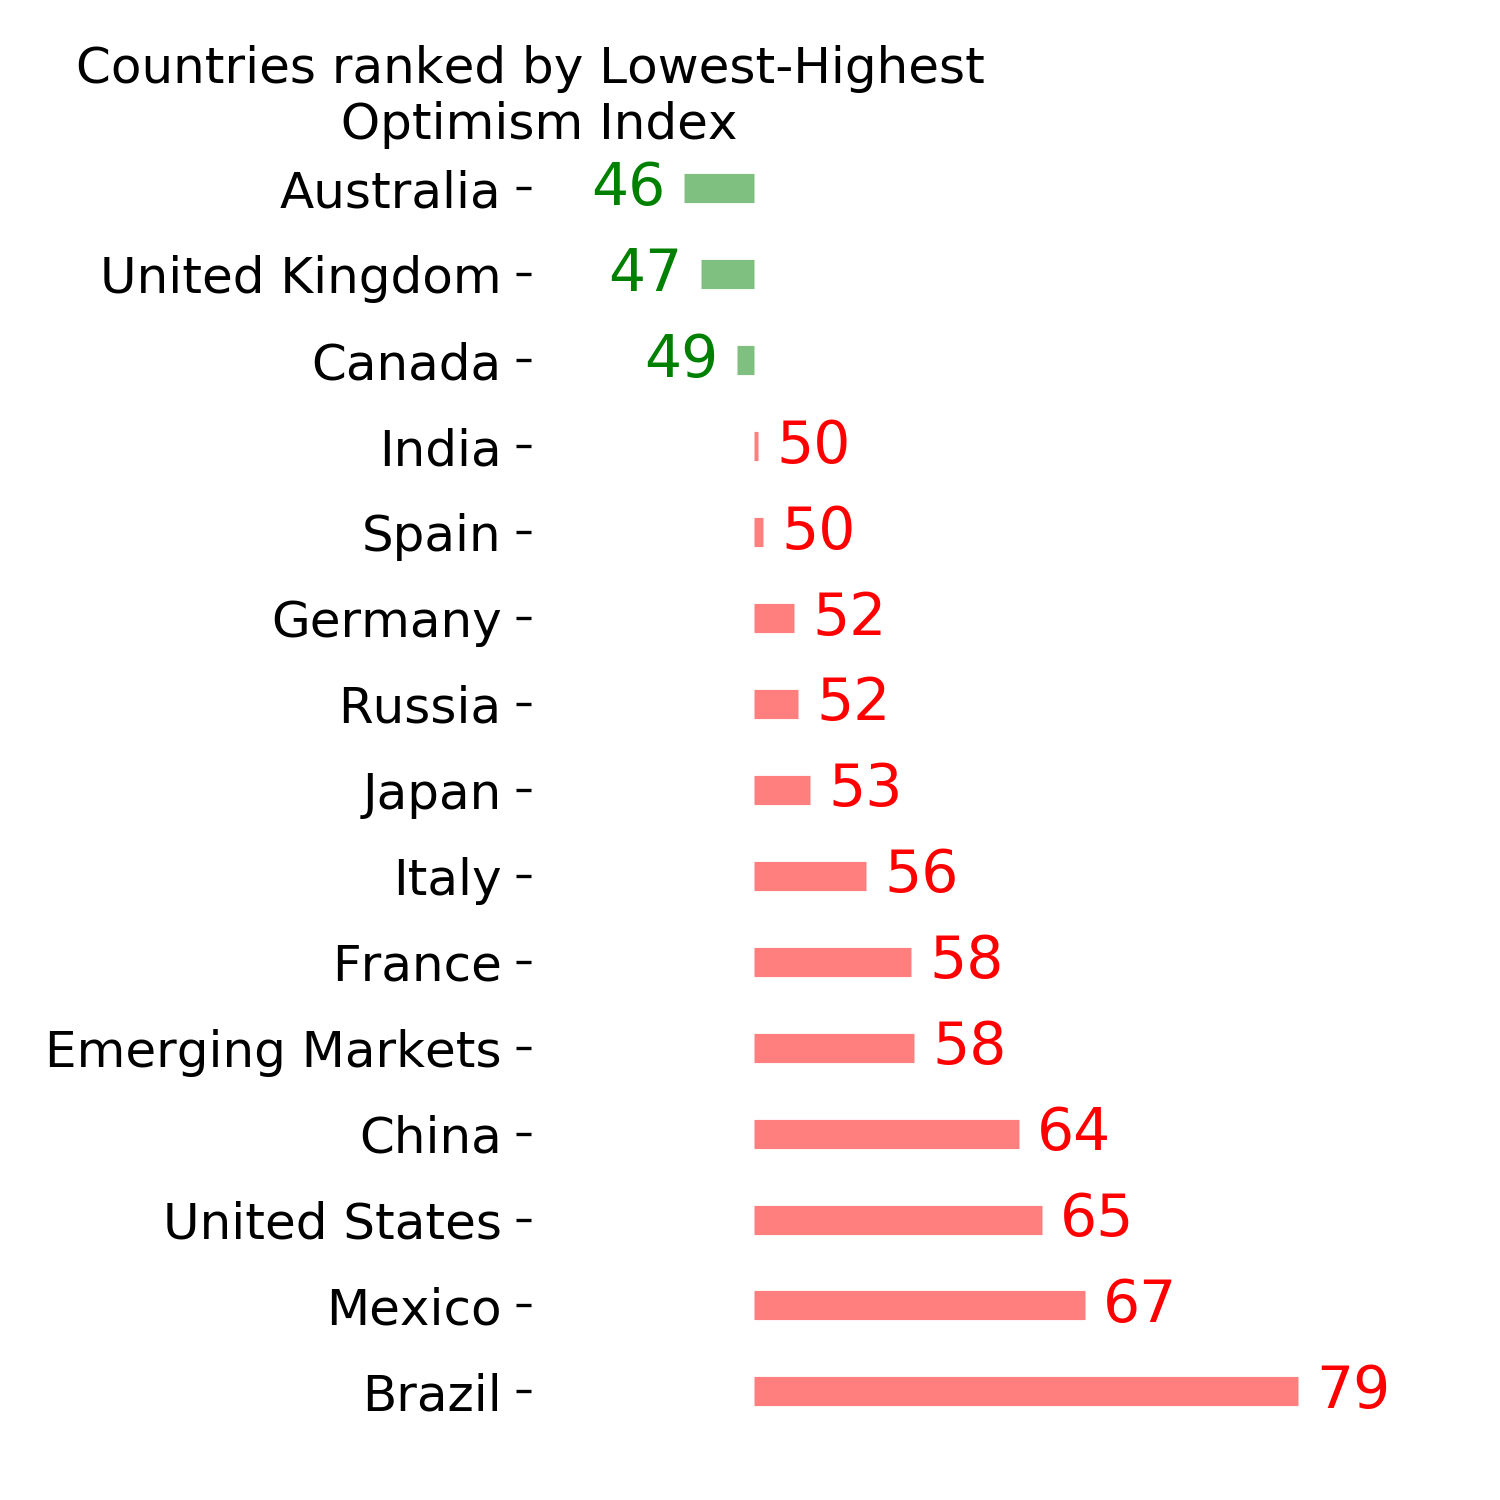
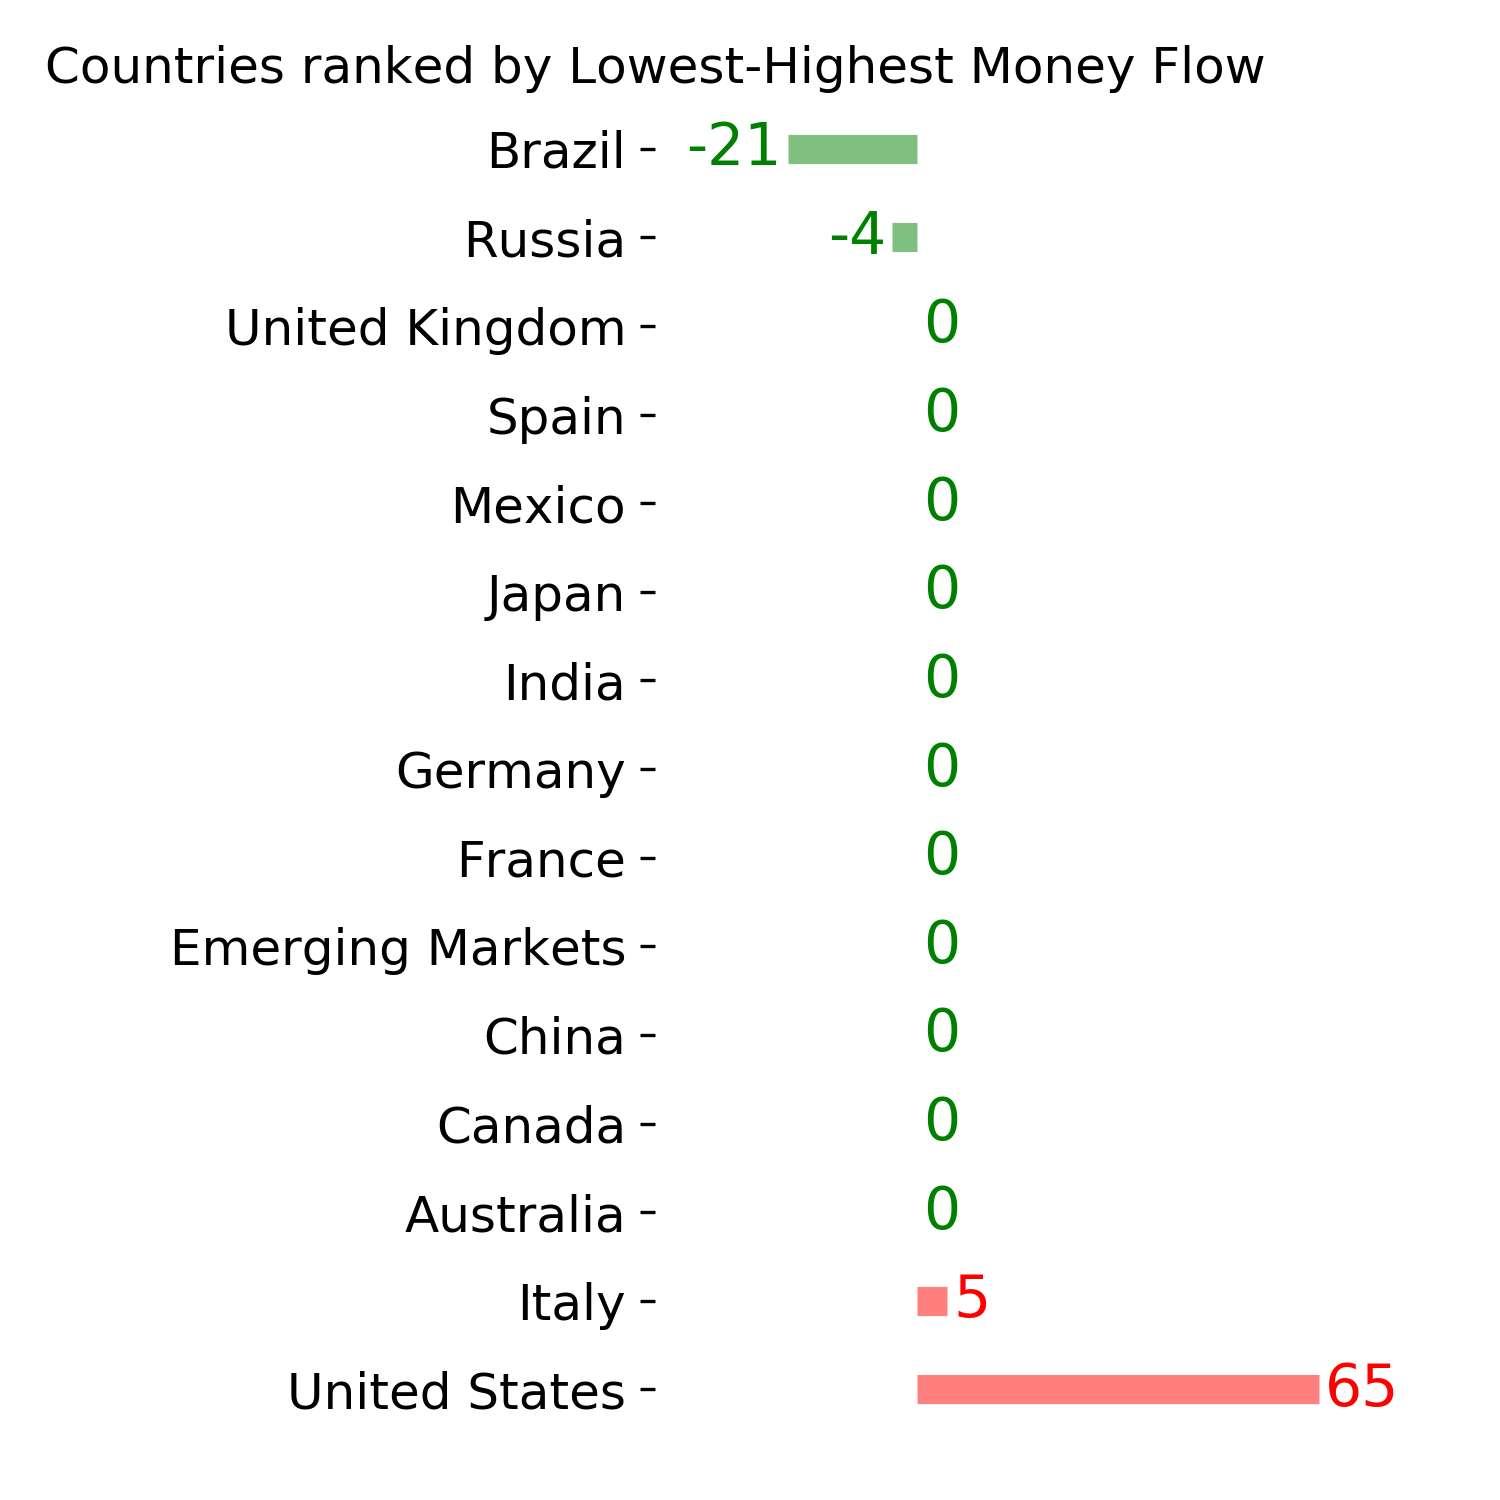
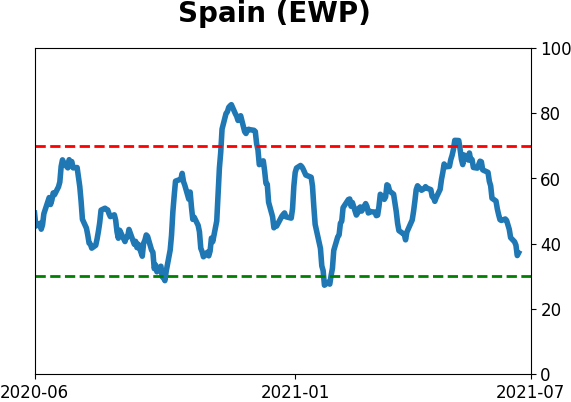
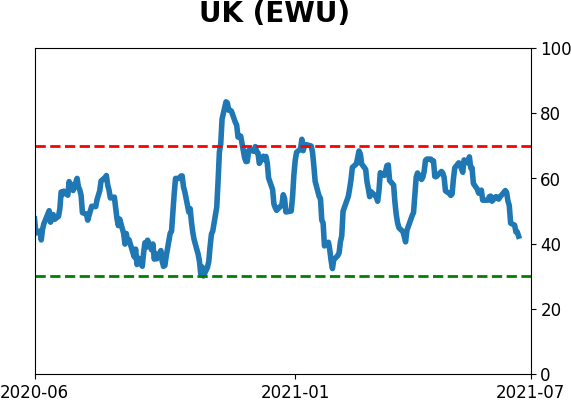
Country ETF's - 10-Day Moving Average
|
|
|
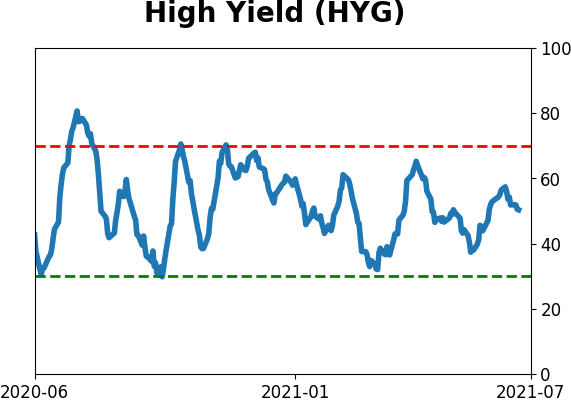
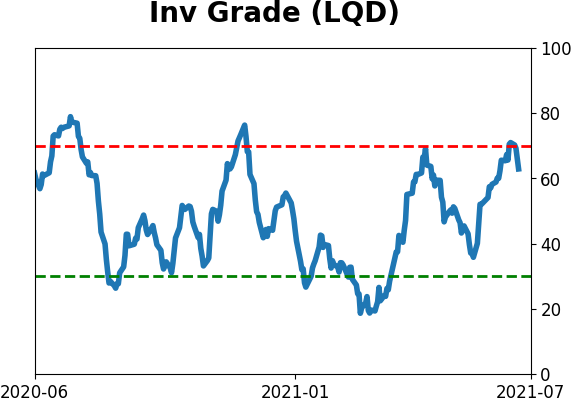
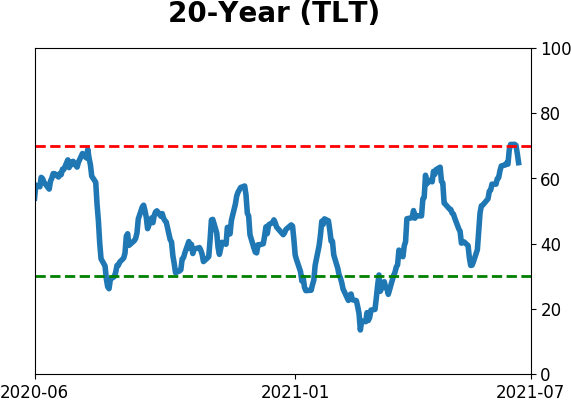
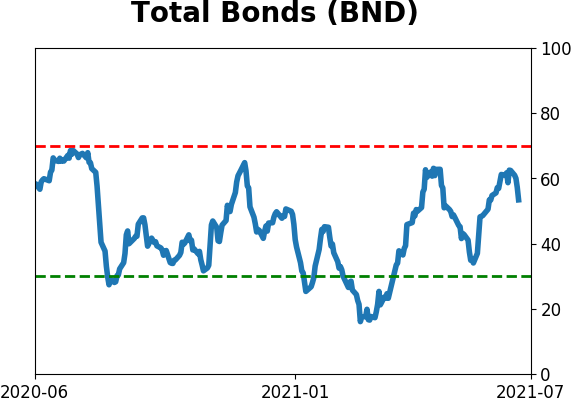
Bond ETF's - 10-Day Moving Average
|
|
|
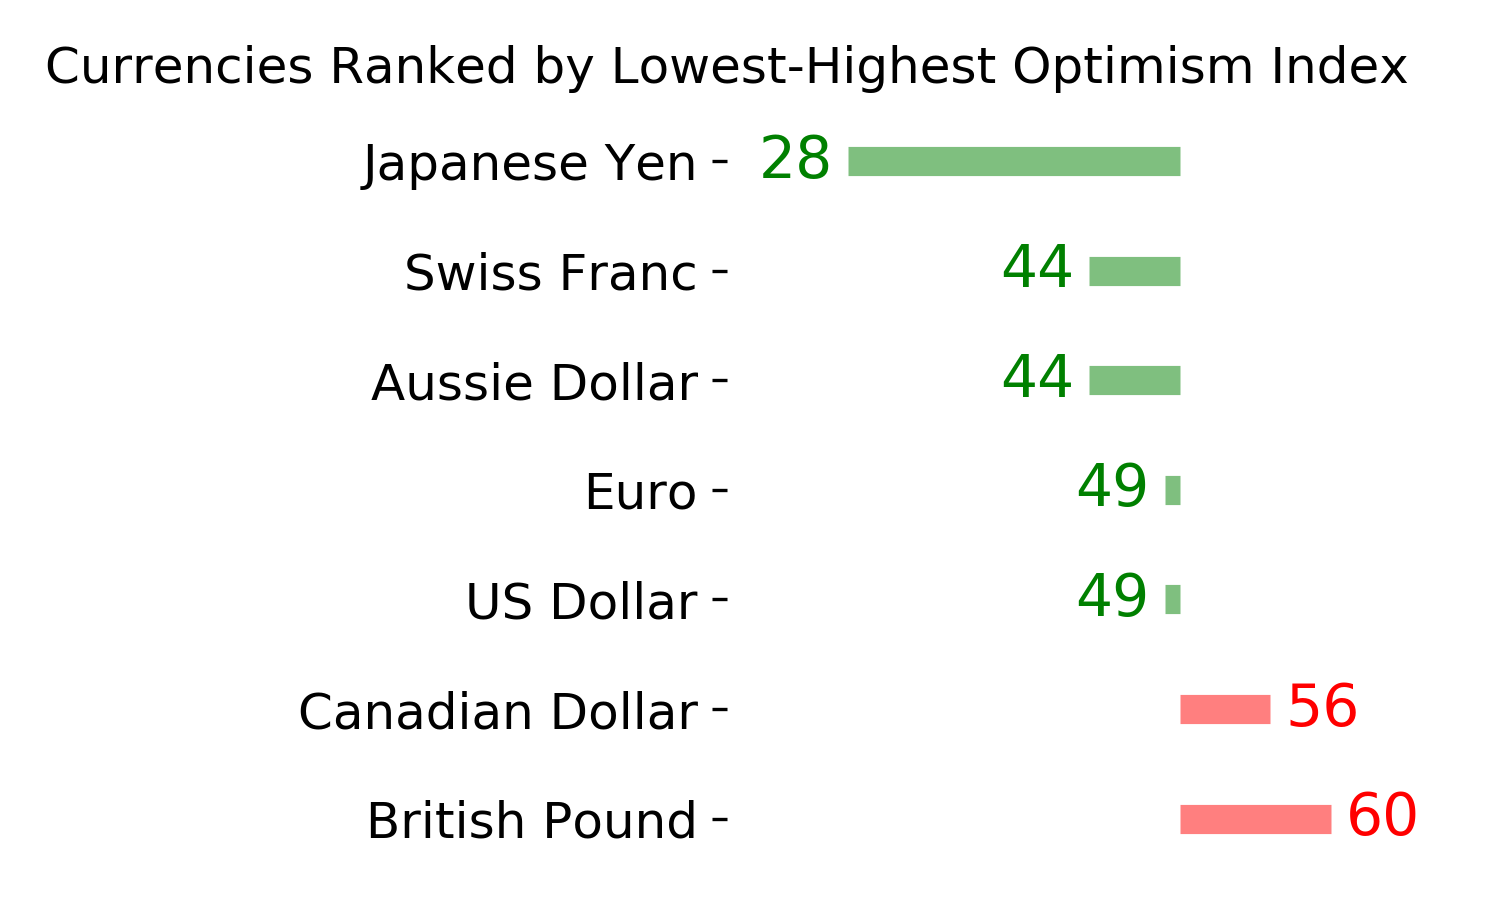
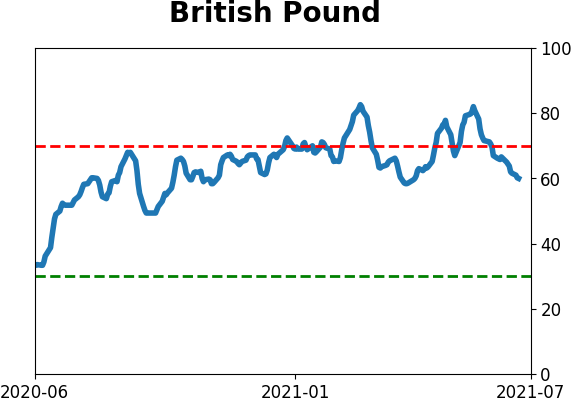
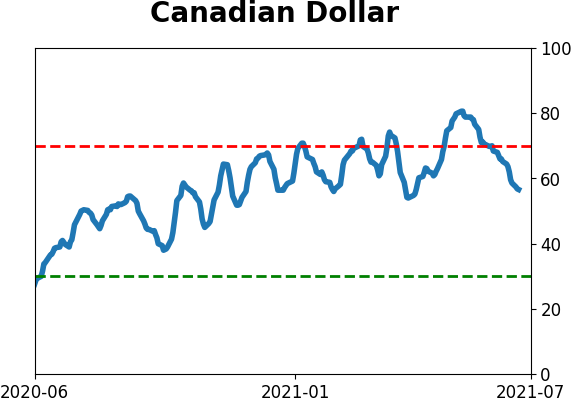
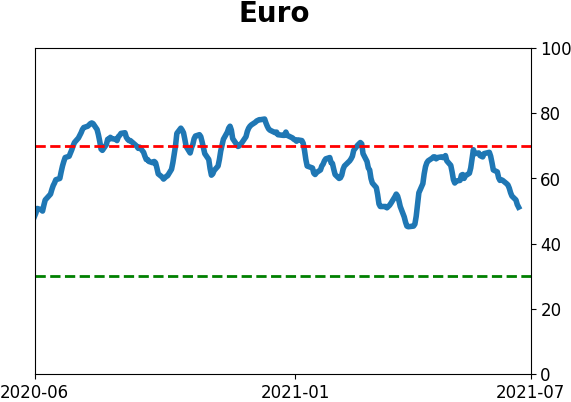
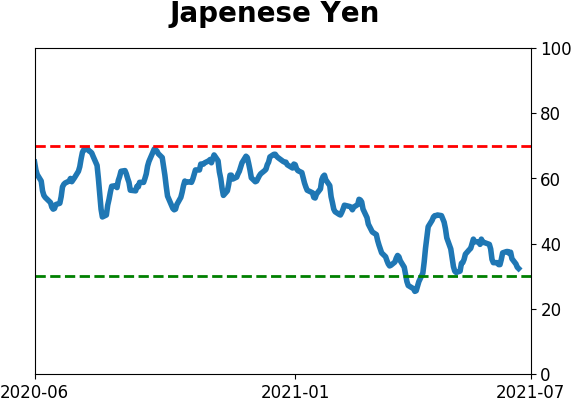
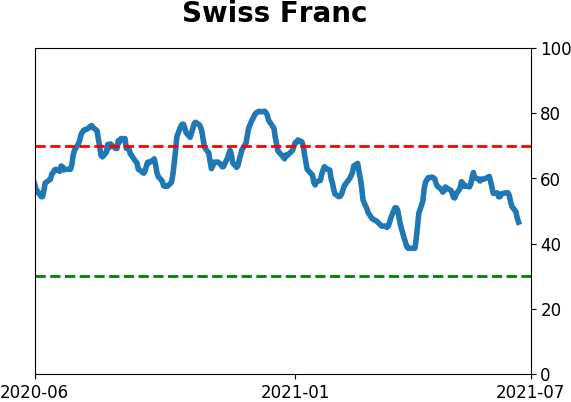
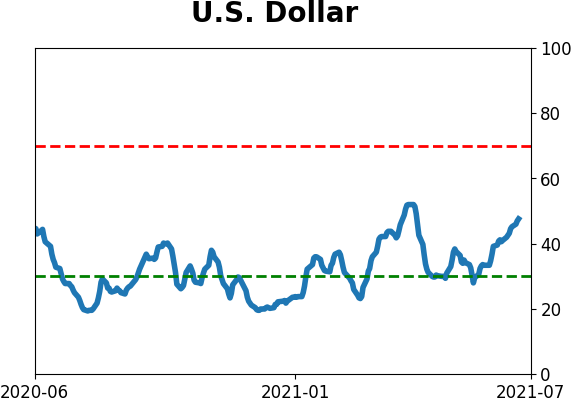
Currency ETF's - 5-Day Moving Average
|
|
|
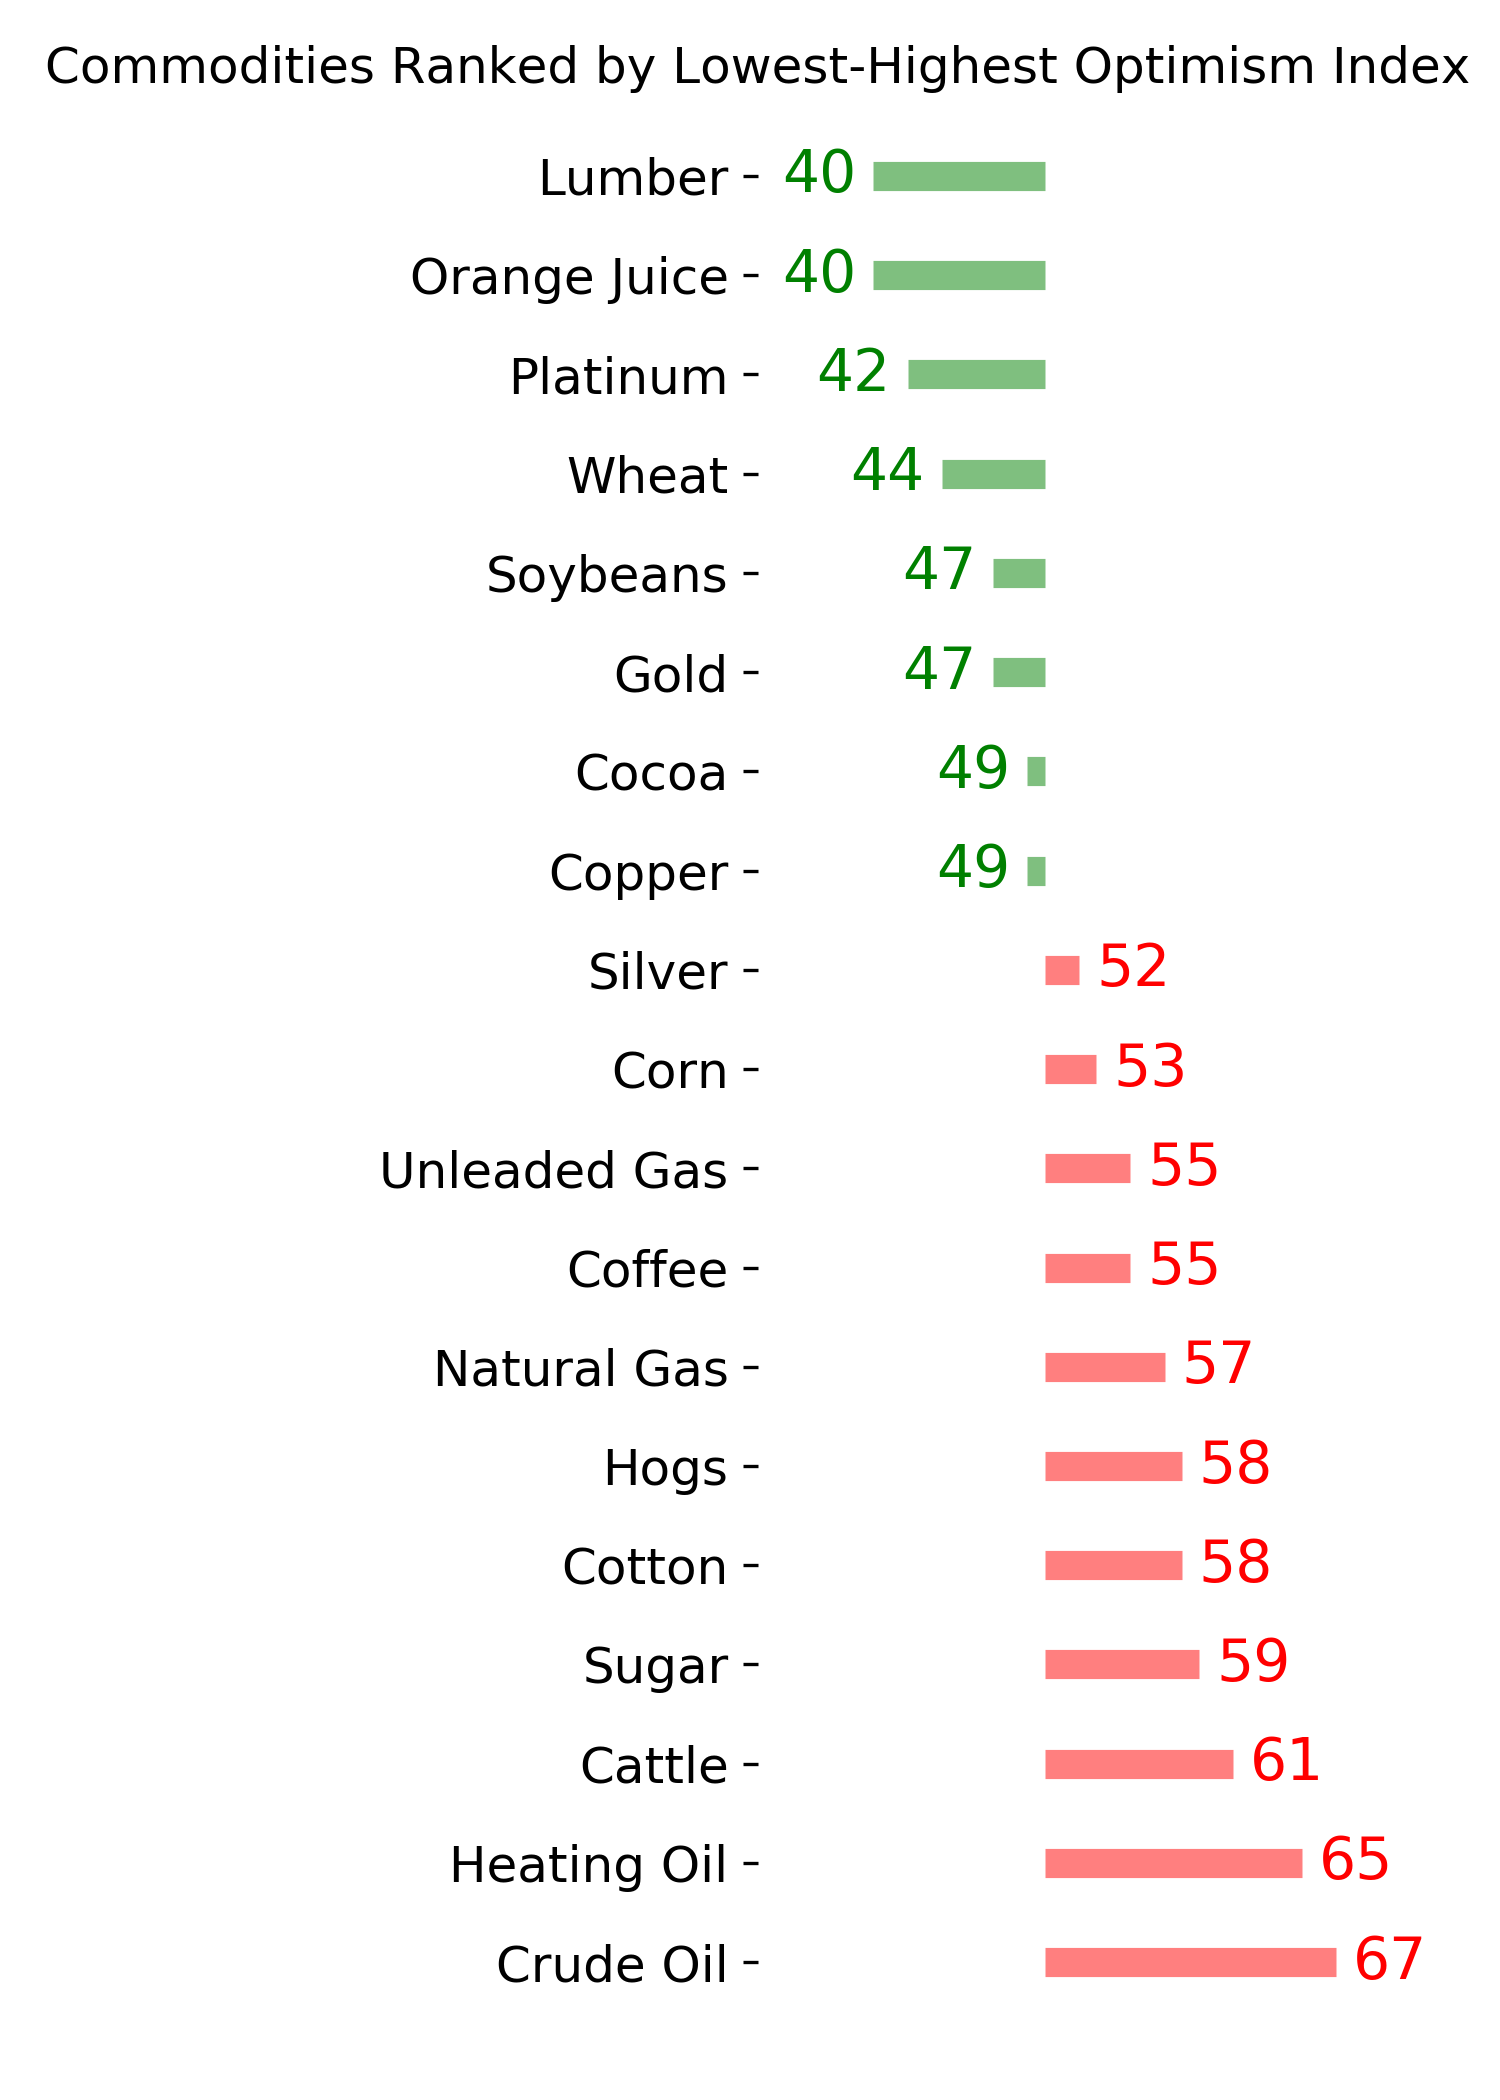
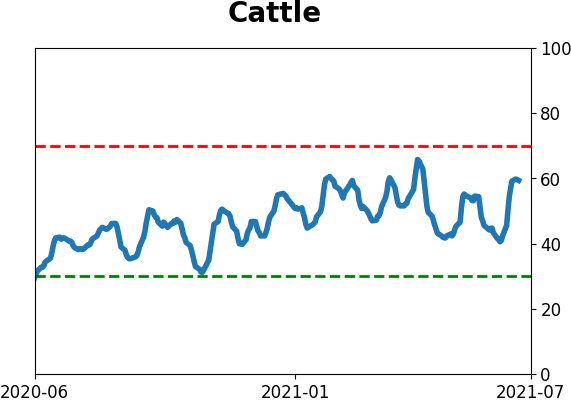
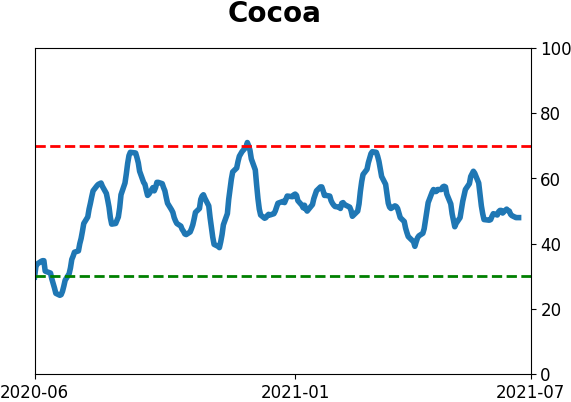
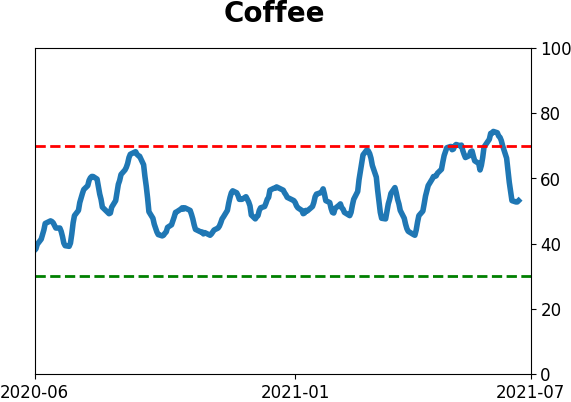
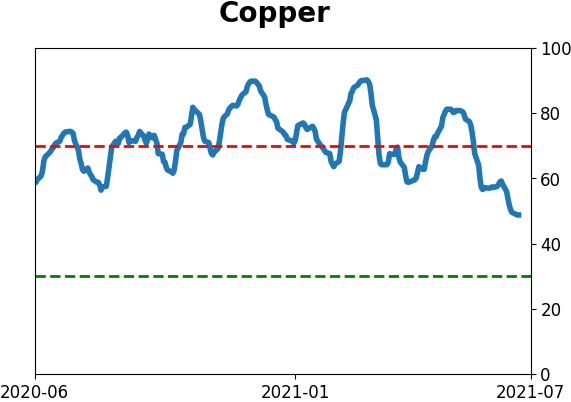
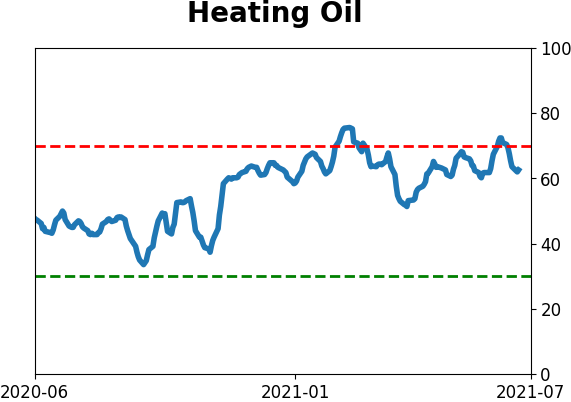
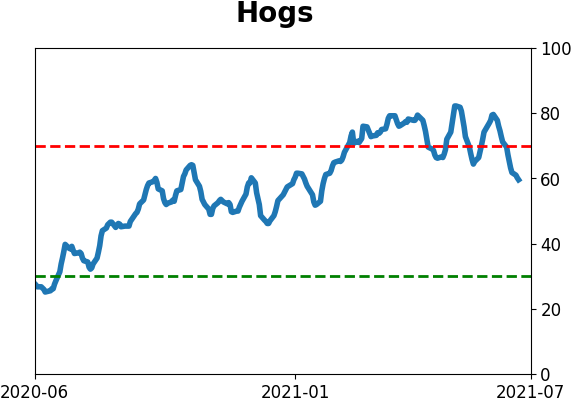
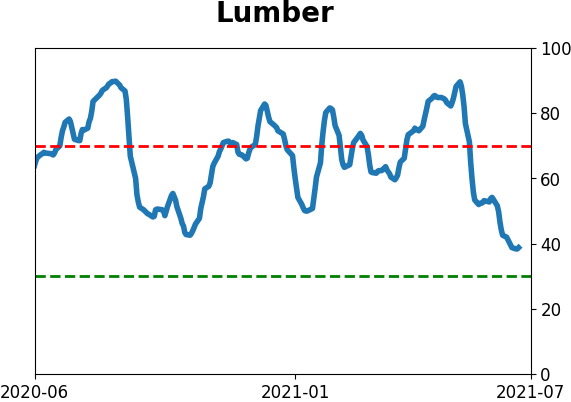
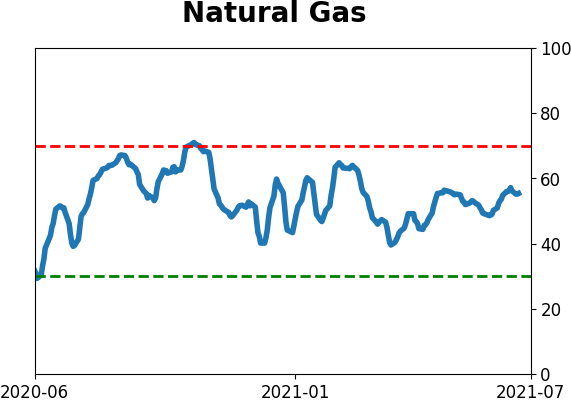
Commodity ETF's - 5-Day Moving Average
|
|