Headlines
|
|
A Big Breadth Turnaround:
Monday's session saw one of the best breadth days in the history of the S&P 500. It's unusual that it occurred so close to a new high. By late last week, there was a large deterioration in medium-term trends, but still with nearly 90% of stocks above their long-term averages.
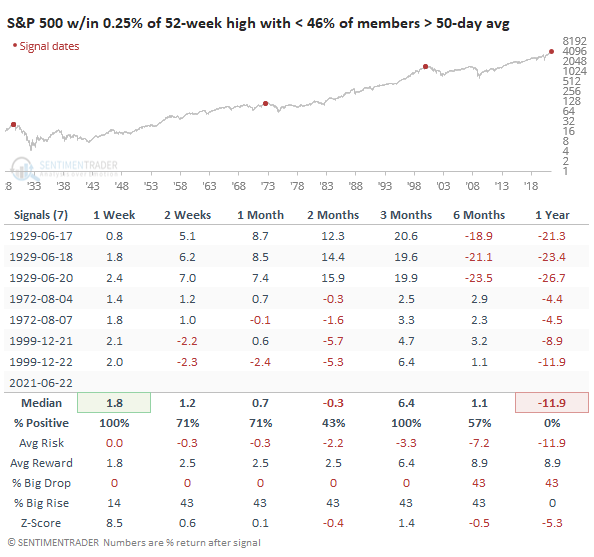
Out of gear: The most widely benchmarked index in the world was close to setting a record high before some late-day selling. Even so, the S&P 500 closed within 0.25% of its prior high. Even so, fewer than 46% of its member stocks are even trading above their 50-day moving averages. Going back to 1928, this has happened only a handful of days. Divergences like this, if they persist, is what often precedes more protracted declines and we need to keep a close watch to see if they develop further.
Bottom Line:
See the Outlook & Allocations page for more details on these summaries STOCKS: Hold
The speculative frenzy in February is wrung out. Internal dynamics have mostly held up, with some exceptions. Many of our studies still show a mixed to poor short-term view, with medium- and long-term ones turning more positive. BONDS: Hold
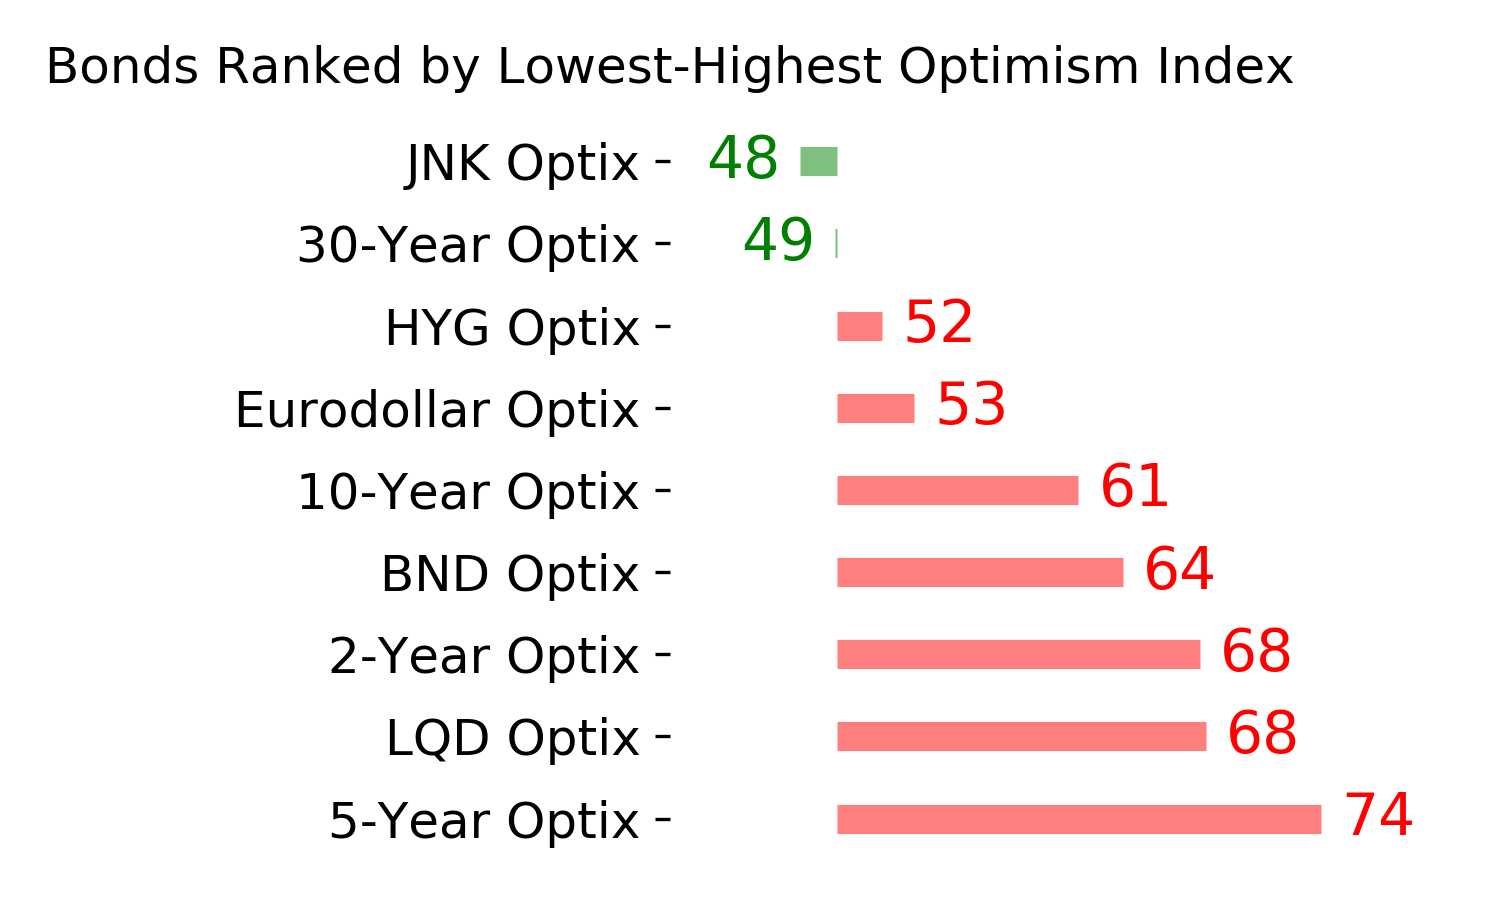
Various parts of the market got hit in March, with the lowest Bond Optimism Index we usually see during healthy environments. After a shaky couple of weeks, the broad bond market has modestly recovered. Not a big edge here either way. GOLD: Hold
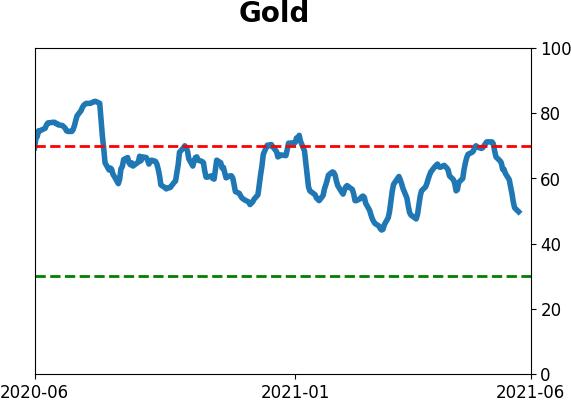
Gold and miners have done very well, recovering above long-term trend lines. The issue is that both have tended to perform poorly after similar situations - will have to wait and see how it plays out.
|
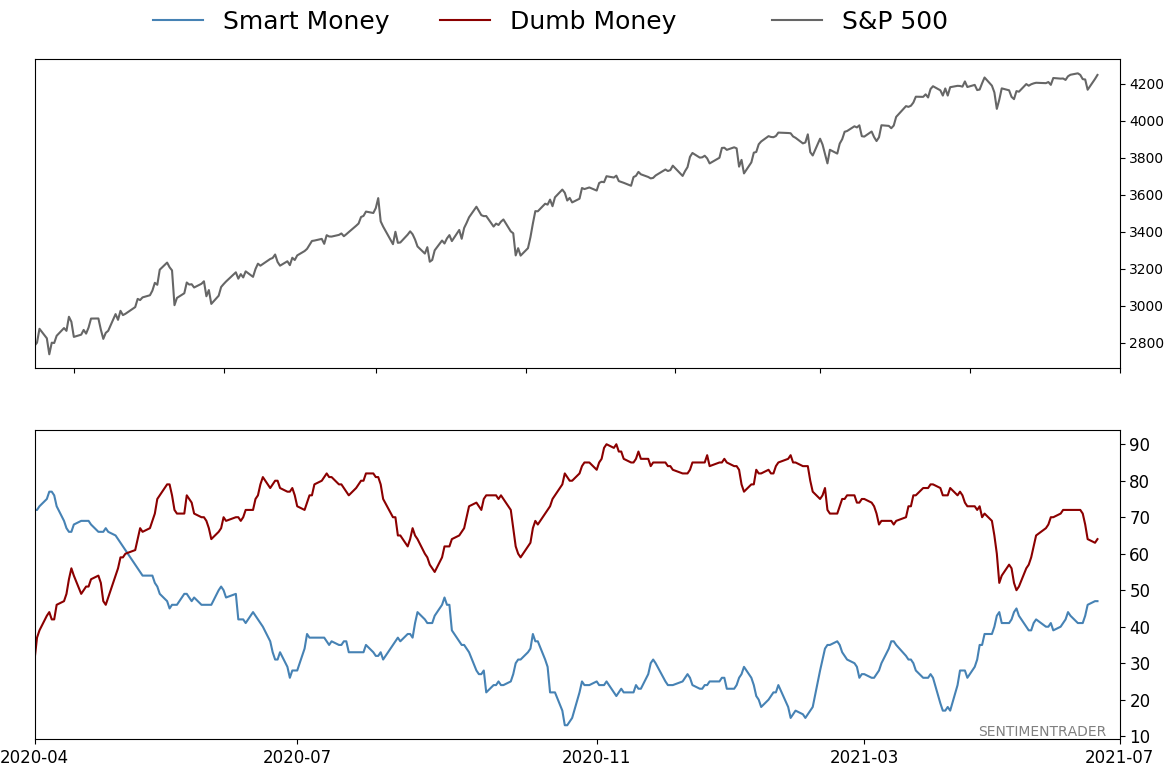
Smart / Dumb Money Confidence
|
Smart Money Confidence: 47%
Dumb Money Confidence: 64%
|
|
Risk Levels
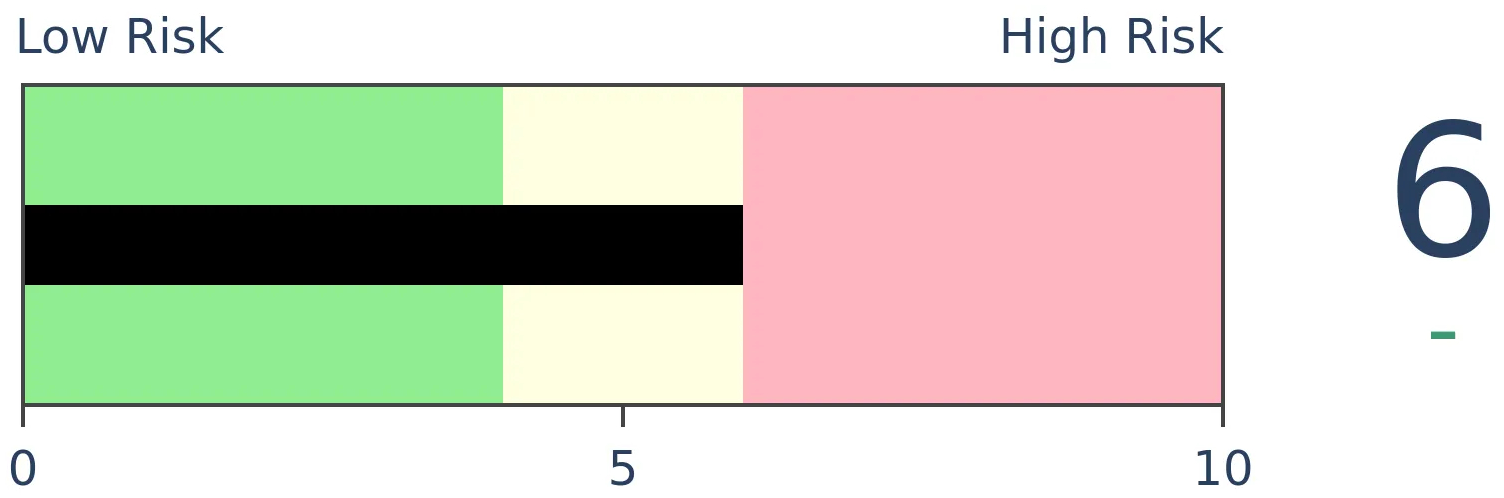
Stocks Short-Term
|
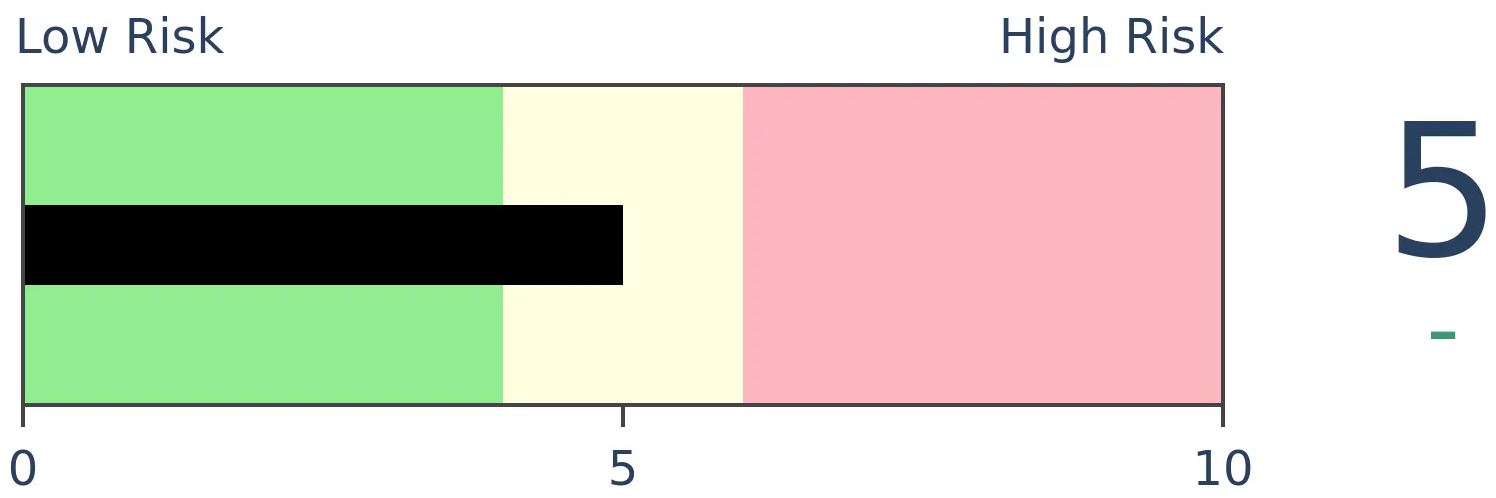
Stocks Medium-Term
|
|
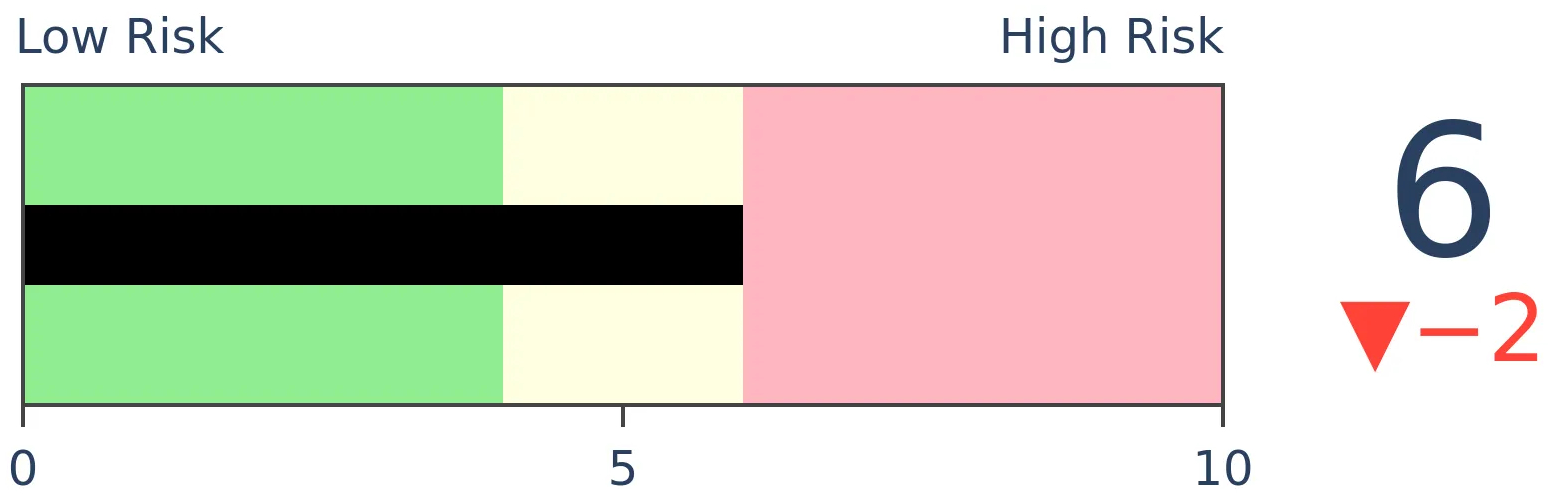
Bonds

|
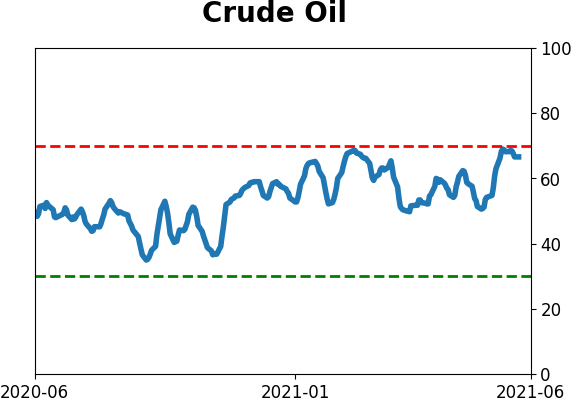
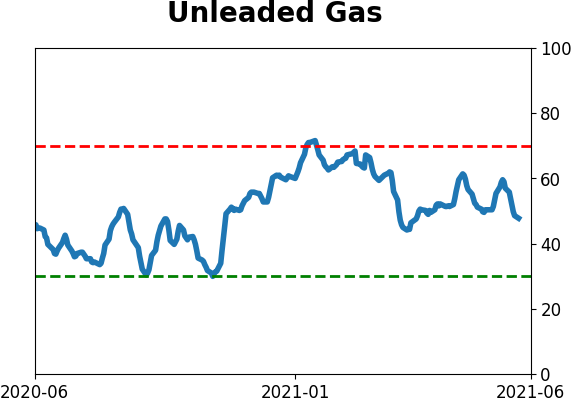
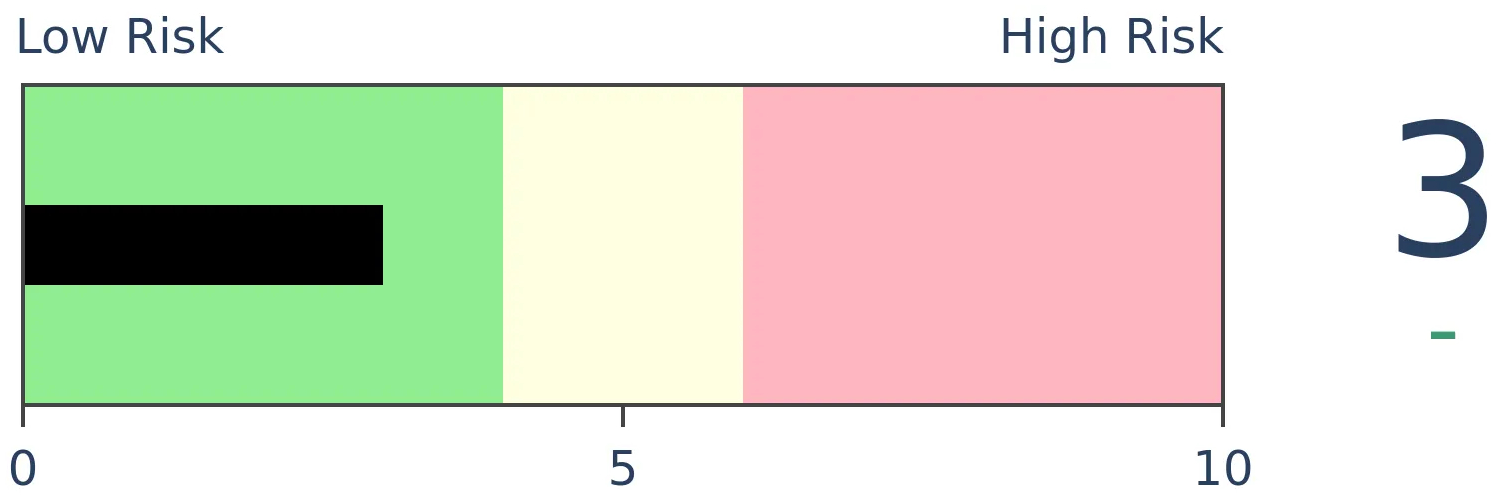
Crude Oil
|
|
Gold
|
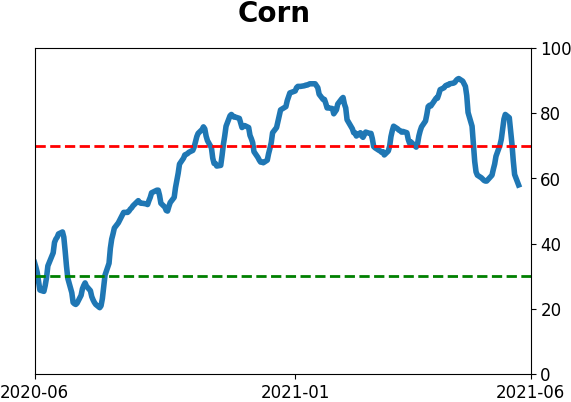
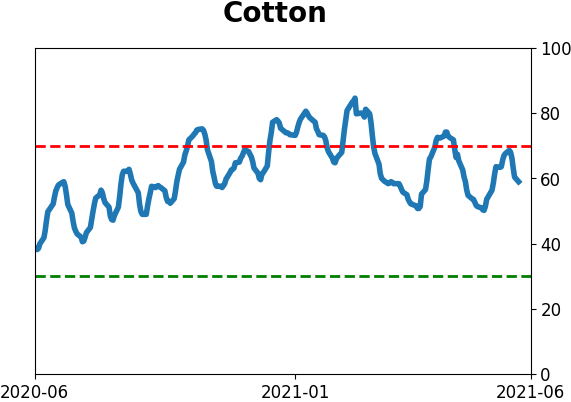
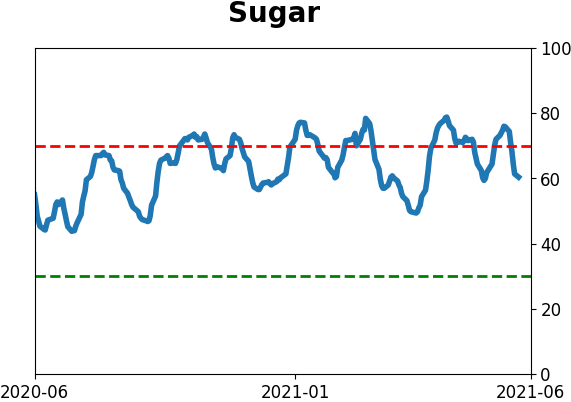
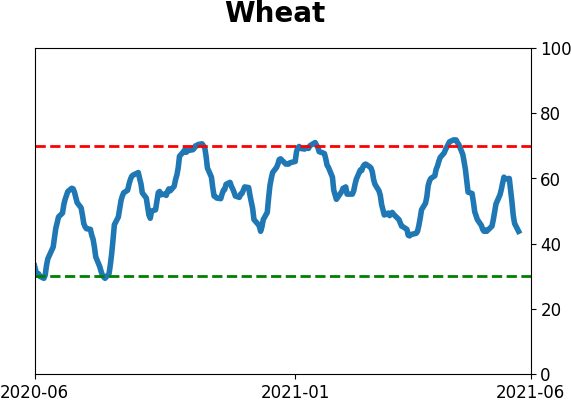
Agriculture
|
|
Research
BOTTOM LINE
Monday's session saw one of the best breadth days in the history of the S&P 500. It's unusual that it occurred so close to a new high. By late last week, there was a large deterioration in medium-term trends, but still with nearly 90% of stocks above their long-term averages.
FORECAST / TIMEFRAME
None
|
With internal weakness that's been festering for a while, then a dip in most stocks to end last week, some sensitive breadth measures neared oversold territory. Monday's surge took care of much of that.
Traders get excited when there is a lopsided day in the markets. On Monday, it was all-aboard to the upside, with few stocks failing to rise. There have been more than 450 net advancing stocks within the S&P 500 only five other times in the past five years.
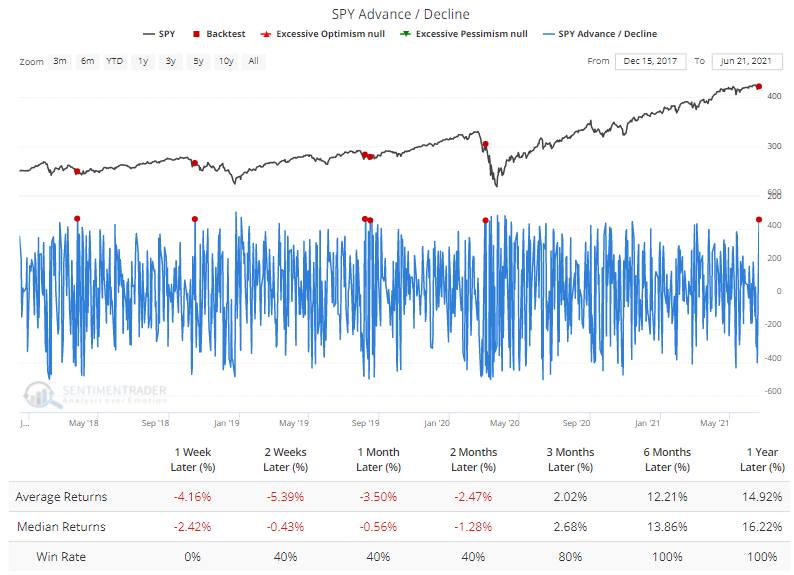
For what it's worth, all five saw the S&P trade lower over the next week before rebounding. To run this same backtest, click this link, then Run Backtest. It takes less than 10 seconds to test your assumptions.
BIG DAY, ALMOST A NEW HIGH
Going back to 1928, Monday was among the best breadth days ever, with more than 90% of its stocks advancing, when the S&P was sitting within 1% of a multi-year high. It never happened from 1928 through 1986.
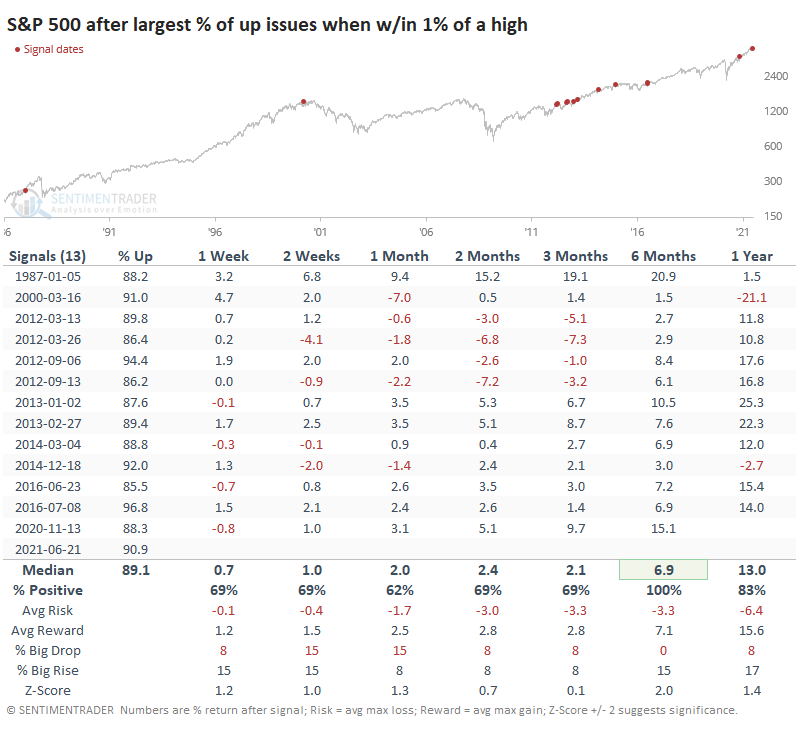
This showed more positive results across all time frames, especially over the next six months. Not sure we want to read too much into six-month returns following a one-day signal, but it is what it is. It did kinda-sorta lead to blow-off conditions in 1987, 2000, 2012, and 2015 but took a while to play out.
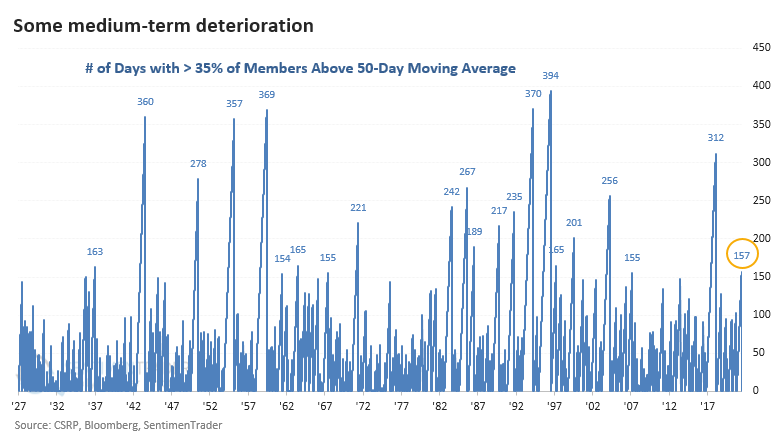
PLUNGE IN MEDIUM-TERM UPTRENDS WITHIN A GOOD ENVIRONMENT
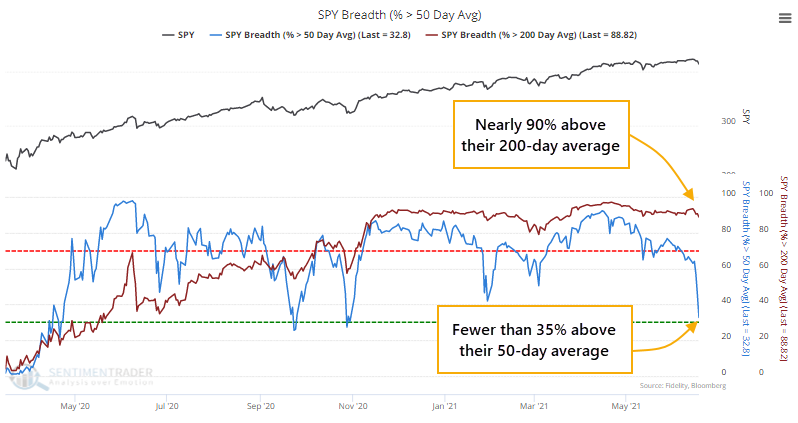
Before Monday's surge, for only the third time since the pandemic low, fewer than 35% of S&P 500 stocks were holding above their 50-day moving averages.
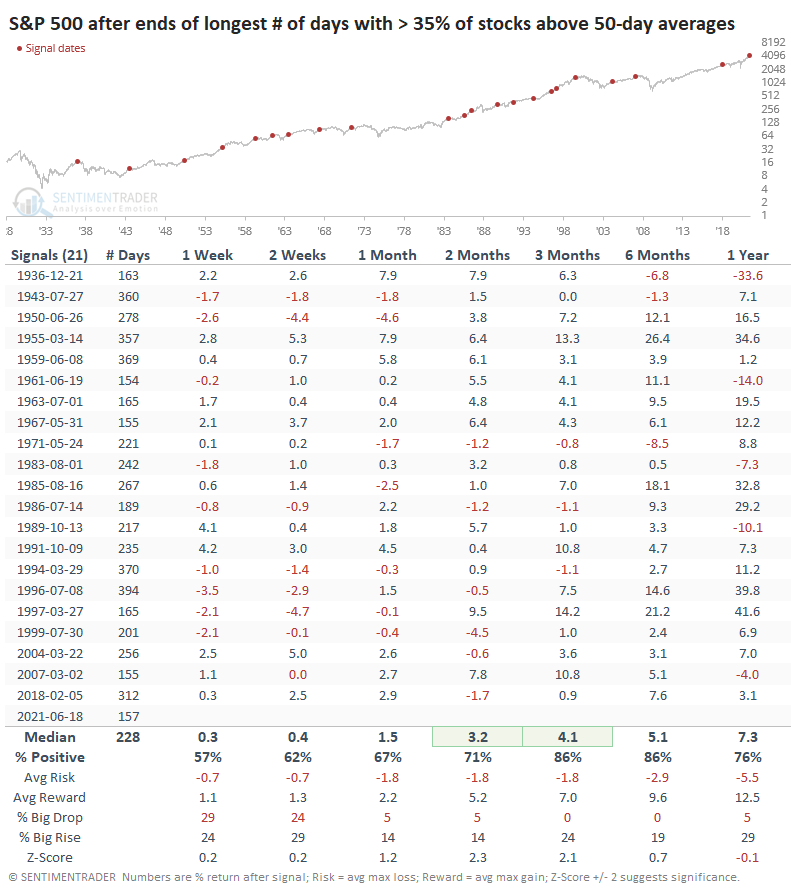
This ended a streak of more than seven months with more than 35% of S&P 500 stocks above their averages, the longest streak in over three years and ranking as one of the longest since 1927.
The ends of other long streaks rarely resulted in sustained downside. Over the next two and three months, the S&P showed much better-than-average returns and risk/reward skew. Three months later, there were no losses larger than -1.1%, an impressive feat.
 The chart above shows that despite the drop in stocks holding above their 50-day averages, nearly 90% of them were still above their 200-day averages. That's the most stocks we've ever seen above their long-term averages when there was a big drop in medium-term uptrends.
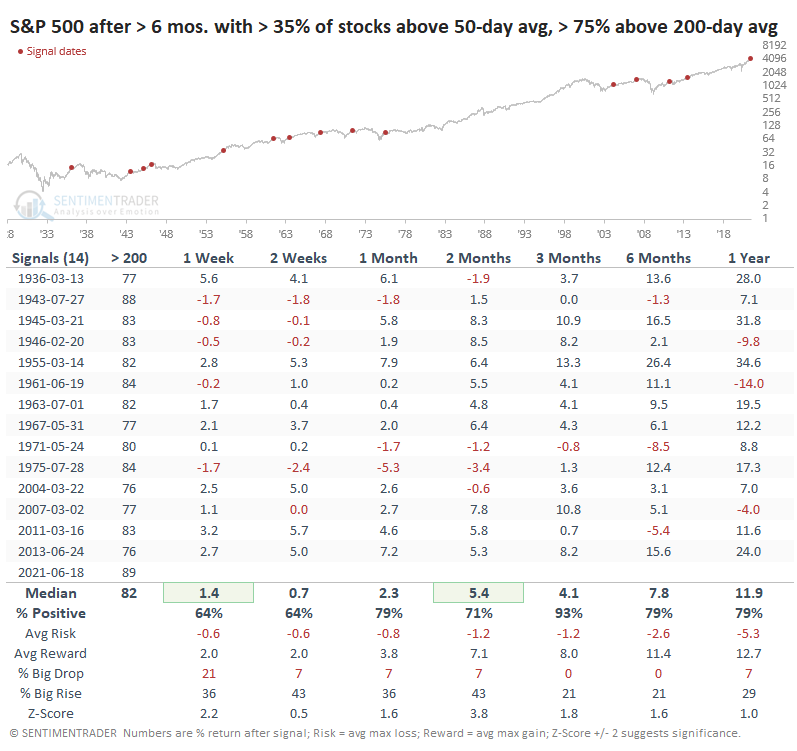
Other times that stocks carved out similar patterns, the S&P rallied in the months ahead. Over the next three months, 13 out of 14 signals showed a positive return, and the sole loss was smaller than -1%.
There are some concerns, with high levels of speculation preceding enough weakness to trigger some internal warnings and even a Dow Theory sell signal. Monday's big up day doesn't change that much, as we've seen over the past five years. Since we're still not seeing a large and sustained deterioration in longer-term trends, though, it's hard to become too negative just yet.
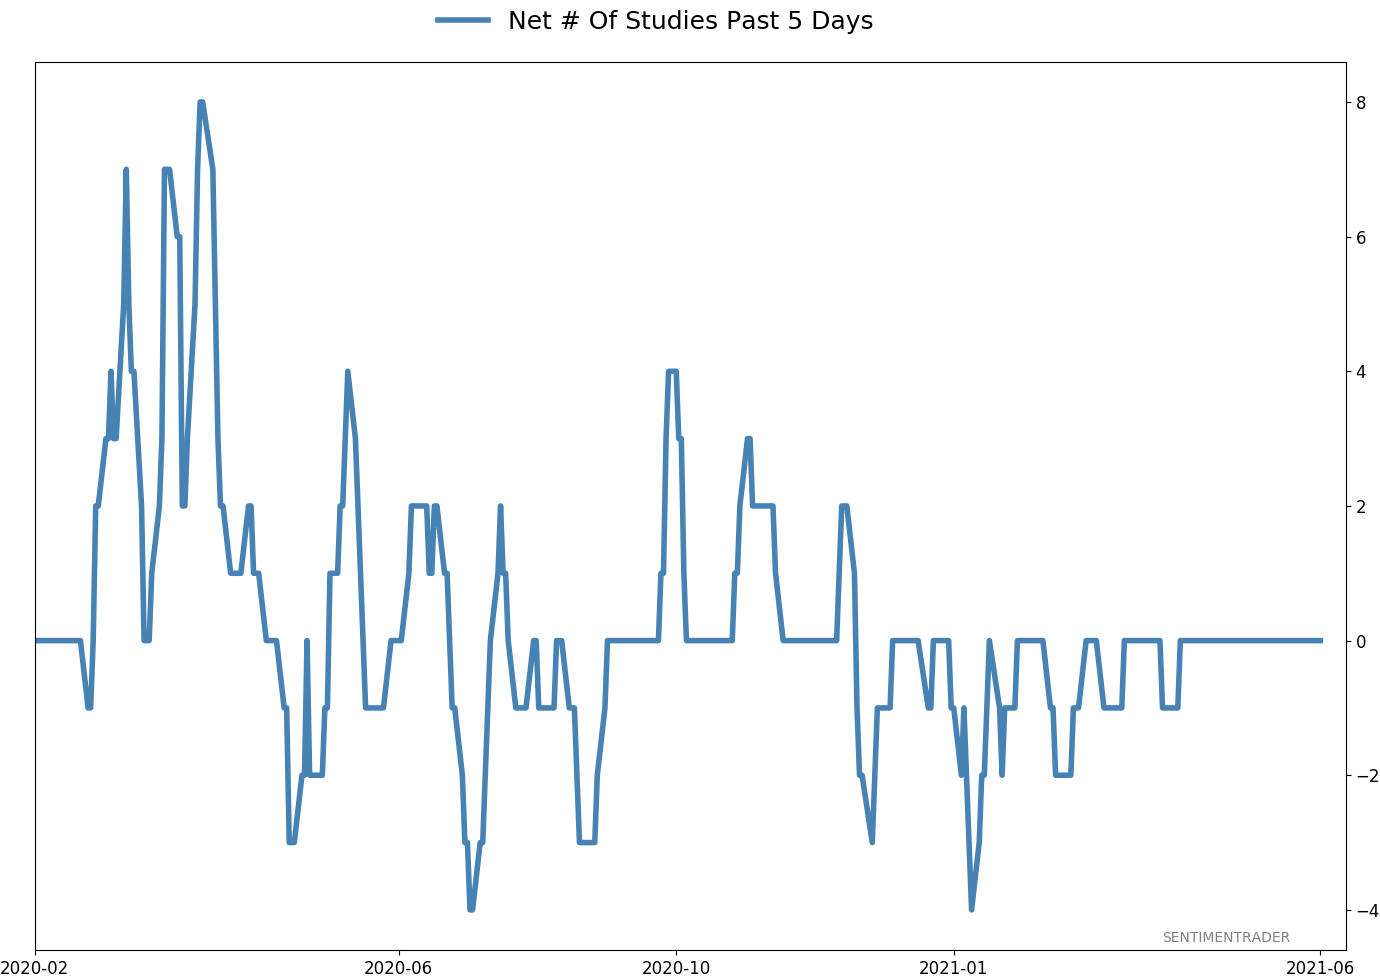
Active Studies
| Time Frame | Bullish | Bearish | | Short-Term | 0 | 1 | | Medium-Term | 2 | 12 | | Long-Term | 11 | 5 |
|
Indicators at Extremes
Portfolio
| Position | Description | Weight % | Added / Reduced | Date | | Stocks | RSP | 4.1 | Added 4.1% | 2021-05-19 | | Bonds | 23.9% BND, 6.9% SCHP | 30.7 | Reduced 7.1% | 2021-05-19 | | Commodities | GCC | 2.6 | Reduced 2.1%
| 2020-09-04 | | Precious Metals | GDX | 5.6 | Reduced 4.2% | 2021-05-19 | | Special Situations | 4.3% XLE, 2.2% PSCE | 7.6 | Reduced 5.6% | 2021-04-22 | | Cash | | 49.4 | | |
|
Updates (Changes made today are underlined)
Much of our momentum and trend work has remained positive for several months, with some scattered exceptions. Almost all sentiment-related work has shown a poor risk/reward ratio for stocks, especially as speculation drove to record highs in exuberance in February. Much of that has worn off, and most of our models are back toward neutral levels. There isn't much to be excited about here. The same goes for bonds and even gold. Gold has been performing well lately and is back above long-term trend lines. The issue is that it has a poor record of holding onto gains when attempting a long-term trend change like this, so we'll take a wait-and-see approach. RETURN YTD: 9.4% 2020: 8.1%, 2019: 12.6%, 2018: 0.6%, 2017: 3.8%, 2016: 17.1%, 2015: 9.2%, 2014: 14.5%, 2013: 2.2%, 2012: 10.8%, 2011: 16.5%, 2010: 15.3%, 2009: 23.9%, 2008: 16.2%, 2007: 7.8%
|
|
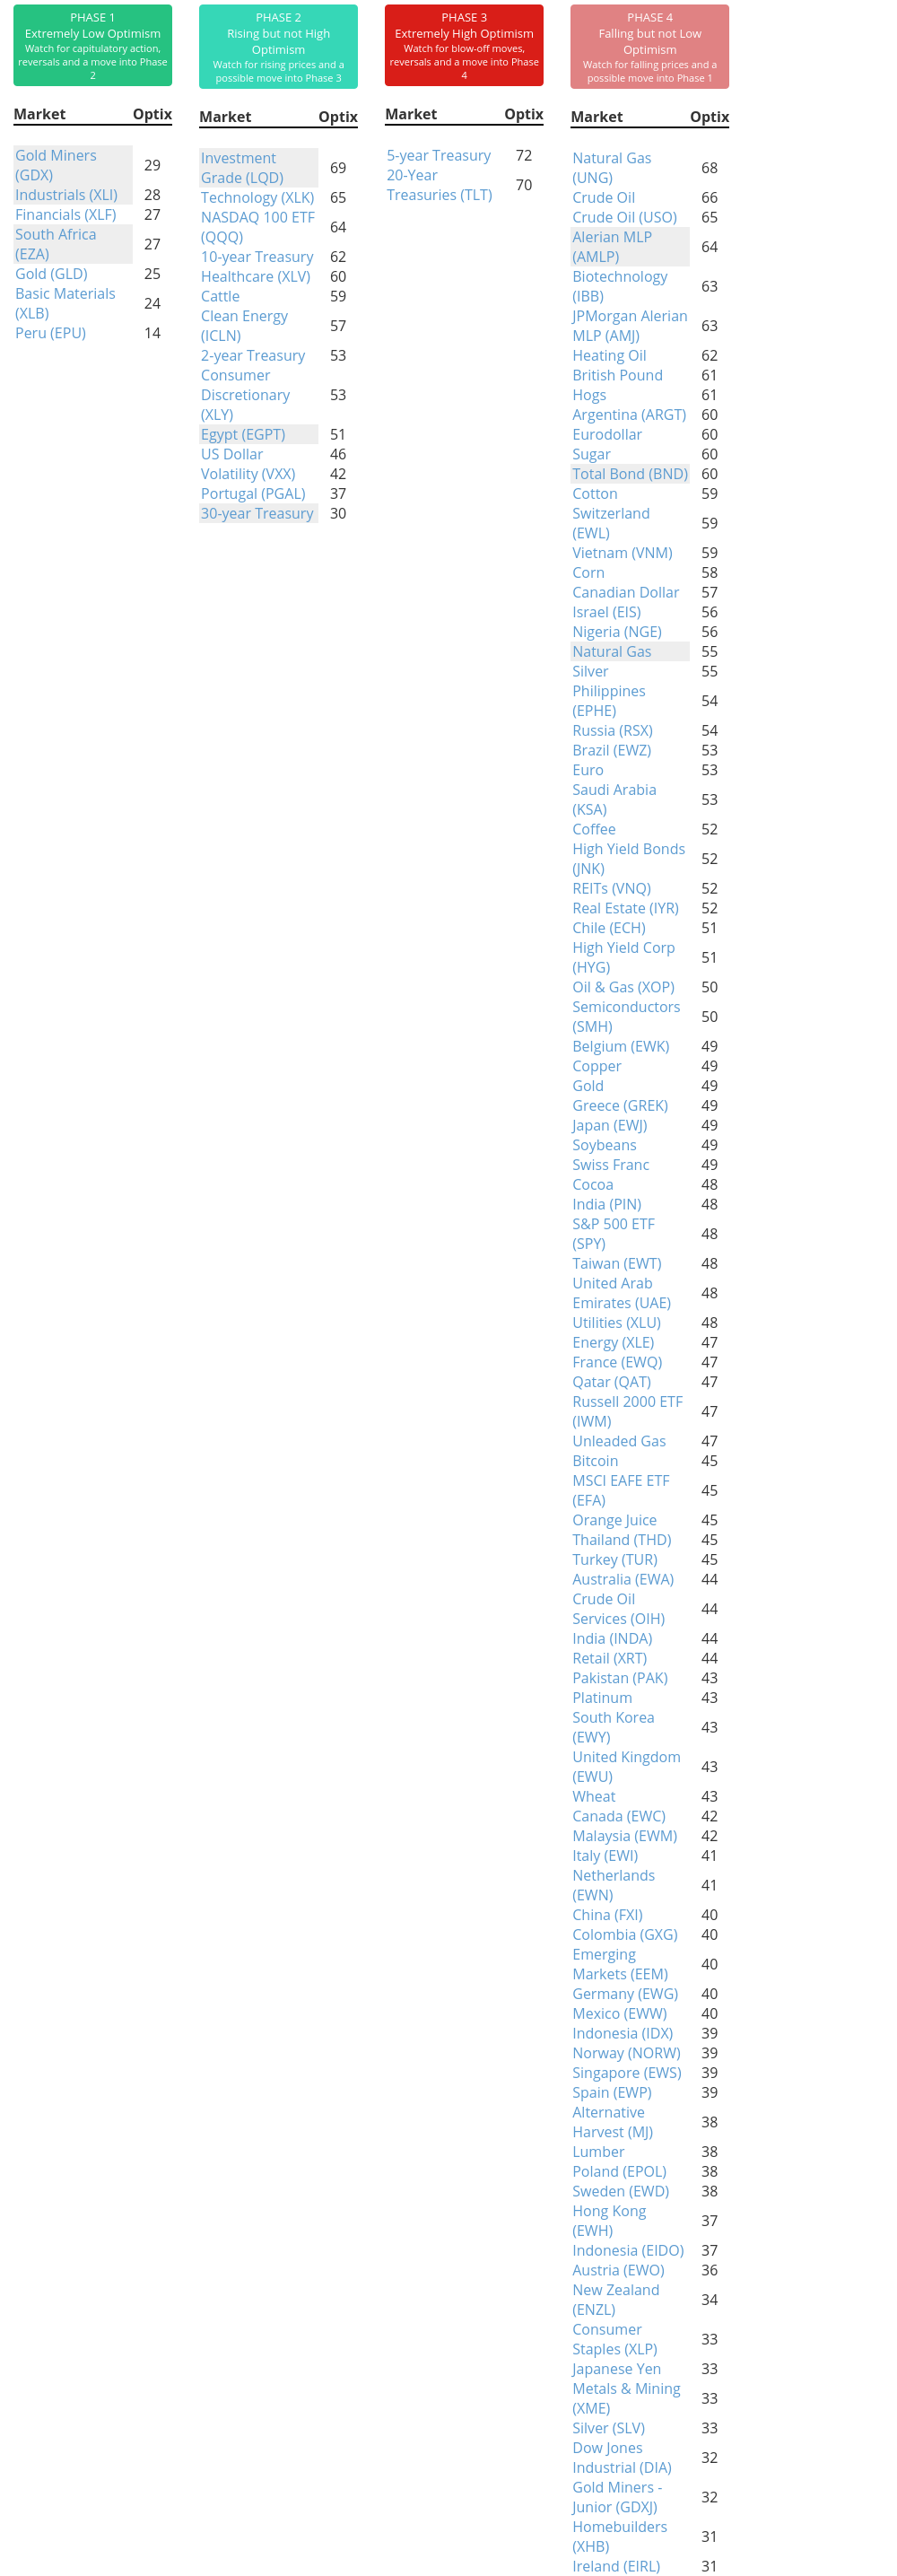
Phase Table
Ranks
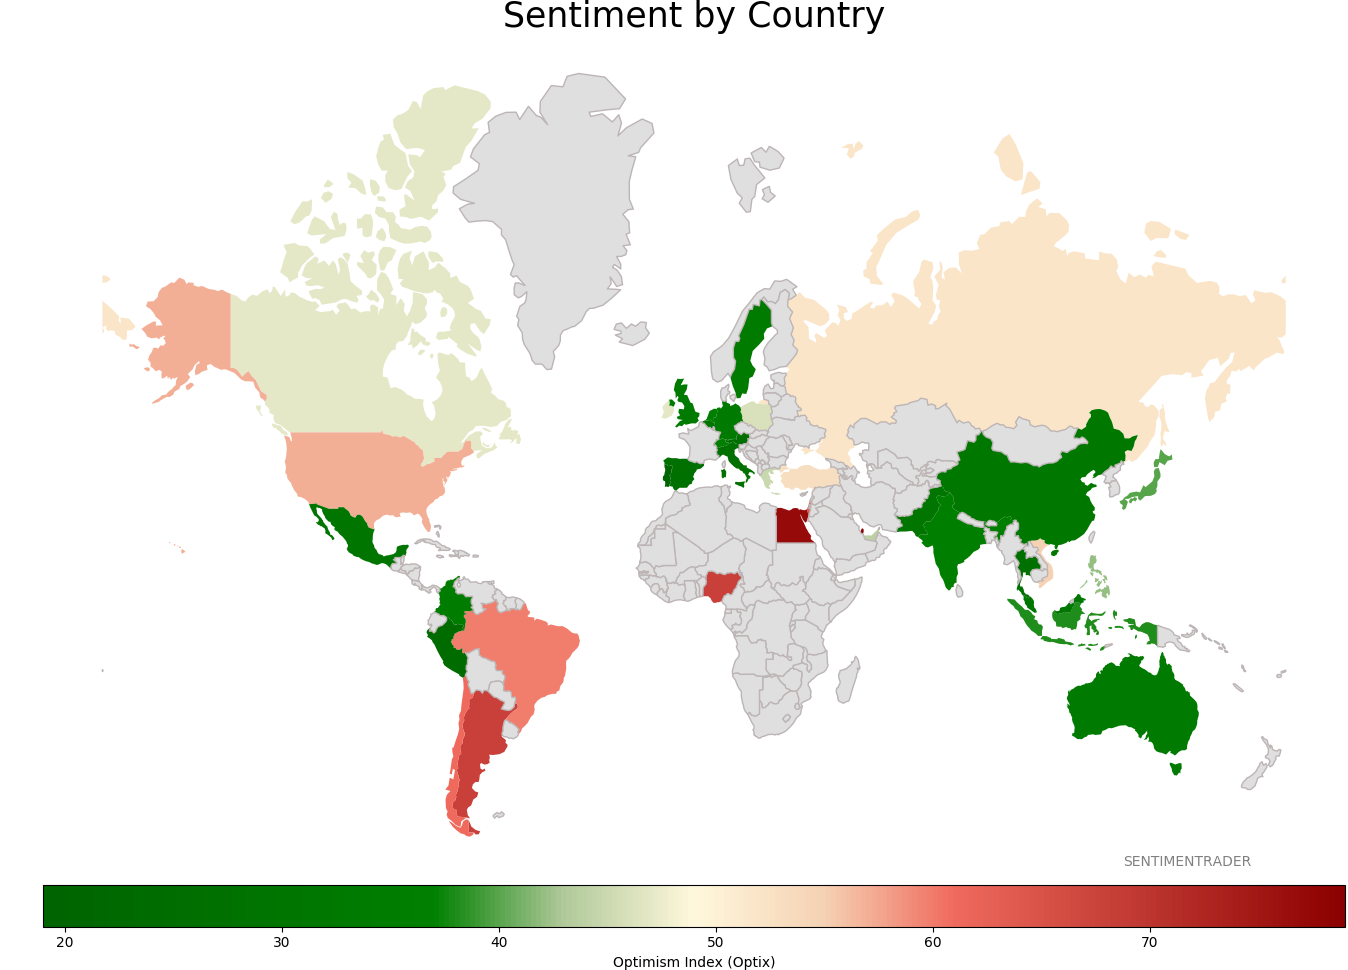
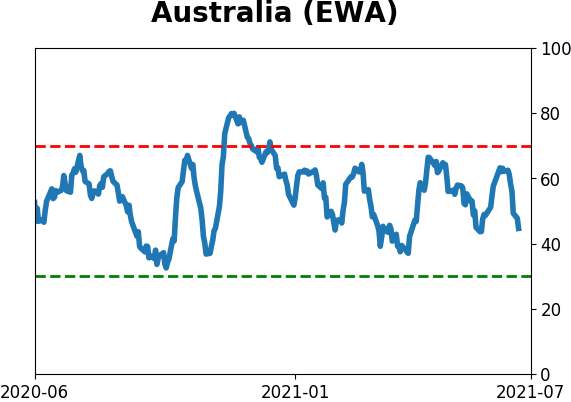
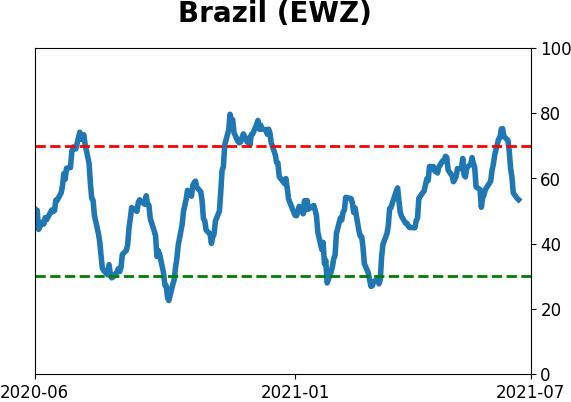
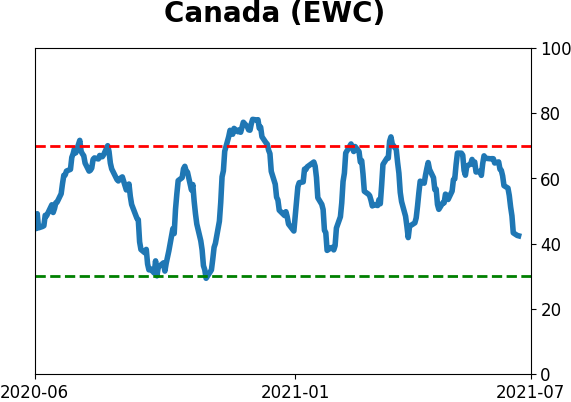
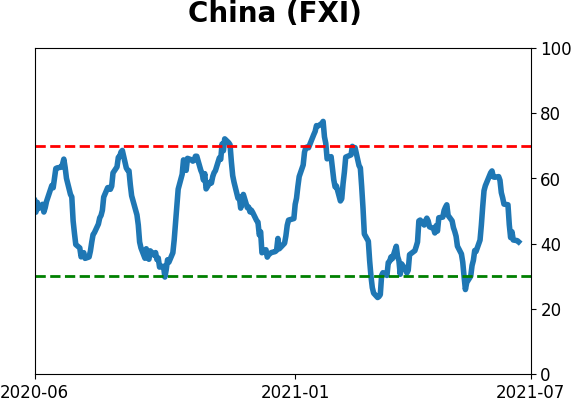
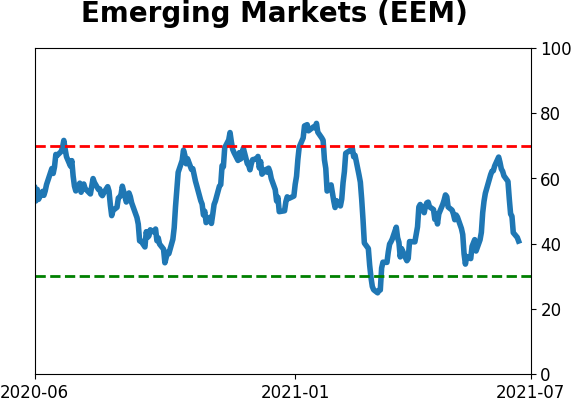
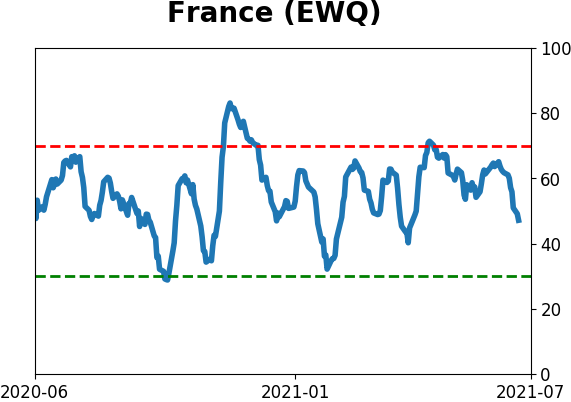
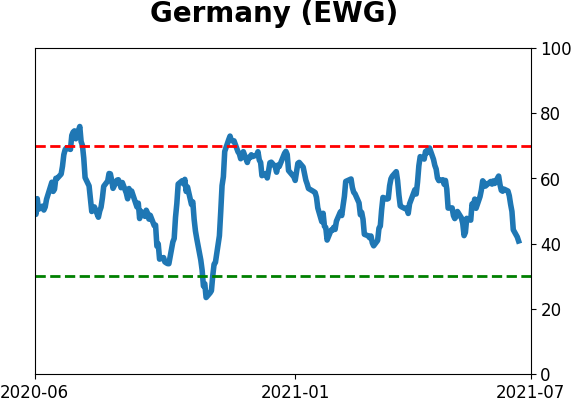
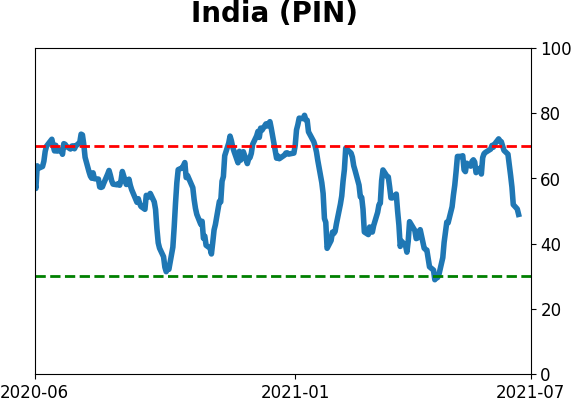
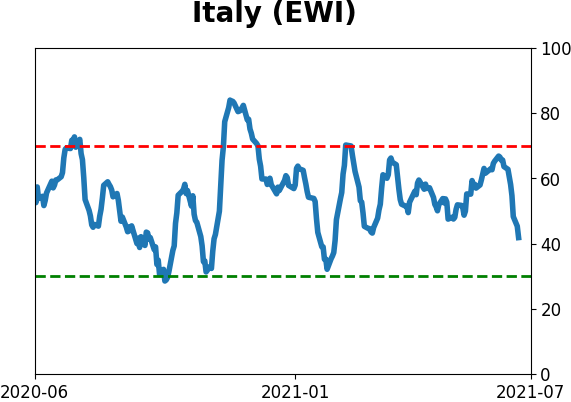
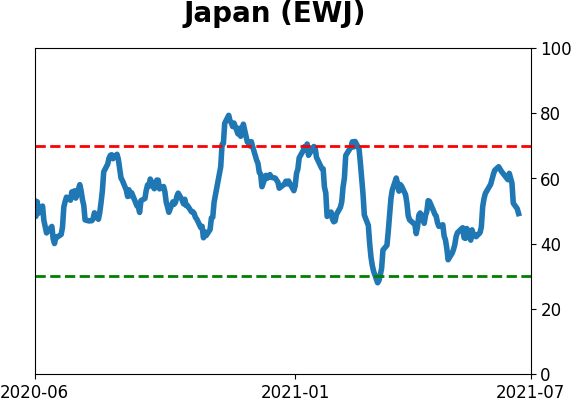
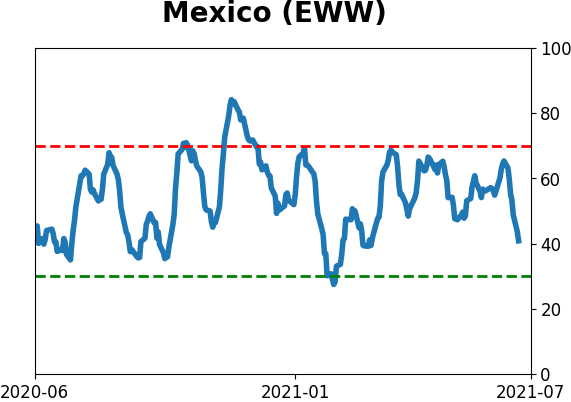
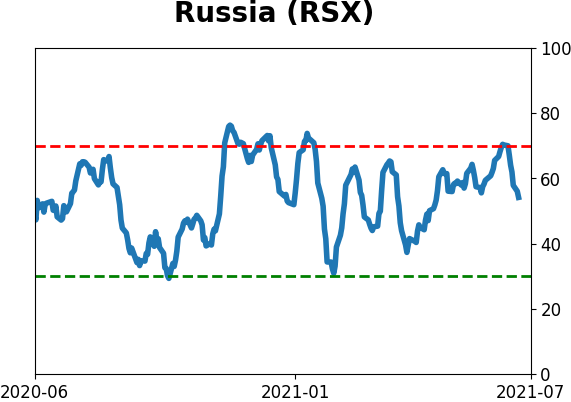
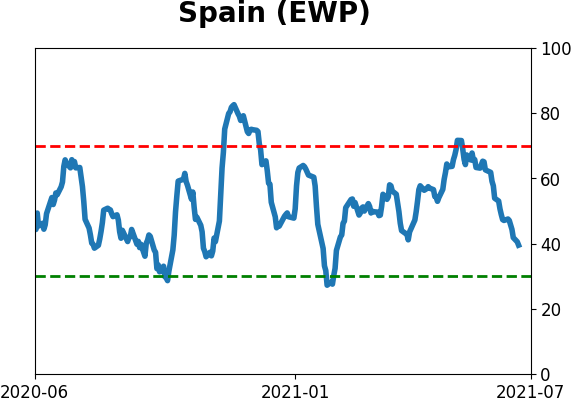
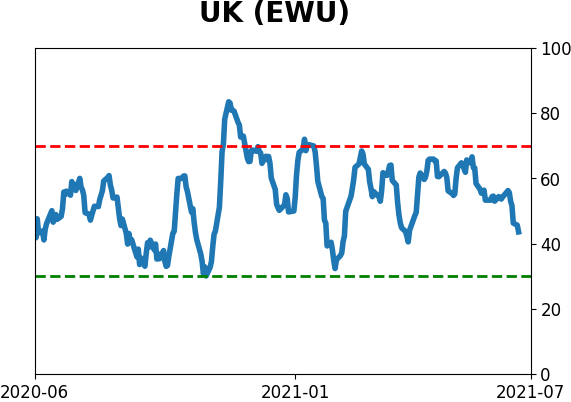
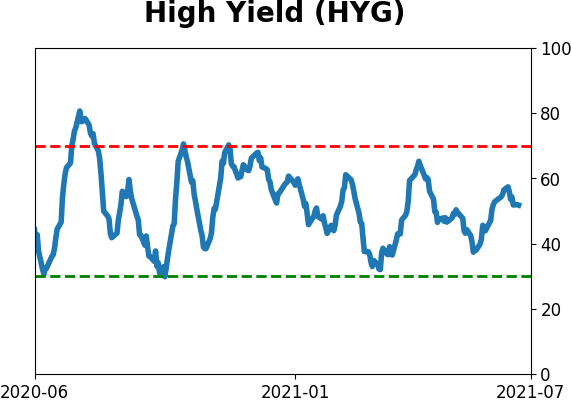
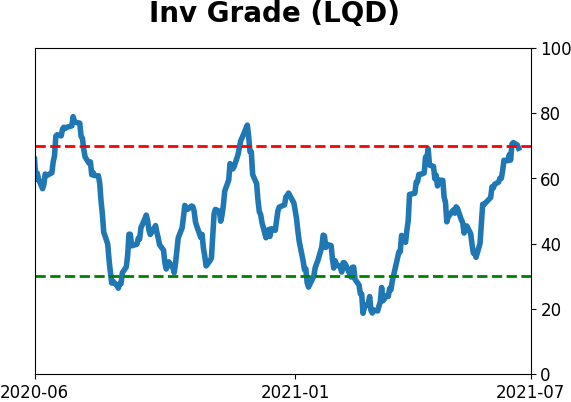
Sentiment Around The World
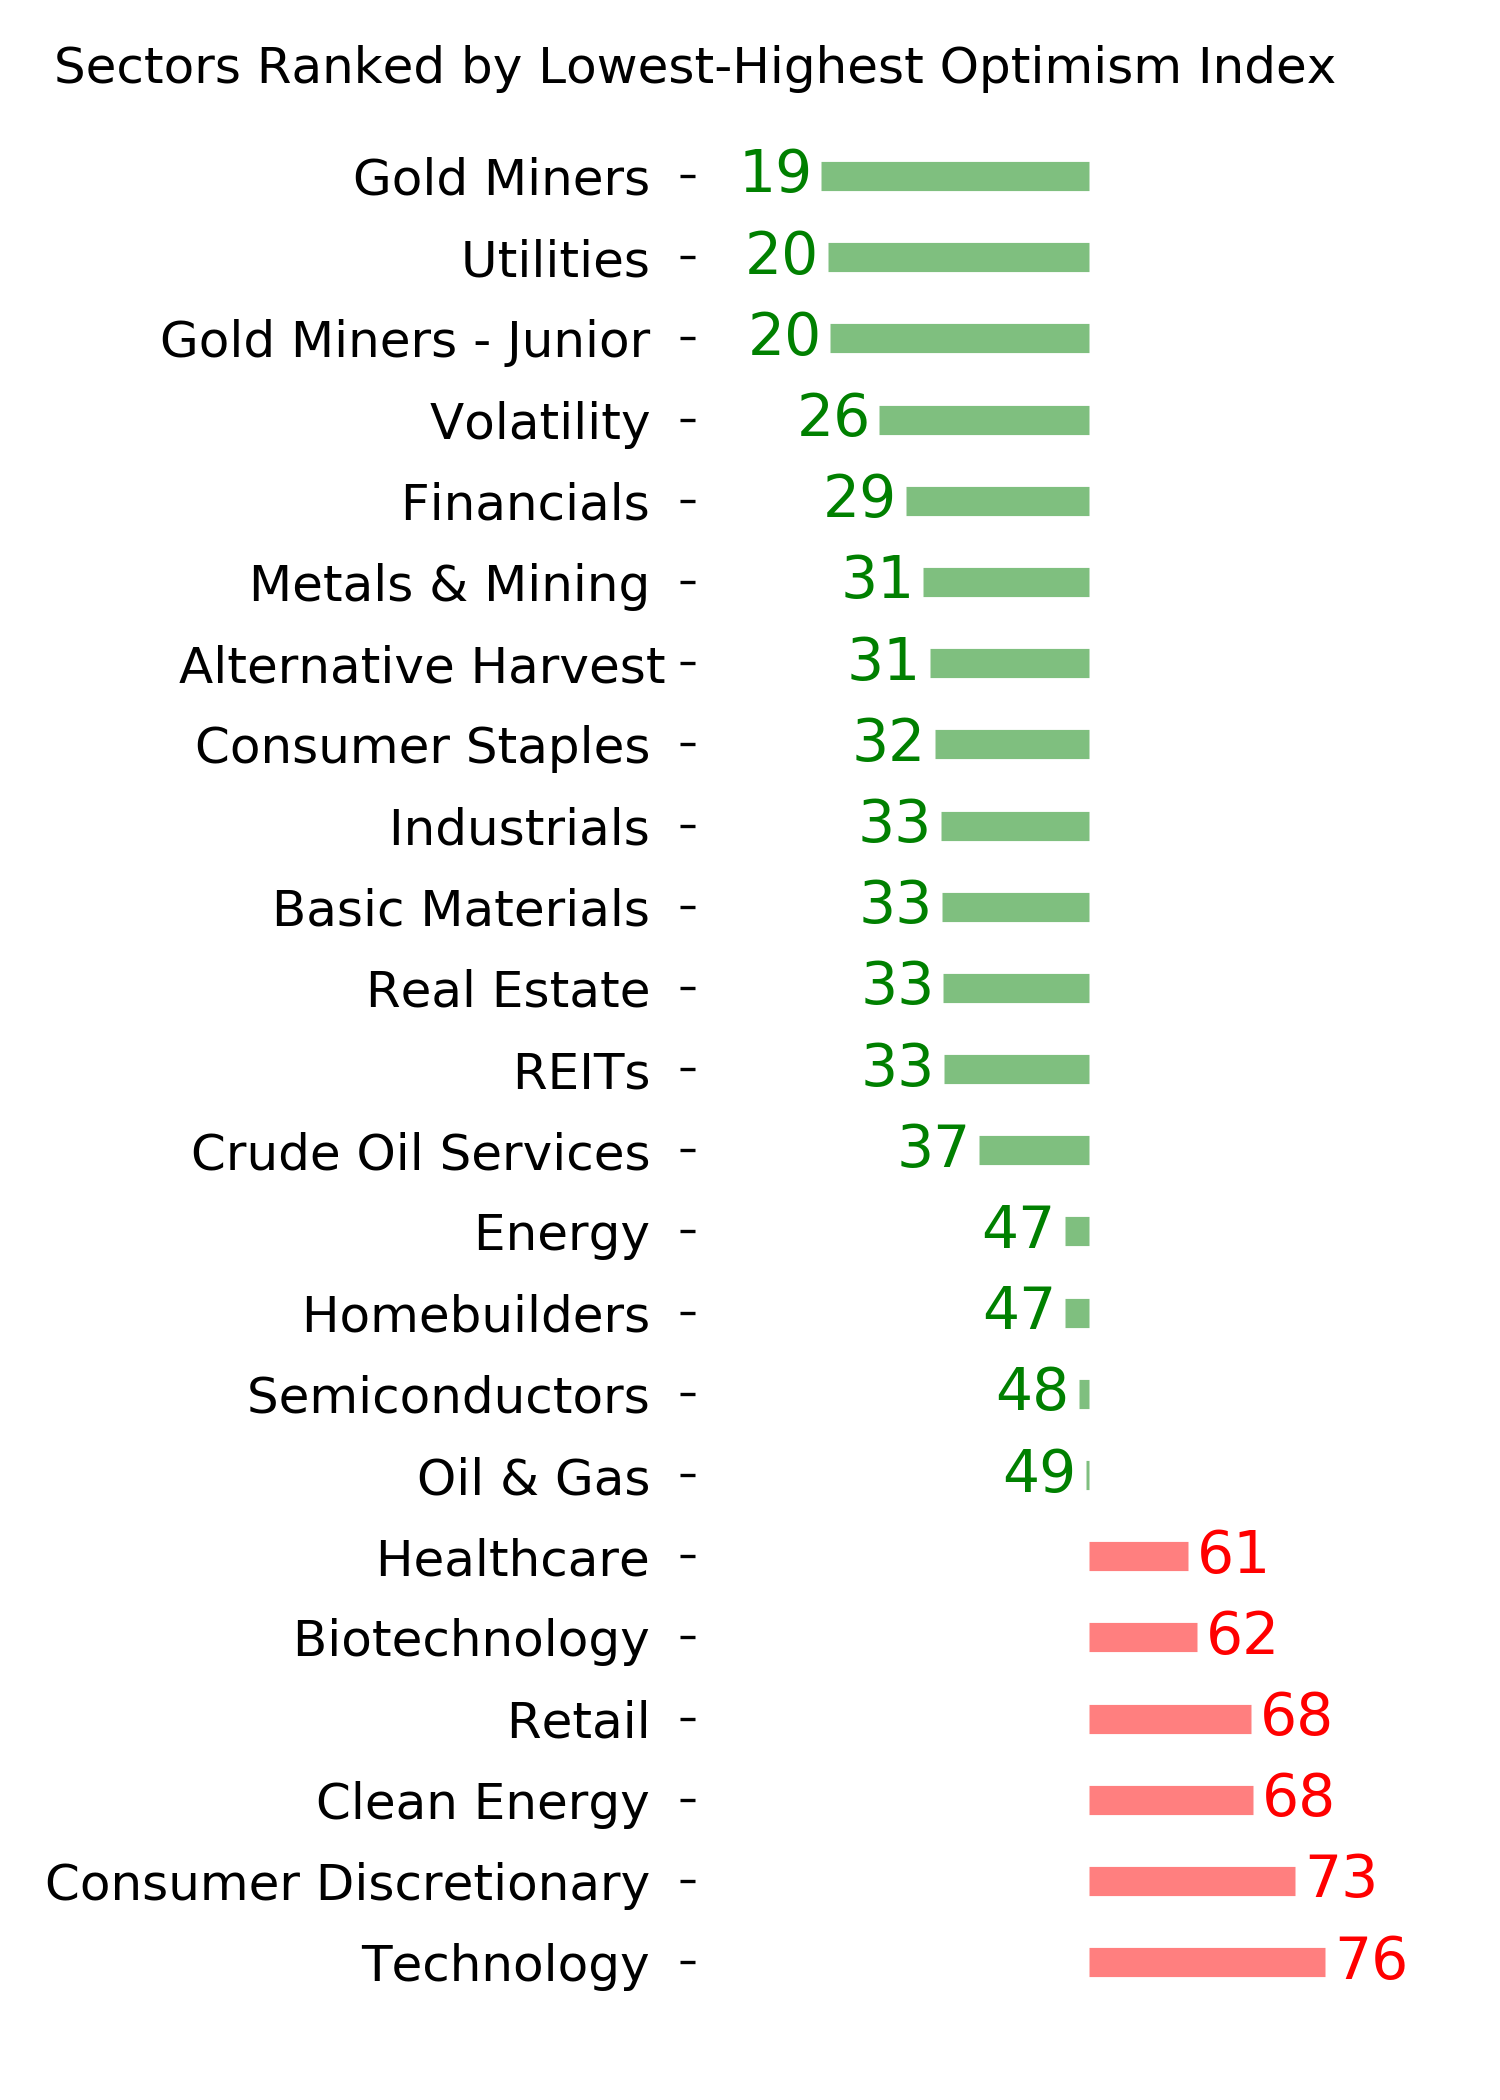
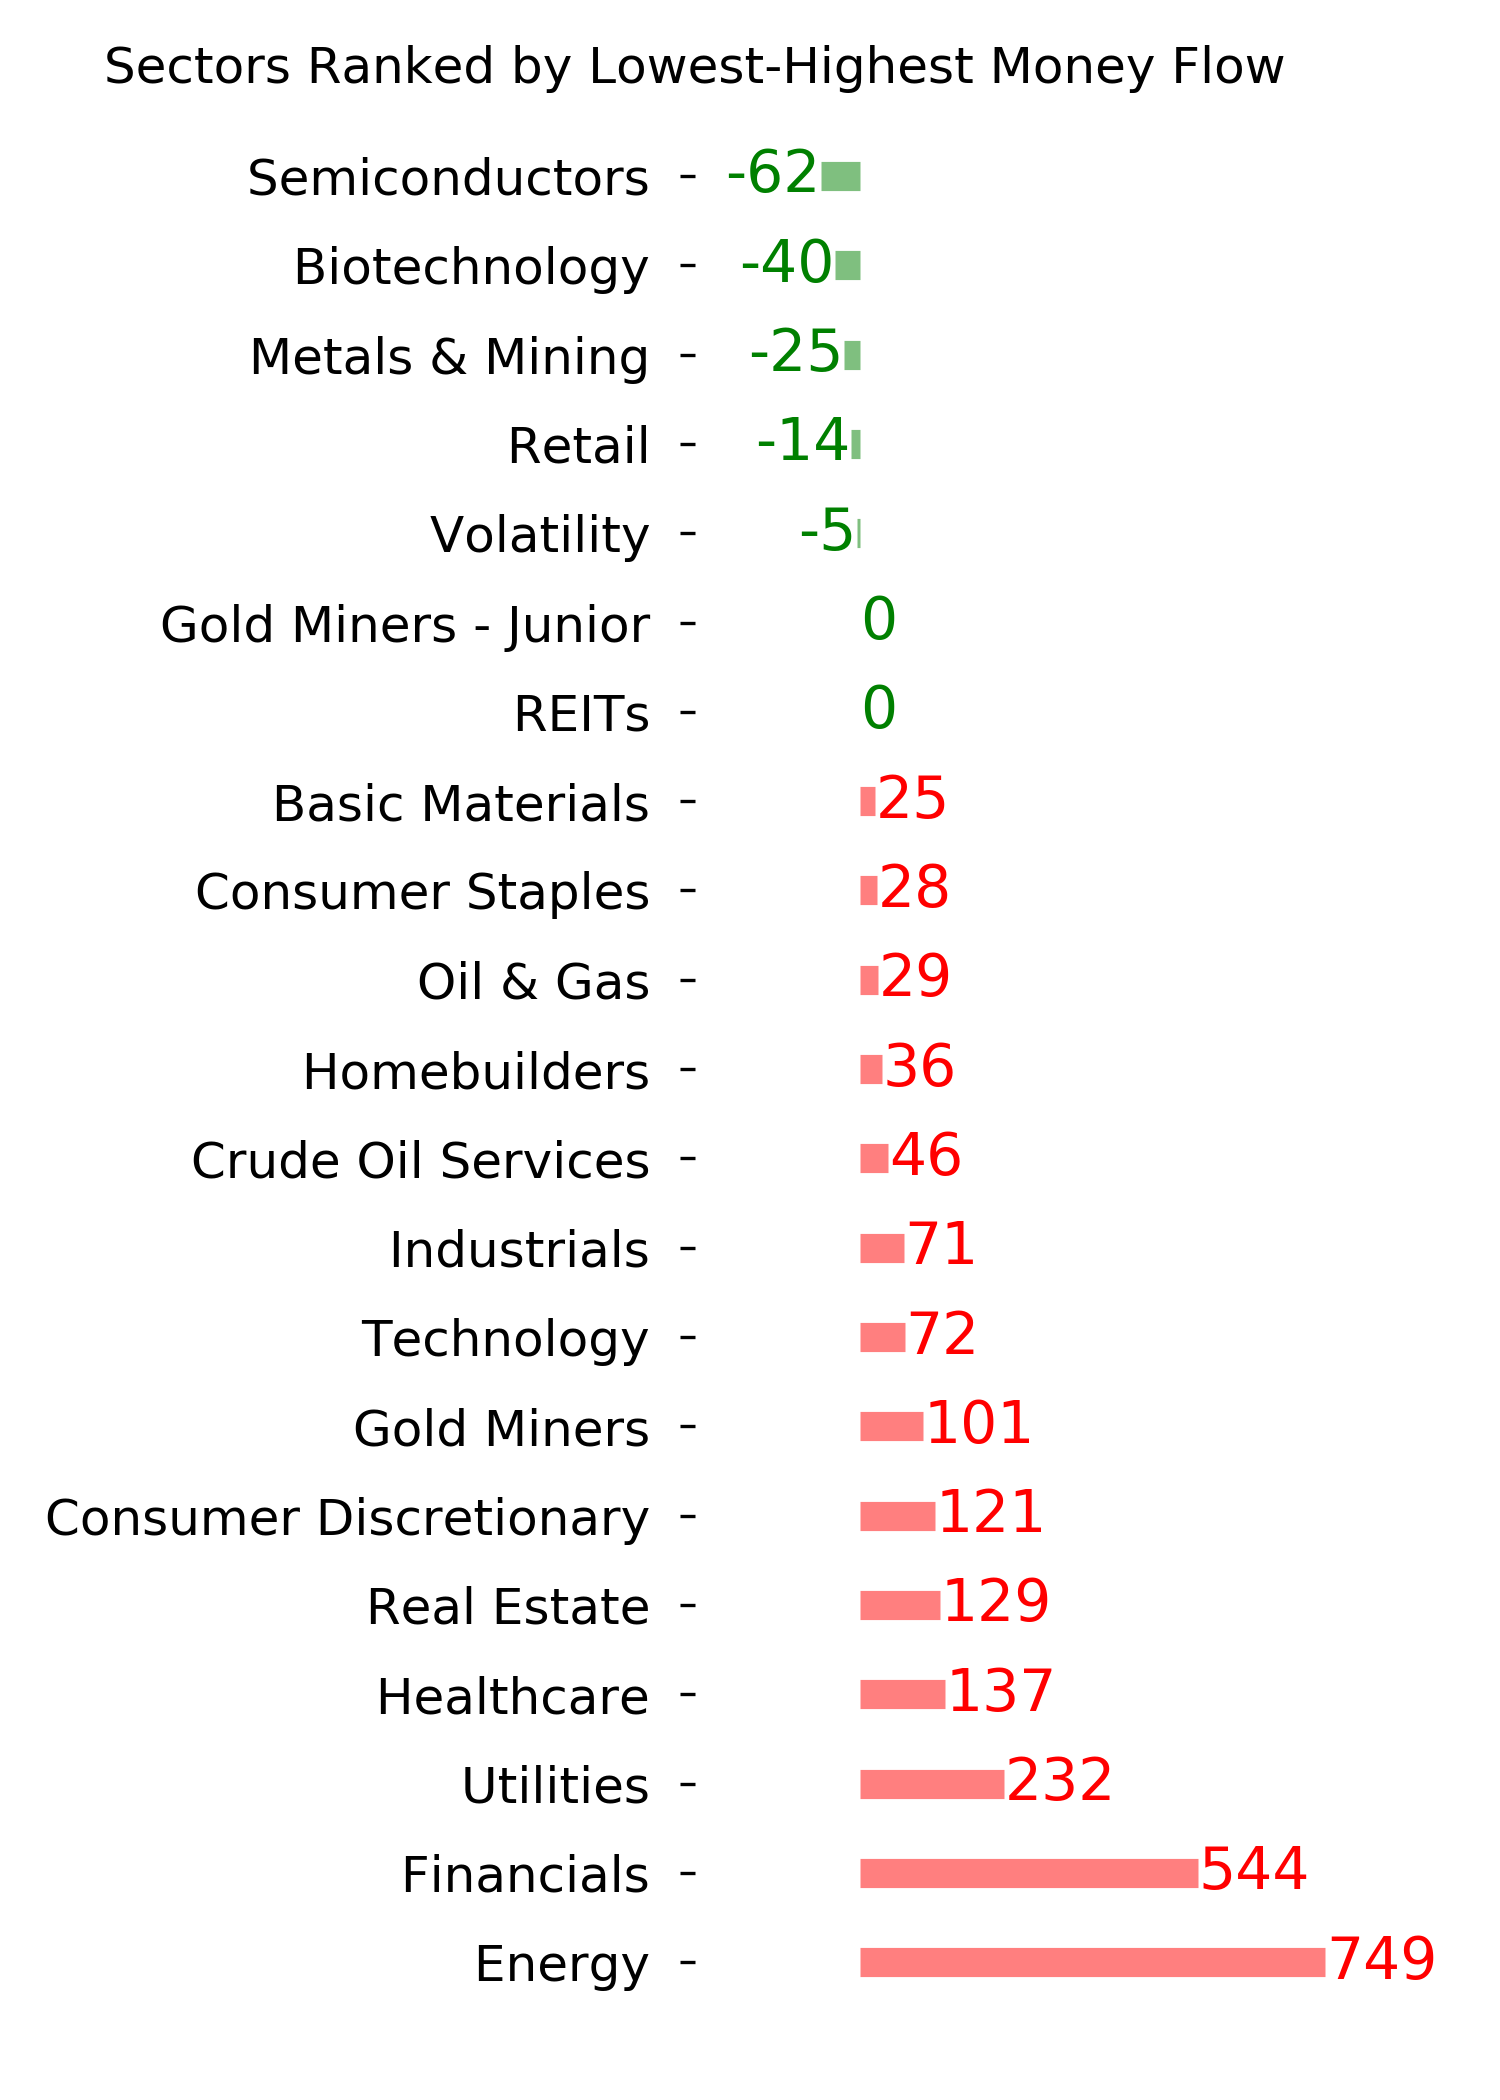
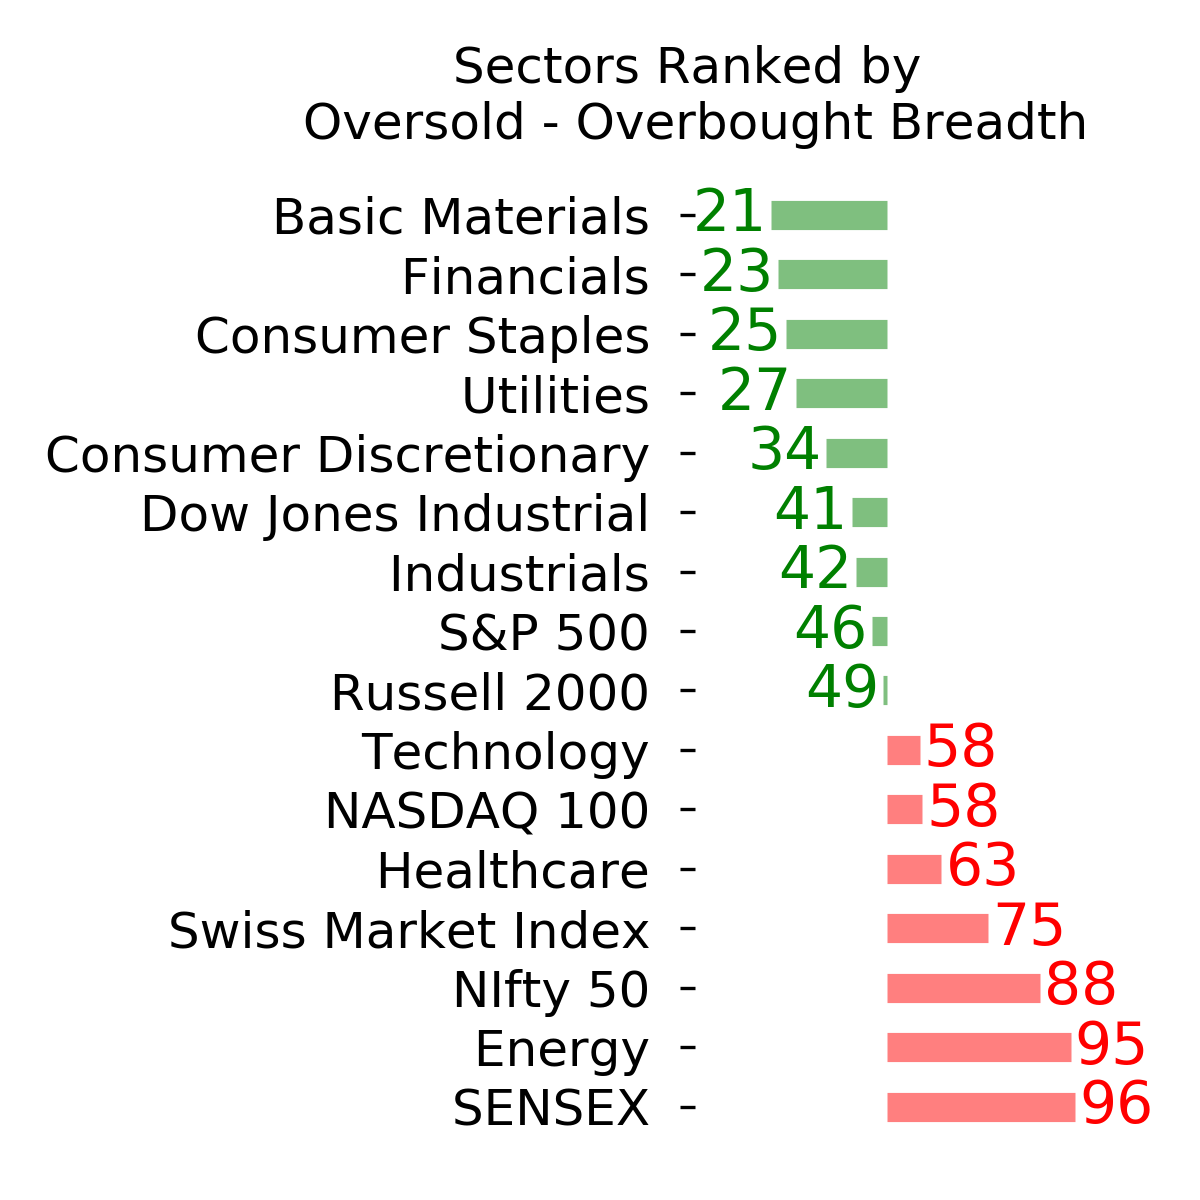
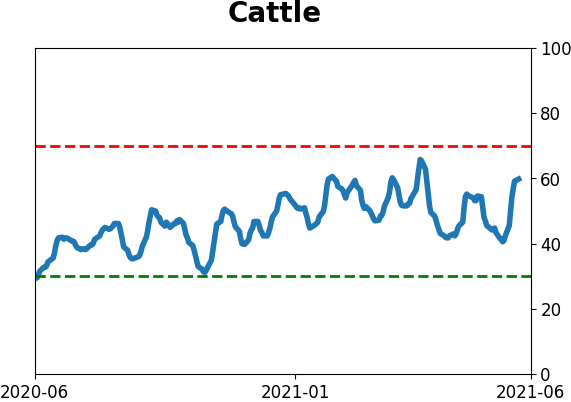
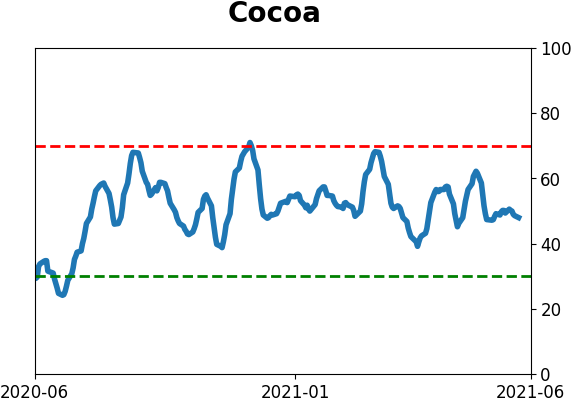
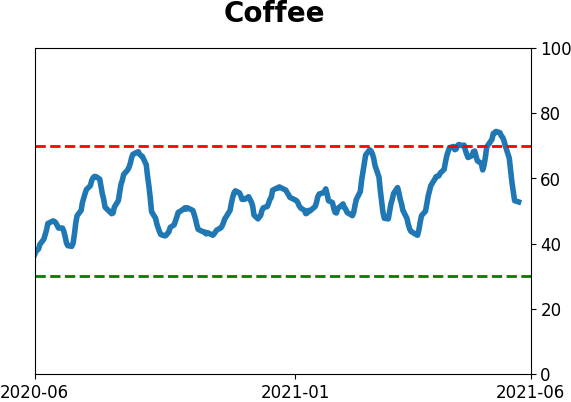
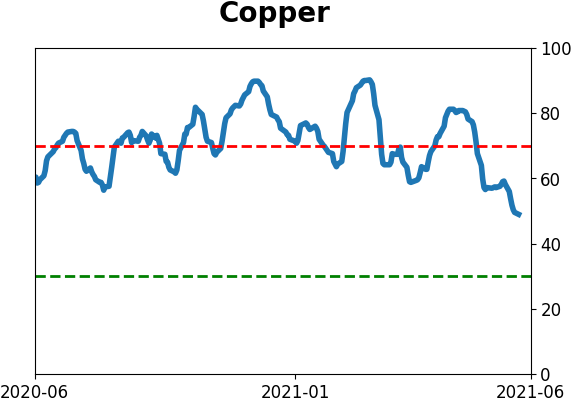
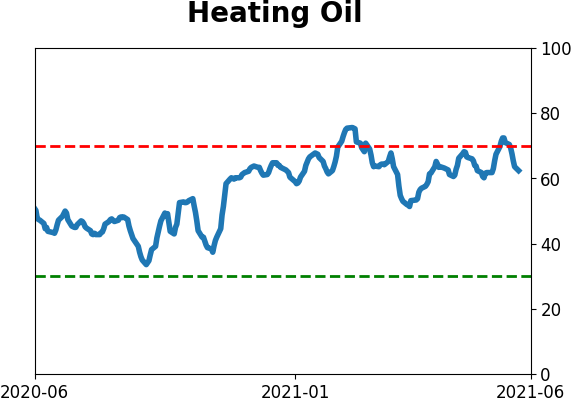
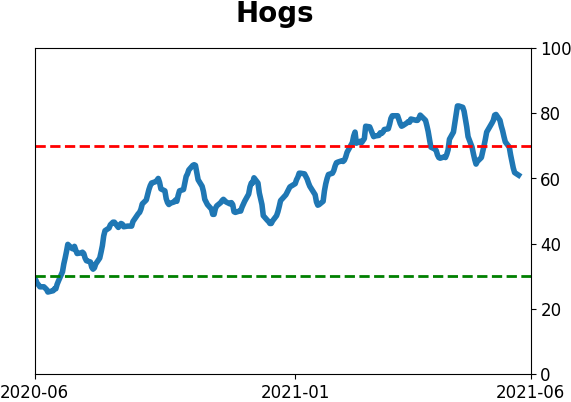
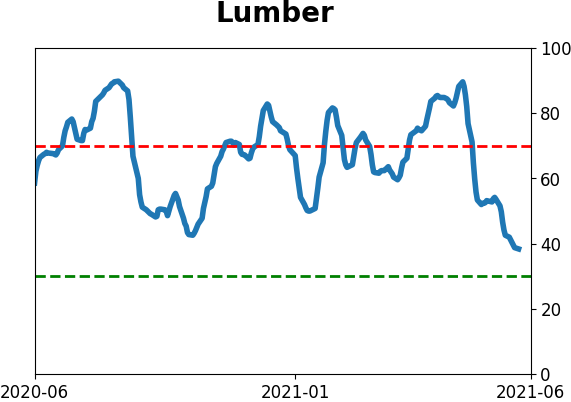
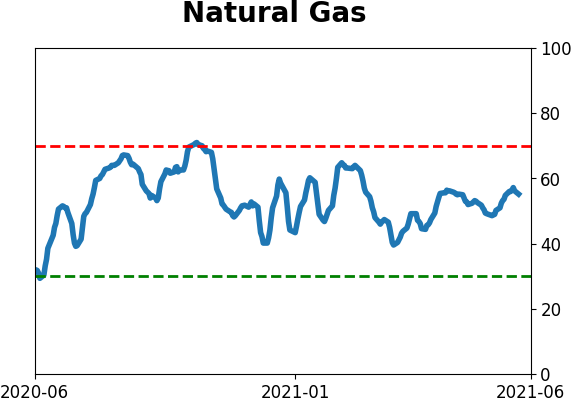
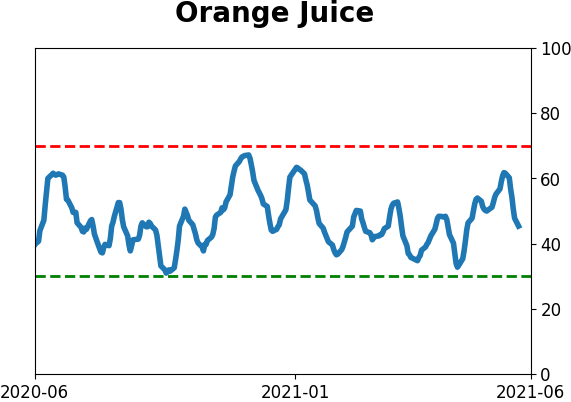
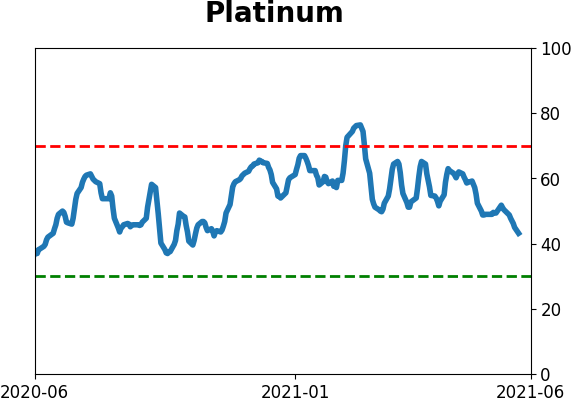
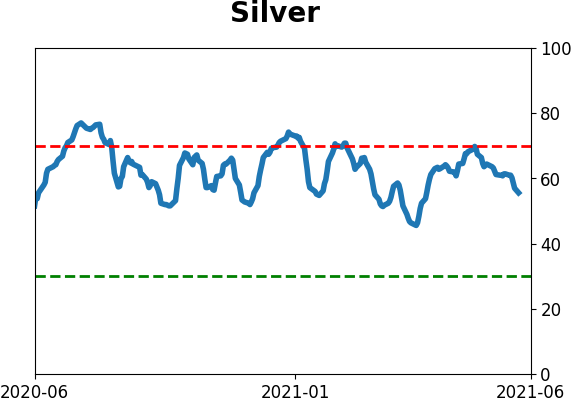
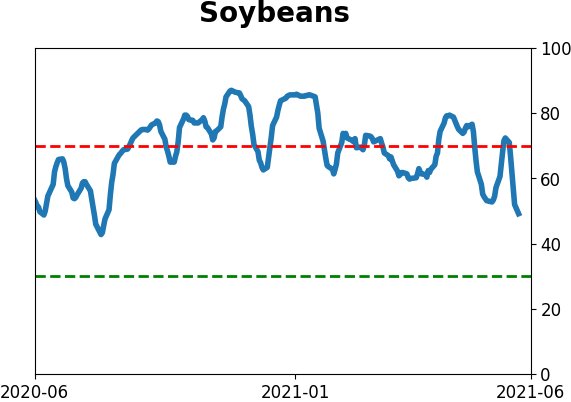
Optimism Index Thumbnails
|
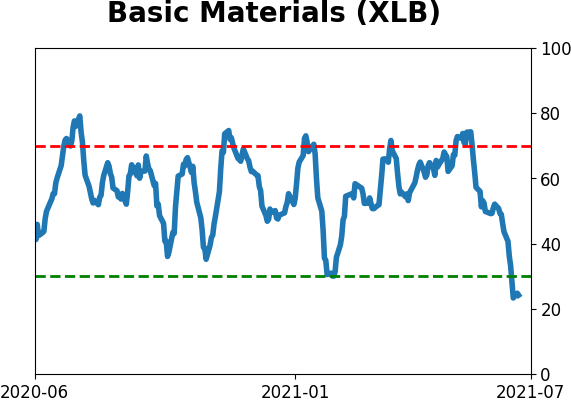
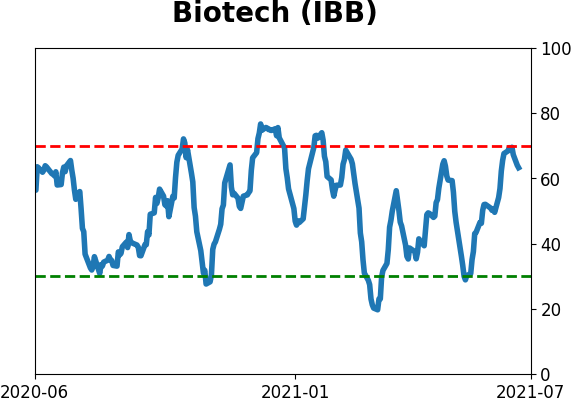
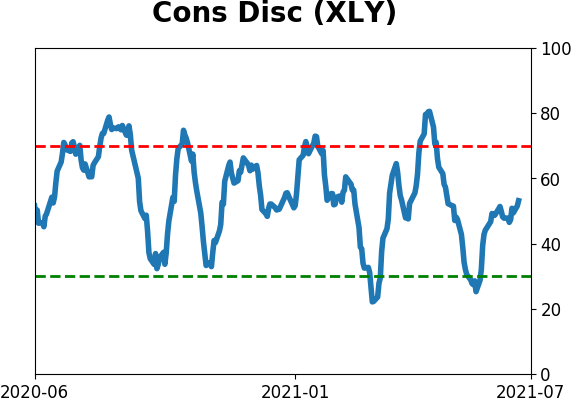
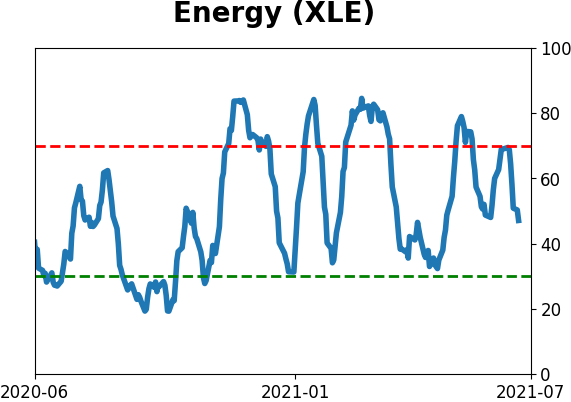
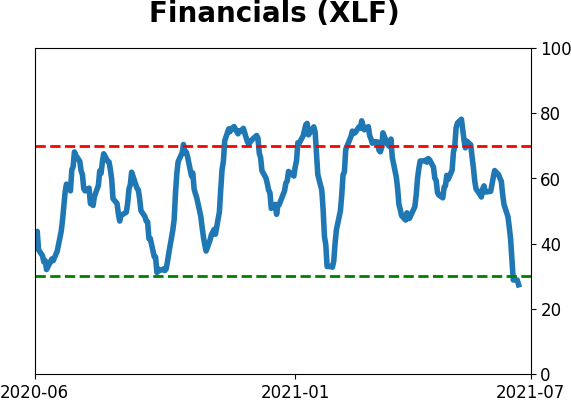
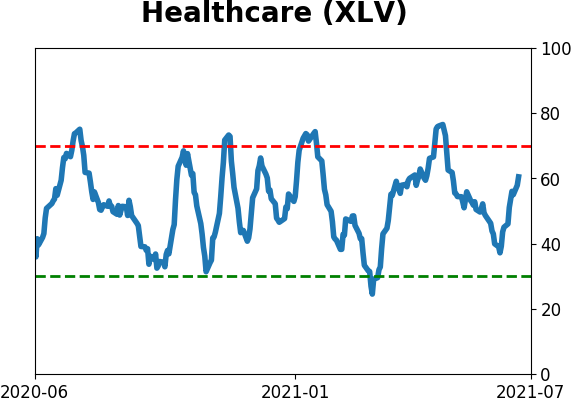
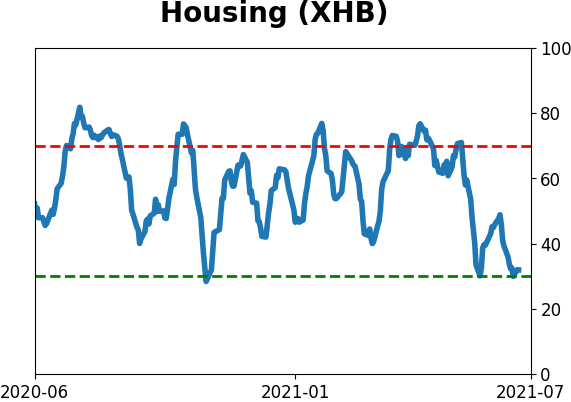
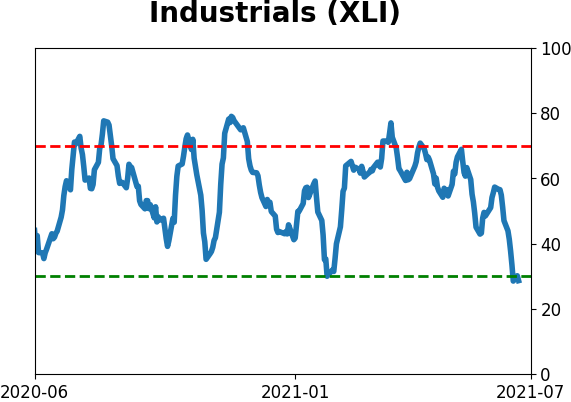
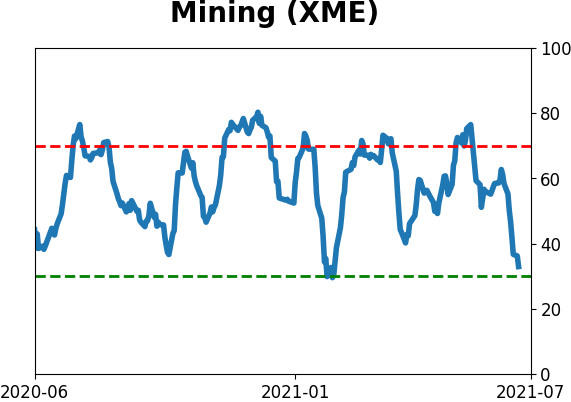
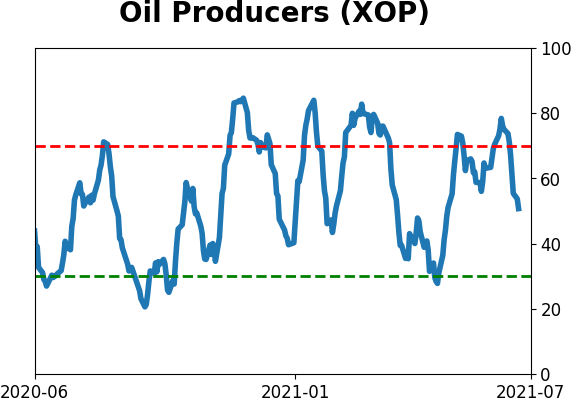
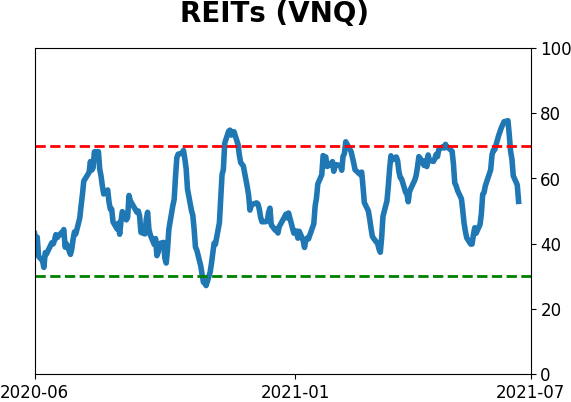
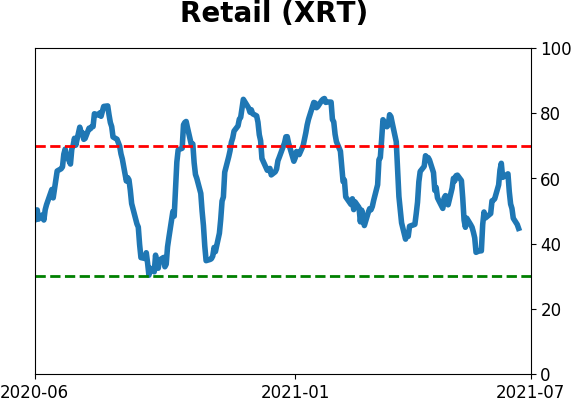
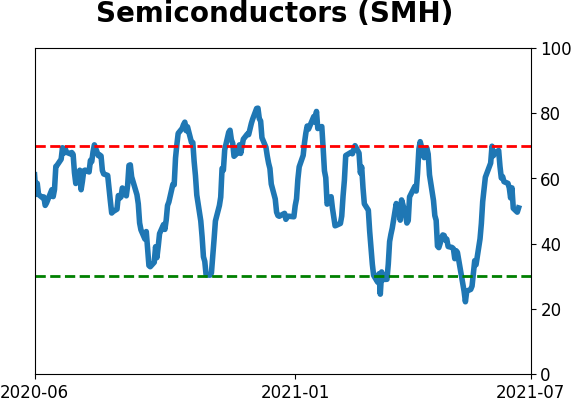
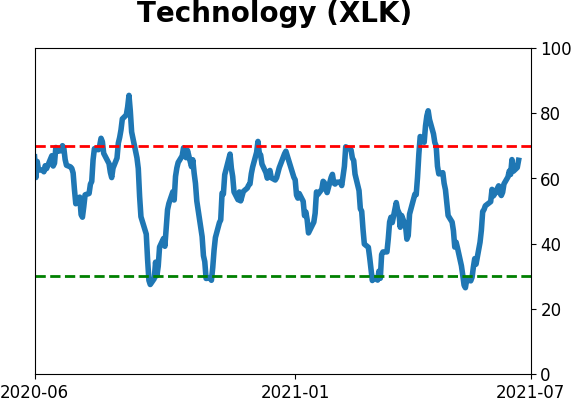
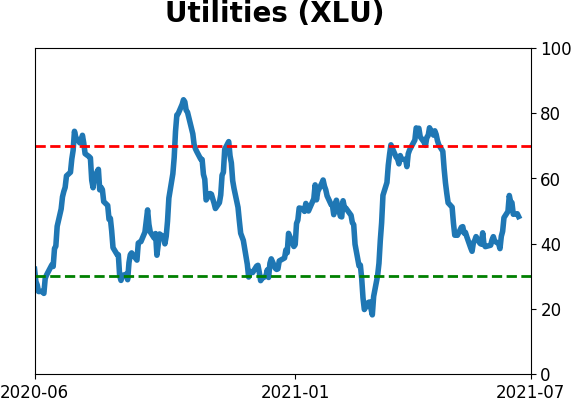
Sector ETF's - 10-Day Moving Average
|
|
|
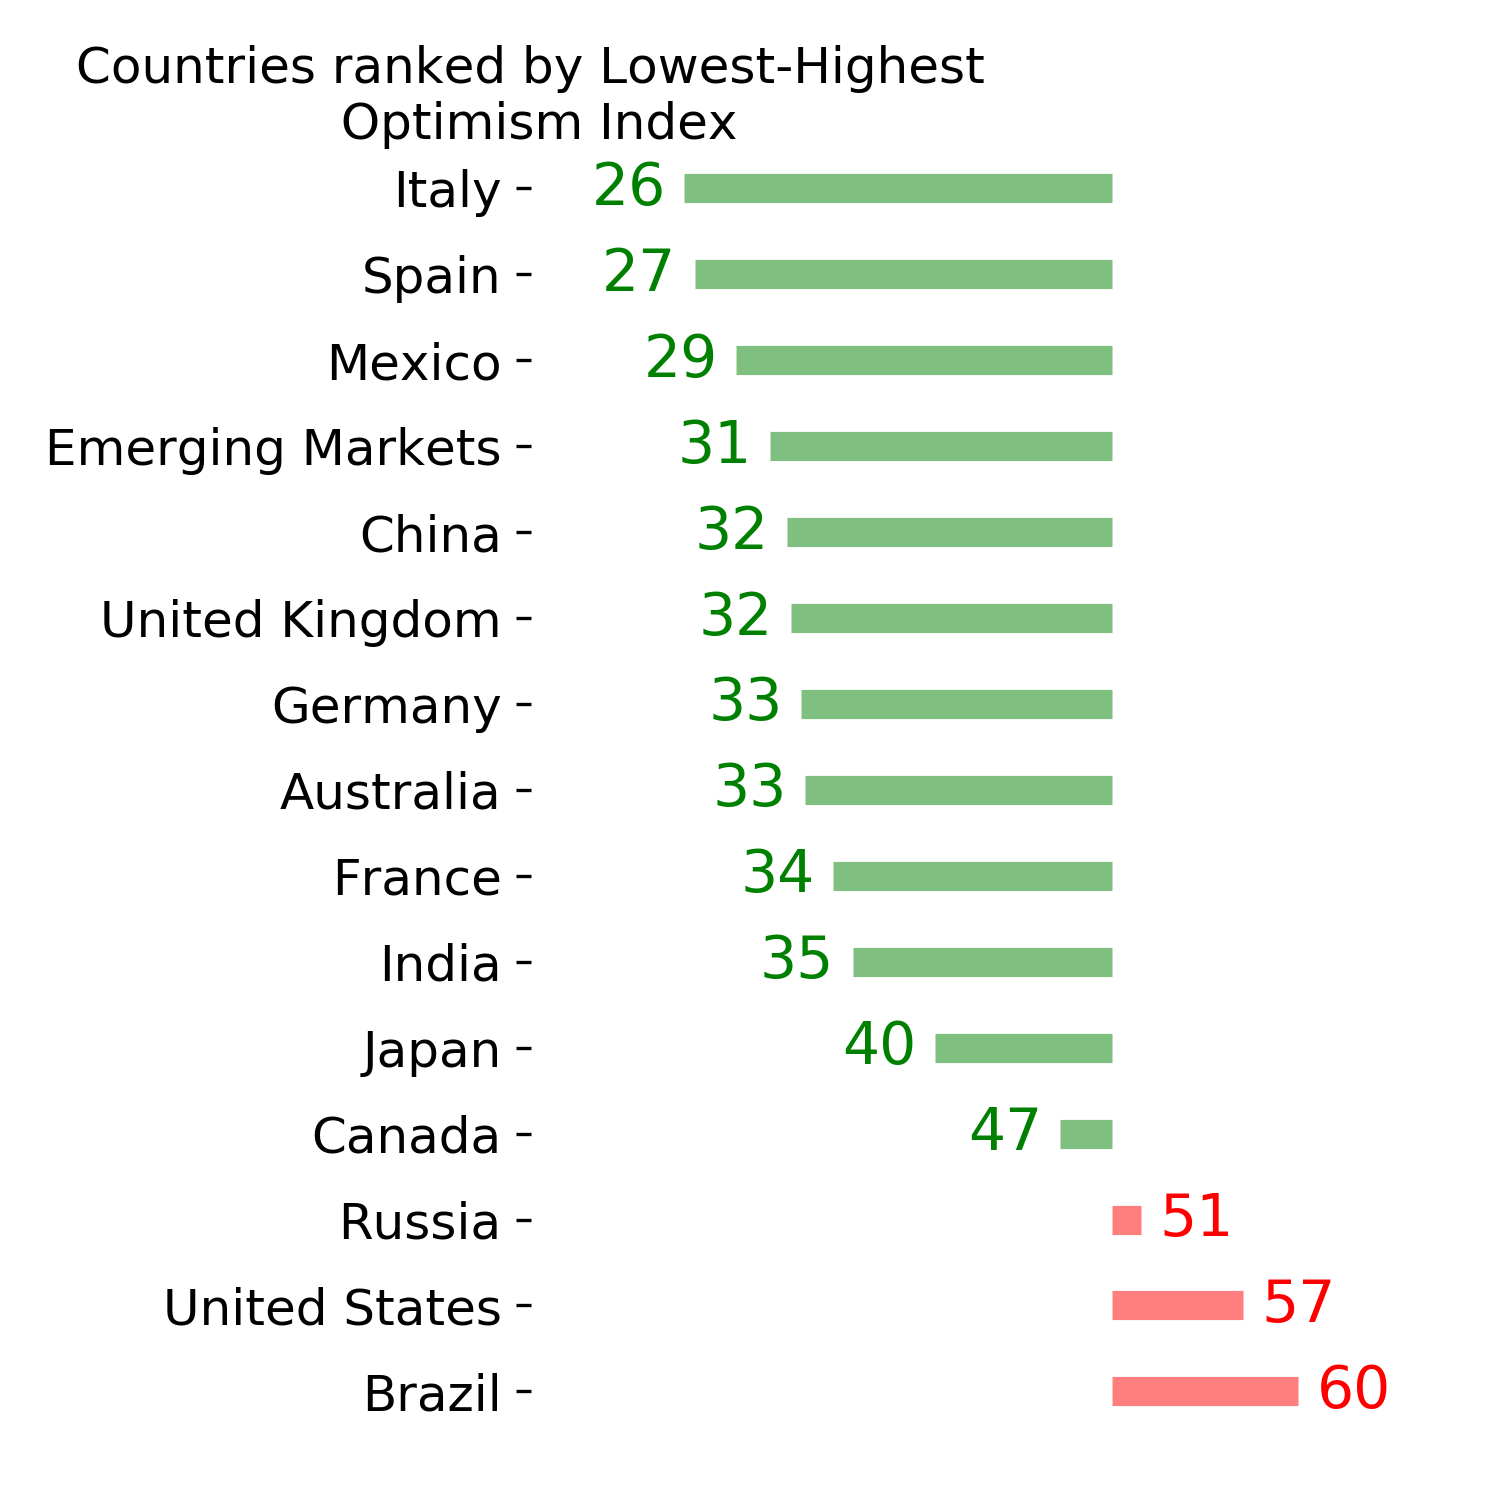
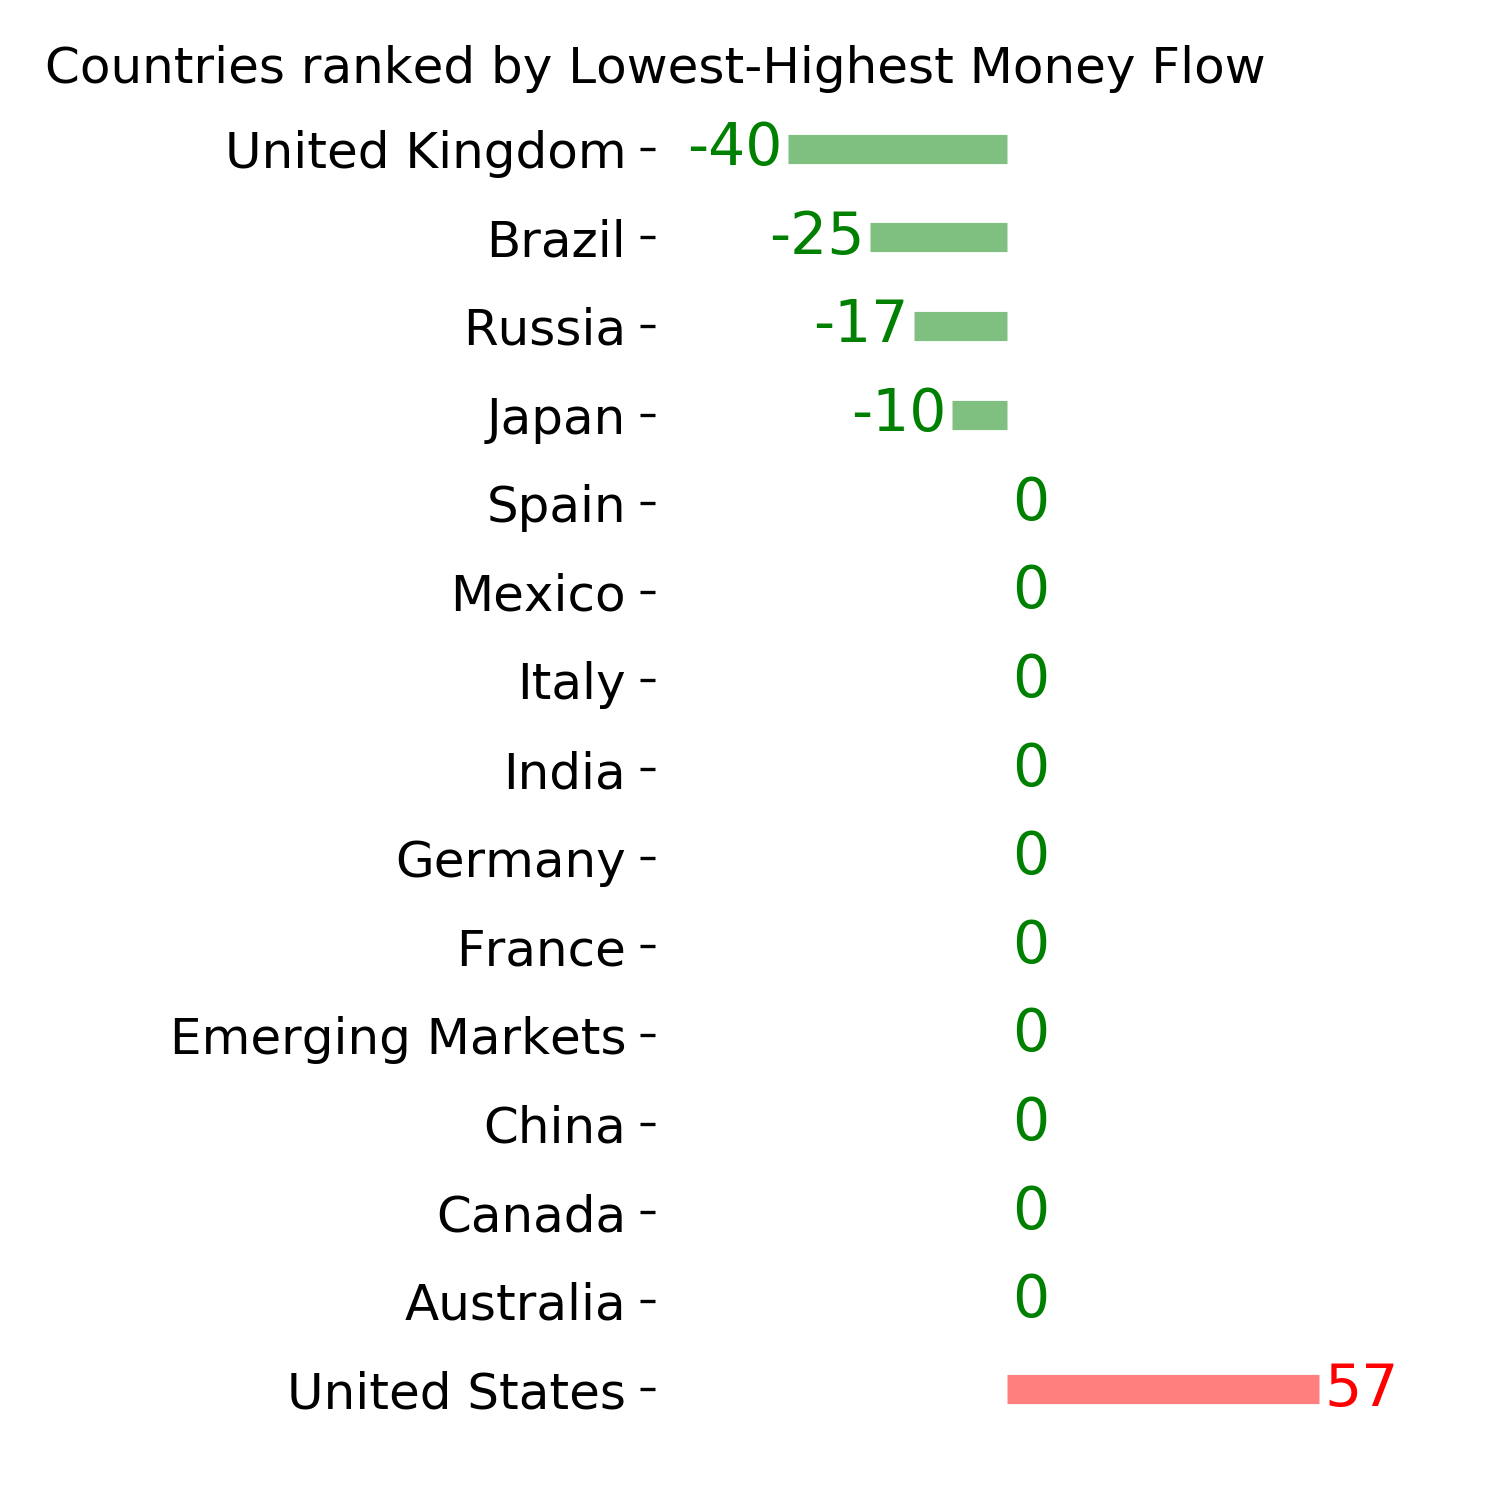
Country ETF's - 10-Day Moving Average
|
|
|
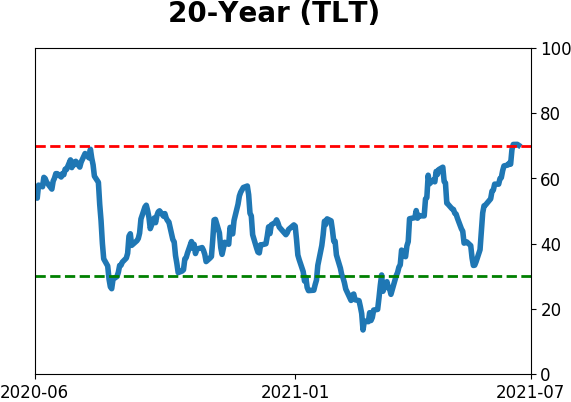
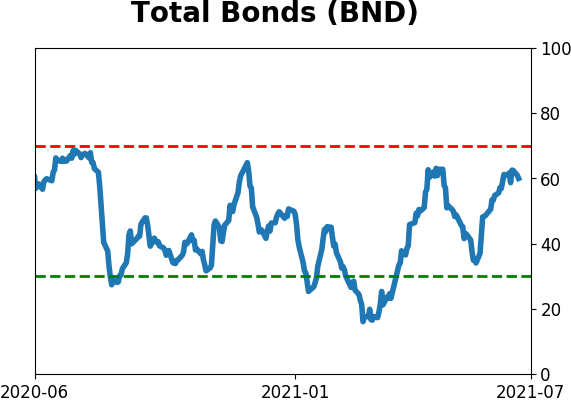
Bond ETF's - 10-Day Moving Average
|
|
|
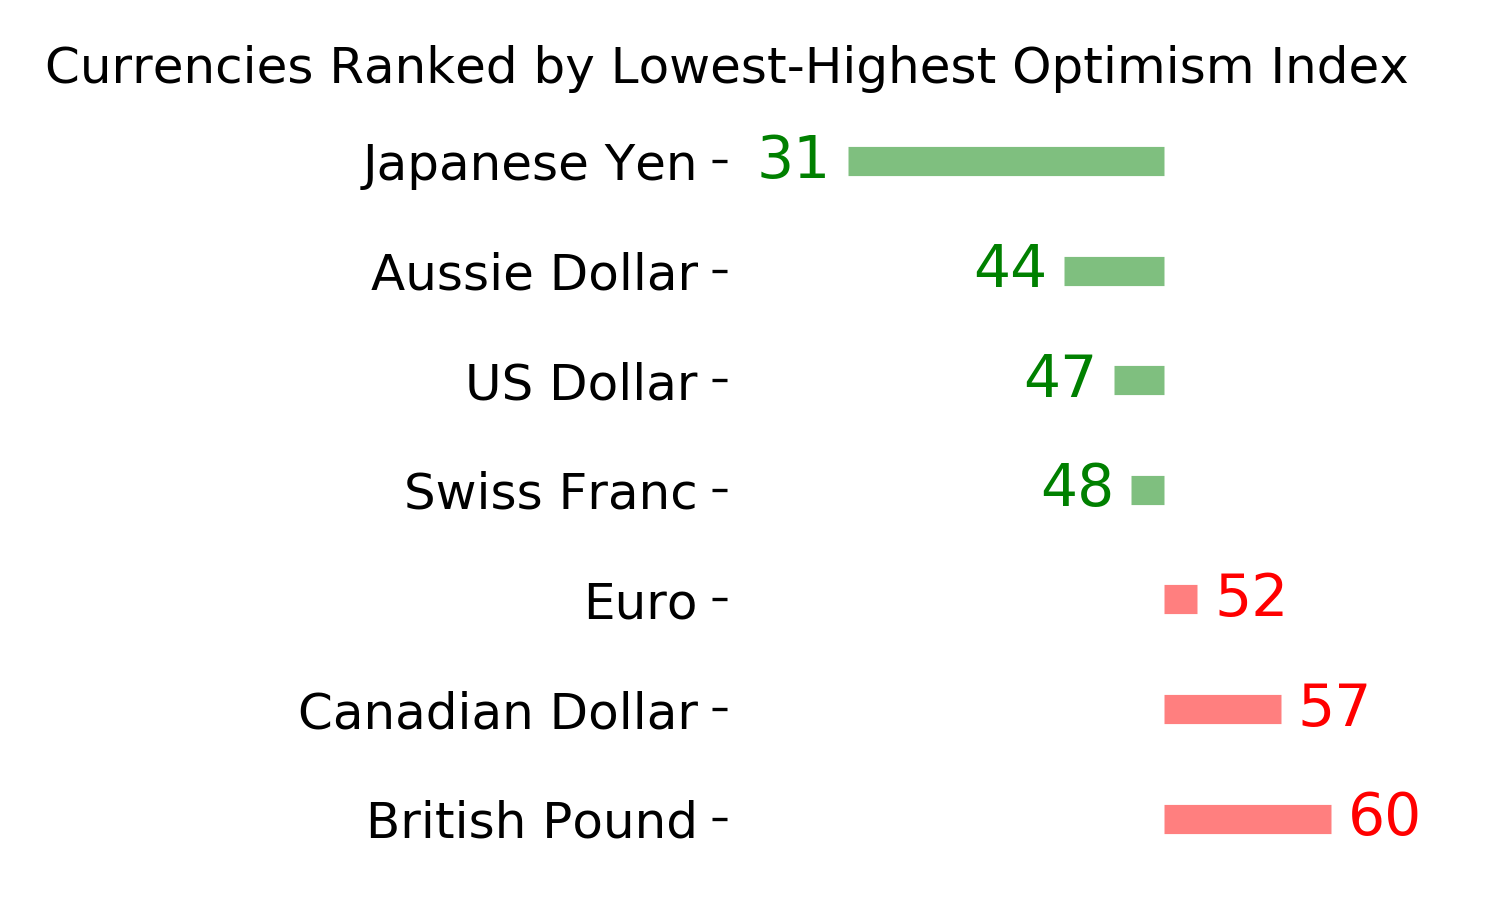
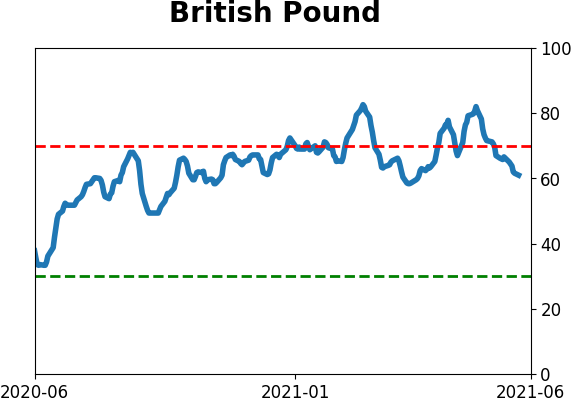
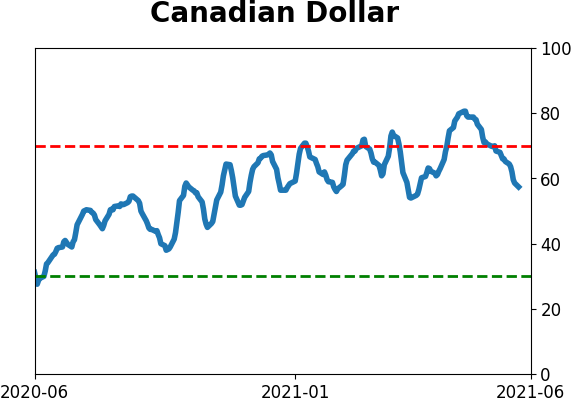
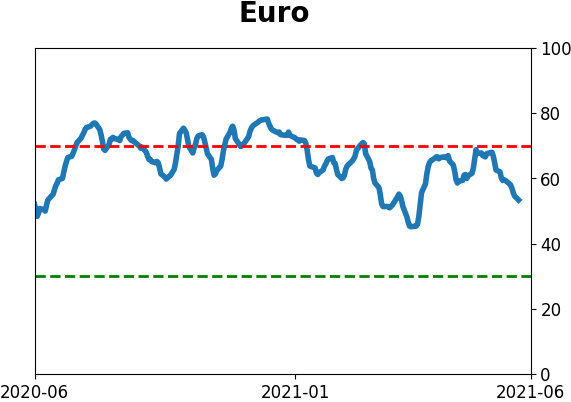
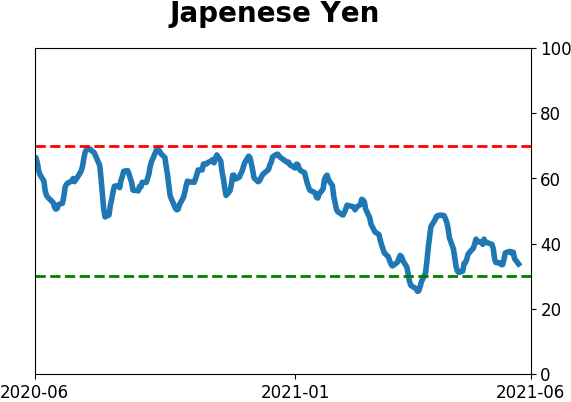
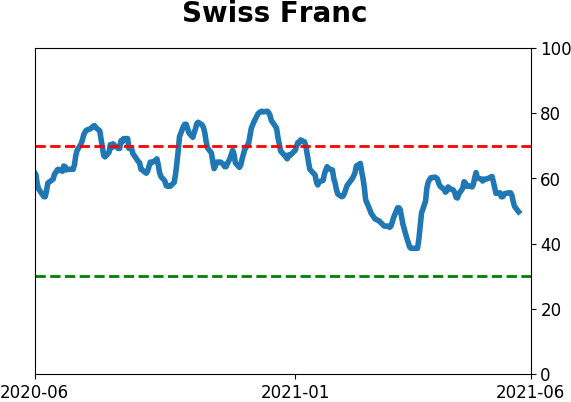
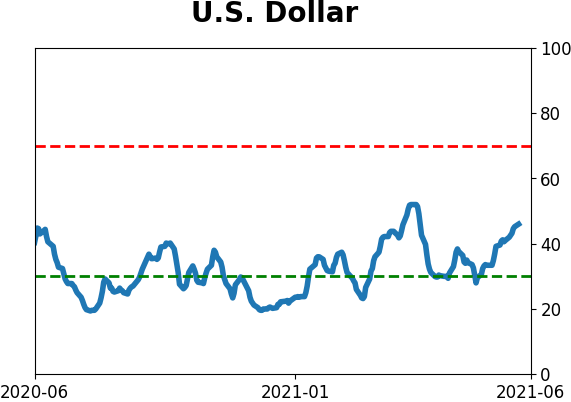
Currency ETF's - 5-Day Moving Average
|
|
|
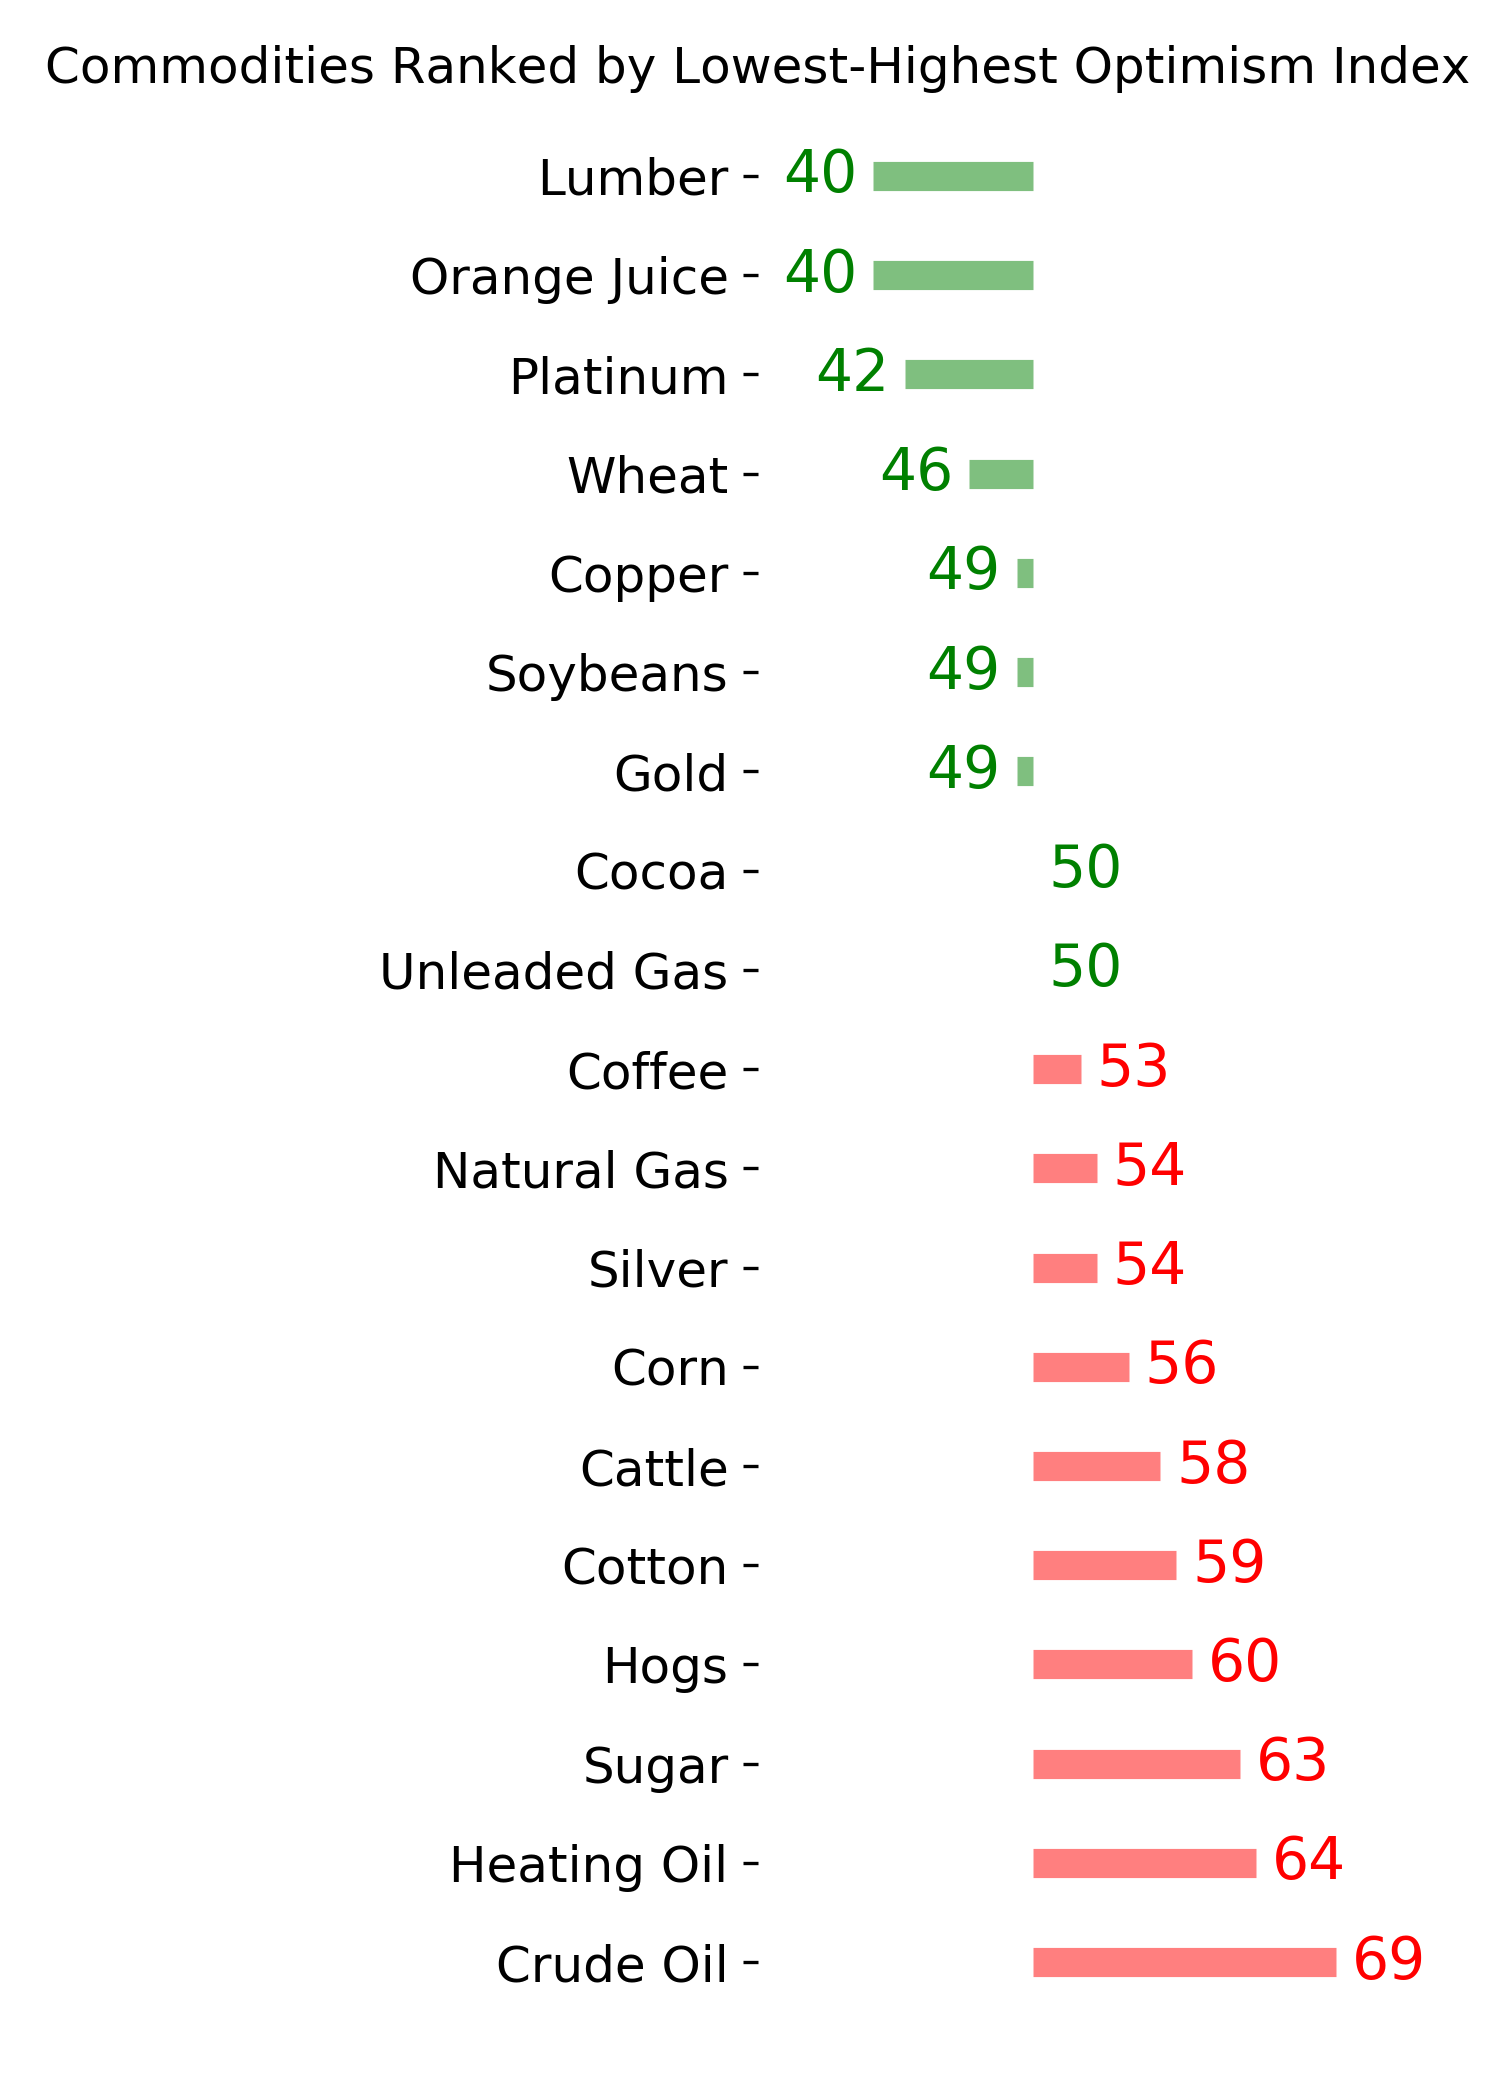
Commodity ETF's - 5-Day Moving Average
|
|